Article

DNA Methylation and mRNA Exon Sequence Variations in the Salt Stress Adaptation of Paspalum vaginatum

Key Laboratory of Genetics and Germplasm Innovation of Tropical Special Forest Trees and Ornamental Plants (Ministry of Education), Hainan Key Laboratory for Biology of Tropical Ornamental Plant Germplasm, Collaborative Innovation Center of Hainan University, School of Tropical Agriculture and Forestry, Hainan University, Haikou 570228, China
*
Author to whom correspondence should be addressed.
Agriculture 2025, 15(17), 1875; https://doi.org/10.3390/agriculture15171875
Submission received: 19 June 2025 / Revised: 25 August 2025 / Accepted: 30 August 2025 / Published: 3 September 2025

Abstract

Background: DNA methylation, as an epigenetic modification, is crucial in the regulatory mechanism of salt resistance in plants. Methods: To gain deeper insight into the relationship between DNA methylation and mRNA exons in halophytes and their potential roles in regulating salt tolerance, this study employed whole-genome bisulfite sequencing (WGBS) and transcriptome sequencing data to analyze the leaves of the halophyte Paspalum vaginatum, widely distributed in tropical regions. Results: The findings revealed that the methylation level of 5-methylcytosine (5mC) in the genomic elements of P. vaginatum increased with prolonged salt treatment under salt stress conditions. This observation suggested that the methylation level plays a pivotal role in the salt stress response of P. vaginatum. Notably, under salt stress, the number of variants at the mRNA exon level was significantly higher than that at the DNA level. Furthermore, comparative analysis revealed sequence variants within exonic regions of mature mRNA transcripts for several genes in salt-treated samples relative to pre-stress controls, and these changes were found to be enriched in several salt-tolerance pathways, including unsaturated fatty acid metabolism and ascorbic acid metabolism, among others. Further analysis demonstrated that the occurrence of these variants changed concomitantly with the dynamic changes in CG methylation levels in the gene body of some salt-tolerant genes. Therefore, it was speculated that mRNA exon variations probably promoted the elevation of CG 5mC methylation levels at the DNA level under salt stress conditions, further enabling the plant to adapt to the salt-stress environment. Conclusions: These findings offer preliminary insights into the relationship between DNA methylation and mRNA exon variations in P. vaginatum under salt stress, providing valuable information and avenues for further investigation into the regulatory role of mRNA in DNA methylation.

1. Introduction

As an essential epigenetic modification mechanism, DNA methylation influences gene expression and regulation without altering the DNA sequence itself. In plants, this modification primarily targets cytosine within three sequence contexts: CG, CHG, and CHH (where H represents A, T, or C) [1]. Catalyzed by DNA methyltransferases (DNMTs), S-adenosylmethionine (SAM) transfers a methyl group (CH3-) to cytosine, predominantly forming 5-methylcytosine (5mC), while N6-methyladenine (6mA) and 7-methylguanine (7mG) are relatively rare.
Abiotic stress poses an inevitable challenge during plant growth and development, often inducing dynamic alterations in DNA methylation patterns. These epigenetic changes represent a crucial strategy for plants to adapt to environmental stresses [2]. Among numerous abiotic stresses, salinity severely impacts plant physiology and agricultural productivity globally. Plants have evolved complex adaptive mechanisms to salt stress, encompassing osmoregulation, ion homeostasis, and reactive oxygen species scavenging [3]. Critically, mounting evidence indicates that epigenetic regulation, particularly DNA methylation, plays a pivotal role in orchestrating these molecular pathways. For instance, studies in the model plant Arabidopsis and in crops like wheat have demonstrated that DNA methylation directly regulates the expression of specific HKT transporters in response to salt stress [4,5]. Additionally, in Arabidopsis and soybean, the expression of salt-induced transcription factors AtMYB74 and GmMYB84, respectively, is regulated by DNA methylation under salt stress conditions [6,7]. This underscores the fundamental link between epigenetic marks and the transcriptional reprogramming essential for salt tolerance. Understanding these epigenetic mechanisms not only reveals novel insights into plant stress biology [8] but also holds significant promise for developing innovative strategies in crop improvement, such as epigenetic breeding for enhanced salinity tolerance.
Research on DNA methylation dynamics under salt stress has primarily focused on glycophytic model plants (e.g., Arabidopsis thaliana) and major crops like rice, cotton, potato, and wheat. However, halophytes represent an invaluable and underexplored resource. Species like Paspalum vaginatum thrive in saline environments, suggesting they possess highly efficient and potentially unique epigenetic regulatory networks for salt adaptation. Studying halophytes like P. vaginatum is therefore crucial for identifying novel epigenetic mechanisms evolved under extreme salinity, discovering key salt-tolerance genes with potential for improving glycophytic crops, and providing a more comprehensive understanding of the spectrum of epigenetic responses to salt stress across plant species. Furthermore, the integration of multi-omics approaches is key to elucidating the complex interplay within the epigenome. Studies have shown that plant genotype significantly influences salt-induced DNA methylation changes [9], and correlations exist between differential DNA methylation and gene expression under salt stress [10]. For instance, He et al. (2024) elucidated the biosynthetic mechanisms of chrysin and phenolic acids during Salvia miltiorrhiza growth using integrated transcriptome and WGBS analyses [11]. Their results demonstrated that most DEGs were downregulated in both hyper- and hypomethylated DMGs. Crucially, only downregulated DEGs associated with promoter hypermethylation and upregulated DEGs linked to hypomethylation were enriched in metabolic pathways. Furthermore, differentially methylated regions (DMRs) for these two gene categories predominantly localized to promoters. Gao et al. (2024) compared tetraploid and diploid citrus, revealing a minimal overlap between DMGs and DEGs [12]. This indicates that methylation changes during genome doubling exert negligible effects on transcriptional regulation; however, among genes exhibiting synchronous alterations in methylation and expression, several key contributors to ploidy-dependent phenotypic variations were identified. Intriguing interactions between different epigenetic layers, such as DNA methylation (5mC) and RNA methylation (e.g., 6mA), and between DNA methylation and histone modifications, are emerging as critical regulators of gene expression under stress [13,14,15]. These findings highlight that epigenetic regulation involves intricate crosstalk and is integral to the plant’s response to environmental challenges, potentially modulating RNA processing and stability.
Despite this progress, a significant gap exists in understanding the holistic epigenetic regulation, particularly the direct link between DNA methylation dynamics and genome-wide transcriptional changes in halophytes under salt stress. While the intricate regulatory relationships between DNA methylation and RNA are gaining attention, most studies remain focused on glycophytes. Given the need for rapid adaptation to salt stress and the relative stability of DNA sequences, we hypothesize that mRNA-level variations, potentially influenced by epigenetic marks, provide a critical layer of regulatory flexibility.
To address these gaps, this study employs the halophyte model P. vaginatum to conduct an integrated analysis of genome-wide DNA 5mC methylation patterns, mRNA exon variants, and the transcriptome under salt stress. We specifically aim to (1) characterize salt stress-induced alterations in DNA methylation landscapes; (2) manually compare these DNA methylation changes (at the gene/region level) with alterations in gene expression profiles derived from transcriptome analysis, thereby identifying epigenetically regulated genes and pathways critical for salt adaptation; (3) investigate the potential impact of DNA methylation on P. vaginatum’s adaptation to saline environments and identify key candidate salt-tolerant genes regulated epigenetically; (4) and explore potential relationships between DNA methylation and mRNA exon variants under salt stress conditions. By establishing these critical links between the methylome and transcriptome in a resilient halophyte, this research aims to provide novel insights into the epigenetic basis of extreme salt tolerance and contribute to the development of epigenetics-informed strategies for crop improvement against salinity.

2. Materials and Methods

2.1. Plant Material and Treatment

In this study, healthy stolons of P. vaginatum’s uniform germplasm ‘SeaIsle2000’ were selected as experimental materials at the experimental base of Hainan University. These stolons were planted in 5 L culture pots and cultivated by hydroponics for 28 days (beginning on 5 March 2023). During this cultivation period, the water and nutrient solutions were replaced weekly in order to ensure optimal growth and development of the roots and leaves. Based on previous results of our group, treatments with NaCl concentrations below 20 g/L (approximately 342 mmol/L) had no significant impact on the physiological characteristics of ‘SeaIsle2000’, whereas concentrations above 30 g/L NaCl (approximately 525 mmol/L) led to wilting and death of some plants. Therefore, at the end of the 28-day incubation period, a NaCl concentration of 23.33 g/L (400 mmol/L) was used to induce salt stress in the plants. Leaf tissues were collected at three time points: day 0 (CK), day 1 (1 d), and day 3 (3 d) of the treatment. The control group was subjected to no salt stress, while the experimental groups were exposed to salt stress for 1 day and 3 days, respectively. Transcriptome sequencing and whole-genome bisulfite sequencing (WGBS) were performed on leaves. To ensure the reliability of the experimental results, three biological replicates were included for both the control and experimental groups.

2.2. Transcriptome Data Processing and Gene Expression Analysis

Following snap-freezing in liquid nitrogen, samples were shipped to Novogene Co., Ltd. (Beijing, China) for sequencing. Total RNA was extracted using Trizol reagent. RNA integrity and purity were assessed, and only qualified samples were used for library preparation. First-strand cDNA was synthesized by reverse transcription. During second-strand synthesis, dUTP was incorporated in place of dTTP. Standard library construction steps, including end repair, adapter ligation, and size selection, were then performed. The uracil-containing second strand was enzymatically degraded prior to PCR amplification. Final libraries were quality-checked and sequenced on an Illumina platform. To guarantee high-quality reads for subsequent analyses, we implemented stringent quality filtering on the raw data generated from high-throughput sequencing. By employing the default parameters of the Fastp software (v0.23.4) for rigorous data quality control, we effectively removed low-quality reads to obtain high-quality reads that fulfilled the necessary criteria [16].
Next, we compared high-quality reads to the reference genome utilizing the Burrows–Wheeler Transformation (BWT) data structure within Hisat2 software and a specialized indexing scheme proposed by Ferragina–Manzini (FM) [17,18,19]. The matched data were subsequently sorted by the samtools software, generating BAM files. To evaluate the expression levels of individual genes, we normalized the gene expression data using the featurecounts software and generated the corresponding FPKM values (fragments per kilobase per million) [20]. Subsequently, we integrated the expression matrices and calculated the differential expression of all genes using the DESeq2 R package (v1.48) [21]. By applying the criteria of padj < 0.05 with log2FoldChange > 1, we screened for differentially expressed genes and counted their numbers. Finally, we illustrated the differences in gene expression in a Venn diagram. To ascertain the variability among different treatment sample groups, we performed principal component analysis (PCA) based on the expression data using the R package PCATools [22].

2.3. DNA Methylation Analysis

Following quality control to ensure DNA purity, genomic DNA was fragmented by sonication to approximately 300 bp. The fragments underwent end repair and A-tailing, followed by ligation with methylated adapters using T4 DNA ligase. Bisulfite conversion was then performed to denature and convert unmethylated cytosines [23]. Subsequently, PCR amplification was carried out to enrich successfully converted fragments and to incorporate sample-specific barcodes for multiplex sequencing. The final libraries were purified using AMPure XP beads to remove short fragments and impurities, and qualified libraries were sequenced on an Illumina platform with a paired-end 150 bp strategy. All sequencing was performed commercially by Novogene Co., Ltd. (Beijing, China). The sequencing data were strictly filtered according to the established criteria, and the obtained high-quality clean reads were aligned to the reference genome (BioProject PRJNA848273 in NCBI) using BisMark (v0.24.2) software. Methylation levels of specific sites and within defined windows were calculated based on the BatMeth2 (v1.1) calmeth tool. These windows were categorized into small windows (600 bp) and large windows (100,000 bp in size with a sliding window of 50,000 bp). The threshold of methylated C-site coverage was established at 4, and the threshold for the number of windowed C-sites was set to 1 [24]. In addition, the methylation level of genomic elements was analyzed using the BatMeth2 methGff module with the following parameters: a C-site coverage threshold of 4, a window C-site number threshold of 1, upstream and downstream extended regions of 2000 bp around each gene, and the window step = 0.02 [24].
To ensure the variability of DNA methylation levels among samples from treatment groups, we performed principal component analysis (PCA) using small-window methylation data using the R package PCATools [22]. To further explore the general distribution pattern of DNA methylation in P. vaginatum, we evaluated the DNA methylation level of each genomic element, as well as the distribution of gene density, transposon density, and the level of the three DNA methylation-producing sequences (CG, CHG, and CHH) based on the large-window methylation data. Additionally, we calculated the average 5mC DNA methylation level of each genomic element based on the small-window methylation data, with the 0 d samples serving as a representative control [23]. We then assessed the sample’s average genome-wide 5mC methylation level. Subsequently, we screened genomic elements for genes exhibiting elevated and significantly different 5mC methylation levels (coefficient of variation < 1.0, consistent with the comparison across three replicates within treatment groups) based on the genomic-element methylation-level data, especially CG sequences (the main sequences undergoing 5mC methylation) and CHH sequences in the promoter (whose 5mC methylation levels were significantly different between treatment groups). Finally, these genes were enriched and functionally analyzed.

2.4. Identification of mRNA Exon and DNA Variant Sites

We used the BWA (v0.7.17) and GATK (v4.0) software to align transcriptome and DNA methylation sequencing data to the reference genome [25]. Picard was employed to label and remove duplicates, thereby generating gvcf files for variant detection at both the DNA and RNA levels. The filtering criteria for variants encompassed QD (variant quality value divided by depth of coverage) < 2.0, QUAL (likelihood of the presence of a variant at the locus) < 30.0, and MQ (root-mean-square of the comparison quality value of all reads compared to the locus) < 50.0. Based on the vcftools setting of MAF = 0.1 (minimum allele frequency), the maximum missing rate was set at 0.1 for population filtering [26]. Subsequently, we annotated the variant function using ANNOVAR (2020Jun07) software to extract variants on exons of all genes [27]. By comparison, we identified the self-specific variations of the mRNA exons.

2.5. Screening of mRNA Exon Variant Genes and Enrichment Analysis

The genes were further screened for new variants at the RNA level or an enhanced degree of variability at the loci following exposure to salt stress. The RNA variability at each locus of a particular gene was determined based on the results of three biological replicates within the same treatment group; i.e., when two of the three biological replicates within the same treatment group showed the same SNP/InDel, it was designated as the variant in the treatment group. Then, these genes were matched to the transcriptome differential expression matrix, and KEGG pathway enrichment analysis was performed based on expression values with fold-change > 1 and a corrected q-value < 0.05 as the screening criteria for differentially expressed genes (DEGs) [28]. Based on these criteria, we identified the biological functions and pathways associated with genes exhibiting novel sequence variations in mRNA exons following salt stress. Finally, focusing on the pathways related to salt tolerance with a q-value < 0.05, the genes related to salt tolerance among them were extracted by integrating gene annotation information and functional analysis data.

2.6. DNA Methylation and mRNA Exon Variants Association Analysis

In order to investigate the adaptive regulation of mRNA exon variations through dynamic changes in DNA methylation levels, we conducted a further analysis of the methylation levels of the CG sequences within the salt-tolerant genes mentioned above. Utilizing the average 5mC methylation levels from three biological replicates as a benchmark, we screened for genes exhibiting an increase in average 5mC methylation levels with extended salt treatment duration. Additionally, we manually compared the mRNA exon variation profiles of these genes with their respective DNA methylation levels. Finally, we analyzed the salt-tolerance genes that had more significant mRNA exon variants (a specific nucleotide within a single gene exhibited variations following salt stress treatment relative to pre-treatment conditions) and more rigorous DNA methylation level data based on t-tests (t < 0.05). We compared these findings with our previous results to explore a more reliable adaptive regulatory relationship between RNA variation and DNA methylation.

3. Results

3.1. The Control Group and the Experimental Group Differ Under Salt Stress

In order to ensure the accuracy of the sample collection and sequencing process, we quantified the transcriptome and DNA 5mC methylation sequencing data after applying fastp quality filtering, and aligned them to the reference genome of ‘SeaIsle2000’. The results of Hisat2 showed that the mapping rate of all samples exceeded 90%. The results of BisMark showed that, on average, approximately 12% of total cytosines in the ‘SeaIsle2000’ genome were methylated. The proportions of CG, CHG, and CHH methylation were 44%, 26%, and 1%, respectively. Additionally, at least 70% of the reads were successfully mapped to the reference genome, covering about 97% of the genome (Table 1). These results indicated that the sequencing data presented good quality and reliability.
To further determine the differences between the control and experimental groups, we performed PCA using the PCATools R Package based on both expression and small-window methylation data. The results demonstrated that there were significant differences in gene expression levels and DNA 5mC methylation levels between the control groups (0 d/CK) and experimental groups (1 d and 3 d) under 400 mM salt treatment (Figure 1). Notably, based on the expression data, there was good concordance among the three biological replicates. As for the slight discrepancies observed within the methylation replicates in the control group, it is conceivable that there was inter-individual or generational genetic variability in DNA 5mC methylation within the plant samples, which may subsequently exert a certain impact on the experimental results.

3.2. Analysis Results of Differentially Expressed Genes

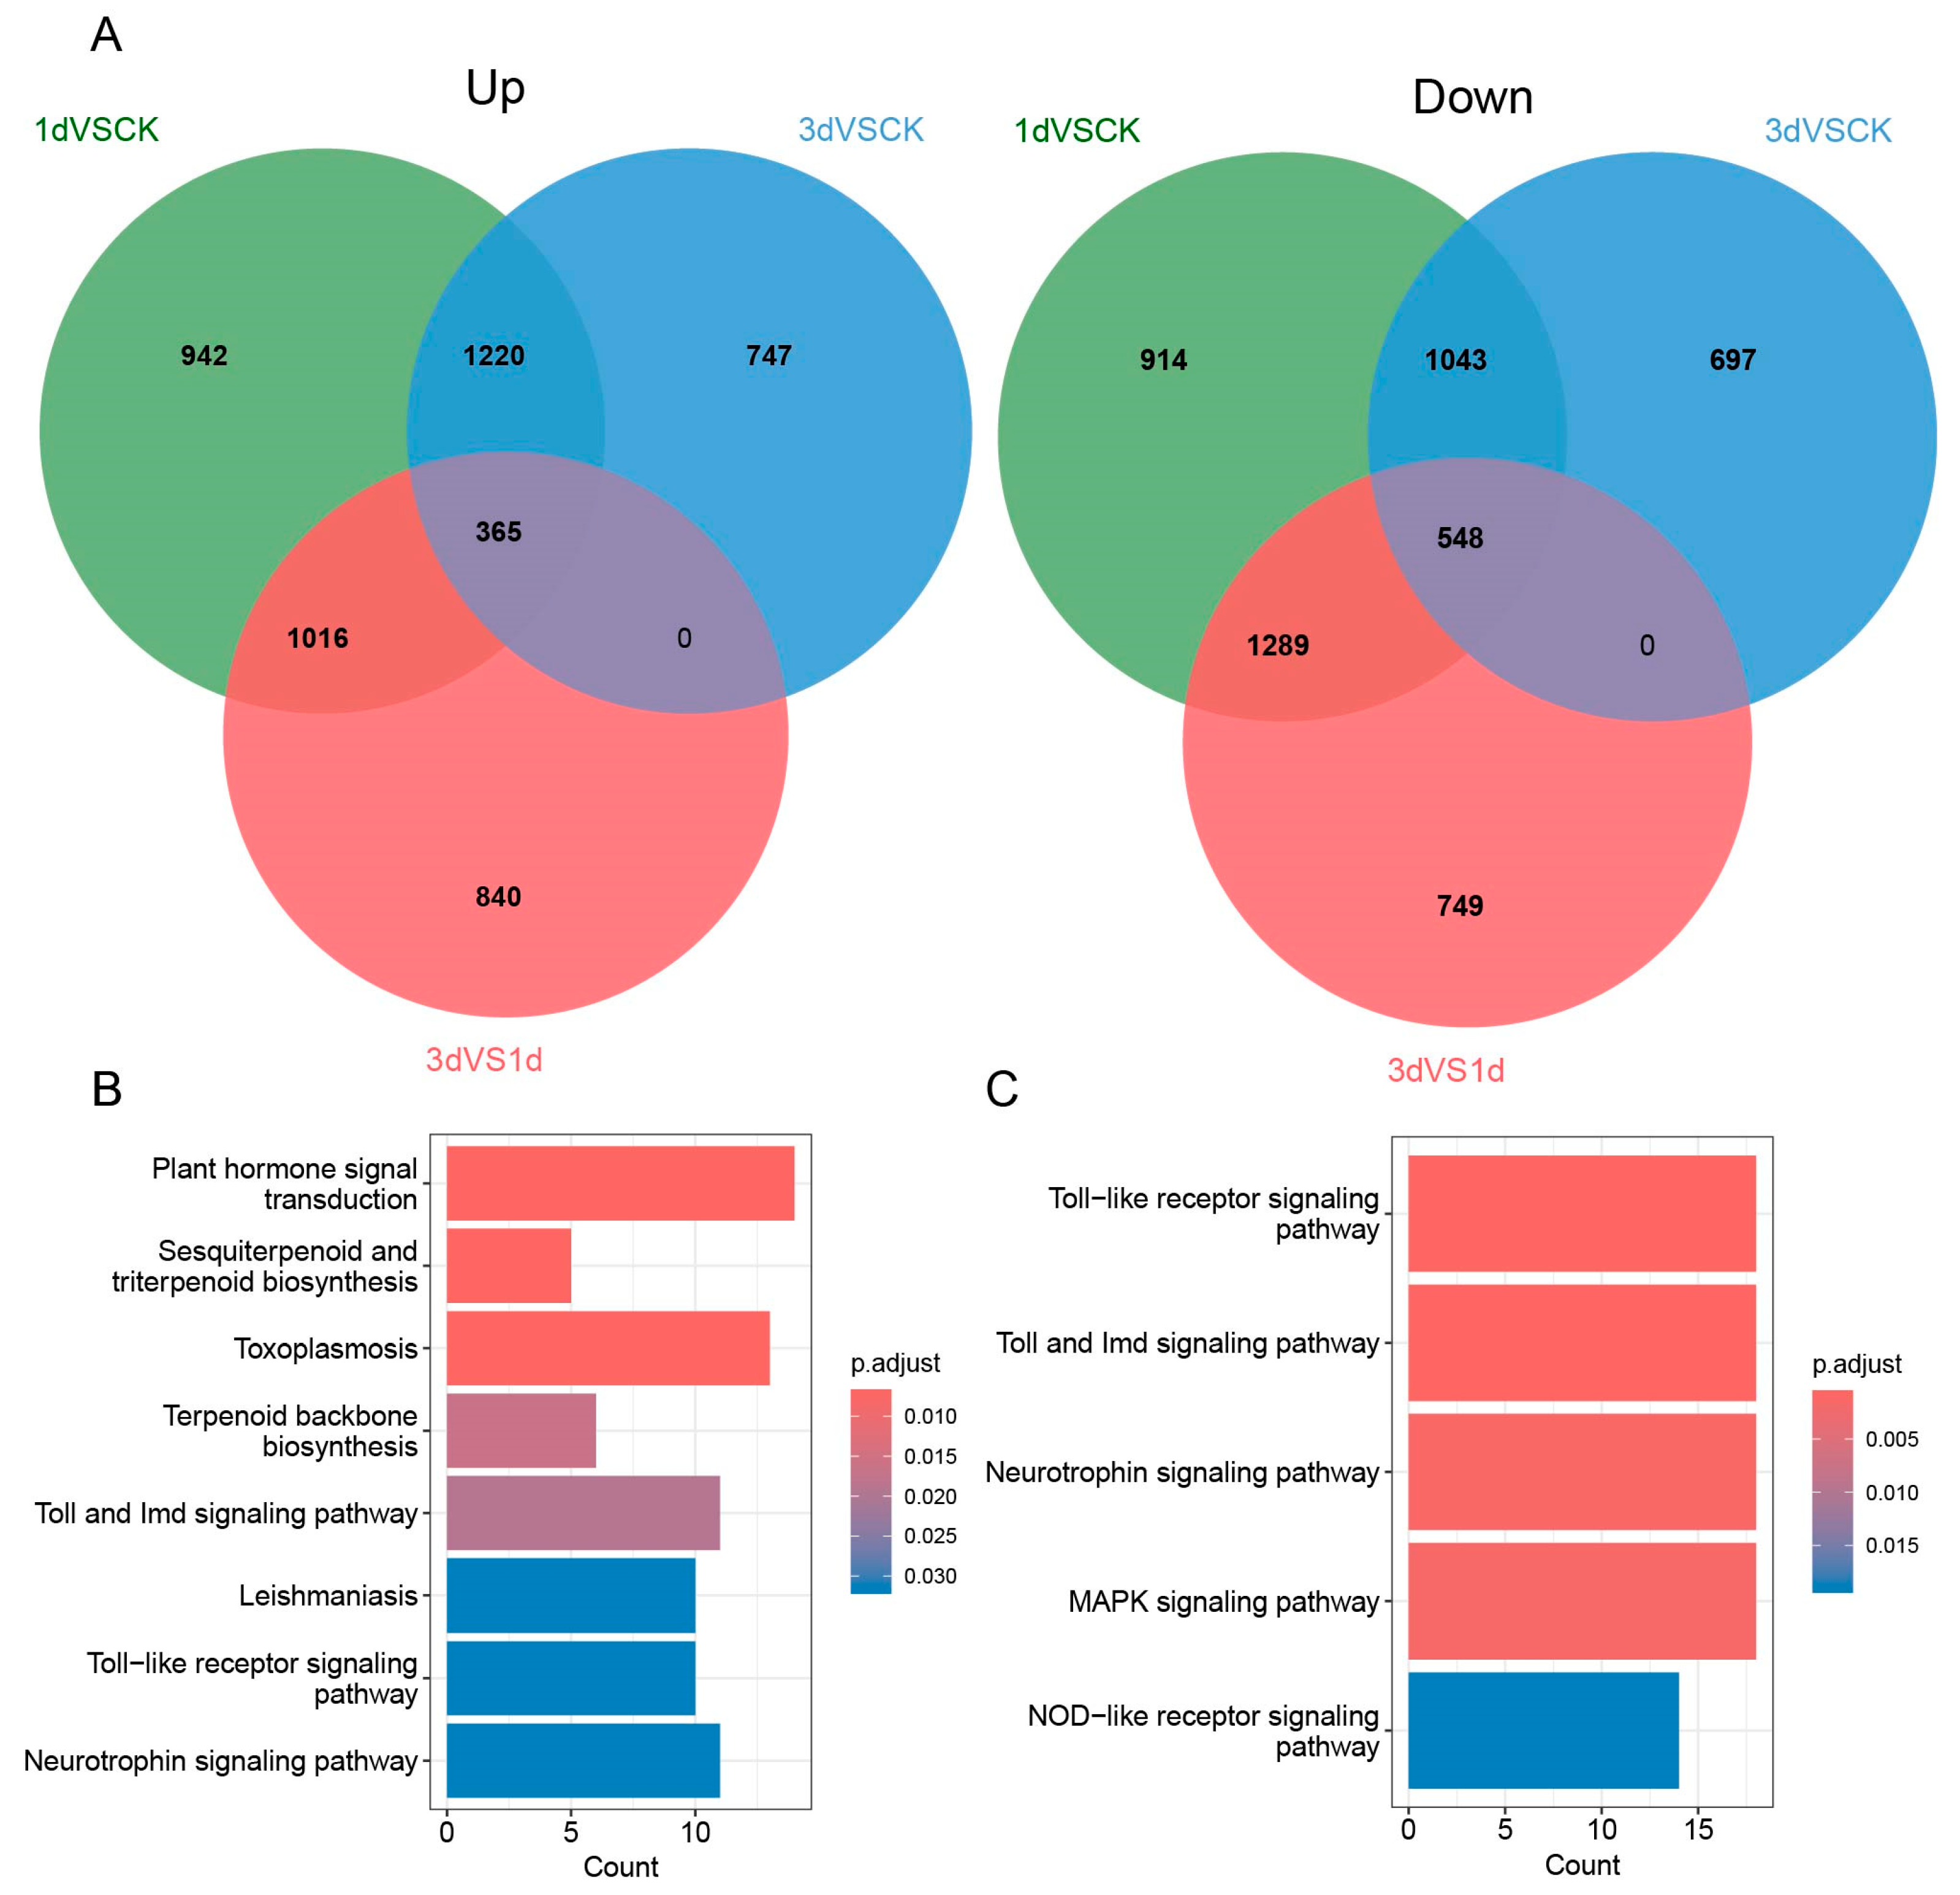
Venn diagram analysis revealed 365 persistently upregulated and 548 persistently downregulated genes under salt stress. Significantly, no overlapping DEGs were identified in the shared region between the two groups: 3 d vs. 1 d and 3d vs. CK (experimental control) (Figure 2A). KEGG pathway enrichment demonstrated that persistently downregulated DEGs were significantly (q-value < 0.05) enriched in arginine and proline metabolism pathways. Conversely, persistently upregulated DEGs showed significant enrichment in plant hormone signal transduction and sesquiterpenoid and triterpenoid biosynthesis pathways (Figure 2B). Notably, the 840 DEGs specifically upregulated in the 3 d vs. 1 d comparison were enriched in salt resistance pathways, including the MAPK signaling pathway (Figure 2C).

3.3. Genes with Increased Variation in mRNA Exon Levels Are Involved in Multiple Metabolic Pathways Associated with Salt Tolerance

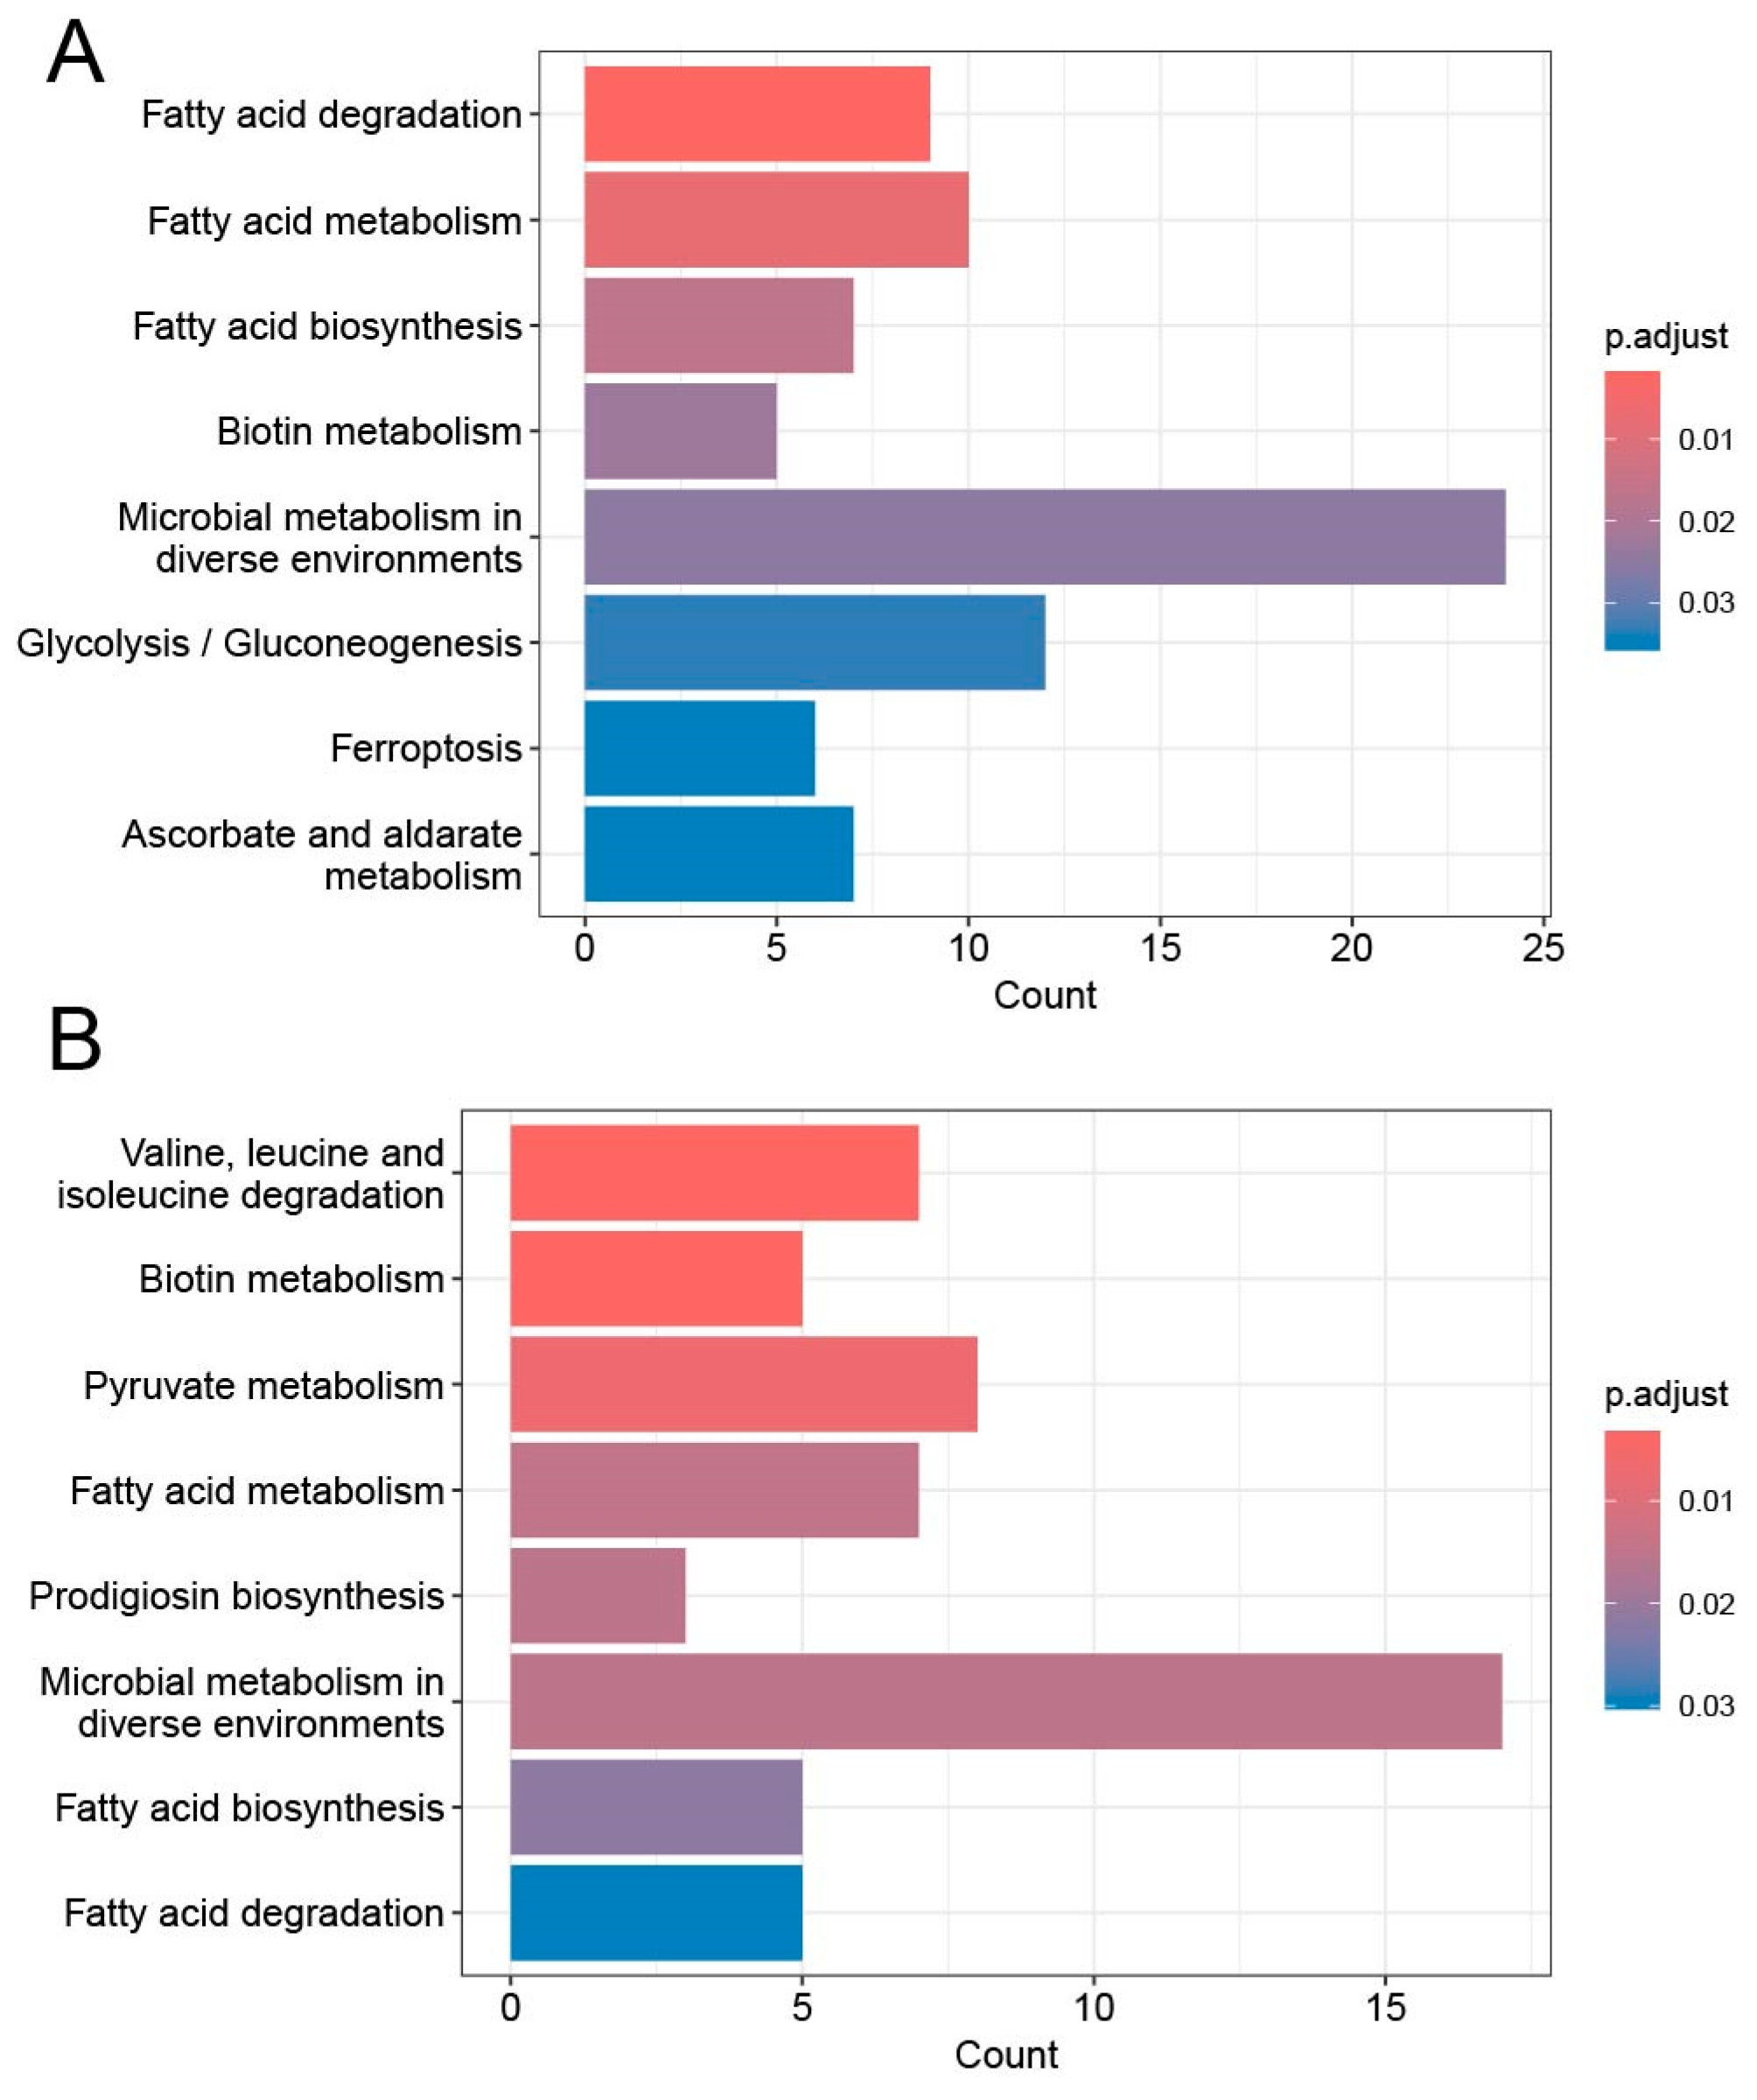
After quality control, we identified a total of 35,029 specific exon variants at the mRNA exon level (including 11,791 deletions, 1180 insertions, and 22,058 SNPs) and 6426 exon variants at the DNA level, and the number of RNA variants was significantly higher than that of DNA variants. Although the difference in the number of RNA variants and DNA variants was to a large extent determined by the fundamental conditions underlying their formation, the possibility that a variety of regulatory mechanisms may act in concert cannot be disregarded. We detected 32,532 mRNA exon-level variants in the experimental control (CK), comprising 10,809 deletions, 806 insertions, and 20,917 SNPs. After 1 day of salt stress, the number of mRNA exon variants increased to 34,102 (including 1016 insertions, 11,337 deletions, and 21,749 SNPs). Conversely, following three days of salt stress, the number of mRNA exon variants decreased to 33,682, encompassing 914 insertions, 11,098 deletions, and 21,670 SNPs. Notably, the number of mRNA exon variants increased significantly upon initial exposure to salt stress (1 d) and subsequently diminished after a prolonged period of salt stress (3 d). The KEGG pathway enrichment results showed that the genes exhibiting more mRNA exon variants when initially exposed to salt stress were broadly involved in the metabolic pathways related to salt tolerance, such as those that regulate fatty acid synthesis and metabolism, ascorbic acid metabolism, pyruvate synthesis, and other regulatory mechanisms. Furthermore, the number of these salt-tolerance-related metabolic pathways was significantly reduced on the third day of salt stress compared to the first day (Figure 3). This suggests that certain salt-tolerance responses may have reached saturation on the first day, while some genes were still involved in the regulatory processes related to salt tolerance on the third day.

3.4. Characteristics of DNA Methylation Distribution of P. vaginatum

Analysis of chromosomal distribution patterns revealed that regions of high gene density tended to coincide with low transposon density and lower levels of DNA methylation. Conversely, areas enriched with transposons were generally associated with higher DNA methylation levels (Figure 4A). Further, we calculated the genome-wide average methylation levels of 0.131, 0.136, and 0.136 for the CK, 1 d, and 3 d salt stress treatments, respectively. Comparison between the experimental and control samples showed that the 5-methylcytosine (5mC) levels of the genomic elements gradually increased with the extension of salt stress duration. The 5mC methylation levels of CG sequences in all samples exhibited a peak in the middle of the gene body (Figure 4B). In contrast, the methylation of CHG and CHH sequences was relatively less abundant in the gene body. Notably, the level of CHH sequences in the gene promoter increased with the duration of salt treatment. In conjunction with the changes observed in the 5mC methylation of the genomic elements, we speculate that the elevated level of 5mC methylation may occur more in the CHH sequence of the promoter and the CG sequence of the gene body, which implies that in the sequences of these two regions, 5mC methylation may play a regulatory role in the transcriptional expression of salt-tolerant genes. The enrichment analysis results showed that the genes showing significantly elevated methylation levels were involved in salt-tolerant metabolic pathways, such as fatty acid metabolism and synthesis, steroid biosynthesis, and peroxisomes (Figure 5). In contrast, genes with significantly elevated 5mC methylation of CG sequences in the gene body were particularly involved in the MAPK pathway, a key salt-tolerance-related pathway. However, hypomethylated genes showed no significant pathway enrichment (q-value < 0.05). This is consistent with our hypothesis that salt-stress adaptation in P. vaginatum primarily entails increased CHH methylation in the promoter and CG methylation in the gene body.

3.5. Association Analysis of DNA Methylation and mRNA Exon Variations

Based on the above results, both 5mC methylation and mRNA exon variations play important roles in improving the salt tolerance of P. vaginatum. Given the need to respond rapidly to salt stress while DNA’s low variation rate preserves genetic stability, we hypothesize that the high sequence variability of mRNA exons may play a role in regulating 5mC methylation. Firstly, we extracted 38 salt-tolerance-related genes with new mRNA exon variants by integrating gene functional analysis and enrichment analysis results. Subsequently, we manually compared the 5mC methylation levels and mRNA exon variants of these genes. Possibly due to the positive and negative regulatory effects of transcription factors, we found that the number of genes with increasing methylation levels was similar to those with decreasing methylation levels at the initial stage (1 d) of salt stress. However, these genes, which initially exhibited increased DNA methylation levels, subsequently showed a trend of recovery by decreasing their methylation levels on the third day of salt stress. Interestingly, although the mRNA exon variation at individual loci of these genes was enhanced to varying degrees at the initial stage of salt stress, the degree of mRNA exon variation was not further enhanced but also exhibited a recovery trend after a sustained period of salt stress (3 d). We therefore hypothesized that the mRNA exon variation under salt stress might promote an initial increase in DNA methylation levels to a certain extent. Furthermore, abnormal changes in DNA methylation and mRNA exons may trigger the plant’s repair mechanism for its own genes, resulting in a trend towards recovery in both DNA methylation level and the degree of mRNA exon variation.
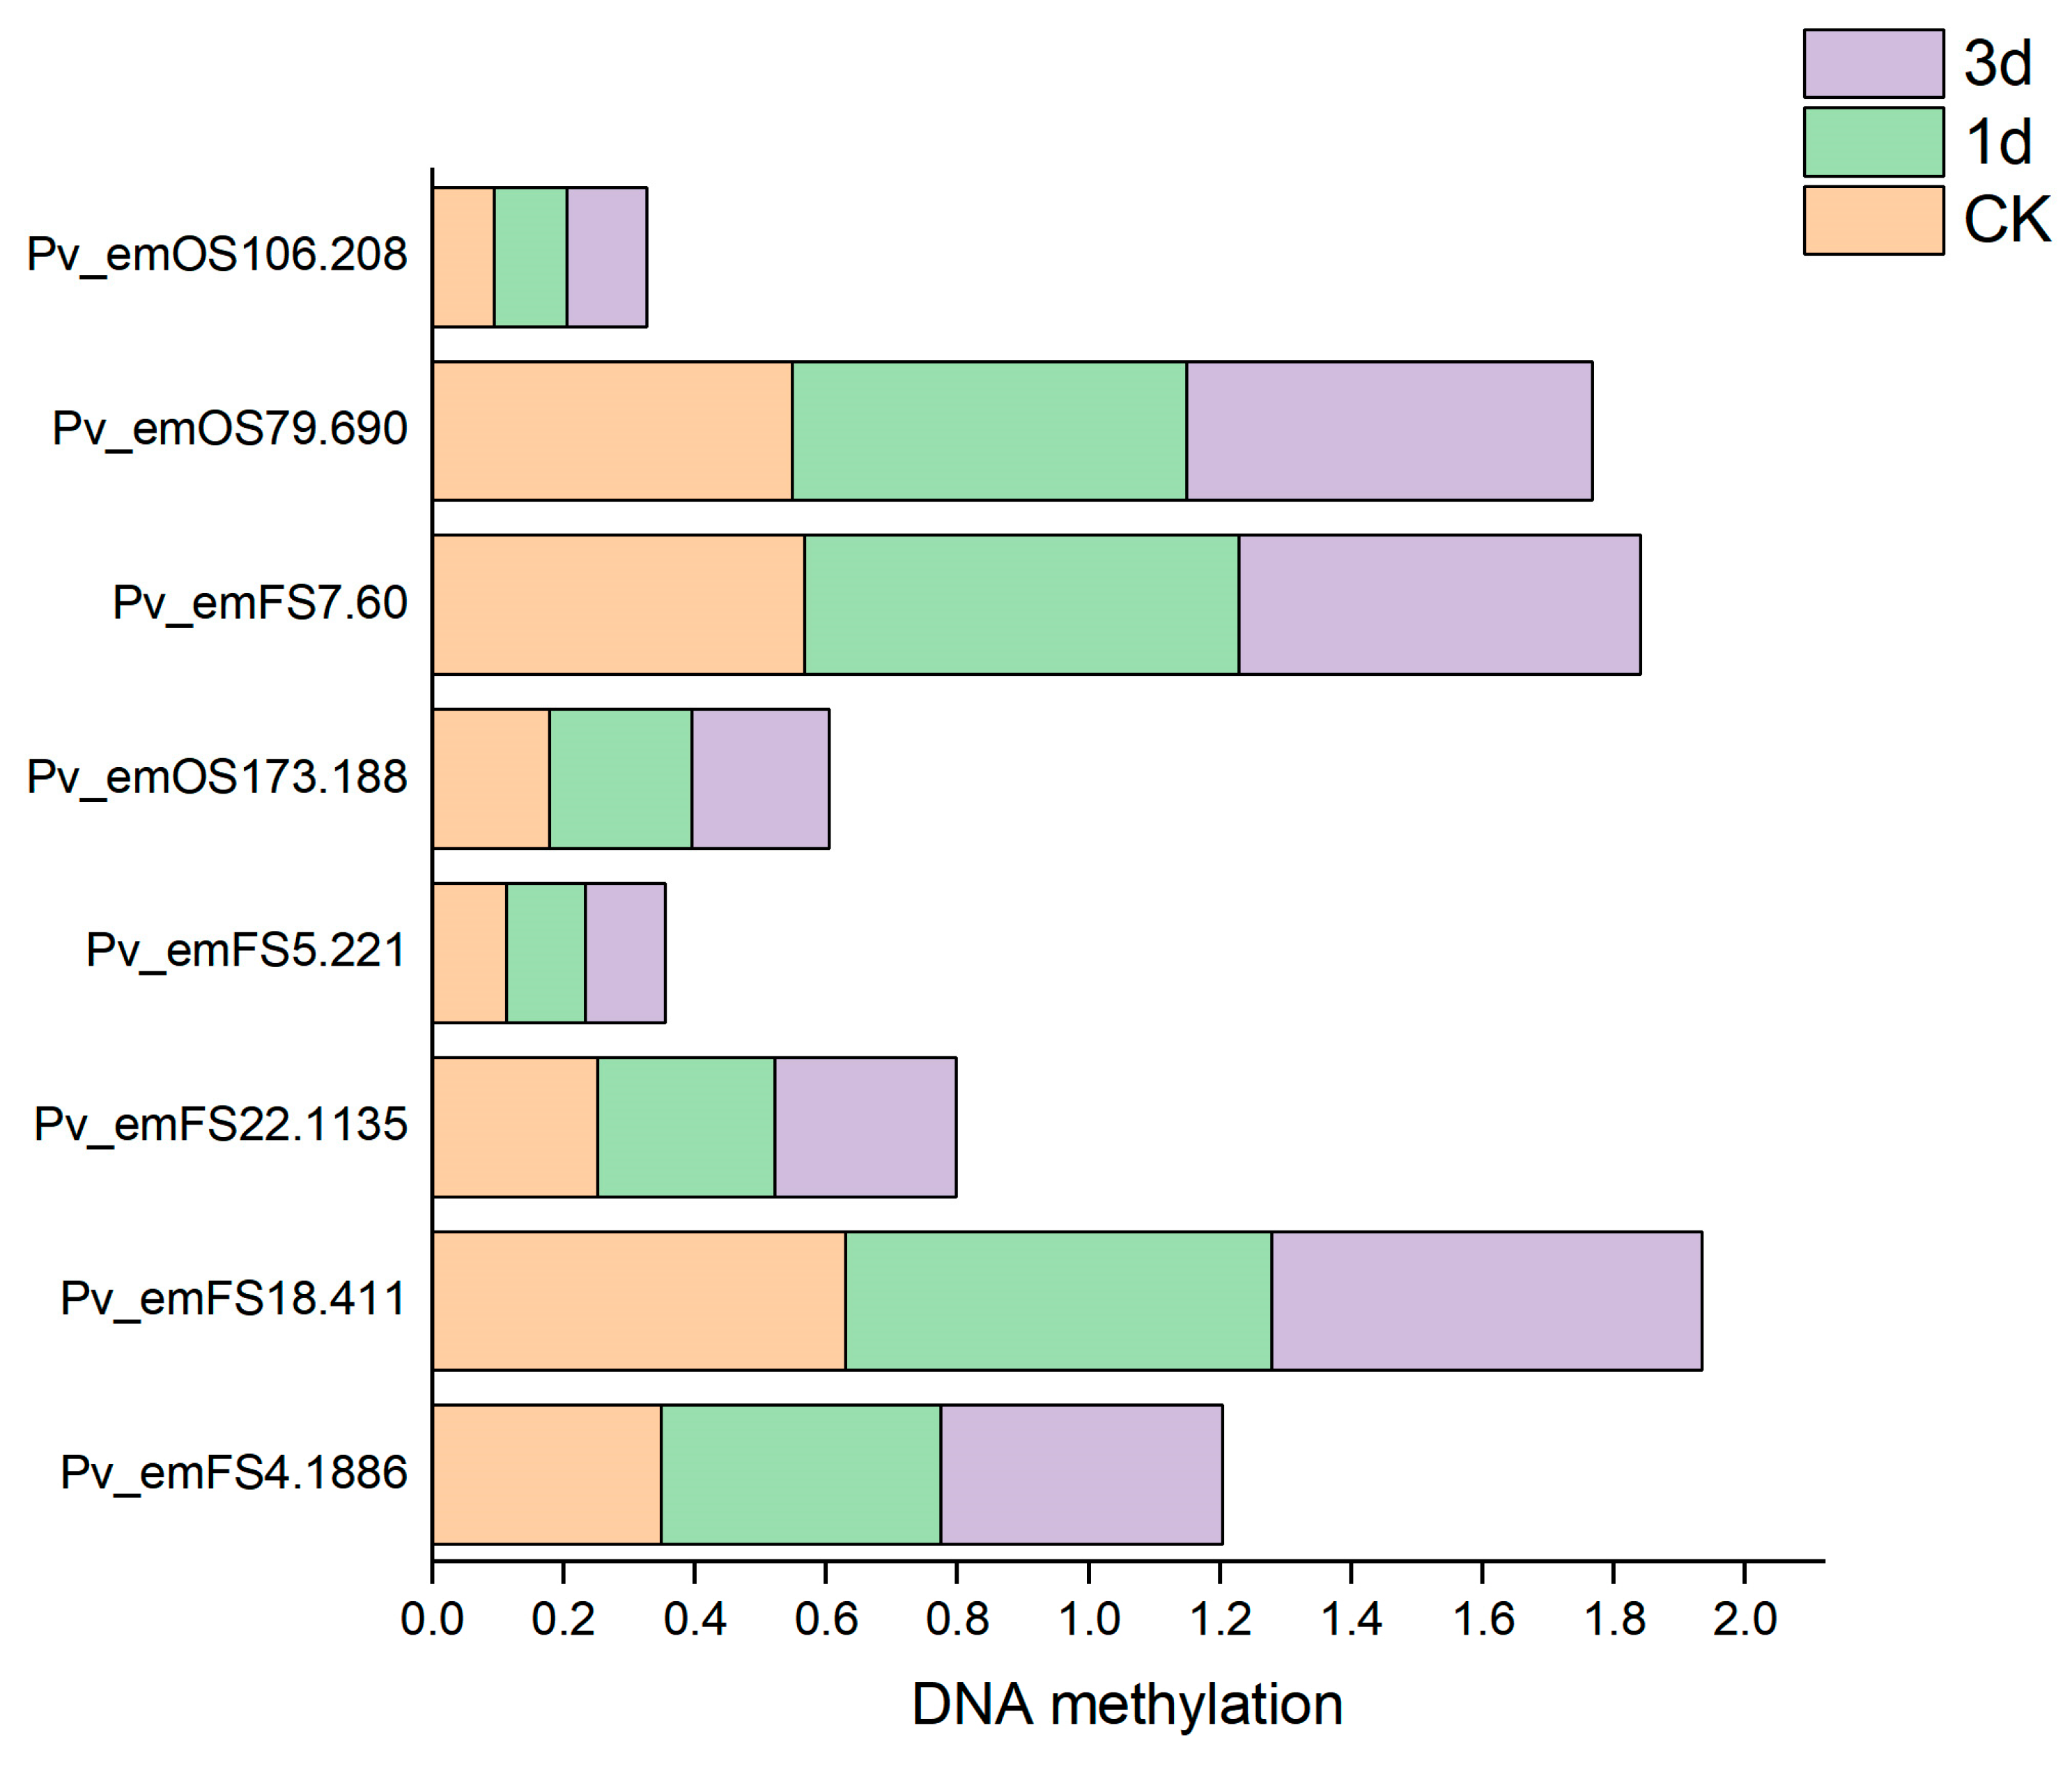
To further investigate the possible impacts of mRNA exon variants in regulating DNA methylation levels, we initially analyzed four of the 38 salt-tolerant genes whose DNA methylation levels increased with salt treatment duration (Figure 6, Table 2). These genes have been demonstrated to be important for enhancing plant salt tolerance, based on functional descriptions or protein structure predictions. We found that these genes all showed new variants containing cytosine (C). Specifically, genes with mRNA exon indels (including more cytosines) had significantly higher DNA methylation levels, suggesting that mRNA exon indels may exert a relatively more pronounced influence on regulating DNA 5mC methylation levels. To explore a more reliable relationship between mRNA exon variants and DNA methylation, we screened four salt-tolerant genes based on the results of mRNA exon variation between 1 d and 0 d. These genes exhibited new variations (0/0:1/1) at the mRNA exon level when initially exposed to salt stress, and DNA methylation levels were significantly increased (p-values < 0.05) at 1 d compared with 0 d (Figure 6, Table 2). These novel mRNA exon variants exhibited cytosine modifications. Among them, two genes have been demonstrated to be important for enhancing plant salt tolerance, while the functions of the other two have not yet been disclosed; we therefore hypothesized that they are likely to be new candidate salt-tolerance genes in P. vaginatum. Based on altered expression patterns, we propose that these changes in mRNA exons may have compromised protein functionality. Combining these findings with previous results further supports our speculation that RNA variation likely promotes DNA methylation levels.

4. Discussion

Compared to glycophytes, P. vaginatum exhibits distinct regulatory mechanisms in response to salt stress. Transcriptome analysis revealed distinct differences between the sustained transcriptional response to salt stress and the transient transcriptional response. The persistent downregulation of proline metabolism suggests a potential long-term metabolic adaptation mechanism, distinct from the initial osmotic adjustment. Conversely, the sustained upregulation of phytohormone signaling and terpene biosynthesis pathways reflects ongoing regulatory processes and continuous investment in protective mechanisms. Notably, the overlapping region of the comparisons 3 d vs. 1 d and 3 d vs. CK yielded no DEGs. This indicates a potential transitional phase between the short-term (1-day) and long-term (3-day) stress responses, suggesting epigenetic regulation may be involved as a critical mechanism for salt stress adaptation. Furthermore, key defense pathways (plant NLR receptors, neurotrophic factors, and MAPK signaling) exhibited dynamic gene induction specifically during the establishment of stress tolerance (3 d vs. 1 d comparison). This identifies a set of key candidate genes that are likely to play a central role in the development of salt tolerance.
Different plants usually exhibit distinct DNA methylation distribution patterns, which are species-specific, tissue-specific, developmental stage-specific, and individual-specific for salt-tolerance regulatory processes. These plants also display variability in DNA methylation levels across specific genes [29]. In the present study, we characterized the distribution of DNA 5mC methylation across whole genes and genomic elements in P. vaginatum. The average CG, CHG, and CHH methylation levels in the whole genome were 44%, 26%, and 1%, respectively, with CG methylation occupying the majority. The DNA methylation levels of genomic elements increased with the duration of salt treatment, aligning with the distribution of DNA methylation observed in most plants, such as maize and rice [9]. However, CHH methylation in ‘SeaIsle2000’ was notably lower, at only about 1%, compared to other plants. Furthermore, a more pronounced upward trend between methylation levels and treatment time was observed for CHH contexts compared to CG or CHG in the promoter. In rice and Arabidopsis, CG demethylation has been accompanied by localized CHH hypermethylation [30,31], and overall DNA hypomethylation during tomato development has been accompanied by CHH hypermethylation in transposable elements (TEs) during tomato ripening [32]. However, similar results were not observed during orange fruit ripening [33], suggesting that the dynamic regulation of CHH methylation may have different regulatory roles in different plants. Therefore, we hypothesize that CHH methylation may have an important role in regulating salt tolerance. It is noteworthy that elevated DNA methylation levels are not invariably associated with reduced gene expression. Certain genes exhibit multi-fold expression increases under specific conditions. Evidence indicates that CpG methylation within the gene body may promote transcriptional persistence rather than suppress expression [34]. Consequently, gene body CpG methylation likely sustains expression of associated genes, driving sustained upregulation that reinforces MAPK pathway regulation. Conversely, CHH methylation in the promoter typically represses gene expression. Elevated methylation of fatty acid metabolism-related genes may mitigate salt stress-induced overactivation, thereby aiding ionic homeostasis maintenance and preventing energy depletion. Highly expressed genes in the “Sesquiterpenoid and triterpenoid biosynthesis” and “Steroid biosynthesis” pathways likely reflect their critical role in salt stress resistance, outweighing the repressive effects of CHH methylation.
Evidence is increasingly establishing a significant association and regulatory interplay between diverse RNA-level variations/modifications and DNA methylation modifications. During the ripening process of tomato, DNA methylation affects RNA 6mA modification by regulating the expression of the 6mA demethylase genes. In turn, 6mA demethylase provides feedback regulation of DNA methylation, thus co-regulating fruit ripening [35], and a similar relationship exists between the effects of 6mA methylation and 5mC methylation in cancer cells [14]. In addition to RNA methylation, the role of small RNAs in altering DNA methylation has also been found in numerous plants, including Cajanus cajan [36]. Moreover, m5C modification has also been identified in mRNAs, tRNAs, rRNAs, and long non-coding RNAs [37], yet the detailed molecular mechanisms underlying these processes remain largely unexplored, indicating that there is still substantial potential for further research in the field of the association between DNA methylation and RNA. Our results showed that under salt stress, the number of mRNA exon variants in salt-tolerance-related genes was significantly greater than that of DNA variants. Furthermore, the variation in mRNA levels within the exons of salt-tolerant genes had a certain promotional effect on DNA methylation under salt stress. Notably, substantial variation in DNA methylation levels was observed among replicate samples subjected to the identical treatment. This inter-sample variability suggests that DNA methylation may orchestrate diverse salt-tolerance strategies. These findings provide crucial insights into the relationship between DNA methylation and its target genes. Collectively, they demonstrate a complex regulatory interplay and flexible regulatory mechanisms between epigenetic modifications and RNA expression in P. vaginatum under salt stress.
Plants maintain homeostasis of their endogenous RNAs through a multitude of mechanisms. One such mechanism involves the NAD+- cap, which serves as an RNA 5’ cap structure that may have a role in enhancing mRNA stability [38]. Additionally, plant immunoproteins possess the ability to modify and reactivate defective miRNA pathways [39], and PRT2a regulates the levels of exogenous RNAs through concerted Arabidopsis RNA quality control (RQC) to promote post-transcriptional gene silencing (PTGS), thereby regulating exogenous RNA levels [40]. According to our study results, the number of mRNA exon variations increased to regulate the expression and transcription of salt-tolerant genes at the onset of salt stress. However, by the third day of salt stress, this number decreased significantly, with the mRNA exons exhibiting a clear trend towards reduced variability. These results suggested that mRNA exon variations rapidly respond to salt stress but may also be constrained by the homeostatic thresholds of endogenous RNAs. We hypothesize that this likely has an effect on the DNA methylation levels of salt-tolerant genes, resulting in an increase in DNA methylation levels at the beginning of salt stress, followed by a significant decreasing trend on the third day. This observation suggests that there may be an adaptive regulatory process of mRNA exon variations on the dynamics of DNA methylation under salt stress.

5. Conclusions

To address the knowledge gap in epigenetic modifications underlying halophyte salt-tolerance mechanisms, this study employed transcriptomics to delineate the phased adaptation of the homogeneous P. vaginatum germplasm ‘Sealcle2000’ to salt stress from day 1 to day 3. We demonstrate the involvement of epigenetic mechanisms in progressive stress adaptation and characterize the genomic distribution of DNA 5-methylcytosine (5mC) in P. vaginatum, revealing distinct patterns compared to glycophytes—particularly in CHH contexts. Notably, promoter CHH methylation likely stabilizes transcriptional homeostasis by suppressing hyperactive early stress responses, while gene body CG methylation contributes robustly to post-stress homeostasis and ion balance maintenance. Furthermore, we identified functional crosstalk between mRNA exon variation and DNA methylation. Despite RNA self-regulation and recovery processes, bidirectional regulatory interplay persists between these molecular layers. These findings provide mechanistic insights into the regulation of DNA methylation by salt-responsive mRNA exon variants, and the multi-omics networks governing halophyte salt adaptation.

Author Contributions

Conceptualization, Q.Z., X.Z. and M.T.; data curation, M.T.; formal analysis, Y.W.; funding acquisition, M.T. and Z.W.; investigation, Q.Z. and X.Z.; methodology, M.T.; project administration, M.T.; resources, M.T. and Z.W.; software, Y.W. and M.T.; validation, Y.W. and M.T.; visualization, Y.W.; writing—original draft, Y.W.; writing—review and editing, M.T. and Z.W. All authors have read and agreed to the published version of the manuscript.

Funding

This research was funded by the Hainan Province Science and Technology Special Fund, grant number ZDYF2023XDNY078; the Innovational Fund for Scientific and Technological Personnel of Hainan Province, grant number KJRC2023C21; the National Natural Science Foundation of China, grant numbers 32060409, 32371782, and 32460358; the Collaborative Innovation Center Project of Nanfan and High-Efficiency Tropical Agriculture in Hainan University, grant number XTCX2022NYB08; and the Collaborative Innovation Center Project of Ecological Civilization in Hainan University, grant number XTCX2022STC10.

Data Availability Statement

The data generated in this study are included in this article and its additional materials. The RNA-seq and DNA WGBS data reported in this paper have been deposited in the Genome Sequence Archive in the National Genomics Data Center (GSA: CRA020765) and are publicly accessible at https://ngdc.cncb.ac.cn/gsa, accessed on 29 November 2024.

Conflicts of Interest

The authors declare no conflicts of interest.

References

  1. Vanyushin, B.F.; Ashapkin, V.V. DNA methylation in higher plants: Past, present and future. Biochim. Biophys. Acta 2011, 1809, 360–368. [Google Scholar] [CrossRef] [PubMed]
  2. Sun, M.H.; Yang, Z.; Liu, L.; Duan, L. DNA methylation in plant responses and adaption to abiotic stresses. Int. J. Mol. Sci. 2022, 23, 6910. [Google Scholar] [CrossRef]
  3. Pan, L.Y.; Ma, J.J.; Li, J.M.; Yin, B.B.; Fu, C. Advances of salt stress-responsive transcription factors in plants. Chin. J. Biotechnol. 2022, 38, 50–65. [Google Scholar]
  4. Baek, D.; Jiang, J.F.; Chung, J.-S.; Wang, B.S.; Chen, J.P.; Xin, Z.G.; Shi, H.Z. Regulated AtHKT1 gene expression by a distal enhancer element and DNA methylation in the promoter plays an important role in salt tolerance. Plant Cell Physiol. 2011, 52, 149–161. [Google Scholar] [CrossRef]
  5. Kumar, S.; Beena, A.S.; Awana, M.; Singh, A. Salt-induced tissue-specific cytosine methylation downregulates expression of HKT genes in contrasting wheat (Triticum aestivum L.) genotypes. DNA Cell Biol. 2017, 36, 283–294. [Google Scholar] [CrossRef]
  6. Xu, R.; Wang, Y.H.; Zheng, H.; Lu, W.; Wu, C.; Huang, J.G.; Yan, K.; Yang, G.D.; Zheng, C.C. Salt-induced transcription factor MYB74 is regulated by the RNA-directed DNA methylation pathway in Arabidopsis. J. Exp. Bot. 2015, 66, 5997–6008. [Google Scholar] [CrossRef]
  7. Zhang, W.X.; Wang, N.; Yang, J.T.; Guo, H.; Liu, Z.H.; Zheng, X.J.; Li, S.; Xiang, F.N. The salt-induced transcription factor GmMYB84 confers salinity tolerance in soybean. Plant Sci. 2020, 291, 110326. [Google Scholar] [CrossRef] [PubMed]
  8. Peng, H.; Zhang, J. Plant genomic DNA methylation in response to stresses: Potential applications and challenges in plant breeding. Prog. Nat. Sci. 2009, 19, 1037–1045. [Google Scholar] [CrossRef]
  9. Zhang, H.M.; Lang, Z.B.; Zhu, J.K. Dynamics and function of DNA methylation in plants. Nat. Rev. Mol. Cell Biol. 2018, 19, 489–506. [Google Scholar] [CrossRef]
  10. Li, H.; Zhang, Y.F.; Li, X.G.; Wang, Z.H.; Lin, J.; Chang, Y.H. Identification of Salt-Tolerant Transcription Factors in the Roots of Pyrus betulaefolia by the Association Analysis of Genome-Wide DNA Methylation and Transcriptome. Sci. Agric. Sin. 2023, 56, 1377–1390. [Google Scholar]
  11. He, X.; Chen, Y.; Xia, Y.; Hong, X.; You, H.; Zhang, R.; Liang, Z.; Cui, Q.; Zhang, S.; Zhou, M. DNA methylation regulates biosynthesis of tanshinones and phenolic acids during growth of Salvia miltiorrhiza. Plant Physiol. 2024, 194, 2086–2100. [Google Scholar] [CrossRef] [PubMed]
  12. Gao, H.; Xiao, G.A.; Bao, Y.; Xia, Q.M.; Xie, K.D.; Wu, X.M.; Guo, W.W. Integrative DNA methylome and transcriptome analysis illuminate leaf phenotype alterations in tetraploid citrus. Hortic. Adv. 2024, 2, 28. [Google Scholar] [CrossRef]
  13. Sun, T.Y.; Xu, Y.Y.; Xiang, Y.; Ou, J.H.; Soderblom, E.J.; Diao, Y.R. Crosstalk between RNA m6A and DNA methylation regulates transposable element chromatin activation and cell fate in human pluripotent stem cells. Nat. Genet. 2023, 55, 1324–1335. [Google Scholar] [CrossRef] [PubMed]
  14. Deng, S.; Zhang, J.L.; Su, J.C.; Zuo, Z.X.; Zeng, L.X.; Liu, K.J.; Zheng, Y.F.; Huang, X.D.; Bai, R.H.; Zhuang, L.S. RNA m6A regulates transcription via DNA demethylation and chromatin accessibility. Nat. Genet. 2022, 54, 1427–1437. [Google Scholar] [CrossRef]
  15. Zhang, M.; Yang, L.L.; Jia, Y.H.; Wang, T.Y. Research Progress in the Roles of DNA and Histone Methylations in Epigenetic Regulation. Biotechnol. Bull. 2022, 38, 23–30. [Google Scholar]
  16. Chen, S.F.; Zhou, Y.Q.; Chen, Y.R.; Gu, J. fastp: An ultra-fast all-in-one FASTQ preprocessor. Bioinformatics 2018, 34, i884–i890. [Google Scholar] [CrossRef]
  17. Kim, D.; Paggi, J.M.; Park, C.; Bennett, C.; Salzberg, S.L. Graph-based genome alignment and genotyping with HISAT2 and HISAT-genotype. Nat. Biotechnol. 2019, 37, 907–915. [Google Scholar] [CrossRef]
  18. Ferragina, P.; Manzini, G. Opportunistic data structures with applications. In Proceedings of the 41st Annual Symposium on Foundations of Computer Science, Washington, DC, USA, 12–14 November 2000; pp. 390–398. [Google Scholar]
  19. Xu, Z.J.; Jiang, Z.Y.; Wang, H.F.; Xie, L. Performance Evaluation of Whole Genome Bisulfite Sequencing Alignment Software for Plant Data Analysis. Genom. Appl. Biol. 2024, 43, 986–996. [Google Scholar]
  20. Liao, Y.; Smyth, G.K.; Shi, W. featureCounts: An efficient general purpose program for assigning sequence reads to genomic features. Bioinformatics 2014, 30, 923–930. [Google Scholar] [CrossRef]
  21. Love, M.I.; Huber, W.; Anders, S. Moderated estimation of fold change and dispersion for RNA-seq data with DESeq2. Genome Biol. 2014, 15, 550. [Google Scholar] [CrossRef]
  22. Lever, J.; Krzywinski, M.; Altman, N. Points of significance: Principal component analysis. Nat. Methods 2017, 14, 641–643. [Google Scholar] [CrossRef]
  23. Paul, D.S.; Guilhamon, P.; Karpathakis, A.; Butcher, L.M.; Thirlwell, C.; Feber, A.; Beck, S. Assessment of RainDrop BS-seq as a method for large-scale, targeted bisulfite sequencing. Epigenetics 2014, 9, 678–684. [Google Scholar] [CrossRef]
  24. Zhou, Q.W.; Lim, J.Q.; Sung, W.K.; Li, G.L. An integrated package for bisulfite DNA methylation data analysis with Indel-sensitive mapping. BMC Bioinform. 2019, 20, 47. [Google Scholar] [CrossRef]
  25. McKenna, A.; Hanna, M.; Banks, E.; Sivachenko, A.; Cibulskis, K.; Kernytsky, A.; Garimella, K.; Altshuler, D.; Gabriel, S.; Daly, M. The Genome Analysis Toolkit: A MapReduce framework for analyzing next-generation DNA sequencing data. Genome Res. 2010, 20, 1297–1303. [Google Scholar] [CrossRef]
  26. Danecek, P.; Auton, A.; Abecasis, G.; Albers, C.A.; Banks, E.; DePristo, M.A.; Handsaker, R.E.; Lunter, G.; Marth, G.T.; Sherry, S.T. The variant call format and VCFtools. Bioinformatics 2011, 27, 2156–2158. [Google Scholar] [CrossRef] [PubMed]
  27. Wang, K.; Li, M.Y.; Hakonarson, H. ANNOVAR: Functional annotation of genetic variants from high-throughput sequencing data. Nucleic Acids Res. 2010, 38, e164. [Google Scholar] [CrossRef]
  28. Kanehisa, M.; Goto, S. KEGG: Kyoto encyclopedia of genes and genomes. Nucleic Acids Res. 2000, 28, 27–30. [Google Scholar] [CrossRef] [PubMed]
  29. Mastan, S.G.; Rathore, M.S.; Bhatt, V.D.; Yadav, P.; Chikara, J. Assessment of changes in DNA methylation by methylation-sensitive amplification polymorphism in Jatropha curcas L. subjected to salinity stress. Gene 2012, 508, 125–129. [Google Scholar] [CrossRef] [PubMed]
  30. Hsieh, T.F.; Ibarra, C.A.; Silva, P.; Zemach, A.; Eshed-Williams, L.; Fischer, R.L.; Zilberman, D. Genome-wide demethylation of Arabidopsis endosperm. Science 2009, 324, 1451–1454. [Google Scholar] [CrossRef]
  31. Zemach, A.; Kim, M.Y.; Silva, P.; Rodrigues, J.A.; Dotson, B.; Brooks, M.D.; Zilberman, D. Local DNA hypomethylation activates genes in rice endosperm. Proc. Natl. Acad. Sci. USA 2010, 107, 18729–18734. [Google Scholar] [CrossRef]
  32. Zhong, S.L.; Fei, Z.J.; Chen, Y.R.; Zheng, Y.; Huang, M.Y.; Vrebalov, J.; McQuinn, R.; Gapper, N.; Liu, B.; Xiang, J. Single-base resolution methylomes of tomato fruit development reveal epigenome modifications associated with ripening. Nat. Biotechnol. 2013, 31, 154–159. [Google Scholar] [CrossRef]
  33. Huang, H.; Liu, R.; Niu, Q.F.; Tang, K.; Zhang, B.; Zhang, H.; Chen, K.S.; Zhu, J.K.; Lang, Z.B. Global increase in DNA methylation during orange fruit development and ripening. Proc. Natl. Acad. Sci. USA 2019, 116, 1430–1436. [Google Scholar] [CrossRef] [PubMed]
  34. Liu, W.; Gallego-Bartolomé, J.; Zhou, Y.; Zhong, Z.; Wang, M.; Wongpalee, S.P.; Gardiner, J.; Feng, S.; Kuo, P.H.; Jacobsen, S.E. Ectopic targeting of CG DNA methylation in Arabidopsis with the bacterial SssI methyltransferase. Nat. Commun. 2021, 12, 3130. [Google Scholar] [CrossRef]
  35. Zhou, L.L.; Tian, S.P.; Qin, G.Z. RNA methylomes reveal the m 6 A-mediated regulation of DNA demethylase gene SlDML2 in tomato fruit ripening. Genome Biol. 2019, 20, 1–23. [Google Scholar] [CrossRef]
  36. Sinha, P.; Singh, V.K.; Saxena, R.K.; Kale, S.M.; Li, Y.; Garg, V.; Meifang, T.; Khan, A.W.; Kim, K.D.; Chitikineni, A. Genome—Wide analysis of epigenetic and transcriptional changes associated with heterosis in pigeonpea. Plant Biotechnol. J. 2020, 18, 1697–1710. [Google Scholar] [CrossRef]
  37. Boulias, K.; Greer, E.L. Biological roles of adenine methylation in RNA. Nat. Rev. Genet. 2023, 24, 143–160. [Google Scholar] [CrossRef] [PubMed]
  38. Wang, W.; Li, K.; Yang, Z.; Hou, Q.; Zhao, W.W.; Sun, Q. RNase H1C collaborates with ssDNA binding proteins WHY1/3 and recombinase RecA1 to fulfill the DNA damage repair in Arabidopsis chloroplasts. Nucleic Acids Res. 2021, 49, 6771–6787. [Google Scholar] [CrossRef] [PubMed]
  39. Qi, Y.; Ding, L.; Zhang, S.W.; Yao, S.Z.; Ong, J.N.; Li, Y.; Wu, H.; Du, P. A plant immune protein enables broad antitumor response by rescuing microRNA deficiency. Cell 2022, 185, 1888–1904.e24. [Google Scholar] [CrossRef]
  40. Kim, M.H.; Jeon, J.; Lee, S.; Lee, J.H.; Gao, L.; Lee, B.-H.; Park, J.M.; Kim, Y.J.; Kwak, J.M. Proteasome subunit RPT2a promotes PTGS through repressing RNA quality control in Arabidopsis. Nat. Plants 2019, 5, 1273–1282. [Google Scholar] [CrossRef]
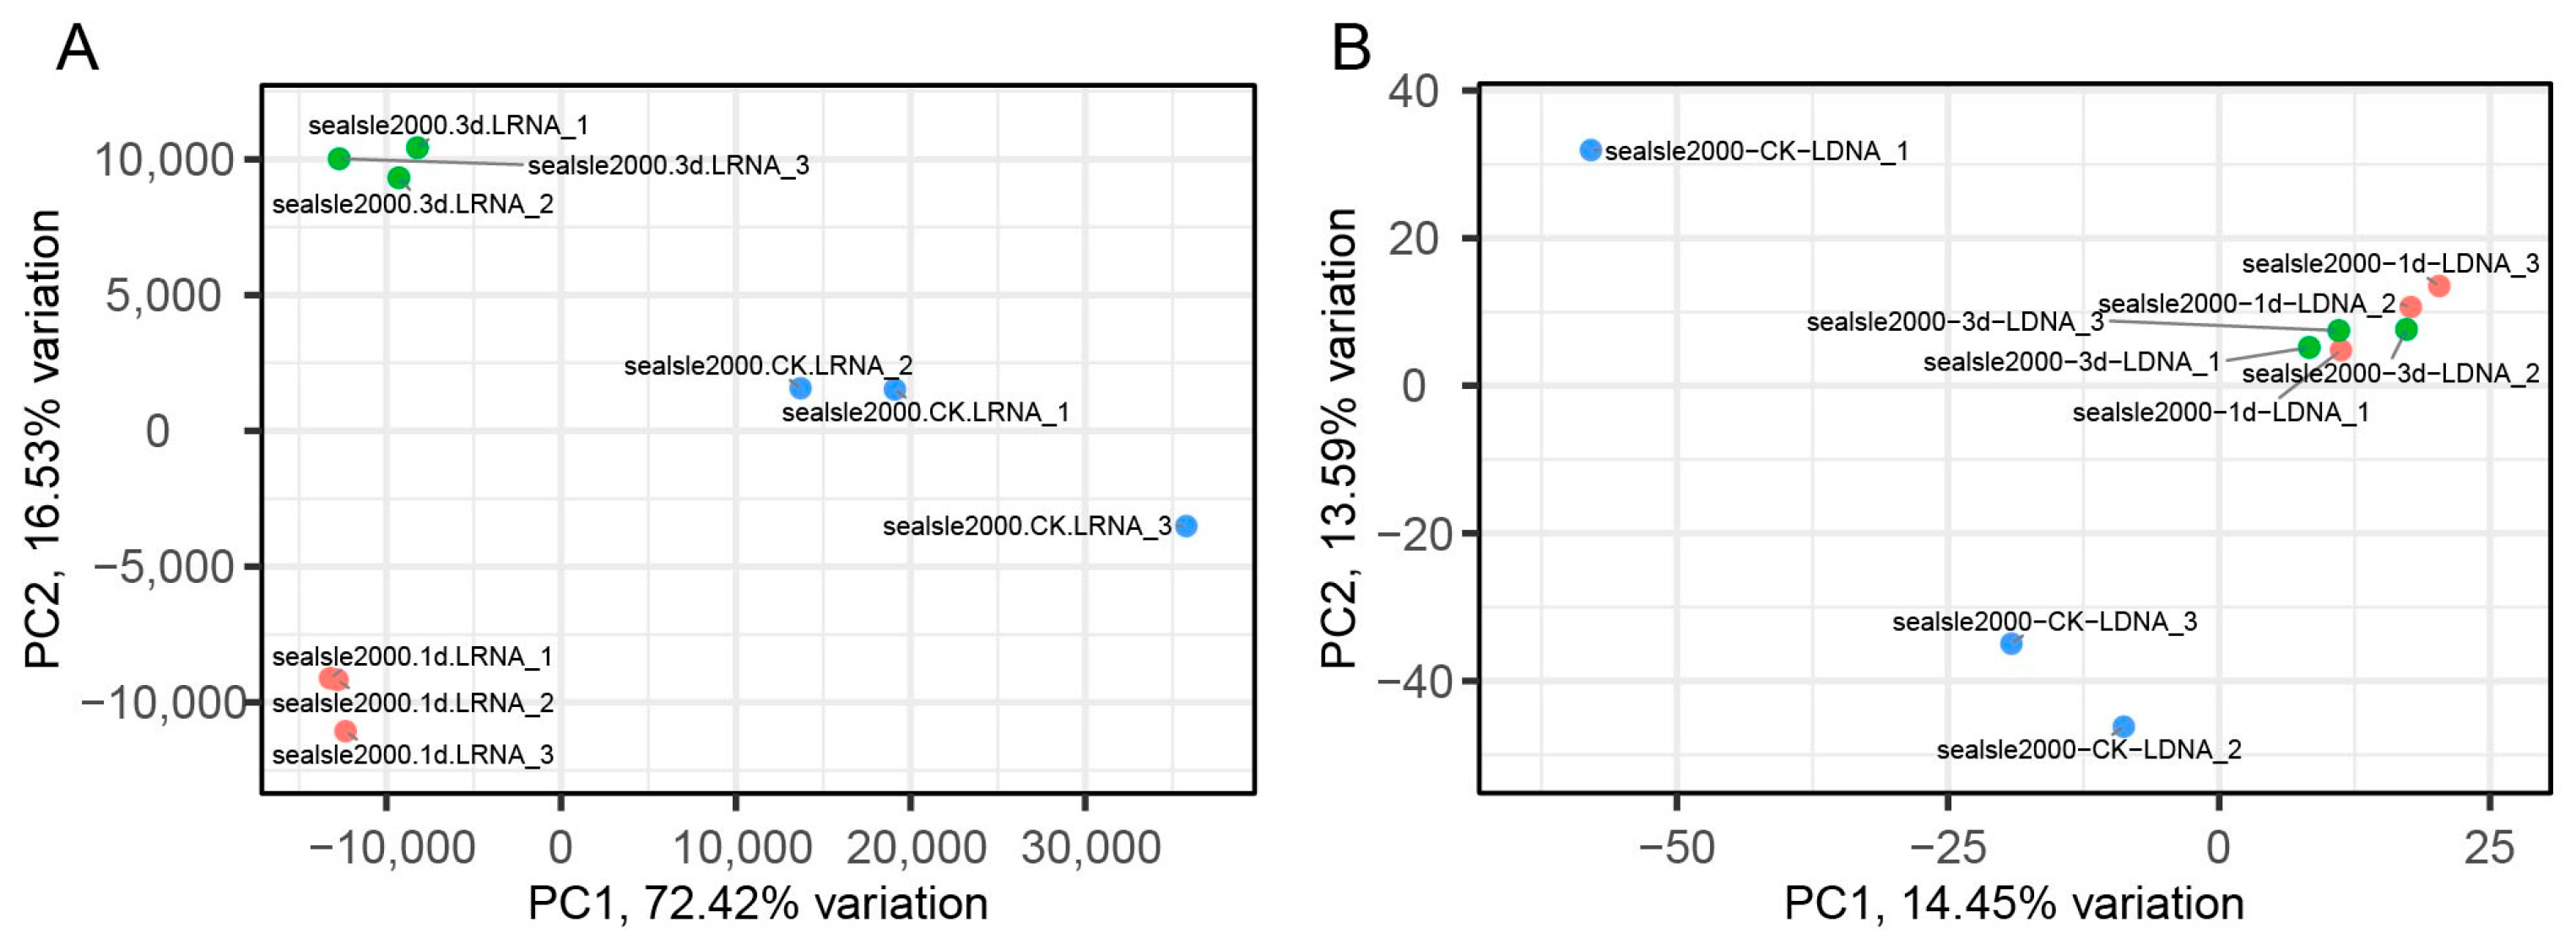
Figure 1. PCA results of gene expression and DNA methylation. (A) Expression-based PCA for control and experimental groups; (B) small-window methylation-based PCA for control and experimental groups. Horizontal axis labeled PC1 indicates the first principal component and the vertical axis labeled PC2 indicates the second principal component.
Agriculture 15 01875 g001
Figure 2. Analysis results of DEGs. (A) Venn diagrams illustrating the distribution of up- and downregulated DEGs among the three comparison groups (1 d vs. CK, 3 d vs. CK, 3 d vs. 1 d). (B) The KEGG enrichment analysis results of the 365 core upregulated genes. (C) The KEGG enrichment analysis results of 840 specific upregulated genes in 3 d vs. 1 d.
Agriculture 15 01875 g002
Figure 3. Functional analysis of RNA variant enhancement genes. (A) Results of 1 day vs. CK enrichment analysis; (B) results of 3-day vs. 1-day enrichment analysis. Count indicates the number of genes enriched in the metabolic pathway, and the color of the bar p.adjust indicates the corrected p-value.
Agriculture 15 01875 g003
Figure 4. Distribution of DNA 5mC methylation levels. (A) Distribution of DNA 5mC methylation levels and gene density and transposon (TE) density; (B) distribution of DNA 5mC methylation levels of multi-sample genomic elements.
Agriculture 15 01875 g004
Figure 5. Enrichment results of genes exhibiting significantly elevated levels of DNA 5mC methylation in the CHH sequence of the gene promoter following one day of treatment. The count indicates the number of genes enriched in the metabolic pathway, and the color of the bar indicates the corrected p-value (p.adjust).
Agriculture 15 01875 g005
Figure 6. DNA 5mC methylation levels of eight genes at three different time points. The first four genes originated from the screening of elevated DNA 5mC methylation levels and accumulation of RNA variations. The last four genes originated from the screening of DNA 5mC methylation levels that were significantly different from RNA variations. The horizontal axis of DNA methylation represents the accumulation of methylation levels, and the vertical axis represents the gene name.
Agriculture 15 01875 g006
Table 1. Data volume and comparison of different samples after quality filtering.
SamplesRNA Clean DataDNA Clean Data
Sum_seqs
(M)
Sum_ Base
(Gb)
Mapping
Efficiency
Sum_seqs
(M)
Sum_ BASE
(Gb)
Unique Mapping
Efficiency
mC/CMethylation Site Sequence
mCG/CGmCHG/CHGmCHH/CHH
CK-120.73.193.9%52.27.371.5%11.6%42.6%24.8%1.1%
CK-221.03.292.3%55.77.872.8%12.0%43.9%25.9%1.1%
CK-319.32.994.2%55.57.872.9%12.2%45.1%26.3%1.1%
1D-125.33.893.2%60.78.571.6%12.5%45.6%27.0%1.1%
1D-221.53.293.1%54.17.672.0%12.5%46.7%27.3%1.1%
1D-320.63.192.8%53.87.572.9%12.8%47.5%28.2%1.1%
3D-119.52.992.8%68.59.671.0%12.5%48.3%27.7%1.2%
3D-221.43.293.4%55.07.772.3%12.7%48.2%28.0%1.2%
3D-321.23.293.1%54.27.672.8%12.5%47.4%27.4%1.2%
CK: control group; D: days of salt stress treatment; mC/C: cytosine methylation rate; mCG/CG: CG sequence methylation ratio; mCHG/CHG: CHG sequence methylation ratio; mCHH/CHH: CHH sequence methylation ratio.
Table 2. mRNA exon variation profiles, DNA methylation levels, differentially expressed data and functional descriptions of eight genes at different time points.
Gene NameVariant Type
(0 d vs. 1 d vs. 3 d)
PositionAverage DNA 5mC
Methylation Level
FPKM Log2FoldChange
(0 d vs. 1 d)
Functional Description
CK1 d3 d
Pv_emFS18.411frameshift deletion 0/1:1/1:0/1exon100.62860.65020.6547−1.6183Ubiquitin-like modifier-activating enzyme ATG7 N-terminus (ATG7).
Pv_emFS22.1135frameshift deletion 0/0:0/1:0/1exon70.25110.27130.2756−1.1210Belongs to the peroxidase family (APX7).
Pv_emFS4.1886synonymous SNV 0/0:0/1:0/1exon50.34840.42650.4293−2.1420Belongs to the beta-ketoacyl-ACP synthases family (Ketoacyl-synt_C).
Pv_emFS5.221frameshift deletion 0/1:1/1:0/0exon30.11250.12090.12125.1240Belongs to the peroxidase family (peroxidase).
Pv_emOS173.188frameshift deletion 0/0:1/1:0/1exon40.17830.21740.2087−1.5996Encodes a plasma membrane-localized ABC transporter (ABC2_membrane).
nonframeshift deletion 0/0:0/1:0/1exon19
Pv_emOS79.1286frameshift deletion 0/0:1/1:0/0exon110.56690.66120.6122−1.3358Encodes a member of the casein kinase 1 protein family that is localized to the cytoplasm and nucleus (Pkinase).
Pv_emOS79.690nonframeshift deletion 0/0:1/1:0/1exon50.54770.60100.6185−0.8127NULL
Pv_emOS106.208frameshift deletion 0/1:1/1:0/0exon20.09390.11140.12101.4275PC-Esterase
Note: The first four genes were screened based on their functional annotations as conditions, while the last four genes were screened based on their variants and methylation levels.
Disclaimer/Publisher’s Note: The statements, opinions and data contained in all publications are solely those of the individual author(s) and contributor(s) and not of MDPI and/or the editor(s). MDPI and/or the editor(s) disclaim responsibility for any injury to people or property resulting from any ideas, methods, instructions or products referred to in the content.