Article

An Interpretable Stacked Ensemble Learning Framework for Wheat Storage Quality Prediction

1
College of Biological and Agricultural Engineering, Jilin University, Changchun 130022, China
2
Institute of Xinjiang Uygur Autonomous Region Grain and Oil Science (Grain and Oil Product Quality Supervision and Inspection Station of Xinjiang Uygur Autonomous Region), Urumqi 830000, China
*
Author to whom correspondence should be addressed.
Agriculture 2025, 15(17), 1844; https://doi.org/10.3390/agriculture15171844
Submission received: 24 July 2025 / Revised: 19 August 2025 / Accepted: 28 August 2025 / Published: 29 August 2025

Abstract

Accurate prediction of wheat storage quality is essential for ensuring storage safety and providing early warnings of quality deterioration. However, existing methods focus solely on storage environmental conditions, neglecting the spatial distribution of temperature within grain piles, lacking interpretability, and generally failing to provide reliable forecasts of future quality changes. To overcome these challenges, an interpretable prediction framework for wheat storage quality based on stacked ensemble learning is proposed. Three key features, Effective Accumulated Temperature (EAT), Cumulative High Temperature Deviation (CHTD), and Cumulative Temperature Gradient (CTG), were derived from grain temperature data to capture the spatiotemporal dynamics of the internal temperature field. These features were then input into the stacked ensemble learning model to accurately predict historical quality changes. In addition, future grain temperatures were predicted with high precision using a Graph Convolutional Network-Temporal Fusion Transformer (GCN-TFT) model. The temperature prediction results were then employed to construct features and were fed into the stacked ensemble learning model to enable future quality change prediction. Baseline experiments indicated that the stacked model significantly outperformed individual models, achieving R2 = 0.94, MAE = 0.44 mg KOH/100 g, and RMSE = 0.59 mg KOH/100 g. SHAP interpretability analysis revealed that EAT constituted the primary driver of wheat quality deterioration, followed by CHTD and CTG. Moreover, in future quality prediction experiments, the GCN-TFT model demonstrated high accuracy in 60-day grain temperature forecasts, and although the prediction accuracy of fatty acid value changes based on features derived from predicted temperatures slightly declined compared to features based on actual temperature data, it remained within an acceptable precision range, achieving an MAE of 0.28 mg KOH/100 g and an RMSE of 0.33 mg KOH/100 g. The experiments validated that the overall technical route from grain temperature prediction to quality prediction exhibited good accuracy and feasibility, providing an efficient, stable, and interpretable quality monitoring and early warning tool for grain storage management, which assists managers in making scientific decisions and interventions to ensure storage safety.

1. Introduction

In recent years, with the rapid growth of the global population, continuous economic development, and the transformation and upgrading of residents’ dietary structures, the contradiction between food supply and demand has become increasingly prominent. Meanwhile, frequent extreme weather events caused by global climate change, along with natural disasters and public health crises, have repeatedly disrupted food production and supply chains, placing food security under unprecedented strain [1,2]. In this context, ensuring the adequacy, stability, and safety of food supplies has not only become a prerequisite for achieving the United Nations Sustainable Development Goal of “Zero Hunger”, but has also emerged as a critical strategic concern for maintaining social stability and national security [3].
Grain storage serves as a crucial link between the production and consumption sectors of the food supply chain, playing a vital role in smoothing seasonal fluctuations, mitigating market and environmental risks, and preserving the quality and nutritional value of grain [4]. However, during long-term storage, grain is inevitably subjected to interactions between metabolic activity and external environmental factors. This process is accompanied by complex aging mechanisms such as moisture migration, enhanced respiration, microbial proliferation, and pest infestation. As a result, starches, proteins, and lipids undergo continuous degradation and oxidation, significantly reducing both the nutritional value and processing performance of the grain [5,6]. According to the Food and Agriculture Organization of the United Nations (FAO), global post-harvest grain losses amount to 13.2% annually, a substantial proportion of which occurs during storage [7]. Therefore, the implementation of scientific and efficient grain storage management is directly linked not only to the quantity and quality of national grain reserves but also to the ability to mitigate risks associated with grain shortages and market volatility.
As one of the world’s primary staple crops, wheat storage quality directly influences flour processing efficiency, the nutritional quality of end products, and economic returns, thereby profoundly affecting the stability of regional and global food supply chain [8]. Accurate monitoring and prediction of wheat quality changes during storage can be employed to optimize temperature and humidity control and ventilation strategies, and to provide a reliable basis for emergency response planning and risk warnings, which is of strategic importance for ensuring food security [9,10]. Numerous studies have delved into the chemical and biological mechanisms of quality deterioration in wheat during storage, confirming that declines in storage quality are closely associated with the ongoing degradation of proteins, lipids, and enzymes within the grain [11,12]. These changes are typically quantified and assessed using various physiological and biochemical indicators [13,14]. As a key parameter for evaluating grain freshness and shelf life, fatty acid value (FAV) is widely used to assess wheat storage quality [15,16,17,18]. Jiang et al. demonstrated through comparative analyses of multiple physiological and biochemical indicators that FAV is the most representative metric for evaluating wheat storage quality [19,20,21]. An increase in FAV indicates intensified lipid hydrolysis and oxidation, not only diminishing grain edibility but also potentially generating harmful peroxides and other compounds that compromise food safety.
Previous studies have demonstrated that storage temperature and relative humidity exert significant effects on wheat storage quality [22,23]. Furthermore, Zhao et al. conducted long-term storage experiments at 15 °C, 20 °C, and 30 °C, revealing the beneficial effects of low temperatures on wheat quality preservation [24]. Salman et al. reported significantly higher FAVs under 20 °C and 30 °C compared to 4 °C storage [25]. Kechkin et al. observed that when storage temperatures fell below 10 °C and relative humidity was kept under 60%, FAV increases were not significant [26]. However, most existing studies remain limited to fixed, controlled experimental conditions and therefore fail to capture the complex temperature fluctuations and spatial heterogeneity present within actual grain piles [27]. Furthermore, wheat quality deterioration is a slow and complex process, and it is challenging to continuously obtain large-scale, long-term monitoring data in real-world settings. Although artificial accelerated aging tests can partially compensate for data deficiencies, their highly controlled experimental environments are unable to authentically reflect the characteristics of quality changes under actual granary conditions. Moreover, actual internal temperature distributions and localized hotspots within grain piles cannot be adequately represented by simple environmental temperature metrics. As a primary indicator of storage processes, grain temperature directly reflects internal respiration, microbial activity and moisture migration dynamics [28].
Conventional quality assessment methods, such as chemical analyses and sensory evaluations, are labor-intensive, time-consuming, and incapable of supporting real-time monitoring. In recent years, emerging sensor technologies and machine learning approaches have offered novel solutions for predicting grain quality. For example, Jiang et al. utilized an electronic nose visualization sensor combined with an ant colony optimization–backpropagation neural network (ACO-BPNN) to monitor rice FAVs [29]. Lu et al. further integrated near-infrared spectroscopy (NIR) with electronic nose sensors to establish a BPNN-based FAV detection model [30]. However, despite promising lab-scale results, large-scale commercialization of these sensor modalities for routine grain storage monitoring has not occurred, owing to high capital and life-cycle costs (instrument acquisition, calibration and maintenance, sensor replacement) and long-term instability arising from sensor drift and dust contamination within granaries. As a result, monitoring grain temperature together with environmental temperature and humidity remains the primary approach in contemporary storage management. Chen et al. proposed a classification and regression tree (CART) approach using effective accumulated grain temperature features to predict corn quality [31]. Wang et al. applied multikernel support vector regression and effective accumulated grain temperature to predict rice FAVs [32]. However, these studies employed average grain temperature or accumulated temperature features without fully accounting for internal temperature gradients and localized hotspots within the grain piles, thus failing to reflect spatial heterogeneity and its effects on quality deterioration. Furthermore, these methods are limited to regression-based predictions of current quality and lack the capability to forecast future quality changes. To address these challenges, an interpretable stacked ensemble learning framework is proposed for wheat storage quality prediction. The main contributions of this study include:
  • Grain temperature data were introduced, and spatial dimensionality reduction was conducted to derive Effective Accumulated Temperature, Cumulative High Temperature Deviation, and Cumulative Temperature Gradient features, thus comprehensively characterizing internal temperature dynamics while avoiding the need for complex three-dimensional modeling.
  • A stacked ensemble learning approach was applied to effectively handle small sample sizes and multi-source data fusion, leveraging automated feature selection and nonlinear modeling capabilities to uncover complex data patterns, and SHAP analysis was employed to provide interpretability of feature-driving mechanisms.
  • A multi-model fusion framework was developed to integrate a high precision grain temperature forecasting model with a stacked ensemble quality prediction model, enabling advanced quantitative forecasts of wheat storage quality changes and thereby supporting storage managers in risk assessment and the formulation of intervention strategies based on the predictions.

2. Materials and Methods

2.1. Dataset

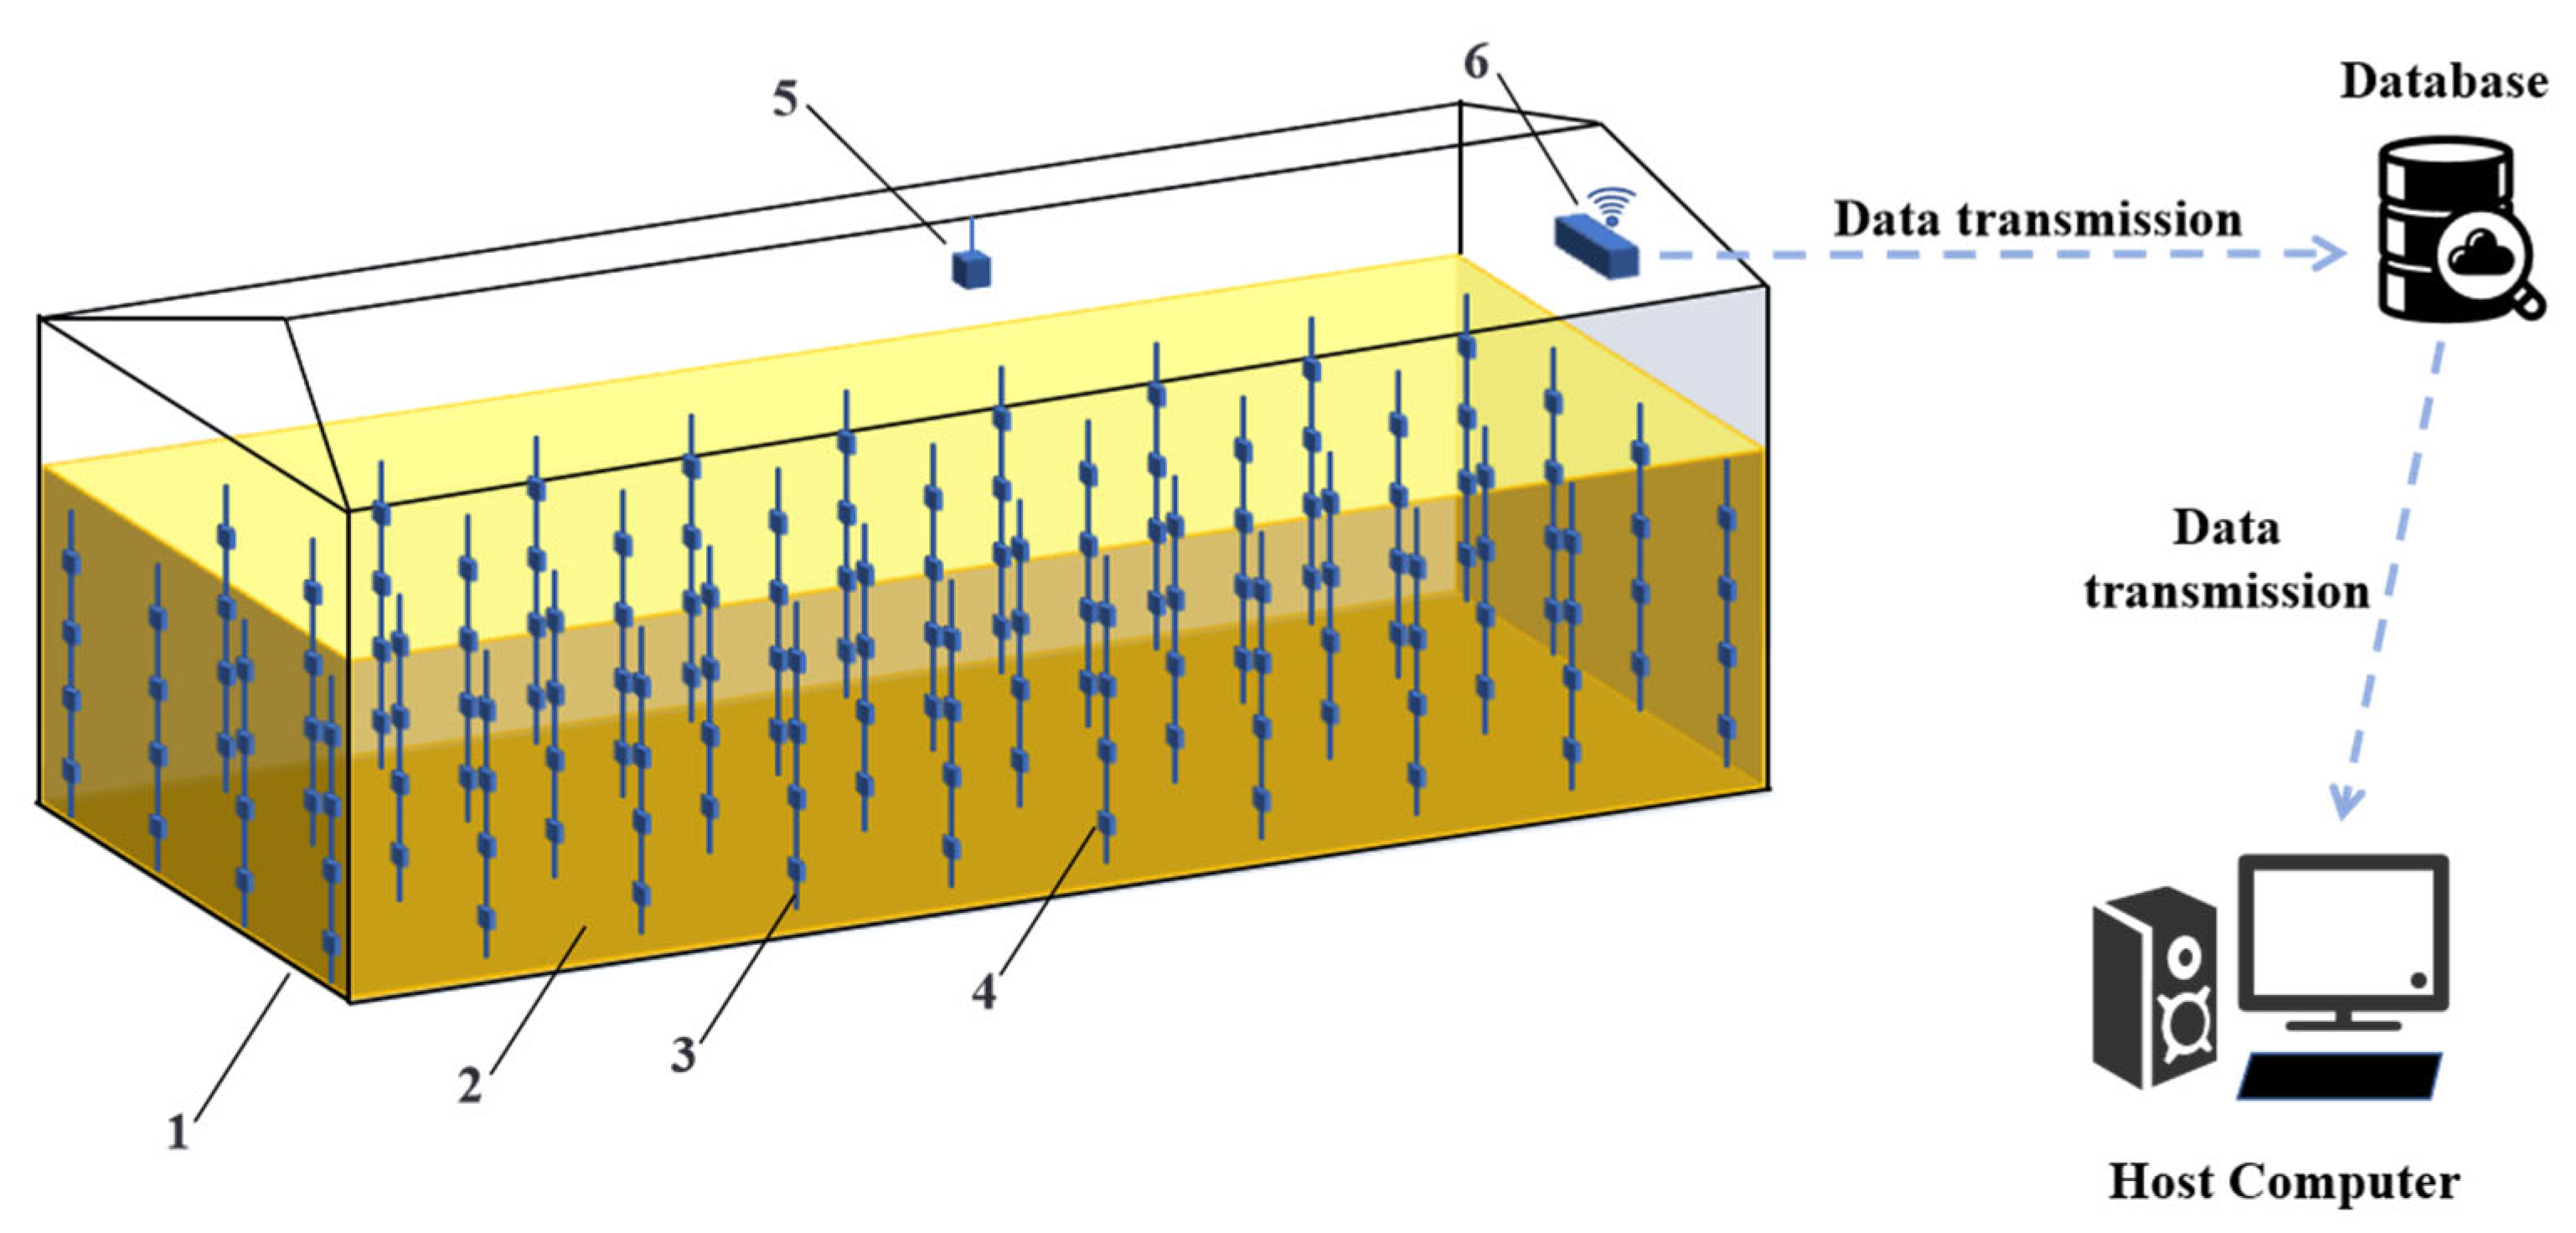
The dataset used in this study was obtained from one year of continuous grain condition monitoring and periodic quality sampling in 20 wheat storage granaries in the eastern and western regions of Xinjiang Uygur Autonomous Region, China. All granaries are flat warehouses. The on-site environment of the granaries is shown in Figure 1. All granaries are equipped with the grain condition monitoring system illustrated in Figure 2, enabling real-time measurement of grain temperature, granary internal air temperature and humidity, and external meteorological temperature and humidity. The grain condition data were recorded daily and transmitted via wired or wireless communication to a database.
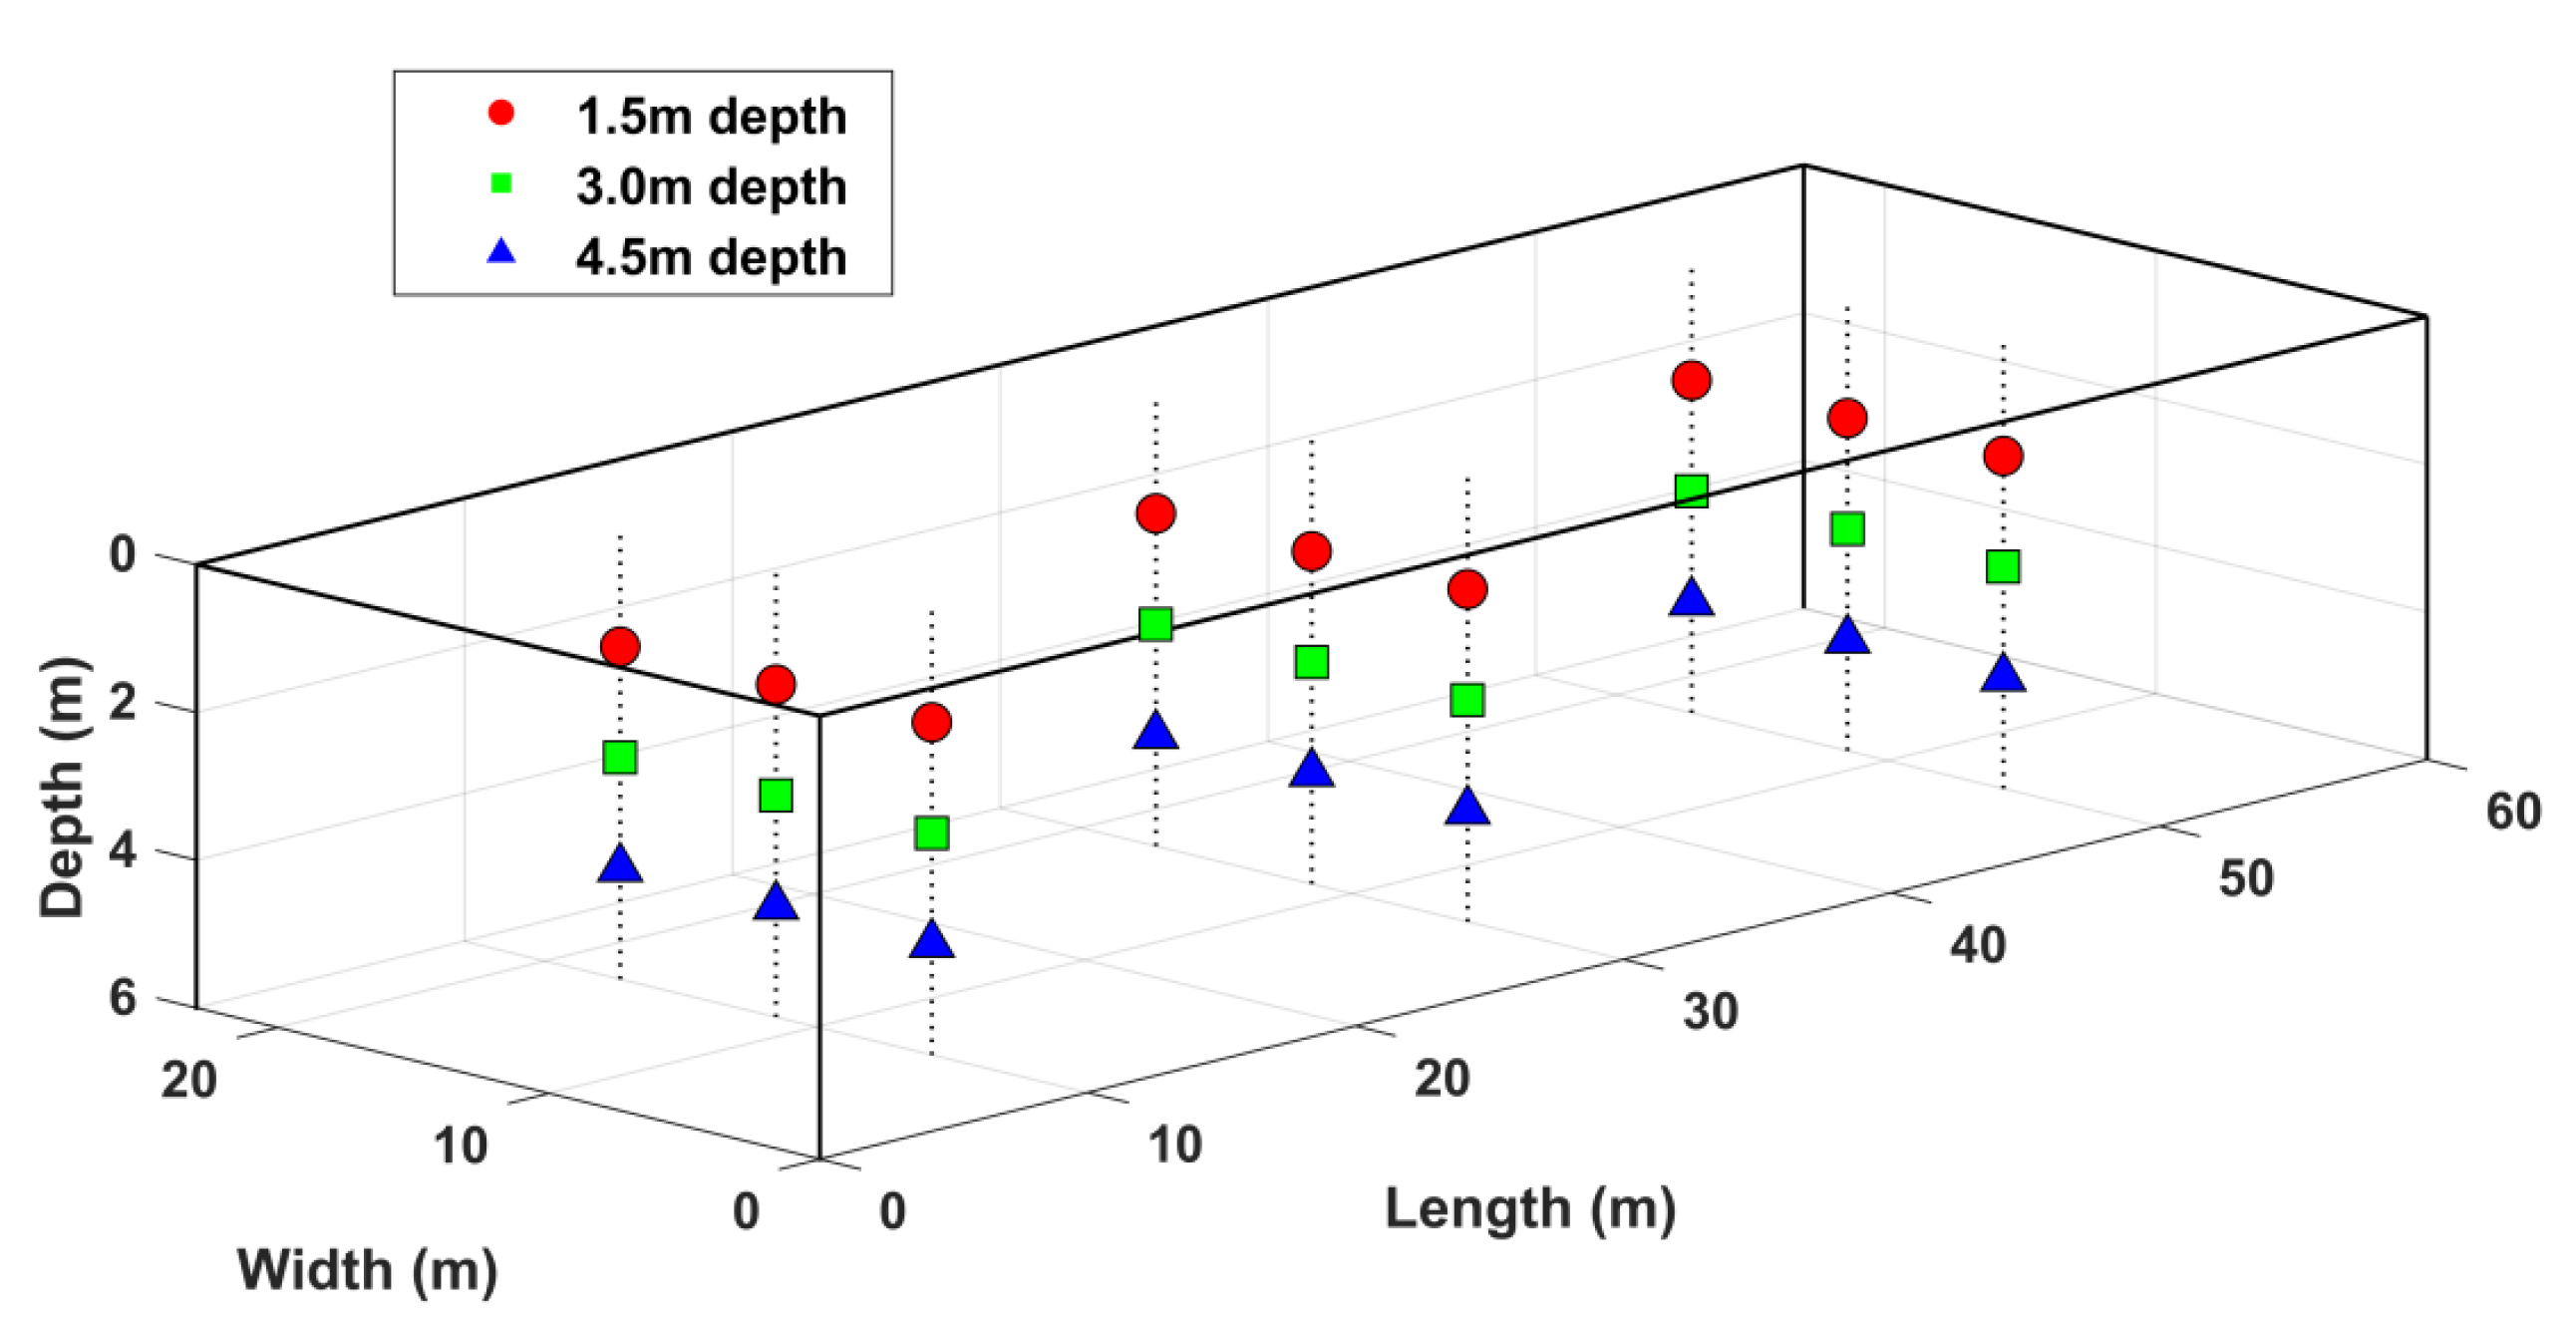
To continuously obtain wheat storage quality data, sampling was conducted every two months, with a sampling plan illustrated in Figure 3. The grain pile was divided evenly into three areas along the horizontal cross-section, with three sampling points selected within each area, resulting in a total of nine sampling points. At each sampling point, the grain pile was vertically divided into three depths, and one 250 g sample was collected from each depth using a BLA-2000 electric sampler. The samples were thoroughly mixed and then tested for the wheat FAV. The wheat FAV was determined according to the GB/T15684-2015 [33] method for determining the FAV of grain [17]. First, the wheat was ground, and the fatty acids were extracted from the wheat using anhydrous ethanol at room temperature. Subsequently, a standard potassium hydroxide solution was used for titration, and the fatty acid content was calculated based on the amount of KOH solution consumed during titration. A total of 120 wheat FAV measurements were obtained. Combined with one-year daily grain-temperature series from 20 granaries and daily internal air temperature and humidity values for the same period, these data formed the original dataset.

2.2. Data Preprocessing

Data preprocessing is a critical step in ensuring the effectiveness and generalizability of machine learning models. The preprocessing workflow used in this study is shown in Figure 4. During data collection, communication errors and occasional sensor malfunctions produced missing values and extreme outliers (e.g., 100 °C or 88 °C). Across 20 granaries over one year, each granary experienced an average of 3.4 days of full-silo data loss, totaling 68 granary-days and accounting for 0.93% of all records. At a finer scale, considering individual logger samples, 342 single-point fault alarms were detected, representing only 0.015% of the total records. In the preprocessing step, significant outliers were first cleaned using logical threshold values, followed by further removal of outliers using the Z-Score method. After data cleaning, missing data was filled using linear interpolation along the time series. To eliminate bias from varying initial acid levels, the dynamic change in FAV was used as the target variable, enabling a more accurate assessment of storage condition effects on wheat quality. Given the scarcity of quality measurement data, a time interval-based sampling strategy was proposed to maximize the utility of available samples. Each granary underwent bi-monthly quality assays at months 2, 4, 6, 8, 10, and 12. For each granary, all earlier-later assay pairs were formed while preserving temporal order. For every pair, the daily sequences of grain temperature, internal air temperature, and relative humidity between the two assay dates were used as inputs, and the target variable was the net change in FAV between the two assays. With six FAV measurements per granary, this design produced 15 intervals spanning 2 to 10 months, yielding 300 samples across 20 granaries. Interval-based pairing transformed sparse laboratory assays into interval-level observations precisely aligned with their exposure histories. This approach increased the effective sample size and enabled the model to learn cumulative effects across varying durations. By spanning multiple timescales, the intervals captured both short-term fluctuations and long-term accumulations, thereby improving data efficiency under label scarcity.
To address the limited sample size and improve data diversity, Generative Adversarial Networks (GANs) were employed, using the TimeGAN model specifically designed for time series data to perform data augmentation. TimeGAN combines the adversarial training mechanism of GANs with the encoding-decoding structure of autoencoders, enabling the generation of time series data highly similar to real data while preserving the temporal dependencies of the data [34]. The TimeGAN model was trained using the original time series data. During training, the generator receives random noise input from the latent space and generates time series data that closely resembles real data, while the discriminator is responsible for distinguishing between generated and real data. Adversarial training continuously optimizes both the generator and the discriminator, and the resulting synthetic data closely match real data in fluctuation trends, distribution characteristics, and temporal dependencies. In developing the synthetic data, it was assumed that the generated data retains the same seasonal variation trend and similar variation speed as the real data within the same storage season and interval length, does not exceed the reasonable range of the real data, and maintains the typical connections among variables. To further expand the dataset, new synthetic data was generated on the original dataset, and the synthetic data was combined with the original data to create an augmented dataset containing 900 samples. These synthetic samples are not only consistent with real data in terms of statistical distribution and time series characteristics but also simulate different grain storage environments, thereby enhancing the robustness of the model.

2.3. Feature Construction

Feature construction is a critical step in this study for predicting wheat storage quality in this study, aiming to extract meaningful features from the raw time series data to provide effective input for subsequent model training. For grain temperature, daily data were collected from a temperature sensor array arranged in a three-dimensional matrix within the grain pile, which recorded the spatial distribution of the temperature field inside the pile. Because directly processing these three-dimensional grain temperature matrices is computationally expensive and the quality assays reflect granary-level conditions, spatial dimensionality reduction was first applied to the daily grain temperature data. The daily average grain temperature T ¯ i was then calculated using Equation (1), followed by the calculation of the mean grain temperature Tmg for each sample’s time interval using Equation (2). Given that the variation in FAV during wheat storage is primarily driven by the long-term cumulative effects of factors such as temperature and humidity [31,32], the effective accumulated temperature (EAT) for each sample’s time interval was further calculated using Equation (3) [31]. The formulas are as follows:
T i ¯ = 1 R × C × L r = 1 R c = 1 C l = 1 L T ( r , c , l ) i
T m g = 1 n i 1 n T ¯ i
EAT = i = 1 n max ( 0 , T m g i T b )
where T(r,c,l) denotes temperature at the sensor located in row r, column c, and vertical layer l; R, C, and L represent the number of rows, columns, and layers, respectively; n denotes the length of the time series interval for each sample; Tb is the baseline temperature, set at Tb = 0 °C.
Based on the results of Equation (1), the cumulative high temperature deviation (CHTD) feature was constructed by summing the daily difference between the maximum grain temperature within the grain pile and the daily average grain temperature for each sample’s time interval. This feature helps identify local hotspots within the grain pile, which may serve as risk signals for FAV increase. The formula is as follows:
CHTD = i = 1 n max ( T ( r , c , l ) i ) T ¯ i
During seasonal transitions, external temperatures drop sharply while residual heat from summer continues to transfer into the grain pile. Due to the low thermal diffusivity of grains and their thermal resistance, internal temperatures lag in response to external temperature changes. This results in a vertical temperature gradient where the surface cools rapidly while the core remains warm, exhibiting a “cold skin, hot core” state. The temperature gradient is the primary factor causing the formation of micro-airflows. Affected by the micro-airflows, heat transfer occurs most rapidly in the upward vertical direction and slowest in the downward vertical direction. The heat and moisture from the hot core region of the grain migrate to the surface’s lower temperature area through micro-airflows. The temperature gradient drives the micro-airflows, transporting moisture from the core region to the surface’s lower temperature area, creating condensation risks and even moisture consolidation, which severely affects grain quality [35]. Based on the above mechanism, the Cumulative Temperature Gradient (CTG) was constructed to quantify the vertical temperature gradient and its associated condensation risks were quantified. With respect to the condensation risk threshold, prior studies indicate that under mechanical aeration at a grain moisture of approximately 12%, a difference between air temperature and grain temperature exceeding about 8 °C is associated with condensation risk [36]. In addition, the Chinese grain storage industry standard LS/T1206-2005 [37] explicitly stipulates that, to prevent condensation, air warmer than the grain should not be introduced into the bin. Within the typical “cold shell, warm core” thermal structure within the grain pile, the temperature in the hot core zone of the grain pile approximates the local micro airflow temperature. When this upward airflow contacts the colder upper grain layers, the resulting temperature difference is equivalent to the difference between air temperature and grain temperature and can therefore trigger condensation risk [38]. Guided by these sources and prevailing industry practice, and incorporating safety margins and empirical thresholds reported by storage enterprises, the vertical temperature-gradient risk threshold Td was set to 8 °C to flag elevated condensation risk. First, the average temperature of each sensor layer within the grain pile was calculated daily using Equation (5). Next, the temperature difference between adjacent layers was computed, retaining only the differences exceeding a predefined risk threshold as valid gradients. All valid gradients were accumulated within the sample’s time interval to form the CTG using Equation (6). Through this process, the CTG reflects the accumulation of temperature differences exceeding the risk threshold, thereby capturing the spatial temperature distribution within the grain pile and the potential impact of condensation risks on quality degradation. The formulas are as follows:
T ¯ l i = 1 R × C r = 1 R c = 1 C T ( r , c , l ) i
CTG = i = 1 n l = 1 L 1 max ( 0 , T ¯ l + 1 i T ¯ l i T d )
where T ¯ l denotes the mean temperature of each layer. Td is the risk threshold temperature, set at Td = 8 °C.
Air temperature and humidity are crucial environmental factors affecting grain storage quality. The average air temperature Tma and the average air humidity Hma within the granary for each sample’s time interval were constructed using Equations (7) and (8). Furthermore, based on these measures, the Cumulative Degradation Index (CDI) was constructed using Equation (9) to capture the impact of sporadic high temperature and humidity on quality degradation. The CDI accumulates positive deviations that exceed the safety threshold each day, retaining the potential driving effect of extreme environmental events while effectively reducing model complexity and overfitting risks. The formulas are as follows:
T m a = 1 n i = 1 n T a i
H m a = 1 n i = 1 n H a i
CDI = i = 1 n max ( 0 , T a i T f ) + i = 1 n max ( 0 , H a i H f )
where Tai denotes the granary internal air temperature; Tf is the critical temperature, the safe temperature threshold during wheat storage, set at 10 °C [26]; Hai denotes the granary internal air humidity; Hf is the critical humidity, the safe humidity threshold during wheat storage, set at 60% [26].

2.4. Feature Selection

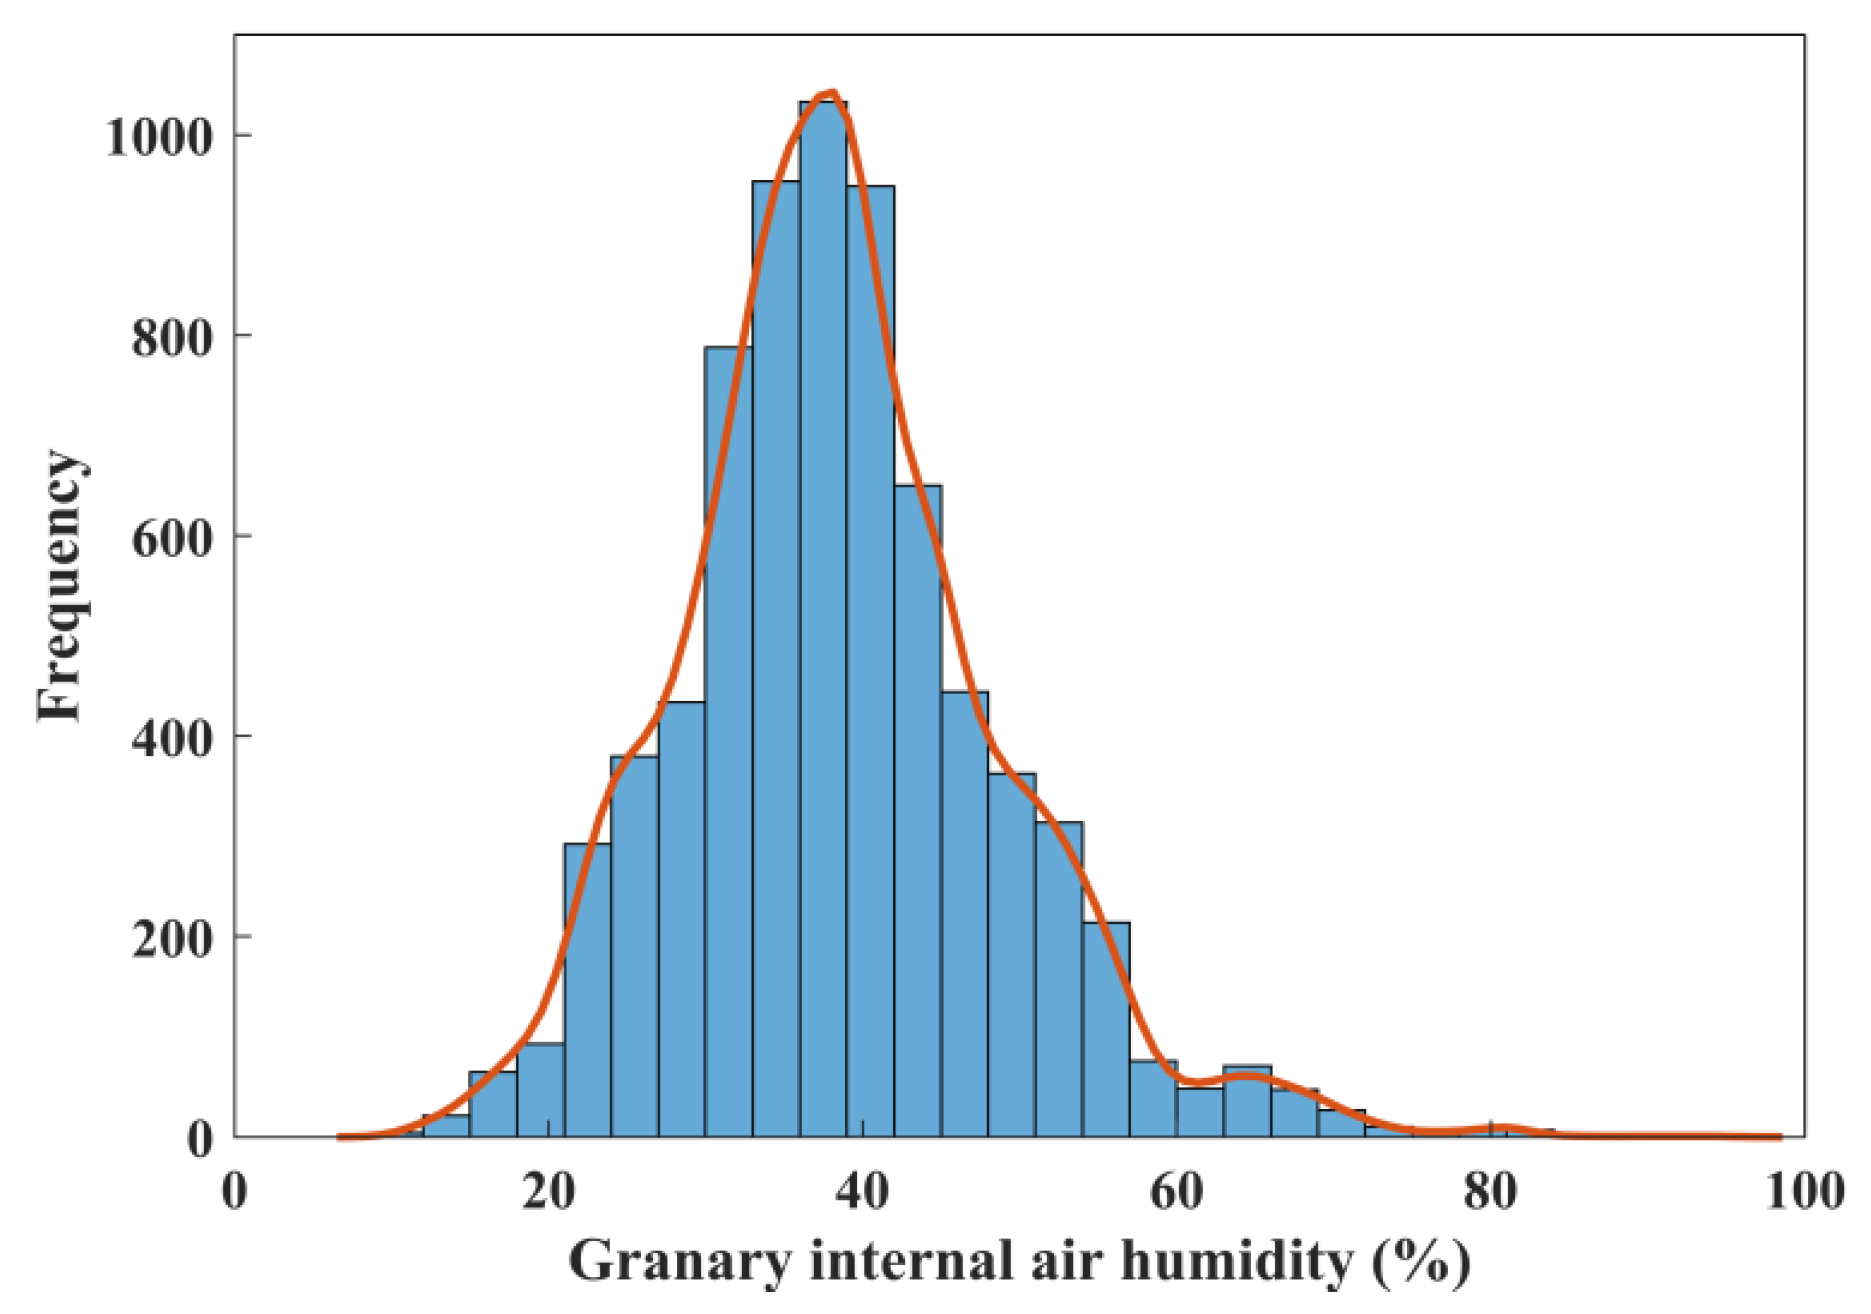
To ensure the efficiency and minimal redundancy of input features, Pearson correlation coefficients R were calculated among the seven constructed features and between each feature and the target variable, based on which feature selection was performed. The Pearson correlation heat map is shown in Figure 5. All seven features correlated with FAV changes (ΔFAV). EAT showed the highest correlation, indicating that accumulated grain temperature is a primary driver of FAV changes. However, the features displayed substantial collinearity. Specifically, EAT correlated with Tmg at R = 0.93, CDI with Tma at R = 0.90, and EAT with Tma at R = 0.80. Because EAT demonstrated the strongest association with FAV changes, it was retained. Tmg and Tma were removed due to high collinearity with EAT and slightly lower correlations with the target. Although CDI remained correlated with ΔFAV, its strong correlation with EAT (R = 0.77) and the fact that granary internal air humidity exceeds 60% for only 11 days per year on average indicate that CDI provides little unique information. To avoid redundancy and potential noise while preserving model stability and interpretability, CDI was excluded. Considering that air humidity is generally regarded as an important factor affecting grain quality, Hma was given a targeted assessment. The dataset was collected from 20 granaries in the eastern and western regions of Xinjiang, China, both of which are located in a continental arid climate region. Daily granary internal air humidity was measured by the grain condition monitoring system installed in each granary and was automatically uploaded to the database (schematic in Figure 2). Statistics results for granary internal air humidity are shown in Figure 6. Humidity was persistently low, with a mean of 37.7%. Only brief periods exceeded 60%, averaging about 11 days per granary per year. Correlation analysis showed a weak negative correlation between Hma and ΔFAV(R = −0.28), which contrasts with mechanisms typically observed under high-humidity conditions. Hma also exhibited moderate negative correlations with other temperature-related features: R = −0.43 with Tmg and R = −0.42 with Tma. After adjusting for temperature-related features, the partial correlation between Hma and ΔFAV was small and positive (R = 0.18), implying at most a weak independent effect of Hma under low-humidity conditions, while the dominant pathway remains indirect via temperature. Slight increases in humidity were typically accompanied by reductions in thermal load, which in turn suppressed ΔFAV growth. Taken together, these results indicate that under persistently low humidity, Hma is not a principal independent driver of ΔFAV. Moreover, Hma showed weak temporal continuity and periodicity, limiting the utility of forecasting future humidity and its application to predictive early warning of quality deterioration. Previous studies have also reported that accumulated grain temperature alone can effectively predict FAV changes, even without explicit humidity input [31,32]. Based on these statistical and mechanistic considerations, Hma was excluded. Ultimately, EAT, CHTD, and CTG were retained as key features because each correlated sufficiently with the target and complemented the others. These three features capture the main drivers of wheat quality deterioration, reduce model complexity and overfitting risk, and provide a solid foundation for precise predictive model development.

2.5. Stacked Ensemble Learning Model

Stacked ensemble learning is recognized as an efficient method for combining models. Predictive accuracy and generalization performance are enhanced by integrating the predictions of multiple base learners and employing a meta-learner. This approach overcomes poor stability and the tendency of single models to become trapped in local optima [39]. First, multiple diverse models are trained at the base layer to capture distinct data characteristics and patterns. The outputs of the base learners are then used as meta-features and fed into the meta-learner. By learning the relationship between base model outputs and the true targets, the optimal combination strategy is derived, thereby achieving ensemble prediction.
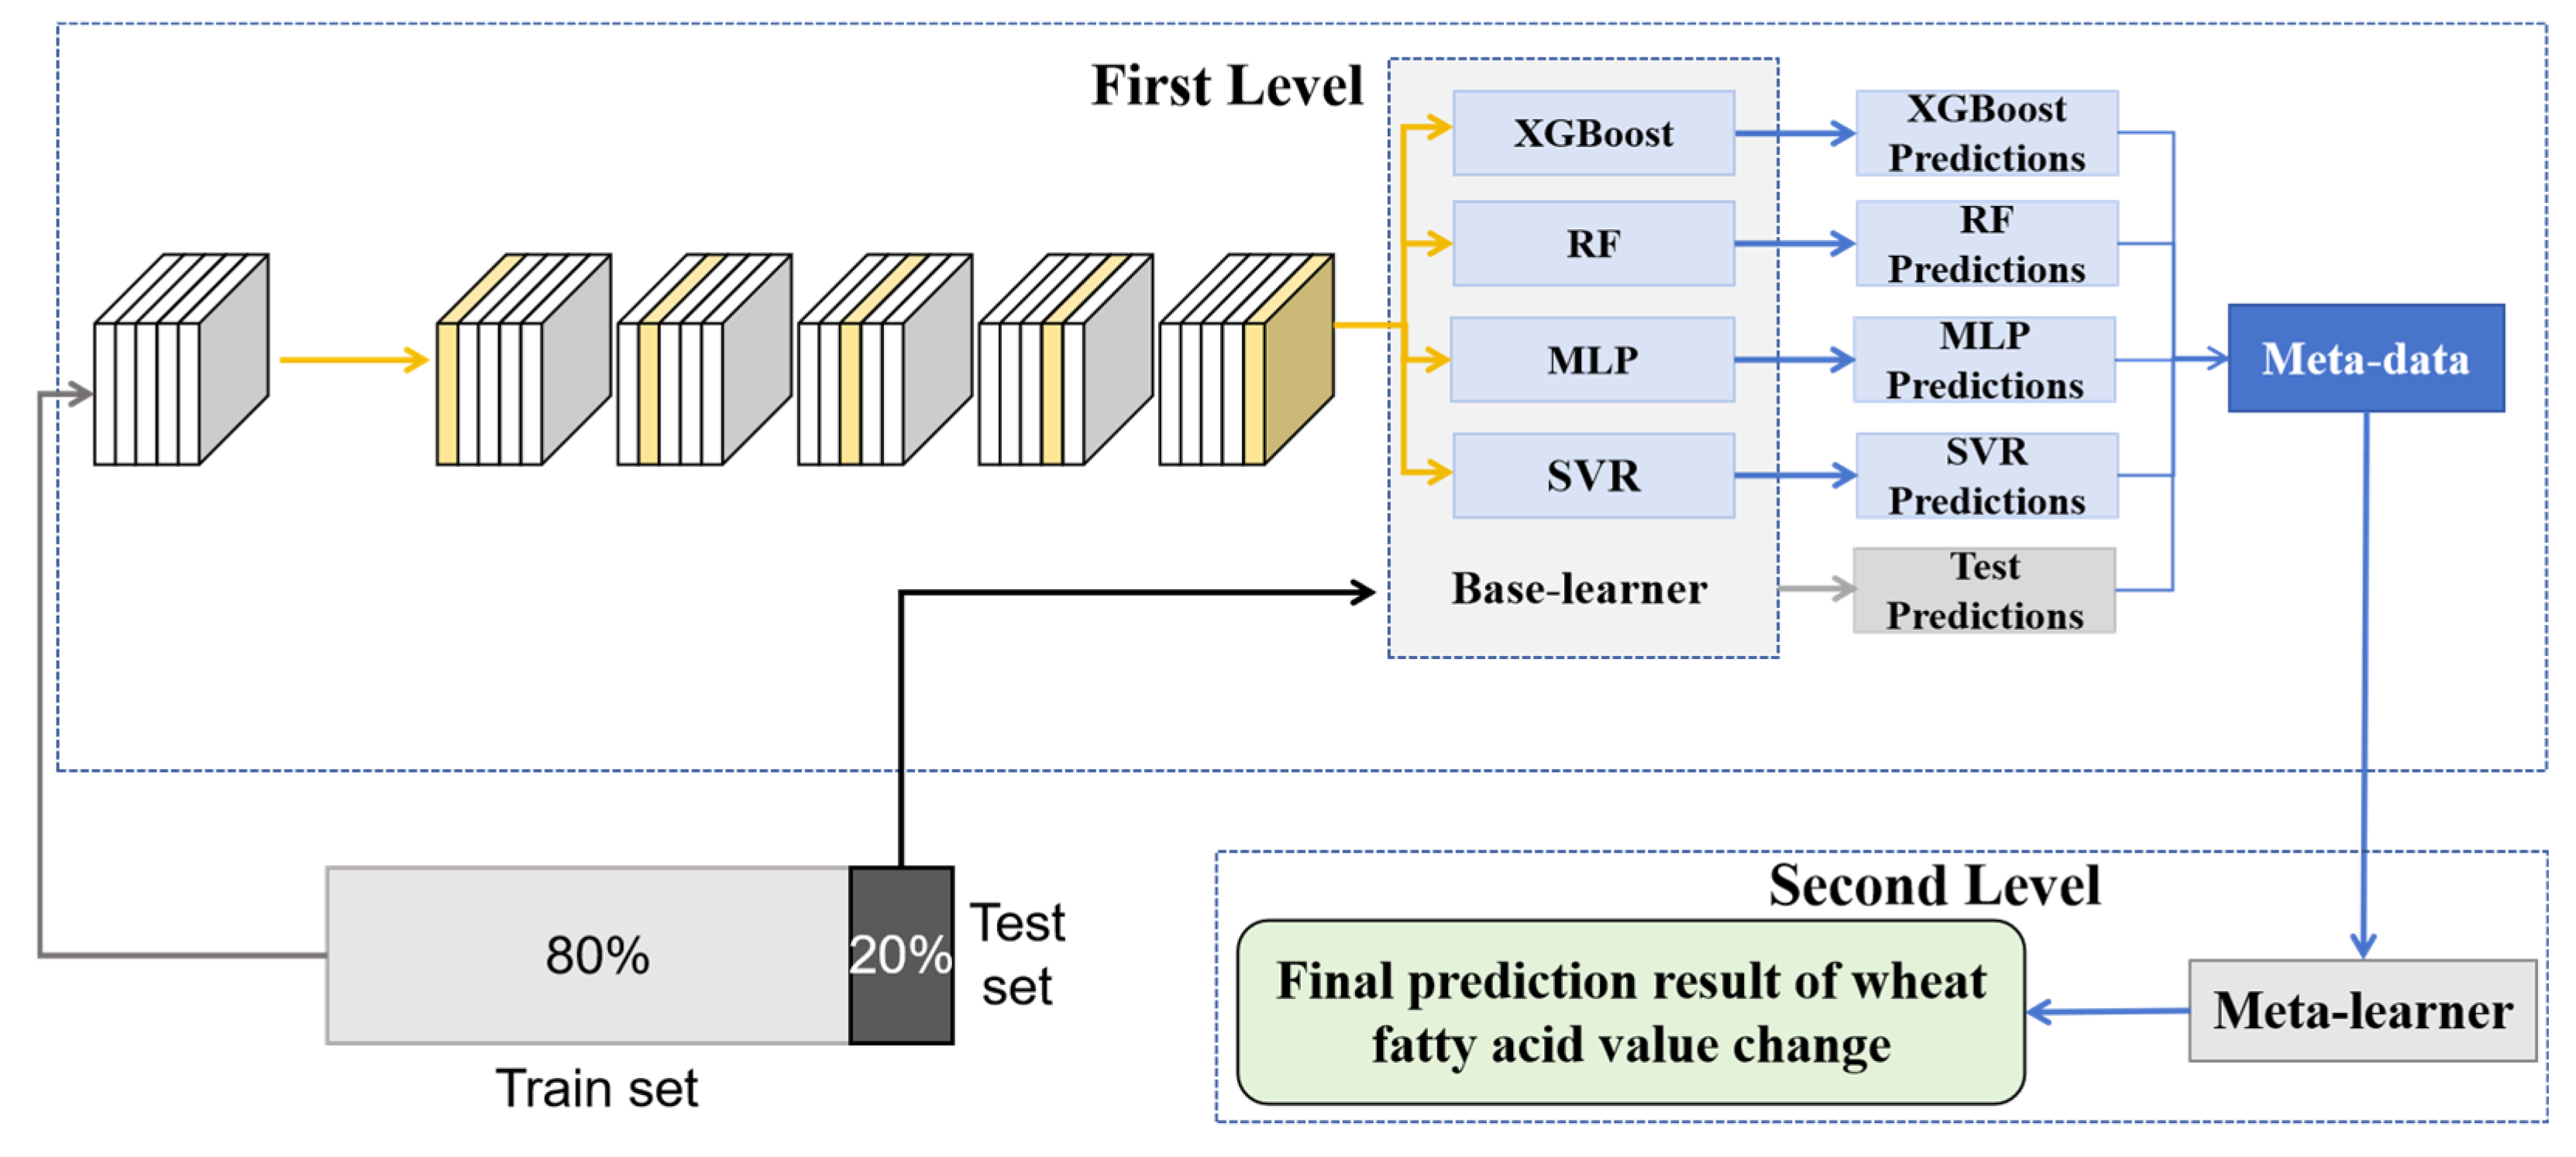
Figure 7 depicts the architecture of the stacked ensemble learning model proposed in this study. The framework comprises two layers. The first layer consists of four diverse base learners selected to ensure diversity and complementarity: support vector regression (SVR), random forest (RF), XGBoost, and a shallow multilayer perceptron (MLP). The SVR model is based on kernel functions and effectively captures nonlinear relationships and demonstrates strong generalization performance under small-sample conditions [40]. RF is a bagging-based decision tree ensemble method that reduces model variance through bootstrap sampling and a multi-tree voting mechanism, exhibiting strong robustness to data noise and outliers [41]. XGBoost is a representative boosting algorithm that sequentially constructs decision trees to iteratively correct residuals of preceding models. It automatically captures high-order nonlinear relationships among features and its built-in regularization and subsampling strategies prevent overfitting [42]. Given that the data are structured in tabular form with low feature dimensionality, a shallow MLP was introduced as an effective supplement. By appropriately limiting network depth and incorporating L2 regularization and dropout, it enhances the ability to capture nonlinear relationships and prevents overfitting due to excessive model complexity [43,44]. The second layer is the meta-learner layer responsible for weighting and combining base learner outputs. This process corrects individual model biases and improves the precision of ensemble predictions. Ridge regression was chosen as the meta-learner for this study. Compared to complex nonlinear meta-models, the linear meta-learner not only incurs lower computational complexity and effectively guards against overfitting, but also yields clearly interpretable model weights, facilitating the evaluation of each base learner’s contribution to the final predictions [45]. Furthermore, the L2 regularization term in ridge regression also effectively mitigates multicollinearity among the predictions of the base learners [46].
To ensure the stacked ensemble model’s robustness, a rigorous data splitting and training procedure was employed. First, the dataset was randomly split into training and test sets in an 8:2 ratio. During the training phase, five-fold cross validation was applied to the training set to prevent meta-learner overfitting. In each fold, four partitions were used simultaneously to train all base learners, and predictions were generated on the remaining partition. This process was repeated across all folds to obtain base learner outputs for all training samples, forming the meta-feature dataset used to train the meta-learner. During the prediction phase, the test set data were processed in parallel by all trained base learners to generate individual predictions. These predictions were assembled into feature vectors and input into the meta-learner, which performed a weighted combination to produce the final wheat FAV variation predictions.

2.6. Future Wheat Storage Quality Prediction Method Based on Multi-Model Fusion

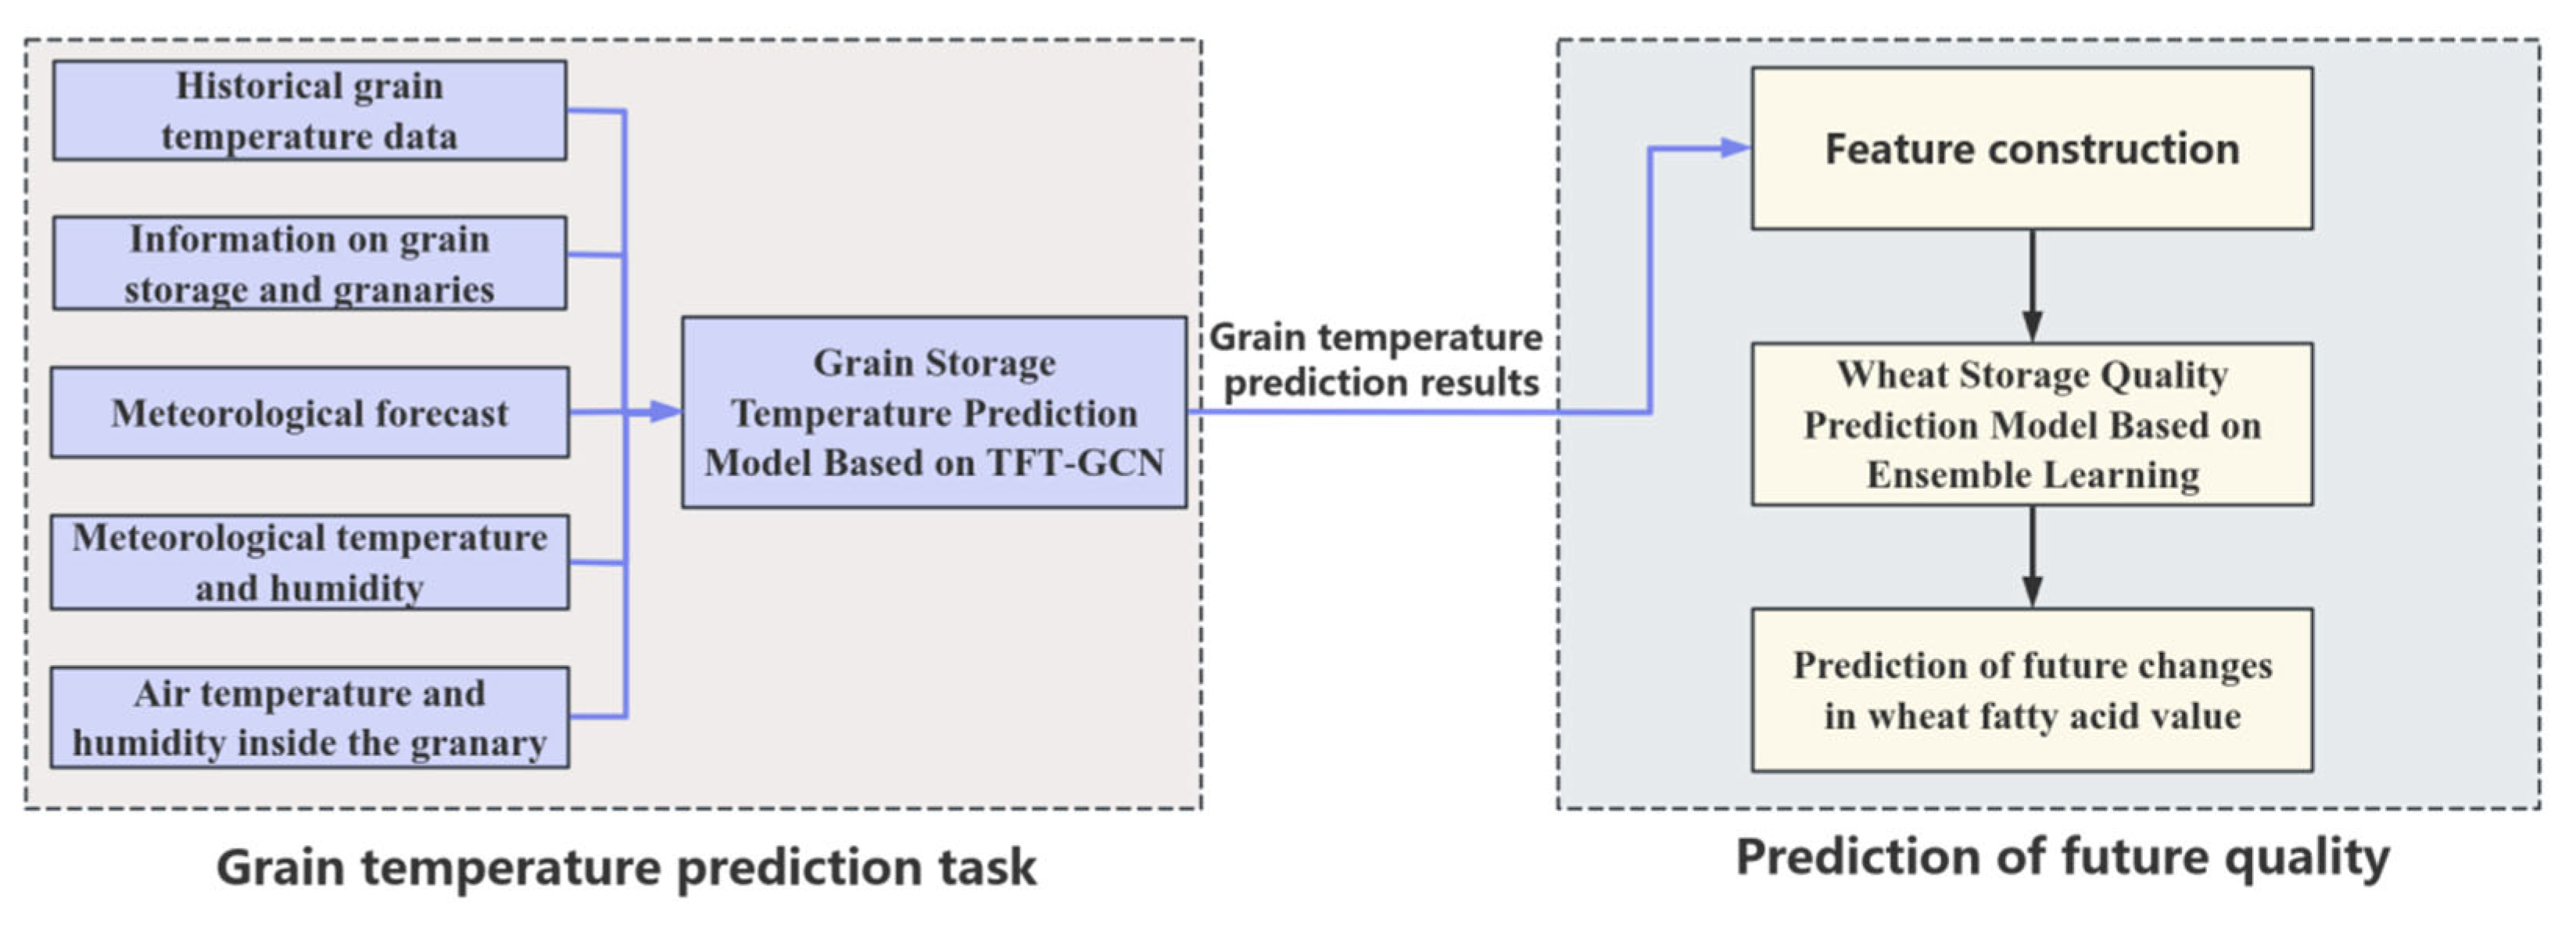
To address the limitations of existing wheat storage quality prediction methods in forecasting future trends and providing early warnings, a multi-model fusion framework was developed, as shown in Figure 8. First, the previously developed high-precision grain temperature prediction model was employed to forecast grain temperature sequences for the next 30 days [47]. This model integrates a graph convolutional network (GCN) module into the Temporal Fusion Transformer (TFT) to capture spatial dependencies across sensor locations within the grain pile and temporal dynamics. Model inputs comprise historical daily grain temperature data, granary internal air temperature and humidity data, meteorological temperature and humidity data, statistical attributes such as granary type, grain variety, and initial moisture content, and future meteorological forecast data at the granary location to ensure sufficient awareness of upcoming environmental changes. Subsequently, the forecasted grain temperature sequences were converted into key features (EAT, CHTD, CTG) through a feature construction process and input into the stacked ensemble learning model to predict wheat FAV changes. This process enables a seamless transition from grain temperature forecasting to quality change prediction, providing reliable technical support for early warning of quality deterioration during wheat storage.

2.7. Evaluation Metrics

In this study, three evaluation metrics were utilized to assess model predictive accuracy: the coefficient of determination (R2), mean absolute error (MAE), and root mean squared error (RMSE) [48]. In regression analysis, R2 is commonly used to estimate the proportion of variance in the dependent variable that can be explained by the independent variables. Both MAE and RMSE are widely applied to evaluate the performance of deep learning in prediction tasks. The formulas are as follows:
R 2 = 1 j = 1 K ( Y ^ j Y j ) 2 j = 1 K ( Y ^ j Y ¯ ) 2
MAE = 1 K j = 1 K Y ^ j Y j
RMSE = j = 1 K ( Y ^ j Y j ) 2 K
where K represents the number of output samples; Y ¯ represents the arithmetic mean of all samples; Yj represents the actual grain temperature value of each sample; Y ^ j represents the predicted grain temperature value of each sample.

3. Results and Discussion

3.1. Data Statistical Description

To identify the basic distribution patterns of the data variables in the dataset and provide support for subsequent feature construction, statistical analysis was performed on the dataset. Key statistical indicators, including mean, standard deviation, maximum value, and minimum value for grain temperature, air temperature and humidity within the granaries, were calculated, with the results summarized in Table 1. Results show that grain temperature ranged from −23.8 °C to 36.9 °C. The mean was 10.7 °C. Granary internal air temperature followed a similar trend, varying between −21.9 °C and 37.5 °C with a mean of 13.1 °C. The occurrence of extreme high temperature conditions also promoted a rapid increase in the wheat’s FAV. Additionally, significant temperature fluctuations throughout the year created potential risks of condensation by forming a temperature gradient within the grain pile. The air humidity within the granaries exhibited a distinctly low and stable characteristic, with an average humidity of only 37.7%, a standard deviation of 10.5%, a minimum value of 11.3%, and a maximum value of 93.8%. Further data analysis revealed that the air humidity within each granary exceeded 60% on average for only about 11 days throughout the year, with the overall data distribution clearly concentrated in the lower humidity range.

3.2. Hyperparameter Optimization

To further enhance the predictive performance of the base learners within the stacked ensemble model, a systematic grid search of hyperparameters was performed for all base learners [49]. First, the search space for each algorithm was predefined according to its characteristics. Subsequently, a grid search was employed to exhaustively enumerate all possible hyperparameter combinations, and cross-validation was used to evaluate each configuration’s performance, thereby objectively comparing predictive outcomes across different settings. Ultimately, the optimal hyperparameter configuration was used to train each base learner of the stacked model, ensuring optimal overall model performance and providing more representative outputs for the subsequent meta-learner. This tuning process significantly improved the fitting capacity and generalization performance of the base models, thereby enhancing the accuracy and stability of the entire stacked ensemble prediction framework. The parameter search ranges and final optimal configurations for each base learner are presented in Table 2.

3.3. Comparison of Model Performance

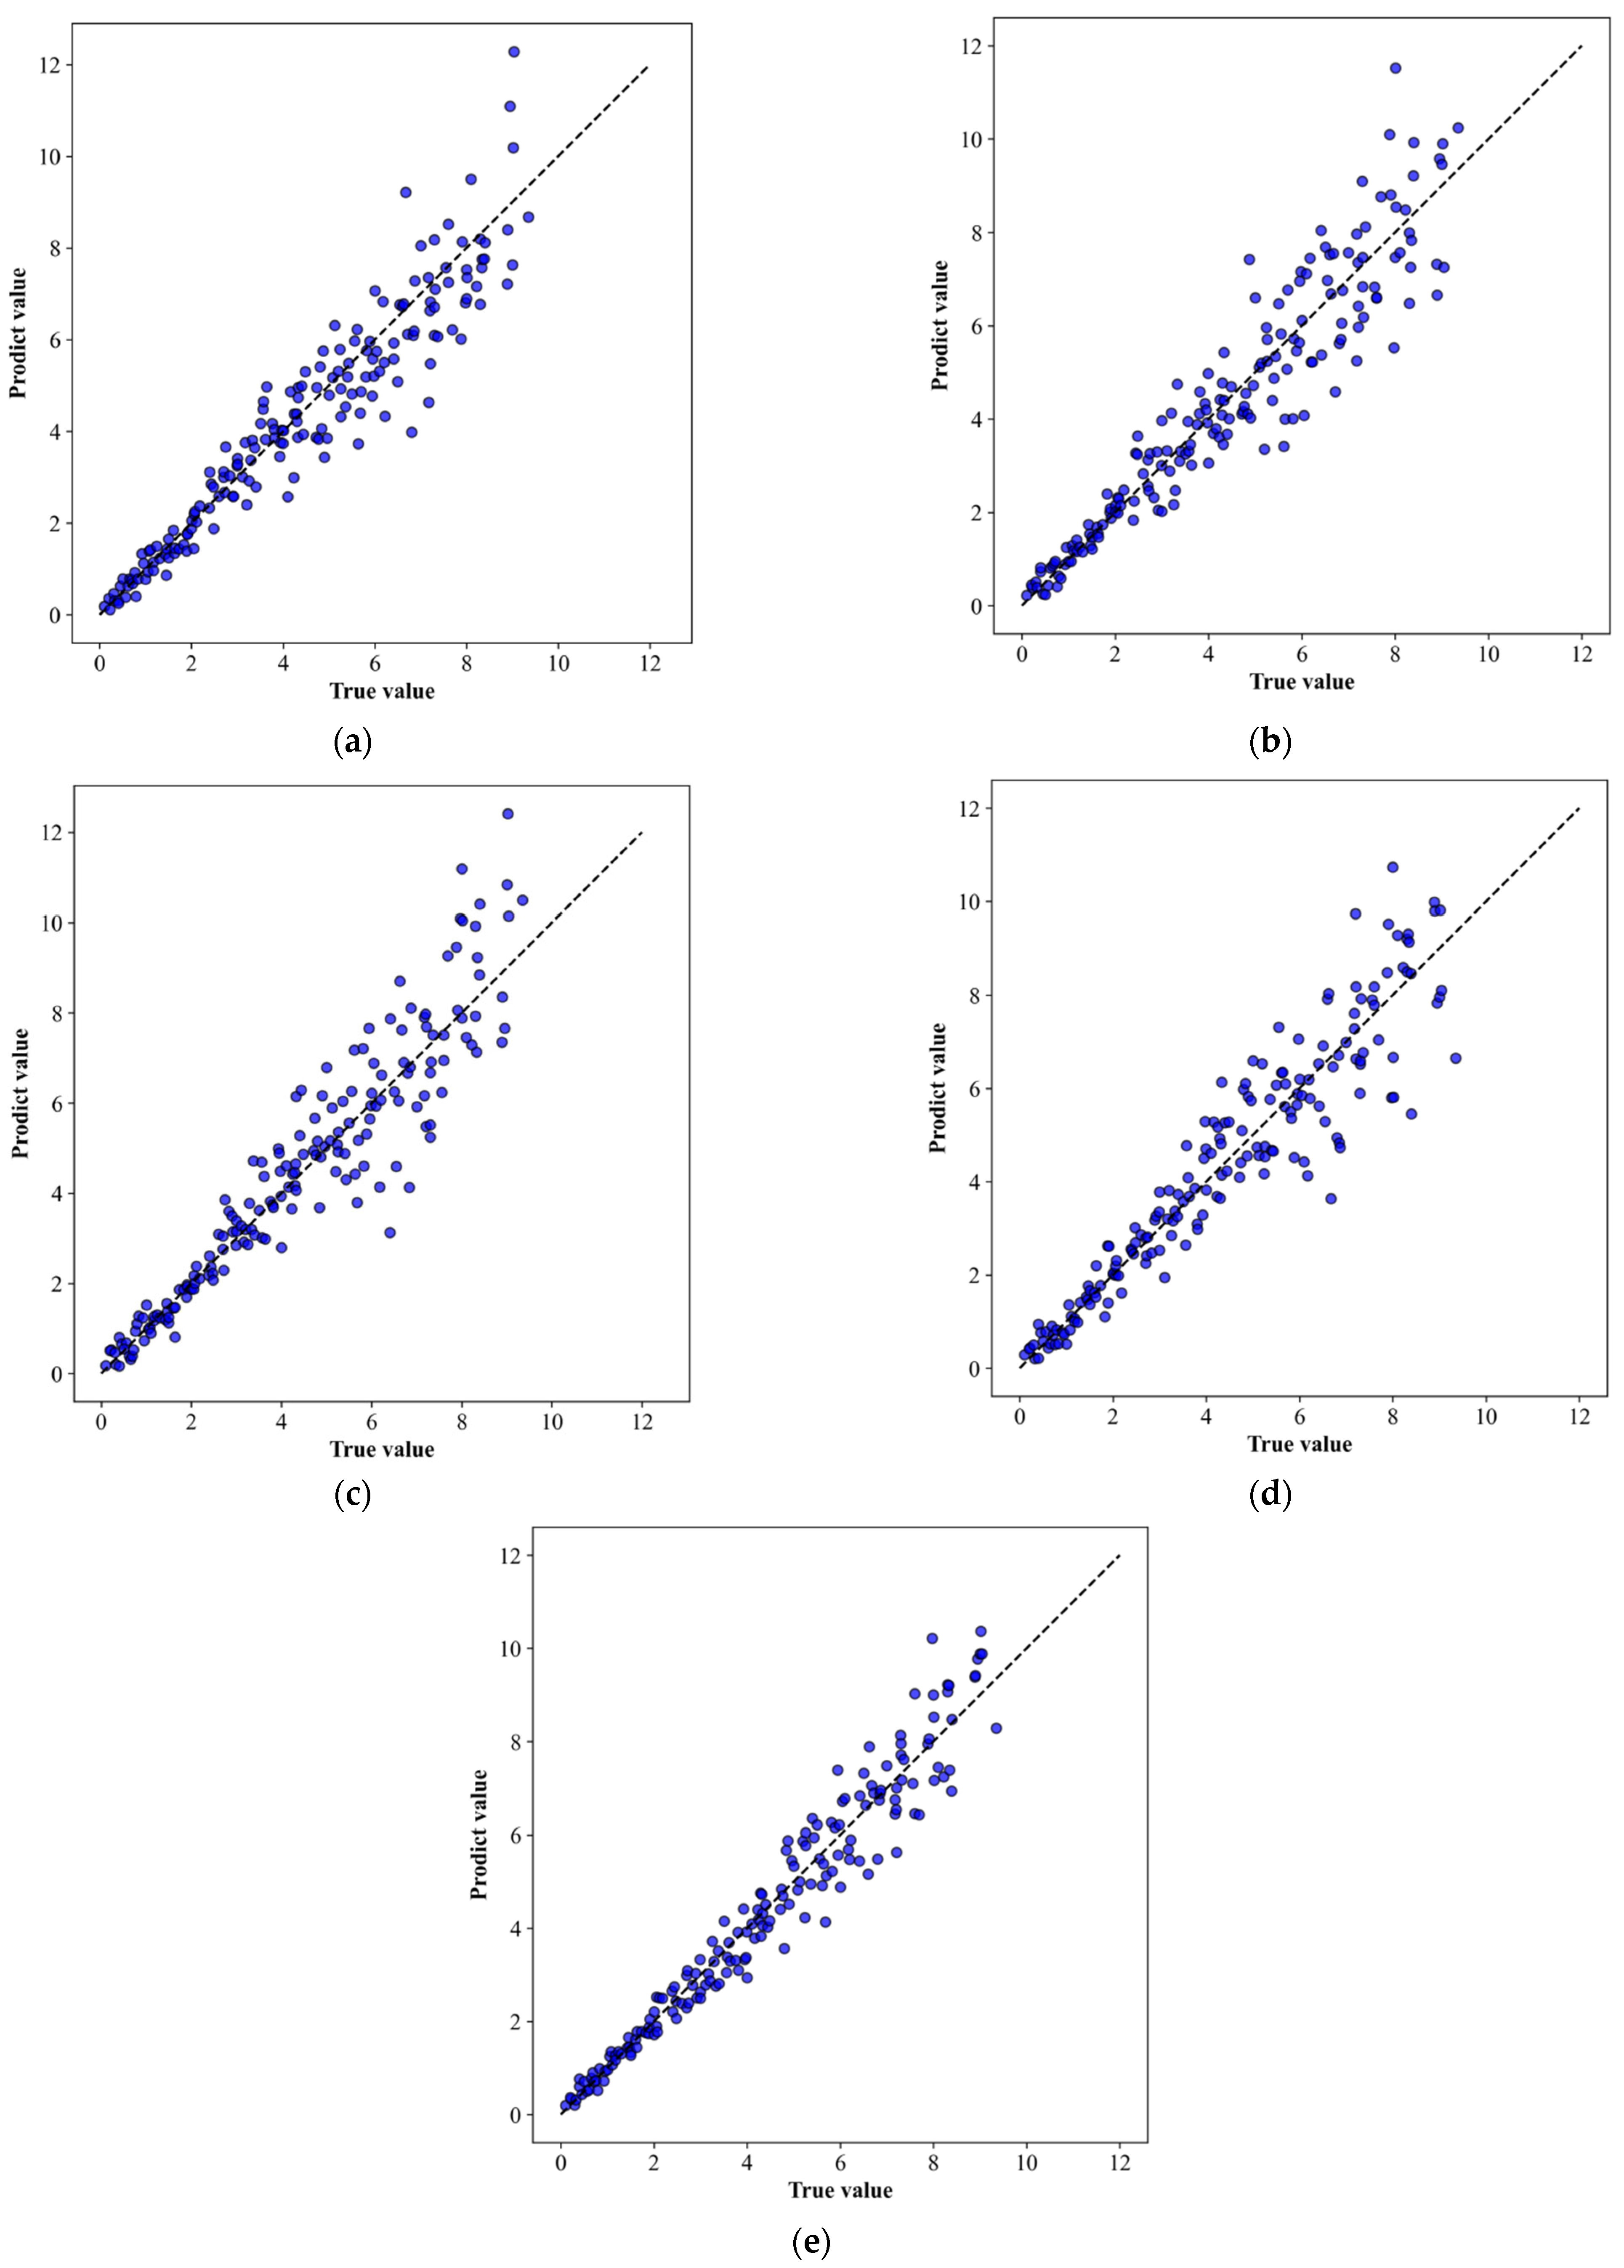
To rigorously evaluate the performance of the proposed model, a comparison experiment was conducted to assess the performance of individual base learners and the stacked ensemble model on the test set. Table 3 summarizes the evaluation metrics for each model on the test set, and Figure 9 shows a scatter plot of predicted versus actual values to visually demonstrate the model fit. The results indicate that, among all base learners, XGBoost exhibits the highest performance, achieving an R2 of 0.90, MAE of 0.57 mg KOH/100 g, and RMSE of 0.81 mg KOH/100 g. RF also demonstrates excellent performance, followed sequentially by SVR and MLP. The stacked ensemble model outperforms all individual models, with an R2 of 0.94, MAE of 0.44 mg KOH/100 g, RMSE of 0.59 mg KOH/100 g, and a prediction error range of −1.6 to 2.2 mg KOH/100 g. Compared with individual models, the stacking strategy reduces the MAE and RMSE by approximately 29% and 33% on average and increases R2 by about 7%, fully demonstrating the efficacy of the stacked ensemble learning approach in leveraging the strengths of multiple models, significantly reducing bias and variance, and enhancing model generalization ability. In Figure 9e, most of the stacked model’s predicted points are closely clustered around the identity line, further validating its superior fit and stability. These comparative experimental results highlight the robustness and high accuracy of the stacked ensemble learning framework in wheat storage quality prediction tasks, providing reliable technical support for early identification of quality deterioration and scientific warnings in practical applications.

3.4. Interpretability Analysis

To facilitate a clear understanding of the key drivers underlying the model’s predictions of wheat FAV changes during storage for granary managers, the SHAP (Shapley Additive Explanations) method was introduced to perform both global and local analyses on the XGBoost model, which achieved the best-performing base learner among the four single models in the baseline experiments. SHAP [50] is based on the Shapley value from game theory, quantifies each feature’s contribution to an individual prediction, and evaluates feature importance at the global level using the mean absolute SHAP value. As shown in Figure 10, the mean absolute SHAP values were 1.47 for EAT, 0.61 for CHTD and 0.14 for CTG. This indicates that EAT plays a dominant role in predicting FAV increments. To illustrate local effects, Figure 11 presents a SHAP beeswarm plot. Each point represents a test sample’s SHAP value for a feature and its color indicates the corresponding feature value. Positive SHAP values increase the prediction, while negative values reduce it. In the plot, high red EAT values cluster on the positive side, while low blue EAT values appear on the negative side. This clearly reflects the positive impact of high EAT on FAV accumulation. CHTD exhibits a similar but weaker effect. Most CTG points cluster near zero, with only extreme CTG events exhibit a strong positive correlation with FAV changes. This suggests that within normal CTG ranges the feature has limited impact, and that only sustained extreme gradients drive fatty acid hydrolysis and oxidation by promoting internal condensation and microbial activity. The SHAP analysis validates the physical plausibility of the constructed features and demonstrates the model’s transparency and reliability in distinguishing between normal and extreme storage conditions. It thus provides a robust explanatory basis for early detection of quality deterioration and scientific risk warnings in grain storage management.

3.5. Future Quality Prediction Experiment

To validate the practical effectiveness of the proposed GCN-TFT temperature forecasting and stacked ensemble learning framework, a future quality prediction experiment was designed to assess the model’s reliability and robustness in forecasting future storage quality and issuing early warnings of rapid deterioration. First, the previously developed GCN-TFT model utilized the previous 60 days of historical data to generate a continuous 60-day forecast for the grain pile using a sliding window and cascade approach. It predicted days 1 to 30, appended these results to the historical data, and then forecasted days 31 to 60, yielding a complete two-month sequence. Next, EAT, CHTD and CTG were derived from the sequence and used as inputs to the stacked ensemble model to enable early prediction of FAV changes. Because long-term forecasts may introduce cumulative errors, and the primary objective is to issue timely warnings before rapid deterioration, such as significant increases in FAV, 12 test samples with substantial FAV rises within 60 days were selected for in-depth analysis, ensuring practical guidance for grain storage management.
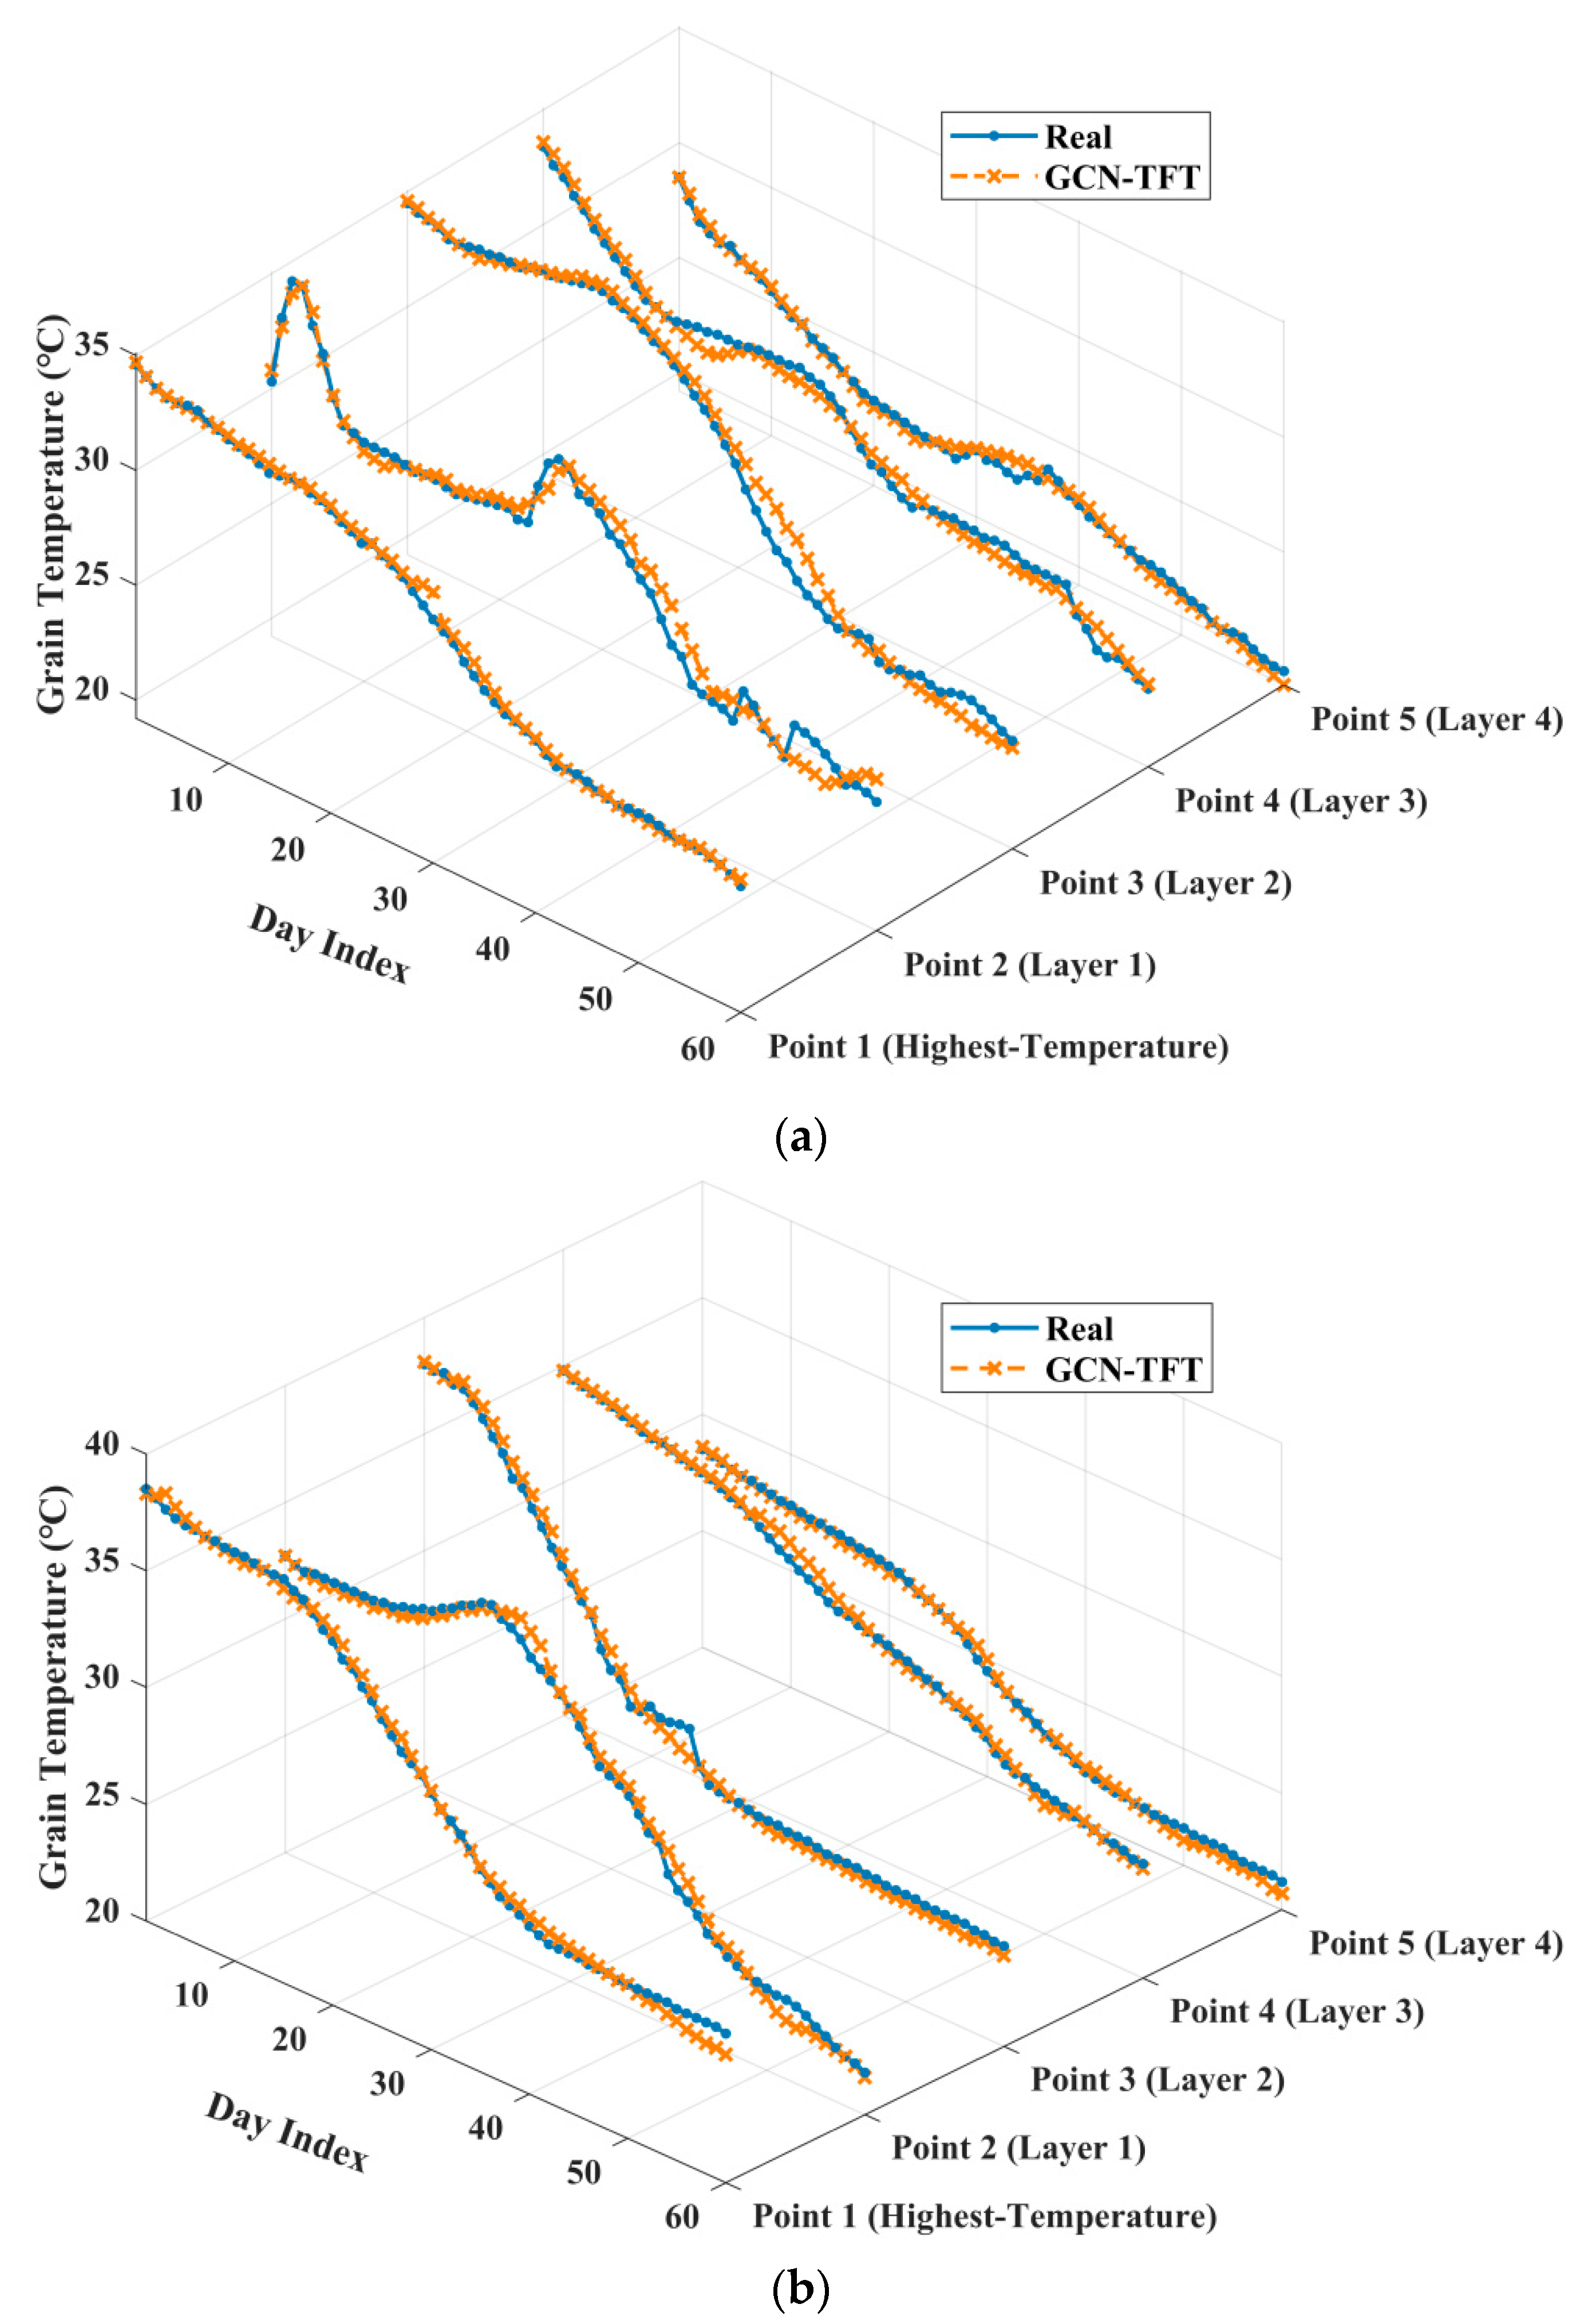
The GCN-TFT model was employed to predict daily grain temperatures at all sensor locations for each selected granary, and overall prediction error across all points was calculated. The model achieved an MAE of 0.26 °C and an RMSE of 0.34 °C, demonstrating its ability to capture complex spatiotemporal temperature variations in the grain pile and meeting the precision requirements for subsequent quality prediction. For a more intuitive demonstration of detail capture, one granary was randomly selected from each region for a case study. Within each selected granary, the sensor with the highest recorded temperature was chosen to show local hotspot trends, and one sensor per vertical layer was selected to illustrate the dynamics of the vertical temperature gradient. Figure 12 compares the predicted and measured temperature curves over 60 days for the five representative sensors, confirming a high degree of alignment and demonstrating that the model captures dynamic temperature details accurately.
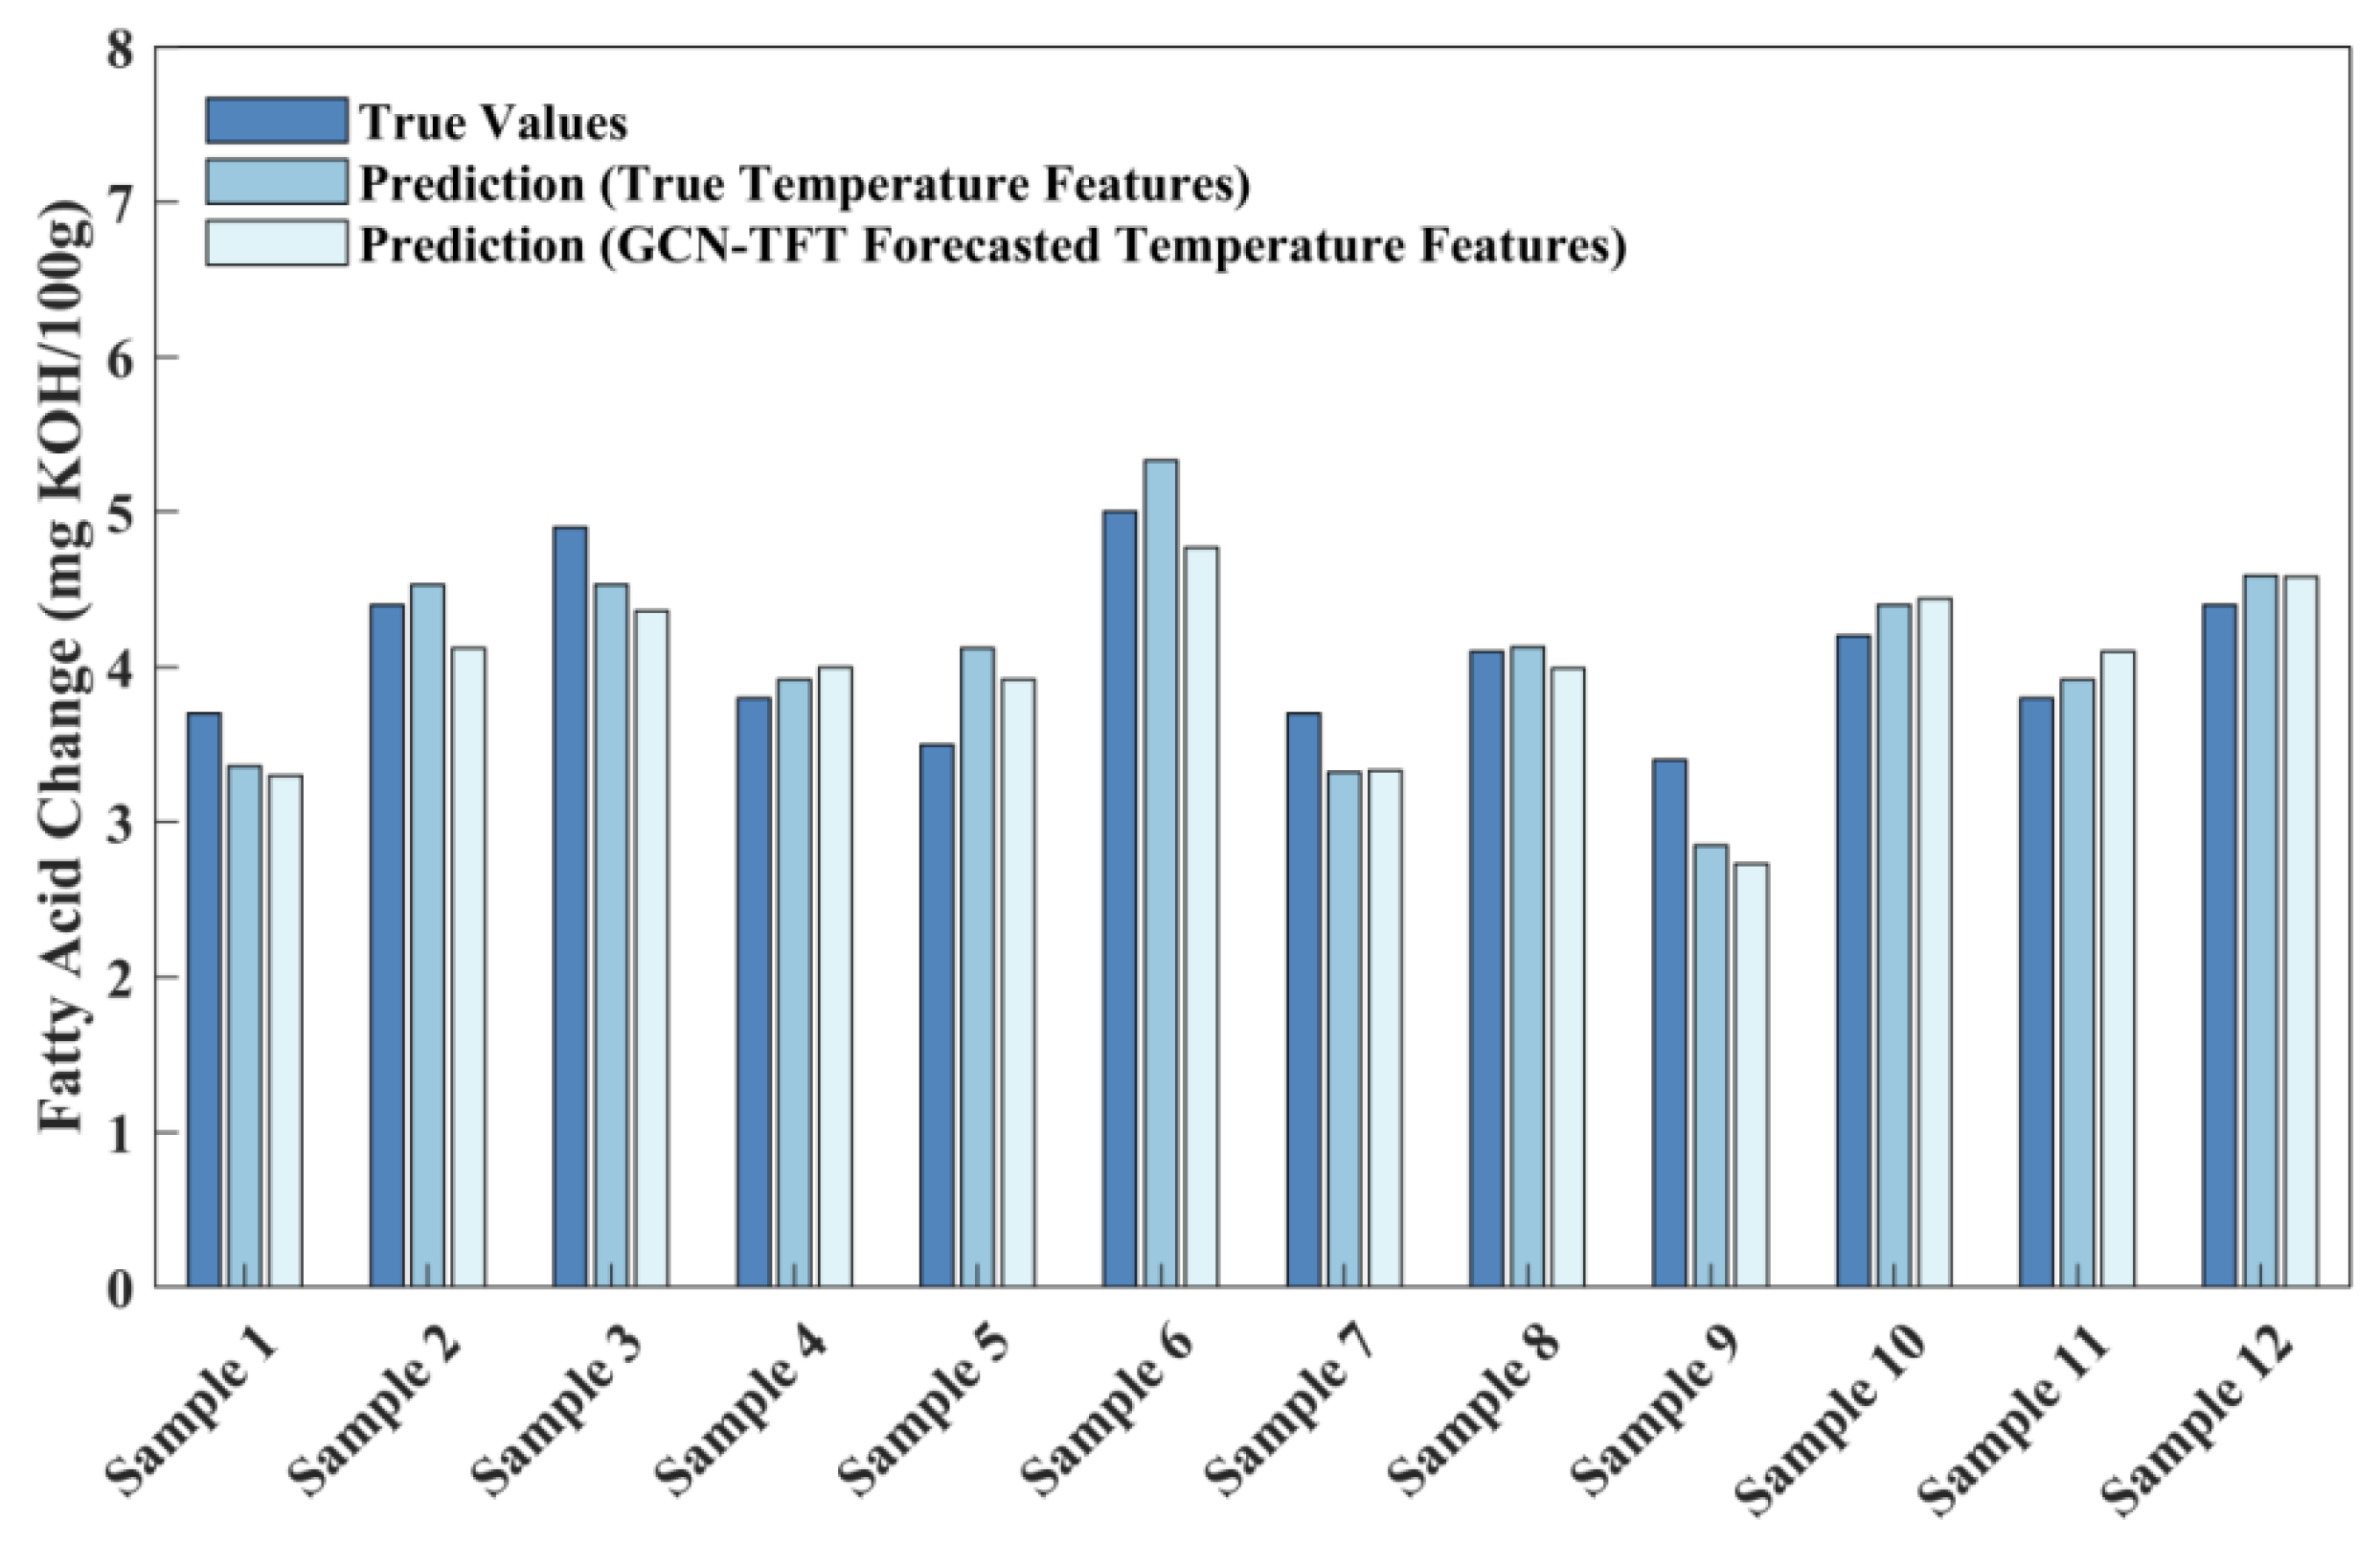
After the grain temperature prediction task was completed, the resulting forecasts were employed to construct features, which were subsequently input into the stacked ensemble learning model developed in this study to predict changes in FAV over the following 60 days. Figure 13 compares the measured FAV changes in test samples with predictions based on features derived from actual temperature data and those based on features derived from GCN-TFT predicted temperatures. The results demonstrate that predictions based on actual temperature data align closely with measurements, achieving an MAE of 0.28 mg KOH/100 g and an RMSE of 0.33 mg KOH/100 g. In contrast, predictions based on GCN-TFT forecasted features exhibited slightly higher errors, with an MAE of 0.33 mg KOH/100 g and an RMSE of 0.36 mg KOH/100 g. These findings indicate that the propagation of errors originating from temperature forecasts had only a limited impact on the final quality predictions. This experiment confirms the feasibility and stability of the proposed multi-model fusion framework from temperature forecasting to quality prediction, providing support for early warning of rapid quality deterioration risks during storage.

3.6. Discussion

Outstanding performance in predicting wheat storage quality was demonstrated by the stacked ensemble learning framework developed in this study, since it leverages weighted combinations of predictions from four complementary base learners through a linear meta learner, thus capitalizing on each model’s strengths in capturing nonlinear relationships, feature interactions, and small sample robustness, and significantly enhancing overall predictive accuracy and generalization. It was further revealed by SHAP interpretability analysis that EAT is the primary driver of FAV increases, a finding that aligns with the biochemical mechanism by which sustained high temperatures enhance enzymatic reactions and spontaneous oxidation. It was also observed that CHTD contributes significantly to quality changes. Under normal conditions, CTG had only a minor effect on prediction results and influenced fatty acid hydrolysis and oxidation positively only when prolonged extreme temperature gradients intensified internal condensation risk, microbial activity and moisture migration within the grain pile, thereby underscoring the potential influence of spatial temperature distribution on storage quality [35,51,52]. By integrating the GCN-TFT grain temperature forecasting model, forecasted grain temperature data are used to predict future storage quality, enabling intervention before rapid increases in FAV occur and facilitating a transition from passive monitoring to proactive management.
Several limitations are associated with this study. Firstly, the original dataset was limited in size. Although augmentation with TimeGAN yielded synthetic samples in which seasonal fluctuation patterns, realistic change rates for a given storage season and interval length, empirical value ranges, and characteristic inter-variable couplings were preserved, truly extreme degradation regimes that were rare or absent in the training set (e.g., mold outbreaks under severe heat and humidity) may not have been generated. Second, other potential drivers, such as storage under sustained high humidity, fungal growth, and pest infestation, were not explicitly modeled. Future work will expand geographic coverage and sample size, enrich the dataset with storage episodes under sustained high humidity, integrate additional multimodal sensor data to enhance robustness, practicality, and generalizability.

4. Conclusions

An interpretable stacked ensemble learning framework based on spatially reduced grain temperature features was proposed to address the limitations of traditional wheat storage quality prediction methods that overlook spatial temperature distributions within grain piles, lack interpretability, and fail to provide early warnings. Three key features, namely EAT, CHTD, and CTG, are incorporated, collectively characterizing the complex spatiotemporal temperature dynamics within the grain pile. Predictions from four distinct base learners are weighted and integrated using a linear meta learner to achieve high precision forecasting of FAV changes during storage. The proposed stacked ensemble model achieved R2 = 0.94, MAE = 0.44 mg KOH/100 g, and RMSE = 0.59 mg KOH/100 g on the test set, representing a significant improvement in both error metrics and model fit compared to single model approaches. SHAP interpretability analysis identified EAT as the primary driver of wheat quality deterioration, followed by CHTD and CTG, thereby reinforcing the model’s reliability and applicability. The GCN-TFT grain temperature forecasting model was further integrated with the stacked ensemble model to establish a multi model fusion framework spanning temperature and quality prediction. In a 60 day forecasting scenario, the integrated model demonstrated satisfactory performance in grain temperature prediction (MAE = 0.26 °C, RMSE = 0.34 °C) and in predicting FAV changes (MAE = 0.33 mg KOH/100 g, RMSE = 0.36 mg KOH/100 g), confirming the feasibility and reliability of the approach for early warning applications in real-world granaries.

Author Contributions

Conceptualization, X.L. and W.W. (Wenfu Wu); methodology, X.L.; software, S.Z. and W.W. (Wenyue Wang); validation, X.L. and S.Z.; formal analysis, X.L. and Y.X.; investigation, Z.L. and H.G.; resources, W.W. (Wenfu Wu) and W.W. (Wenyue Wang); data curation, X.L., B.P. and Y.X.; writing—original draft preparation, X.L.; writing—review and editing, X.L., W.W. (Wenfu Wu) and Y.X.; visualization, X.L. and Y.M.; supervision, W.W. (Wenfu Wu) and Y.X.; project administration, W.W. (Wenyue Wang) and J.Z.; funding acquisition, W.W. (Wenyue Wang) and Y.X. All authors have read and agreed to the published version of the manuscript.

Funding

This work was supported by the Key Research and Development Program of Xinjiang Uygur Autonomous Region, grant number 2023B02043, founded by Wenyue Wang.

Institutional Review Board Statement

Not applicable.

Data Availability Statement

The data presented in this study are available on request from the corresponding author due to confidentiality restrictions regarding corporate grain storage data.

Conflicts of Interest

The authors declare no conflicts of interest.

References

  1. Alam, M.F.B.; Tushar, S.R.; Ahmed, T.; Karmaker, C.L.; Bari, A.B.M.M.; de Jesus Pacheco, D.A.; Nayyar, A.; Islam, A.R.M.T. Analysis of the enablers to deal with the ripple effect in food grain supply chains under disruption: Implications for food security and sustainability. Int. J. Prod. Econ. 2024, 270, 109179. [Google Scholar] [CrossRef]
  2. Jia, S.; Qiu, Y.; Yang, C. Sustainable development goals, financial inclusion, and grain security efficiency. Agronomy 2021, 11, 2542. [Google Scholar] [CrossRef]
  3. United Nations. Transforming Our World: The 2030 Agenda for Sustainable Development; Department of Economic and Social Affairs: New York, NY, USA, 2015. [Google Scholar]
  4. Tushar, S.R.; Alam, M.F.B.; Zaman, S.M.; Garza-Reyes, J.A.; Bari, A.B.M.M.; Karmaker, C.L. Analysis of the factors influencing the stability of stored grains: Implications for agricultural sustainability and food security. Sustain. Oper. Comput. 2023, 4, 40–52. [Google Scholar] [CrossRef]
  5. Keskin, S.; Özkaya, H. Effect of storage and insect infestation on the technological properties of wheat. CyTA-J. Food 2015, 13, 134–139. [Google Scholar] [CrossRef]
  6. Ziegler, V.; Paraginski, R.T.; Ferreira, C.D. Grain storage systems and effects of moisture, temperature and time on grain quality—A review. J. Stored Prod. Res. 2021, 91, 101770. [Google Scholar] [CrossRef]
  7. FAO. The State of Food and Agriculture 2019: Moving Forward on Food Loss and Waste; Food and Agriculture Organization of the United Nations: Rome, Italy, 2019. [Google Scholar]
  8. Liu, H.; Zhang, Y.; Don, C.; Zhang, B. Effects of grain storage time and storage temperature on gluten protein structure of wheat. Cereal Chem. 2023, 100, 183–195. [Google Scholar] [CrossRef]
  9. Kumar, C.; Ram, C.L.; Jha, S.N.; Vishwakarma, R.K. Warehouse storage management of wheat and their role in food security. Front. Sustain. Food Syst. 2021, 5, 675626. [Google Scholar] [CrossRef]
  10. González-Torralba, J.; Arazuri, S.; Jarén, C.; Arreegui, L.M. Influence of temperature and RH during storage on wheat bread making quality. J. Stored Prod. Res. 2013, 55, 134–144. [Google Scholar] [CrossRef]
  11. Alconada, T.M.; Moure, M.C. Deterioration of lipids in stored wheat grains by environmental conditions and fungal infection—A review. J. Stored Prod. Res. 2022, 95, 101914. [Google Scholar] [CrossRef]
  12. Strelec, I.; Mrša, V.; Simović, D.Š.; Petrović, J.; Zahorec, J.; Budžaki, S. Biochemical and Quality Parameter Changes of Wheat Grains during One-Year Storage under Different Storage Conditions. Sustainability 2024, 16, 1155. [Google Scholar] [CrossRef]
  13. Hu, H.; Qiu, M.; Qiu, Z.; Li, S.; Lan, L.; Liu, X. Variation in wheat quality and starch structure under granary conditions during long-term storage. Foods 2023, 12, 1886. [Google Scholar] [CrossRef]
  14. Zhang, S.B.; Lv, Y.Y.; Wang, Y.L.; Jia, F.; Wang, J.S.; Hu, Y.S. Physicochemical changes in wheat of different hardnesses during storage. J. Stored Prod. Res. 2017, 72, 161–165. [Google Scholar] [CrossRef]
  15. Zhang, Q.; Song, Z.; Bi, M. Evaluation Model Based on the SGCNiFormer for the Influence of Different Storage Environments on Wheat Quality. Foods 2025, 14, 1715. [Google Scholar] [CrossRef]
  16. Li, L.; Li, Y.; Chen, Y.; Ding, Q.; He, R.; Liu, Y. Effects of Mechanical Damage for Different Type of Threshing Patterns on Wheat Storage Quality Traits. Foods 2025, 14, 1577. [Google Scholar] [CrossRef]
  17. Jiang, H.; Zhou, T. Classification of storage wheat grain quality based on multi-index analysis and fisher discriminant criterion. Trans. Chin. Soc. Agric. Eng. 2019, 35, 291–298. [Google Scholar]
  18. Gao, Y.N. Study on the Changes of Postpartum Quality in Wheat. Ph.D. Thesis, Henan University of Technology, Zhengzhou, China, 2010. [Google Scholar]
  19. Jiang, H.; Zhang, S.; Zhen, Y.; Zhao, L.K.; Zhou, Y.; Zhou, D. Quality classification of stored wheat based on evidence reasoning rule and stacking ensemble learning. Comput. Electron. Agric. 2023, 214, 108319. [Google Scholar] [CrossRef]
  20. Jiang, H.; Zhang, L.; Zhao, L.; Guo, T.; Zhou, D.; Chen, S. Prediction model of wheat quality index based on Broad-AdaBoost. J. Jilin Univ. (Eng. Technol. Ed.) 2022, 52, 1222–1228. [Google Scholar]
  21. Zhang, S. Study on the Quality Evaluation Model of Stored Wheat Based on Ensemble Learning. Master’s Thesis, Henan University of Technology, Zhengzhou, China, 2023. [Google Scholar]
  22. Kibar, H. Influence of storage conditions on the quality properties of wheat varieties. J. Stored Prod. Res. 2015, 62, 8–15. [Google Scholar] [CrossRef]
  23. Han, G. Study on the Effects of Storage Temperature on Mold Occurrence and Quality Changes of Wheat with Different Moisture Contents. Master’s Thesis, Henan University of Technology, Zhengzhou, China, 2024. [Google Scholar]
  24. Zhao, Y.; Han, G.; Li, Y.; Zhang, Y.; Chen, X.; Qiu, Z. Changes in quality characteristics and metabolites composition of wheat under different storage temperatures. J. Stored Prod. Res. 2024, 105, 102229. [Google Scholar] [CrossRef]
  25. Salman, H.; Copeland, L. Effect of storage on fat acidity and pasting characteristics of wheat flour. Cereal Chem. 2007, 84, 600–607. [Google Scholar] [CrossRef]
  26. Kechkin, I.A.; Ermolaev, V.A.; Ivanov, V.A.; Romanova, I.V. Dependence of fat acidity value on wheat grain storage conditions. BIO Web Conf. 2020, 17, 00226. [Google Scholar] [CrossRef]
  27. Qu, Z.K.; Zhang, Y.; Hong, C.; Zhang, C.D.; Dai, Z.W.; Zhao, Y.Y.; Wu, X.D.; Gao, Y.; Jiang, X.M.; Qian, J.; et al. Temperature forecasting of grain in storage: A multi-output and spatiotemporal approach based on deep learning. Comput. Electron. Agric. 2023, 208, 107785. [Google Scholar] [CrossRef]
  28. Wu, Z.; Zhang, Q.; Yin, J.; Wang, X.; Zhang, Z.; Wu, W.; Li, F. Interactions of mutiple biological fields in stored grain ecosystems. Sci. Rep. 2020, 101, 9302. [Google Scholar]
  29. Jiang, H.; Liu, T.; He, P.; Chen, Q. Quantitative analysis of fatty acid value during rice storage based on olfactory visualization sensor technology. Sens. Actuators B Chem. 2020, 309, 127816. [Google Scholar] [CrossRef]
  30. Lu, H.; Jiang, H.; Chen, Q. Determination of fatty acid content of rice during storage based on feature fusion of olfactory visualization sensor data and near-infrared spectra. Sensors 2021, 21, 3266. [Google Scholar] [CrossRef] [PubMed]
  31. Chen, K.; Wu, W.F.; Lan, Y.; Liu, Z.; Han, F.; Xu, Y. Assessment and prediction of free fatty acids changes in maize based on effective accumulated temperature in large granaries. Int. J. Food Prop. 2022, 25, 1156–1170. [Google Scholar] [CrossRef]
  32. Wang, Q.; Han, F.; Wu, Z.; Lan, T.; Wu, W. Estimation of free fatty acids in stored paddy rice using multiple-kernel support vector regression. Appl. Sci. 2020, 10, 6555. [Google Scholar] [CrossRef]
  33. GB/T 15684-2015; Inspection of Grain and Oils—Determination of Fatty Acid Value of Grain. Standardization Administration of China: Beijing, China, 2015.
  34. Yoon, J.; Jarrett, D.; Van der Schaar, M. Time-series generative adversarial networks. Adv. Neural Inf. Process. Syst. 2019, 32, 5508–5518. [Google Scholar]
  35. Yin, J. Research on Multi-Fields Coupling Model of Wheat Grain and Condensation Prediction. Ph.D. Thesis, Jilin University, Changchun, China, 2015. [Google Scholar]
  36. Xiong, D. Condensation in the Grain Mass during Mechanical Aeration of Stored Grain and Its Prevention. Food Sci. Technol. Econ. 1999, 4, 25–27. [Google Scholar]
  37. LS/T 1206-2005; Safe Operation Regulations for Grain Storage Facility. State Administration of Grain: Beijing, China, 2005.
  38. Li, X.; Qiao, X.; Wang, W.; Wuyun, S.; Wu, W.; Guo, H.; Lu, Y. Grain Storage Condensation Risk Prediction Method Based on 3DCNN Combined with TFT. Trans. Chin. Soc. Agric. Mach. 2025, 56, 549–557. [Google Scholar]
  39. Zhang, Z.; Guo, J.; Gao, Y.; Zhang, Y.; Chen, X.; Li, Y. Increasing yield estimation accuracy for individual apple trees via ensemble learning and growth stage stacking. Comput. Electron. Agric. 2025, 237, 110648. [Google Scholar] [CrossRef]
  40. Priyadarshi, M.; Das, P.; Hussain, A.; Aswathy, R.; Lasker, S.M. Prediction of specific methanogenic activity of anaerobic sludges from sewage treatment plants of Delhi, India based on SVR model. Fuel 2025, 385, 134119. [Google Scholar] [CrossRef]
  41. Yu, H.; Zhao, H.; Liu, D.; Wang, L.; LI, L.; Li, X.; Dong, Y.; Nai, M. Prediction of myofascial pelvic pain syndrome based on random forest model. Heliyon 2024, 10, e32123. [Google Scholar] [CrossRef]
  42. Chen, T.; Guestrin, C. XGBoost: A scalable tree boosting system. In Proceedings of the 22nd ACM SIGKDD International Conference on Knowledge Discovery and Data Mining (KDD’16), San Francisco, CA, USA, 13–17 August 2016; Association for Computing Machinery: New York, NY, USA, 2016; pp. 785–794. [Google Scholar]
  43. Biswas, M.A.R.; Robinson, M.D.; Fumo, N. Prediction of residential building energy consumption: A neural network approach. Energy 2016, 117, 84–92. [Google Scholar] [CrossRef]
  44. Thakkar, A.; Lohiya, R. Analyzing fusion of regularization techniques in the deep learning-based intrusion detection system. Int. J. Intell. Syst. 2021, 36, 7340–7388. [Google Scholar] [CrossRef]
  45. Sercan, B.; Murat, U. Data-driven prediction of copper leaching yield from brass waste using stacking ensemble learning. Sep. Purif. Technol. 2025, 378, 134691. [Google Scholar]
  46. Chen, Z.; Luan, X.; Liu, F. Near-infrared fault detection based on stacked regularized auto-encoder network. Chemom. Intell. Lab. Syst. 2020, 204, 104101. [Google Scholar]
  47. Li, X.; Wu, W.; Guo, H.; Qiao, X.; Wu, Y.; Qiao, G. An interpretable temperature prediction method for grain in storage based on improved temporal Fusion Transformers. Comput. Electron. Agric. 2025, 236, 110414. [Google Scholar] [CrossRef]
  48. Shao, K.; Li, D.; Tang, H.; Zhang, Y.; Xu, B.; Bhatti, U.A. Improving multi-step dissolved oxygen prediction in aquaculture using adaptive temporal convolution and optimized transformer. Comput. Electron. Agric. 2025, 235, 110329. [Google Scholar] [CrossRef]
  49. Zhang, G.; Ren, S.; Zhao, P.; Liu, Y.; Chen, X.; Chen, H. Damage prediction of ship cabins subjected to underwater contact explosion by deep neural network with grid search algorithm. Ocean Eng. 2024, 312, 119278. [Google Scholar] [CrossRef]
  50. Lundberg, S.M.; Lee, S.I. A unified approach to interpreting model predictions. Adv. Neural Inf. Process. Syst. 2017, 4768–4777. [Google Scholar]
  51. Jian, F.; Jayas, D.S.; White, N.D.G. Temperature fluctuations and moisture migration in wheat stored for 15 months in a metal silo in Canada. J. Stored Prod. Res. 2009, 45, 82–90. [Google Scholar] [CrossRef]
  52. Thorpe, G.R. Moisture diffusion through bulk grain subjected to a temperature gradient. J. Stored Prod. Res. 1982, 18, 9–12. [Google Scholar] [CrossRef]
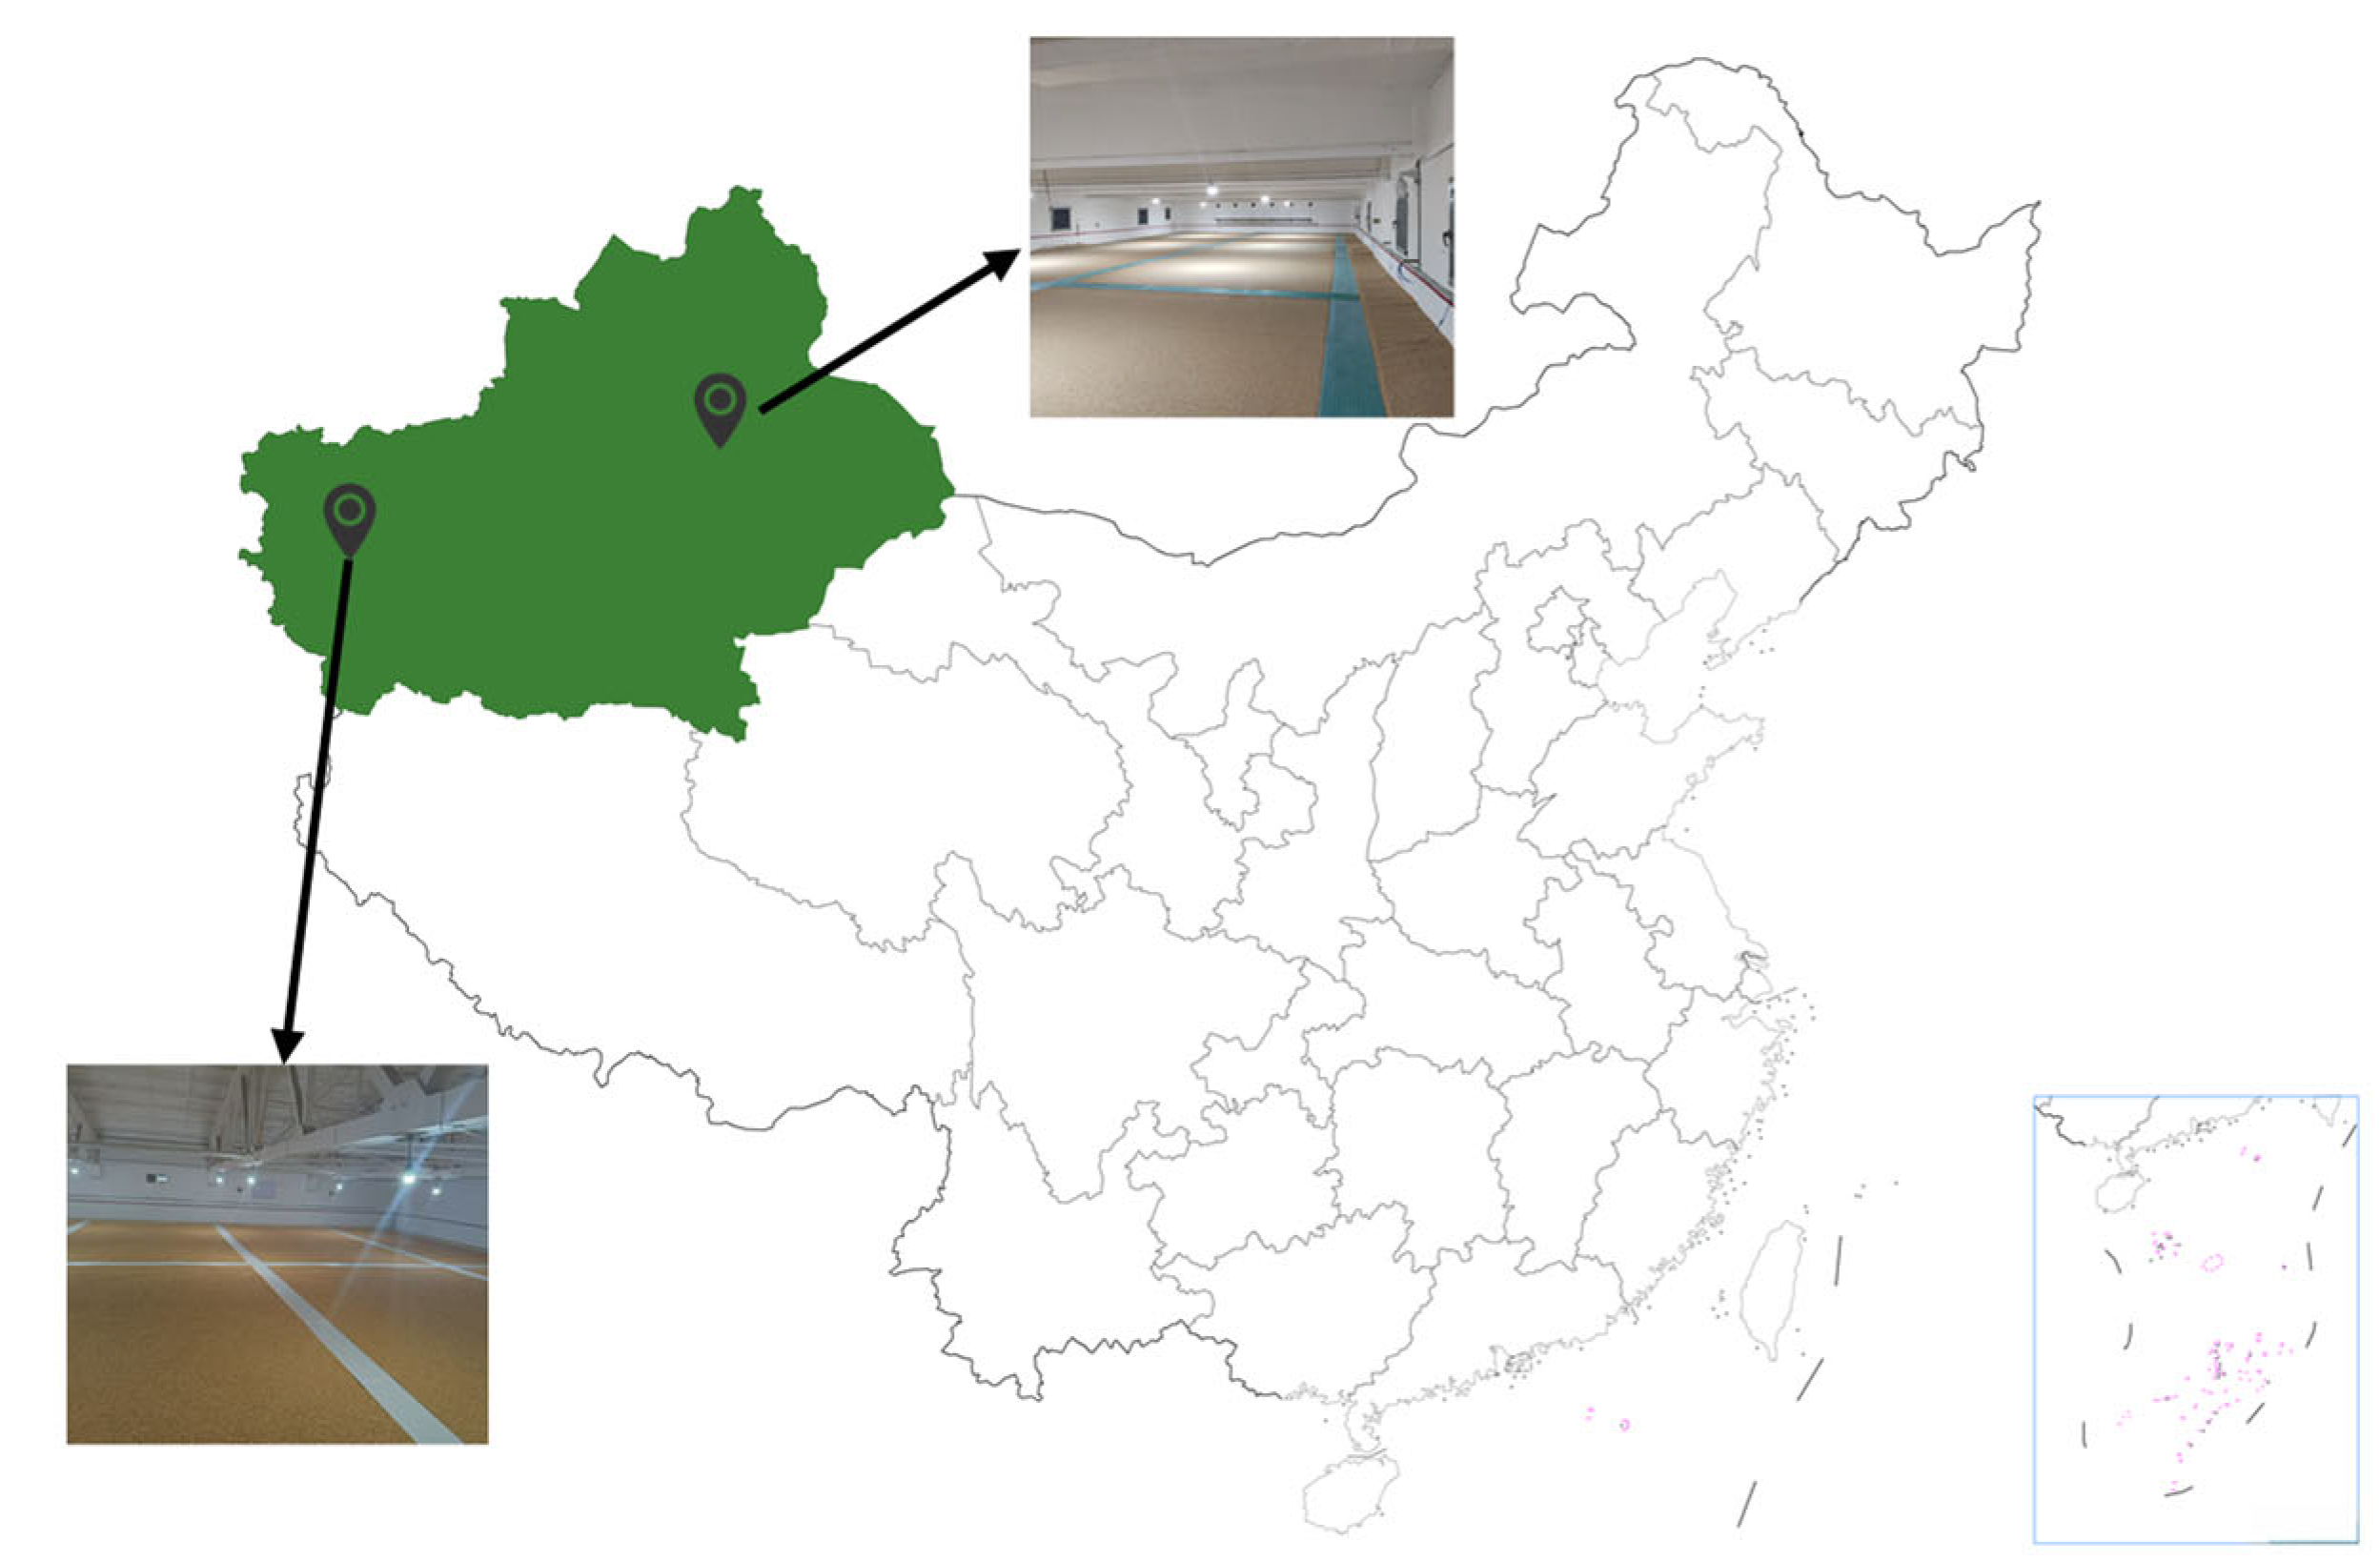
Figure 1. Data source.
Agriculture 15 01844 g001
Figure 2. Example of the grain condition monitoring system. 1. Granary; 2. Grain; 3. Cable; 4. DS18B20 Digital temperature sensor (for monitoring grain temperature); 5. Temperature and humidity sensor (for monitoring air temperature and humidity inside the granary); 6. Wireless node.
Agriculture 15 01844 g002
Figure 3. Schematic diagram of the sampling scheme.
Agriculture 15 01844 g003
Figure 4. Data preprocessing workflow.
Agriculture 15 01844 g004
Figure 5. Pearson correlation heat map.
Agriculture 15 01844 g005
Figure 6. Statistical results of granary internal air humidity data.
Agriculture 15 01844 g006
Figure 7. Structure of the Stacked Ensemble Learning Model.
Agriculture 15 01844 g007
Figure 8. Multi-Model fusion framework for wheat storage quality prediction.
Agriculture 15 01844 g008
Figure 9. Comparison of the prediction results of each model with the actual values. (a) XGBoost; (b) RF; (c)MLP; (d) SVR; (e) Stacking.
Agriculture 15 01844 g009
Figure 10. Global feature importance bar chart.
Agriculture 15 01844 g010
Figure 11. SHAP beeswarm plot.
Agriculture 15 01844 g011
Figure 12. Results of grain temperature prediction. (a) Visualization of the grain temperature prediction results for granary 1; (b) Visualization of the grain temperature prediction results for granary 2.
Agriculture 15 01844 g012
Figure 13. Comparison of FAV change prediction results based on actual grain temperatures and GCN-TFT predicted grain temperatures.
Agriculture 15 01844 g013
Table 1. Descriptive statistics of the dataset.
MeanStandard DeviationMaximumMinimum
Grain temperature (°C)5.910.736.9−23.8
Granary internal air temperature (°C)9.813.137.5−21.9
Granary internal air humidity (%)37.710.593.811.3
FAV (mg KOH/100 g)23.33.5532.915.9
Table 2. Hyperparameter search range and rational parameter settings.
Base LearnerParameterSearch RangeRational Parameter Settings
XGBoostLearning Rate0.01, 0.05, 0.10.05
n_estimators100, 200, 300200
Max Depth3, 5, 75
MLPhidden_layer_sizes(30,), (50,), (100,)(50,)
alpha0.0001, 0.001, 0.010.001
RFn_estimators100, 200, 300200
Max Depth5, 10, 1510
SVRC0.1, 1, 101
ε0.001, 0.01, 0.10.01
Table 3. Evaluation coefficients of each model.
ModelMAE (mg KOH/100 g)RMSE (mg KOH/100 g)R2
RF0.630.870.88
XGBoost0.570.810.90
MLP0.640.940.86
SVR0.630.880.88
Stacking0.440.590.94
Disclaimer/Publisher’s Note: The statements, opinions and data contained in all publications are solely those of the individual author(s) and contributor(s) and not of MDPI and/or the editor(s). MDPI and/or the editor(s) disclaim responsibility for any injury to people or property resulting from any ideas, methods, instructions or products referred to in the content.