Article

Synergistic Effects of Sediment Size and Concentration on Performance Degradation in Centrifugal Irrigation Pumps: A Southern Xinjiang Case Study

1
College of Hydraulic and Architectural Engineering, Tarim University, Alar 843300, China
2
College of Mechanical and Electrical Engineering, Central South University, Changsha 410083, China
*
Authors to whom correspondence should be addressed.
Agriculture 2025, 15(17), 1843; https://doi.org/10.3390/agriculture15171843
Submission received: 23 July 2025 / Revised: 23 August 2025 / Accepted: 24 August 2025 / Published: 29 August 2025
(This article belongs to the Section Agricultural Technology)

Abstract

Centrifugal irrigation pumps in Southern Xinjiang face severe performance degradation due to high fine-sediment loads in canal water. This study combines Eulerian multiphase simulations with experimental validation to investigate the coupled effects of sediment size (0.05~0.8 mm) and concentration (5~20%) on hydraulic performance. Numerical models incorporating Realizable kε turbulence closure and discrete phase tracking reveal two critical thresholds: (1) particle sizes ≥ 0.4 mm trigger a phase transition from localized disturbance to global flow disorder, expanding low-pressure zones by 37% at equivalent concentrations; (2) concentrations exceeding 13% accelerate nonlinear pressure decay through collective particle interactions. Velocity field analysis demonstrates size-dependent attenuation mechanisms: fine sediments (≤0.2 mm) cause gradual dissipation via micro-scale drag, while coarse sediments (≥0.6 mm) induce “cliff-like” velocity drops through inertial impact-blockade chains. Experimental wear tests confirm simulation accuracy in predicting erosion hotspots at impeller inlets/outlets. The identified synergistic thresholds provide critical guidelines for anti-wear design in sediment-laden irrigation systems.

1. Introduction

Centrifugal pumps operating in sediment-laden environments experience severe hydraulic performance degradation and accelerated component wear, particularly in agricultural irrigation systems such as those in Southern Xinjiang, where fine sediments (dp < 0.8 mm) at high volumetric concentrations (Cv > 10%) are prevalent [1,2,3,4,5]. Extensive research has established that sediment properties—including particle size distribution (PSD), concentration, shape, and density—directly influence erosion intensity, flow stability, and energy losses. For instance, broader PSDs can reduce impeller wear by 20% but exacerbate volute erosion by 30% due to altered particle trajectories [6,7,8], while angular particles induce higher erosion rates than spherical equivalents [9,10,11]. Studies by Tarodiya and Gandhi further quantified nonlinear head and efficiency reductions under multi-size slurries, linking performance decay to granular viscosity and particle kinetics [12,13]. In high-concentration regimes (Cv ≥ 15%), solid-phase interactions amplify turbulence dissipation, causing flow separation and pressure field distortion [14,15,16], with critical thresholds identified at dp ≥ 0.4 mm for “global flow disorder” [17,18,19].
Numerical advancements, particularly Eulerian–Lagrangian frameworks and CFD-DEM coupling, have enabled high-fidelity prediction of solid–liquid interactions. Modified drag models incorporating turbulence intensity [20] and erosion models accounting for particle Stokes numbers [21,22] have improved accuracy in wear simulation, validated against experimental data from elbow pipes [6] and pump casings [23]. The DDPM approach efficiently captures particle–fluid momentum exchange [24,25], while sliding mesh techniques resolve unsteady effects in impeller–volute interfaces [26]. These methods reveal that fine sediments (dp ≤ 0.2 mm) follow fluid streamlines but cumulatively dissipate kinetic energy at high Cv [27,28], whereas coarse particles (dp ≥ 0.6 mm) trigger blockage–reverse flow cycles [29,30,31,32]. Wear localization—driven by particle inertia, centrifugal forces, and secondary flows—is most severe at blade leading edges, volute tongues, and suction surfaces [33,34,35,36,37,38].
Despite these insights, gaps persist in understanding the synergistic impact of fine sediments (dp = 0.05~0.8 mm) and high concentrations (Cv = 5~20%) typical of arid-region irrigation pumps. The existing studies focus on mono-sized or mixed coarse slurries [39,40], neglecting the unique “quasi-continuous phase” behavior of fine sediments at Cv ≥ 13% [41,42]. While bionic blade geometries [43,44] and elastomer liners [45] mitigate wear, composite materials can enhance the performance of mechanical materials [46]; their efficacy in fine-sediment regimes remains untested in Southern Xinjiang. Furthermore, turbulent kinetic energy (TKE) restructuring under particle-induced disturbances—key to energy loss mechanisms—is poorly quantified [47,48,49,50], and critical transitions in pressure–velocity fields lack systematic thresholds [51,52,53].
Therefore, this study addressed these gaps by investigating a centrifugal irrigation pump (PGW 65-200-7.5G) handling fine sediments from Southern Xinjiang, with the aim of elucidating the synergistic effects of sediment particle size and volumetric concentration in canal systems on the performance degradation of centrifugal pumps in the Southern Xinjiang region, thereby clarifying the underlying mechanisms. Combining Realizable kε modeling, Eulerian multiphase simulations, and experimental validation, we analyze (1) pressure–velocity field degradation under incremental dp and Cv; (2) TKE evolution from “progressive restructuring” to “disordered oscillation”; (3) critical particle size (dp = 0.4 mm) and concentration (Cv = 13%) thresholds for nonlinear hydraulic decay; and (4) sediment volume distribution laws governing wear localization. This work provides granular-scale insights for optimizing anti-wear designs in sediment-intensive agricultural pumps.

2. Materials and Methods

2.1. Modeling and Grid Generation

2.1.1. Model

The centrifugal irrigation pump model studied in this research is PGW 65-200-7.5G (Manufactured by Zhejiang Taizhou PuXuanTe Pump Industry Co., Ltd., Taizhou, China), as shown in Figure 1, with its parameters listed in Table 1.

2.1.2. Grid Generation and Verification

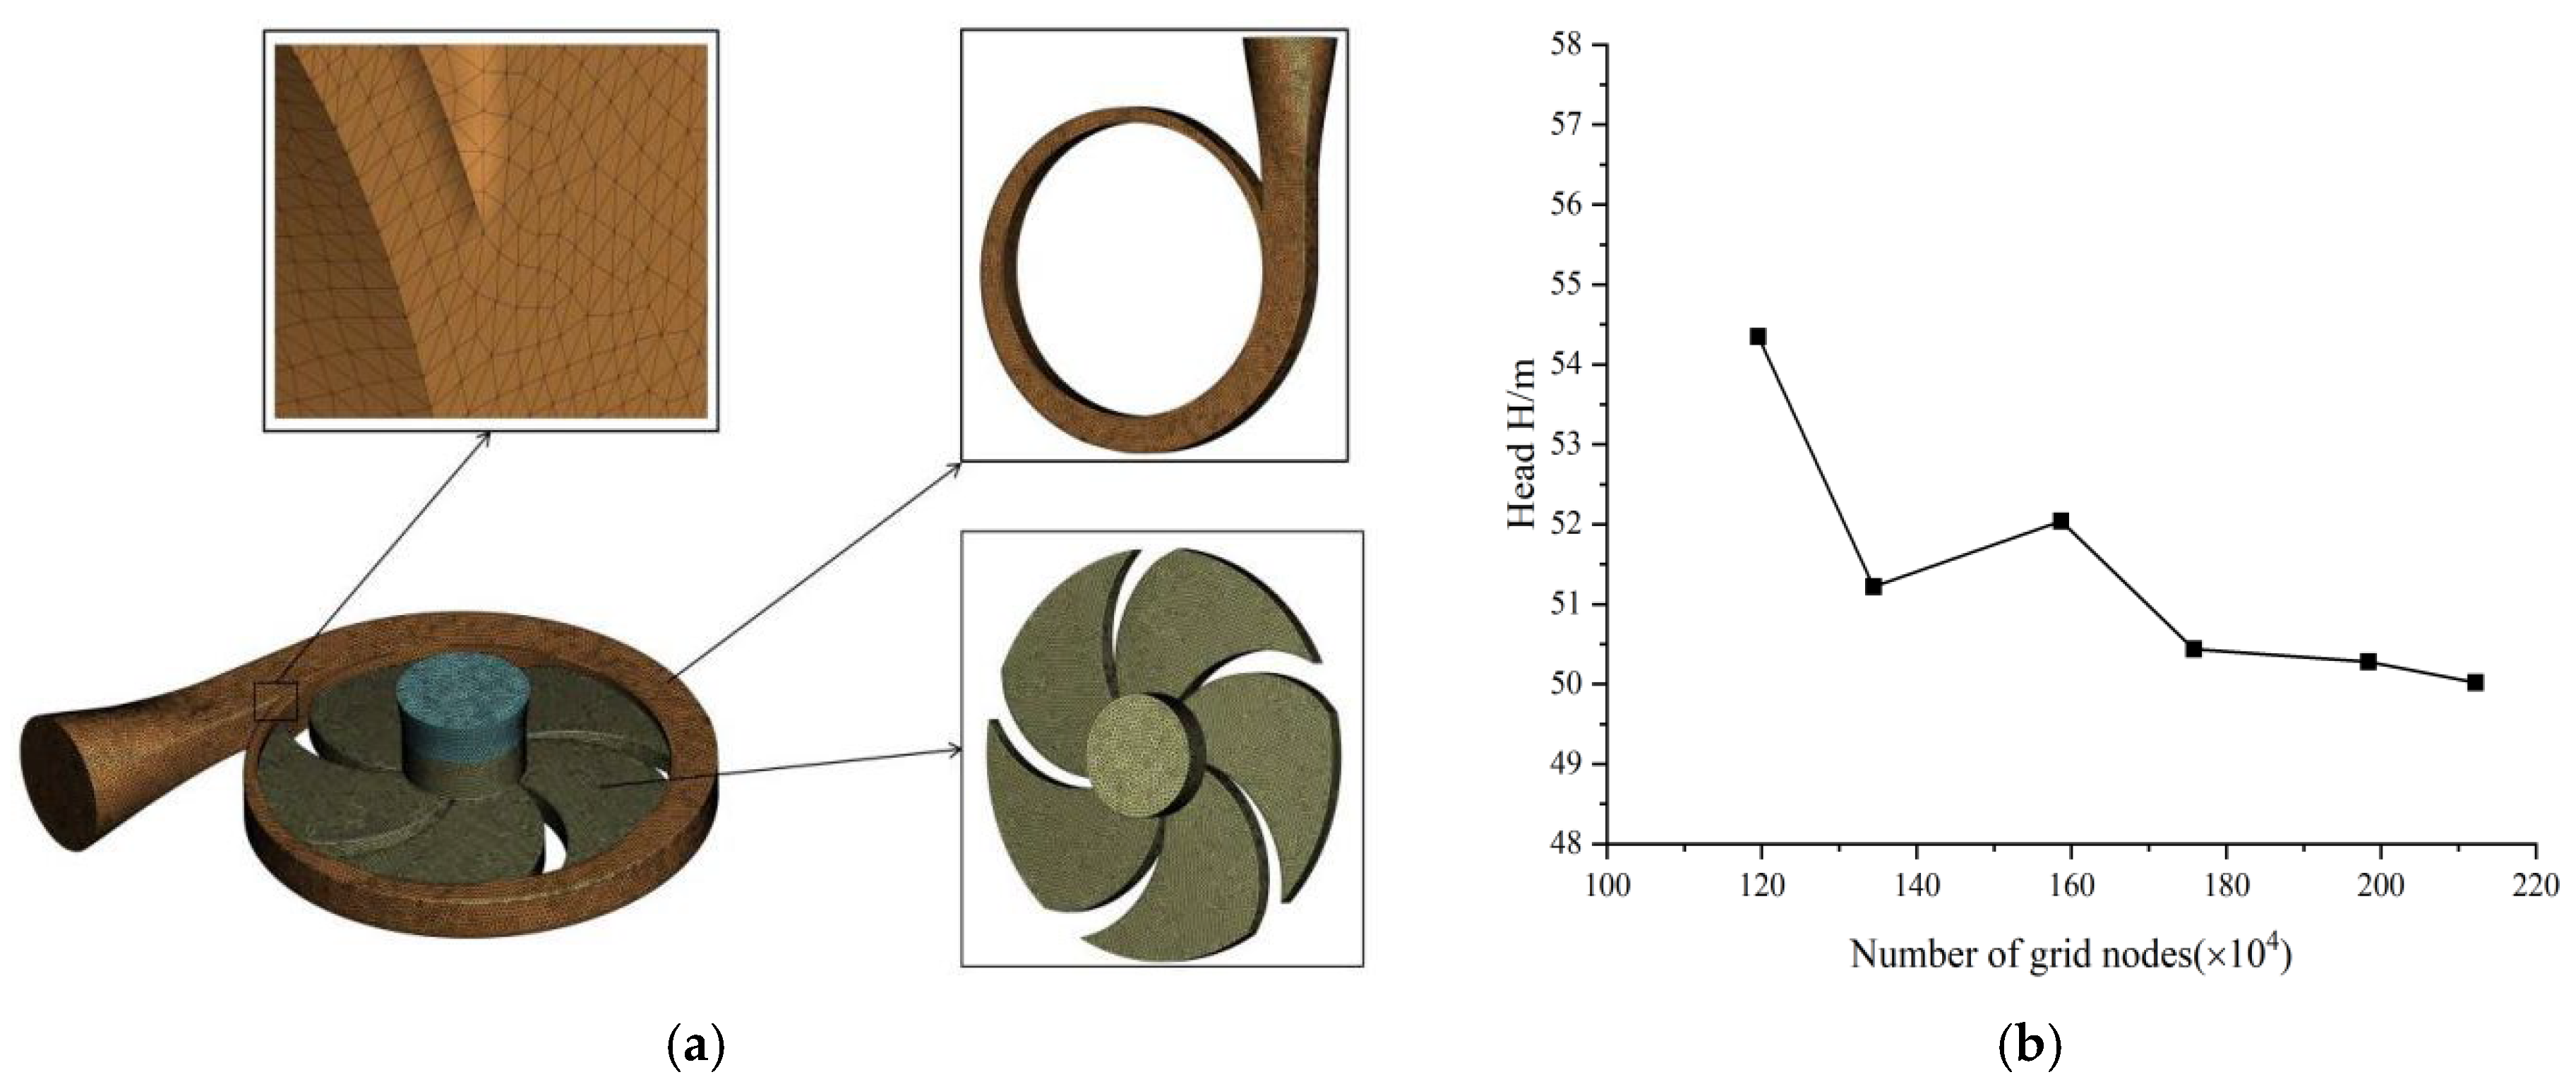
The model was meshed using ANSYS Meshing (2022R2), generating six sets of unstructured grids with varying densities; the number of grids is shown in Table 2. A grid independence study was conducted, with the fluid domain meshing and verification results depicted in Figure 2.
As indicated in Figure 2b, when the grid count exceeds 1,758,117, the relative deviation in centrifugal irrigation pump head stabilizes within 1%. Consequently, this grid size was selected as the final solution for the computational domain.

2.2. Numerical Computation Methods

2.2.1. Turbulence Model Selection

The Realizable kε model, an enhanced two-equation turbulence closure, demonstrates superior accuracy in simulating critical flow regimes—including boundary layers, separated flows, jets, and mixing layers—particularly for analyzing complex flow mechanisms within turbomachinery. The model is commonly used for performance analysis of rotating machinery such as centrifugal pumps [54]. Adopted in this study, it effectively characterizes the transport of TKE and its dissipation rate, enabling precise prediction of boundary layer development, flow separation in impeller passages, and intricate secondary flow phenomena within the volute.

2.2.2. Control Equation

The transport equation for TKE k is given by the following:
ρ k t + ρ u j k x j = x j ( v + v t σ k ) k x j + G k ρ ε
The transport equation for turbulent dissipation rate ε is given by the following:
ρ ε t + ρ u j ε x j = x j ( v + v t σ ε ) + ε x j + ρ C 1 S ε ρ C 2 ε 2 k + v ε
The governing equation for turbulent viscosity v t is given by the following:
v t = ρ C μ k 2 ε
where v is kinematic viscosity, ρ is fluid density, u j is velocity component, x j is spatial coordinate component, σ k is prandtl number for TKE k , σ ε is prandtl number for turbulent dissipation rate ε , G k is TKE production term due to mean velocity gradients, C 1 and C 2 are model constants, and S is mean strain rate tensor.

2.2.3. Boundary Conditions

The multiphase flow simulation employed an Eulerian model with gravitational acceleration set to −9.81 m/s2 along the Z-axis. A velocity-inlet boundary condition was applied at the pump inlet, where the inflow velocity was calculated based on the volumetric flow rate and cross-sectional area, with solid particles introduced axially at zero slip velocity relative to the fluid phase. The outlet utilized a pressure-outlet condition, while all wetted surfaces adopted no-slip walls incorporating a hydraulic roughness height of 0.5 mm calibrated to actual blade topography. Data transfer between the inlet volute, impeller, and spiral casing domains was enabled through shared topology interfaces, with other flow passage surfaces configured for specular particle reflection.

3. Results and Discussion

To investigate flow characteristics within the centrifugal irrigation pump under high fine-sediment conditions typical of Southern Xinjiang irrigation districts, numerical simulations incorporated five sediment particle sizes (0.05 mm, 0.2 mm, 0.4 mm, 0.6 mm, and 0.8 mm) and five concentration levels (5%, 9%, 13%, 17%, and 20%), with sediment density set at 2650 kg/m3. All simulations maintained rated rotational speed and inlet flow conditions, based on extensive sediment measurement data from the region.

3.1. Pressure Characteristics Analysis

3.1.1. Different Sediment Particle Size

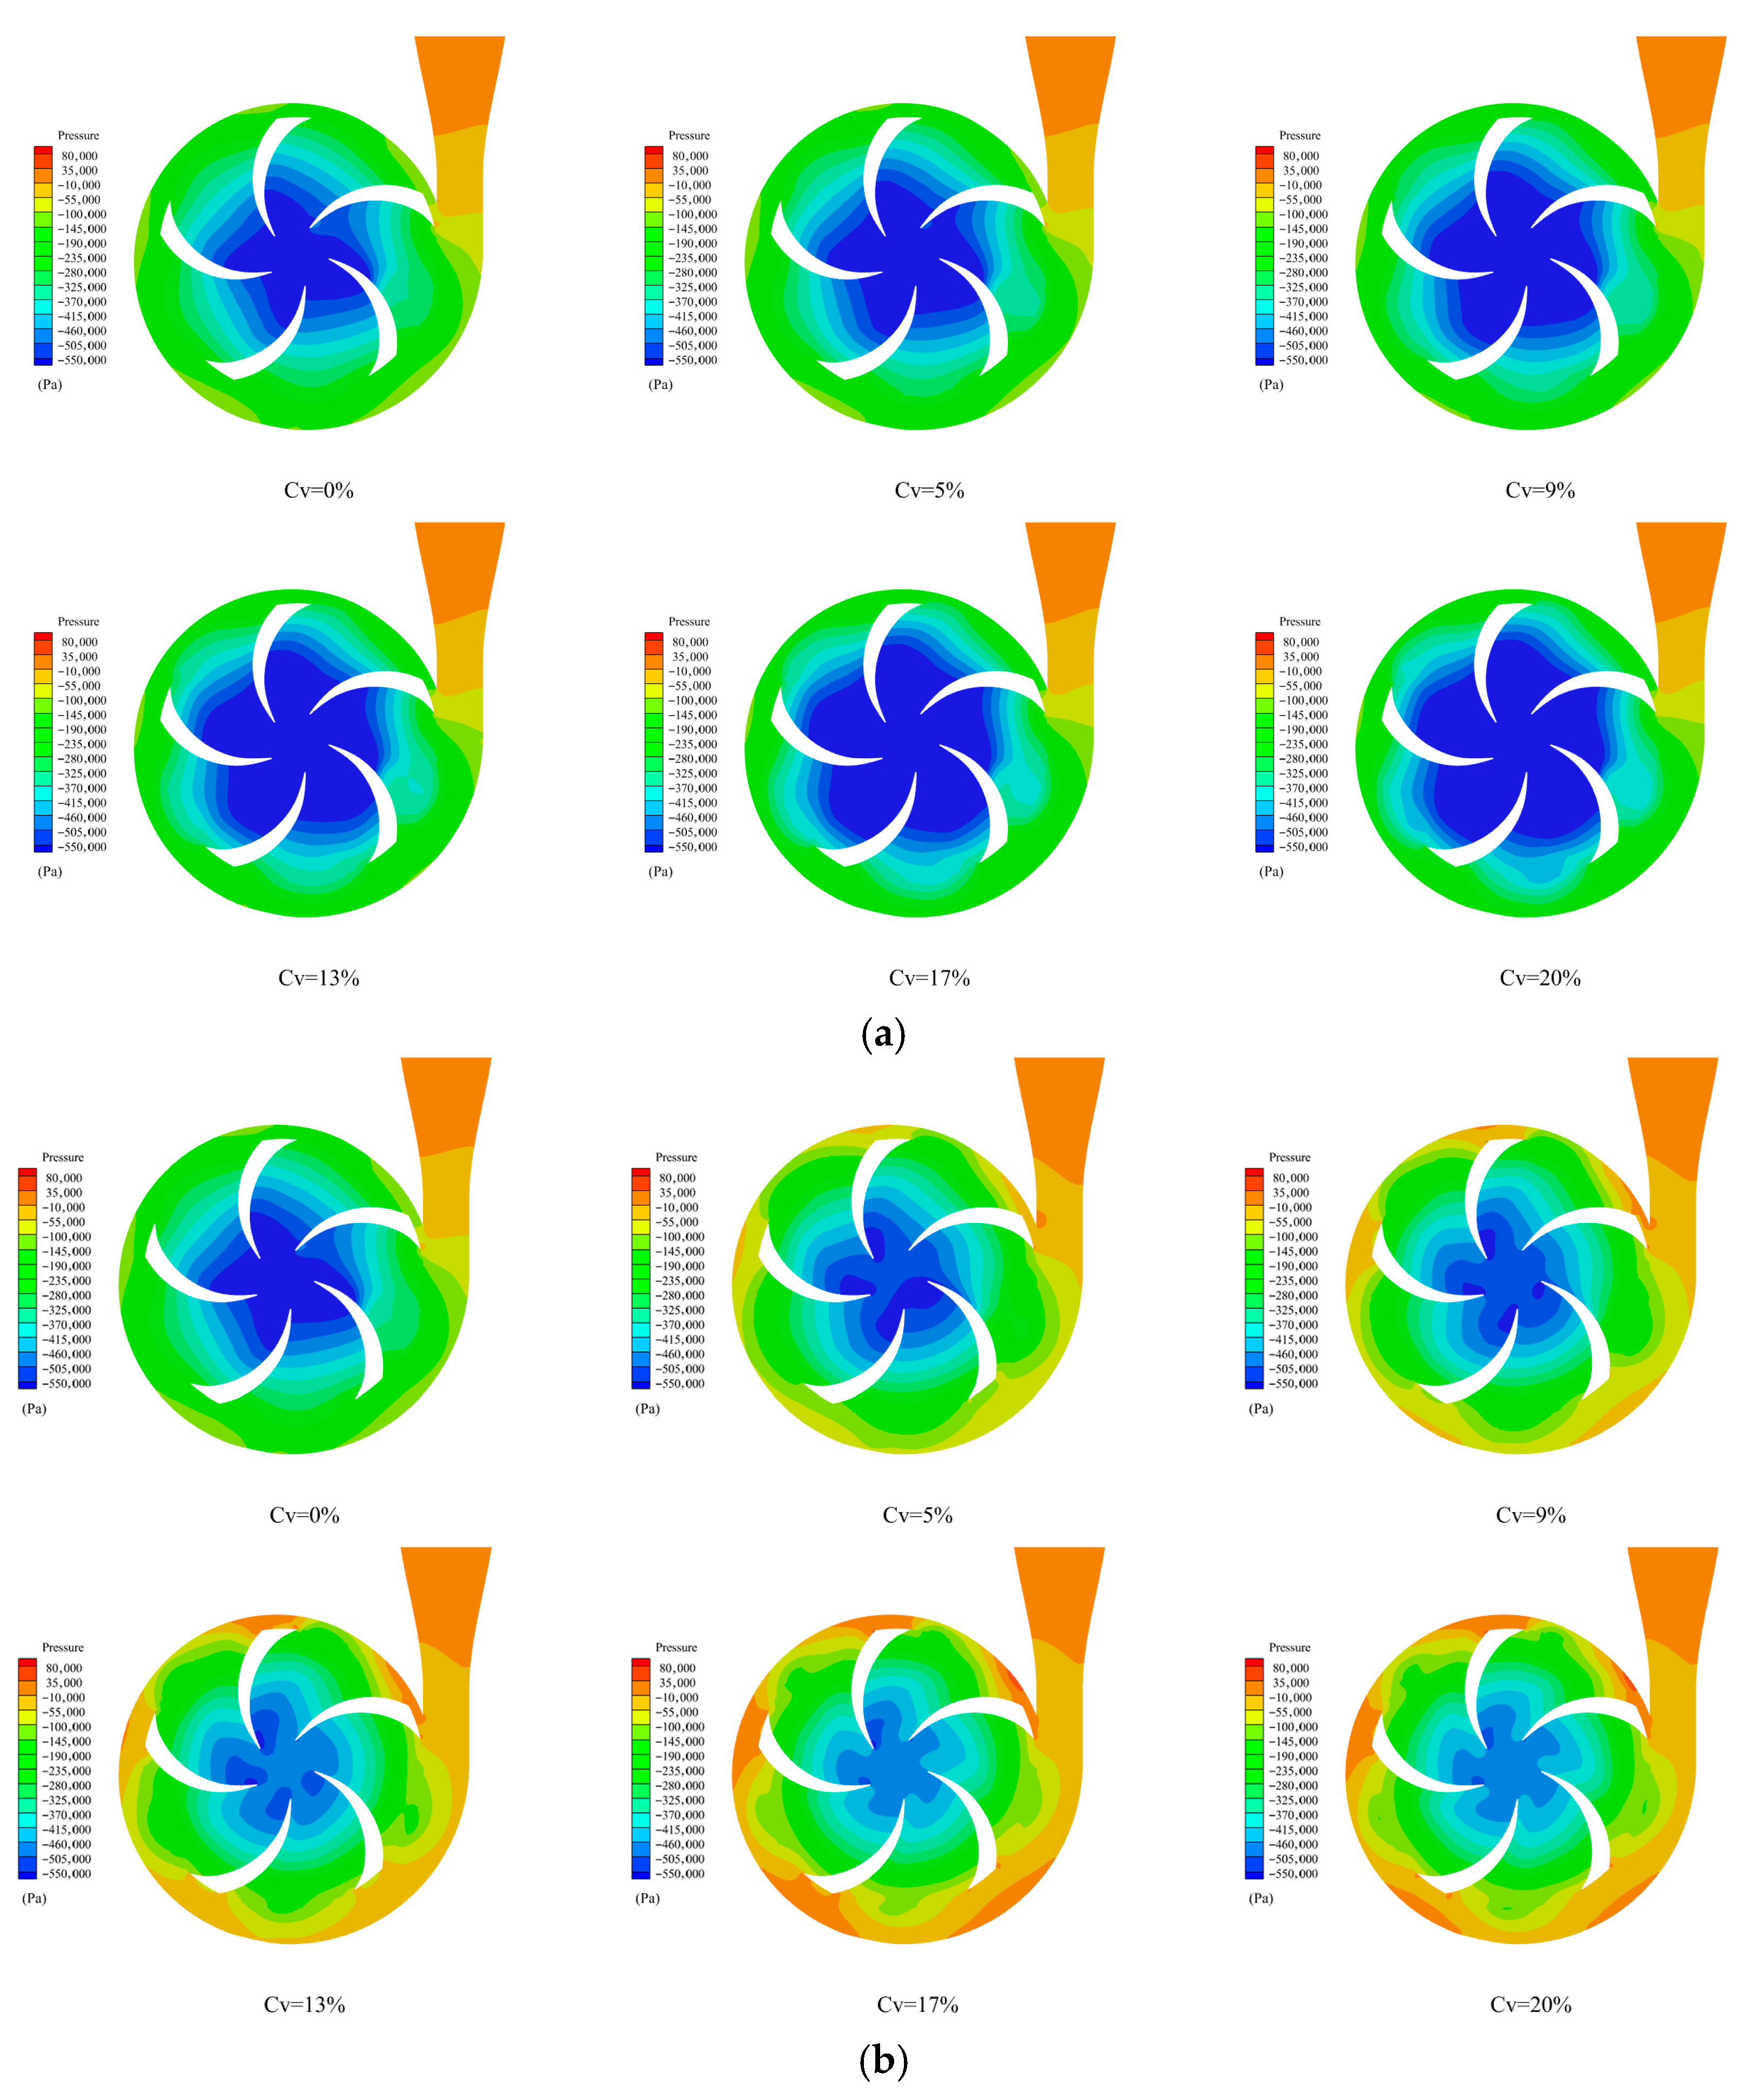
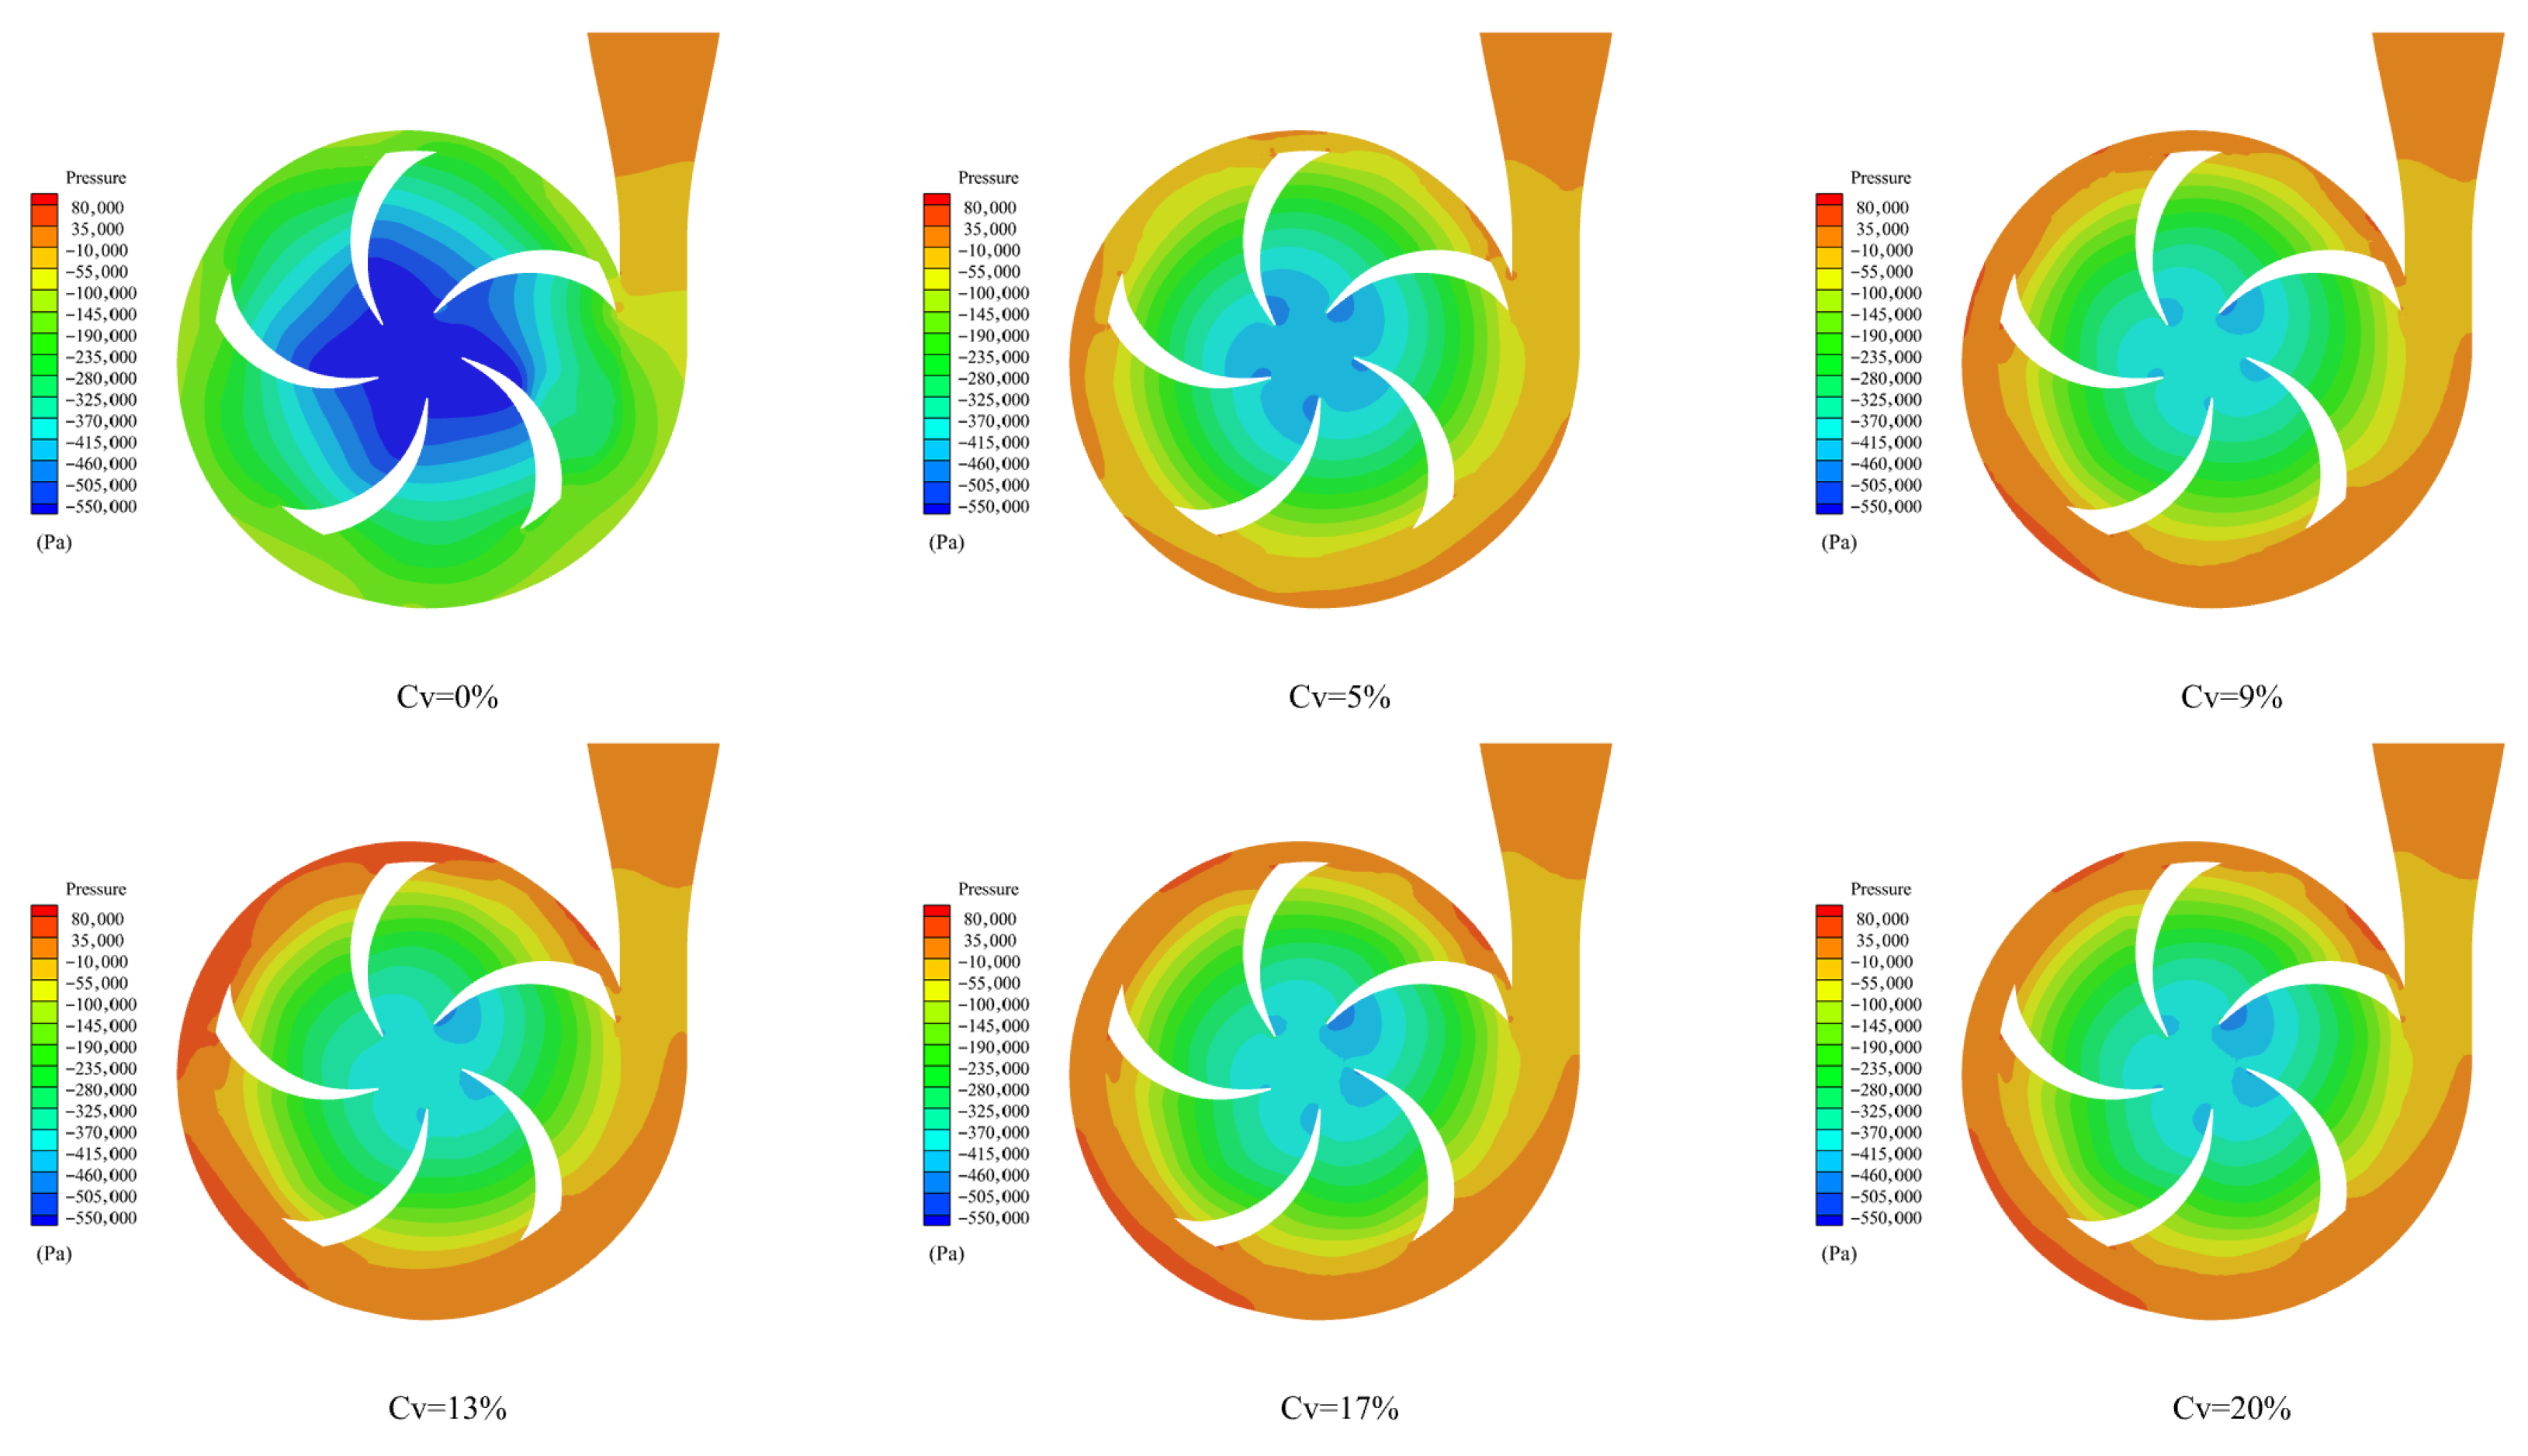
Figure 3, Figure 4 and Figure 5 illustrate the pressure distribution within the centrifugal irrigation pump for 0.05 mm, 0.2 mm, 0.4 mm, 0.6 mm, and 0.8 mm sediment particles at five distinct concentration levels.
Figure 3 demonstrated the progressive deterioration of pressure fields in the centrifugal pump’s impeller–volute passage as Cv increased from 0% to 20%. Under clean water (Cv = 0%), ordered pressure gradients prevailed. For 0.05 mm sediments (Cv ≥ 5%), suction surfaces developed low-pressure zones via flow-separation-induced particle accumulation, while pressure surfaces showed gradient decay from collision/drag coupling. At Cv = 5~9%, perturbations remained localized. Beyond Cv = 13%, accelerated degradation occurred: interconnected low-pressure networks formed with destabilized gradients, marking a transition from discrete to continuous-phase dominance breakdown. For 0.2 mm particles, inertial momentum dissipation exacerbated energy loss, causing distinct pressure distortion (e.g., Cv = 20%) due to amplified drag forces. Both cases exhibited concentration-dependent nonlinear resistance amplification.
Figure 4 revealed progressive pressure deterioration in the impeller–volute passage under increasing sediment concentration (Cv = 0% to 20%). Clean water (Cv = 0%) exhibited radial/axial pressure gradients with smooth color transitions, indicating stable energy transfer. For 0.4~0.6 mm sediments (Cv ≥ 5%), low-pressure zones expanded directionally: at Cv = 5~9%, localized patches formed on suction surfaces/near blades, disrupting uniformity; beyond Cv = 13%, interconnected low-pressure networks permeated impeller/volute passages with destabilized gradients due to inertial momentum obstruction. Compared to smaller particles (0.05~0.2 mm), 0.4 mm and 0.6 mm sediments induced more severe distortion-expanding low-pressure coverage by 37% and 32%, and steepening gradients by 41% at equivalent Cv via amplified drag/collision effects that exacerbated flow separation, confirming their dominant disturbance mechanism.
Figure 5 revealed orderly pressure gradients under clean water (Cv = 0%). Introducing 0.8 mm sediment (Cv ≥ 5%) expanded low-pressure zones locally at Cv = 5~9%, then permeated impeller/volute beyond Cv = 13%, collapsing coherence. Compared to smaller particles, 0.8 mm sediments caused >40% wider low-pressure coverage and heightened non-uniformity via amplified drag/collision, confirming synergistic effects.

3.1.2. Variation Characteristics of Volume Concentration

Figure 6 presents the pressure evolution curves on both pressure and suction sides versus increasing volumetric sediment concentration under the influence of five different particle sizes.
Figure 6a–d consistently demonstrated monotonic pressure decay on both suction and pressure surfaces as Cv increased. Suction-side pressure persistently registered lower values due to amplified flow separation via particle interactions, while pressure surfaces exhibited abrupt energy loss from collisions despite mainstream momentum buffering. This revealed differential wall-response mechanisms across impeller passages.
For larger sediments (0.4~0.8 mm), suction-side separation intensified, accelerating energy dissipation. Pressure surfaces maintained higher initial pressure but suffered significant attenuation from particle collisions, driving continuous escalation in curve slope magnitude (>40% gradient steepening at Cv ≥ 13%). These effects confirmed concentration-dependent nonlinear deterioration, particularly under inertial dominance of coarse particles.

3.1.3. Discussion

The simulation results revealed a dual critical effect arising from the synergistic interaction of particle size and concentration: (1) Critical particle size effect: When the sediment particle size dp ≥ 0.4 mm, the pressure field undergoes a qualitative change, shifting from “local disturbance” to “global disorder”, with the flow resistance effect being significantly enhanced. (2) Critical concentration effect: Cv ≥ 13% forms a key threshold; beyond this concentration, the pressure drop rate accelerates noticeably, and the particle phase behavior transitions from being dominated by “discrete phase disturbance” to “systematic weakening” of the continuous phase flow field.

3.2. Velocity Characteristics Analysis

3.2.1. Different Sediment Particle Size

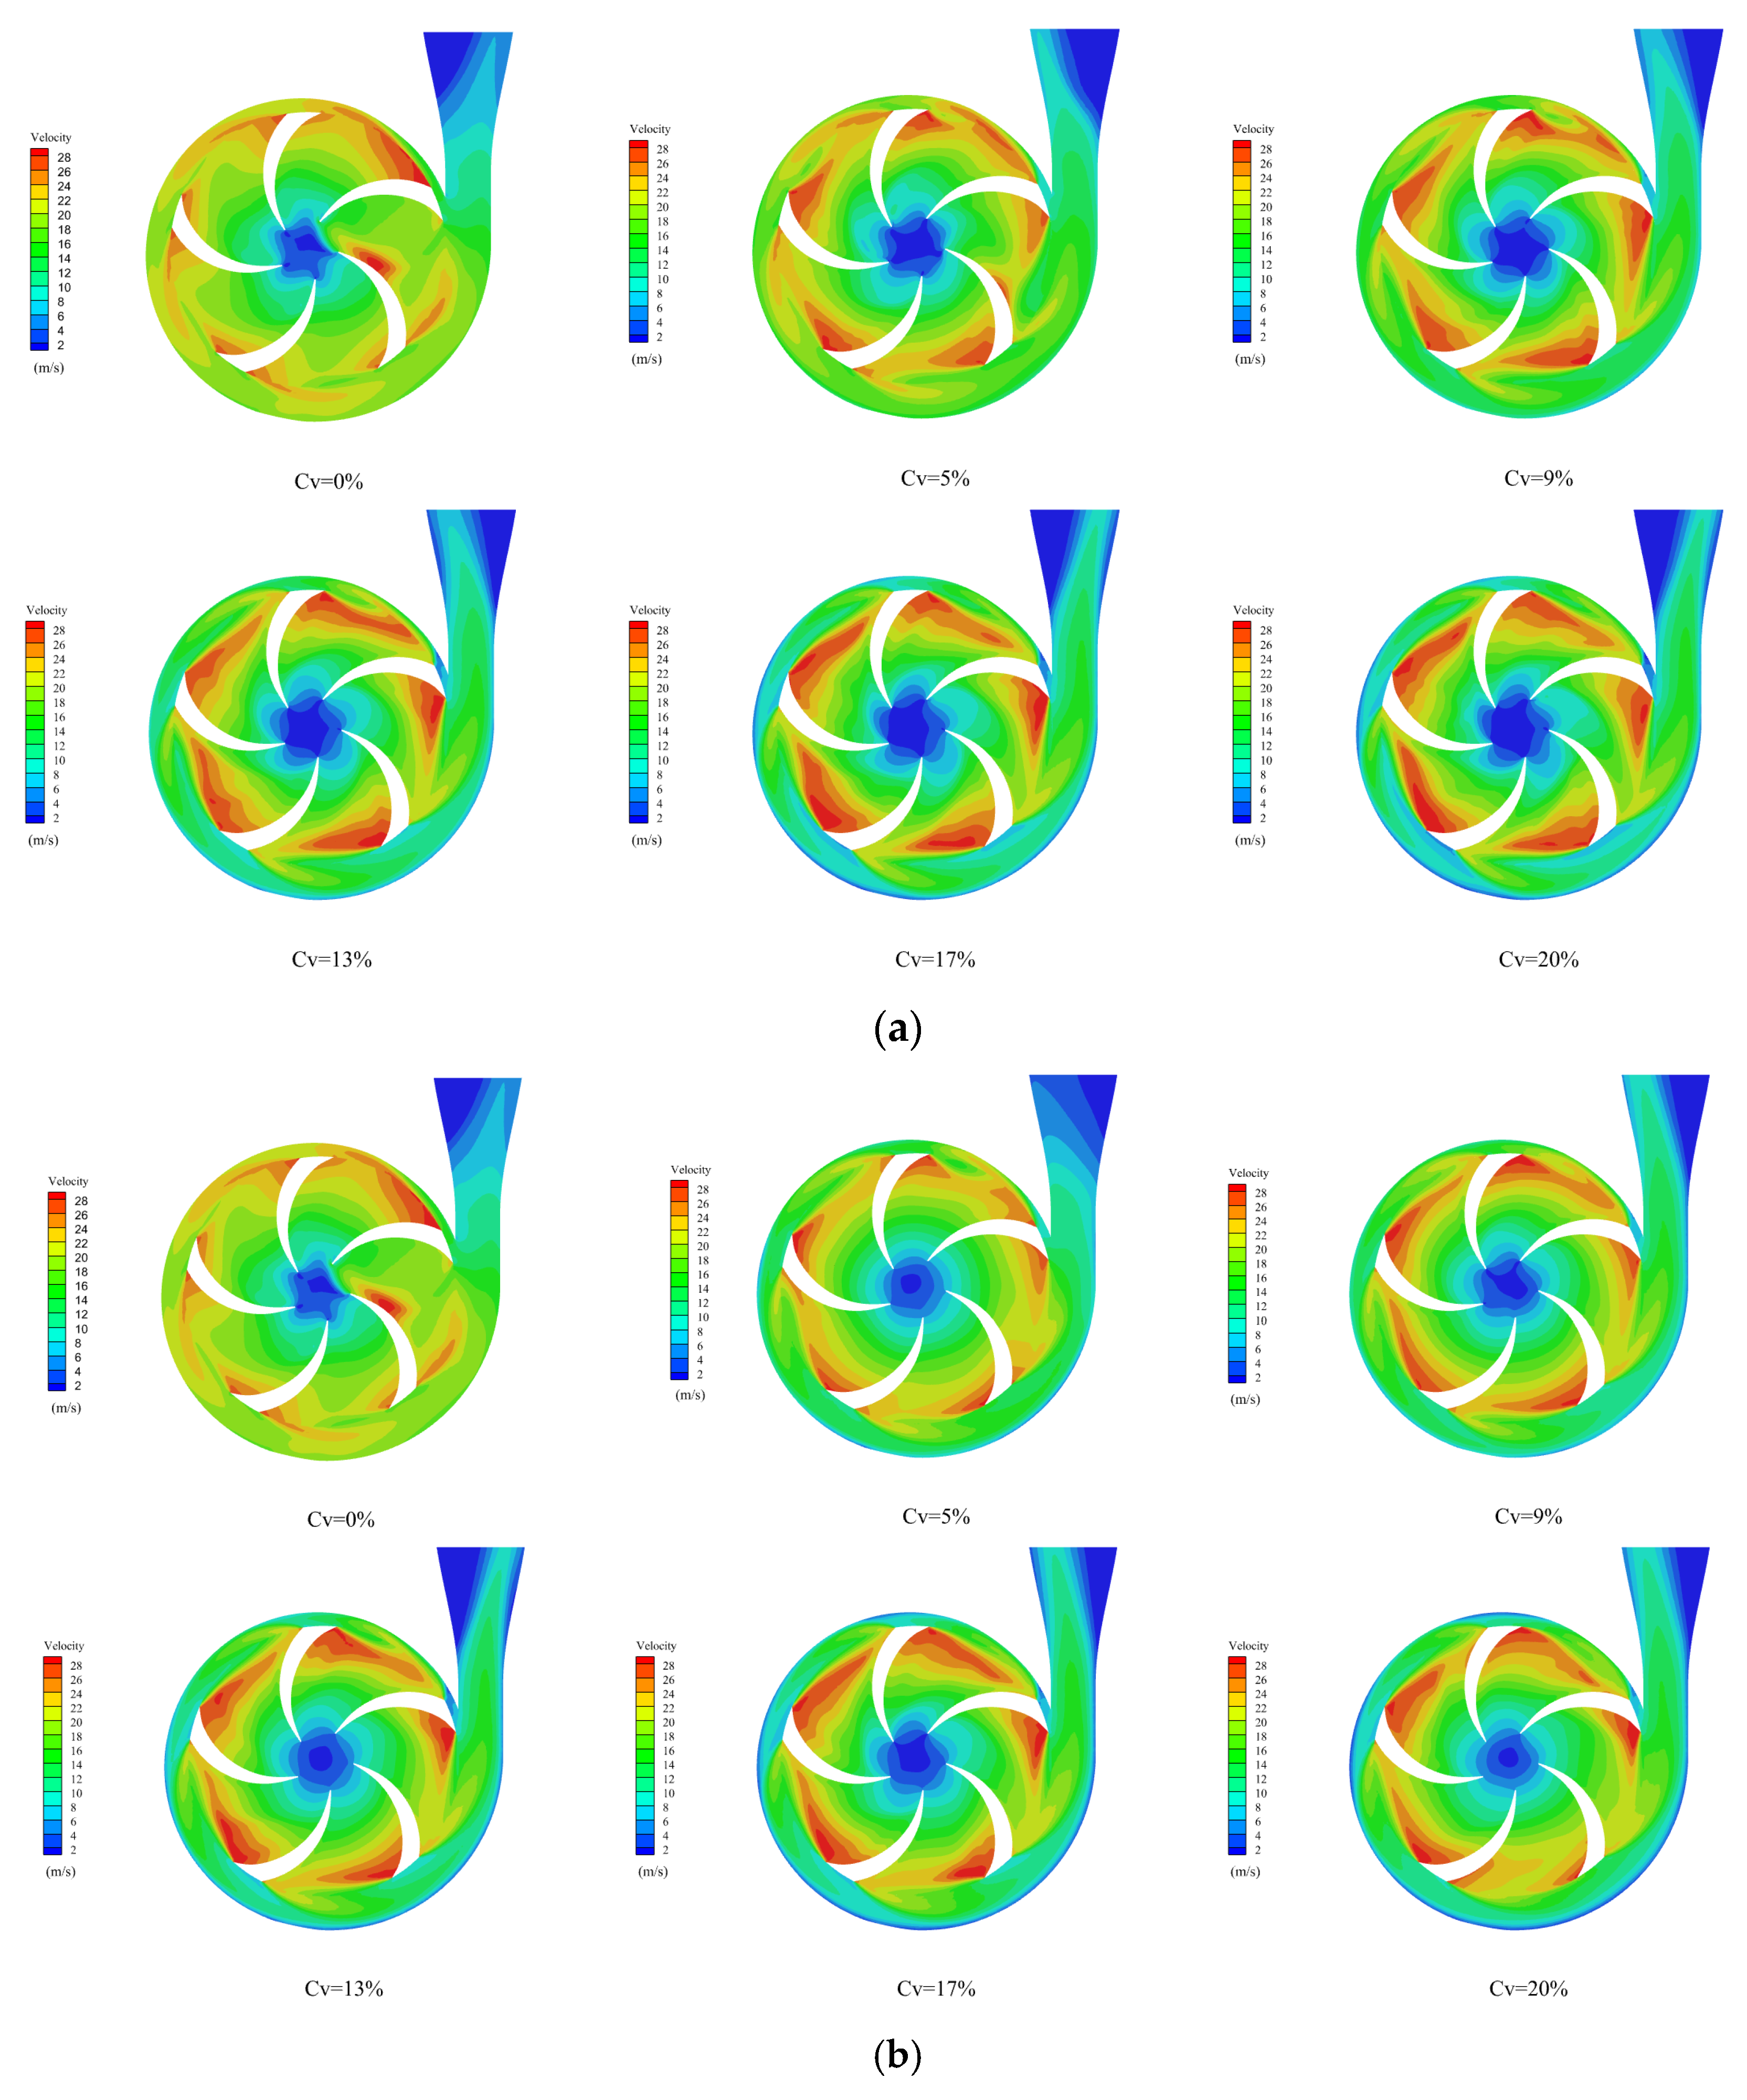
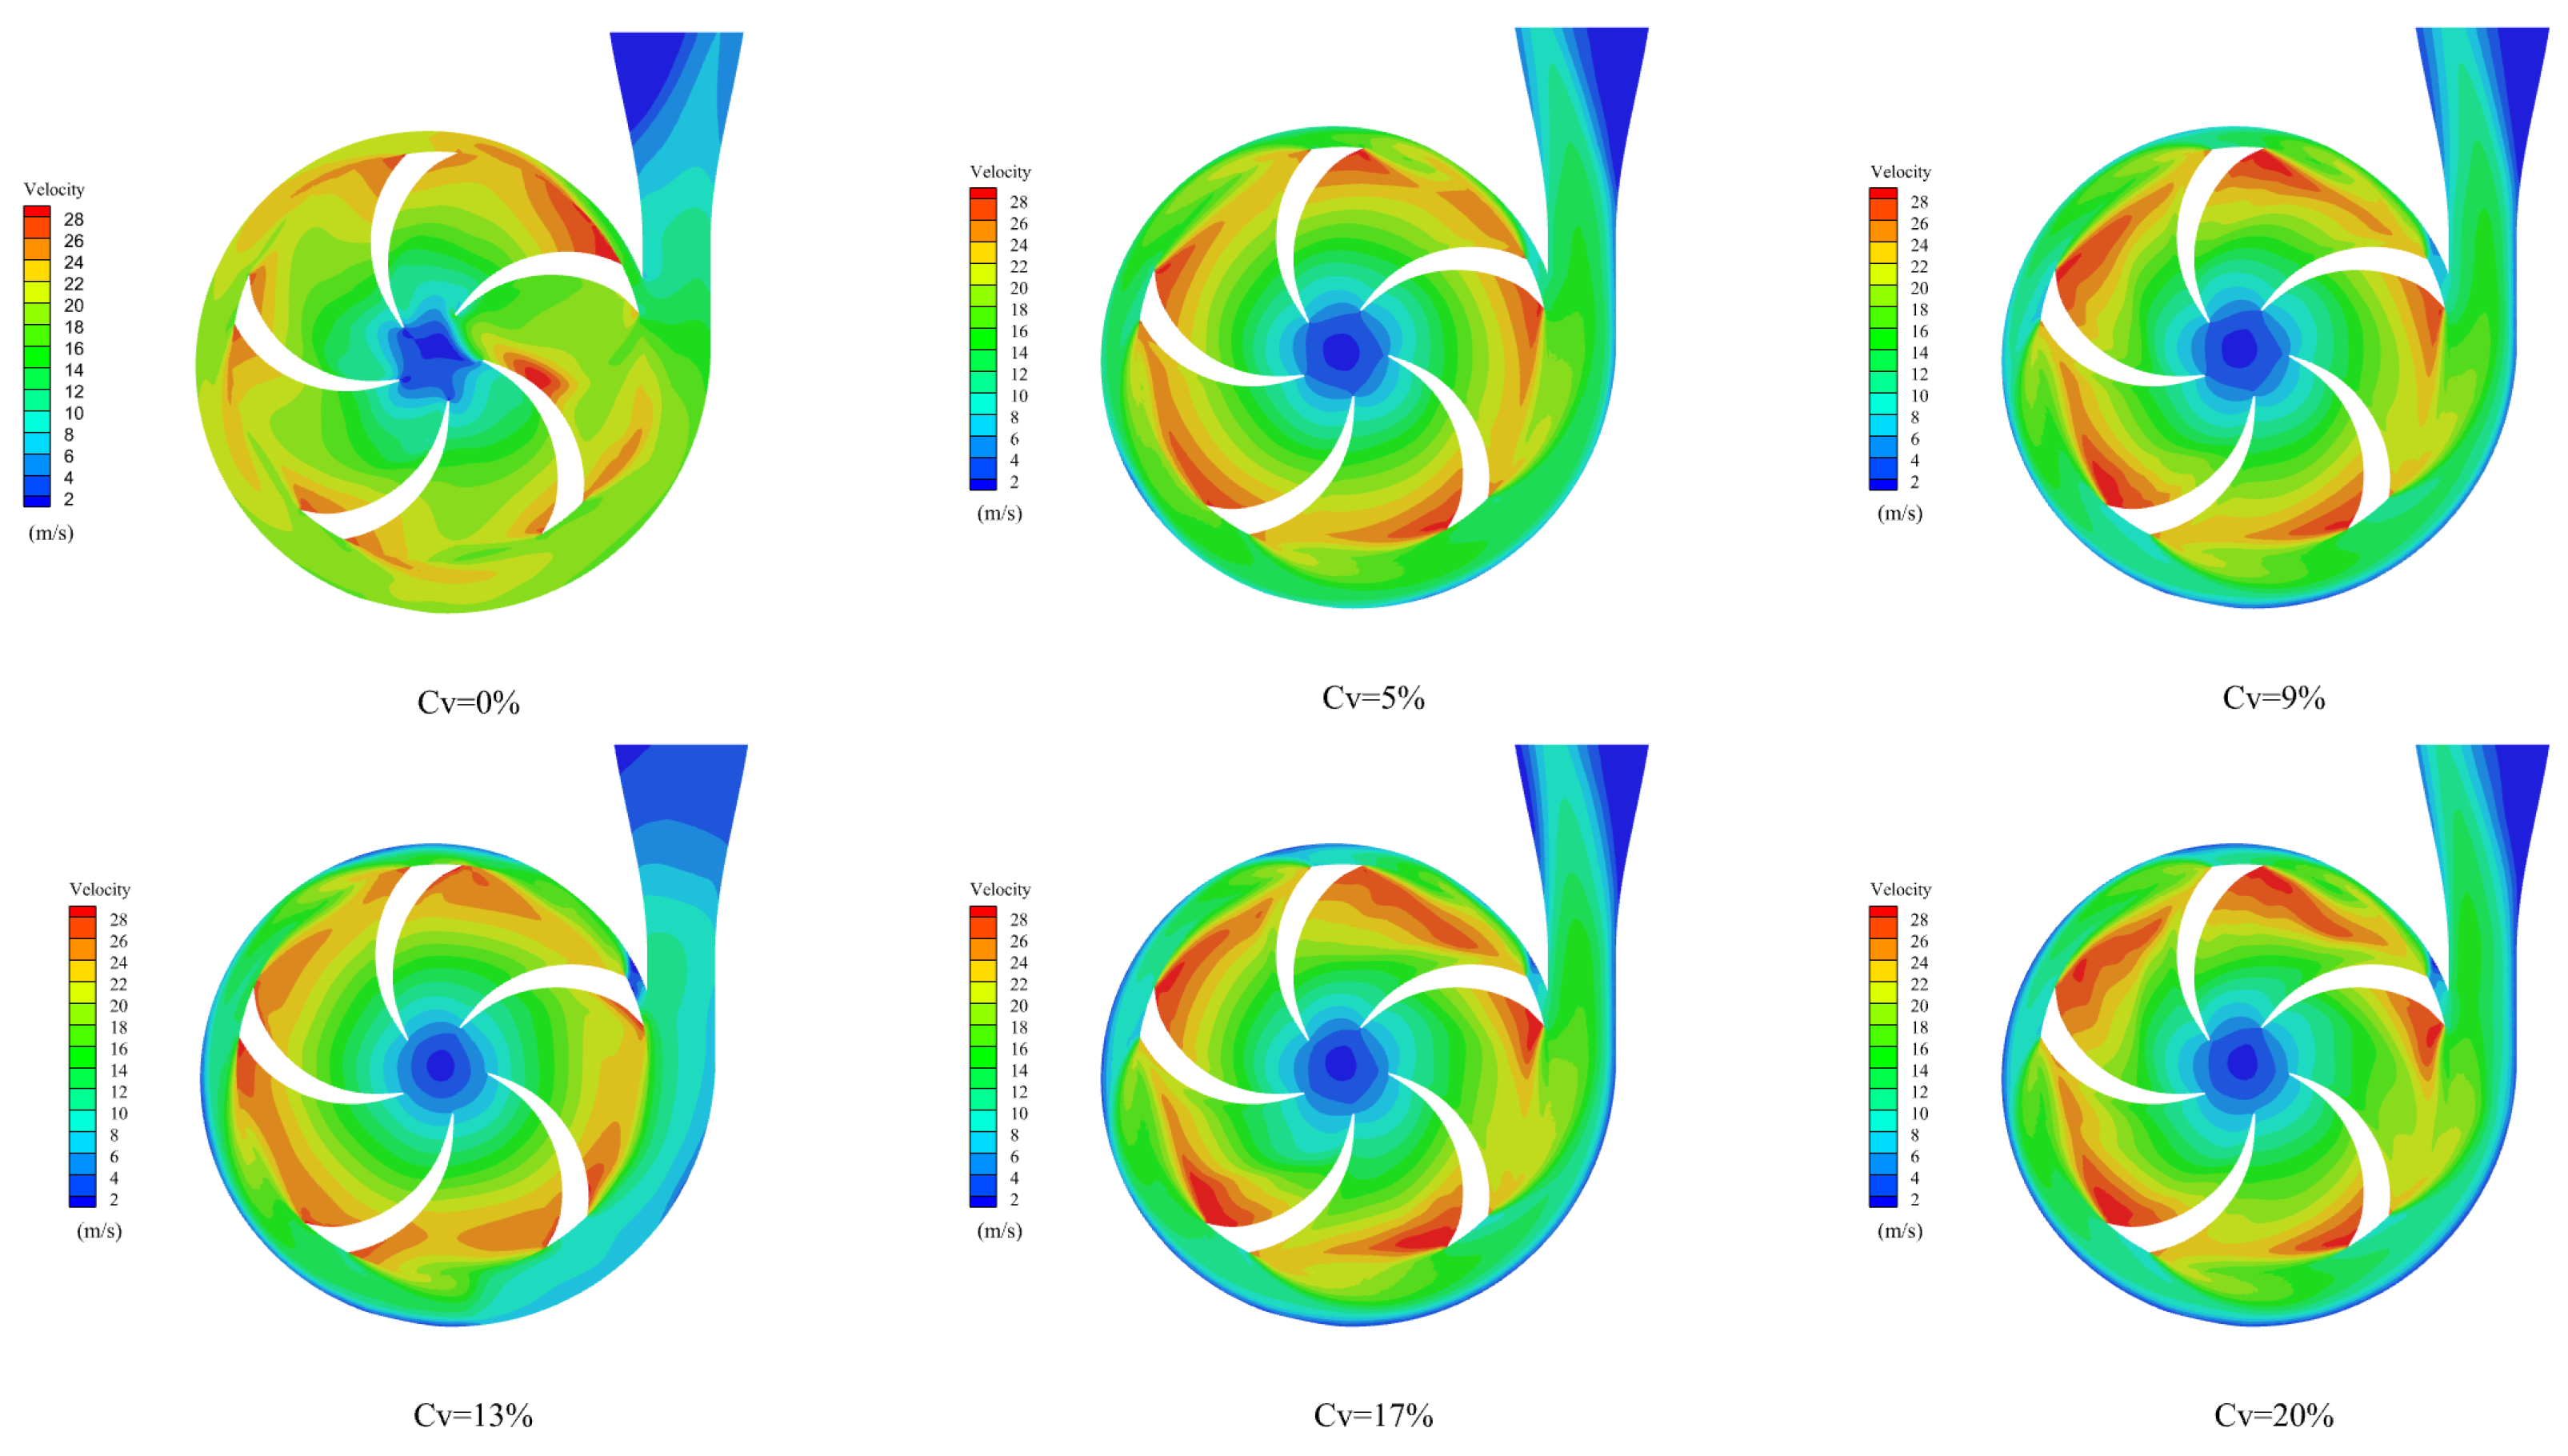
When the sediment particle sizes are 0.05 mm, 0.2 mm, 0.4 mm, 0.6 mm, and 0.8 mm, Figure 7, Figure 8 and Figure 9 present the velocity distribution characteristics inside the centrifugal irrigation pump under five groups of different concentration conditions.
Figure 7 revealed the velocity field evolution under increasing Cv. For 0.05 mm sediments, clear water (Cv = 0%) showed symmetric “center-low to periphery-high” gradients. At Cv = 5~9%, slightly high-speed serrations and low-speed expansions occurred with minimal disruption due to strong flow-following properties. Beyond Cv = 13%, fragmentation intensified, but gradual disorder prevailed without abrupt breaks. For 0.2 mm particles at Cv ≥ 13%, accumulated particles drove global disorder via drag/collision dissipation, though velocity continuity persisted due to size limitations.
Figure 8 revealed distinct velocity deterioration for 0.4~0.6 mm sediments under increasing Cv. At low concentrations (Cv = 5~9%), both particle sizes intensified high-speed serrations and expanded low-speed zones near suction surfaces, with 0.6 mm particles causing stronger non-uniformity due to inertial deviation from streamlines. Beyond Cv = 13%, 0.4 mm sediments induced abrupt high-/low-speed transitions with no intermediate zones through strong drag/collision dissipation, while 0.6 mm particles triggered severe fragmentation, low-speed dominance, and reverse flows via “accumulation-blockage-secondary flow” chain reactions. Both cases evolved flow fields from localized to global disorder, with coarse particles exhibiting more extreme chaotic restructuring.
Figure 9 revealed severe velocity deterioration under 0.8 mm sediment loading. At Cv = 5~9%, high-speed zones developed extreme serration while low-speed zones expanded rapidly into channel centers due to inertial deviation from streamlines, creating localized “velocity break zones”. Beyond Cv = 13%, high-speed fragmentation intensified, low-speed dominance prevailed, and significant reverse flows emerged via “congestion–blockage–reverse flow” chain reactions, evolving the field to global chaotic counterflow.

3.2.2. Velocity Variation Characteristics

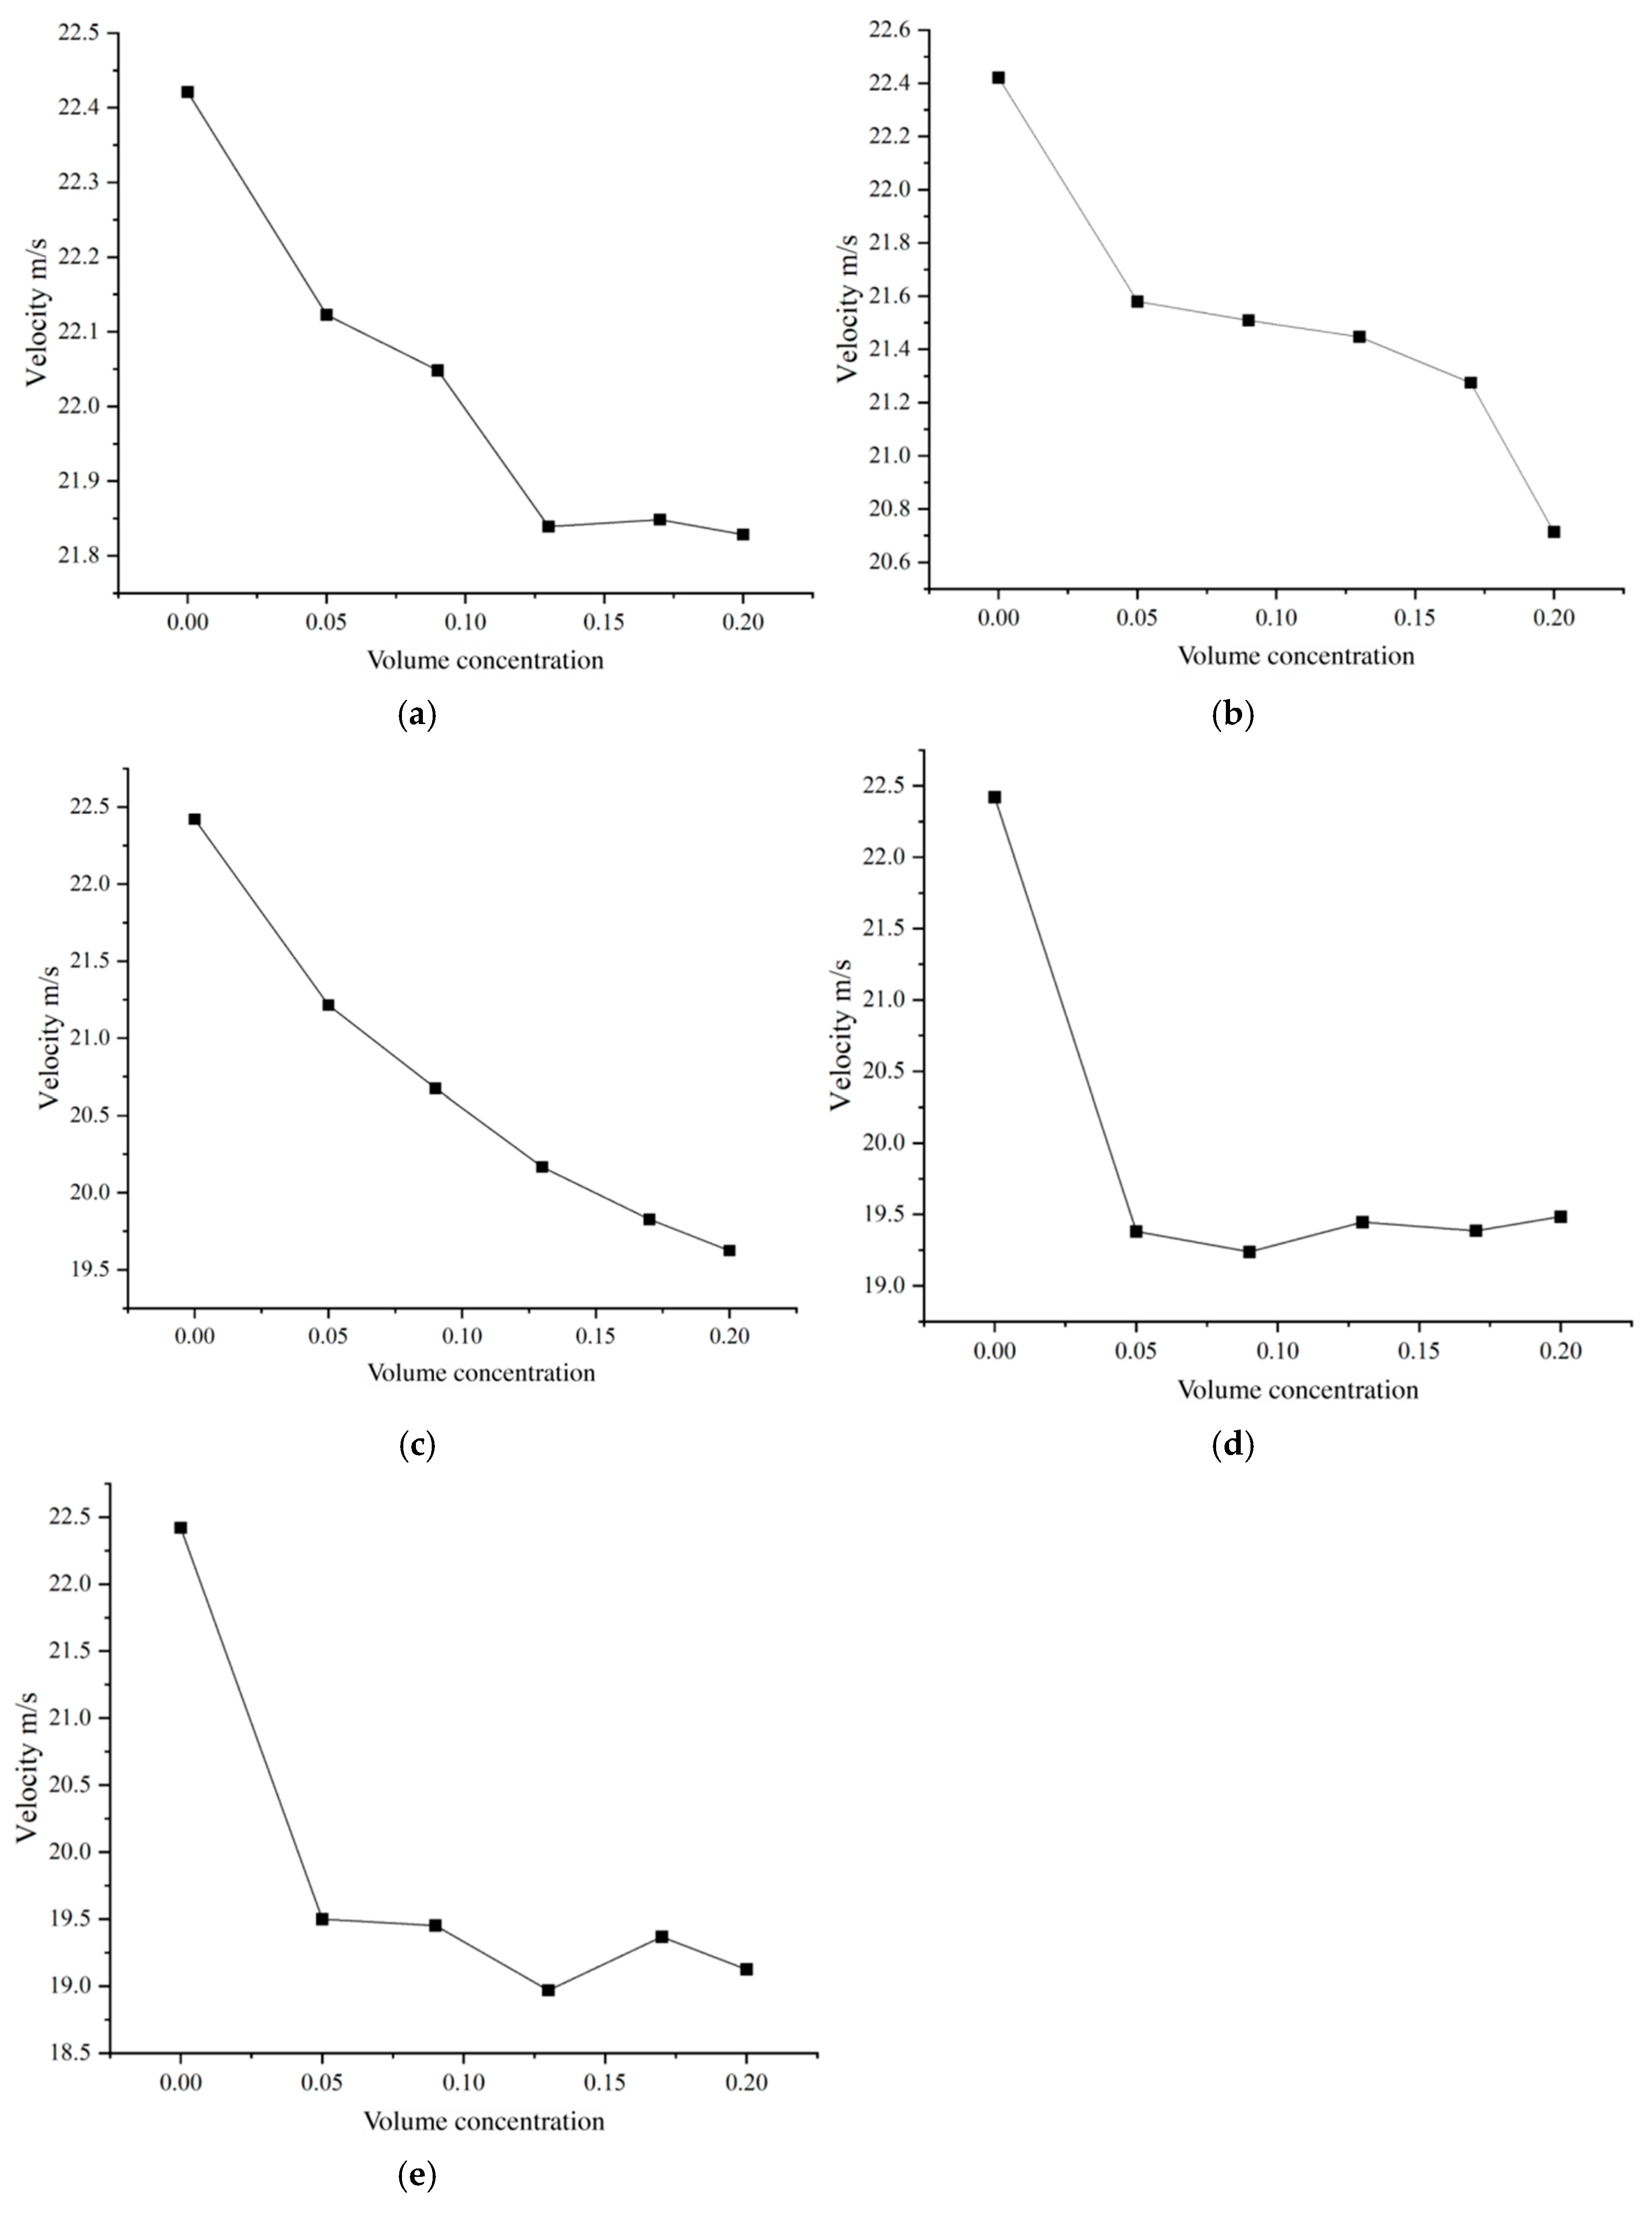
Figure 10 presents the curve of velocity variation in the centrifugal irrigation pump with volumetric concentration.
Figure 10a–d demonstrated universal monotonic velocity decay with increasing Cv, driven by particle-induced fluid momentum depletion. For fine sediments (0.05~0.2 mm), two-phase decay emerged: rapid decline at Cv ≤ 10% (e.g., 22.4 to 21.5 m/s for 0.2 mm) from discrete drag/collision interference, followed by gentle decay at Cv ≥ 13% due to “quasi-continuous phase” viscosity and resistance saturation. Fine particles’ weak inertia enabled flow-following but caused cumulative microscale dissipation, inducing quantitative-to-qualitative degradation.
Coarse sediments (0.4~0.8 mm) exhibited nonlinear deterioration: 0.4 mm induced >30% steeper decay (22.4 to 19.6 m/s) via particle-channel narrowing feedback; 0.6~0.8 mm triggered “cliff-like drops” (e.g., 22.4 to 19.4 m/s at Cv ≤ 5%) from impact-dominated momentum collapse. Beyond Cv = 10%, fluctuating decay occurred (19.0~19.5 m/s oscillations) as “rigid clumps” caused dynamic blockage–fragmentation cycles with reverse flows, confirming critical-size-exceeding mechanistic mutations.

3.2.3. Discussion

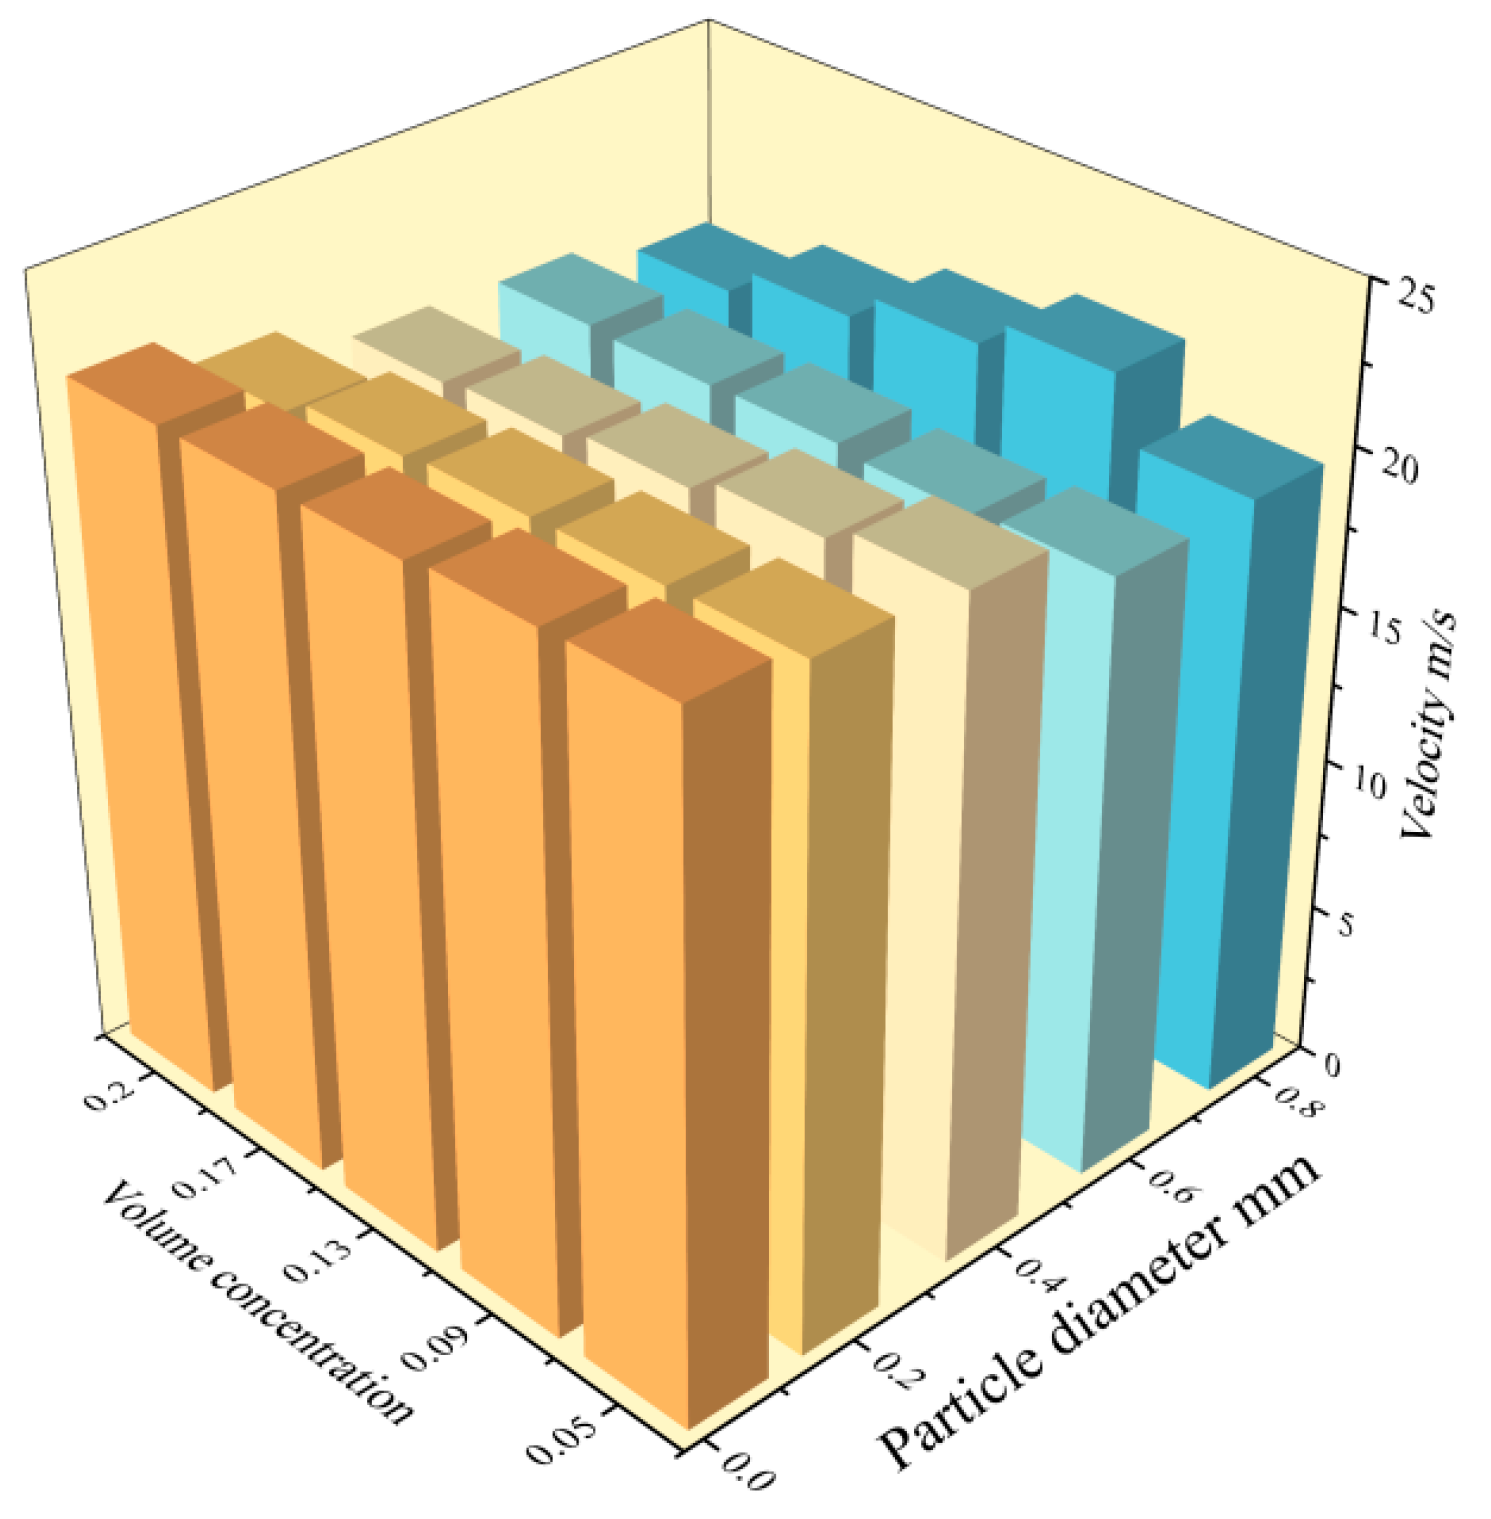
Figure 11 shows the velocity comparison in the centrifugal irrigation pump under the combined influence of different particle sizes and volume concentrations.
Figure 11 shown three traits under combined particle size and Cv effects: (1) Common trend: As Cv rises from 0%, velocity fields grow disordered-clear water (Cv = 0%) has regular gradients; low Cv (≤9%) disturbs large particles (e.g., 0.8 mm) more; high Cv (≥13%) disorders all, with large particles (≥0.4 mm) causing backflow and nonlinear energy loss. (2) Size differentiation: Small particles (≤0.2 mm) show delayed changes, with “fast-then-slow” decay. Medium (0.4 mm), a critical size, decays steeply via inertia and blockage. Large (≥0.6 mm) particles cause “cliff-like decay and fluctuations” due to rigid clumps and backflow. (3) Staged decay: Low Cv (≤10%) shows steeper decay with larger particles via inertial impacts. High Cv (≥13%) shows small particles (resistance saturation) but fluctuates large ones via “blockage–fragmentation–reblockage” cycles.

3.3. TKE

3.3.1. Different Sediment Particle Size

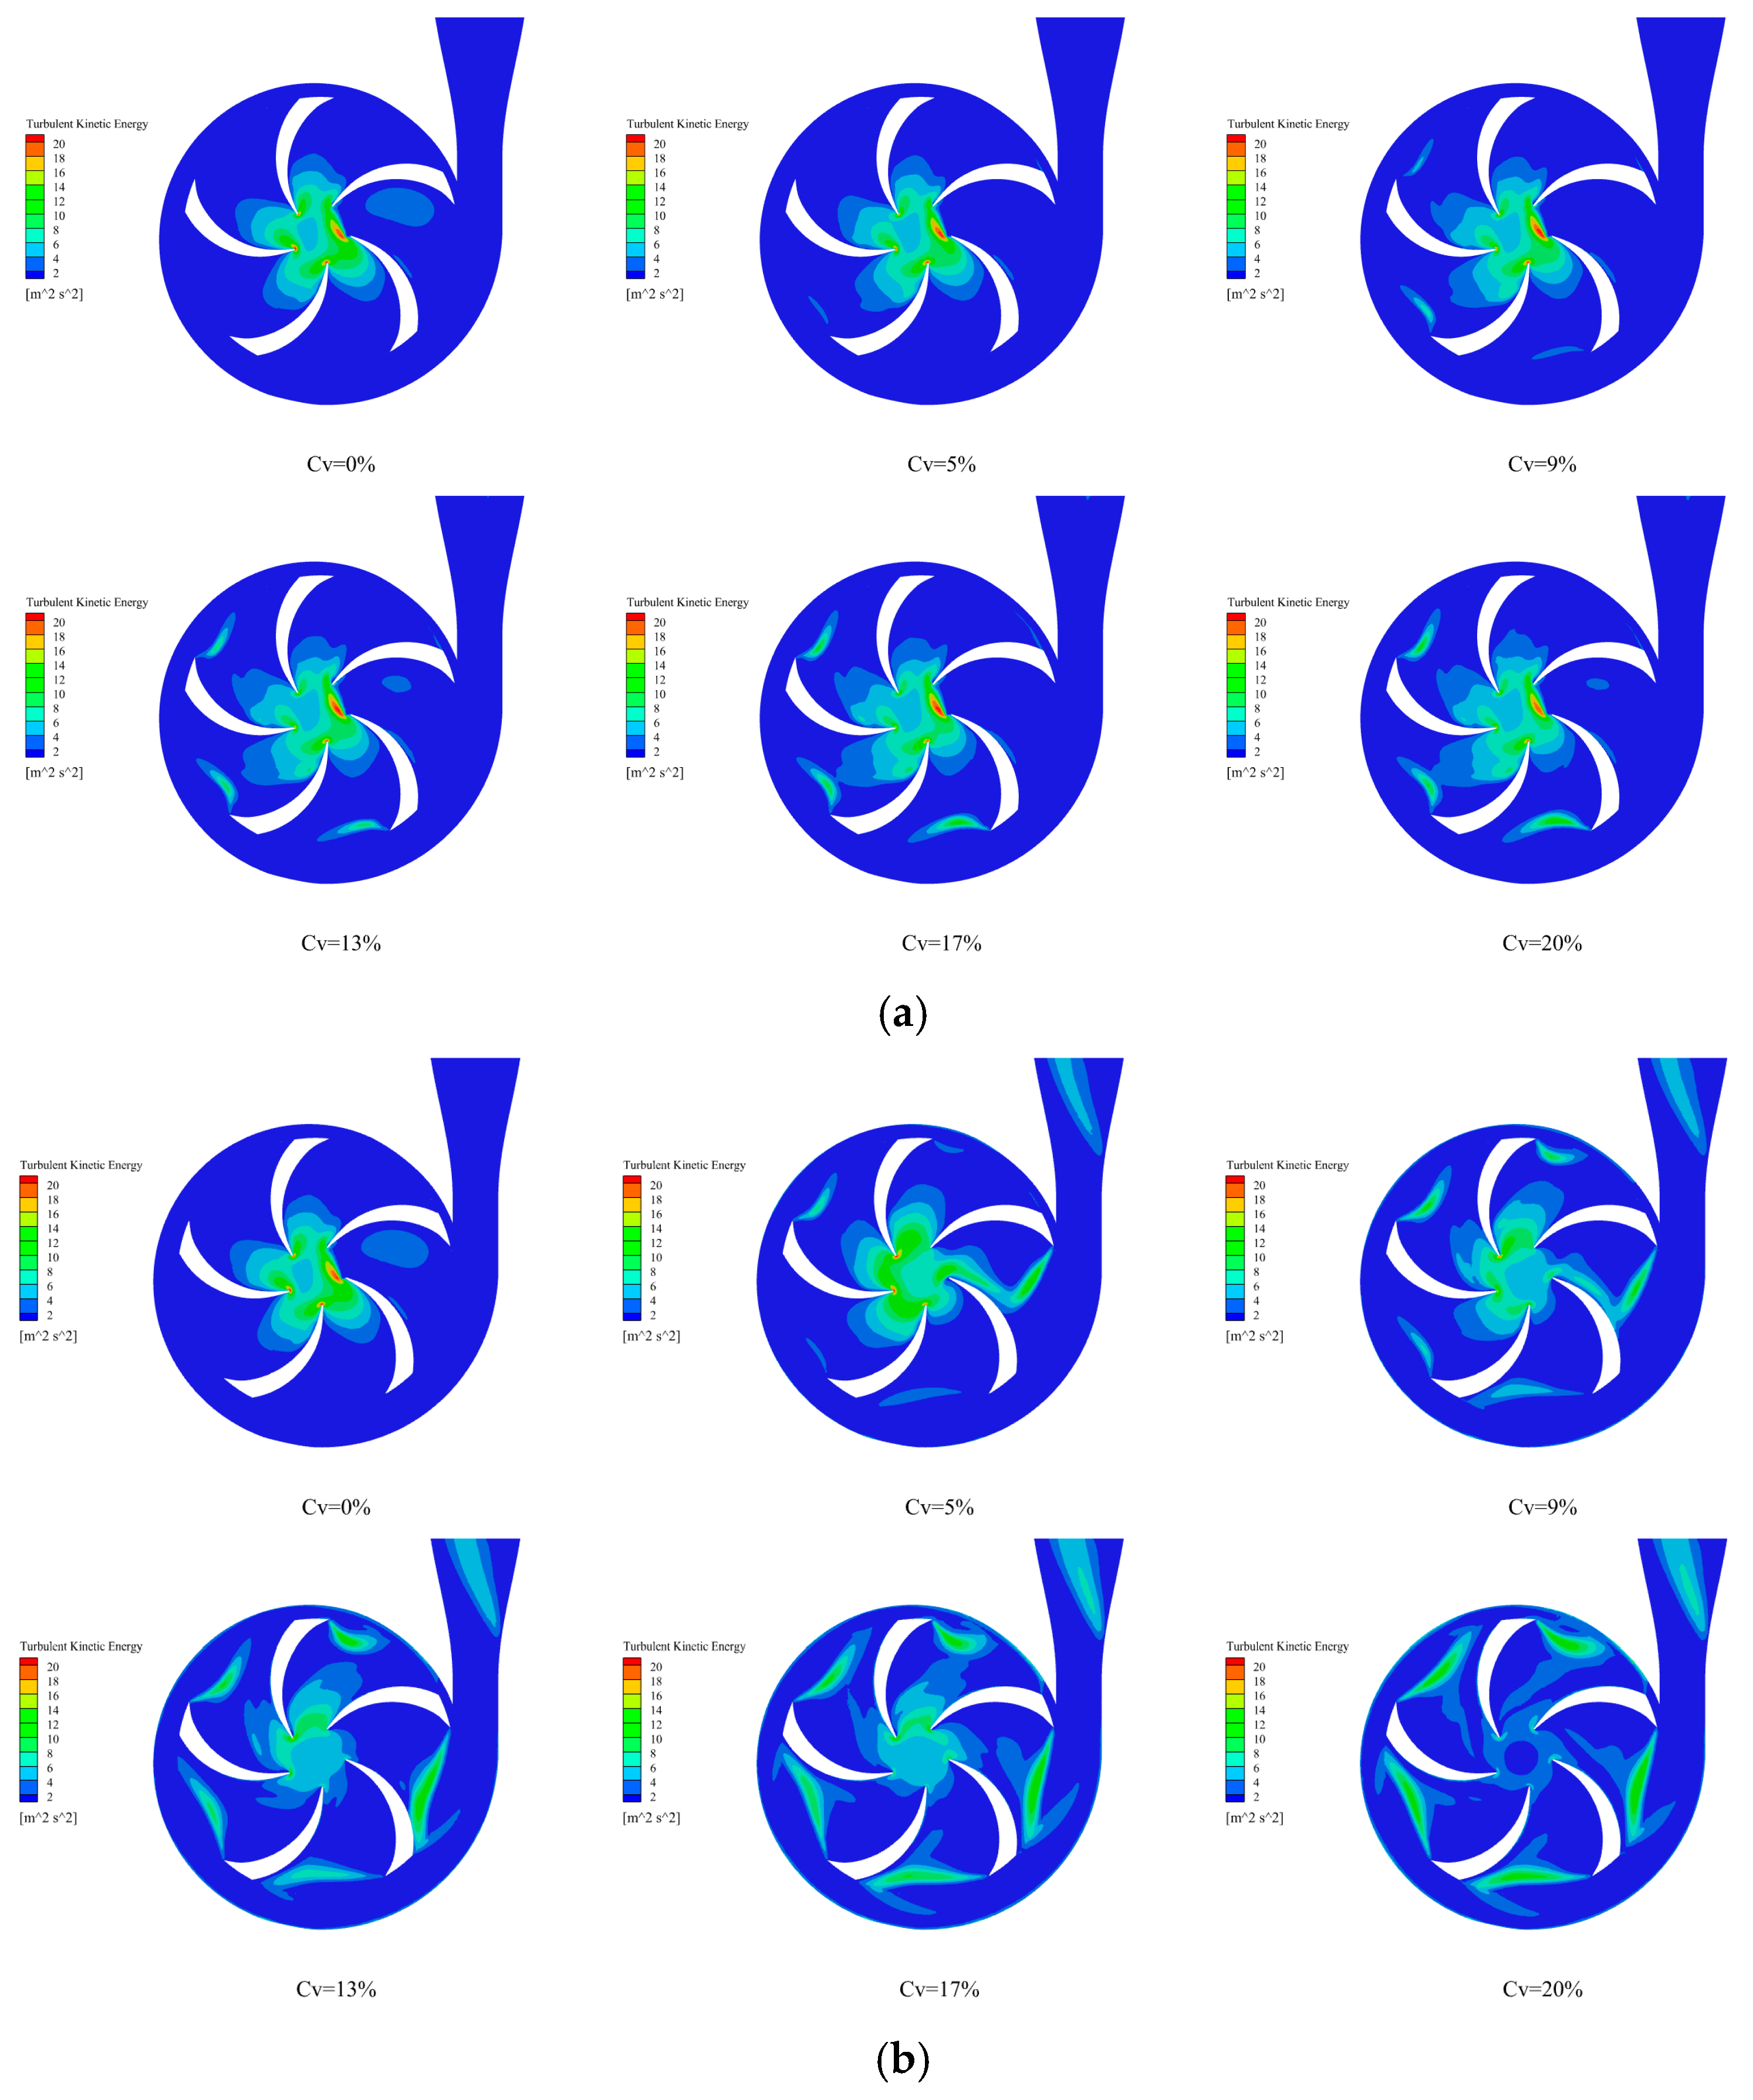
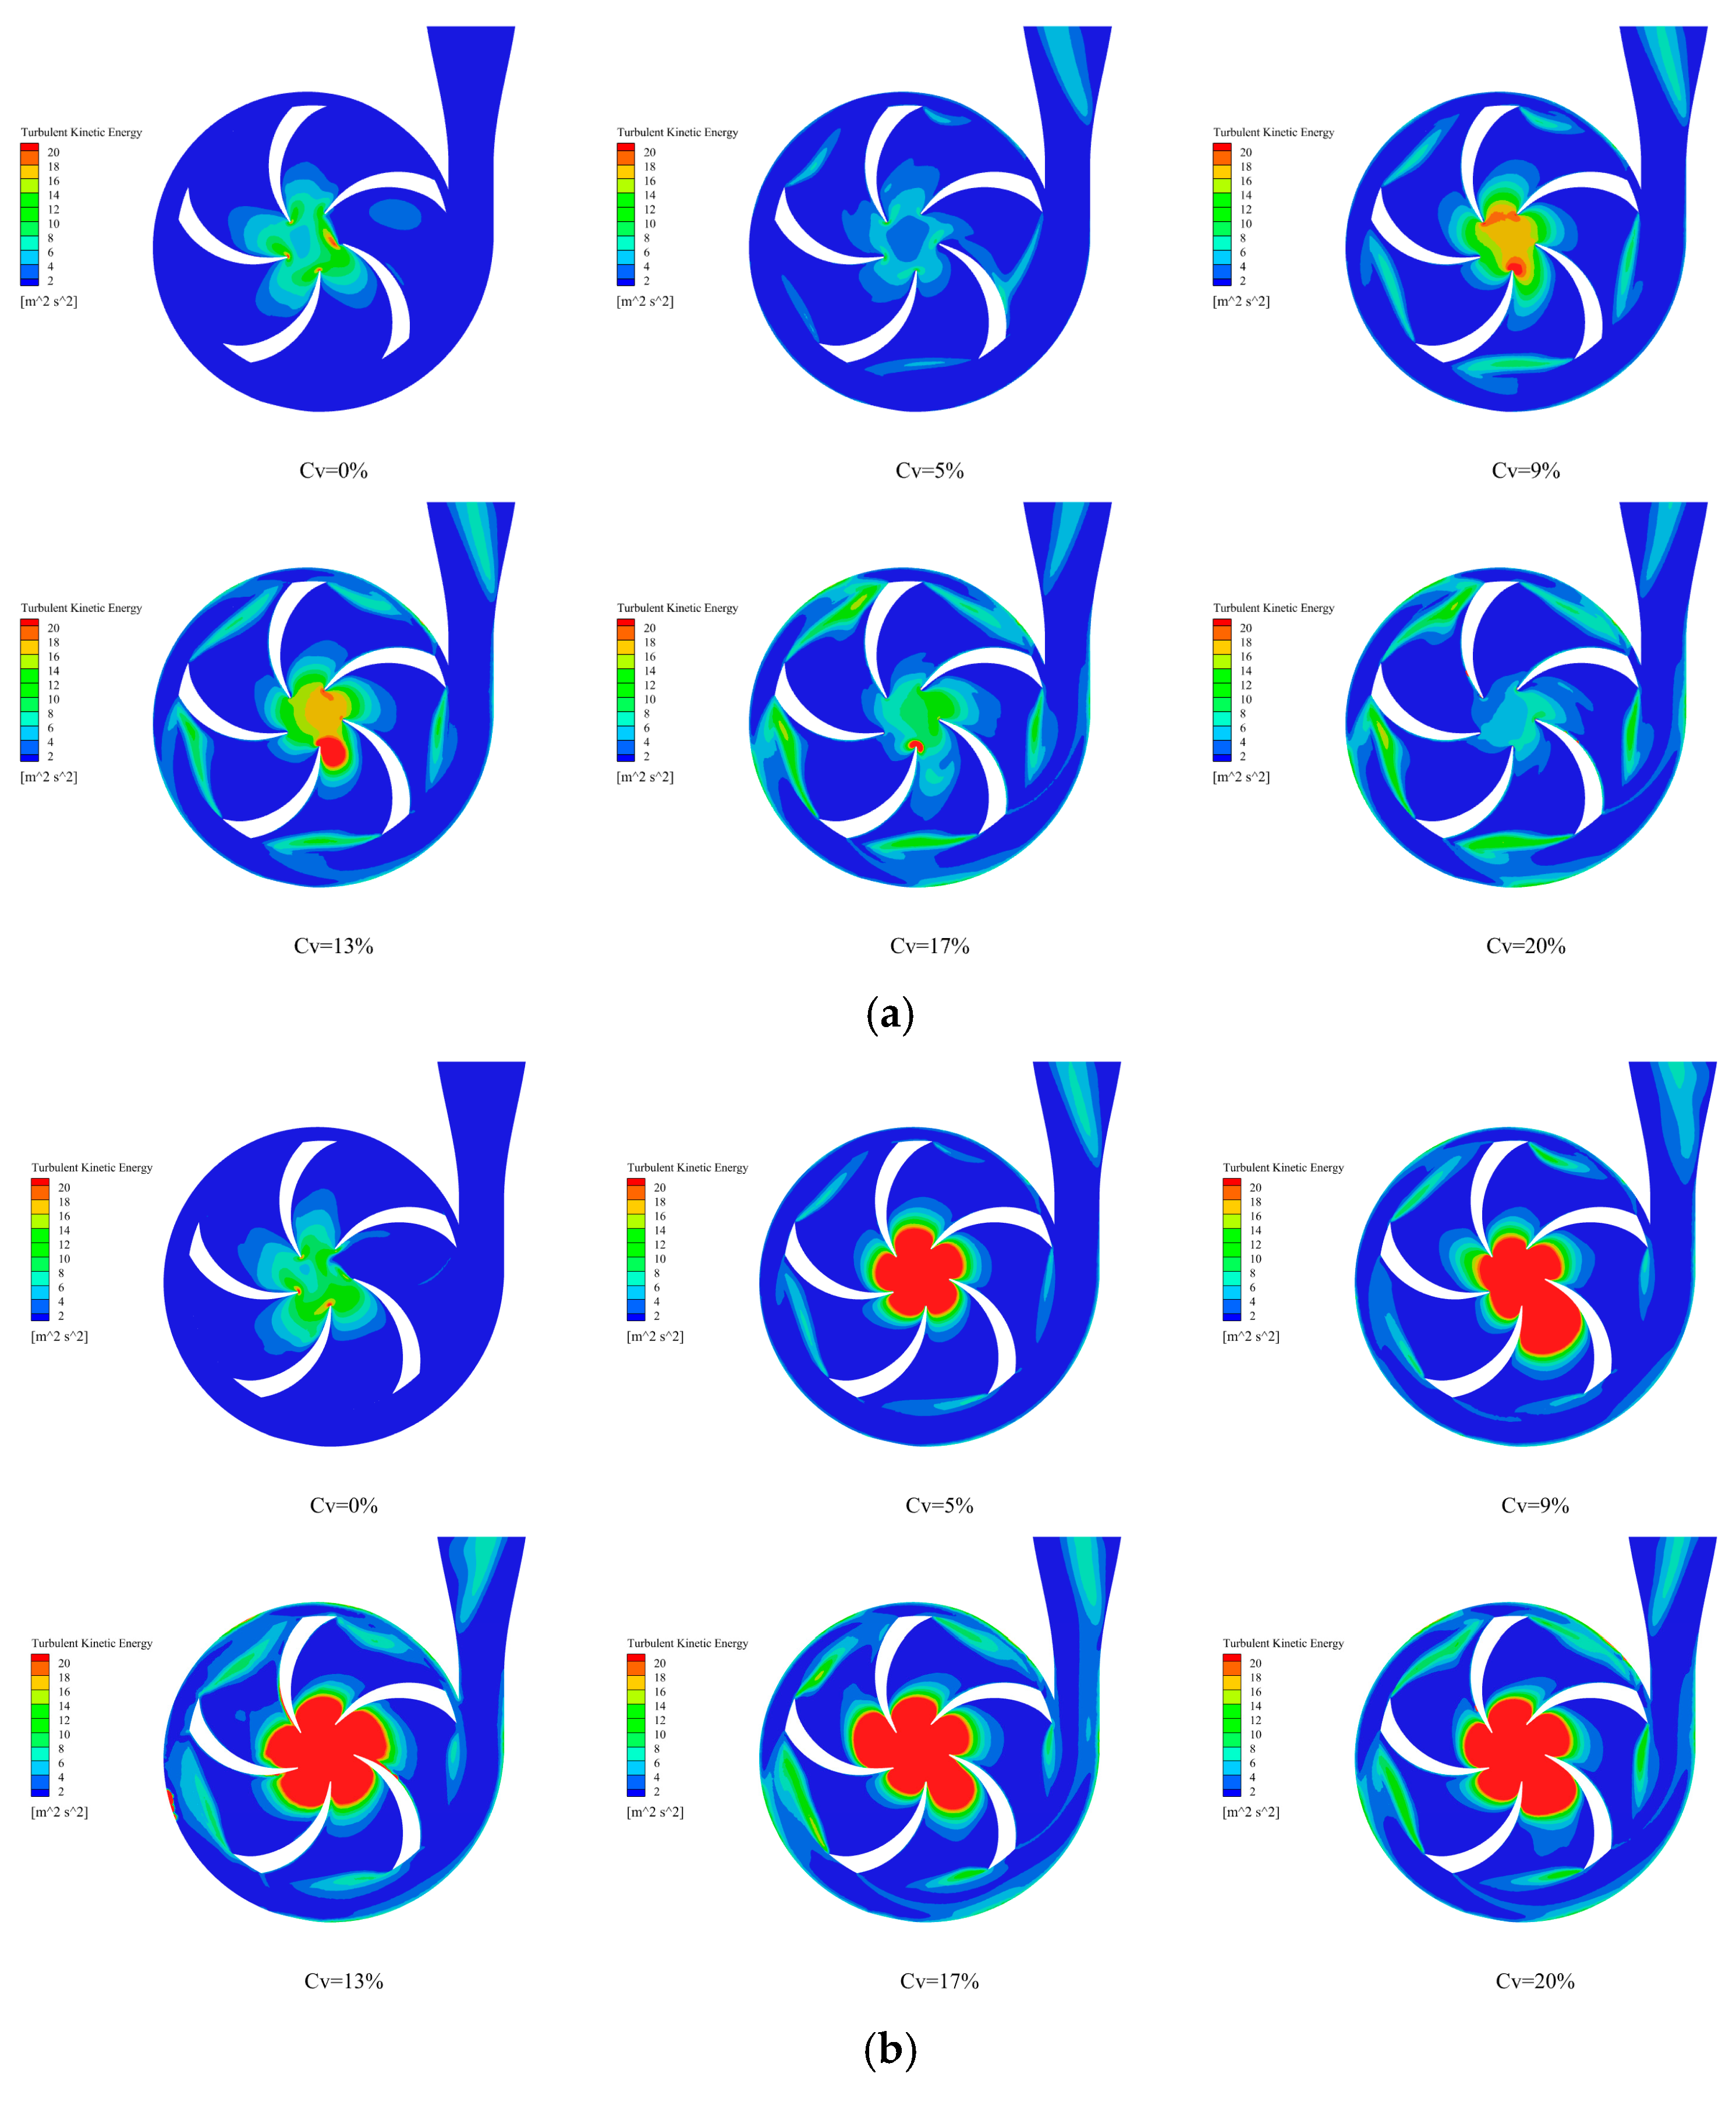
When the sediment particle sizes are 0.05 mm, 0.2 mm, 0.4 mm, 0.6 mm, and 0.8 mm, the TKE distribution in the centrifugal irrigation pump under the action of five concentration groups is shown in Figure 12, Figure 13 and Figure 14.
Figure 12 revealed TKE evolution under sediment loading. For 0.05 mm particles, clear water (Cv = 0%) exhibited symmetric TKE concentration at the impeller center/blade edges. At Cv = 5~9%, weak inertia induced sparse micro-disturbances via micro-collisions, preserving baseline structure; beyond Cv = 13%, particle accumulation gradually spread TKE toward edges through quantitative restructuring. Conversely, 0.2 mm sediments triggered significant restructuring: low concentrations (Cv = 5~9%) shifted energy from single-core focus to multi-local disturbances via inertial deviation; high concentrations (Cv ≥ 13%) drove band-like TKE expansion with blurred boundaries through “inertia–quantity synergy”, demonstrating qualitative energy reorganization from accumulated disturbances.
Figure 13 revealed intensified TKE restructuring for 0.4–0.6 mm sediments. Under clear water (Cv = 0%), energy is concentrated at impeller centers. At Cv = 5~9%, strong inertial collisions locally enhanced TKE (0.4 mm) or caused intense mutations (0.6 mm). Beyond Cv = 13%, “inertia–quantity synergy” drove oscillatory restructuring: 0.4 mm exhibited boundary oscillations from “accumulation–unclogging”, while 0.6 mm triggered radial spread with agglomeration–fragmentation cycles, reflecting nonlinear mutation mechanisms where strong inertia upgraded interventions from progressive to mutational.
Figure 14 revealed extreme TKE disturbance under 0.8 mm sediment. At low concentrations, huge inertia caused severe flow deviation, triggering instantaneous TKE boosts via violent collisions and blockages, shifting energy to local extreme disturbance. High concentrations drove global disordered restructuring with random high-value zones and pulsed oscillations from rigid clumps, reflecting critical size breach mechanisms.

3.3.2. Discussion

Under the combined effect of sediments with particle sizes ranging from 0.05 mm to 0.8 mm and varying Cv, the evolution of TKE cloud maps in centrifugal pumps exhibits a phased pattern of “progression–restructuring–oscillation–mutation–disorder”. This essentially arises from the coupling mechanism where “particle size determines the intensity of inertial intervention, and concentration drives the quantitative synergy effect”.

3.4. Sediment Volume Distribution

3.4.1. Sediment Particle Size: 0.05 mm

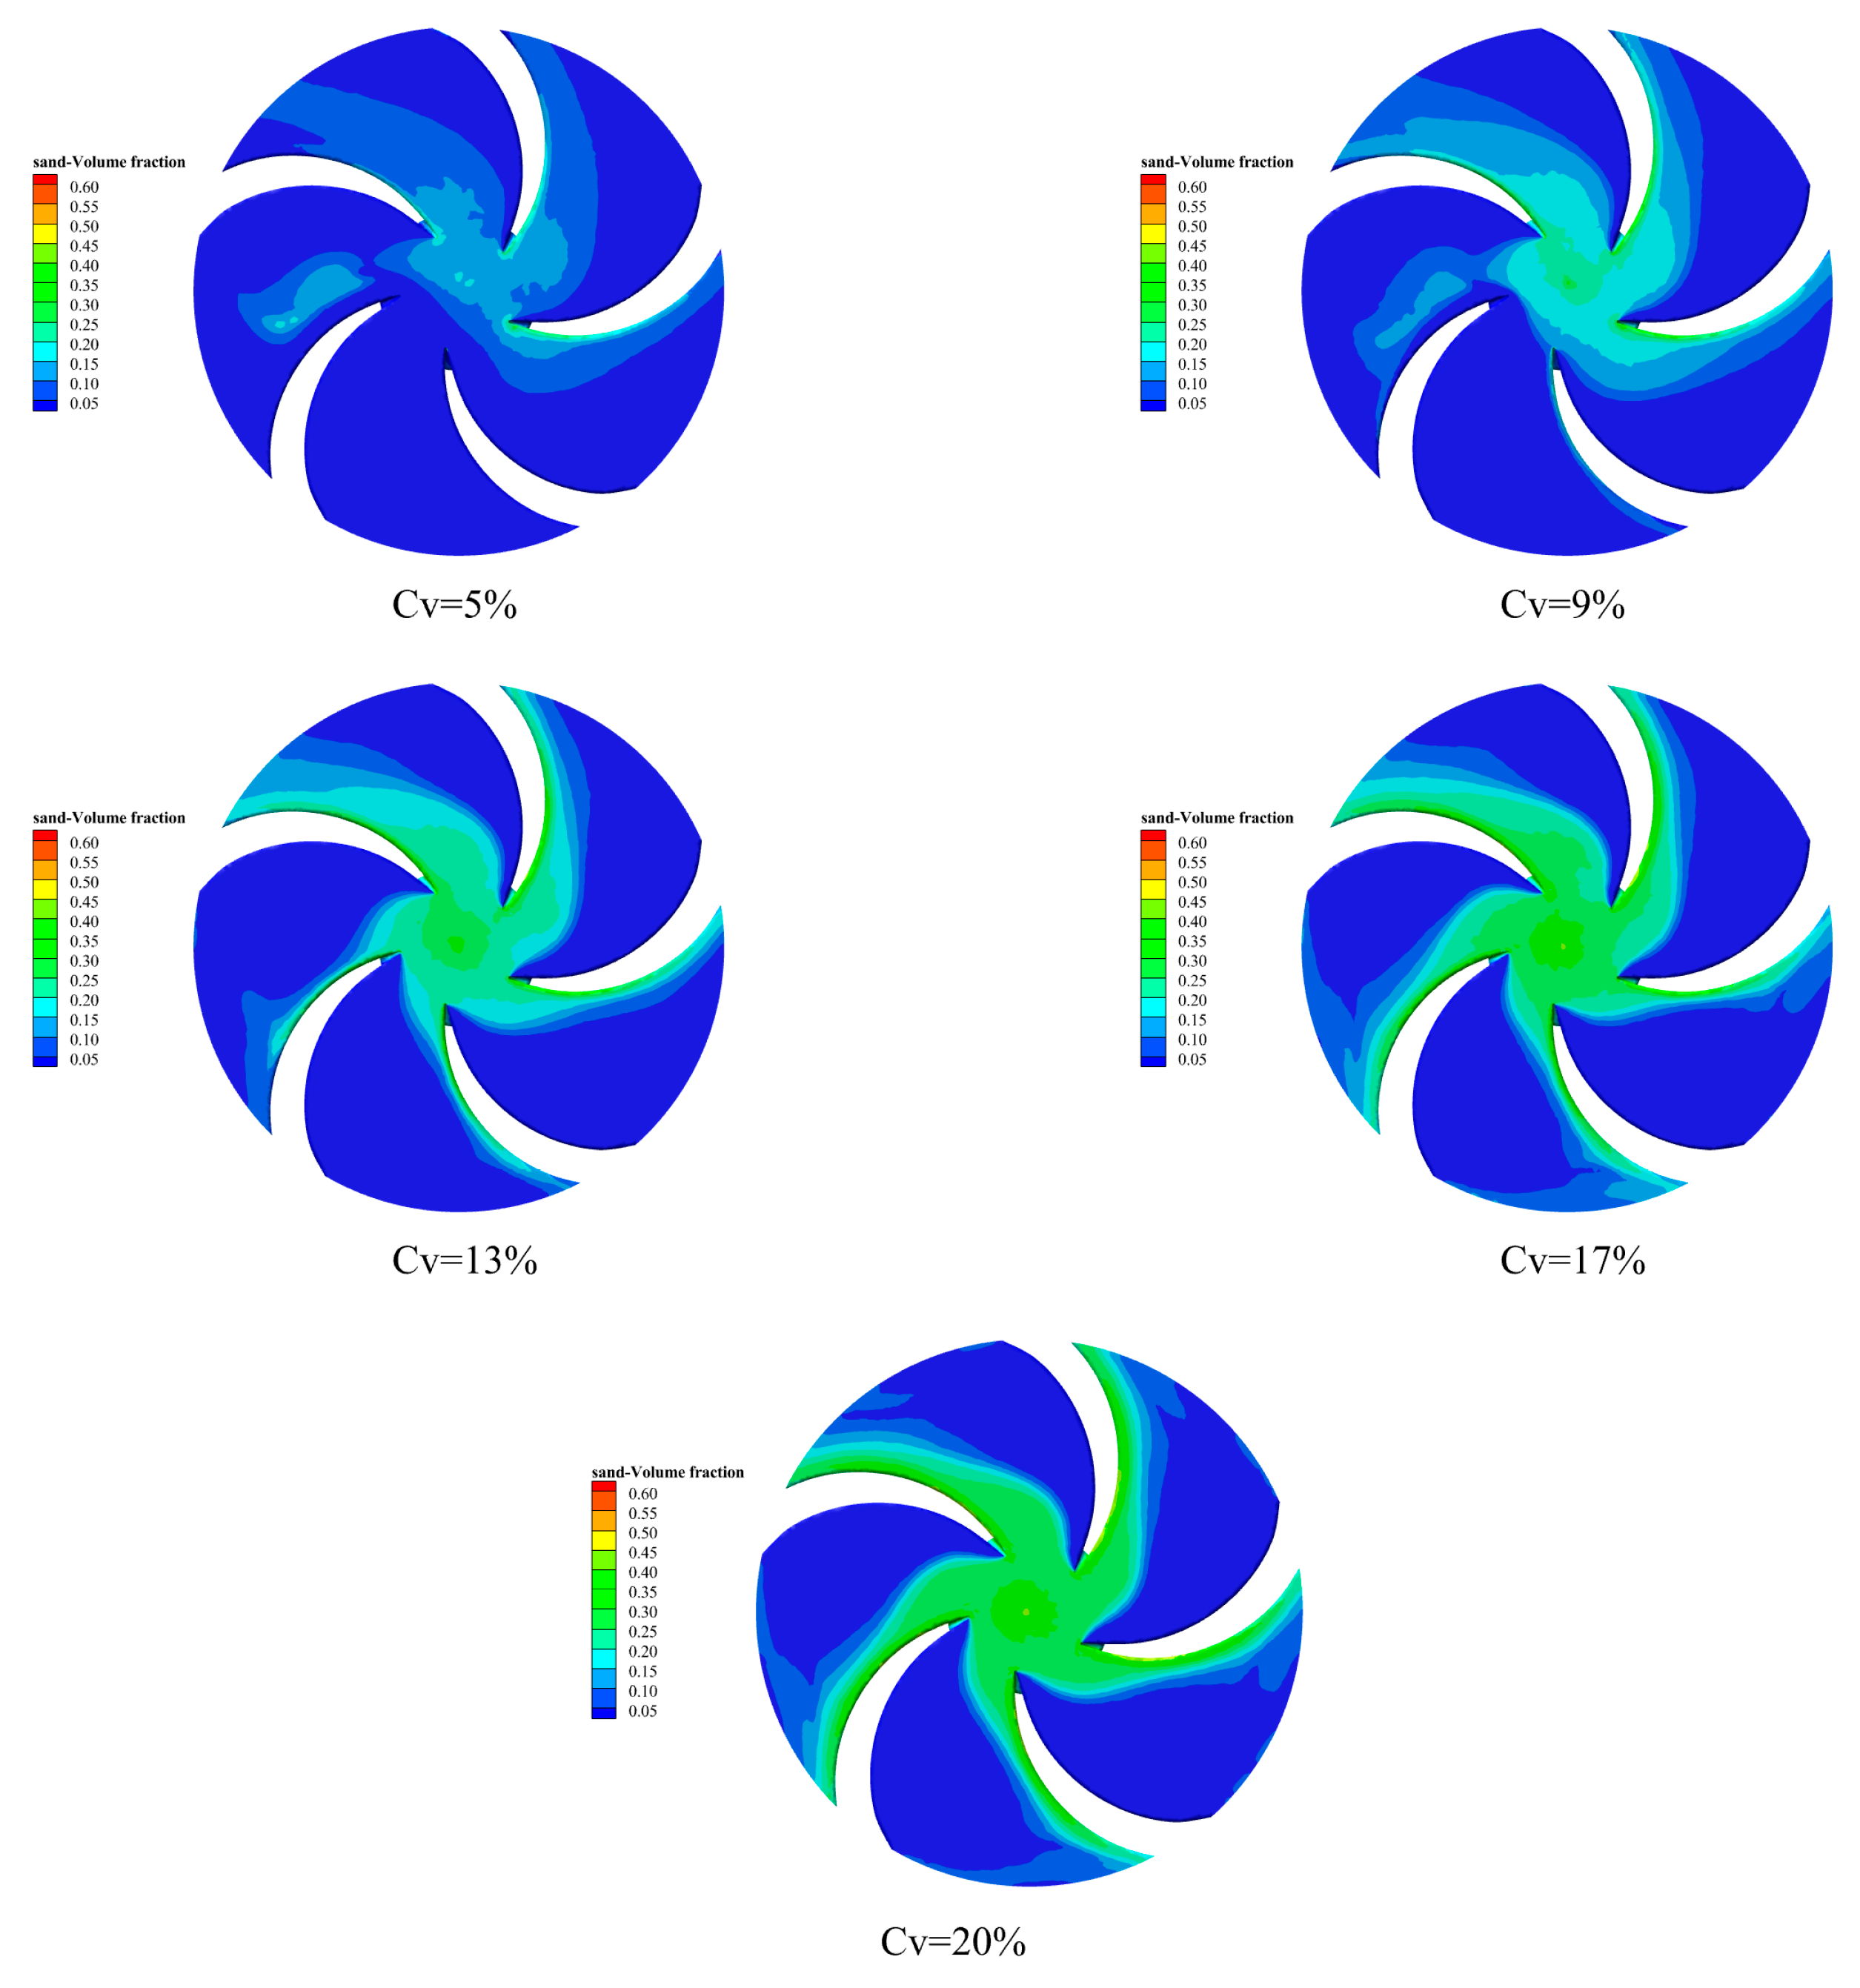
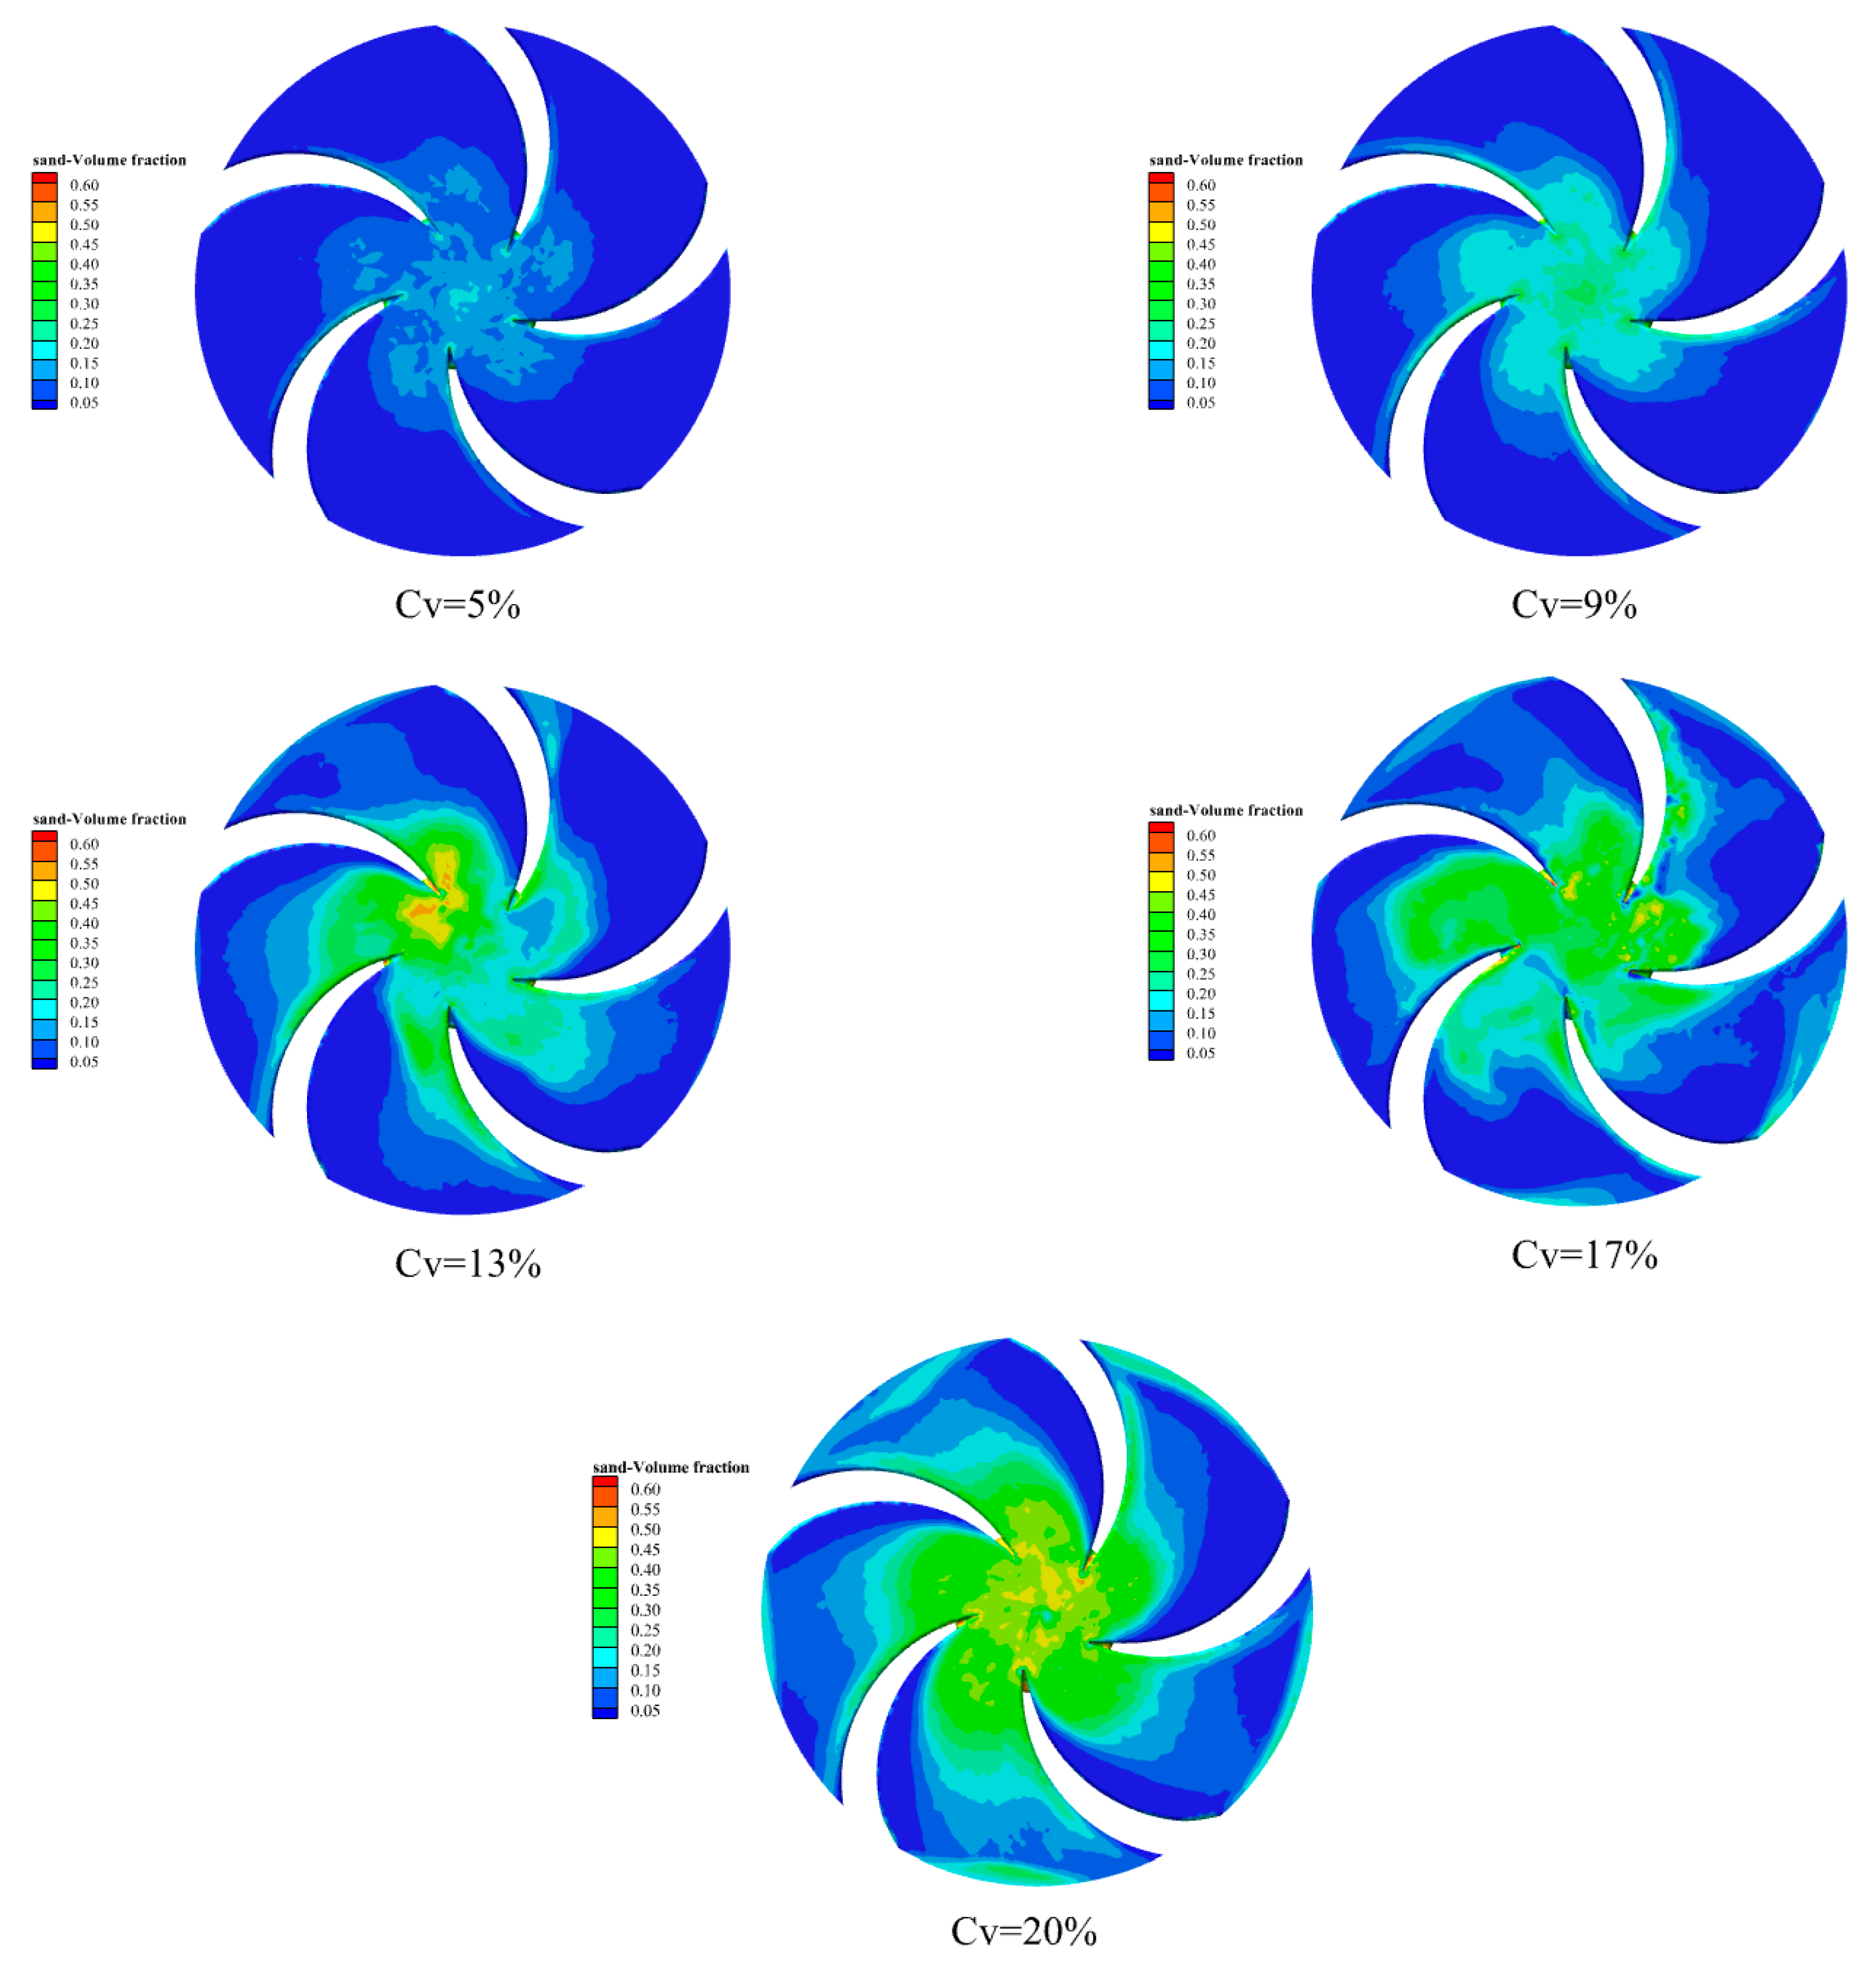
The sediment particle size is 0.05 mm; the volume distribution of sediment particles within the centrifugal irrigation pump, under the influence of five different concentration groups, is illustrated in Figure 15.
As shown in Figure 15, for 0.05 mm sediment, at low concentrations (Cv = 5%, 9%), particles have excellent flow-following ability and, constrained by channel geometry, form symmetric weak accumulations in central channels and blade gaps. At high concentrations (Cv = 13%, 17%, 20%), cumulative particles exceed geometric limits, gradually spreading from the center to blade edges via turbulent transport, following the mechanism of “flow-following and geometry/turbulence synergy”.

3.4.2. Sediment Particle Size: 0.2 mm

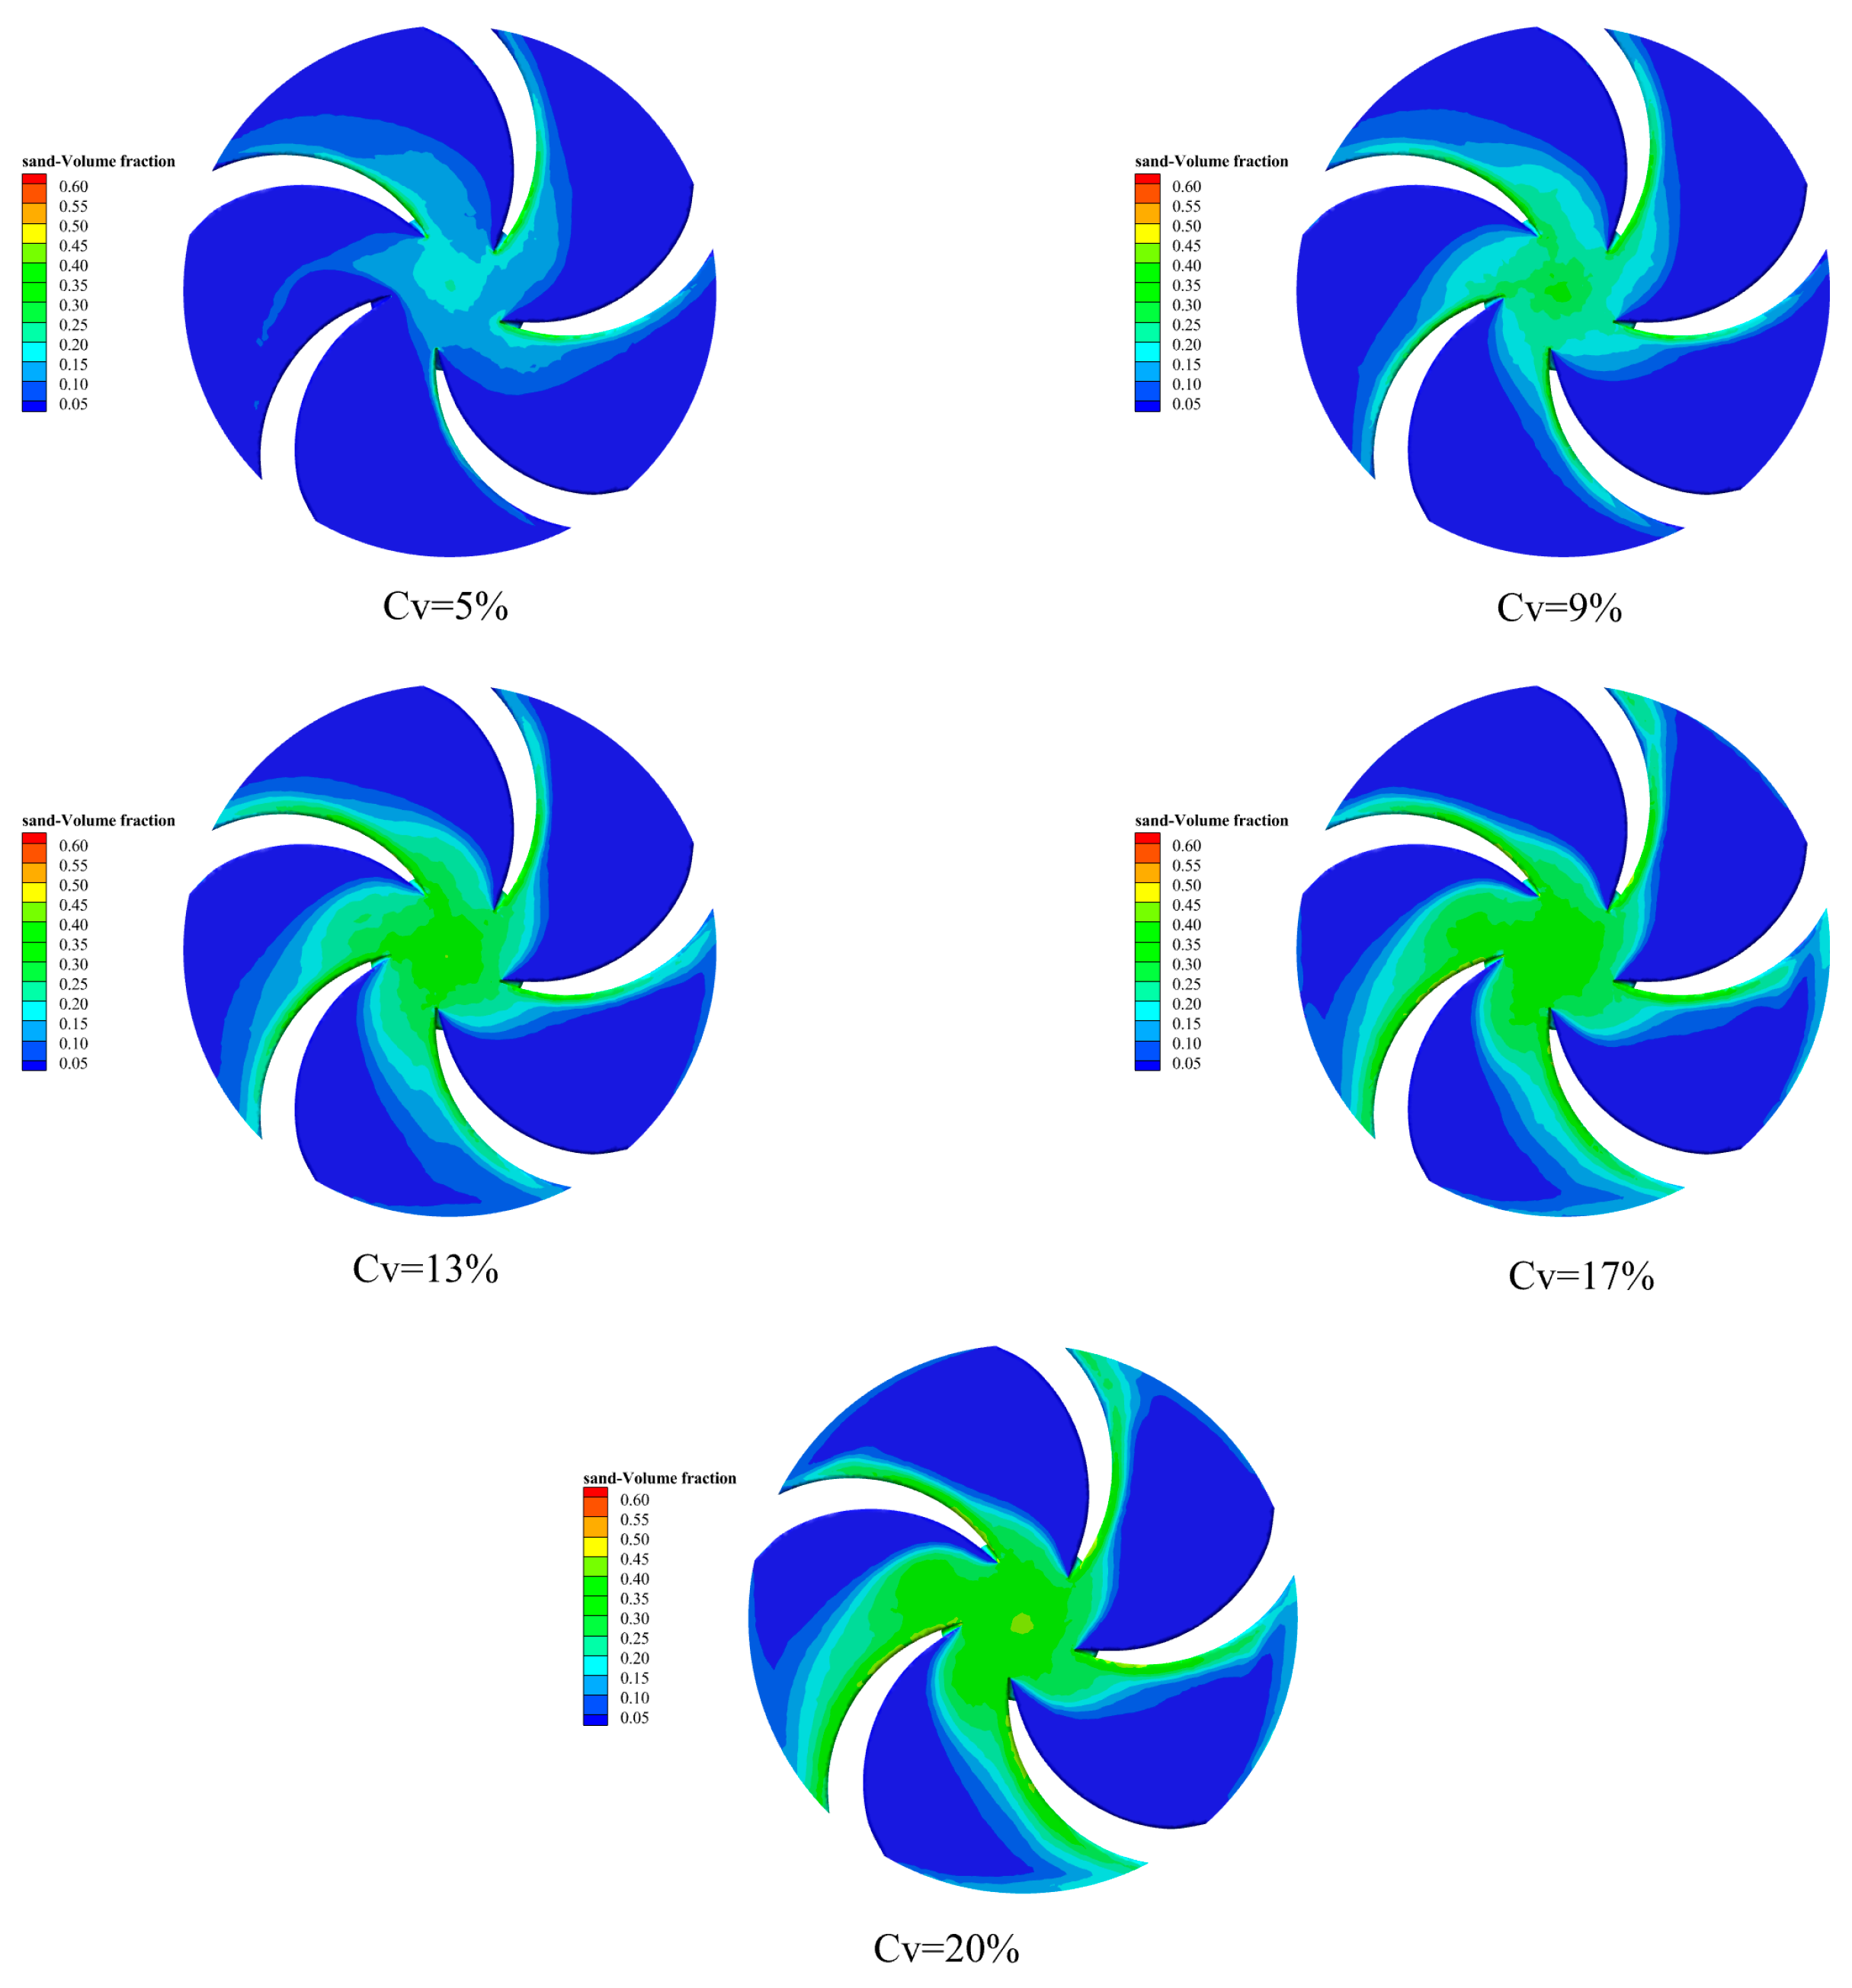
The sediment particle size is 0.2 mm; the volume distribution of sediment particles within the centrifugal irrigation pump, under the influence of five different concentration groups, is illustrated in Figure 16.
As shown in Figure 16, for 0.2 mm sediment, at low concentrations (Cv = 5%, 9%), particles have good flow-following ability. Slightly affected by blade secondary flow, they form double accumulations in central channels and blade gaps. At high concentrations (Cv = 13%, 17%, 20%), cumulative particles enhance flow field disturbance and transport, driving particles to spread from double accumulations to the entire channel, following the mechanism of “flow-following dominance + weak flow field disturbance assistance”.

3.4.3. Sediment Particle Size: 0.4 mm

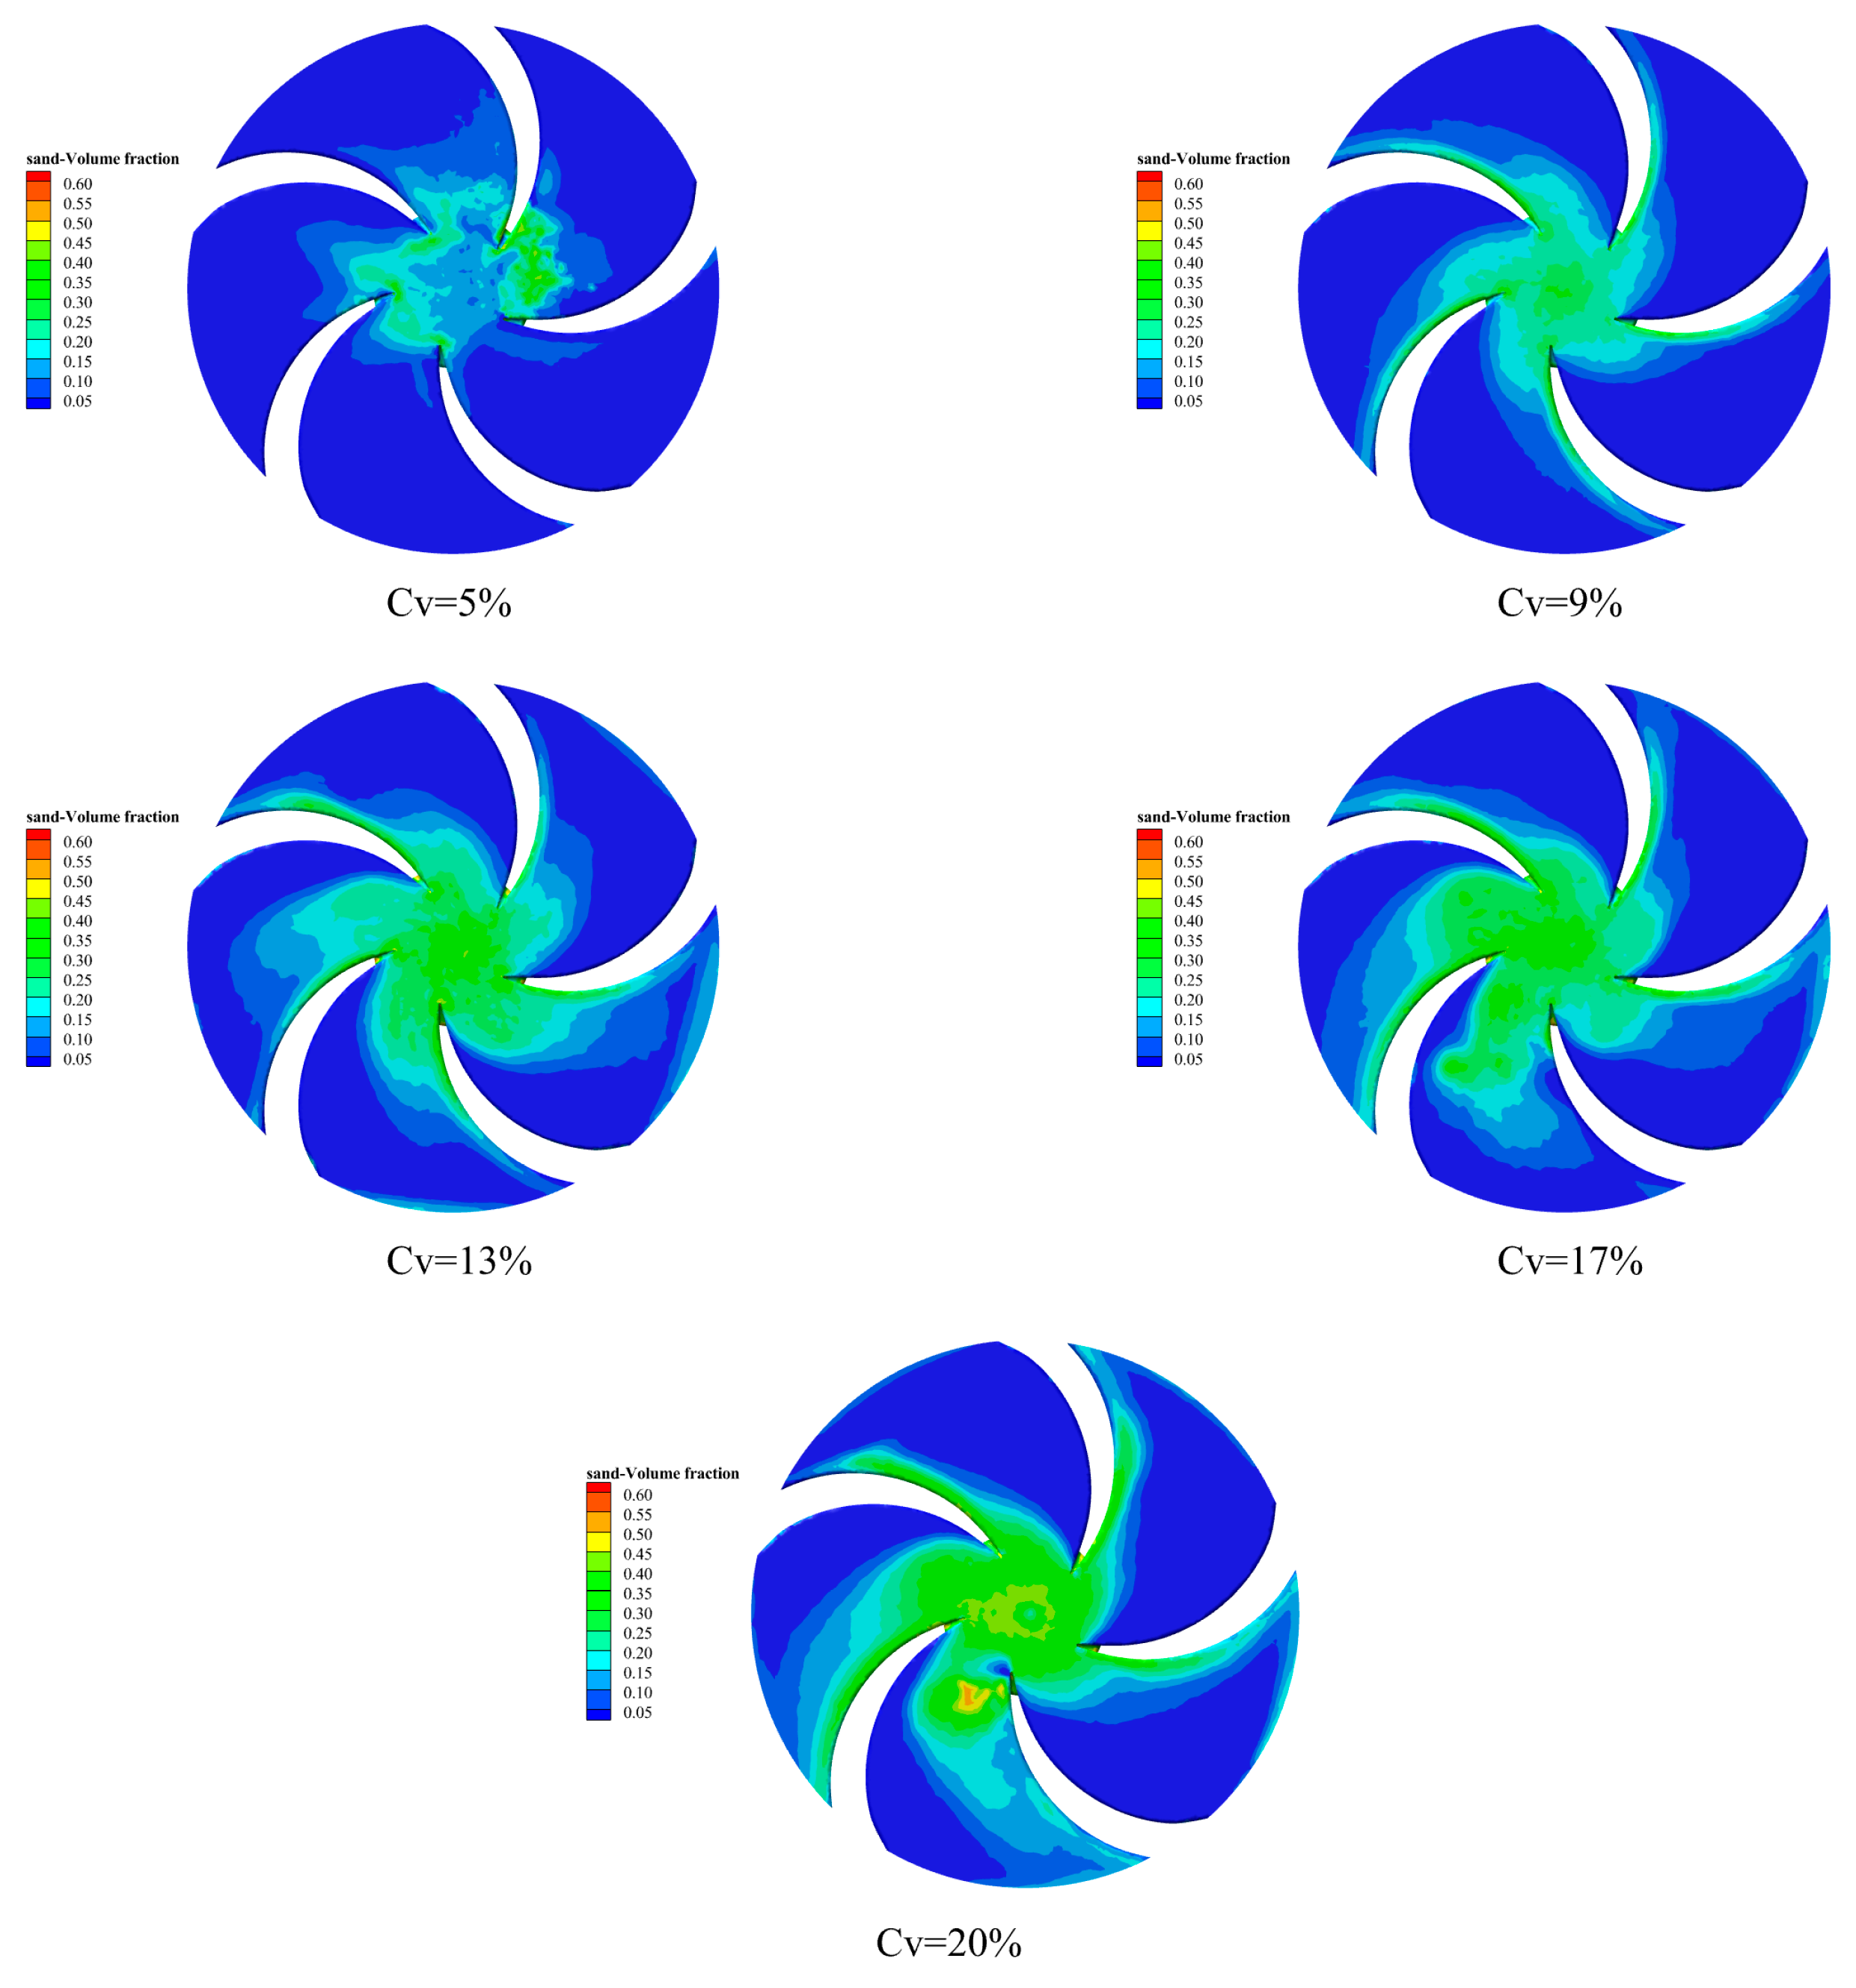
The sediment particle size is 0.4 mm; the volume distribution of sediment particles within the centrifugal irrigation pump, under the influence of five different concentration groups, is illustrated in Figure 17.
As shown in Figure 17, for 0.4 mm sediment, at low concentrations (Cv = 5%, 9%), particles with increased inertia form strong accumulations in blade gaps and central channels under the combined effect of geometric constraints and secondary flow. At high concentration (Cv = 20%), cumulative particles, synergized with flow field disturbances, spread from strong accumulations to the entire channel, following the mechanism of “inertia dominance and enhanced flow field transport”.

3.4.4. Sediment Particle Size: 0.6 mm

The sediment particle size is 0.6 mm; the volume distribution of sediment particles within the centrifugal irrigation pump, under the influence of five different concentration groups, is illustrated in Figure 18.
As shown in Figure 18, for 0.6 mm sediment, at low concentrations (Cv = 5%, 9%), particles with significant inertia form local strong accumulations in central channels and partial blade gaps. At medium concentrations (Cv = 13%, 17%, 20%), cumulative particles, synergized with macro flow field disturbances, expand accumulations into multiple zones with complex distribution. At high concentration (Cv = 20%), agglomeration helps form “strong central core and global diffusion”, following the mechanism of “inertia dominance and quantity accumulation and agglomeration assistance”.

3.4.5. Sediment Particle Size: 0.8 mm

The sediment particle size is 0.8 mm; the volume distribution of sediment particles within the centrifugal irrigation pump, under the influence of five different concentration groups, is illustrated in Figure 19.
As shown in Figure 19, in the scenario of 0.8 mm sediment, at low concentrations (Cv = 5%, 9%), the particles have extremely high inertia and form extremely significant strong accumulations in the central flow channel due to geometric constraints. At medium concentrations (Cv = 13%, 17%, 20%), the cumulative quantity of particles, in synergy with weak disturbances in the macro flow field, drives the accumulation area to slowly permeate and expand into the blade gaps. At high concentration (Cv = 20%), the agglomeration effect is enhanced, forming a “strong central core and global diffusion and scattered agglomeration spots” pattern, following the mechanism of “inertia dominance and quantity accumulation and agglomeration enhancement”.

3.4.6. Particle Volume Distribution

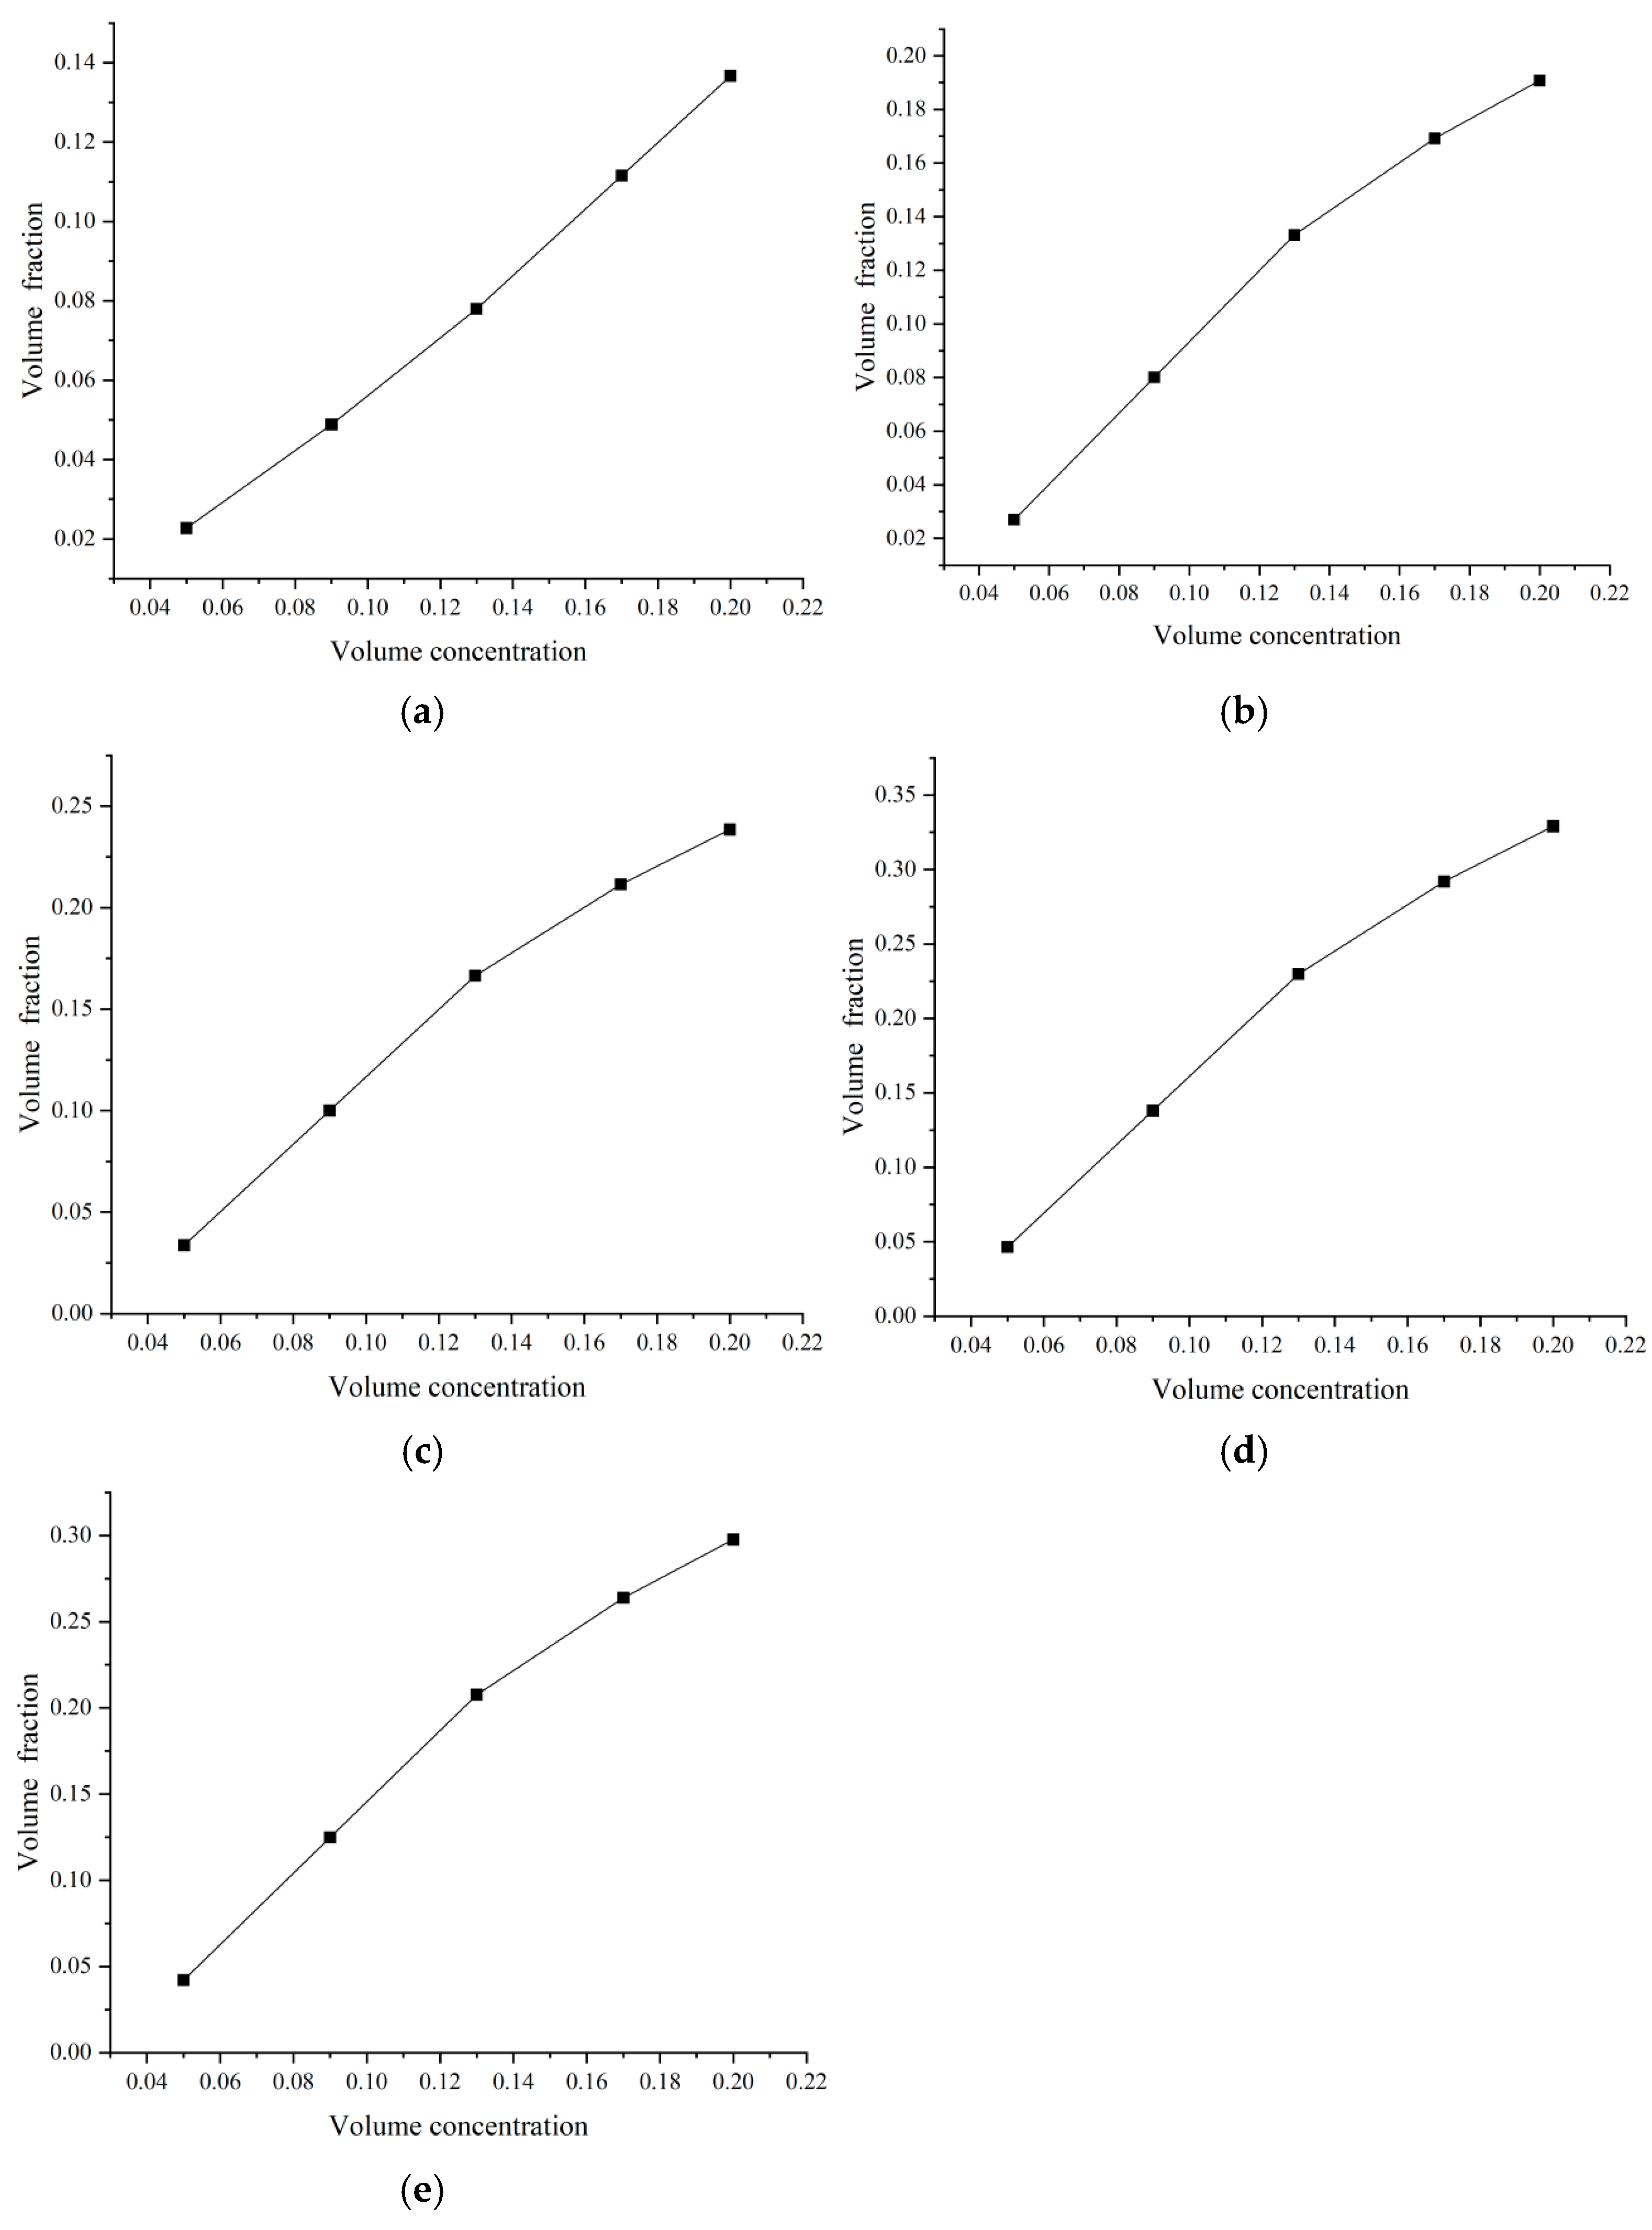
Figure 20 presents the variation in particle volume distribution as a function of concentration.
Figure 20a–e consistently exhibited linear positive correlations between sediment concentration and volume fraction across all particle sizes (0.05~0.8 mm). For fine particles (0.05~0.4 mm), turbulent diffusion dominated over centrifugal sedimentation, ensuring uniform dispersion. The 0.4 mm sediments approached bed-suspended load transition but maintained dynamic balance via turbulence-counteracted sedimentation within the tested Cv.
Coarse sediments (0.6~0.8 mm) showed steeper linear slopes, indicating bed load dominance with intensified centrifugal settling and inter-particle contact forces. Despite massive blade deposition, high-intensity turbulence sustained dispersion equilibrium. Notably, 0.8 mm sediment elevated impeller pressure, risking blade deformation/runner shutdown at high Cv.

3.4.7. Discussion

Figure 21 shows a comparison chart of the volume fraction of sediment particles in the centrifugal irrigation pump under the combined influence of different particle sizes and different volume concentrations.
According to Figure 21, there are two characteristics: (1) The evolution law of the particle size-flow field interaction mechanism. As the particle size increases (0.05~0.8 mm), the controlled mode of particles in the flow field undergoes a significant transformation from “fluid drag dominance” to “inertia/centrifugal force dominance”. (2) The correlation characteristic between concentration and volume fraction. Under different particle size conditions, the particle volume fraction and volume concentration all show a linear positive correlation, which reflects the universal law of the dynamic balance between turbulent diffusion and particle transport in the centrifugal irrigation pump.

4. Experimental Verification

To verify the effectiveness of the adopted numerical calculation method, experiments were conducted on the centrifugal irrigation pump (PGW 65-200-7.5G), and a comparative analysis was performed between the numerical simulation results and the experimental results under the same parameters and boundary conditions.

4.1. Experimental System

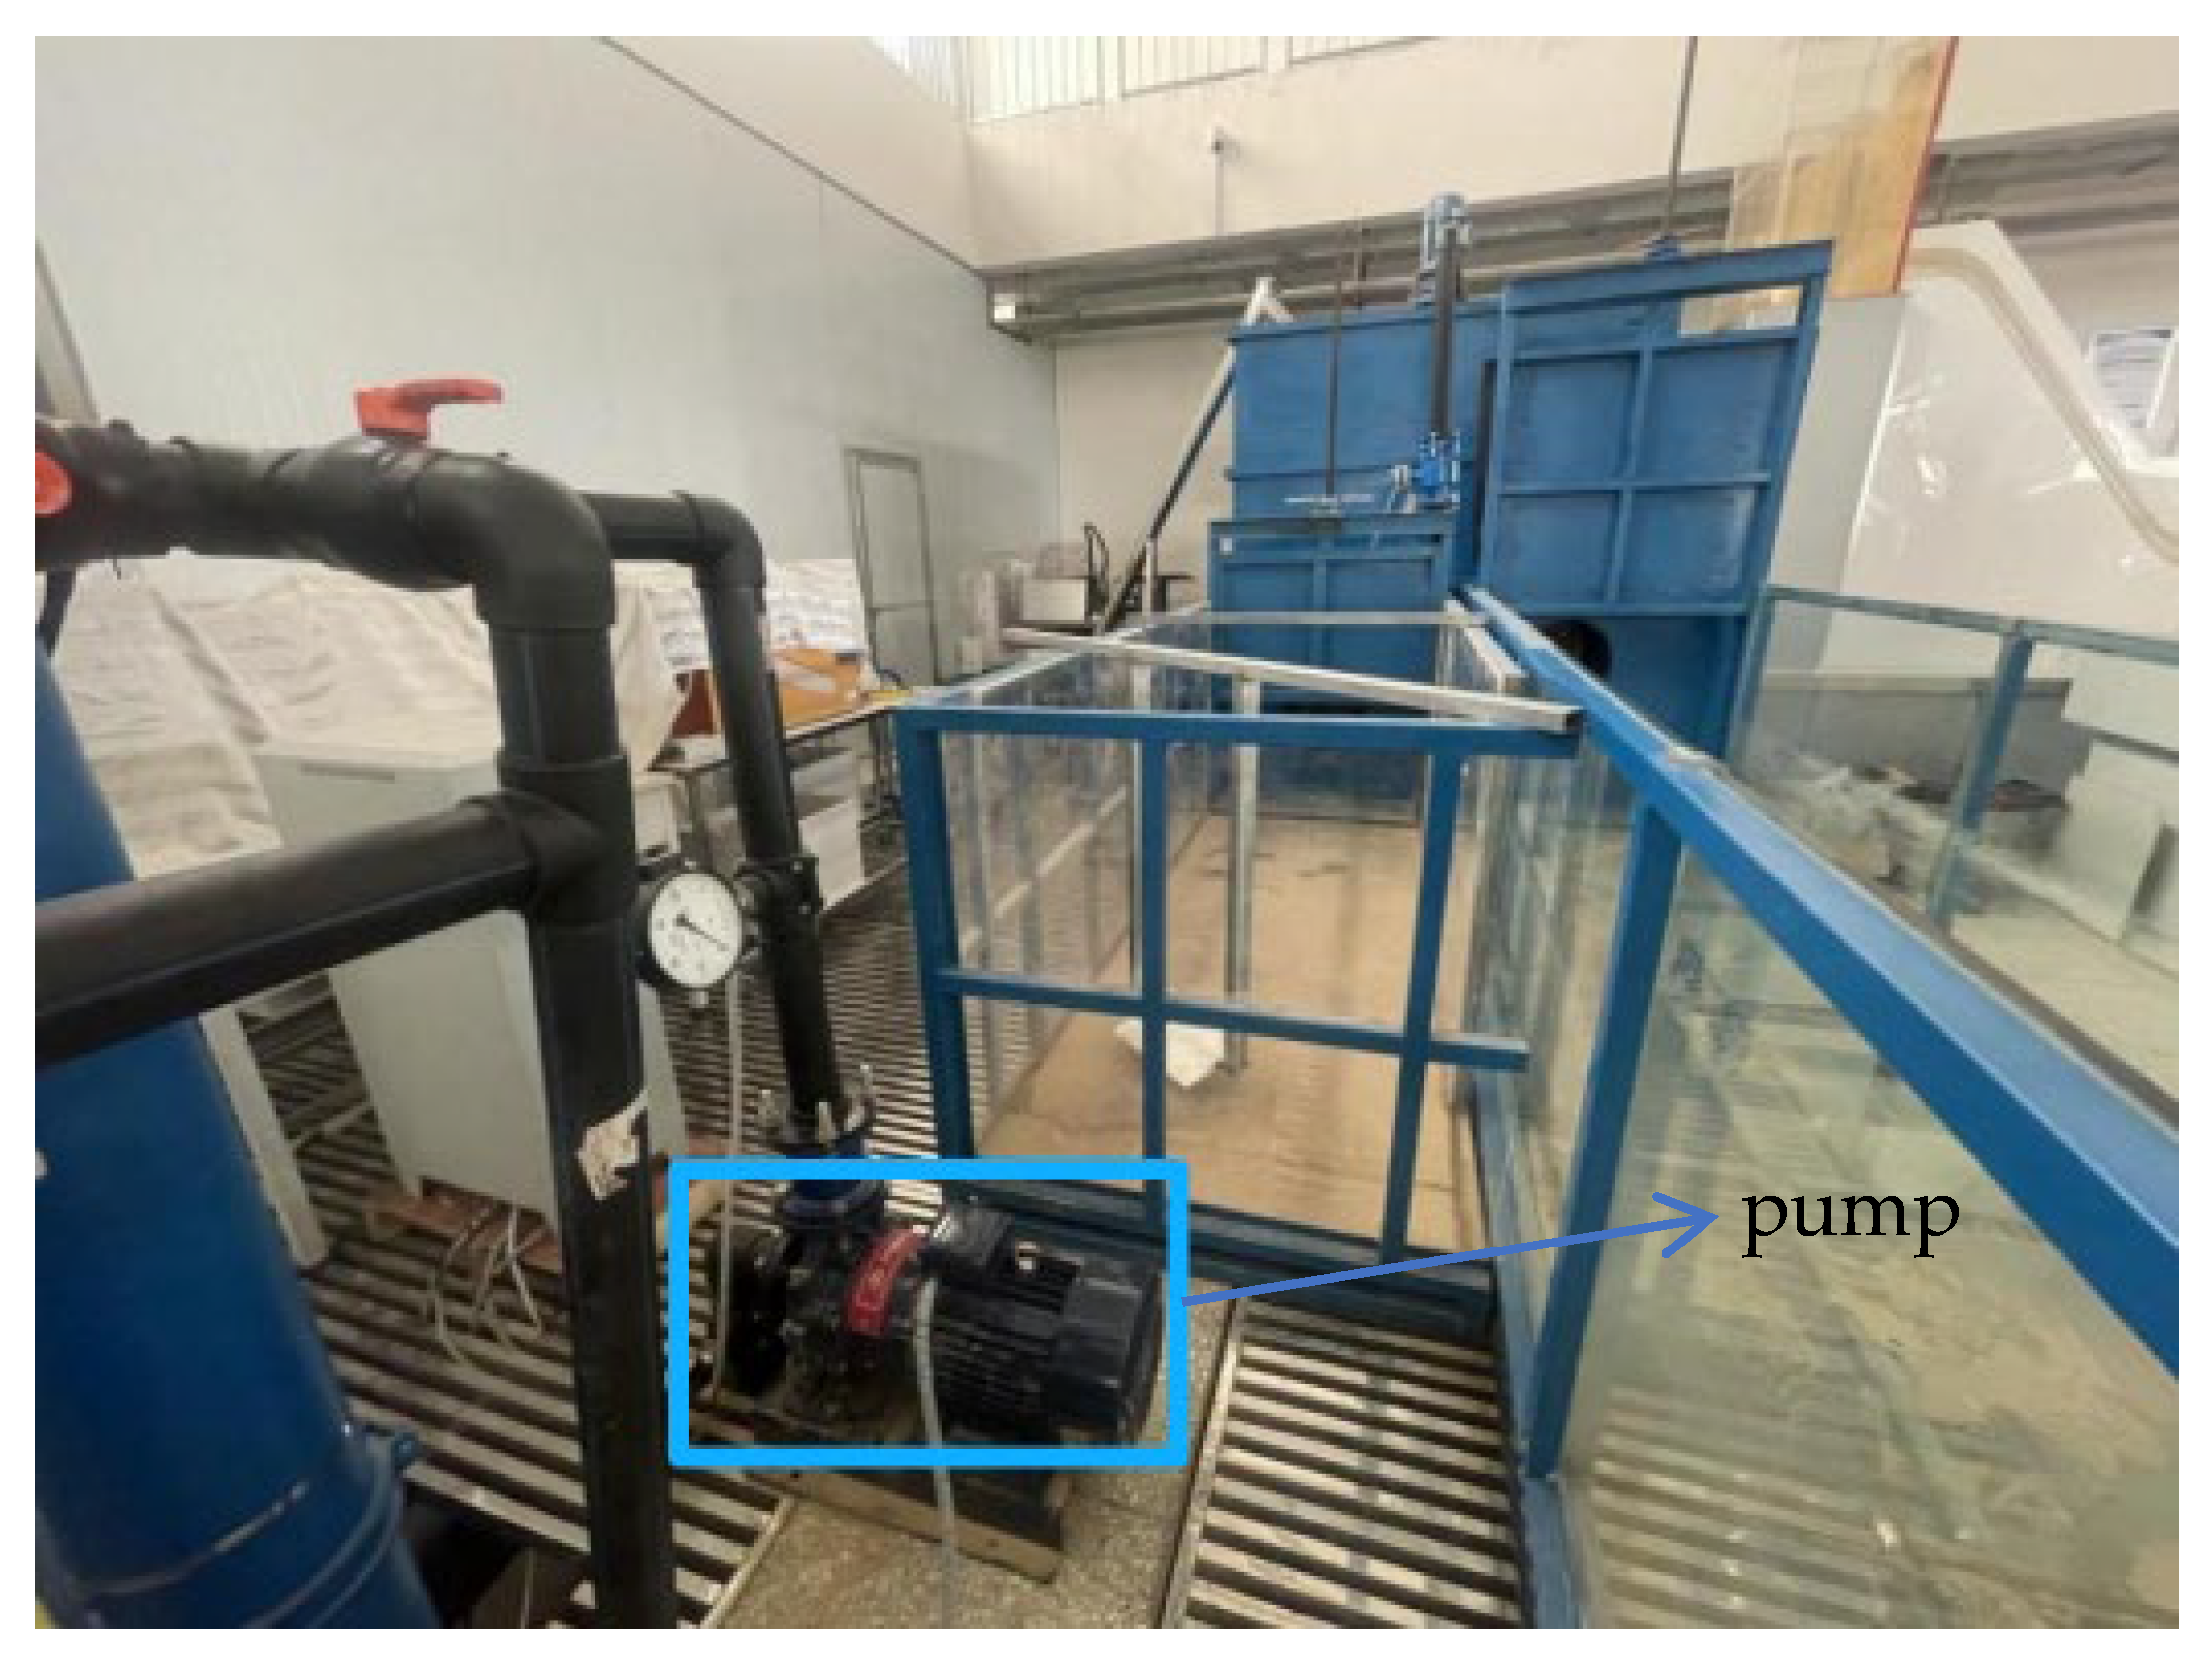
The experimental system is composed of a water supply pump, water tank, electric machinery, valve, pipe, centrifugal irrigation pump, etc. The experimental system is shown in Figure 22, and the experimental site is shown in Figure 23.

4.2. Experimental Process

Prior to the experiment, a water-based coating of the same thickness was applied to the impeller (using an equal amount of water-based paint, the same brushing device, and the same number of brushing passes). After the coating was completely dry, the experiment was conducted. The wear of solid particles on the flow-passing components was determined by observing the changes in the wear area of the coating caused by solid particles, and then compared with the numerical simulation results calculated under the same boundary conditions.
Experimental procedures:
(1)
Install the experimental pump on the experimental system, conduct a no-load experiment to check the motor, and verify whether the experimental system operates normally. The wear experiment can only be carried out after ensuring the entire system is functioning properly.
(2)
Disassemble the impeller and volute, wipe the inlet of the centrifugal pump and the impeller clean, respectively, apply a water-based paint of the same thickness, and reassemble the centrifugal pump after the coating is completely dry.
(3)
Add clean water and experimental sand into the water tank (added at a concentration of 5%), install the centrifugal pump on the experimental system, and check the correctness of the connections of pipes, valves, and other components.
(4)
Turn on the power switch on the main console, control the flow rate at the rated flow rate (25 m3/h), record the experimental data, and turn off the power switch to stop the experiment after the experimental pump has been running for 10 h.
(5)
Disassemble the impeller and volute of the experimental pump, observe the wear status of the water-based coating in the inlet and impeller flow channels, and take photos to retain the results.
(6)
After the experiment, tidy up the experimental site and organize all materials in a unified manner.

4.3. Comparison and Analysis of Results

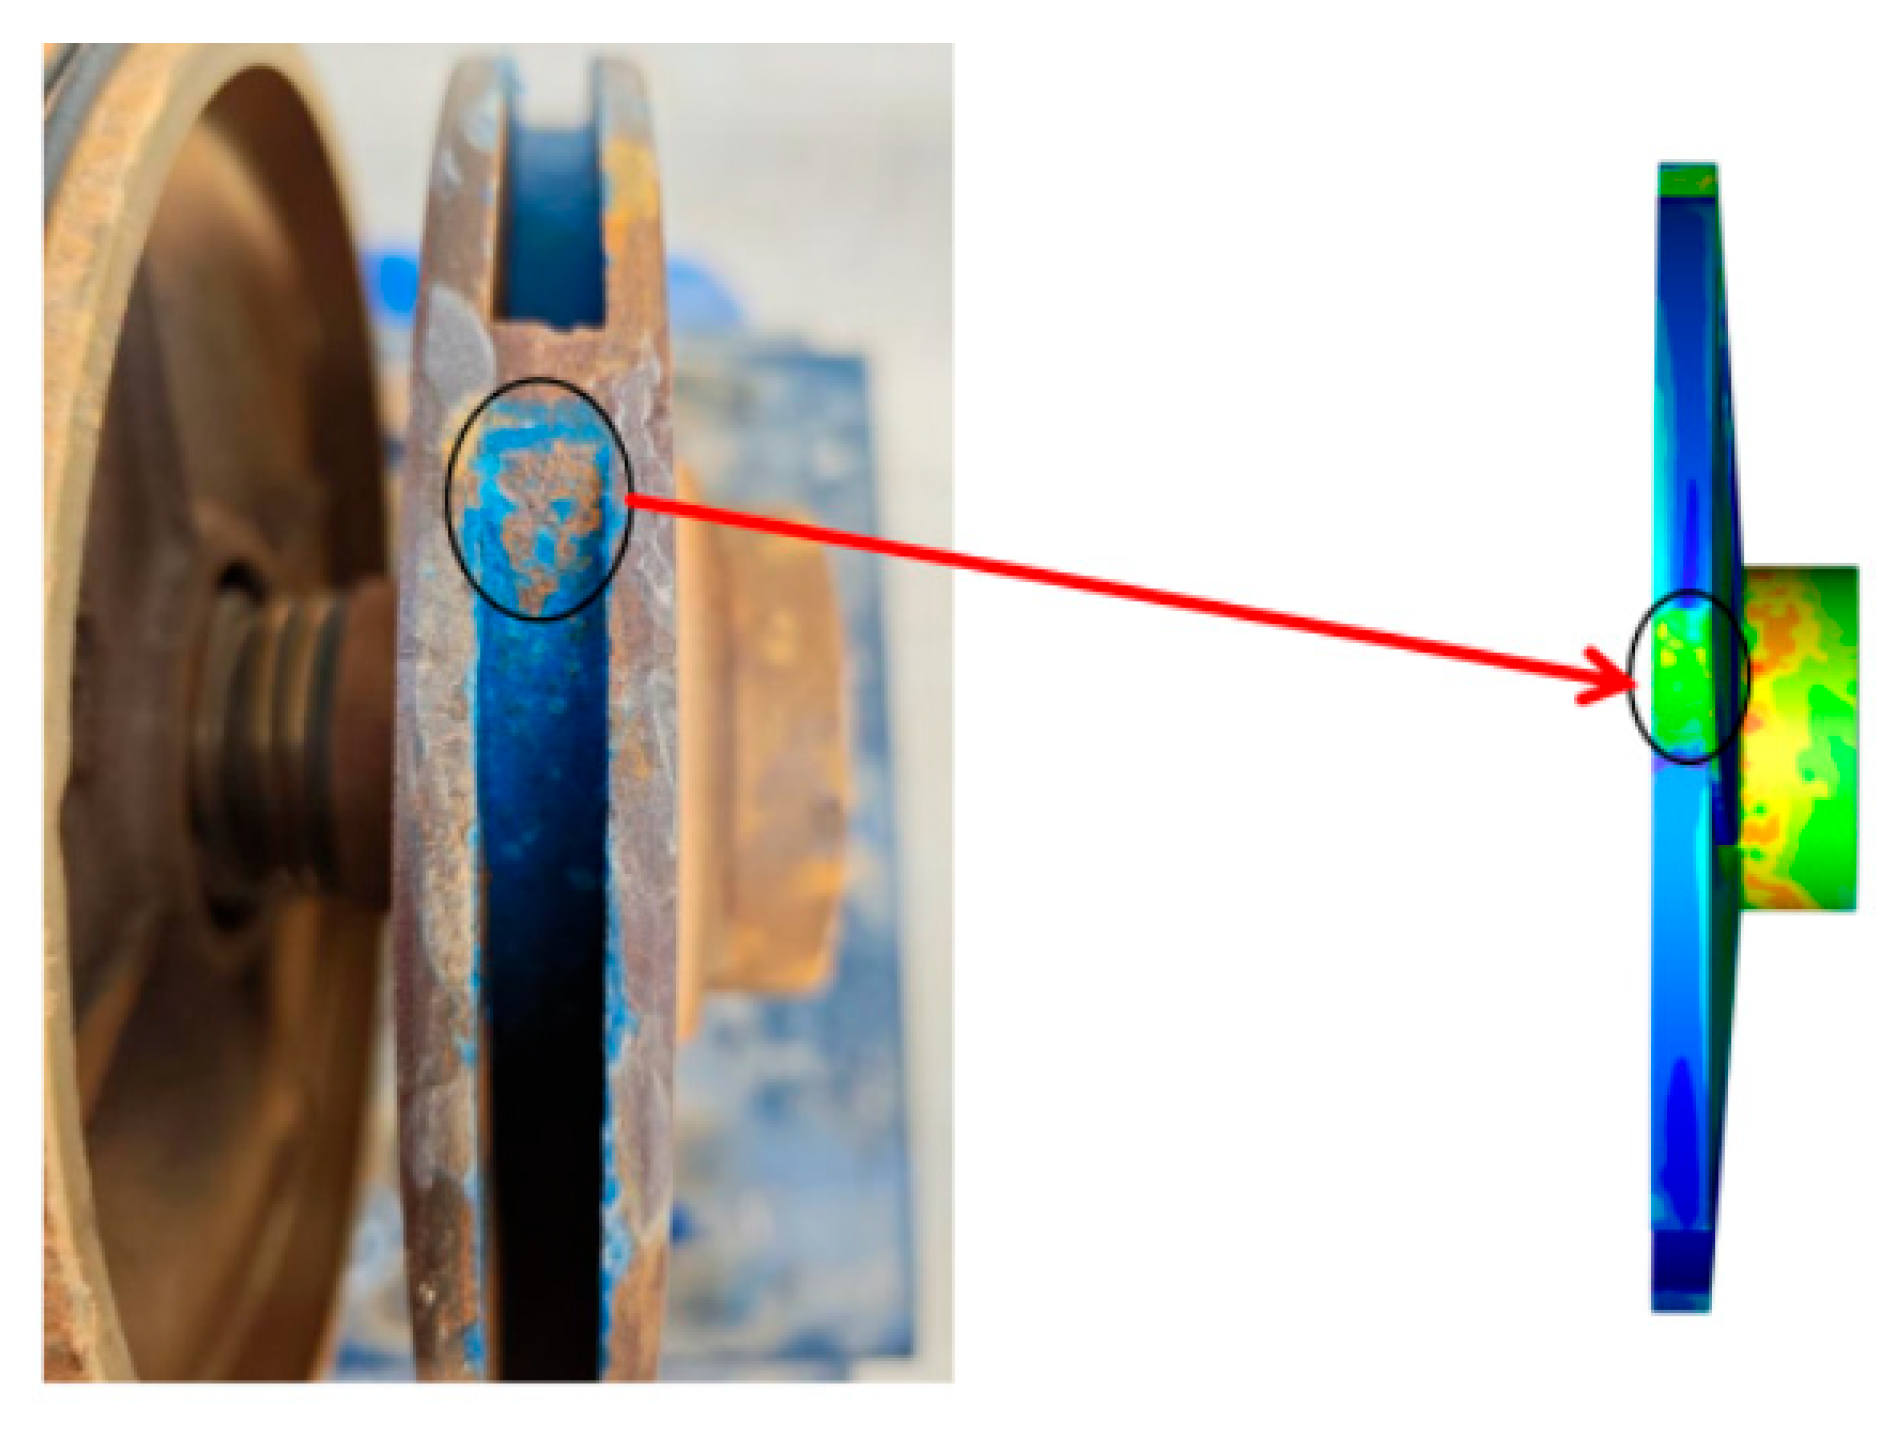
The results obtained from the numerical simulation of the centrifugal irrigation pump inlet are compared with the experimental results, as shown in Figure 24.
It can be seen from Figure 24 that the numerical simulation results are highly consistent with the experimental observations. In the inlet area, the distribution position of high sediment concentration is in good agreement with the actual wear and damage position. When solid particles enter the inlet along the axial direction, driven by the rotational movement of the impeller, the direction of the particle movement velocity needs to change from axial to radial. During this complex flow channel transition process, the particles will collide violently with the inlet edge repeatedly at a large impact angle. The high consistency between the two strongly verifies the correctness of the numerical simulation results.
The comparison between the numerical simulation results and experimental results of the impeller outlet is shown in Figure 25.
According to Figure 25, the numerical simulation results and experimental results mutually confirm each other. In the impeller outlet area, the distribution characteristics of high sediment concentration exhibit clear regularities. When solid particles enter the impeller flow channel, the impeller does work to impart kinetic energy to the particles, causing their motion states to continuously change. As the particles flow toward the outlet, under the rotational action of the impeller, the tangential component of the velocity continuously increases and reaches a peak near the outlet. Particles with high kinetic energy impact and collide with the blade outlet edge with relatively large momentum. Under continuous mechanical action, the material of the outlet edge is gradually eroded, intensifying the degree of wear.

5. Conclusions

(1)
Synergistic Thresholds Dominate Performance Degradation: Critical particle size (≥0.4 mm) triggers a phase transition from localized disturbance to global flow disorder, expanding low-pressure zones by 37% at equivalent concentrations. Concurrently, exceeding the 13% concentration threshold accelerates nonlinear pressure decay through collective particle interactions, shifting energy dissipation from discrete-phase dominance to systematic continuous-phase weakening.
(2)
Size-Specific Deterioration Pathways: Fine sediments (≤0.2 mm) induce gradual “fast-then-slow” velocity attenuation via micro-scale drag accumulation, with inflection at Cv = 10%. In contrast, coarse sediments (≥0.6 mm) cause “cliff-like” degradation (e.g., 22.4 to 19.4 m/s at Cv = 5% through inertial impact-blockade chains, evolving into fluctuating velocity oscillations under high-concentration “blockage–fragmentation–reblockage” cycles.
(3)
Engineering Validation and Design Implications: Experimental wear tests’ accuracy of numerical models in predicting erosion hotspots at impeller inlets (large-angle particle collisions) and outlets (high-kinetic-energy erosion) meets the requirements. For Southern Xinjiang’s silt-dominated canals (Cv = 0.05~0.2 mm), maintaining Cv < 13% and optimizing blade curvature to suppress particle aggregation are proposed as critical anti-wear protocols.
(4)
This study establishes universal thresholds for sediment-induced degradation. These mechanisms transcend specific pump geometries, providing broad-spectrum anti-wear protocols: optimizing blade curvature to suppress particle aggregation in similar high-sediment conditions, directly transferable to centrifugal pumps across irrigation systems. The limitation of the study lies in the simplification of certain structures of the centrifugal pump during three-dimensional modeling. Future research will focus on the effects of shape-size-concentration coupling on the wear of key flow-passing components in centrifugal pumps.

Author Contributions

Conceptualization, R.X., S.H. and Z.Y.; methodology, R.X., S.H., Z.Y. and X.H.; software, R.X., Z.Y., Y.H. and C.G.; validation, R.X., S.H. and Y.J.; resources, S.H., X.H. and X.W.; funding acquisition, S.H.; project management, S.H.; writing—original draft preparation, R.X.; writing—review and editing, S.H.; supervision, X.W. All authors have read and agreed to the published version of the manuscript.

Funding

This research was supported by the President’s Fund of Tarim University (TDZKBS202563).

Institutional Review Board Statement

Not applicable.

Informed Consent Statement

Not applicable.

Data Availability Statement

The data presented in this study are available upon request from the corresponding.

Acknowledgments

We gratefully acknowledge the “President’s Fund of Tarim University” for the financial support.

Conflicts of Interest

The authors declare no conflicts of interest.

References

  1. Kang, C.; Cao, Q.; Teng, S.; Liu, H.X.; Ding, K.J. Wear characteristics of a centrifugal pump transporting solid-liquid mixture: An experimental and numerical study. Ain Shams Eng. J. 2024, 15, 102277. [Google Scholar] [CrossRef]
  2. Peng, G.J.; Chen, Q.; Bai, L.; Hu, Z.Q.; Zhou, L.; Huang, X. Wear mechanism investigation in a centrifugal slurry pump impeller by numerical simulation and experiments. Eng. Fail. Anal. 2021, 128, 105637. [Google Scholar] [CrossRef]
  3. Singh, J.; Mohapatra, S.K.; Kumar, S. Performance analysis of pump materials employed in bottom ash slurry erosion conditions. J. Tribol. 2021, 30, 73–89. [Google Scholar]
  4. Shen, Z.; Li, R.; Han, W.; Quan, H.; Guo, R. Erosion wear on impeller of double-suction centrifugal pump due to sediment flow. J. Appl. Fluid Mech. 2020, 13, 1131–1142. [Google Scholar] [CrossRef]
  5. Shen, Z.J.; Chu, W.L.; Li, X.J.; Dong, W. Sediment erosion in the impeller of a double-suction centrifugal pump—A case study of the Jingtai Yellow River Irrigation Project, China. Wear 2019, 422, 269–279. [Google Scholar] [CrossRef]
  6. Bandi, S.; Banka, J.; Kumar, A.; Rai, A.K. Effects of sediment properties on abrasive erosion of a centrifugal pump. Chem. Eng. Sci. 2023, 277, 118873. [Google Scholar] [CrossRef]
  7. Wang, Y.; Wang, X.L.; Chen, J.; Li, G.X.; Liu, H.L.; Xiong, W. Numerical simulation of the influence of mixed sand on erosion characteristics of centrifugal pump. Eng. Comput. 2022, 39, 2053–2080. [Google Scholar] [CrossRef]
  8. Tarodiya, R.; Gandhi, B.K. Effect of particle size distribution on performance and particle kinetics in a centrifugal slurry pump handling multi-size particulate slurry. Adv. Powder Technol. 2020, 31, 4751–4767. [Google Scholar] [CrossRef]
  9. Li, Y.; Zhang, H.Y.; Lin, Z.; Zhang, G.; Zhu, Z.C. Analysis of particle motion and wear characteristics for mixed particle sizes in centrifugal pumps. J. Mech. Sci. Technol. 2023, 37, 4705–4716. [Google Scholar] [CrossRef]
  10. Tang, C.; Yang, Y.C.; Liu, P.Z.; Kim, Y.J. Prediction of abrasive and impact wear due to multi-shaped particles in a centrifugal pump via CFD-DEM coupling method. Energies 2021, 14, 2391. [Google Scholar] [CrossRef]
  11. Singh, J.; Kumar, S.; Mohapatra, S.K. Study on role of particle shape in erosion wear of austenitic steel using image processing analysis technique. Proc. Inst. Mech. Eng. Part J J. Eng. Tribol. 2019, 233, 712–725. [Google Scholar] [CrossRef]
  12. Tarodiya, R.; Gandhi, B.K. Numerical investigation of erosive wear of a centrifugal slurry pump due to solid–liquid flow. J. Tribol. 2021, 143, 101702. [Google Scholar] [CrossRef]
  13. Tarodiya, R.; Gandhi, B.K. Numerical simulation of a centrifugal slurry pump handling solid-liquid mixture: Effect of solids on flow field and performance. Adv. Powder Technol. 2019, 30, 2225–2239. [Google Scholar] [CrossRef]
  14. Wang, H.Y.; Tan, Z.; Kuang, S.B.; Yu, A.B. Numerical modeling and analysis of particle-fluid flow and wall erosion in centrifugal slurry pumps under different solid concentrations. Powder Technol. 2022, 410, 117861. [Google Scholar] [CrossRef]
  15. Peng, G.J.; Huang, X.; Zhou, L.; Zhou, G.X.; Zhou, H. Solid-liquid two-phase flow and wear analysis in a large-scale centrifugal slurry pump. Eng. Fail. Anal. 2020, 114, 104602. [Google Scholar] [CrossRef]
  16. Lin, Z.; Hu, L.H.; Tao, J.Y.; Zhu, X.J.; Zhou, C.H.; Li, Y. Analysis of high-concentration solid-liquid flow and erosion characteristics of centrifugal pump based on CFD-DEM. Chem. Eng. Sci. 2025, 317, 122106. [Google Scholar] [CrossRef]
  17. Chen, M.D.; Tan, L. Solid-liquid multiphase flow and erosion in the energy storage pump using modified drag model and erosion model. J. Energy Storage 2023, 73, 108859. [Google Scholar] [CrossRef]
  18. Tao, Y.; Bai, Y.M.; Wu, Y.C. Influence of blade thickness on solid–liquid two-phase flow and impeller wear in a ceramic centrifugal slurry pump. Processes 2021, 9, 1259. [Google Scholar] [CrossRef]
  19. Guo, X.; Shi, G.T.; Xiao, Y.X.; Ye, X.Y. A study of the relationship between sand movement and flow field distribution and wear causes in a multiphase pump. J. Mar. Sci. Eng. 2024, 12, 1203. [Google Scholar] [CrossRef]
  20. Wang, H.Y.; Huang, F.Y.; Mohammad, F.; Kuang, S.B.; Yu, A.B. CFD-DEM investigation of centrifugal slurry pump with polydisperse particle feeds. Powder Technol. 2024, 447, 120204. [Google Scholar] [CrossRef]
  21. Shi, B.C.; Pan, J.P.; Wu, L.J.; Zhang, X.K.; Qiu, Y.J.; Zhang, Y.D. A prediction method of wear for volute casing of a centrifugal slurry pump. Geofluids 2020, 2020, 8847087. [Google Scholar] [CrossRef]
  22. Pirouzpanah, S.; Patil, A.; Chen, Y.M.; Morrison, G. Predictive erosion model for mixed flow centrifugal pump. J. Energy Resour. Technol. 2019, 141, 092001. [Google Scholar] [CrossRef]
  23. Tarodiya, R.; Gandhi, B.K. Experimental investigation of centrifugal slurry pump casing wear handling solid-liquid mixtures. Wear 2019, 434, 202972. [Google Scholar] [CrossRef]
  24. Wang, H.Y.; Tan, Z.; Kuang, S.B.; Yu, A.B. Systematic investigation of centrifugal slurry pump under different operating condition by DDPM method. Powder Technol. 2023, 430, 119024. [Google Scholar] [CrossRef]
  25. Wang, H.Y.; Tan, Z.T.; Kuang, S.B.; Yu, A.B. DDPM investigation on centrifugal slurry pump with inlet and sideline configuration retrofit. Powder Technol. 2025, 449, 120386. [Google Scholar] [CrossRef]
  26. Dong, W.; Li, S.C.; He, F.; Fan, X.G.; Li, P.X. Effect of variable conditions on transient flow in a solid–liquid two-phase centrifugal pump. Phys. Fluids 2024, 36, 073340. [Google Scholar] [CrossRef]
  27. Wang, Y.P.; Tao, R.L.; Han, C.F.; Li, W.Q.; He, T.L.; Zhu, Z.C. Numerical study on flow and wear characteristics of dense fine particle solid–liquid two-phase flow in centrifugal pump. AIP Adv. 2022, 12, 045109. [Google Scholar] [CrossRef]
  28. Zhang, W.Q.; Yang, S.; Wu, D.Z.A.; Mou, J.G. Effect of particle mass concentration on erosion characteristics of self-priming pump. Proc. Inst. Mech. Eng. Part C J. Mech. Eng. Sci. 2021, 235, 6782–6797. [Google Scholar] [CrossRef]
  29. Teng, S.; Kang, C.; Li, M.H.; Qiao, Y.J.; Ding, K.J. Blockage of the deep-sea mining pump transporting large particles with different sphericity. China Ocean Eng. 2023, 37, 343–352. [Google Scholar] [CrossRef]
  30. Jia, H.; Wang, Y.Q.; Zhu, Z.C.; Su, X.H.; Tang, Z.J. Coarse Particle Motion Characteristics in a Double-Stage Slurry Pump Considering Leakage Flow. Shock Vib. 2021, 2021, 5904446. [Google Scholar] [CrossRef]
  31. Su, X.H.; Tang, Z.J.; Li, Y.; Zhu, Z.C.; Mianowicz, K.; Balaz, P. Research of particle motion in a two-stage slurry transport pump for deep-ocean mining by the CFD-DEM method. Energies 2020, 13, 6711. [Google Scholar] [CrossRef]
  32. Hong, S.M.; Peng, G.J.; Chang, H.; Yu, D.H.; Ji, G.C.; Ma, L.; Wang, Z.Q. Numerical study of erosion characteristics in U-shaped elbow and slurry pump. Phys. Fluids 2024, 36, 073343. [Google Scholar] [CrossRef]
  33. Shi, X.W.; Ding, W.J.; Xu, C.J.; Xie, F.W.; Tian, Z.Z. Numerical investigation of inlet section structure effect on wear characteristic of particle condition in centrifugal slurry pump by CFD-DEM coupling. Part. Sci. Technol. 2023, 41, 834–843. [Google Scholar] [CrossRef]
  34. Song, X.J.; Yao, R.; Shen, Y.B.; Bi, H.J.; Zhang, Y.; Du, L.P.; Wang, Z.W. Numerical prediction of erosion based on the solid-liquid two-phase flow in a double-suction centrifugal pump. J. Mar. Sci. Eng. 2021, 9, 836. [Google Scholar] [CrossRef]
  35. Jiang, Z.Q.; Zeng, X.D.; Li, Y. Study on the relationship between wear and flow characteristics of a centrifugal pump at different mass concentrations. Processes 2021, 9, 988. [Google Scholar] [CrossRef]
  36. Huang, S.; Huang, J.X.; Guo, J.W.; Mo, Y.S. Study on wear properties of the flow parts in a centrifugal pump based on EDEM-fluent coupling. Processes 2019, 7, 431. [Google Scholar] [CrossRef]
  37. Shen, Z.J.; Kong, F.Q.; Liu, Y.; Zeng, J.L.; Yang, W.G.; Wu, J.B. Erosion Analysis of Static Components in Slurry Pumps Based on Reverse Modeling. Fluid Dyn. Mater. Process. 2025, 21, 589–603. [Google Scholar] [CrossRef]
  38. Cao, W.D.; Wang, H.; Tang, J.A. Study on wear characteristics of a guide vane centrifugal pump based on CFD-DEM. J. Mar. Sci. Eng. 2024, 12, 593. [Google Scholar] [CrossRef]
  39. Wang, Y.P.; He, T.L.; Ding, Q.M.; Gao, P.L.; Tao, R.L.; Zhu, Z.C. Analysis of internal flow and wear characteristics of binary mixture particles in centrifugal pump based on CFD-DEM. Processes 2022, 10, 681. [Google Scholar] [CrossRef]
  40. Li, Y.; Zhuang, L.; Jiang, Z.Q. Study of the two-phase flow and wear of a pump with mixed-size particles. Processes 2022, 10, 565. [Google Scholar] [CrossRef]
  41. Wang, Y.P.; Li, W.Q.; He, T.L.; Liu, H.; Han, C.F.; Zhu, Z.C. Experimental study on the influence of particle diameter, mass concentration, and impeller material on the wear performance of solid-liquid two-phase centrifugal pump blade. Front. Energy Res. 2022, 10, 893385. [Google Scholar] [CrossRef]
  42. Wang, Y.P.; Han, C.F.; Zhou, Y.; Lin, Z.; Ma, J.F.; Li, X.J.; Zhang, W. Wear Characteristics of Dense Fine Particles Solid-Liquid Two-Phase Fluid Centrifugal Pump with Open Impellers. Shock Vib. 2021, 2021, 6635630. [Google Scholar] [CrossRef]
  43. Ma, L.B.; Gu, Y.Q.; Xia, K.; Mou, C.Q.; Mou, J.G.; Wu, D.H.; Yan, M.H. Influence of bionic circular groove blade surface on wear performance. Lubricants 2022, 10, 101. [Google Scholar] [CrossRef]
  44. Gu, Y.Q.; Liu, N.J.; Mou, J.G.; Zhou, P.J.; Qian, H.; Dai, D.S. Study on solid–liquid two-phase flow characteristics of centrifugal pump impeller with non-smooth surface. Adv. Mech. Eng. 2019, 11, 1687814019848269. [Google Scholar] [CrossRef]
  45. Xie, Y.S.; Jiang, J.R.; Islam, M.A. Applications of elastomers in slurry transport. Wear 2021, 477, 203773. [Google Scholar] [CrossRef]
  46. Srinivasa, P.K.P.; Selvarajan, L.; Mathan, K.P.; Shriguppikar, S. Enhancing mechanical and morphological properties of glass fiber reinforced epoxy polymer composites through rutile nanoparticle incorporation. Prog. Addit. Manuf. 2025, 10, 831–848. [Google Scholar] [CrossRef]
  47. Shi, B.C.; Zhou, K.L.; Pan, J.P.; Zhang, X.K.; Ying, R.M.; Wu, L.J.; Zhang, Y.D. PIV test of the flow field of a centrifugal pump with four types of impeller blades. J. Mech. 2021, 37, 192–204. [Google Scholar] [CrossRef]
  48. Tan, L.W.; Wang, W.R.; Shi, W.D.; Yang, Y.; Bao, L.L.; Wang, C.L.; Wang, T.; Li, H. A study on the internal vortex structure within a single-blade pump via numerical methods and particle image velocimetry experiments. Phys. Fluids 2024, 36, 115130. [Google Scholar] [CrossRef]
  49. Pu, W.; Ji, L.L.; Li, W.; Yang, Q.Y.; Liu, Z.B.; Yang, Y.; Li, H.M.; Huang, W.; Agarwal, R. Experimental study on the unsteady evolution mechanism of centrifugal pump impeller wake under solid–liquid two-phase conditions: Impact of particle concentration. Phys. Fluids 2024, 36, 113327. [Google Scholar] [CrossRef]
  50. Wang, Y.; Li, M.; Chen, J.; Xu, Q.; Wang, X.L.; Mao, Y.H.; Liu, H.L. Numerical investigation on the internal flow and wear characteristics of solid–liquid two-phase flow in a centrifugal pump under different stall levels. Phys. Fluids 2024, 36, 113367. [Google Scholar] [CrossRef]
  51. Wang, Y.; Wang, X.; Chen, J.; Li, G.X.; Liu, H.L.; Xiong, W. An experimental insight into dynamic characteristics and wear of centrifugal pump handling multi-size particulate slurry. Eng. Fail. Anal. 2022, 138, 106303. [Google Scholar] [CrossRef]
  52. Duan, A.Q.; Lin, Z.; Chen, D.S.; Li, Y. A review on the hydraulic performance and erosion wear characteristic of the centrifugal slurry pump. Particuology 2024, 95, 370–392. [Google Scholar] [CrossRef]
  53. Chen, M.D.; Tang, L. Role of particle motion on pressure fluctuation and erosion for a centrifugal pump in energy storage pump station. J. Energy Storage 2024, 99, 113252. [Google Scholar] [CrossRef]
  54. Zhang, Y.L.; Zheng, S.H.; Zhao, Y.J. Numerical investigation of flow characteristics in the front and rear chambers of centrifugal pump and pump as turbine. Sci. Rep. 2024, 14, 11955. [Google Scholar] [CrossRef] [PubMed]
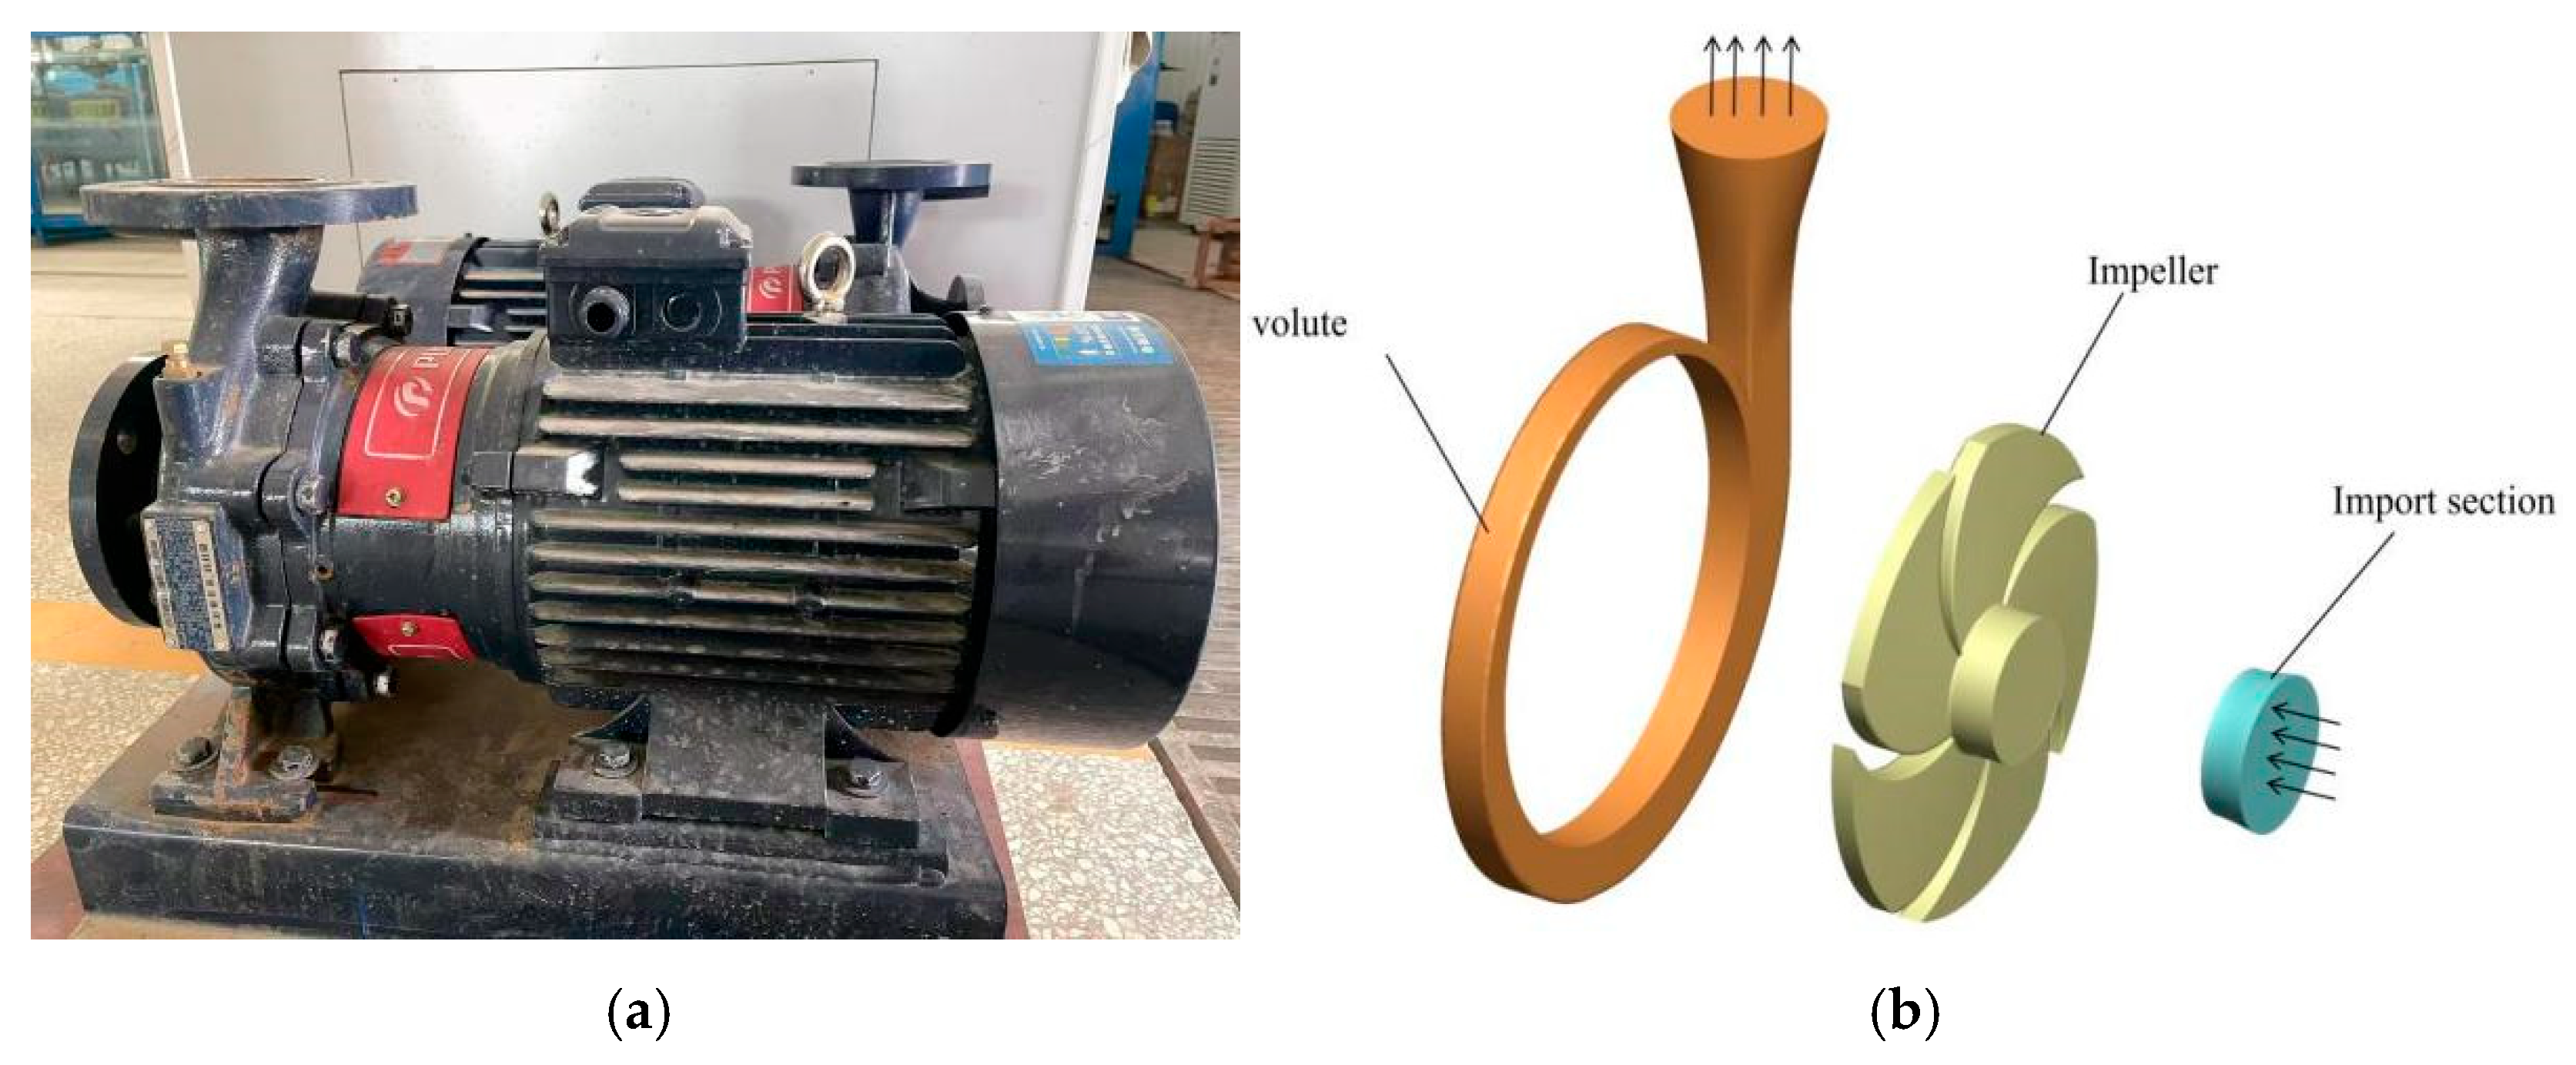
Figure 1. Centrifugal irrigation pump and model. (a) Pump. (b) Model.
Agriculture 15 01843 g001
Figure 2. Grid generation and independence verification: (a) grid generation, (b) grid independence verification.
Agriculture 15 01843 g002
Figure 3. Pressure distribution contour in centrifugal irrigation pump. (a) dp = 0.05 mm. (b) dp = 0.2 mm.
Agriculture 15 01843 g003
Figure 4. Pressure distribution contour in centrifugal irrigation pump. (a) dp = 0.4 mm. (b) dp = 0.6 mm.
Agriculture 15 01843 g004
Figure 5. Pressure distribution contour in centrifugal irrigation pump under 0.8 mm.
Agriculture 15 01843 g005
Figure 6. Pressure variation curves on pressure and suction sides versus volumetric concentration: (a) dp = 0.05 mm, (b) dp = 0.2 mm, (c) dp = 0.4 mm, (d) dp = 0.6 mm, (e) dp = 0.8 mm.
Agriculture 15 01843 g006
Figure 7. Velocity distribution contour in centrifugal irrigation pump. (a) dp = 0.05 mm. (b) dp = 0.2 mm.
Agriculture 15 01843 g007
Figure 8. Velocity distribution contour in centrifugal irrigation pump. (a) dp = 0.4 mm. (b) dp = 0.6 mm.
Agriculture 15 01843 g008
Figure 9. Velocity distribution contour in centrifugal irrigation pump under 0.8 mm.
Agriculture 15 01843 g009
Figure 10. Curve of velocity variation with volumetric concentration: (a) dp = 0.05 mm, (b) dp = 0.2 mm, (c) dp = 0.4 mm, (d) dp = 0.6 mm, (e) dp = 0.4 mm.
Agriculture 15 01843 g010
Figure 11. Variation in velocity under the combined influence of sediment particle size and volume concentration.
Agriculture 15 01843 g011
Figure 12. TKE distribution. (a) dp = 0.05 mm. (b) dp = 0.2 mm.
Agriculture 15 01843 g012
Figure 13. TKE distribution. (a) dp = 0.4 mm. (b) dp = 0.6 mm.
Agriculture 15 01843 g013
Figure 14. TKE distribution under 0.8 mm.
Agriculture 15 01843 g014
Figure 15. Sediment volume distribution under 0.05mm.
Agriculture 15 01843 g015
Figure 16. Sediment volume distribution under 0.2mm.
Agriculture 15 01843 g016
Figure 17. Sediment volume distribution under 0.4mm.
Agriculture 15 01843 g017
Figure 18. Sediment volume distribution under 0.6mm.
Agriculture 15 01843 g018
Figure 19. Sediment volume distribution under 0.8mm.
Agriculture 15 01843 g019
Figure 20. Curve of particle volume distribution varying with concentration: (a) dp = 0.05 mm, (b) dp = 0.2 mm, (c) dp = 0.4 mm, (d) dp = 0.6 mm, (e) dp = 0.8 mm.
Agriculture 15 01843 g020
Figure 21. Curve of the volume fraction of sediment particles varying with particle size and concentration.
Agriculture 15 01843 g021
Figure 22. Experimental system.
Agriculture 15 01843 g022
Figure 23. Experimental site.
Agriculture 15 01843 g023
Figure 24. Comparison of inlet.
Agriculture 15 01843 g024
Figure 25. Comparison of impeller outlet.
Agriculture 15 01843 g025
Table 1. Centrifugal irrigation pump parameters.
ParameterUnitValue
Rated speedr/min2900
Rated flow ratem3/h25
Headm50
PowerkW7.5
Efficiency%52.9%
Inlet Diametermm60
Impeller Diametermm200
Blade outlet widthmm10
Number of bladesindividual5
Outlet blade angle°23.6
Blade wrap angle°100
Base circle diameter of the volutemm210
Table 2. Grid scheme.
SchemeNumber of GridsHead (m)
11,195,28354.35
21,344,41951.22
31,586,65652.04
41,758,11750.44
51,983,62750.28
62,122,05150.02
Disclaimer/Publisher’s Note: The statements, opinions and data contained in all publications are solely those of the individual author(s) and contributor(s) and not of MDPI and/or the editor(s). MDPI and/or the editor(s) disclaim responsibility for any injury to people or property resulting from any ideas, methods, instructions or products referred to in the content.