Abstract
Straw checkerboard sand barriers play a critical role in wind erosion control and dune stabilization. However, manual installation remains predominant, leading to low efficiency and inconsistent quality. To address this, a compact integrated machine was developed for straw checkerboard laying and pressing using rice straw. The design emphasizes the coordinated function of the straw distribution and pressing systems. Physical parameters of rice straw—average bundle length (<120 cm), repose angle (20.95°), and elastic modulus (1.65 MPa)—were measured to guide structural design. A 3D model of the machine and a multibody dynamic simulation of the distribution system were conducted to validate the mechanical configuration. Field trials were performed using straw mass per metre and average layer thickness as evaluation metrics. Single- and multi-factor experiments combined with response surface methodology yielded optimal parameters: conveyor shaft speed of 230 r/min, crankshaft speed of 227 r/min, and a third-stage tooth height of 0.03 m. Field tests in desert environments confirmed straw output of 0.2–0.4 kg/m, layer thickness of 2–3 cm, burial depth of 14.3–19.5 cm, and exposed height of 19.8–39.5 cm. Results meet quality specifications for barrier construction, demonstrating the machine’s strong applicability and potential for engineering deployment in desertification control.
1. Introduction
Land desertification has become one of the most pressing ecological and socio-economic challenges worldwide, severely restricting environmental security and sustainable development. China is among the countries most affected by desertification, with degraded land accounting for approximately 27.2% of its total area. In the arid and semi-arid regions of northwest China, factors such as drought, wind erosion, vegetation degradation, and extreme weather have led to fragile ecosystems, widespread farmland sandification, and declining water availability, all of which pose substantial threats to food security and local livelihoods [1,2,3].
Straw checkerboard sand barriers were widely adopted in China for combating desertification due to their simple structure, ease of construction, and locally sourced materials [4,5]. By forming orthogonal straw grids across sand surfaces, these barriers reduce near-surface wind velocity, trap moving sand, and create favourable microenvironments for vegetation recovery [6,7,8,9]. Despite their effectiveness, these barriers are still primarily installed manually, resulting in high labour intensity, low efficiency, and inconsistent quality. Enhancing mechanization in sand barrier construction is, therefore, critical for improving large-scale desert restoration efficiency [10,11].
Supported by national R&D initiatives, academic and industrial institutions in China have conducted multi-level studies on mechanical solutions for straw barrier installation. The “863 Program” project at Northeast Forestry University pioneered research in this field with its design of a straw checkerboard barrier-laying robot [12], laying a theoretical foundation for mechanical modelling and system design. Lu et al. proposed traction force and travel resistance models for robotic movement on sandy terrain [13]. Zhao et al. developed traction efficiency prediction models and recommended wide-profile low-pressure tires to enhance passability [14,15,16]. Pan et al. employed a six-degree-of-freedom dynamic model to analyze vibrations during operation [17]. Yang et al. demonstrated correlations between straw breakage rate, embedding depth, and wheel width, contributing to power-matching optimization [18,19]. Significant progress has also been achieved in structural improvements of planting, hydraulic, and shear systems by researchers such as Li [20], Jiang [21], and Sun [22,23,24]. The mechanized installation of straw checkerboard sand barriers offers significant advantages in reducing manual labour intensity and improving installation quality and efficiency, thereby ensuring greater scientific rigour and operational effectiveness. Beyond enhancing construction efficiency, mechanized and uniform sand barrier deployment can stabilize near-surface wind fields and soil moisture on a large scale, promote the establishment of psammophytes, and reduce per-unit-area labour costs in remote regions, thereby strengthening the long-term sustainability of restoration projects.
To enhance field adaptability, Beijing Forestry University proposed a multifunctional sand-fixing vehicle in 2010, incorporating a stepwise lateral-insertion mechanism [25,26,27] and simulating soil–blade interactions via discrete element modelling [28]. Additionally, the GSDQ750-132L tractor-type sand barrier machine, developed by Gansu Provincial Construction Investment Group (Lanzhou, China), achieved a daily coverage of over 3.3 hectares—50 to 80 times that of manual labour—demonstrating significant field application potential [29,30].
However, major technical challenges remain. Large-scale machinery typically suffers from excessive size, limited maneuverability, poor adaptability to uneven terrain, and difficulty operating on steep slopes and loose sand. Moreover, issues such as uneven straw distribution, poor pressing stability, and high operational vibration remain unresolved in many existing systems.
To address these limitations, this study first investigates the feasibility of using rice straw as a barrier material by measuring key physical and mechanical properties—including bundle length, elastic modulus, repose angle, and interfacial friction coefficients—which inform system design [31]. Based on these parameters, we develop a compact, integrated straw checkerboard laying and pressing machine featuring automated straw collection, distribution, conveyance, and embedding functions. Particular focus is placed on optimizing the coordination between the straw distribution and pressing mechanisms. The system is validated through 3D modelling, multibody dynamics simulation, and field trials. Further, response surface methodology is applied to optimize operational parameters and assess the machine’s field performance and engineering applicability.
This work offers theoretical insights and practical solutions for the mechanized and intelligent deployment of straw checkerboard sand barriers, contributing to efficient desertification control and sustainable ecological restoration.
2. Materials and Methods
2.1. Preparation of Materials
In this study, rice straw was used as the experimental material. The straw was arranged sequentially with root and tip aligned, then bundled and naturally dried in sunlight. Due to variations in straw length, the bundles were evenly spread on a flat surface to ensure uniform alignment of the root ends before measuring their intrinsic physical properties.
2.2. Determination of Rice Straw’s Intrinsic Parameters
2.2.1. Measurement of Straw Length
A tape measure was used to determine the length of the rice straw, with the longest straw in each bundle used as a reference for comparison. The moisture content was measured and recorded using a TH100 multifunctional moisture metre (Guangzhou Xiangli Instruments Co., Ltd., Guangzhou, China) with an accuracy of 0.1%. The straw length data were analyzed, and a scatter plot of straw lengths and a histogram of the maximum length per bundle were generated, as shown in Figure 1. The results showed that the average moisture content of randomly selected straw samples was 10.4%. Most straw pieces in each bundle were shorter than 120 cm, while 29% exceeded 120 cm. These findings supported the design decision to set the conveyor width at 120 cm.
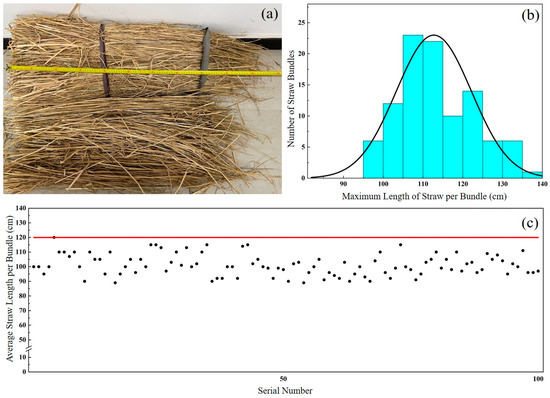
Figure 1.
Measurement of straw length: (a) Actual measurement of straw length; (b) Histogram of maximum straw length per bundle; and (c) Scatter plot of average straw length per bundle.
2.2.2. Measurement of Straw Diameter and Wall Thickness
To minimize measurement errors caused by defective samples, a bundle of naturally air-dried rice straws was randomly selected. From this bundle, 10 straws with intact morphology, without cracks or withering, and having approximately circular cross-sections were chosen for testing. The spike, root, and loosely attached outer leaf sheaths were removed, retaining only the section between the first and second nodes above the root, where the wall thickness was relatively uniform. The ends of the straws were evenly trimmed and used for measurement, as illustrated in Figure 2. This internodal segment was selected to minimize biological and geometric variability associated with nodes and root/tip regions, and to ensure accurate determination of cross-sectional dimensions required for calculating the second moment of area in bending tests. A vernier calliper (Mitutoyo Corporation, Kawasaki, Japan) with an accuracy of 0.01 mm was used to measure the length, external diameters at both ends, and wall thicknesses of the straw samples. The measurement results are summarized in Table 1. The average straw length was 200.26 mm. The mean external diameter near the tip (D1) was 3.09 mm with a wall thickness (T1) of 0.65 mm, while near the root (D2), the external diameter was 4.48 mm and the wall thickness (T2) averaged 1.24 mm.
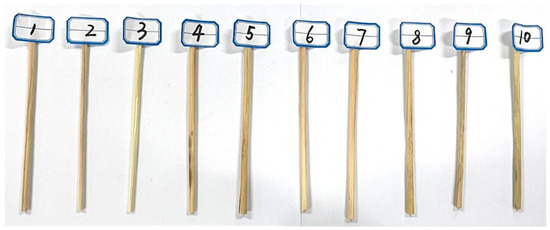
Figure 2.
Mid-stem rice straw samples.

Table 1.
Parameters of rice straw stem samples from the middle section.
2.3. Determination of Physical Parameters of Rice Straw Contact
2.3.1. Determination of the Angle of Repose
The angle of repose of rice straw refers to the stable slope angle formed during natural accumulation, reflecting its motion state and frictional properties. It is primarily governed by static friction, adhesion, and gravity. A larger angle of repose indicates higher inter-straw friction and lower flowability, whereas a smaller angle suggests lower friction and improved flowability.
In this study, a custom-built device was employed to measure the angle of repose. A bundle of rice straw was placed in the device, and the movable galvanized iron plate was rapidly removed, allowing the straw to fall freely under gravity and form a naturally stable slope. The entire process was recorded laterally using a camera, and key frames were extracted. These images were subjected to grayscale conversion, threshold segmentation, boundary extraction, and linear fitting using computer software. Each test was repeated 10 times, and the average value was adopted as the final result, as shown in Figure 3.
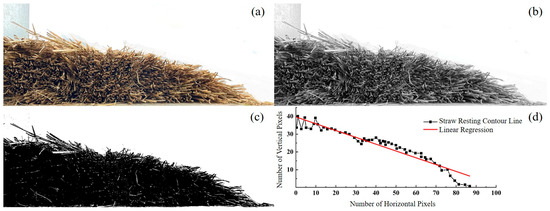
Figure 3.
Image processing and measurement of the resting angle of rice straw: (a) Natural resting configuration of rice straw; (b) Grayscale conversion; (c) Threshold segmentation; and (d) Linear fitting of the resting angle boundary.
After 10 trials, the average angle of repose was determined to be 20.95°± 0.87° (95% CI: [20.36°, 21.54°], N = 10), with a linear fitting correlation coefficient of 0.95794, indicating high reliability of the measurement. The results suggest that rice straw possesses relatively low stacking stability and high flowability. Although surface roughness and inter-fibre friction contribute to temporary stability, the straw’s flexibility and disordered arrangement make it prone to displacement at lower slope angles. This characteristic facilitates smooth flow during mechanical laying, reducing resistance. However, the small angle of repose may also lead to slippage under external forces or wind loads in sand barriers. Therefore, in the design of straw checkerboard sand barriers, it is essential to balance the flowability and structural stability to ensure long-term functionality and mechanical integrity [32].
2.3.2. Measurement of the Bending Modulus of Rice Straw
In the construction of straw checkerboard sand barriers, the mid-section of the straw stems is typically buried in loose sand. Owing to their fibrous structure, the mechanical behaviour of rice straw stems under load resembles the bending deformation of simply supported beams. Therefore, a three-point bending test was conducted to characterize their bending properties [33].
The bending modulus was calculated based on the relationship between the applied force and the resulting deflection. Following the sampling procedure described in Section 2.3.1, ten straw stem specimens, each with a length of 200 mm, were selected. The outer diameters at the upper end (D1) and lower end (D2), as well as the wall thickness (T), were measured for each sample. Each straw specimen was mounted horizontally on a support with an 80 mm span and subjected to a three-point bending test using a SANS electronic universal testing machine (Shenzhen SANS Testing Machine Co., Ltd., Shenzhen, China). A constant loading speed of 5 mm/min was applied during testing, as illustrated in Figure 4a. The corresponding force–displacement (F–W) curves were recorded, and the bending modulus (Eb) of each straw was calculated. The average value and standard deviation are presented in Figure 4b.
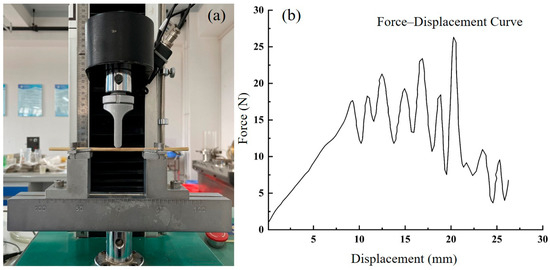
Figure 4.
Three-point bending test of rice straw stems: (a) SANS electronic universal testing machine; and (b) Force–Displacement curve.
The moment of inertia I of the straw cross-section relative to the neutral axis was calculated using Equation (1), and the corresponding bending modulus was subsequently obtained from Equation (2). The average bending modulus of the straw samples was found to be 1.65 ± 0.12 MPa (95% CI: [1.57, 1.73 MPa], N = 10), while the bending failure load was approximately 0.5 N. These results provide essential reference data for assessing the mechanical behaviour of rice straw in the structural design of sand barriers:
where Eb is the bending elastic modulus (MPa); F is the loading force (N); L is the support span (mm); W is the deflection of rice straw (mm); I is the moment of inertia (mm4); D is the outer diameter of rice straw (mm); and t is the wall thickness of rice straw (mm).
2.3.3. Determination of the Friction Coefficients of Rice Straw
During the conveying process, rice straw interacts with the inner surfaces of the straw storage box, conveyor belts, and other straw pieces, generating friction. To quantify this behaviour, both static and kinetic friction coefficients were measured for two contact conditions: between straw and stainless steel, and between straw stems. A self-fabricated test device was employed, consisting of an adjustable inclined plate (0.7 mm thick galvanized iron), an electric push rod (250 mm stroke), a high-precision angle sensor (0.05° accuracy), a level, and a support frame.
To measure the static friction coefficient, the plate was first levelled horizontally, and the straw specimen was placed on its surface. The electric push rod gradually lifted one end of the plate. As the inclination angle increased, the straw eventually reached a critical point of motion initiation. At that point, the angle between the plate and the horizontal plane (denoted as α) was recorded. The static friction coefficient fs was calculated using Equation (3), as illustrated in Figure 5a:
where fs is the static friction coefficient; and α is the critical angle of static friction.
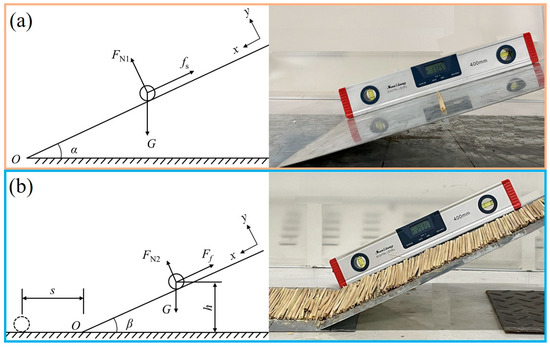
Figure 5.
Measurement of the friction coefficient of rice straw: (a) Principle of static friction coefficient calculation; and (b) Principle of rolling friction coefficient calculation.
For the kinetic friction coefficient, the plate was inclined slightly beyond the critical static angle. A straw sample was then placed on the surface and allowed to slide freely. The inclination angle was adjusted until the straw moved at a constant velocity, indicating a balance between gravitational and frictional forces. The corresponding angle (β) was recorded, and sliding time was measured using a stopwatch or motion sensor to calculate the sliding speed. Each material combination was tested 10 times, and the average values and standard deviations were computed. The calculation method is illustrated in Figure 5b, according to the energy conversion relationship as follows:
where fr is the kinetic friction coefficient; G is the gravity of the rice straw (N); β is the critical angle of kinetic friction; h is the placement height of the rice straw (mm); and s is the displacement of the straw on the plane (mm).
The experimental results are summarized in Table 2. The static friction coefficient between straw and galvanized iron was relatively high (0.4), suggesting strong adhesion before the onset of motion. This may result in considerable resistance during the transport and laying processes in straw-based sand barrier systems. The static friction coefficient between straw stems was lower (0.35), primarily due to inter-fibre physical contact rather than adhesive interactions.
Table 2.
Friction Coefficient of Rice Straw Stems.
The kinetic friction coefficient between straw and galvanized iron was measured at 0.3, which is lower than its static counterpart but still indicative of significant resistance during sliding. This implies that once motion begins, the frictional resistance does not decrease substantially, potentially increasing energy consumption in conveying systems. In contrast, the kinetic friction coefficient between straw stems was extremely low (0.016), indicating nearly frictionless motion. This is attributed to the similar material properties and the inherent flexibility of straw fibres, which facilitate smooth sliding [34]. Such characteristics enhance laying efficiency by reducing energy loss during mechanical operations.
3. Design and Analysis
3.1. Structure and Working Principle of the Straw Grid Paving and Pressing Machine
The straw grid paving and pressing machine comprises six primary subsystems: the power system, paving system, pressing system, straw storage system, and traction system, as illustrated in Figure 6. Among them, the paving and pressing mechanisms constitute the core functional components. The paving system mainly consists of a conveyor belt and a three-stage straw-combing mechanism, while the pressing system is centred on a rotating pressing disc. Forward propulsion is provided by an agricultural tractor via the traction system. Key technical parameters are summarized in Table 3.
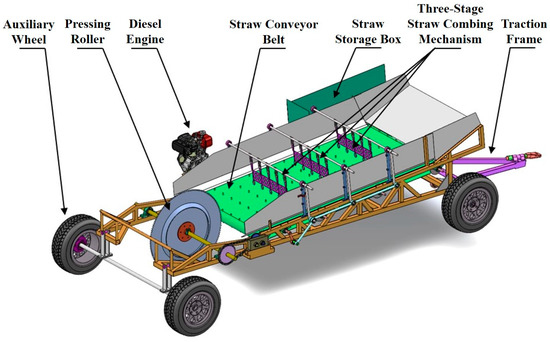
Figure 6.
Schematic Diagram of the Structure of the Straw Grid Paving and Pressing Machine.
Table 3.
Main technical parameters of straw sand barrier paving and pressing machine.
In desert operations, to adapt to uneven terrain and loose sand, the integrated straw checkerboard laying and pressing machine employs a large-diameter serrated press roller. Under its own weight, the lower portion of the roller penetrates the sand and rolls forward with the machine, passively conforming to micro-undulations on dune surfaces, thereby maintaining continuous ground contact and reducing vibration when traversing irregular sand ridges. This motion is transmitted through a chain drive to the gearbox, reversed within, and then delivered to a secondary sprocket, which drives the conveyor belt in a direction opposite to the disc rotation. Straw within the inclined storage box slides downward under gravity. Upon reaching the lower end of the storage box, the straw contacts the moving conveyor belt, where uniformly distributed barbed teeth help secure and guide it onto the belt.
The power output from an F173 air-cooled diesel engine is reduced via two stages of chain transmission and fed into a crank-rocker mechanism, which drives the combing teeth to operate in sequence. The primary combing mechanism performs initial separation and regulates the feed volume. The secondary mechanism further disperses the straw for better uniformity, and the tertiary mechanism conducts final combing and straightening to ensure stable output at the conveyor belt’s end.
As the straw exits the belt, the rotating pressing disc collects it via its toothed grooves and presses it uniformly onto the sand surface. Most straw stems are embedded approximately 10–15 cm into the sand layer by the disc, and, aided by lateral sand backfilling, they stand upright. This process forms a stable straw grid structure with an average height of approximately 0.5 m.
3.2. Design and Analysis of the Straw-Paving System
3.2.1. Design of the Straw Combing Mechanism
In the straw-combing mechanism, the adjustable spacing between the primary combing teeth and the conveyor belt ranges from 4 to 10 cm, that of the secondary teeth from 3 to 4 cm, and the tertiary teeth from 2 to 3 cm. This staged narrowing of spacing ensures that the straw is thoroughly combed and uniformly dispersed before being delivered to the pressing disc.
The combing motion is generated by a crank-rocker mechanism, which is a planar four-bar linkage. The combing teeth are fixed to rocker shafts of equal length. As illustrated in Figure 7, AB represents the crank, BC the connecting rod, and CD the rocker (combing shaft). The kinematic behaviour of the combing mechanism follows the motion of the hinge-type four-bar linkage.
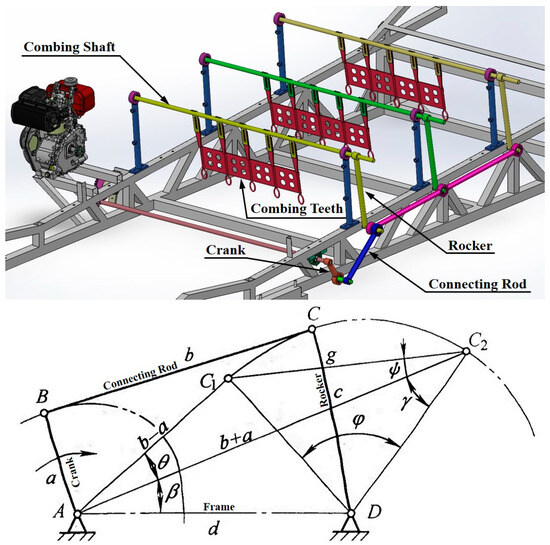
Figure 7.
Schematic diagram of the motion of the straw-combing mechanism.
When the sprocket rotates at a constant speed, the crank (AB) rotates uniformly with angular velocity ω, causing the rocker to swing between positions C1D and C2D. The included angle of this swing is denoted as θ. The quick-return ratio K, defined as the ratio of forward and return stroke speeds, is given by the following:
Assuming a quick-return ratio of K = 1.4, the corresponding extreme angle θ can be calculated as follows:
To ensure that the combing teeth swing sufficiently to effectively separate the straw, the minimum transmission angle γmin during the reciprocating motion of the combing mechanism should be maximized. Therefore, the transmission angle γ is set as the design objective. According to mechanical principles, for a crank-rocker mechanism, the minimum transmission angle γmin occurs when the driving crank AB and the frame AD are collinear at one of two possible positions.
Given a rocker swing angle of φ = 40°, reference [35] provides that the maximum achievable γmin ≈ 36°, with β ≈ 66°. Using this data, the normalized link lengths can be calculated as follows:
To ensure the combing teeth have a large operating radius, the length of the combing shaft is chosen to be c = 390 mm. Consequently, the crank length is a = 130 mm, the length of the connecting rod is b = 305 mm, and the distance from the crank to the centre of the combing shaft is d = 530 mm.
To ensure a large working radius for the combing teeth, the rocker (combing shaft) length is set to c = 390 mm, resulting in a crank length of a = 130 mm, connecting rod length of b = 305 mm, and a frame length (distance from crank pivot to combing shaft pivot) of d = 530 mm.
3.2.2. Simulation Analysis of the Straw-Combing Mechanism
To optimize the motion performance of the straw-combing mechanism, simulations were carried out to evaluate the striking velocity, acceleration, and displacement of the combing teeth [36]. The objective was to ensure periodic and effective straw combing within the designated range while minimizing acceleration fluctuations, thereby enhancing the stability of straw separation and reducing reactive forces transmitted to the tractor.
Multibody simulations were conducted in RecurDyn (V9R2) and EDEM (2020). The combing mechanism was modelled as a planar rigid four-bar linkage with revolute joints at A, B, C, and D. Gravity (9.81 m·s−2) was enabled. The crank was driven at constant angular velocity corresponding to target speeds (200–300 r/min, 10 r/min increments). Masses and principal moments of inertia of links and the tooth carrier were imported from the CAD model (material: 45# steel, density 7850 kg·m−3). Rayleigh damping (small proportional coefficients) was applied to suppress nonphysical oscillations. The solver used an LMS/GSTIFF integrator with automatic step control (maximum step 1.0 × 10⁻⁴ s, local error tolerance 1 × 10⁻⁵). Straw–tooth contact was not modelled in this stage; the objective was to evaluate kinematic envelopes (velocity/acceleration) to avoid excessive striking.
As the primary combing teeth are responsible for initial straw separation and must overcome the highest adhesion resistance, their kinematic behaviour is representative of the entire combing mechanism. Therefore, motion analysis was focused on the primary combing teeth. A reference point was placed at the centroid of the primary combing teeth, and simulations were performed to obtain the velocity and acceleration variation curves at different crankshaft rotational speeds.
Figure 8 presents the horizontal-direction variation curves of reaction force, velocity, and acceleration for the primary combing teeth at crank speeds of n1 = 220 r/min and n2 = 240 r/min. The simulation results indicate that the minimum effective crank speed is approximately 200 r/min, below which straw combing becomes uneven. As the crank speed increases, the uniformity of straw dispersion improves significantly. However, at speeds exceeding 300 r/min, the aggressive motion of the combing teeth leads to excessive disturbance and even breakage of the straw. This negatively affects the straw’s ability to penetrate the sand to the target depth and to remain upright, thereby failing to meet the design criteria of the sand barrier system. Therefore, the optimal operating range for the crankshaft speed is determined to be between 200 and 300 r/min, which ensures sufficient combing effectiveness and improved uniformity of straw-laying while maintaining structural integrity.
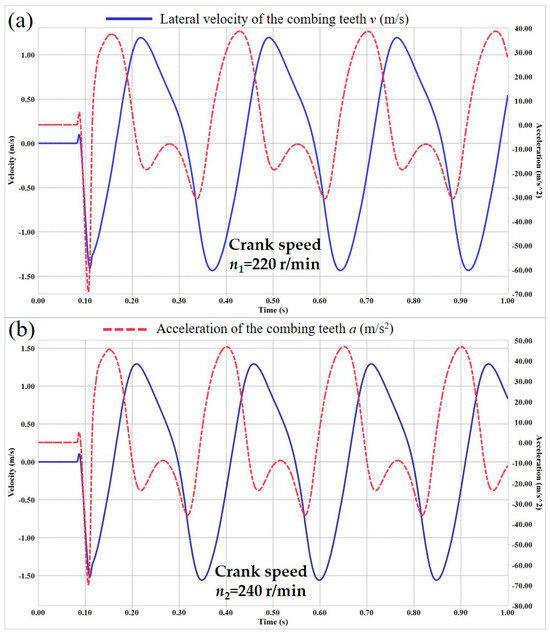
Figure 8.
Horizontal velocity and acceleration curves of the primary combing teeth: (a) Crank speed n1 = 220 r/min; and (b) Crank speed n2 = 240 r/min.
3.2.3. Design of the Power Transmission Ratio
The crank of the straw-combing mechanism is powered by a diesel engine, and the transmission structure is illustrated in Figure 9. According to field test data, the F173 diesel engine provides a stable output speed of ne = 1400 r/min, while optimal combing performance is achieved when the crankshaft speed nc lies between 220 and 240 r/min. Therefore, the transmission ratio i of the straw-paving system is designed based on a target crank speed of nc = 230 r/min. It can be expressed as follows:
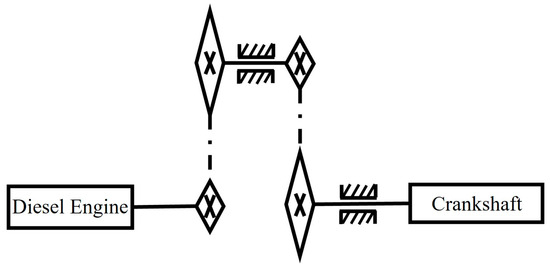
Figure 9.
Motion diagram of straw-paving system.
The total transmission ratio i is the product of the two-stage chain drive ratios i1 and i2:
Chain transmission was selected for its stable speed ratio, strong adaptability to harsh environments, and long-distance power transmission capability. A two-stage chain drive system was employed to ensure smooth and reliable operation of the combing mechanism. Typically, chain drive ratios are limited to i ≤ 7, and commonly set between 2.0 and 3.5. In this design, the first-stage ratio was set as i1 = 2.5 and the second-stage as i2 = 2.4.
To minimize wear on the chain and sprockets, mechanical design standards recommend selecting an even number of chain links and an odd number of sprocket teeth, preferably relatively prime. The selected sprocket parameters are listed in Table 4.
Table 4.
Sprocket parameters for the straw-paving system.
The transmission ratios were recalculated based on the sprockets as follows: i1 = z2/z1 = 35/17 = 2.06, i2 = z4/z3 = 51/17 = 3. The total transmission ratio is I = i1·i2 = 2.06 × 3 = 6.18. Therefore, the crankshaft speed driving the straw-combing teeth is calculated as: nc = ne/I = 1400/6.18 = 226.54 r/min, which satisfies the design requirements.
3.3. Design and Analysis of the Straw Pressing System
3.3.1. Design of the Straw Press Disc
The 3D structural model of the straw press disc is illustrated in Figure 10. The initial design adopts a pressing disc with a diameter of D = 950 mm and an outer edge thickness of 6 mm, constructed from 45# carbon steel. To enhance structural rigidity and strength, reinforcing ribs are symmetrically arranged on both sides along a circular path with a diameter of φ = 650 mm. Grooves with a depth of 20 mm are evenly distributed along the rim of the disc. These grooves are designed to engage and guide the straw discharged from the conveyor belt, facilitating its uniform and stable insertion into loose sand to a depth of approximately 15 cm. The rolling-induced lateral backfilling generated by the disc further stabilizes the inserted stems, enabling them to remain upright even in low-bearing, loose sand. This design consideration addresses the instability typically caused by reduced soil resistance in such terrains. This process promotes the formation of a vertical straw grid barrier. The pressing disc is mounted to the drive shaft via a flange connection.
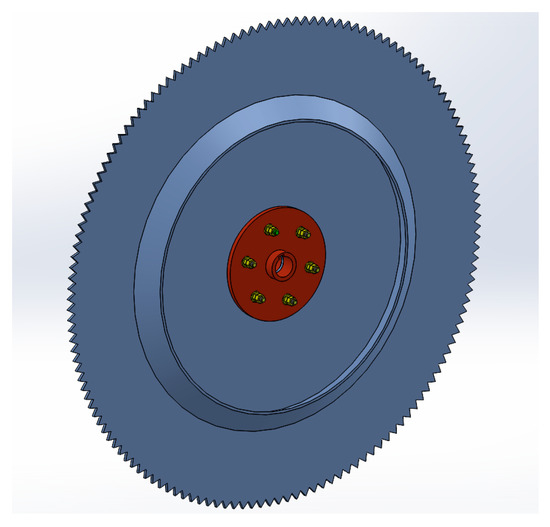
Figure 10.
3D structural diagram of the straw press disc.
3.3.2. Force Analysis of the Pressing Disc
When operating in desert environments, the straw press disc must support the machine’s weight, embed the laid straw into the sand, and simultaneously act as a driving wheel for the conveyor belt. Therefore, the forces acting on the pressing disc directly influence both the operational stability of the machine and the effectiveness of straw embedding. Excessive slippage of the disc significantly diminishes the sand-pressing efficiency of the straw grid and may lead to straw displacement, resulting in uneven distribution and compromised uniformity in straw delivery.
The interaction between the pressing disc and the sand consists of two components: bearing characteristics and shear characteristics. The bearing characteristics determine the depth to which the disc sinks into the loose sand, thereby affecting machine stability. The shear characteristics govern the disc’s tractive force, influencing its forward mobility. By analyzing these interactions through the Bekker pressure–sinkage model and the J. Janosi shear equation, the optimal design parameters for the pressing disc can be systematically determined.
Soil Mechanics Characteristics Study
To analyze the forces acting on the straw press disc, the Bekker model was adopted to decompose soil deformation into vertical (bearing) and horizontal (shear) components [37]. The bearing and shear capacities of the soil depend on its physical and mechanical properties. Table 5 presents key mechanical parameters for different soil types, including deformation index, cohesion, internal friction angle, and shear modulus.
Table 5.
Parameters for various terrain types.
According to the Bekker model [37,38], the average normal pressure σ exerted by sand on the disc surface can be expressed as follows:
where K is the soil deformation modulus, n is the soil deformation index, σ is the average normal pressure, and z is the sinkage depth of the disc.
The soil deformation modulus K is determined by the following:
where b is the width of the disc, and kc and kϕ are soil parameters associated with cohesive and frictional contributions.
The normal pressure in loose sand can also be expressed using an empirical relationship as follows:
The shear stress τ between the press disc and the plastic soil is calculated using the J. Janosi equation:
where τ is the shear stress of the soil, c is the cohesion of the sandy soil, σ is the unit pressure perpendicular to the shear plane, φ is the internal friction angle of the soil, j is the shear displacement, and j0 is the modulus of the shear stress-displacement curve of the soil.
Study of the Interaction Between the Straw Press Disc and Sand
In a small area on the outer edge of the straw press disc (length dS, width b), the force FQ acting in a direction perpendicular to the outer edge of the disc satisfies Equation (17). The vertical load W on the disc balances the supporting force of the sand, as given in Equations (3)–(14). The horizontal resistance Ff, caused by the thrust Ft of the straw press disc, can be calculated using Equations (3)–(15). The geometric relationship of the disc in Figure 3, Figure 4, Figure 5, Figure 6 and Figure 7 satisfies Equations (3)–(16).
In an infinitesimal area near the outer edge of the straw press disc—of length dS and width b—the normal force FQ acting perpendicularly to the disc’s circumference is given by Equation (17). The total vertical load W, exerted on the disc, is balanced by the integrated normal support force from the underlying sand, as expressed in Equation (18). The horizontal resistance force Ff, resulting from the thrust force Ft generated by the disc’s forward motion, can be calculated using Equation (19). The geometric parameters of the disc, illustrated in Figure 11, satisfy the following relationship: Equation (20).
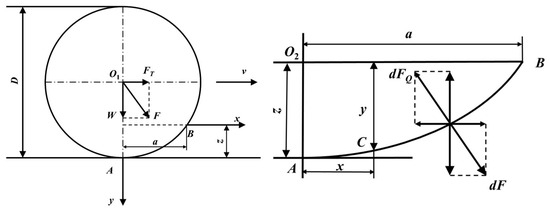
Figure 11.
Calculation diagram of rigid wheel.
From Equations (15) and (20), the following relationships are derived:
Let , and, by expanding X into a Taylor series and taking the first two terms of Equation (23), we obtain Equation (24):
Integrating Equation (24) yields the analytical relationship between the vertical load W and the disc’s penetration depth z in the sand:
Considering the traction force Fd required for uniform rolling of the straw press disc, the following expression is derived:
By substituting the parameters listed in Table 5 and setting the roller width b = 6 mm, the vertical load is calculated as W = 541.42 N, and the horizontal resistance is Ff = 247.63 N.
As illustrated in Figure 12, under the pressure exerted by the straw press disc, the shear deformation j in the sand is initially zero at the point of contact between the disc rim and the soil surface. The maximum shear deformation jmax occurs at the deepest penetration point of the disc into the soil.
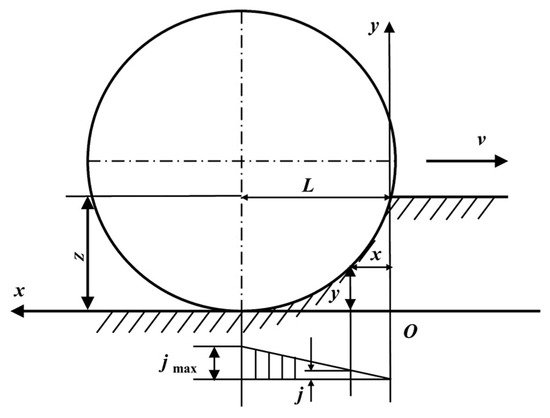
Figure 12.
Schematic diagram for shear deformation of loose sand under press disc.
The shear deformation j is given by the product of the slip velocity vj and the duration t over which the deformation occurs:
Additionally, considering the slip ratio s during disc operation as follows:
where vt is the theoretical velocity of the disc, r the radius of the disc, ω is the angular velocity of the disc, and v is the actual horizontal speed of the disc. L is the stroke length that generates jmax (half of the chord length).
The maximum shear deformation jmax is as follows:
The soil deformation at any point on the rim can be expressed using the similarity triangle relationship:
At any point along the rim, the shear deformation j is expressed using the geometric similarity relationship:
where x is the horizontal displacement from the initial contact point of the rim into the sand soil.
From Equations (16), (30) and (31), the average shear stress τ of the sand soil is as follows:
Accordingly, the traction force Fd exerted by the disc is derived as follows:
The traction force Fd depends on the soil properties, the penetration depth of the disc, and its geometry (diameter D, width d, and average normal stress σ). For loose sand, the optimal slip ratio at which Fd reaches its maximum is typically low. This is because loose sand provides sufficient traction at a low slip rate, while higher slip rates lead to rapid sand soil movement and loss of support. Theoretical and experimental results indicate that Fd peaks when the slip ratio s = 15% in loose sand.
Based on the theory of soil stability and bearing capacity, the “Janbu” method provides the following calculation formula:
where m is the compression modulus coefficient of the soil, a the soil’s compressibility coefficient, σ the normal stress on the soil, and pa the atmospheric pressure.
From Equations (32) and (35), we obtain the following:
where the internal friction angle of the soil φ = 30°, and half chord length of the disc = 0.3464 m, yields: Fdmax = 5788.956 N using Equation (36). Given that the horizontal resistance Ff is significantly smaller than Fdmax, the straw press disc demonstrates adequate traction and structural stability for field operation. In addition, kinematic synchronization between the press disc and the conveyor belt is achieved via a chain–gear transmission system. This ensures that the straw-laying rate matches the actual ground speed, preventing over-feeding or under-feeding during local slip events, which are common on steep slopes or loose sand surfaces.
3.3.3. Transmission Ratio Between the Straw Press Disc and the Conveyor Belt
Chain drive was selected for its ability to maintain a precise average transmission ratio and its robust environmental adaptability, making it suitable for the low-speed, high-load operating conditions of the straw press disc. To achieve synchronized and stable rotation between the straw press disc and the conveyor belt, a combined chain–gear transmission system was adopted, as illustrated in Figure 13.
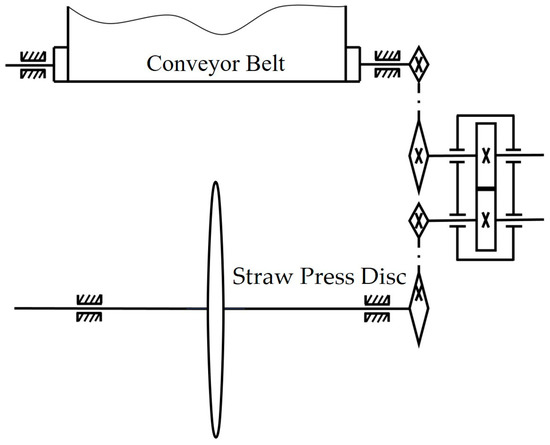
Figure 13.
Motion diagram of straw pressing disc-conveyor mechanism.
In order to match the linear velocity of the outer edge of the straw press disc with that of the conveyor belt, the total transmission ratio between the two was designed as i = D/DR = 8.36, where the diameter of the straw press disc D = 950 mm and the diameter of the conveyor belt drum DR = 114 mm. To reduce manufacturing costs and save space, the system incorporated a gear transmission using two identical straight gears, with the gearbox solely performing direction reversal. The primary chain drive (with a transmission ratio i1 = 3) first transmits rotational motion from the straw press disc to the gear reverser. Subsequently, the secondary chain drive (transmission ratio i2 = 2.8) transfers the reversed rotational motion to the conveyor belt drum shaft, thus driving the conveyor belt. Ultimately, the conveyor belt conveyed the processed straw to the sand surface at a rate of 0.3~0.4 kg/m, ensuring even distribution of the straw.
To match the linear velocity at the outer edge of the straw press disc with that of the conveyor belt, the overall transmission ratio was designed as i = D/DR = 8.36, where D = 950 is the diameter of the straw press disc, and DR = 114 mm is the diameter of the conveyor belt drum. To reduce production cost and conserve space, two identical spur gears were used, with the gear reducer serving only to reverse the direction of motion. The primary chain drive (transmission ratio i1 = 3) transfers rotational motion from the straw press disc to the gear reverser. The secondary chain drive (transmission ratio i2 = 2.8) then delivers the reversed motion to the drum shaft, thereby driving the conveyor belt. Ultimately, the conveyor system transports processed straw to the sand surface at a feed rate of 0.3~0.4 kg/m, ensuring uniform straw distribution.
4. Results and Discussion
4.1. Overview of the Test
The field experiments were conducted at the Comprehensive Sand Control Experimental Station in Minqin County, Gansu Province, located on the southeastern edge of the Tengger Desert in China (102°58′ E, 38°35′ N; elevation 1378 m), where the landforms are dominated by mobile sand dunes and gravelly Gobi. The experimental environment featured temperatures above 30 °C with calm or light wind conditions. Under each operating condition, straw-paving was performed three times, with each run covering 100 m. In accordance with the Chinese national standard GB/T 21141-2007—“Technical Specifications for Sand Prevention and Control”, the key performance indicators for the integrated straw grid paving and pressing machine were defined [39]. The test indices are summarized in Table 6.
Table 6.
The performance index of the complete machine test.
4.2. Design and Analysis of Straw-Paving Tests
To evaluate the influence of key parameters on the uniformity and stability of straw distribution during the separation and laying process, both single-factor and multi-factor experiments were conducted. The quality of straw paving was quantitatively assessed, as shown in Figure 14.
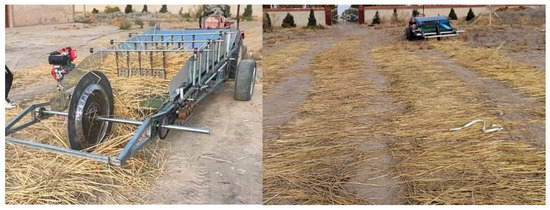
Figure 14.
Experimental setup for straw-laying tests.
4.2.1. Design and Analysis of Single-Factor Straw-Paving Tests
Under tractor traction, the straw press disc rotates and simultaneously drives the paving system forward, ensuring even distribution of straw from the storage box onto the sand surface. In the single-factor experiments, three independent variables were selected: conveyor belt drum speed (A), crankshaft speed (B), and the height of the third-level combing teeth (C). The quality of laid straw per unit length (Q) and the average straw thickness (T) were taken as the primary evaluation metrics. To ensure test reliability and data accuracy, each test consisted of laying three rows of straw; the total row lengths were measured, and five random measurement points per row were selected to determine T.
Figure 15a illustrates the influence of variable A (with B = 230 r/min, C = 0.03 m). The results show that as A increases, both Q and T decrease. This trend is attributed to the increased forward velocity of the tractor, which raises the rotational speed of the press disc and conveyor belt, leading to faster laying rates and reduced straw quantity and thickness. A drum speed range of 170~250 r/min was found to meet the construction requirements of straw–sand barriers. Therefore, three levels of A (170, 210, and 250 r/min) were chosen for subsequent multi-factor tests.
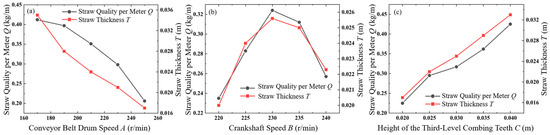
Figure 15.
Effects of different factors on straw-paving quality: (a) Influence of conveyor belt drum speed on Q and T; (b) Influence of crankshaft speed on Q and T; and (c) Influence of third-level combing tooth height on Q and T.
Figure 15b presents the results for crankshaft speed B (with A = 210 r/min, C = 0.03 m). As B increases, both Q and T first increase and then decrease. Initially, a higher crank speed enhances the frequency of the combing teeth, improving straw dispersion. However, when the frequency becomes excessive, the third-level combing teeth strike the straw too forcefully, resulting in fragmentation and uneven distribution, thereby reducing Q and T. Accordingly, B was set at three levels (220, 230, and 240 r/min) for the multi-factor tests.
Figure 15c shows the effect of combing tooth height C (with A = 210 r/min, B = 230 r/min). The data indicate that increasing C enhances both Q and T. This occurs because a larger gap between the third-level combing teeth and the conveyor belt permits more straw to pass through, increasing both the amount and thickness of straw laid. The tests suggest that the height range of 0.02~0.04 m is optimal, and these three values (0.02, 0.03, and 0.04 m) were selected for the multi-factor experiment.
4.2.2. Design and Analysis of Multi-Factor Straw-Paving Tests
To investigate the interactions between the conveyor belt drum speed A, crankshaft speed B, and the height of the third-level combing teeth C, with straw quality per metre Q and average straw thickness T as response variables, multi-factor tests were designed and analyzed using Design-Expert 11. The Box–Behnken design was applied, with the influencing factors and their levels encoded as shown in Table 7, and the experimental scheme and results are presented in Table 8.
Table 7.
Influence factors and level of experiment.
Table 8.
Box–Behnken experimental scheme and results.
To investigate the interactions among conveyor belt drum speed (A), crankshaft speed (B), and the height of the third-level combing teeth (C), a series of multi-factor tests were designed and analyzed using Design-Expert 11 software. In this study, straw quality per metre (Q) and average straw thickness (T) served as the response variables. The Box–Behnken design method was adopted, with the coded levels of the influencing factors shown in Table 7. The experimental scheme and corresponding results are summarized in Table 8.
Based on the data presented in Table 8, quadratic multiple regression models were developed to predict the response variables Q and T within the specified ranges, and are denoted as Equations (37) and (38):
The statistical significance of these regression models was evaluated through analysis of variance (ANOVA), with the results summarized in Table 9 and Table 10.
Table 9.
Variance analysis for the quadratic regression models of straw quality per metre.
Table 10.
Variance analysis for the quadratic regression models of straw thickness.
The multiple regression model for straw quality per metre (Q) yielded an F-value of 29.42 and a p-value < 0.0001, indicating that the model was statistically highly significant and exhibited a strong goodness of fit (R2 = 0.9743). The linear terms A and C, along with the quadratic terms A2, B2, and C2, had a highly significant effect on Q (p < 0.01). In contrast, the linear term B and the interaction terms AB and AC showed statistically significant effects (p < 0.05). The interaction term BC and the lack-of-fit term were not statistically significant (p > 0.05). Based on the F-values, the order of influence on Q was C > A > B, indicating that the height of the third-level combing teeth had the most substantial effect on straw quality, followed by the conveyor belt drum speed and then the crankshaft speed. This indicates that the effect of drum speed (A) on Q depends on the crank-driven combing frequency (B) and on the discharge aperture defined by the third-level tooth height (C). Physically, when A is high but B is low, feed starvation may occur; conversely, when both A and B are high with a small C, over-aggressive striking and intermittent clogging can reduce Q. These interaction patterns are consistent with the stronger surface curvature observed in Figure 16b,c.
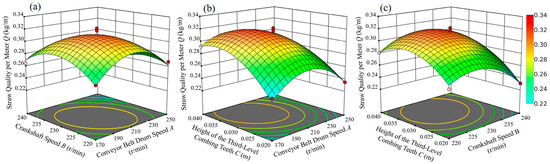
Figure 16.
Response surface of interaction among influencing factors of straw spread per metre: (a) Q = f (A, B); (b) Q = f (A, C); and (c) Q = f (B, C).
The multiple regression model for average straw thickness (T) yielded a p-value of 0.0021, indicating that the model was statistically significant and exhibited a strong fit. Among the variables, the linear term C and the quadratic term A2 had a highly significant effect on T (p < 0.01), whereas the remaining terms showed no statistically significant influence (p > 0.05). Based on the magnitude of the effects, the influence of the factors on T followed the same trend as for Q, ranked as C > A > B. Notably, none of the interaction terms (AB, AC, or BC) for T reached statistical significance (p > 0.05), implying that layer thickness is primarily governed by the discharge aperture C and the nonlinear (quadratic) response to drum speed A, rather than by cross-factor couplings. From a design standpoint, T can, therefore, be robustly controlled by specifying C within 0.02–0.04 m and tuning A within the validated range, without relying on specific combinations with B.
Response surface plots based on the regression models were generated to evaluate the interactive effects of the three factors on straw quality per metre (Q) and average straw thickness (T). Figure 16 illustrates the response surface for Q. As shown in Figure 16a, when conveyor belt drum speed A remained constant, Q first increased and then decreased with increasing crankshaft speed B, and vice versa. In Figure 16b, with A constant, Q increased and then plateaued as the height of the third-level combing teeth C increased; with C constant, Q increased initially and then declined with increasing A. Figure 16c shows that with B constant, Q first rose and then dropped as C increased, while with C constant, Q exhibited a gradual rise followed by a sharp decline with increasing B. Among the three surfaces, Figure 16b,c displayed greater convexity than Figure 16a, indicating more pronounced interactions between factor C and both A and B. These graphical features are consistent with the ANOVA results for Q, in which AB and AC were statistically significant while BC was not (Table 9).
Figure 17 illustrates the response surface for average straw thickness (T). In Figure 17a, the interaction between conveyor roller speed A and crankshaft speed B reveals that T remained relatively stable with increasing B when A was held constant, while it initially increased and then decreased with increasing A when B was constant. In Figure 17b, as C increased, T gradually increased when A was fixed; conversely, with fixed C, T first increased and then declined as A increased. Figure 17c shows that T steadily increased with increasing C when B was constant, whereas it increased slightly and then declined slowly with increasing B when C was constant. Overall, the three-factor interactions significantly affected T, with Figure 17b displaying the most pronounced convexity, indicating that the interaction between third-level combing teeth height (C) and conveyor roller speed (A) exerted the greatest influence on average straw thickness.
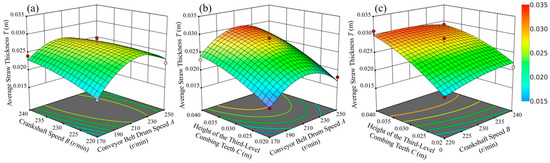
Figure 17.
Response surface of interaction among influencing factors of a straw-laying thickness: (a) T = f (A, B); (b) T = f (A, C); and (c) T = f (B, C).
4.2.3. Response Surface Optimization and Verification Test
Based on decades of practical experience in straw checkerboard sand barrier projects in China and long-term field monitoring results, construction standards for straw checkerboard sand barriers have been established. To achieve optimal porosity and surface roughness, thereby reducing near-surface wind speed while avoiding excessive straw usage, the target values for straw quantity per unit length (Q = 0.3 kg/m) and average straw thickness (T = 0.025 m) were set. The uniformity parameters of straw paving were optimized using Design-Expert 11 software. The objective of the optimization was to enhance the operational stability of the combing mechanism while maximizing the machine’s working speed. The optimization prioritized maximizing the conveyor belt drum speed, with crankshaft speed as a secondary target. The optimization results are summarized in Table 11.
Table 11.
Optimization scheme of straw-laying quality.
To verify the reliability of the optimized parameters, three repeated validation tests were conducted. The average measured value of straw quality per metre (Q) was 0.294 kg/m, with a relative error of 1.01% compared to the predicted value. The measured average straw thickness (T) was 0.025 m, yielding a relative error of 3.85%. The close agreement between measured and predicted values confirms the feasibility and reliability of the optimization scheme. However, in this study, the machine’s performance was evaluated only through short-term field trials, and its long-term durability and maintenance performance have yet to be assessed. Future research will, therefore, conduct in-depth investigations to address these aspects, incorporating intelligent image recognition and satellite navigation-based path planning to optimize the mechanical structure and enhance the machine’s adaptability to various desert environments.
5. Conclusions
To overcome the limitations of low efficiency, high labour intensity, and inconsistent quality inherent in manual installation of straw checkerboard sand barriers, this study developed a compact integrated machine designed for the mechanized laying and pressing of straw-based barriers.
- (1)
- Fundamental physical properties of rice straw—including bundle length, stem repose angle, elastic modulus, and friction coefficients—were experimentally determined. These measurements provided essential theoretical support for the structural design, facilitating accurate straw separation and uniform distribution.
- (2)
- A multi-stage combing mechanism driven by a crank-rocker linkage was designed based on the mechanical response and motion behaviour of straw during the combing process. Its dynamic performance was validated via kinematic simulations and experimental tests. Additionally, a serrated-edge compaction roller, with a diameter of 950 mm and a thickness of 6 mm, was developed through force and motion analysis to ensure effective compaction and operational stability.
- (3)
- Field experiments were conducted in desert conditions to evaluate the prototype’s performance in terms of feeding uniformity, operational continuity, and pressing effectiveness. Key operational parameters were optimized using both single-factor analysis and response surface methodology. The optimal combination included a conveyor shaft speed of 230 r/min, crankshaft speed of 227 r/min, and a third-stage combing tooth height of 0.03 m. The experimental results validated the design, confirming that the optimized machine met relevant technical specifications for straw checkerboard sand barrier construction, and underscoring its practical applicability and engineering potential for desertification mitigation.
Author Contributions
Conceptualization, Y.Q.; methodology, Y.Q., B.S. and D.K.; software, Y.Q., Y.Z. and D.K.; validation, P.Z., D.K., X.M. and X.Z.; formal analysis, Y.Q., D.K. and B.S.; data curation, D.K., X.Z. and Y.S.; writing—original draft preparation, Y.Q.; writing—review and editing, Y.Q. and B.S.; funding acquisition, Y.Q. and B.S. All authors have read and agreed to the published version of the manuscript.
Funding
This research was funded by the Special Program for Science and Technology Commissioners of Gansu Province 25CXGA091; the Research Start-up Projects Foundation of Gansu Agricultural University, grant number GAU-KYQD-2020-2; the Gansu Province Major Science and Technology Program Project, grant number 21ZD4FA010; Key Research and Development Program of Gansu Province 20YF8NA134; and the Commissioned Research Project supported by Gansu Agricultural University GSAU-JSYF-2024-36.
Institutional Review Board Statement
Not applicable.
Data Availability Statement
No new data were created or analyzed in this study.
Conflicts of Interest
Author Yuan Qi was employed by the company Zhejiang Kingfit Environment Co., Ltd. Authors Yang Zhang and Yonghua Su were employed by the company Zhejiang Zhenhang Industrial Group Co., Ltd. The remaining authors declare that the research was conducted in the absence of any commercial or financial relationships that could be construed as a potential conflict of interest.
References
- Li, J.; Wu, W.; Fu, X.; Zhang, Y. Assessment of the Effectiveness of Sand Control and Desertification in the Mu Us Desert, China. Remote Sens. 2022, 14, 837. [Google Scholar] [CrossRef]
- Yue, Y.; Geng, L.; Li, M. The Impact of Climate Change on Aeolian Desertification: A Case of the Agro-Pastoral Ecotone in Northern China. Sci. Total Environ. 2022, 859, 160126. [Google Scholar] [CrossRef]
- Lyu, Y.; Shi, P.; Han, G.; Wang, T. Desertification Control Practices in China. Sustainability 2020, 12, 3258. [Google Scholar] [CrossRef]
- Wang, J.; Wang, R. The Physical and Chemical Properties of Soil Crust in Straw Checkerboards with Different Ages in the Mu Us Sandland, Northern China. Sustainability 2019, 11, 4755. [Google Scholar] [CrossRef]
- Huang, H. Modeling the Inhibition Effect of Straw Checkerboard Barriers on Wind-Blown Sand. Earth Surf. Dynam. 2023, 11, 167–181. [Google Scholar] [CrossRef]
- Wu, Y.; Jin, A.; Jiang, J. Numerical Simulation and Parameter Optimization of a New Slant Insertion-Opening Combination Sand Fence. Sustainability 2024, 16, 8651. [Google Scholar] [CrossRef]
- Yan, Q.; Li, J.; Yin, Z.; Liu, J.; Liu, H. Numerical Simulation of the Influence of Typical Shrub Types on Wind-Sand Flow Field. Arid. Zone Res. 2023, 40, 785–797. [Google Scholar]
- Huang, N.; Xia, X.; Tong, D. Numerical Simulation of Wind Sand Movement in Straw Checkerboard Barriers. Eur. Phys. J. E 2013, 36, 99. [Google Scholar] [CrossRef]
- Xu, B. Numerical Simulation Study on the Mechanism of Sand Blocking and Fixation by Mechanical Sand Barriers. Master’s Thesis, Lanzhou University, Lanzhou, China, 2018. [Google Scholar]
- Li, X.R.; Xiao, H.L.; He, M.Z.; Zhang, J.G. Sand Barriers of Straw Checkerboards for Habitat Restoration in Extremely Arid Desert Regions. Ecol. Eng. 2006, 28, 149–157. [Google Scholar] [CrossRef]
- Peng, Z.; Jia, M.; Fang, J.; Jiang, F. Design and Simulation of Portable Paving Vehicle for Straw Checkerboard Barriers. Machines 2024, 12, 835. [Google Scholar] [CrossRef]
- Xu, X.Y.; Zhao, P.; Tang, J.N.; Ji, Y. Current Status and Prospects of Sand Control Machinery Research in China. For. Grassl. Mach. 2020, 1, 21–25. [Google Scholar]
- Lu, H.M.; Guo, X.R.; Zhao, Z.G. Study on Desert Passability of Straw Checkerboard Laying Robot. Chin. J. Constr. Mach. 2006, 4, 389–393. [Google Scholar]
- Zhao, Z.G. Study on Passability of Straw Checkerboard Laying Machine. Ph.D. Thesis, Northeast Forestry University, Harbin, China, 2005. [Google Scholar]
- Zhao, Z.G.; Lu, H.M. Experimental Study on Passability of Windbreak and Sand-Fixing Robot. Res. Agric. Mech. 2008, 1, 189–192. [Google Scholar]
- Shu, Q.; Liu, J.H. Study on Passability of Straw Checkerboard Laying Robot. Trans. Chin. Soc. Agric. Mach. 2007, 7, 99–102. [Google Scholar]
- Pan, H.B. Study on Vibration System of Straw Checkerboard Laying Robot. Ph.D. Thesis, Northeast Forestry University, Harbin, China, 2006. [Google Scholar]
- Yang, B.; Liu, J.H. Experimental Study on Longitudinal Laying Wheel System of Straw Checkerboard Robot. For. Mach. Woodw. Equip. 2007, 35, 22–25. [Google Scholar]
- Yang, B. Optimization and Finite Element Analysis of Longitudinal Laying Wheel System Structure of Sand-Fixing Robot. Ph.D. Thesis, Northeast Forestry University, Harbin, China, 2006. [Google Scholar]
- Li, Y.J. Dynamic Simulation Analysis of Transverse Pneumatic Straw Inserting Mechanism of Straw Checkerboard Laying Robot. Ph.D. Thesis, Northeast Forestry University, Harbin, China, 2005. [Google Scholar]
- Jiang, X.S. Design and Simulation Study of Transmission System of Straw Checkerboard Laying Robot. Ph.D. Thesis, Guangxi University, Nanning, China, 2005. [Google Scholar]
- Sun, S.F. Design Study of Shearing Mechanism of Straw Checkerboard Laying Robot. Ph.D. Thesis, Northeast Forestry University, Harbin, China, 2006. [Google Scholar]
- Sun, S.F.; Ye, Y. Strength Analysis of Transverse Cutting Mechanism of Straw Checkerboard Laying Robot. For. Eng. 2009, 25, 37–40. [Google Scholar]
- Sun, S.F.; Liu, J.H.; Ye, Y. Dynamic Analysis of Transverse Cutting Mechanism of Windbreak and Sand-Fixing Straw Checkerboard Laying Robot. J. Desert Res. 2011, 31, 1087–1092. [Google Scholar]
- Si, K. Design and Research of Transverse Laying System of Three-Dimensional Sand-Fixing Vehicle. Ph.D. Thesis, Beijing Forestry University, Beijing, China, 2011. [Google Scholar]
- Tang, W.; Liu, J.; Li, C. Kinematic Research and Simulation of Multi-Link Transverse Insertion Knife Mechanism. Mech. Eng. Autom. 2017, 2, 38–39. [Google Scholar]
- Sui, T.; Liu, J.; Tang, W. Kinematic Solution and Trajectory Planning of Stepwise Transverse Insertion Knife Mechanism. J. Beijing For. Univ. 2017, 39, 109–116. [Google Scholar]
- Yi, Y.; Liu, Y.; Zhang, H.; Liu, C.; Li, Y. Influencing Factors of Resistance in Embedding Flexible Straw Stems into Sandy Soil Using Insertion Disc. Bull. Soil. Water Conser. 2017, 37, 157–161. [Google Scholar]
- Li, X. Analysis of Digital-Based Mechanized Desertification Control Applications. For. Sci. Technol. Inf. 2019, 6, 90–93. [Google Scholar]
- Lin, Z. Desert Control Enters the Era of Mechanization. Gansu For. 2017, 1, 16–17. [Google Scholar]
- Zhu, Q.; Wang, Y.; Xu, X.; Gao, S.; Liu, S.; Chen, H.; Zhang, Y. Optimization of Manufacturing Parameters and Experimental Study of Rice Straw Fiber-Based Plant Fiber Seedling Pots. Agronomy 2023, 13, 1782. [Google Scholar] [CrossRef]
- Gong, F.; Hu, M.; Bao, A.; Li, D.; Gao, T.; Wang, C. Calibration and Significance Analysis of Rice Straw Parameters Based on the Hertz-Mindlin Model. J. Southwest Univ. 2022, 44, 186–196. [Google Scholar]
- Sun, Z.; Jiang, E. Study on Mechanical Properties of Rice Straw. J. Northeast. Agric. Univ. 2007, 38, 660–664. [Google Scholar]
- Wang, X.; Zhao, C.; Ji, Z.; Ju, D.; Gao, C.; Chen, H.; Li, L. The Sliding Frictional Properties of Untreated and Extrusion-Exploded Wheat and Rice Straw. Agriculture 2022, 12, 1911. [Google Scholar] [CrossRef]
- Sun, H.; Chen, Z.; Ge, W. Theory of Machines, 8th ed.; Higher Education Press: Beijing, China, 2013. [Google Scholar]
- Sun, L. Dynamic Modeling and Control of Four-Wheel Independent Steering Mobile Robot. Master’s Thesis, Harbin Institute of Technology, Harbin, China, 2008. [Google Scholar]
- Bekker, M.G. Introduction to Terrain-Vehicle Systems; University of Michigan Press: Ann Arbor, MI, USA, 1969. [Google Scholar]
- Janosi, Z.; Hanamoto, B. An Analysis of the Drawbar Pull of Tracked Vehicles on Soft Ground. In Proceedings of the 1st International Conference of the International Society for Terrain-Vehicle Systems (ISTVS), Turin, Italy, 12–16 June 1961. [Google Scholar]
- GB/T 21141-2007; Technical Specifications for Sand Prevention and Control. Standards Press of China: Beijing, China, 2007.
Disclaimer/Publisher’s Note: The statements, opinions and data contained in all publications are solely those of the individual author(s) and contributor(s) and not of MDPI and/or the editor(s). MDPI and/or the editor(s) disclaim responsibility for any injury to people or property resulting from any ideas, methods, instructions or products referred to in the content. |
© 2025 by the authors. Licensee MDPI, Basel, Switzerland. This article is an open access article distributed under the terms and conditions of the Creative Commons Attribution (CC BY) license (https://creativecommons.org/licenses/by/4.0/).