Article

Design and Experiment of Monomer Profiling Strip Tillage Machine with Straw-Strip-Collecting and Subsoiling Functions

1
College of Engineering, China Agricultural University, Beijing 100083, China
2
Key Laboratory of Agricultural Equipment for Conservation Tillage, Ministry of Agricultural and Rural Affairs, Beijing 100083, China
3
Scientific Observing and Experiment Station of Arable Land Conservation (North Hebei), Ministry of Agricultural and Rural Affairs, Beijing 100083, China
4
School of Agricultural Engineering and Food Science, Shandong University of Technology, Zibo 255000, China
5
College of Agricultural Equipment Engineering, Henan University of Science and Technology, Luoyang 471003, China
*
Author to whom correspondence should be addressed.
Agriculture 2025, 15(16), 1771; https://doi.org/10.3390/agriculture15161771
Submission received: 17 July 2025 / Revised: 9 August 2025 / Accepted: 11 August 2025 / Published: 18 August 2025
(This article belongs to the Section Agricultural Technology)

Abstract

Aiming at the problems of intensified soil compaction under the conditions of no-tillage operations and machine blockage caused by large-scale straw returning to the field, an operation mode of “straw strip collecting-strip subsoiling” was proposed, and a Monomer Profiling Strip Tillage Machine (MPSTM) with Straw-Strip-Collecting and Subsoiling Functions was designed to achieve anti-blocking operation and three-dimensional soil compaction reduction. The principle and mechanism parameters of monomer profiling in strip tillage are analyzed, and the effective profiling conditions are clarified. It is determined that the deflection angle, inclination angle, and installation spacing have a key influence on the straw clearance effect. The theory of soil failure and soil compaction reduction under the operation of the subsoiling and strip tillage mechanism is studied, and a combination of a medium-sized Subsoiler shovel handle and a 150 mm double-wing shovel is adopted. Using the EDEM discrete element method, taking the spatial parameters of the stubble clean disc (SCD) as the test factors and the straw removal rate (SRR) as the test indicator, a quadratic orthogonal rotation test is conducted to clarify the influence of each parameter on the straw clearance. The optimal SCD spatial parameters were determined as a deflection angle of 16.5°, an inclination angle of 25°, and an installation spacing of 100 mm, achieving a maximum SRR of 95.34%. Field test results demonstrated stable machine operation. Post-operation measurements yielded the following results: the width of the straw-cleaning band (WSCB) in the sowing strip is 193.7 mm; the overall straw removal rate (OSRR) is 84.82%, which is basically consistent with the simulation results; the subsoiling depth (SD) is 271.7 mm; the subsoiling depth stability (SDS) is 91.85%; the soil fragmentation rate (SFR) is 81.19%; and the reduction of soil compaction in the 0–10, 10–20, and 20–30 cm soil layer is 50.08%, 21.78%, and 40.83%, respectively. These results confirm that the machine effectively cleaned straw within the seeding band and reduced soil compaction, meeting the agronomic and technical requirements for strip tillage.

1. Introduction

Conservation tillage is a modern tillage technology system mainly consisting of returning crop residues to the field and no-till or minimum-till seeding. It eliminates the use of moldboard plows for soil inversion and implements no-till or minimum-till practices, covering the soil surface with crop residues to enhance soil fertility. It offers ecological benefits such as reducing soil erosion, increasing organic matter content, and carbon sequestration and emission reduction. It has been widely promoted on a large scale [1]. However, under the extensive straw returning to the field model, the surface of the field is uneven, making it difficult for related machinery to pass through and prone to clogging. Moreover, the long-term shallow tillage intensifies soil compaction, which is not conducive to crop growth [2]. Therefore, how to deal with the straw in the fields and improve the conditions of the planting beds has become a key challenging aspect of implementing conservation tillage.
In terms of straw processing and the prevention of blockages, relevant scholars have carried out a lot of research on power-driven anti-blocking devices, mainly using external power to drive the working parts to cut or throw straw [3,4,5]. Passive straw cleaning devices have also been investigated [6,7,8]. Studies have examined the influence of tooth profiles and dimensions on stubble clean disc (SCD) performance [9,10], while others have designed cleaning mechanisms with adaptability to varying working widths [11,12]. Kumar, M. et al. [13] analyzed the spatial installation parameters of stubble-cleaning components. It is worth noting that current research mostly focuses only on the structural parameters of SCD (such as diameter) or simultaneously discusses operational parameters (such as forward speed), structural parameters, and spatial installation parameters (such as deflection angle and inclination angle, etc.). However, there is relatively little analysis of purely spatial installation parameters, which makes the mechanism of their impact on the effect of straw removal unclear.
To alleviate soil compaction and improve the conditions of the planting beds, methods like strip tillage and subsoiling are commonly employed to disrupt compacted plow pans and enhance soil structure [14,15,16]. Research has explored various strip tillage patterns [17,18], confirming their efficacy in reducing soil compaction. Pei, Y. et al. [19] investigated a novel deep strip tillage method under wide–narrow row planting configurations, while Chu, J. et al. [20] developed a deep rotary seeding machine suitable for such systems, contributing ideas for soil structure improvement under conservation tillage. To enhance strip tillage adaptability and improve the field maneuverability of the machinery, Wang, Q. et al. [21] integrated a profiling mechanism into a surface straw-cleaning implement, make it capable of conforming to the undulations of the terrain, and Lou, S.Y. et al. [22] designed an adjustable subsoiling and harrowing combined implement based on a four-bar linkage mechanism, which can perform tillage operations under different field conditions and control tillage depth. However, few studies have been conducted on strip subsoiling implements, their profiling principles and mechanisms, and particularly on soil disturbance patterns under such strip subsoiling conditions.
In summary, this study addresses the dual problems of implement clogging under heavy straw return conditions and aggravated soil compaction by proposing a combined “straw strip collecting-strip subsoiling” operational mode. A profiling strip tillage implement integrating straw-strip-collecting and subsoiling functions was designed. Each working unit incorporates a terrain-profiling mechanism to enhance adaptability to varying field surface conditions. This study systematically analyzed the influence of the spatial installation parameters of SCD on the straw removal effect. By integrating stubble cleaning and subsoiling, this implement simultaneously clears straw from planting strips and achieves vertical alleviation of soil compaction.

2. Materials and Methods

2.1. Overall Structure and Working Principle

2.1.1. Overall Structure of Monomer Profiling Strip Tillage Machine (MPSTM)

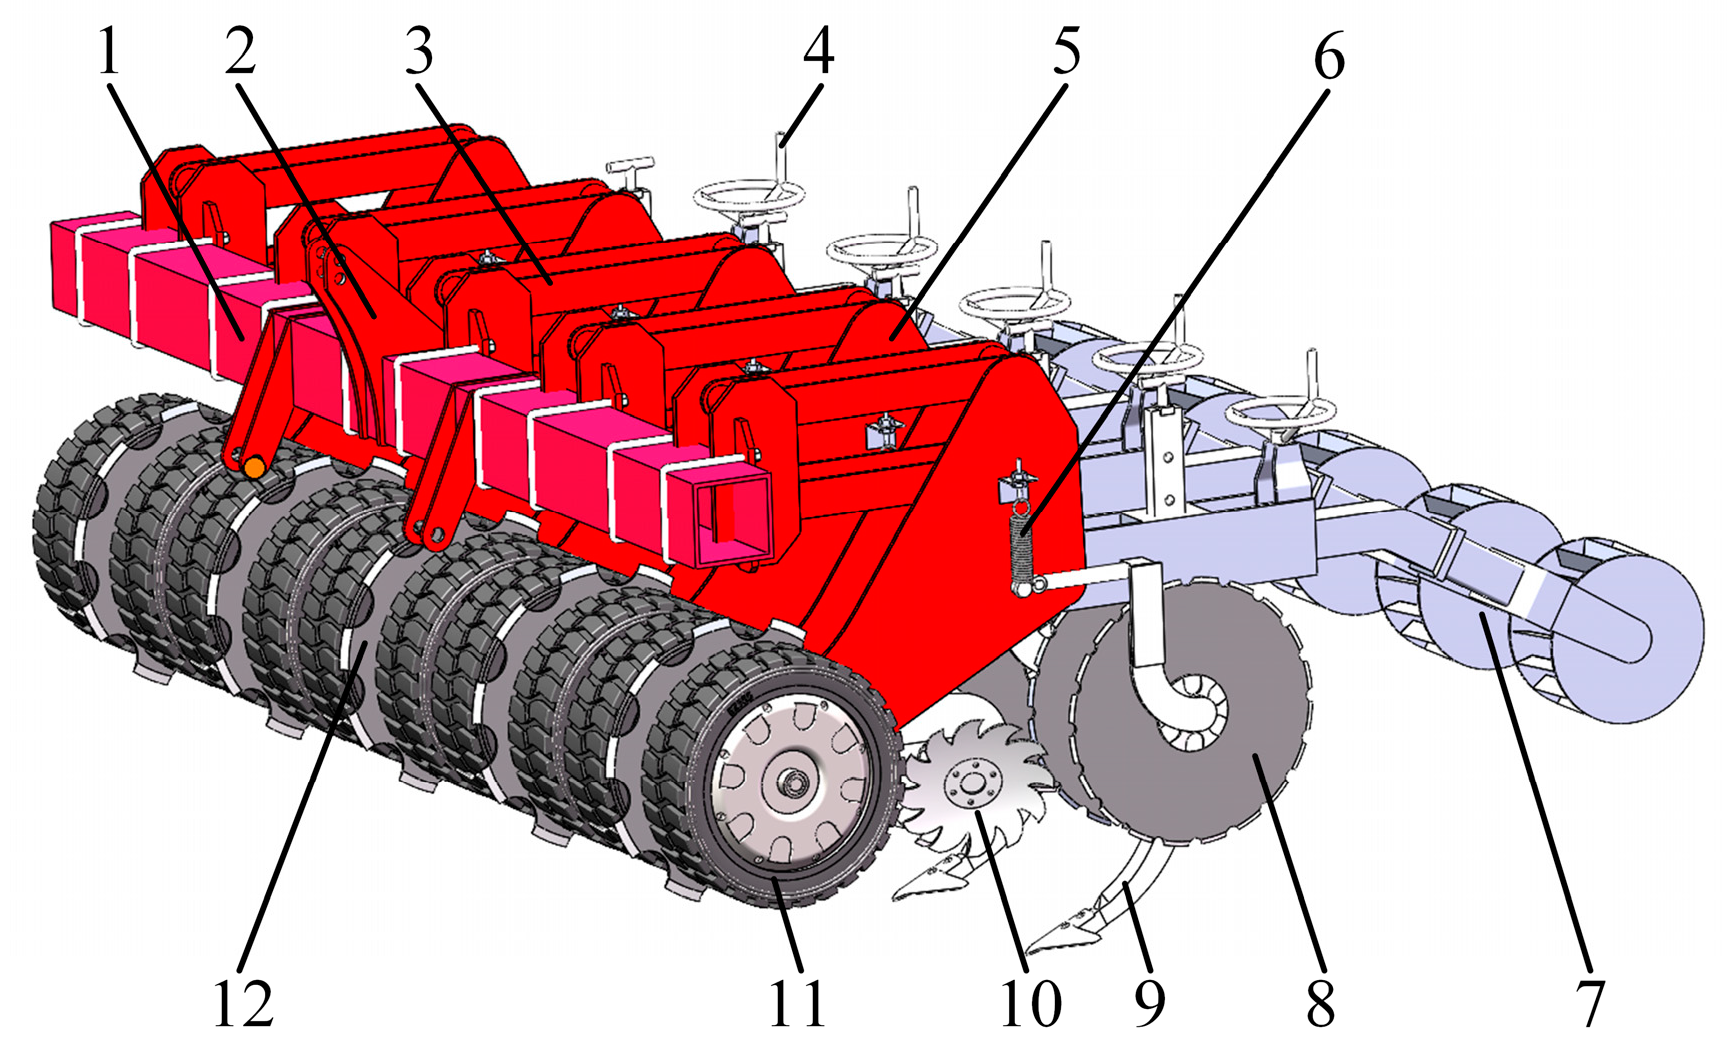
The overall structure of the MPSTM with straw-strip-collecting and subsoiling functions is illustrated in Figure 1. The machine comprises the following key components: a frame, three-point suspension mechanism, monomer profiling mechanism, pressing knobs, mainboards, soil-cutting knives profiling mechanism, compacting devices, soil-cutting knives, subsoiler shovels, stubble clean discs (SCDs), depth-limiting wheels, and stubble cut notch discs.
The stubble cut notch discs are mounted at the front, coaxially aligned with the depth-limiting wheels. The SCDs are positioned behind the stubble cut notch discs and symmetrically arranged within a spatial plane. Soil-cutting knives are mounted on either side of the subsoiler shovels and feature terrain profiling capability. The subsoiler shovels are vertically aligned through the center of the soil-cutting knives. Compacting devices are mounted at the rear of the machine, and their pressing force is adjustable via the pressing knobs. All components are mounted on the mainboards and connected to the frame via the profiling mechanisms. The main technical parameters are listed in Table 1.

2.1.2. Working Principle of MPSTM

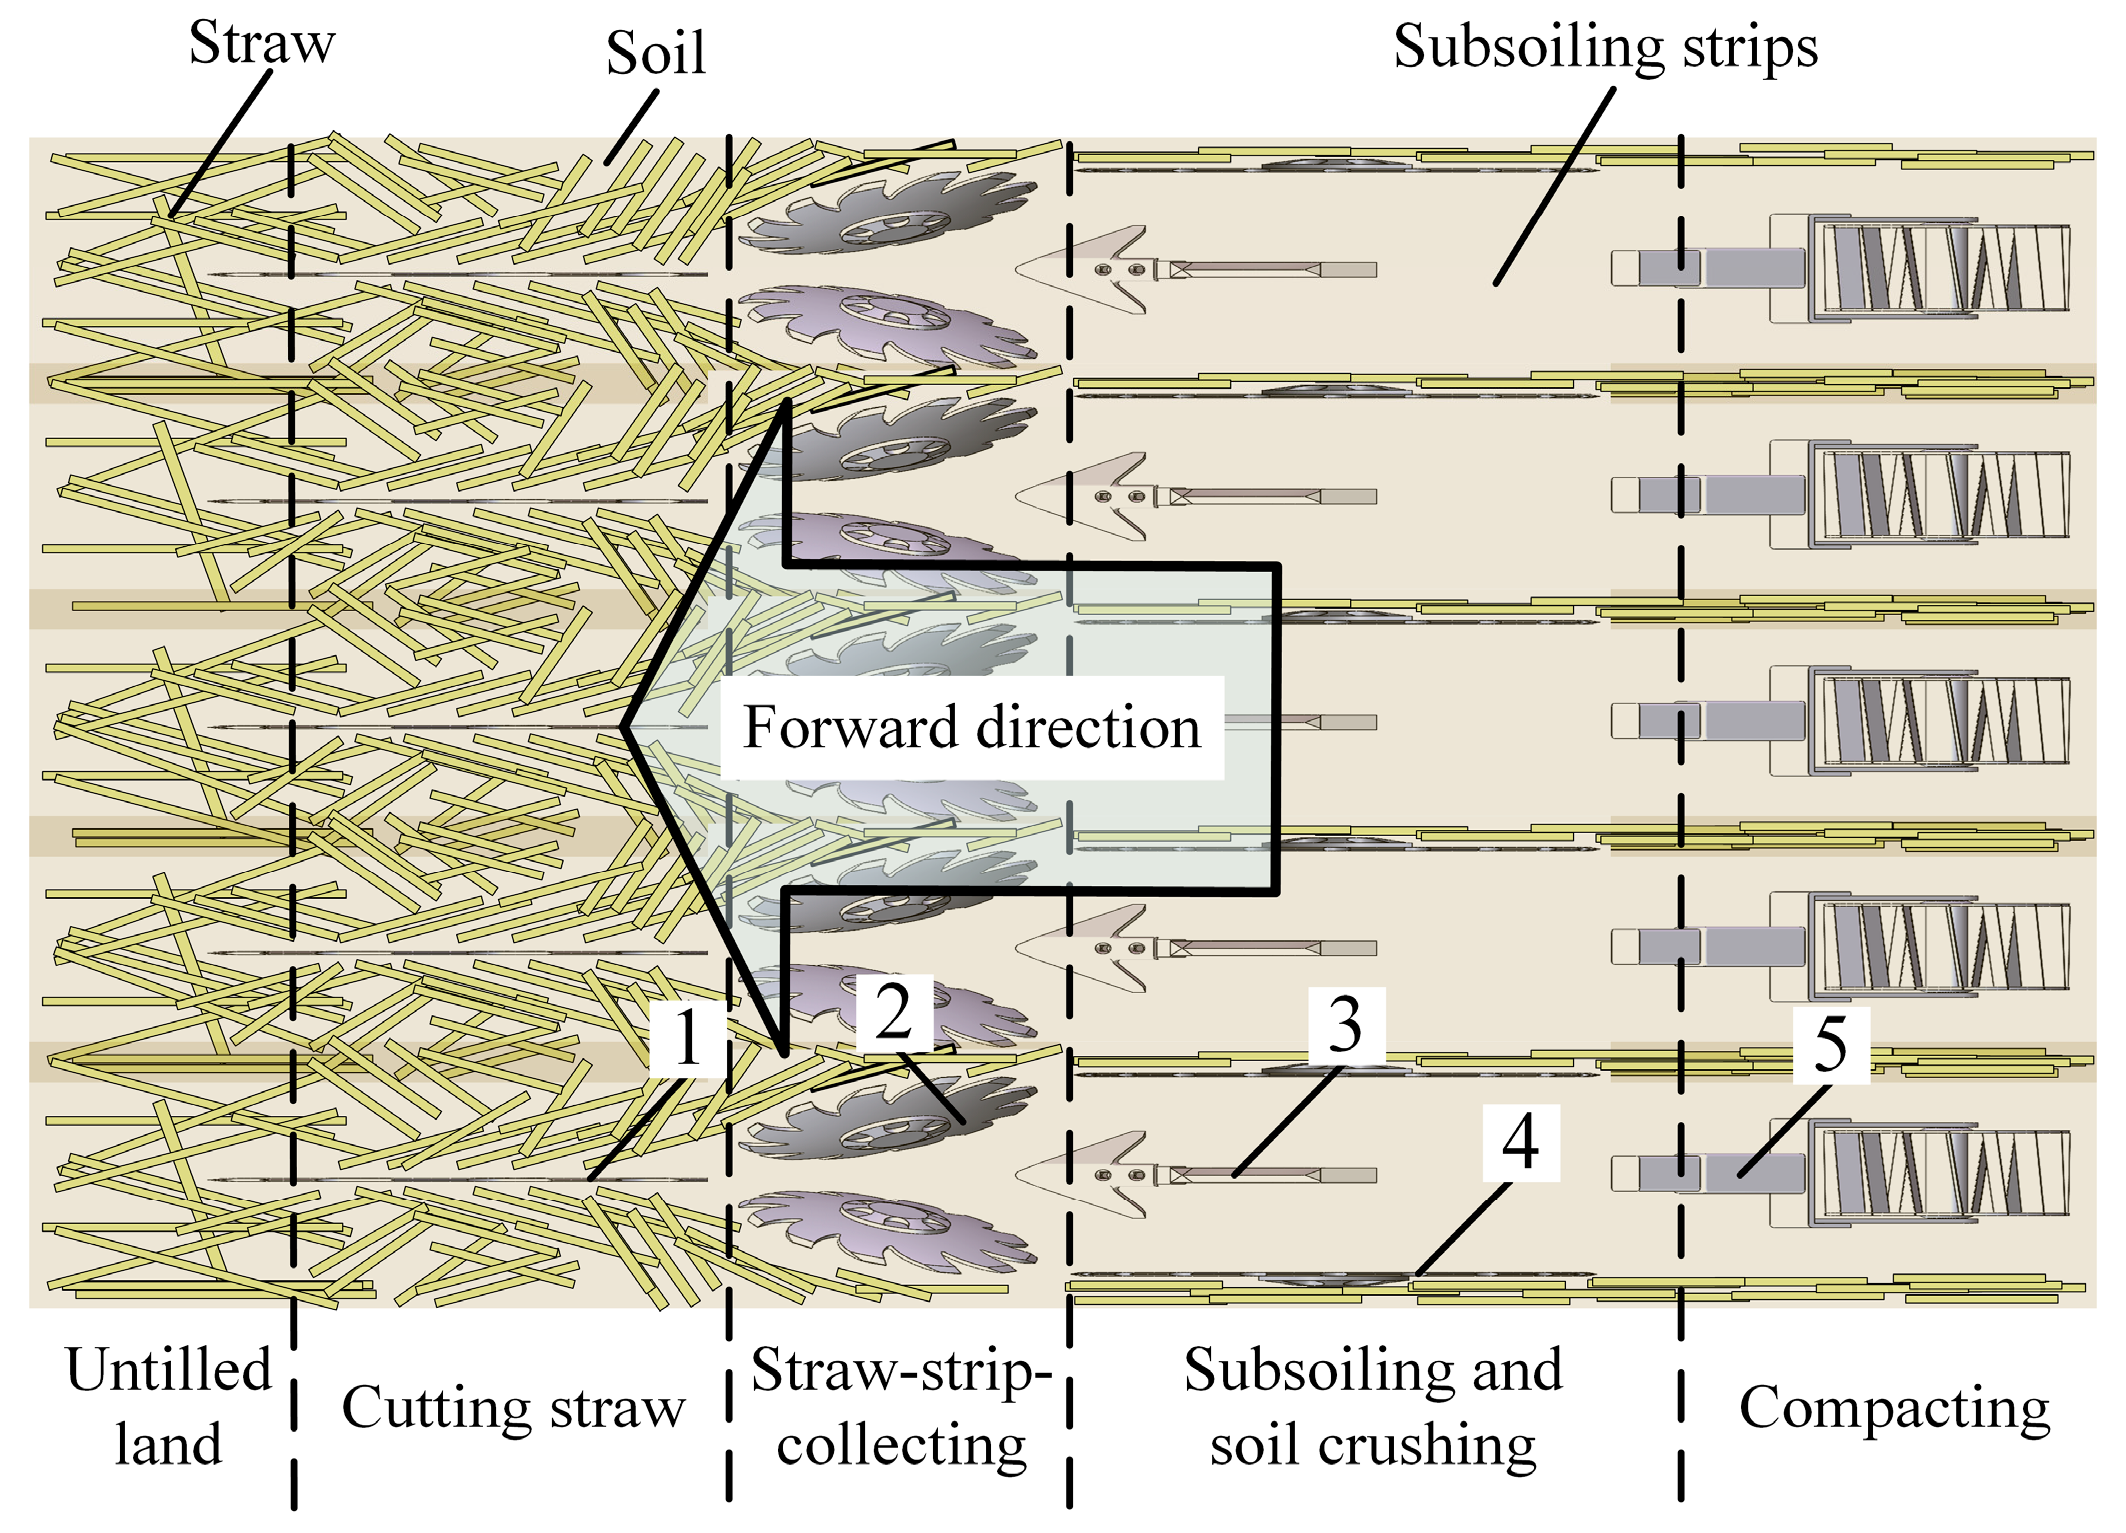
The working principle of the MPSTM is shown in Figure 2. During operation, the stubble cut notch discs, supported by the ground surface, first cut long straws within the designated strip. Subsequently, the SCDs enter the soil and passively rotate, shifting the severed straw and residue laterally to both sides of the strip. The subsoiler shovels then penetrate the subsurface, lifting and fracturing the compacted soil layer beneath the strip. Simultaneously, the soil-cutting knives penetrate the soil on both sides of the strip surface. They prevent residue rollback and further fragment soil clods and straw debris. Finally, the compacting devices consolidate the tilled strip. This process results in five distinct strips characterized by cleared straw and loosened soil, providing a suitable seedbed for subsequent seeding operations.

2.2. Design of Key Components

2.2.1. Design of Monomer Profiling Mechanism

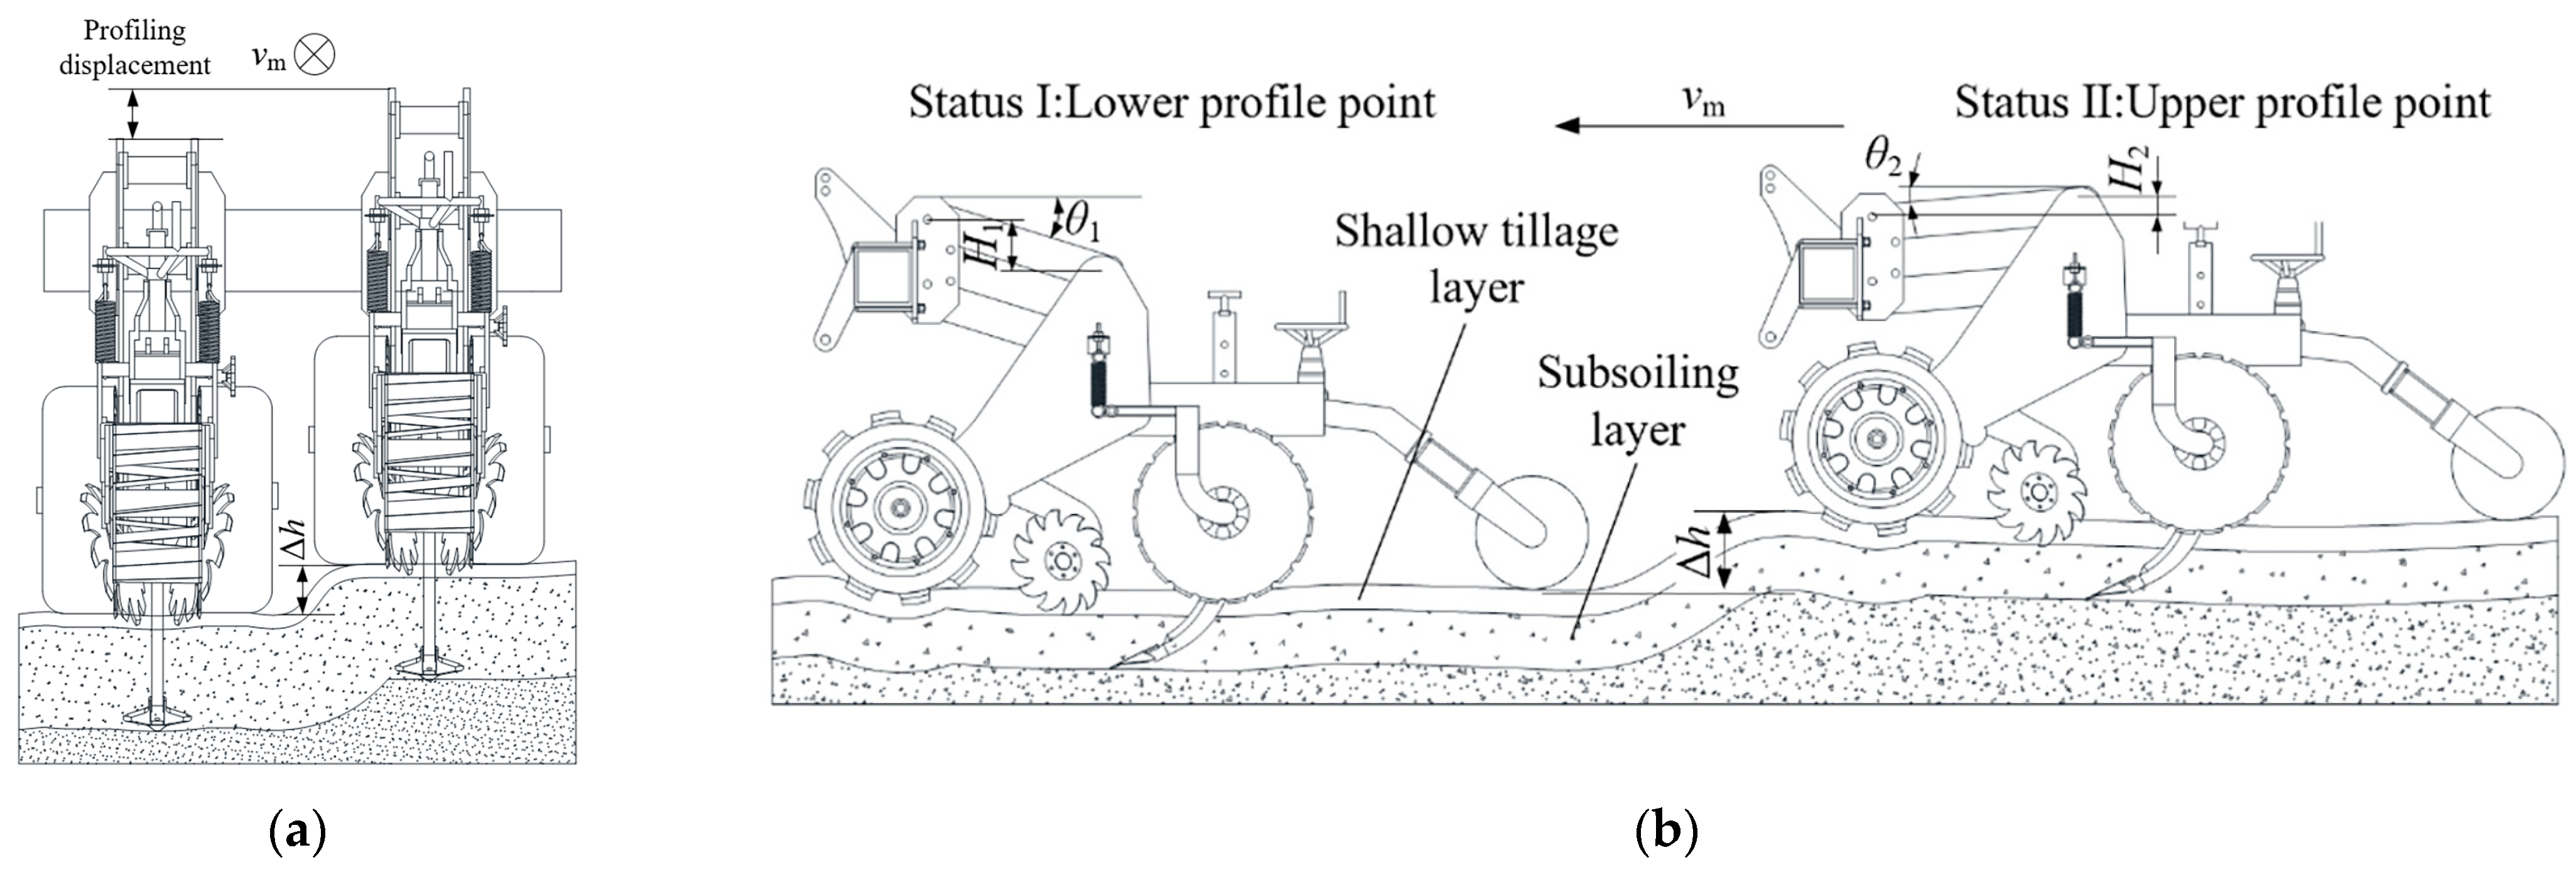
In the combined “straw strip collecting-strip subsoiling” mode, consistent straw removal performance and subsoiling depth across each individual strip are critical for successful subsequent seeding. Therefore, a monomer-based profiling mechanism was designed for each tillage unit. The implement features five independent monomer units, each performing both straw-cleaning and subsoiling functions. Each unit employs a parallelogram linkage to passively follow terrain variations. The principle is illustrated in Figure 3. During operation, each unit independently adapts to transverse surface undulations within its strip, maintaining close contact between its working components and the ground. This ensures consistent straw removal and tillage depth. When encountering longitudinal terrain undulations, the frame height undergoes abrupt changes in the vertical plane. The profiling mechanism accommodates these height changes, maintaining ground contact and reducing traction resistance, thereby improving operational efficiency.
From Figure 3, the total profiling displacement H of the mechanism is:
H = H 1 + H 2 = L 0 ( sin θ 1 + sin θ 2 )
where H1 and H2 are the lower profiling displacement and the upper profiling displacement, respectively; L0 is the length of the profiling link; and θ1 and θ2 are the lower profiling angle and the upper profiling angle, respectively.
Given the substantial tillage depth and reliance on implement weight for passive ground contact, longer profiling linkages and a larger total profiling displacement were employed. This configuration shifts the center of gravity rearward, enhancing stability [23]. Both profiling angles were set to 15°, with mechanical stops pins limiting the range. The total profiling displacement H was set to 320 mm. Substituting these values into the Equation (1) and rounding, the final linkage length was 620 mm, with a vertical distance between the linkages of 200 mm.
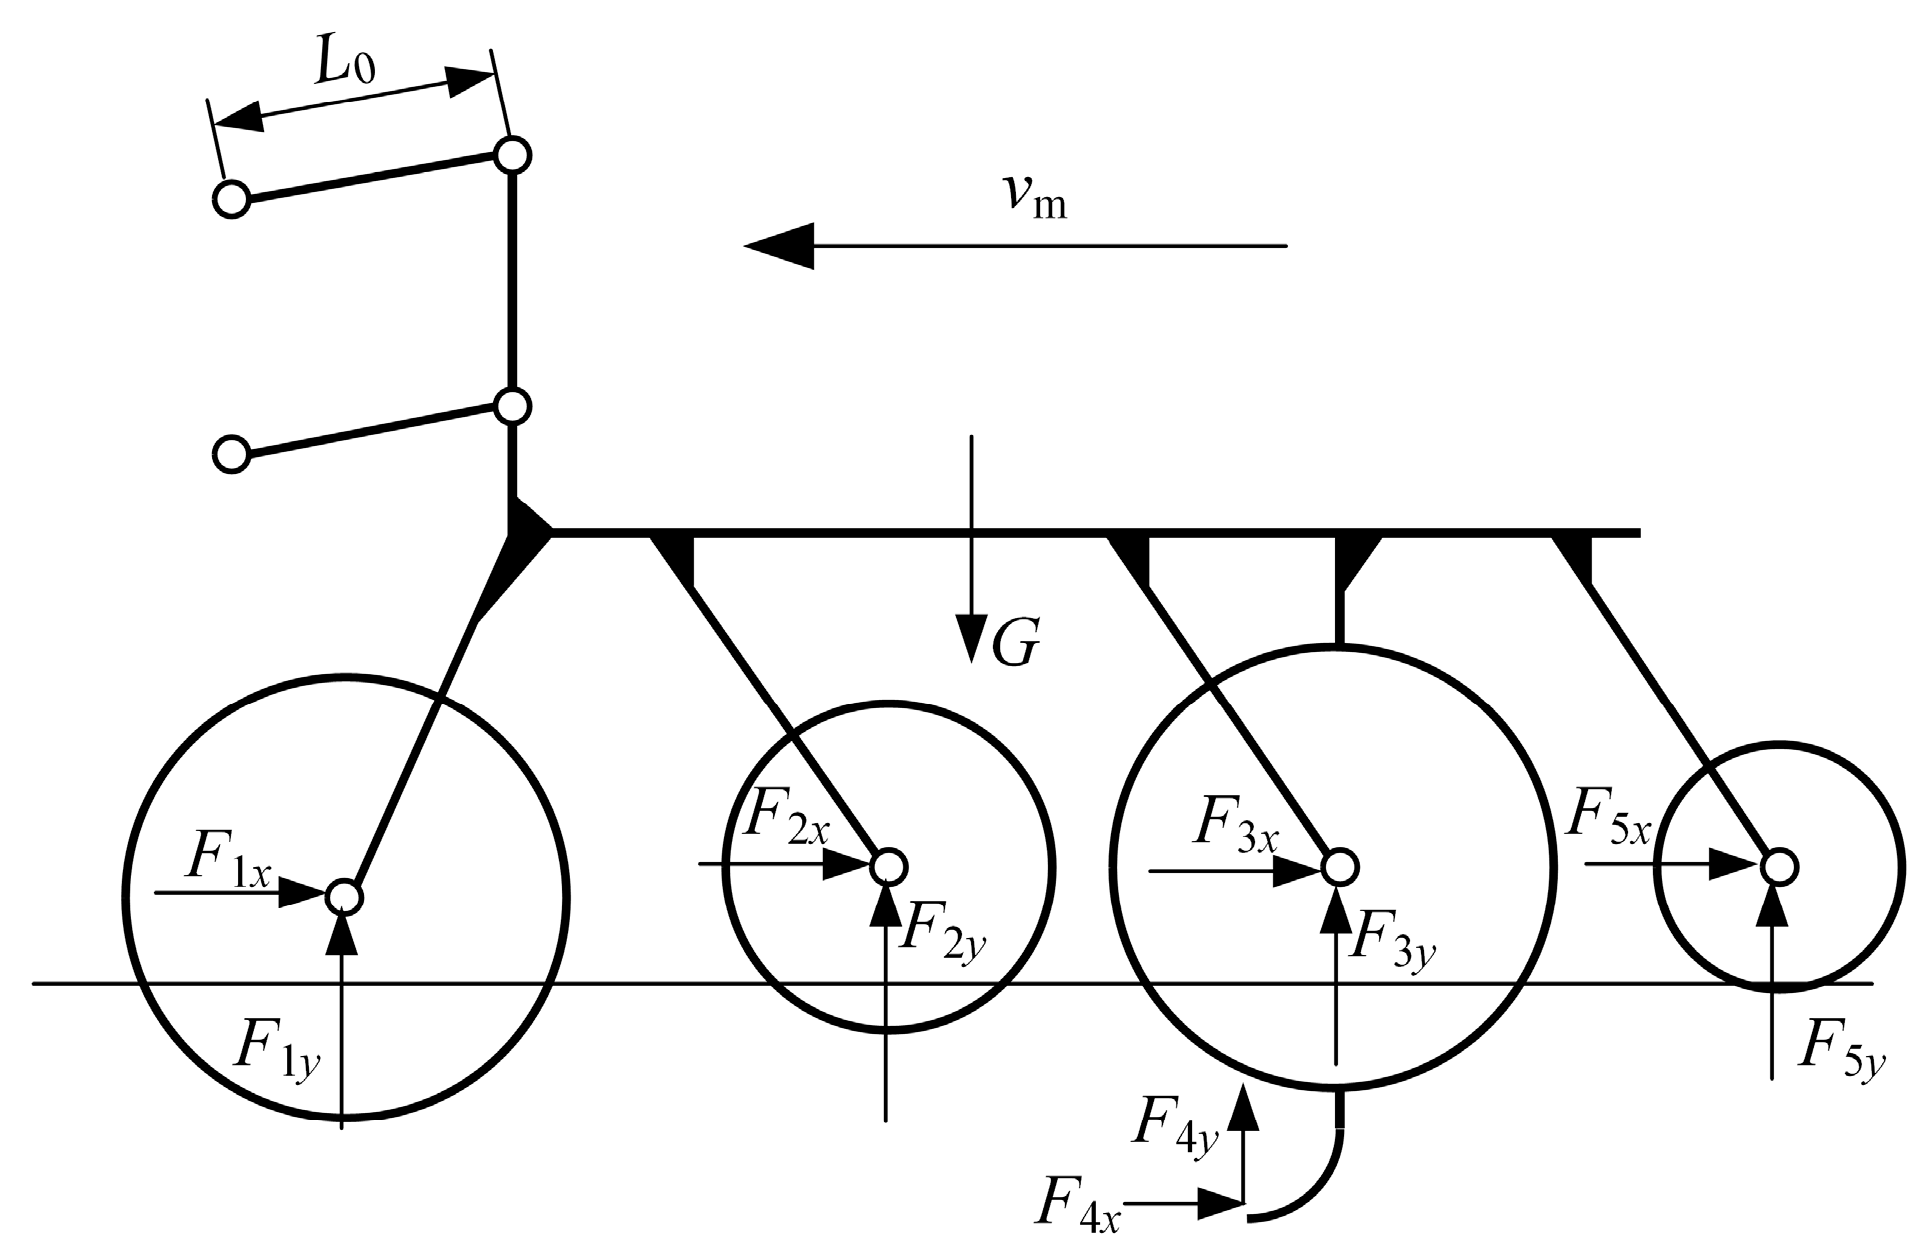
The force analysis of the profiling mechanism during operation is presented in Figure 4. As the mechanism lacks a dedicated profiling spring, sufficient machine and implement weight is required to ensure ground contact of the working parts. This condition is expressed as:
G > i = 1 5 F i y
where G is the self-weight of the MPSTM; and F1y~F5y are the vertical component forces exerted by the stubble cut notch disc and depth-limiting wheel, SCD, soil-cutting knife, subsoiler shovel and compacting device, respectively.
Each monomer unit has a base weight of approximately 3000 N, sufficient for most passive profiling scenarios. However, as the required contact force varies with operational speed and soil conditions, additional counterweights may be necessary to ensure adequate ground contact under all operating conditions.

2.2.2. Design of Stubble Clean Disc (SCD)

Under high-residue return conditions, the random distribution of straw increases soil resistance heterogeneity. This compromises both the consistency of subsoiling depth and the uniformity of soil fissure formation. As a precursor operation within the combined mode, stubble cleaning removes residue and stubble from the strip, creating a more uniform soil environment for subsequent subsoiling. The SCD is the core component for this task, and its design critically influences cleaning performance.
  • Structure Parameter
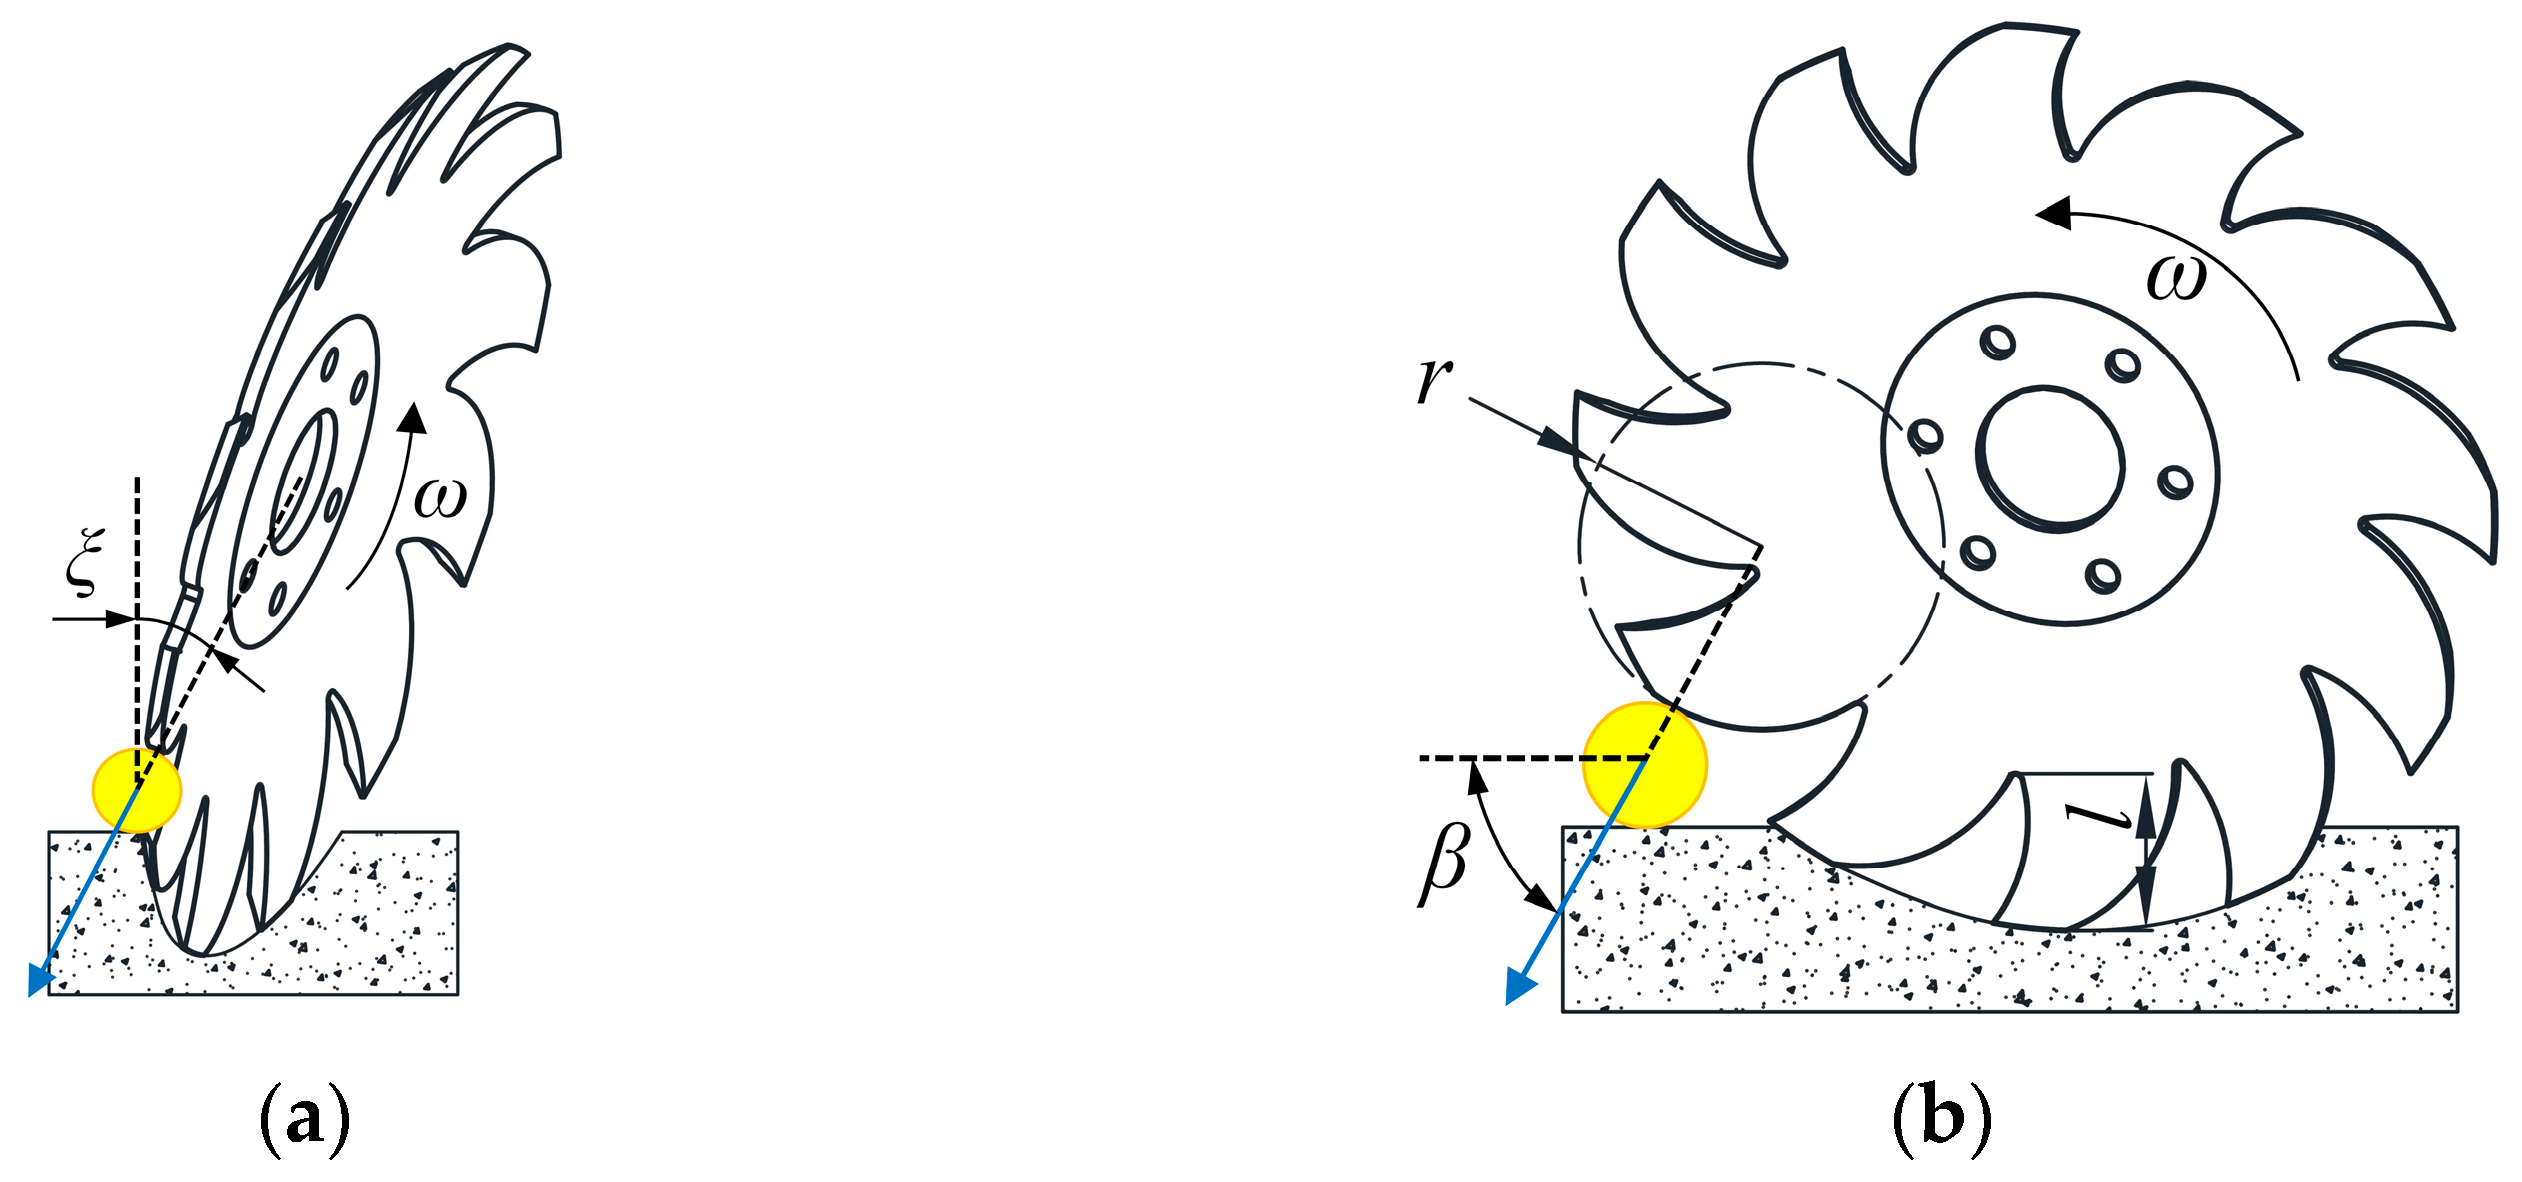
Key structural parameters, illustrated in Figure 5, include the diameter D, the curvature radius ρ, the tooth thickness δ, the tine radius r, and the tine height l.
For D, the Agricultural Machinery Design Manual recommends:
D = K h
where K is the ratio of diameter to depth, with a range from 5 to 7, and h is burial depth of SCD. Assuming h of 50 mm, D was set to 330 mm.
For ρ, a large value results in a disc approximating a flat plate with weak soil-turning capability. Conversely, a small radius enhances performance but increases draught resistance. Based on empirical data, ρ = 600 mm was selected.
The δ determines the operational reliability of the SCD and must be sized according to the anticipated working load. An empirical formula for general working conditions is:
δ = 0.008 D + 1
Typical thickness values range from 3.5 to 6 mm. Since the SCD operates near the soil surface for shallow tillage, a greater thickness is warranted. After substituting relevant parameters into the formula and rounding, a final δ of 3.5 mm was chosen.
The tines primarily function to deflect whole straw laterally to both sides. The r and l of the tines influence straw movement. Consequently, these parameters were determined based on the straw movement analysis presented in the following sections.
2.
Space Installation Parameters
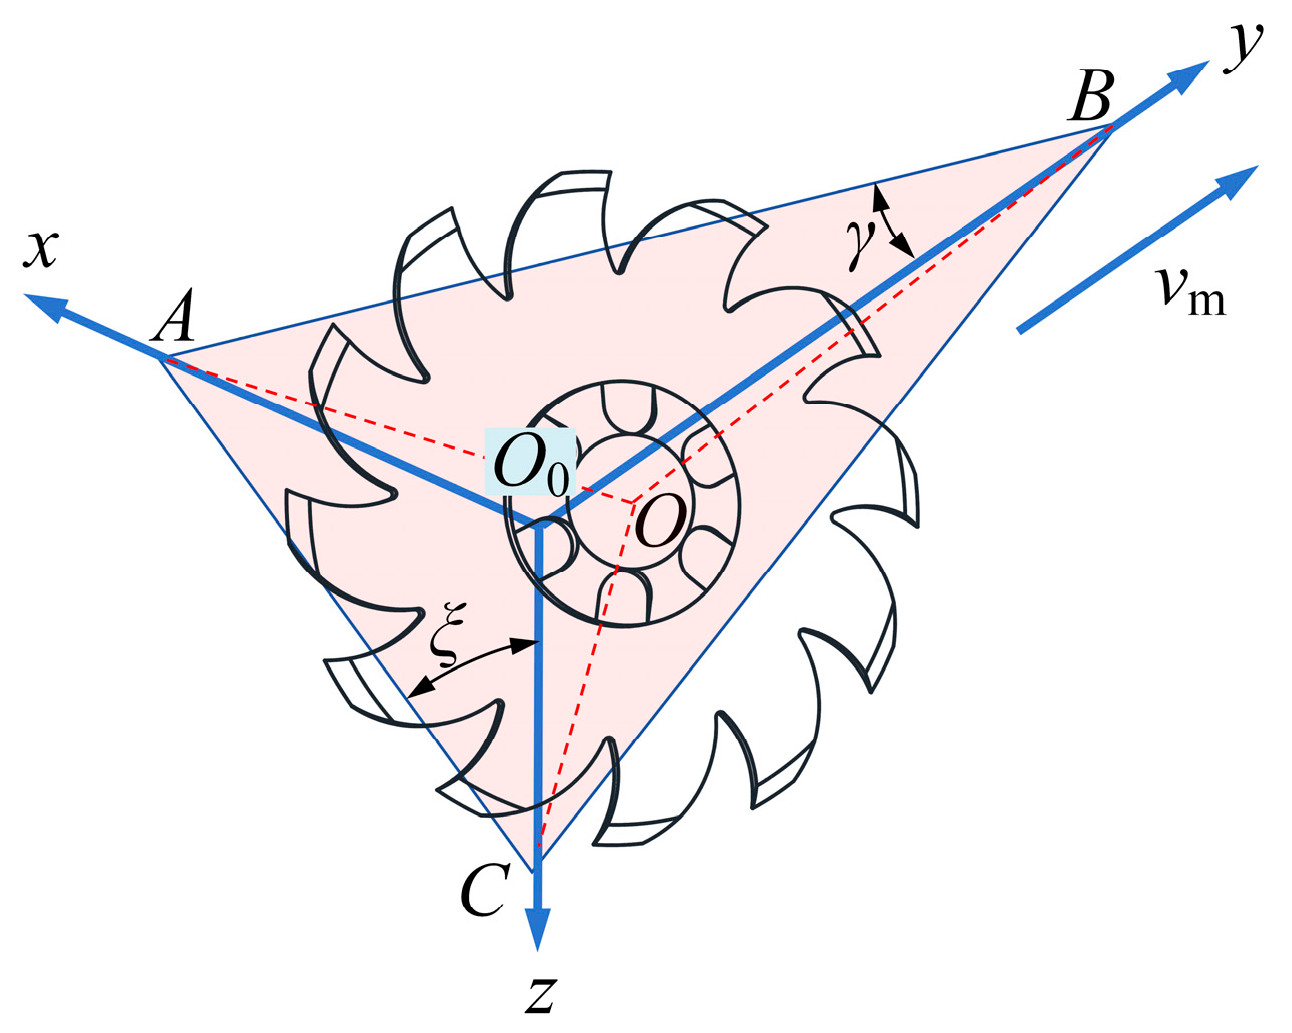
To define the spatial orientation, coordinate system O0xyz is established as shown in Figure 6. The y-axis aligns with forward direction and lies on the machine’s symmetry plane, the x-axis is perpendicular to y and parallel to the ground, and the z-axis is vertical. The disc surface intersects the coordinate axes at points A, B, and C, defining deflection angle γ and inclination angle ξ. The horizontal distance between the centers of the two discs is the installation spacing L. Based on disc harrow operational references, γ typically ranges from 6° to 25°. For ξ, the concave disc surface must face the soil surface to effectively clean straw; thus, an initial range from 0° to 90° was considered.
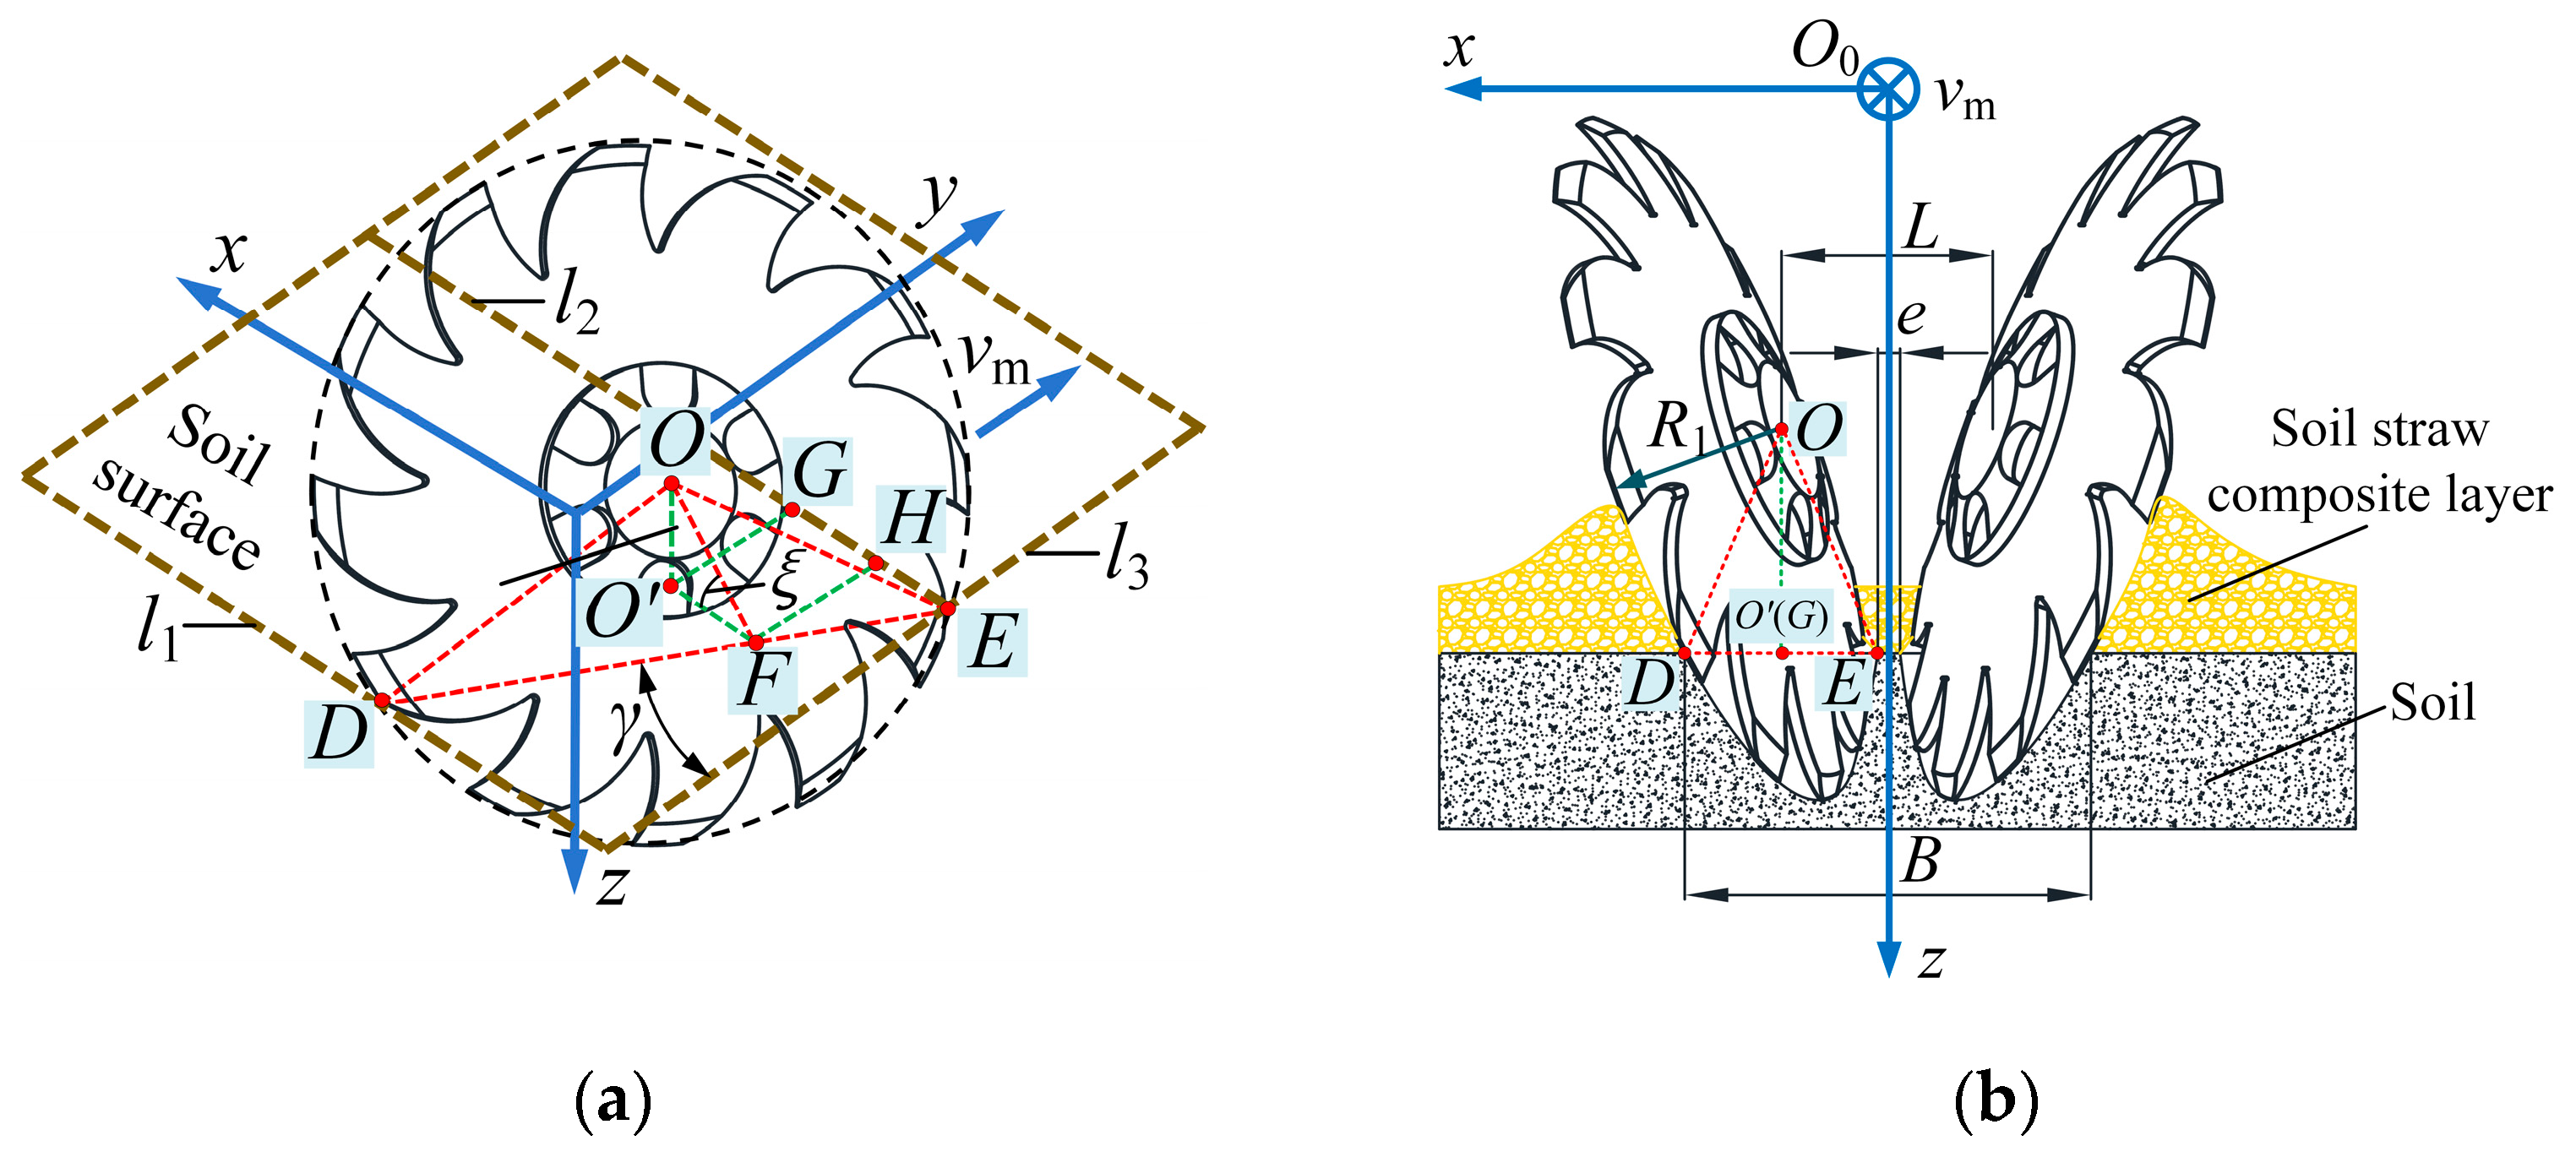
Different installation parameters influence the effective straw-cleaning width of the SCD. As shown in Figure 7, consider a stationary SCD penetrated into the soil. The line DE represents the intersection between the disc surface and the soil surface. Within the soil surface plane, lines l1 and l2 pass through D and E, respectively, and are parallel to the x-axis, while l3 passes through E and is parallel to the y-axis. The projection of the disc center O onto the soil surface is point O′, and a parallel line is drawn through O′ to intersect DE at F. The projection of the radius OE onto l3 is the line segment GE. It can be seen from the figure that the static straw-cleaning width can be expressed as:
B = 2 ( l D E sin γ l G E ) + L
where B is the static cleaning width, lDE and lGE are, respectively, the lengths of line segments DE and GE, and L is the installation spacing of the two SCDs.
Utilizing geometric relationships and the power-of-a-point theorem (as shown in Figure 7), the static cleaning width B is derived as:
B = 2 2 R h h 2 sin γ + 2 ( R h ) ( sin γ 1 ) tan ξ + L
where R is the SCD radius.
Since the disc centers must be above the ground surface and cannot overlap along the x-axis, a missed cleaning region exists. The width of this region is:
e = L 2 l G E = L 2 ( R h ) ( 1 sin γ ) tan ξ 2 2 R h h 2 sin γ
where e is the width of the missed cleaning region.
Equations (6) and (7) demonstrate that SCD cleaning performance is influenced by γ, ξ and L. A small L may cause disc interference, whereas a large L increases the e of the missed cleaning region. Therefore, based on theoretical analysis and practical considerations, L was constrained to the range of 50–200 mm.
3.
Analysis of Straw-Strip-Collecting Process
During soil engagement, the rotating SCD undergoes three key operational phases:
  • Phase 1: Pressing Straws into Soil
The operational process and straw-force interactions during this phase are illustrated in Figure 8. Here, the tines press straw downward into the soil layer. To ensure good stubble-cleaning performance and structural strength, the tine radius r is selected as 60 mm [24].
The forces exerted by the SCD on the straw can be resolved in both the front and side views.
Front view: Assume the tine contact surface is perpendicular to the tangential velocity direction and passes through the centroid of the straw. The resultant force forms an angle ξ with the vertical direction. As ξ increases, the horizontal component of the force increases. If this horizontal component exceeds the static friction between the straw and soil, the straw slides towards the convex side of the disc, leading to missed cleaning.
Side view: Assume the force line between the tine and straw passes through the tine center and the straw centroid. The resultant force forms an angle α with the horizontal direction. After contacting the straw, the outermost point of the tine tends to slide forward relative to it. For a fixed tine radius r, the angle α decreases with decreasing tine height l. This increases the likelihood of sliding and potential blockage.
To prevent straw slippage and ensure effective engagement, self-locking conditions must be satisfied in both views. These conditions are:
ξ φ α π 2 φ
where φ is the friction angle between the straw and the ground.
According to ref. [25], ξ should be constrained within the range from 0° to 30°. Based on geometric constraints, a tine height l of 55 mm ensures that the α satisfies the self-locking condition in the side view.
  • Phase 2: Concave Cleaning Straw and Shallow Tillage
During this phase, the tines penetrate the soil surface slightly. This disturbs the upper soil layer, achieving shallow tillage and reducing surface soil compaction. Simultaneously, straw and soil rotate continuously with the SCD, moving towards the ejection point D where they are thrown out. The magnitude and direction of the velocity at point D affect the trajectory height and side-throwing distance. As shown in Figure 9, the velocity instantaneous center theorem shows that the angular velocity of the disc and the velocity at point D are:
ω = v 1 R 1 = v m cos γ R 1 v D = ω R 1
where ω is the angular velocity of SCD, v1 is the component velocity in SCD plane, vm is the initial forward speed of SCD, and vD is the absolute linear velocity at point D of SCD.
  • Phase 3: Leaving and Throwing Straws
After leaving point D, the straw possesses the absolute velocity vD. Modeling the straw as an ideal particle, its velocity components in the spatial coordinate system are:
v D = v D x 2 + v D y 2 + v D z 2 v D x = v D z tan ξ v D y = v D x / tan γ
where vDx, vDy, and vDz are respectively the component velocities of vD along the x, y, and z axes.
The lateral throwing distance is expressed as:
L 1 = v D x t t = 2 v D z g
where L1 is the distance of straw lateral throwing, and t is the straw’s airborne time.
During this dynamic ejection phase, the effective cleaning width exceeds the static width B. This defines the dynamic cleaning width B’, calculated as:
B = B + 2 L 1 = B + 4 v m 2 cos 2 γ tan ξ g ( tan 2 ξ + tan 2 ξ / tan 2 γ + 1 )
where B’ is the dynamic cleaning width.
Equation (12) further confirms the influence of γ, ξ, and L on cleaning performance. The interactions among these parameters are complex, precluding the determination of optimal values based solely on theoretical analysis. As the feasible parameter ranges were established in the preceding sections, simulation methods were employed to evaluate SCD operational performance across various parameter combinations and to conduct optimization accordingly.

2.2.3. Design of Strip Subsoiling Mechanism

Full-width subsoiling operations in maize fields face significant limitations due to their high draft resistance, extensive soil disturbance, and substantial energy consumption. In contrast, strip subsoiling targets the soil layer directly beneath the seeding strip (following the shallow tillage performed by the SCDs) to achieve the vertical alleviation of soil compaction.
During subsoiling, the subsoiler shovel penetrates the soil. Its action generates crescent-shaped fractures in the upper soil layer and rectangular fractures in the deeper soil [26]. Given that the crescent-shaped failure range is relatively narrow and that the strip width is restricted by the soil-cutting knives, the overall fracture area can be approximated as a rectangle, as shown in Figure 10a. When the Subsoiler shovel advances, its tip wedges into the soil and the shovel surface applies vertical tensile and shear forces on the soil, as illustrated in Figure 10b. According to the Mohr–Coulomb criterion [27], the shear stress τ satisfies:
τ = C + σ tan φ i
where τ is the soil shear stress, C is the soil cohesion, σ is the soil normal stress, and φi is the internal friction angle of soil.
When τ exceeds the soil shear strength, it induces shear failure and brittle fracture, forming a fissure network that penetrates the plow pan. Under ideal conditions, the fissure depth should exceed the subsoiling depth HS. The formation of such fissures greatly enhances vertical permeability of the soil and causes an upward heave height ΔH in the longitudinal-vertical plane, resulting in changes in soil bulk density. According to the principle of mass conservation:
ε S = ε 0 1 + Δ H / H S
where ε0 and εS are, respectively, the soil bulk densities before and after the operation.
Soil compaction is positively correlated with bulk density [28]. Hence, from the above equation, a larger ΔH indicates a lower post-operation bulk density and a greater reduction in soil compaction. The relative reduction is expressed as:
Δ P = P 0 P S P S × 100 %
where ΔP is the relative decrease in soil compaction, and P0 and PS are, respectively, the soil compaction before and after the operation.
During subsoiling, if the shovel is flanked by unbounded side components, the surface disturbance pattern is approximately fan-shaped. The maximum disturbance width W can be expressed as [29]:
W = 2 ( H S cos φ i + L S sin φ i )
where LS is the length of subsoiler shovel handle.
This indicates that the disturbance width is determined not only by shovel geometry but also by subsoiling depth. To ensure effective fragmentation of the topsoil within the strip, the disturbance width should exceed the strip width of 200 mm. Addressing the need for reduced straw entanglement and minimized tillage resistance under conservation tillage, a combination of medium shovel and dual-wing subsoiling shovel is adopted according to the Chinese national standard GB/T 24675.2-2024 Conservation Tillage Equipment—Part 2:Subsoiler [30]. The shovel is 300 mm in length and 25 mm in width. For ensuring sufficient deep-soil disturbance while reducing operating resistance, 150 mm-wide dual-wing shovels are selected. Tungsten carbide coating is applied to the shovel tips to enhance wear resistance, enabling adaptation to high-residue return conditions. To effectively break the plow pan, a mid-position subsoiling depth of 300 mm is selected, with two adjustable levels in increments of 90 mm depending on field conditions. Substituting into Equation (16), it is found that under common ranges of soil friction angle [31,32,33], the selected parameters satisfy the disturbance width requirements for strip subsoiling.
To cut the upper soil layer clods and finely chopped straw after subsoiling, constrain the strip width, and prevent straw fallback, soil-cutting knives are mounted on both sides of the subsoiler shovel. Based on Equation (3), the knives diameter is set to 600 mm. For improved crushing of soil clods, 20 notches with a depth of 17 mm are selected. To avoid interference with the wedge-shaped structure formed by the subsoiling shovel and ensure adaptability to uneven surfaces, a spring-based profiling mechanism is used to control the penetration depth of the soil-cutting knives.
2.3. Simulation Test on Optimal Spatial Parameters of the SCD

Based on theoretical analysis and relevant industry and national standards, the dimensions of the monomer profiling mechanism and strip subsoiling mechanism have been determined, but the specific spatial installation parameters of the SCD are still unclear. These parameters influence its straw-cleaning ability, which, in turn, affects the overall field operation. To ensure optimal cleaning performance, a multi-factor discrete element method (DEM) simulation was carried out to determine the optimal spatial configuration.

2.3.1. Establishment of the Soil Bin Model

Using Solidworks 2024 (Dassault Systèmes, Waltham, MA, USA), a 3D model of the SCD was created, with irrelevant parts excluded, and saved in IGS format. It was imported into EDEM 2024 (Altair, Edinburgh, Scotland, UK). The material for the disc was made of Q235 steel with a Poisson’s ratio of 0.3, shear modulus of 7.9 × 10¹⁰ Pa, and density of 7865 kg/m3.
A soil bin model measuring 2000 mm × 700 mm × 100 mm (L × W × H) was built using spherical soil particles with a 5 mm radius, Poisson’s ratio of 0.38, shear modulus of 1 × 10⁶ Pa, and density of 2650 kg/m3.
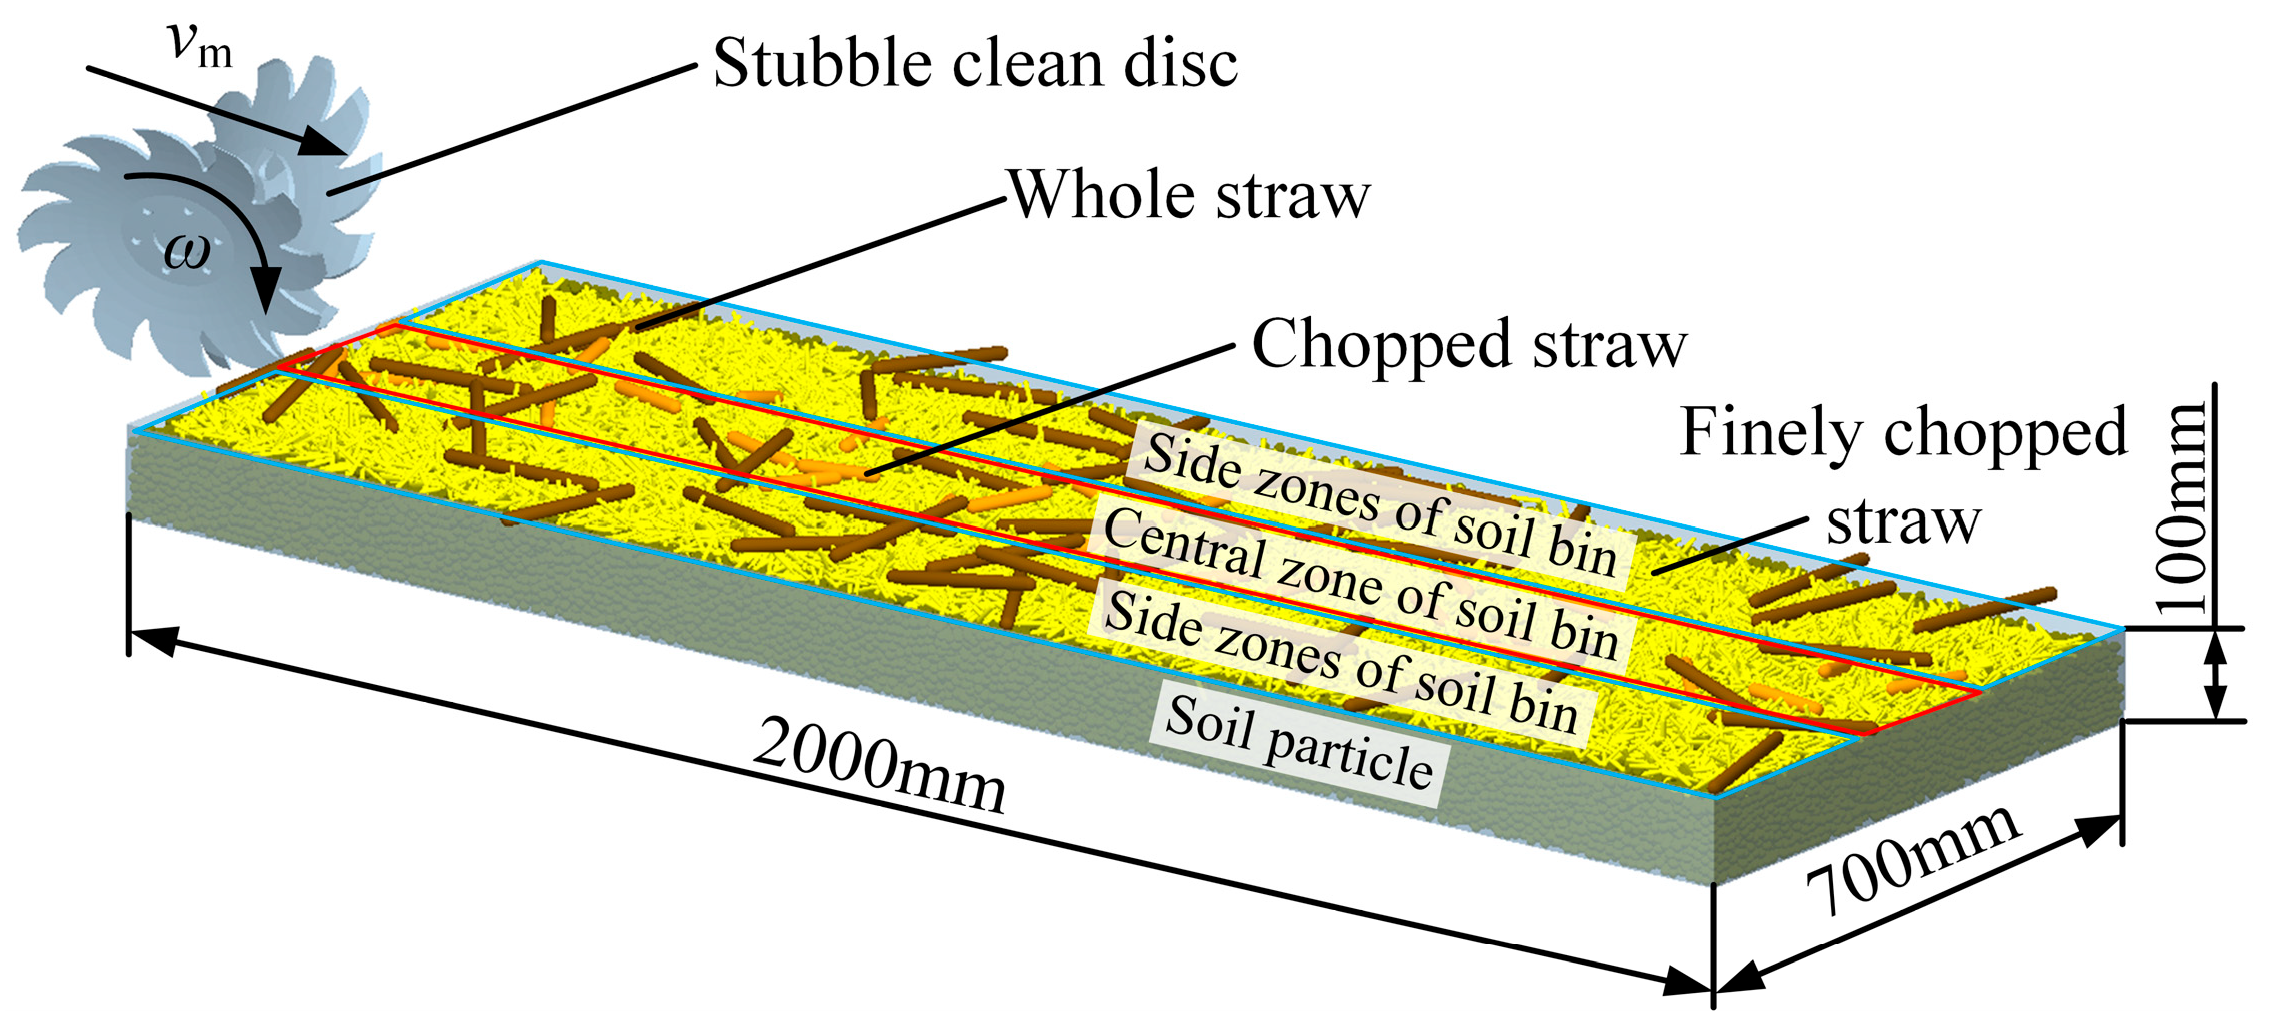
To simulate realistic operating conditions where the disc follows the stubble cut notch discs for straw cleaning, SpheroCylinders were used to model three types of straw: finely chopped straw, whole straw, and chopped straw. Based on actual field conditions, the mulch density of finely chopped straw and whole straw are 2.35 kg/m2 and 0.35 kg/m2, respectively. The chopped straw represents the state of whole straw after being cut by the stubble cut notch discs; therefore, its mulch density is 0.35 kg/m2. The quality of each type of straw is the product of the mulch density and the distribution area. The specific quality is shown in Table 2. Straw had a Poisson’s ratio of 0.4, shear modulus of 1 × 10⁶ Pa, and density of 243 kg/m3. The model is illustrated in Figure 11.
There have been a large number of simulations conducted on SCD components currently. In these studies, scholars often adopt specific methods to simplify the simulation models. For example, when the moisture contents of both soil and straw are relatively low, by neglecting the unnecessary frictional effects between the materials, valid simulation results can be obtained, which can reliably support the design of the mechanism [9,25,34,35]. Therefore, focusing on the interaction between the disc and straw, we prioritized less accuracy in soil particle details. Given the weak adhesion of dry corn straw, the Hertz–Mindlin (no-slip) contact model was used for straw–straw, straw–soil, straw–Q235, and soil–Q235. Contact parameters are shown in Table 3.

2.3.2. Plan of the Simulation Test

The disc was placed outside the soil bin with a working depth of 50 mm. According to existing research, when using SCD components for straw removal, the machine’s forward speed generally has a positive correlation with the straw removal rate [11,12,13,14,34,36]. Therefore, in this paper, the role of this factor is appropriately weakened, and the forward speed is set at 2 m/s. Spatial parameters were adjusted by rotating and translating the disc relative to coordinate axes. To match the rotational speed of the SCD with all parameters and the forward speed, the rotational speed was calculated using relevant mechanical Equation (9). A fixed timestep of 1.5 × 10⁻⁵ s and total simulation time of 2.5 s were used, with GPU acceleration enabled.
Using an orthogonal rotation combination design, three factors were selected: the deflection angle γ, inclination angle ξ, and installation spacing L. The response variable was straw removal rate Y. Factor levels and their coded values are shown in Table 4.

2.3.3. Indicator of the Simulation Test

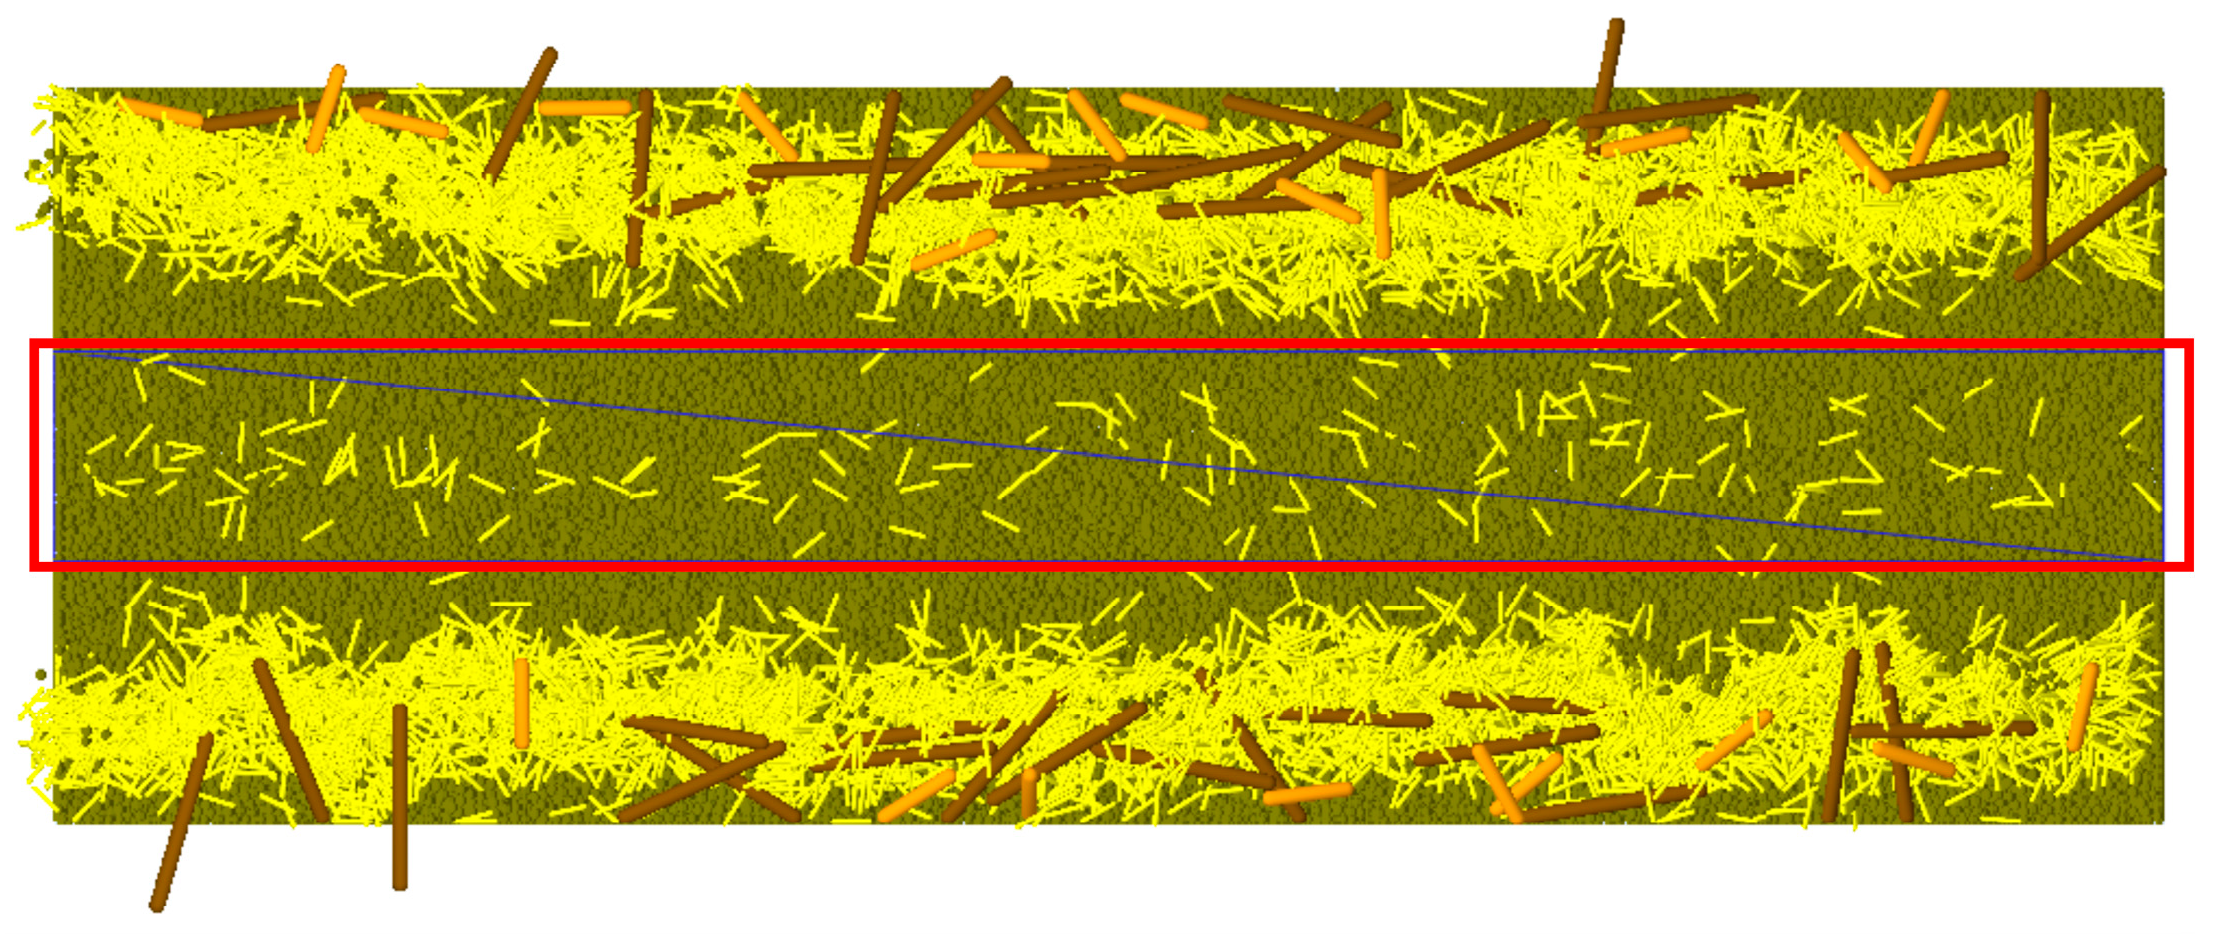
The straw removal rate (SRR) was used to quantify the performance of the SCD. As shown in Figure 12, the straw masses within the designated frame area before and after operation were extracted and compared. The SRR was then calculated using the following equation:
J d = M q M h M q × 100 %
where Jd is the SRR of the SCD; Mq and Mh are, respectively, the quality of straw before and after the operation.

2.4. Field Test

2.4.1. Test Condition

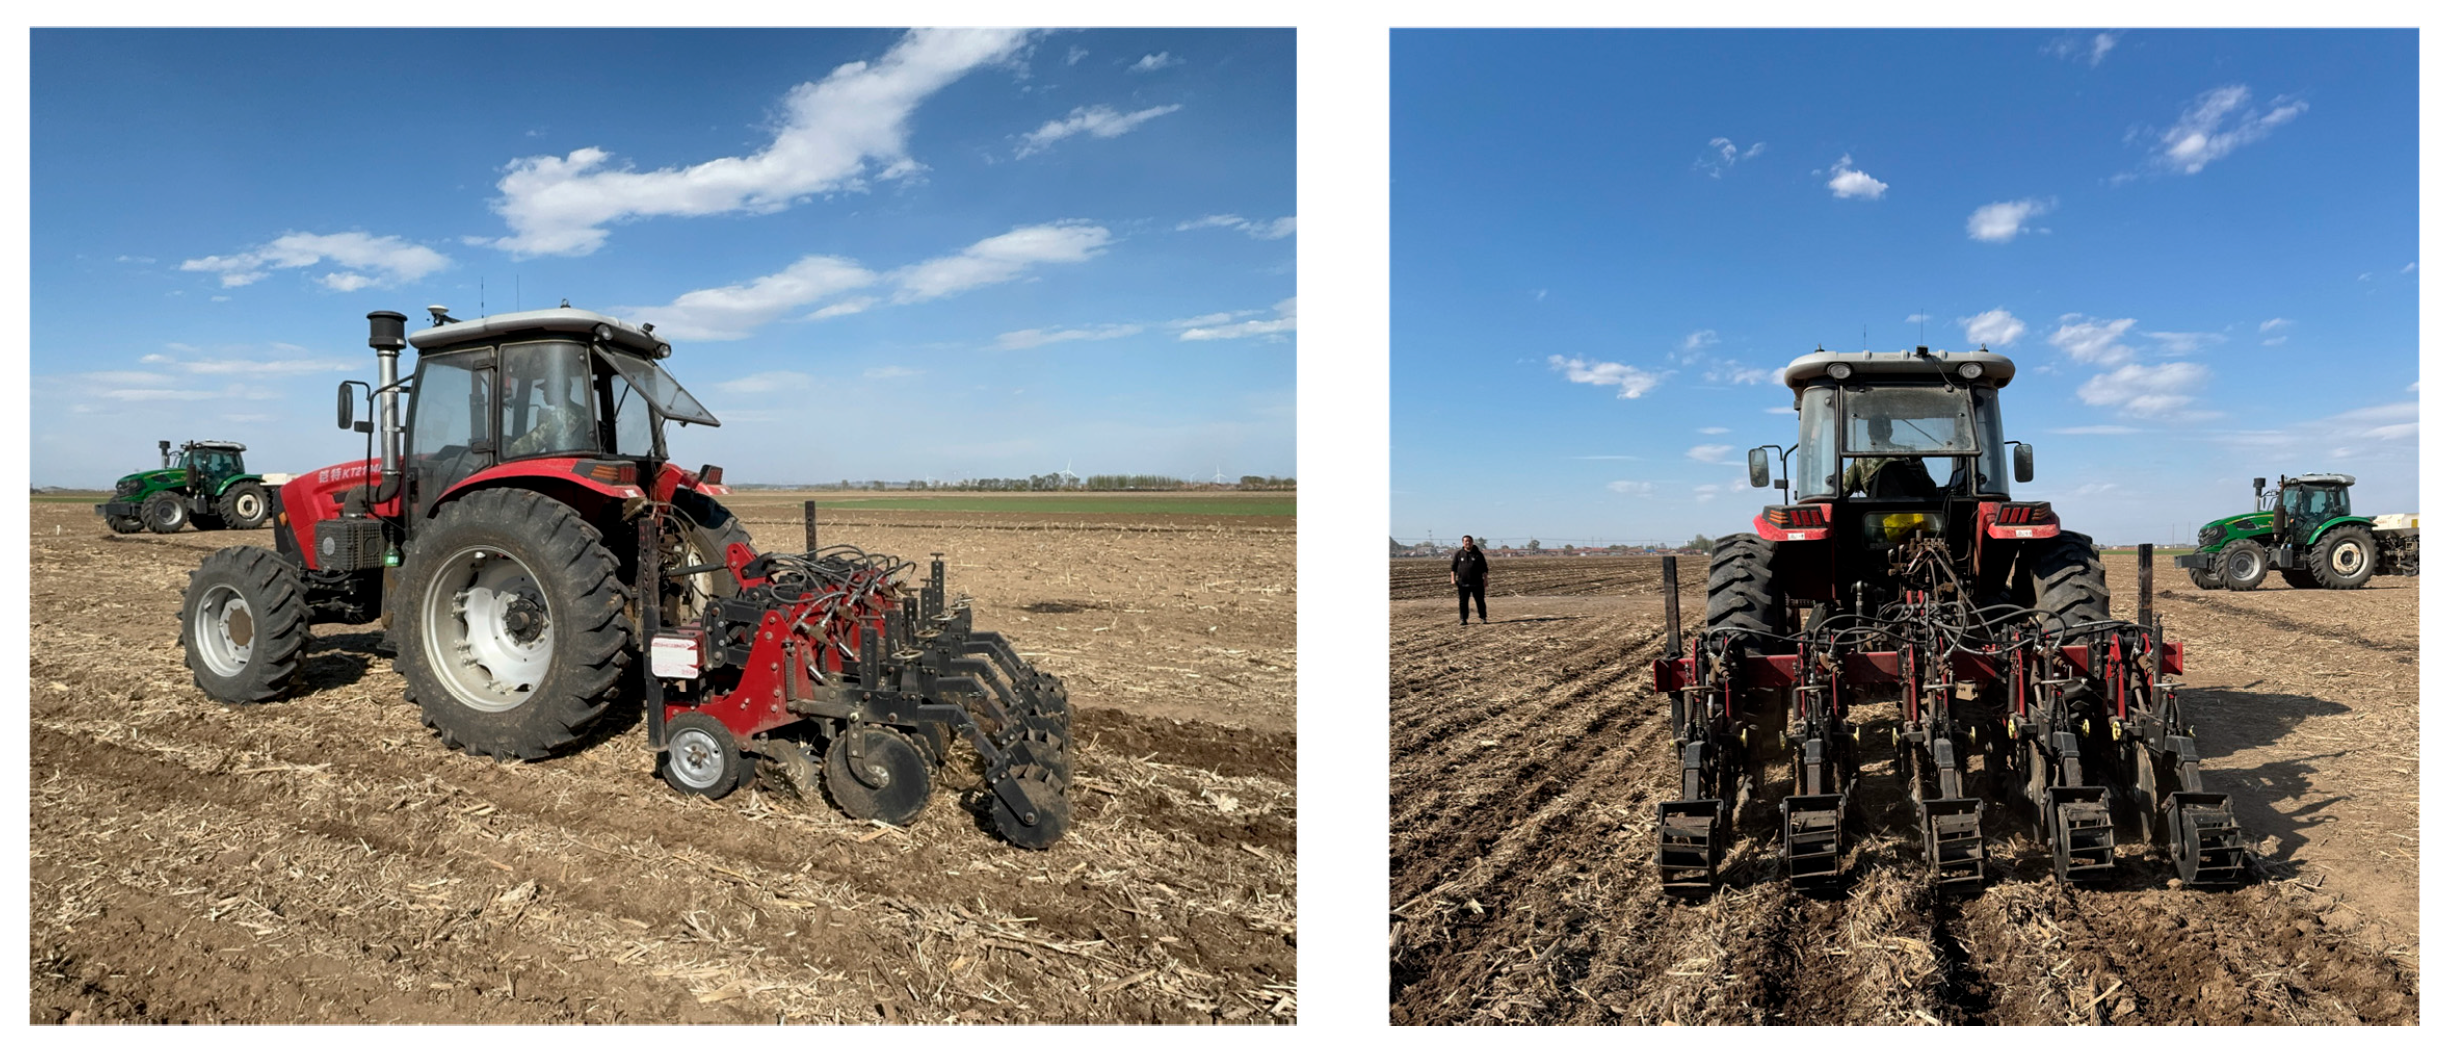
To verify the field operational performance of the designed machine, all components were fabricated and assembled based on the dimensions obtained from theoretical and simulation analyses. Field tests were conducted in April 2025 at the Zhangzhuang Cooperative in Cainiu Town, Tieling City, Liaoning Province (123°37′58″ E, 42°21′27″ N), where continuous maize cropping is commonly practiced. During the test period, the average daytime temperature was approximately 15 °C, with no rainfall, and the test plots were flat. The field testing conditions are shown in Figure 13.
The main equipment and instruments used during the field test included a KT2104A tractor (KaiTe), the straw-strip-collecting and subsoiling strip tillage machine, a soil compaction tester (SC900 model, Spectrum Technologies Inc., Shijiazhuang, China, accuracy: ±103 kPa), a 100 cm3 soil sampler (ring knife), a measuring tape (accuracy: 0.1 mm), a tillage depth gauge (accuracy: 0.1 mm), a Kubei portable electronic scale (accuracy: 0.01 g), and a handheld spring scale (accuracy: 0.01 kg), among others. Characteristic parameters of the test plot were measured, and the results are presented in Table 5.

2.4.2. Test Methods and Indicators

During field testing, the tractor operated at a forward speed of 2 m/s, with each operation pass covering 100 m. At least two full passes were conducted in each test zone. In accordance with the relevant standards for JB/T 9788-2020 Subsoiler and Share Shaft and DB22/T 3605-2023 Specification for Operational Quality Strip Tillage and Land Preparation Machine [37,38], the width of the straw-cleaning band (WSCB), overall straw removal rate of sowing strip (OSRR), subsoiling depth and its stability (SD and SDS), and soil fragmentation rate (SFR) were selected and measured.
  • Width of the Straw-Cleaning Band (WSCB)
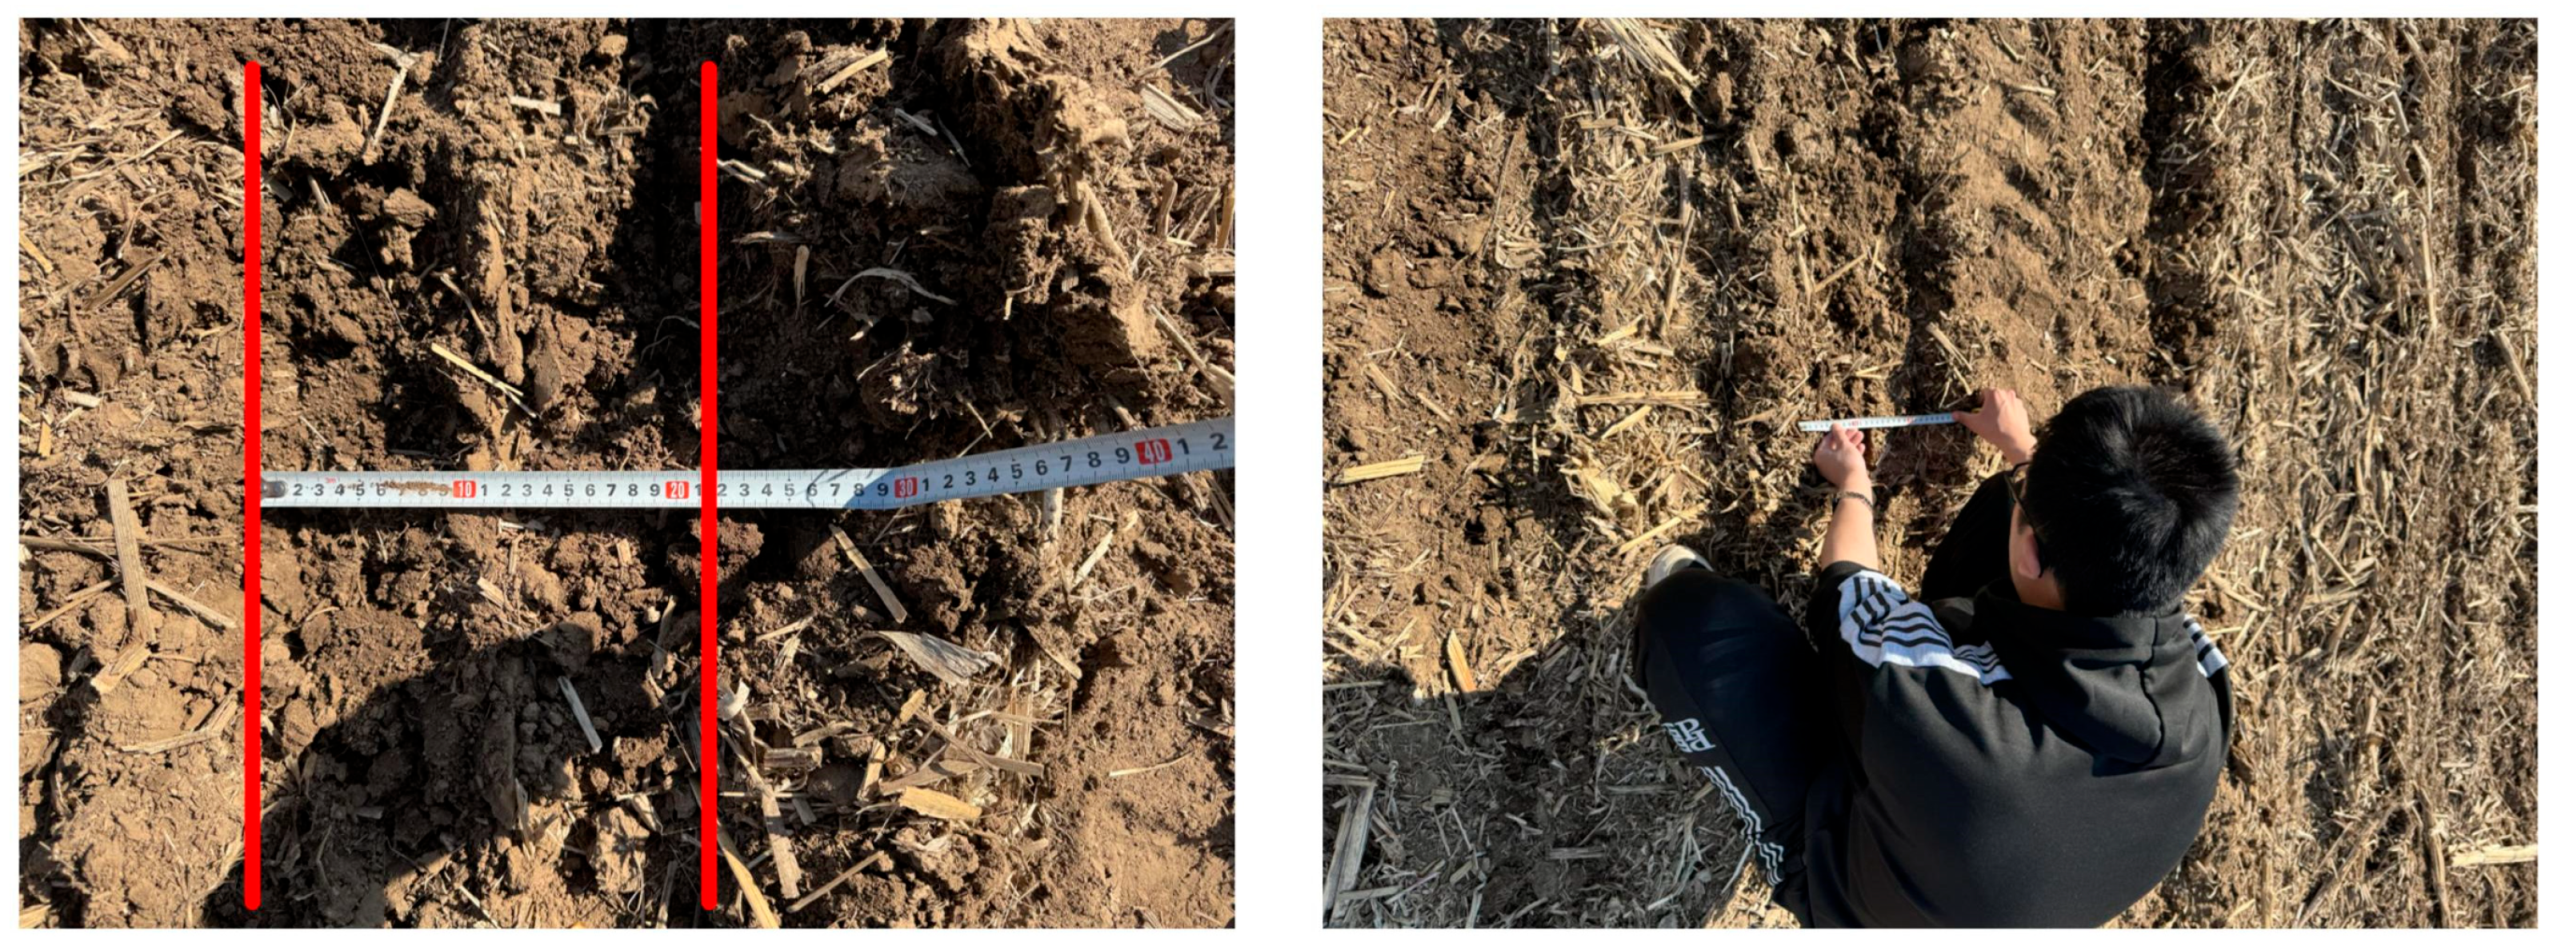
As shown in Figure 14, in any operated strip, a line perpendicular to the machine’s travel direction was drawn, stretching from one side of the uncleaned straw boundary to the other. The length of this line was measured at 10 points, spaced at 0.5 m intervals along the forward direction. The average value was taken as the straw-cleaning width. This procedure was repeated for two randomly selected strips, and the final result was averaged.
2.
Overall Straw Removal Rate of Sowing Strip (OSRR)
In any operated strip, a 5 m-long section was randomly selected along the forward direction. The mass of uncleaned straw was collected and recorded. The OSRR was calculated using the following equation:
J = 1 q 500 T W × 100 %
where J is the SRR of field test, q is the quality of uncleaned straw in the survey area, T is the WSCB, and W is the mulch density of straw.
3.
Subsoiling Depth and its Stability (SD and SDS)
For each operation pass, one side point in a strip was selected every 2 m along the travel direction. The depth from the undisturbed surface to the trench bottom was measured using a depth gauge or other measuring tools. At least 10 points were measured per strip. After multi-strip operation, two strips per pass were randomly selected for measurement. The average subsoiling depth and the stability coefficient were calculated accordingly.
4.
Soil Fragmentation Rate (SFR)
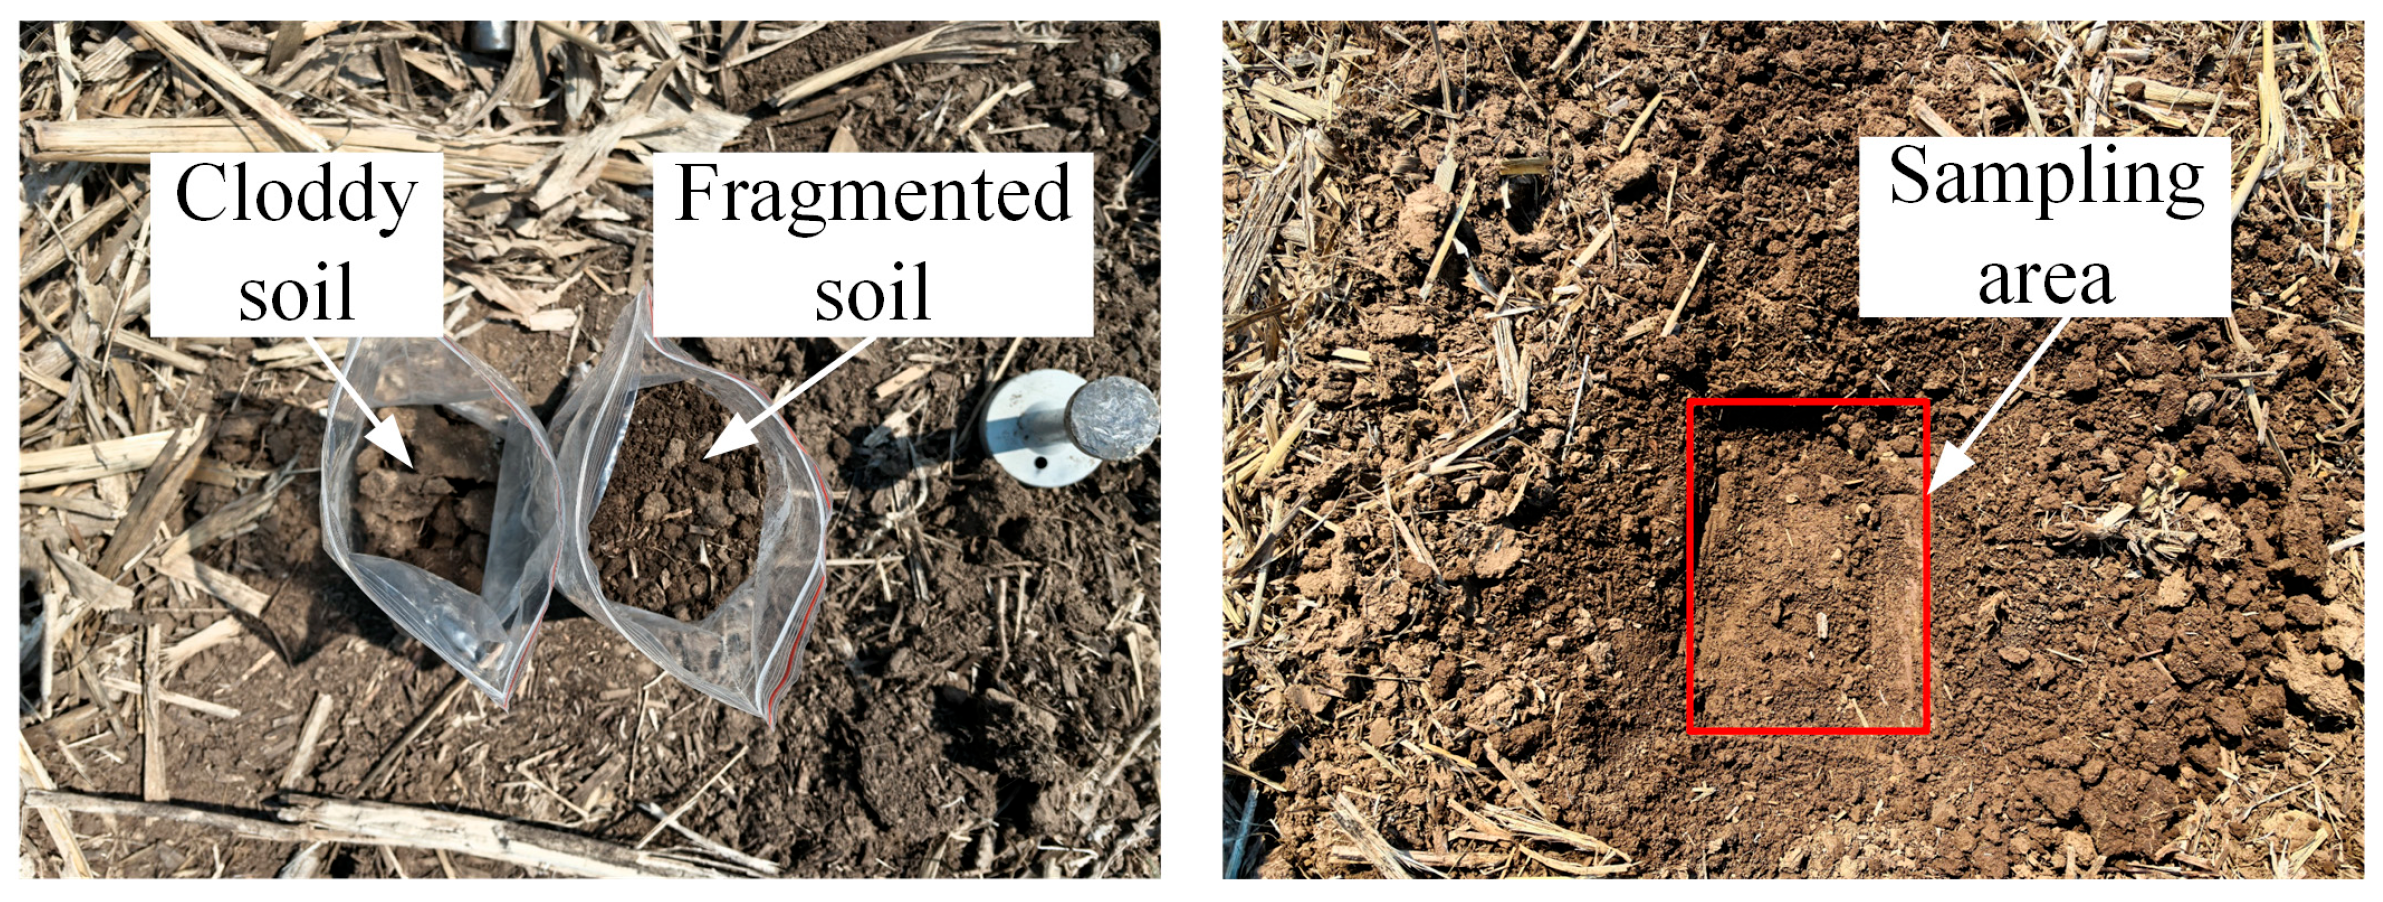
As shown in Figure 15, a 0.2 m × 0.2 m area, down to a depth of 100 mm, was sampled on one side of each operated strip at 2 m intervals along the travel direction. At least 10 areas were measured per strip to cover most of the strip’s area. For each sampled area, the total soil mass and the mass of clods ≤ 40 mm in length were recorded for each sampled area, and the fragmentation rate for each area, as well as the overall fragmentation rate, were calculated using the following equations:
C i = G s i G i × 100 % C = i = 1 N C i N
where Ci is the SFR of the i-th area, GSi is the mass of the cloddy soil with the longest side not exceeding 40 mm of the i-th area, Gi is the total mass of cloddy soil of the i-th area, N is the number of areas, and C is the total SFR.

2.5. Soil Compaction Reduction Test over the Years

To verify the effectiveness of the designed straw-strip-collecting and subsoiling strip tillage machine in reducing soil compaction, long-term soil compaction data were collected under continuous operation of the machine and analyzed comparatively. According to the analysis in Section 2.2.3, both soil bulk density and soil compaction can be used to characterize the degree of soil compaction; in this study, soil compaction was selected as the evaluation index.
The data collection site was the same as described in Section 2.4, and all test plots adopted the straw-strip-collecting and subsoiling strip tillage mode. Data were collected in May 2023 (Time Point I), May 2024 (Time Point II), and April 2025 (Time Point III), all measured before spring maize sowing. For each year, 10 measurement points were selected, and soil compaction was recorded from 0 to 30 cm soil depth at 2.5 cm intervals.
Statistical analysis was performed using R 4.5.0 (R Development Core Team, Auckland, NA, New Zealand) software, and ANOVA followed by Tukey HSD tests was conducted at a significance level of 0.05.

3. Results and Discussion

3.1. Simulation Test Results and Analysis

The simulation test results for the SCD are summarized in Table 6. Overall, 23 factor combinations were tested, including nine center-point replicates to validate model consistency.

3.1.1. Significance Testing and Regression Analysis

Multiple regression and ANOVA were performed using Design Expert 13 to assess the independent effects of each factor on the response. Results are presented in Table 7, and the regression equation for Y is shown in Equation (20).
Y = 65.07 + 7.60 γ + 21.33 ξ 16.41 L 1.76 γ ξ + 0.24 γ L + 1.99 ξ L + 0.57 γ 2 4.73 ξ 2 + 0.73 L 2
As shown in Table 7, the lack-of-fit was not significant (p > 0.1), confirming no uncontrolled variables influenced the results and supporting the adequacy of the quadratic regression model. The model itself was highly significant (p < 0.01). All primary factors—deflection angle (γ), inclination angle (ξ), and installation spacing (L)—had extremely significant effects on the SRR (p < 0.01) with independent contributions. According to the regression model, the order of influence was ξ > L > γ, where γ exerted its effect primarily through interaction terms. Among the quadratic terms, ξ2 showed an extremely significant effect (p < 0.01), while γ2 and L2 were not significant (p > 0.1).

3.1.2. Analysis of Interaction Effects Among Factors

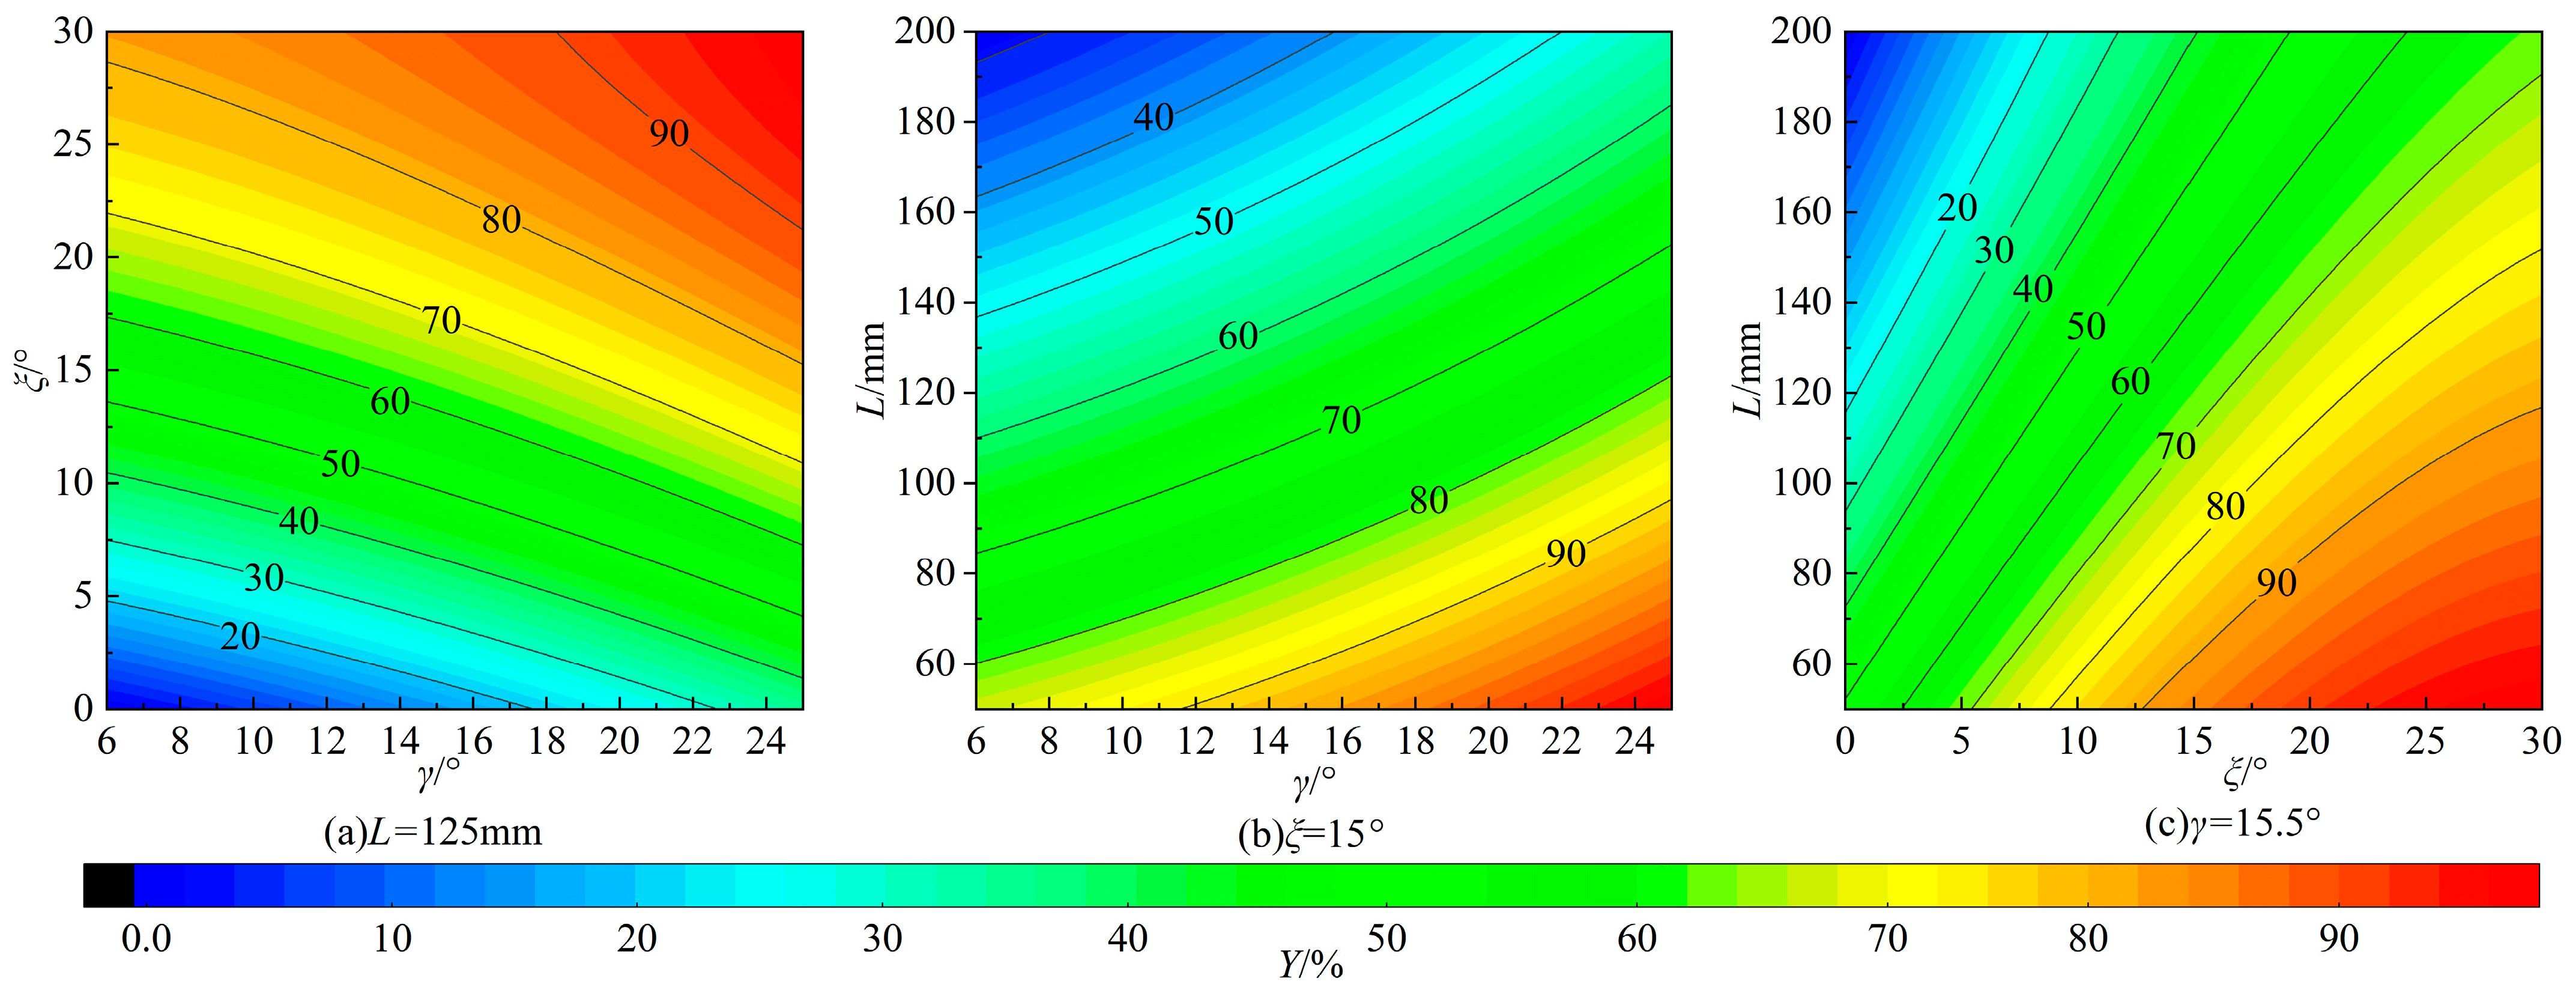
Contour plots showing the effects of interactive factors on SRR were generated using Origin 2022 (OriginLab, Northampton, MA, USA).
As shown in Figure 16a, the SRR increased with both the deflection angle (γ) and inclination angle (ξ), which is consistent with the conclusion of Kumar, M. et al. [13]. This is because a greater γ increases the ground contact range of the SCD, while higher ξ promotes lateral movement of straw during ejection from the disc. The combination of these two parameters fully leverages the curvature radius of the disc to enhance soil turning and straw throwing. When ξ is at a low level, increasing γ has limited effect on improving the SRR. However, at any given γ level, increasing ξ consistently improves performance. This indicates that increasing γ primarily enhances the disc’s pushing ability but does not contribute significantly to lateral ejection [11]. In contrast, increasing ξ reduces the angle between the initial ejection velocity and the ground, thereby increasing the side-throwing distance and enhancing the cleaning effect.
As shown in Figure 16b, the SRR increased with increasing γ and decreasing installation spacing (L), which is consistent with the conclusion of Lekavičienė, K. et al. [14]. A smaller L reduces the width of the missed cleaning region, thereby improving the disc’s ability to capture straw. When either γ or L is held constant, changes in the other factor have relatively minor effects on straw removal. This indicates that while increasing γ can partially compensate for cleaning width and slightly enhance soil-turning and straw-throwing performance, its effect remains limited.
In Figure 16c, the SRR increased with increasing ξ and decreasing L. At all ξ levels, reducing L leads to improved removal performance. Larger ξ values consistently result in higher removal rates, with gentler trends compared to smaller ξ values, which is consistent with the conclusion of Gao Z. et al. [39]. This indicates that a greater inclination angle is more decisive in determining straw removal effectiveness. When L is held constant, increasing ξ exhibits a similar trend: its effect on straw removal becomes progressively weaker as ξ increases. This suggests that increasing ξ can effectively compensate for cleaning width and reduce missed cleaning regions, but its compensation capacity diminishes when installation spacing is large. This explains the lower removal rates observed in simulation tests No. 5, 6, and 11.

3.1.3. Parameter Optimization

To determine the optimal spatial installation parameters for the SCD, a goal-constrained optimization was performed using the regression model in Design Expert 13 (Stat-Ease, Minneapolis, MN, USA). Based on the selected optimization objectives, constraints, and constraint functions:
max Y ( γ , ξ , L ) s . t . 6 ° γ 25 ° 0 ° ξ 30 ° 50   mm L 200   mm
The objective function was solved accordingly. The resulting optimal parameters were then rounded for practical implementation and verified within the simulation model to ensure no interference between components and ease of manufacturing.
The final optimal configuration was determined as follows: γ = 16.5°, ξ = 25°, L = 100 mm. Under these conditions, the predicted SRR was 92.19%. A subsequent validation simulation yielded a SRR of 95.34%, confirming the accuracy and reliability of the optimized results.

3.2. Field Test Results and Analysis

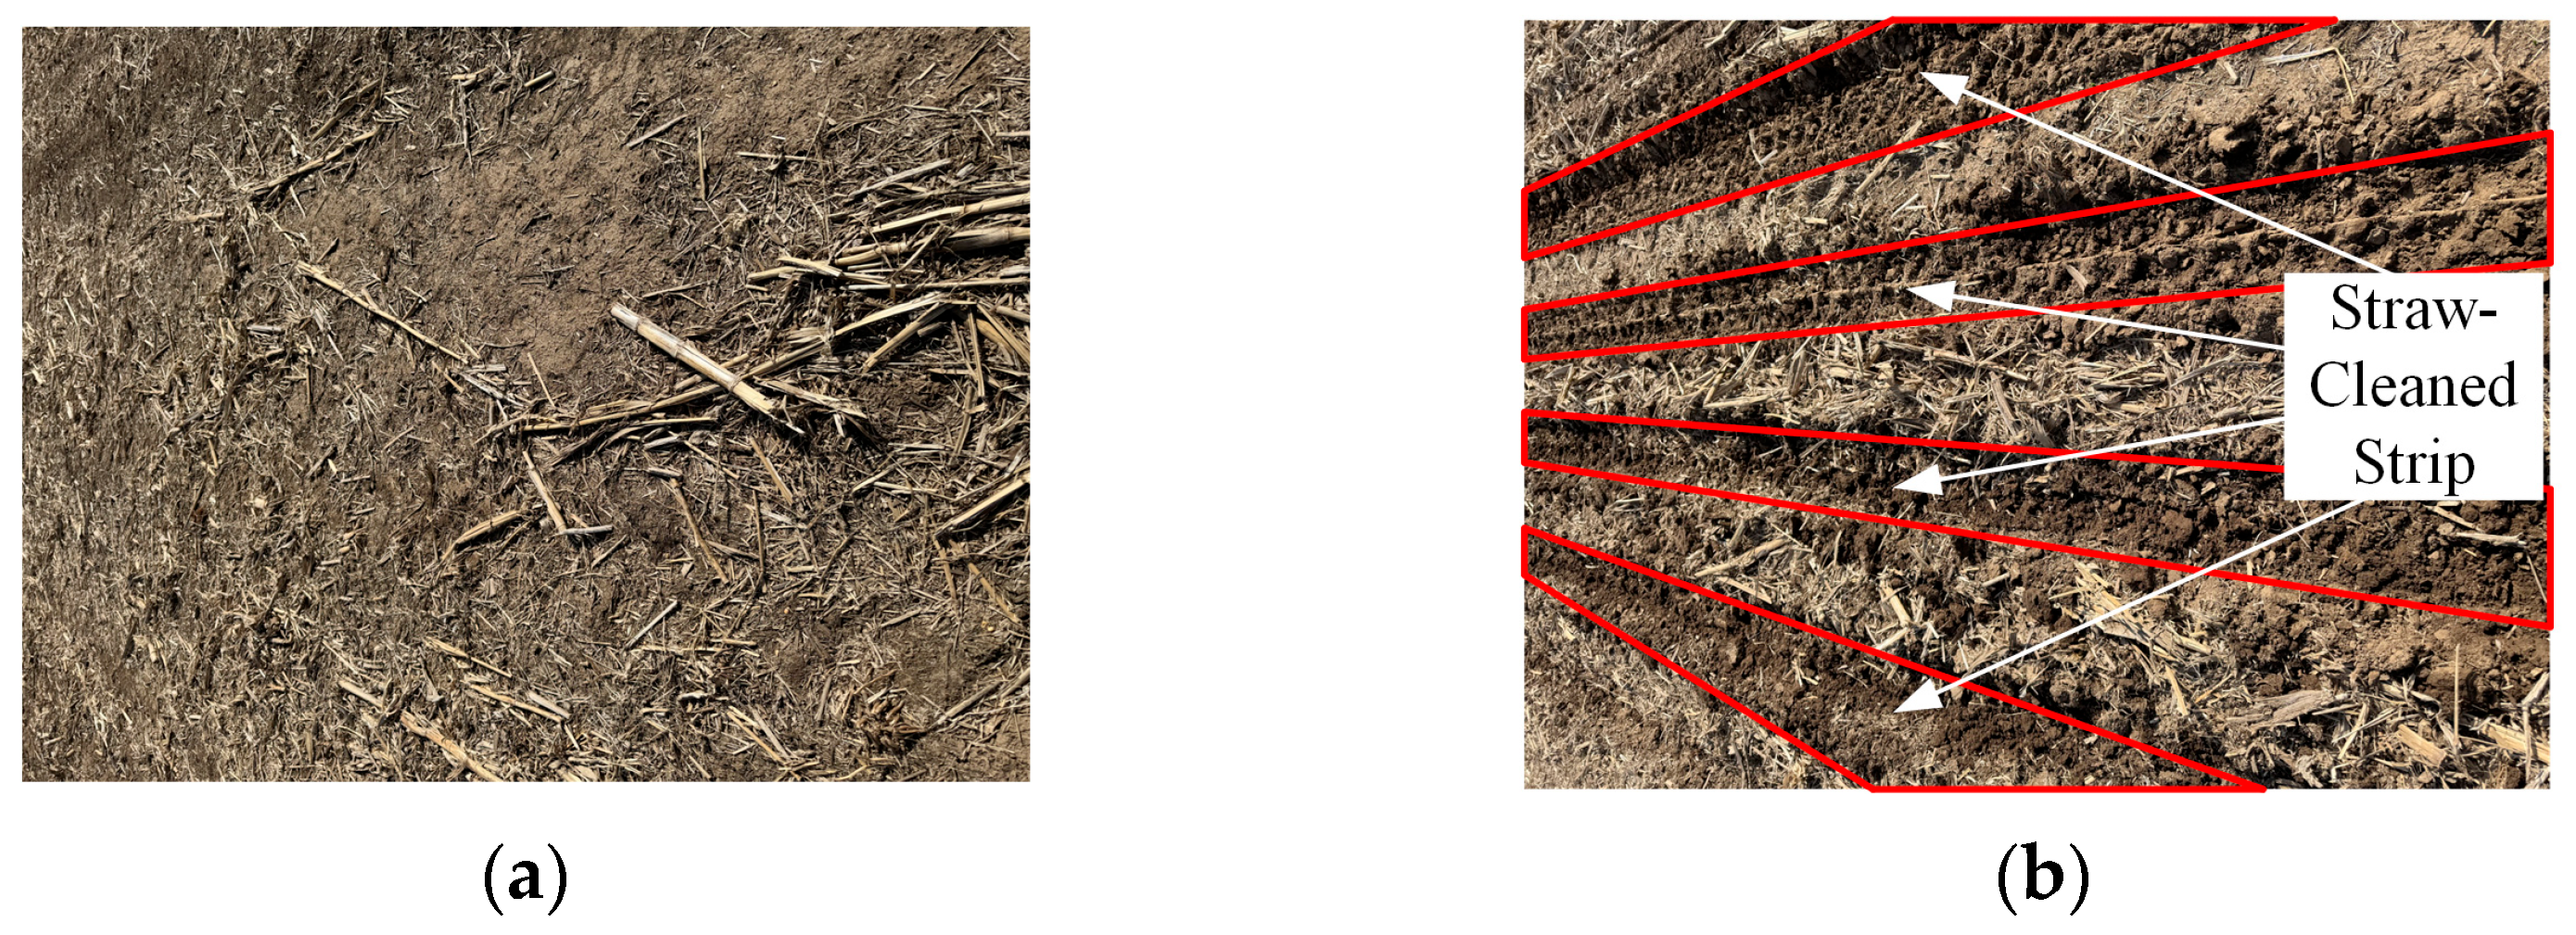
As shown in Figure 17, the machine formed five clean seed strips after operation, and the soil appeared loosened, indicating that the equipment effectively achieved the intended tillage results. Based on the relevant standards for JB/T 9788-2020 Subsoiler and Share Shaft and DB22/T 3605-2023 Specification for Operational Quality Strip Tillage and Land Preparation Machine and the measurement results of the field tests, the performance standards and the measured results are listed in Table 8.

3.2.1. Analysis of WSCB

The average WSCB was 193.70 mm, slightly less than the theoretical strip width of 200 mm. It is worth noting that, according to the analysis in Section 2.2.2, the actual straw clearance width should be greater than the theoretical straw clearance width. However, the actual value in Section 3.2 is less than the theoretical value by 200 mm.
This is primarily related to our measurement method. The spacing of the soil-cutting knives on each monomer unit is 200 mm, which is the theoretical value. The soil-cutting knives can maintain a clear and distinct boundary between the sowing area and the non-sowing area. Therefore, when we measure, we will take this boundary as the reference point and further search for the boundary of uncleaned straw. Due to the falling back of the straw and the soil, it will result in a decrease in the WSCB, and situations where it is less than 200 mm may occur.
In addition, there are numerous random errors, possible causes include: (1) the thin soil-cutting knives, which may shift slightly due to installation gaps, and (2) the falling back of soil and straw after operation. Nevertheless, the width remained within the required range and met operational standards.

3.2.2. Analysis of OSRR

The average OSRR was 84.82%, exceeding the 70% standard. Compared with traditional stubble-cleaning devices, the device demonstrates OSRR improvements between 4.68% and 19.17% [9,24,34]; the following reasons were identified: Like conventional tools, the device employs passive stubble-cleaning mechanisms, which are inherently limited under high-residue return conditions. However, the compact structure of the machine minimizes gaps between components. The stubble cut notch discs and SCDs overlap in part, allowing quick removal after cutting and reducing the chance of straw sliding into missed-cleaning zones. Additionally, the soil-cutting knives and subsoiling shovel further crush and embed the straw, improving cleaning effectiveness.
Compared with the simulation, SRR the OSRR is 10.52% lower; this resulted from more irregular field straw distribution and the ineffective lifting and throwing of some fine straw. Uneven straw cover density across the field also contributed to the variability. Overall, the optimized simulation results are in good agreement with the field experiments, and the operation effect is satisfactory.

3.2.3. Analysis of SD and SDS

The average SD was 271.70 mm, and the average SDS was 91.85%, both exceeding the standard values of 250 mm and 85%, respectively. Compared with traditional subsoiling devices, the device demonstrates SDS improvements about 1.12% [22], which represents a certain degree of enhancement but is still limited. This is because the MPSTM is equipped with a profiling mechanism, which can better adapt to the undulating conditions in the field, thus resulting in an increase in SDS. However, under conditions of high operational resistance, the profiling mechanism exhibits constrained efficacy, where active control methods are required to augment SDS. Overall, these results confirm the MPSTM’s excellent subsoiling performance.

3.2.4. Analysis of SFR

The SFR averaged 81.19%, far exceeding the 35% requirement. This high rate is attributed to the soil-cutting knives, which effectively broke up the large soil clods loosened by the subsoiling shovel, enhancing soil fragmentation.
In summary, all performance indicators of the straw-strip-collecting and subsoiling strip tillage machine met or exceeded the standards for strip tillage, confirming its effectiveness in field operations.

3.3. Soil Compaction Reduction Test over the Years Results and Analysis

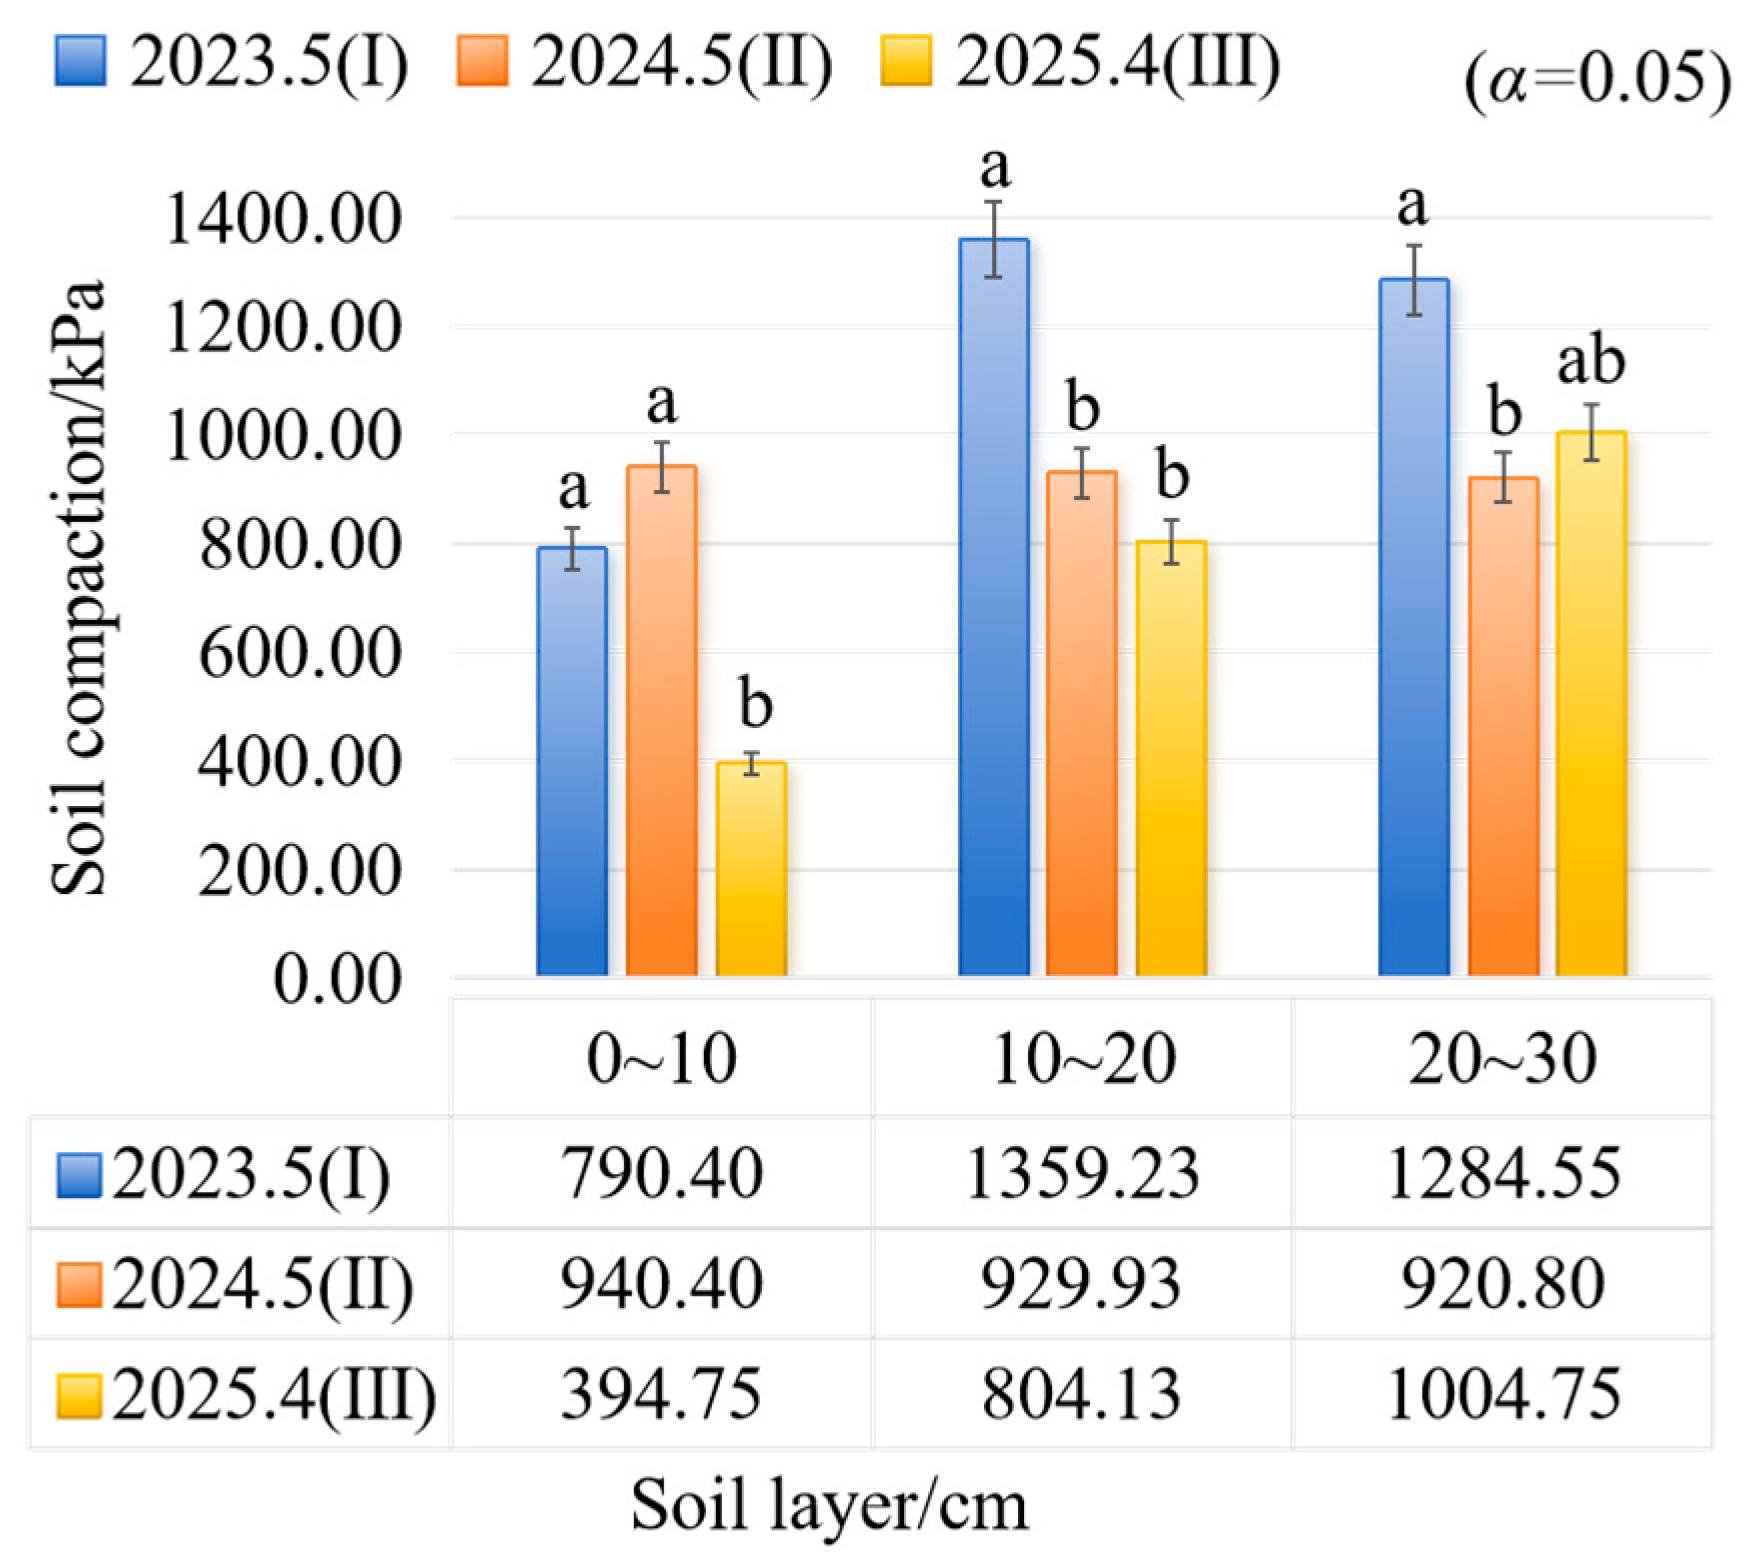
The full results of soil compaction reduction over the years are shown in Appendix A Table A1, Table A2 and Table A3. The results after processing are shown in Figure 18.
The p-values for the 0–10 cm, 10–20 cm, and 20–30 cm layers were 0.0028, 0.0047, and 0.044, respectively, indicating significant differences in soil compaction across time points.
For the 0–10 cm layer: compaction at Time Point II was slightly higher than at Point I (due to intensive machinery operations before sowing), though the difference was not significant. At Time Point III, compaction decreased significantly compared to Point I (about 50.08% reduction). For the 10–20 cm layer: compaction at Points II and III was significantly lower than at Point I (about 40.83% reduction), with no significant difference between II and III. For the 20–30 cm layer: compaction at Point II was significantly lower than Point I. At Point III, compaction was slightly higher than at Point II but still significantly lower than Point I (about 21.78% reduction).
These findings confirm that the subsoiling strip-tillage mode provides effective soil compaction reduction, particularly in the 10–30 cm soil layer. Compaction reduction in the 0–10 cm layer is more susceptible to annual field operation intensity.
It should be noted that this study used soil compaction alone as the evaluation metric. Future studies will expand the dataset and include more comprehensive indicators (e.g., porosity, infiltration rate) to better validate the long-term soil compaction reduction potential of the subsoiling strip-tillage system.

4. Conclusions

  • A strip tillage composite machine operating in the “straw strip collecting–strip subsoiling” mode was developed. The process integrates stubble cut notch discs for pre-cutting stubble, rotary discs for dynamic straw cleaning, and winged subsoiling shovels for strip-wise compaction reduction. This enables efficient straw gathering and three-dimensional soil loosening.
  • Structural designs were completed for the profiling mechanism, SCDs, and strip subsoiling mechanism assembly. The mechanisms of the single-unit profiling principle, the straw-strip-collecting process, and the theory of soil failure and compaction reduction during subsoiling were analyzed. Through theoretical modeling, the spatial installation parameters of the SCDs were identified as critical to straw cleaning performance. Discrete element method simulations combined with second-order rotational orthogonal tests determined the optimal parameters as follows: deflection angle γ = 16.5°, inclination angle ξ = 25°, and installation spacing L = 100 mm, achieving a maximum straw cleaning rate of 95.34%.
  • Field test results showed that the OSRR, SDS, and SFR reached 84.82%, 91.85%, and 81.19%, respectively. Soil compaction in the 0–30 cm layer was significantly reduced. These outcomes confirm the machine’s effectiveness in cleaning the seed zone and mitigating compaction, meeting the requirements of strip tillage and validating the operational concept. The developed system offers a practical solution for blockage prevention and spatial compaction reduction in conservation strip tillage systems.
  • The implement demonstrates optimal operational efficacy under field conditions with straw coverage ≤ 70%, straw moisture content ≤ 15%, and soil moisture content ≤ 25%. Beyond this threshold, performance exhibits discernible reduction due to increased straw accumulation and elevated risks of tool blockage.

Author Contributions

Conceptualization, B.Q. and Q.Z.; methodology, B.Q. and H.Y.; software, L.T.; validation, B.Q., Q.Z. and H.Y.; formal analysis, B.Q.; investigation, B.Q. and H.Y.; resources, J.H.; data curation, B.Q.; writing—original draft preparation, B.Q., Q.Z. and L.T.; writing—review and editing, J.H., Q.W., H.L. (Hang Li) and X.W.; visualization, B.Q. and L.T.; supervision, H.Y. and H.L. (Han Lin); project administration, J.H.; funding acquisition, J.H. All authors have read and agreed to the published version of the manuscript.

Funding

This research was funded by the Strategic Priority Research Program of Chinese Academy of Sciences, grant number XDA28010402.

Institutional Review Board Statement

Not applicable.

Data Availability Statement

The data presented in this study are available within the article.

Conflicts of Interest

The authors declare no conflicts of interest.

Abbreviations

The following abbreviations are used in this manuscript:
MPSTMMonomer Profiling Strip Tillage Machine
SCDstubble clean disc
SRRstraw removal rate
WSCBwidth of the straw-cleaning band
OSRRoverall straw removal rate
SDsubsoiling depth
SDSsubsoiling depth stability
SFRsoil fragmentation rate

Appendix A

Table A1. Complete results of soil compaction reduction in May 2023 (Time Point I).
Measured Point NumberSoil Compaction/kPa
0~10 cm10~20 cm20~30 cm
11553.252062.501904.50
21158.251588.501781.50
31561.752545.002238.00
4649.001509.251509.50
5649.001325.001017.75
6315.75824.50798.25
7377.00868.25894.50
8543.751044.25956.25
9394.50912.50903.25
10701.75912.50842.00
Table A2. Complete results of soil compaction reduction in May 2024 (Time Point II).
Measured Point NumberSoil Compaction/kPa
0~10 cm10~20 cm20~30 cm
1535.00763.25894.75
21026.50851.00850.75
31017.50824.501035.50
41184.501096.501114.50
5956.50666.75824.50
61079.251026.50824.50
71061.501202.00947.50
81070.50965.25772.00
91130.501184.25829.75
10342.25719.251114.25
Table A3. Complete results of soil compaction reduction in April 2025 (Time Point III).
Measured Point NumberSoil Compaction/kPa
0~10 cm10~20 cm20~30 cm
1254.25851.00851.00
2227.75567.50833.50
3255.75684.00886.00
4254.25701.501114.25
5403.50807.00896.00
6728.25964.751026.50
7526.25947.751167.00
8561.25850.751089.25
9297.75780.751052.25
10438.50886.251131.75

References

  1. Zhang, Z.; Peng, X. Bio-tillage: A new perspective for sustainable agriculture. Soil Tillage Res. 2021, 206, 104844. [Google Scholar] [CrossRef]
  2. Wang, X.L. Study on the Evaluation of Soil Compaction by Agricultural Tire and Combination Shovel Loose Soil Technology. Ph.D. Thesis, China Agricultural University, Beijing, China, 2018. [Google Scholar]
  3. Hou, S.Y.; Chen, H.T.; Zou, Z.; Shi, N.Y. Design and Test of Side-direction Straw-cleaning Blade for Seedbed Treatment of Original Stubble Planter. Trans. Chin. Soc. Agric. Mach. 2019, 50, 41–51, 217. [Google Scholar] [CrossRef]
  4. Yao, W.Y.; Zhao, D.B.; Miao, H.Q.; Cui, P.D.; Wei, M.J.; Diao, P.S. Design and Experiment of Oblique Anti-blocking Device for No-tillage Planter with Shallow Plowing Stubble Clearing. Trans. Chin. Soc. Agric. Mach. 2022, 53, 42–52. [Google Scholar] [CrossRef]
  5. Wang, X.; Zhou, H.; Zhou, H.; Ji, J. Research progress and development in anti-blocking methods for no-till seeders in regenerative agriculture. Biosyst. Eng. 2025, 257, 104215. [Google Scholar] [CrossRef]
  6. Zhang, C.; Wang, X.; Zhao, D.; Gong, J.; Wang, Y.; Zhao, J. A driven-elastic straw clearing device for strip tillage based on DEM-MFBD coupling simulation significantly improves maize seedling emergence rate. Biosyst. Eng. 2025, 257, 104235. [Google Scholar] [CrossRef]
  7. Raoufat, M.H.; Matbooei, A. Row cleaners enhance reduced tillage planting of corn in Iran. Soil Tillage Res. 2007, 93, 152–161. [Google Scholar] [CrossRef]
  8. Fallahi, S.; Raoufat, M.H. Row-crop planter attachments in a conservation tillage system: A comparative study. Soil Tillage Res. 2008, 98, 27–34. [Google Scholar] [CrossRef]
  9. Wang, Q.; Wang, Z.; Zhang, Z.; Zhang, K.; Yao, S.; Zhou, W.; Sun, X.; Wang, J. Design and Test of Bionic Elastic Row Cleaner with Improved Straw Cleaning Performance. Agriculture 2024, 14, 186. [Google Scholar] [CrossRef]
  10. Fan, X.H.; Jia, H.L.; Zhang, W.H.; Yang, H.T.; Gu, Y.Q.; Li, H.G. Parametric Analysis of Finger-type Anti-blocking Residue-cleaner for No-till Planting. Trans. Chin. Soc. Agric. Mach. 2011, 42, 56–60. [Google Scholar]
  11. Vaitauskienė, K.; Šarauskis, E.; Romaneckas, K.; Jasinskas, A. Design, development and field evaluation of row-cleaners for strip tillage in conservation farming. Soil Tillage Res. 2017, 174, 139–146. [Google Scholar] [CrossRef]
  12. Yuan, P.P.; Li, H.W.; Jiang, G.J.; He, J.; Lu, C.Y.; Huang, S.H. Design and Experiment of Straw Cleaning Device for Wide-Narrow Maize No-tillage Sowing Strip in Drip Irrigation Area. Trans. Chin. Soc. Agric. Mach. 2021, 52, 43–52. [Google Scholar] [CrossRef]
  13. Kumar, M.; Kamendra; Pandey, H.S.; Singh, K.; Verma, C.; Singh, S.K.; Singh, D. Sustainable no–tillage practices with a disc type novel residue cleaning mechanism: Design, development and field evaluation. Soil Tillage Res. 2025, 251, 106560. [Google Scholar] [CrossRef]
  14. Lekavičienė, K.; Šarauskis, E.; Naujokienė, V.; Kriaučiūnienė, Z. Effect of Row Cleaner Operational Settings on Crop Residue Translocation in Strip-Tillage. Agronomy 2019, 9, 247. [Google Scholar] [CrossRef]
  15. Bauke, S.L.; Seidel, S.J.; Athmann, M.; Berns, A.E.; Braun, M.; Gocke, M.I.; Guigue, J.; Kautz, T.; Kögel-Knabner, I.; Ohan, J.; et al. Short-term effects of subsoil management by strip-wise loosening and incorporation of organic material. Soil Tillage Res. 2024, 236, 105936. [Google Scholar] [CrossRef]
  16. Qian, Y.; Zhang, Z.; Jiang, F.; Wang, J.; Dong, F.; Liu, J.; Peng, X. Impacts of tillage treatments on soil physical properties and maize growth at two sites under different climatic conditions in black soil region of Northeast China. Soil Tillage Res. 2025, 248, 106471. [Google Scholar] [CrossRef]
  17. Rehman, S.U.; Xin, X.; Ijaz, S.S.; Fatima, S.; Siddiqa, A.; Bin Khalid, H.; Haider, I.; Iqbal, R.; Mahmood, A.; Hussain, S.; et al. Simulation-based assessment of the impact of conservation tillage and strip intercropping on soil microbial biomass carbon. Catena 2025, 259, 109331. [Google Scholar] [CrossRef]
  18. Dou, S.; Wang, Z.; Tong, J.; Shang, Z.; Deng, A.; Song, Z.; Zhang, W. Strip tillage promotes crop yield in comparison with no tillage based on a meta-analysis. Soil Tillage Res. 2024, 240, 106085. [Google Scholar] [CrossRef]
  19. Pei, Y.; Bian, S.F.; He, Z.; Cao, Y.; Ma, X.; Yu, J.Q. Study on a New Tilling Method of Striped Deep Loosening of Wide-Narrow Row Alternate Planting and Its Attached Machines. Trans. Chin. Soc. Agric. Eng. 2000, 16, 67–70. [Google Scholar] [CrossRef]
  20. Chu, J.; Lu, H.D.; Xue, J.Q.; Zhao, M. Field experiment and effect of precise mechanical sowing of maize based on wide-narrow row deep rotation and no-tillage technology. Trans. Chin. Soc. Agric. Eng. 2014, 30, 34–41. [Google Scholar] [CrossRef]
  21. Wang, Q. Research on Key Technologies of Inter-Row Clean-Tillage and its Strip-Till Machine. Ph.D. Thesis, Jilin University, Jilin, China, 2019. [Google Scholar]
  22. Lou, S.Y. Research on Key Technology of Subsoiling Depth Monitoring and Control Under Straw Covering. Ph.D. Thesis, China Agricultural University, Beijing, China, 2022. [Google Scholar]
  23. Wei, S.; Zhang, C.H.; Zhan, Z.Y.; Nong, F.; Ding, Y.C. Simulation and Optimization Test of Imitation Furrowing Process of Cotton Direct Seeding Machine Based on DEM-MBD Coupling. Trans. Chin. Soc. Agric. Mach. 2025, 56, 275–289. [Google Scholar]
  24. Hou, S.Y.; Ji, Z.C.; Xue, D.H.; Wang, X.; Feng, B.J.; Chen, H.T. Improves Design and Test of Straw Cleaning Device Suitable for No-tillage Seeding Unit. Trans. Chin. Soc. Agric. Mach. 2023, 54, 111–122. [Google Scholar]
  25. Cao, X.P.; Wang, Q.J.; Li, H.W.; He, J.; Lu, C.Y. Combined Row Cleaners Research with Side Cutter and Stubble Clean Disk of Corn No-till Seeder. Trans. Chin. Soc. Agric. Mach. 2021, 52, 36–44. [Google Scholar] [CrossRef]
  26. Godwin, R.J. A review of the effect of implement geometry on soil failure and implement forces. Soil Tillage Res. 2007, 97, 331–340. [Google Scholar] [CrossRef]
  27. Cao, Y.Y.; Su, X.M.; Zhou, Z.C.; Liu, J.; Chen, M.; Wang, N.; Zhu, B.; Wang, P.; Liu, F. Effects of root traits on shear performance of root-soil complex and soil reinforcement in the Loess Plateau. Soil Tillage Res. 2025, 252, 106625. [Google Scholar] [CrossRef]
  28. Fouladidorhani, M.; Lamandé, M.; Moitzi, G.; Nawaz, M.M.; Arthur, E. Detection of negative consequences of traffic on subsoil properties depends on measurement type and scale: The case of a Calcaric Chernozem. Soil Tillage Res. 2025, 252, 106615. [Google Scholar] [CrossRef]
  29. Jiang, X.H. Design and Research of a Reduced Resistance Deep Loose Shovel and Depth Detection Device Based on Soil Dynamics. Ph.D. Thesis, Jilin University, Jilin, China, 2021. [Google Scholar]
  30. GB/T 24675.2-2024; Conservation Tillage Equipment—Part 2:Subsoiler. Shandong Yuanquan Machinery Company Limited, Jining Zhongkun Agricultural Machinery Technology Company Limited, Chinese Academy of Agricultural Mechanization Sciences Group Company Limited, Yancheng Tigstools Machinery Manufacturing Company Limited, Shandong Tiansheng Machinery Technology Stock Company Limited, Liaocheng University, Qihe County Bureau of Agriculture and Rural Affairs, Shandong Wuzheng Group Company Limited, Liaoning Academy of Agricultural Mechanization, Hebei Shenghe Agricultural Machinery Company Limited, Hunan Yongsheng Hydraulic Technology Company Limited, Liaoning Agricultural Development Service Center, Yongkang Weili Technology Stock Company Limited, Taishan Institute of Intelligent Manufacturing Industry, Guanxian Taixin Machinery Manufacturing Company Limited, Liaocheng Inspection and Testing Center and Shandong Henglüe Standardization Service Company Limited: Beijing, China, 2024.
  31. Qiao, Y.; Huang, S.; Yang, C.; Liu, S.; Wang, K.; Lu, Y.; Wang, J. Calibration and Testing of Discrete Element Simulation Parameters for Ultrasonic Vibration-Cutter-Soil Interaction Model. Agriculture 2025, 15, 20. [Google Scholar] [CrossRef]
  32. Ding, H.; Wang, M.; Wang, Q.; Lin, H.; Zhang, C.; Jin, X. Parameter Calibration and Experimental Study of a Discrete Element Simulation Model for Yellow Cinnamon Soil in Henan, China. Agriculture 2025, 15, 1365. [Google Scholar] [CrossRef]
  33. Wu, Y.; Yang, S. Experimental basis for determining contact angle in the ideal model of unsaturated soils. Soil Tillage Res. 2023, 227, 105602. [Google Scholar] [CrossRef]
  34. Li, X.; Zhang, Y.; He, H.; Wang, B.; Zhou, H.; Geng, D.; Zhang, Y. Design and Experiment of Row Cleaner with Staggered Disc Teeth for No-Till Planter. Agriculture 2023, 13, 1373. [Google Scholar] [CrossRef]
  35. Jia, H.L.; Liu, X.; Yu, H.B.; Lu, Y.; Guo, C.J.; Qi, J.T. Simulation and Experiment on Stubble Clearance Mechanism with Concave Claw-type for No-tillage Planter. Trans. Chin. Soc. Agric. Mach. 2018, 49, 68–77. [Google Scholar] [CrossRef]
  36. Xia, X.; Li, H.; Liu, S.; Ran, R.; Cong, Y.; Jin, Y.; Huang, D. Design and experiment of high-speed straw cleaning unit with double air springs. Int. J. Agric. Biol. Eng. 2024, 17, 89–97. [Google Scholar] [CrossRef]
  37. JB/T 9788-2020; Subsoiler and Share Shaft. Chinese Academy of Agricultural Mechanization Sciences, Nanjing Institute of Agricultural Mechanization, Ministry of Agriculture, Anhui Huaifeng Modern Agricultural Equipment Company Limited, Modern Agricultural Equipment Technology Company Limited, National Quality Supervision and Inspection Center for Agricultural Machinery: Beijing, China, 2020.
  38. DB22/T 3605-2023; Specification for Operational Quality Strip Tillage and Land Preparation Machine. Jilin Provincial Agricultural Mechanization Management Center: Jilin, China, 2023.
  39. Gao, Z.; Lu, C.Y.; Wei, X.Y.; Li, H.W.; He, J.; Wang, Q.J. Design and Experiment of Co-stirring Combined Corn Strip Straw Cleaning Device. Trans. Chin. Soc. Agric. Mach. 2023, 54, 68–79. [Google Scholar] [CrossRef]
Figure 1. Structure schematics of overall structure of Monomer Profiling Strip Tillage Machine (MPSTM) with straw-strip-collecting and subsoiling functions. 1. Frame. 2. Three-point suspension mechanism. 3. Monomer profiling mechanism. 4. Pressing knobs. 5. Mainboards. 6. Soil-cutting knife profiling mechanism. 7. Compacting devices. 8. Soil-cutting knives. 9. Subsoiler shovels. 10. stubble clean discs (SCDs). 11. Depth-limiting wheels. 12. Stubble cut notch discs.
Agriculture 15 01771 g001
Figure 2. Schematic of machine working principle. 1. Stubble cut notch disc. 2. SCD. 3. Subsoiler shovel. 4. Soil-cutting knife profiling mechanism. 5. Compacting device.
Agriculture 15 01771 g002
Figure 3. Monomer profiling principle. (a) Lateral profiling; (b) longitudinal profiling.
Agriculture 15 01771 g003
Figure 4. Mechanism schematic diagram of monomer and effective profiling conditions.
Agriculture 15 01771 g004
Figure 5. Structure of SCD. (a) Side view. (b) Top view.
Agriculture 15 01771 g005
Figure 6. Space installation parameters of the SCD. The red dotted lines represents the connecting lines from each vertex of triangle ABC to the center of the SCD circle.
Agriculture 15 01771 g006
Figure 7. Schematics of static cleaning width of SCD. (a) Three-dimensional schematic diagram. (b) Two-dimensional schematic diagram. The red dotted lines represents the center of the SCD, and the line connecting points D, E, and F on the ground.
Agriculture 15 01771 g007
Figure 8. Schematics of pressing straws into soil. (a) Front view. (b) Side view. The blue arrow indicates the direction of the force exerted by SCD on the straw, and the yellow circle represents the straw.
Agriculture 15 01771 g008
Figure 9. Schematics of leaving and throwing straws. The blue and red straight arrows represent the speed and its various components, the red curved arrow shows the movement trajectory of the straw, and the blue dotted line indicates the orientation of the straw after its movement relative to the initial point.
Agriculture 15 01771 g009
Figure 10. Strip subsoiling mechanism. (a) Operating results. (b) Soil stress.
Agriculture 15 01771 g010
Figure 11. Model of the soil bin.
Agriculture 15 01771 g011
Figure 12. Test area diagram of straw removal rate (SRR). The red box is the designated frame area.
Agriculture 15 01771 g012
Figure 13. Field test condition.
Agriculture 15 01771 g013
Figure 14. Measurement of the width of the straw-cleaning band (WSCB). The strip is limited by the red lines.
Agriculture 15 01771 g014
Figure 15. Measurement of the soil fragmentation rate (SFR). The area highlighted with the red box is the sampling area.
Agriculture 15 01771 g015
Figure 16. Contour plots of influence of factors on the simulated SRR.
Agriculture 15 01771 g016
Figure 17. Effect of operation. (a) No operation. (b) Operated, and the straw-cleaned strips have been highlighted with the red boxes.
Agriculture 15 01771 g017
Figure 18. Results of soil compaction reduction over the years. Letters like a, b, or ab indicate significant differences: groups sharing the same letter are not significantly different, while those with no common letters are significantly different.
Agriculture 15 01771 g018
Table 1. Main technical parameters.
Technical ParametersValue
Boundary dimension/(mm × mm × mm)1980 × 2960 × 1200
Supporting power/kW160
Operating speed/(m/s)1~2 m/s
Number of operating strips5
Strip width/mm200
Straw-strip-collecting formCutting and distribution
Subsoiling depth/mm300
Table 2. Types and characteristics of straw.
Type of StrawSize (Diameter × Length)/mm × mmQuality/gDistribution Location
Finely chopped straw5 × 403290Surface layer of soil bin
Whole straw15 × 180390Side zones of soil bin
Chopped straw15 × 90100Central zone of soil bin
Table 3. Simulation test materials contact parameters.
MaterialsRecovery CoefficientStatic Friction FactorDynamic Friction Factor
Straw-Q2350.6030.3240.108
Straw-Soil0.50.30.05
Straw-Straw0.4850.650.098
Soil-Q2350.280.50.040
Soil-Soil0.60.60.4
Table 4. Test factors and level coding.
Level of FactorγξL/mm
+1.6822530200
+121.123.9169.6
015.515125
−19.96.180.4
−1.6826050
Table 5. Field test plot characteristic parameters.
ParametersAverage Value
0~300 mm soil layer0~100 mm soil compaction/kPa394.75
100~200 mm soil compaction/kPa804.13
200~300 mm soil compaction/kPa1004.75
Soil moisture content/%21.90
Soil bulk density/(g/cm3)1.40
Surface strawTotal mulch density of straw/(kg/m2)2.70
Mulch density of finely chopped straw/(kg/m2)2.35
Mulch density of whole straw/(kg/m2)0.35
Average length of straw/mm180
Table 6. Results of the simulation test.
Test NumberTest FactorsIndicator
γξL/mmSRR/%
1−1−1−149.79
2+1−1−167.84
3−1+1−192.13
4+1+1−198.09
5−1−1+115.43
6+1−1+129.38
7−1+1+160.69
8+1+1+172.65
9−1.6820051.93
10+1.6820083.97
110−1.682014.26
120+1.682091.63
1300−1.68296.47
1400+1.68240.36
1500069.60
1600055.75
1700065.74
1800069.20
1900065.68
2000059.59
2100070.19
2200067.38
2300062.10
Table 7. Variance analysis of the simulated SRR.
Source of VariationQuadratic SumDegree of FreedomMean SquareFp
Model11,155.2691239.47161.98<0.0001
γ789.011789.01103.11<0.0001
ξ6210.8716210.87811.68<0.0001
L3676.2013676.20480.43<0.0001
γξ24.75124.753.240.3095
γL0.4510.450.060.8887
ξL31.76131.764.150.2526
γ25.1715.170.060.6372
ξ2356.231356.2354.810.0015
L28.7518.750.230.5447
Residual288.031322.16
Lack of fit92.39518.480.760.6053
Error195.65824.46
Total11,392.3622
Table 8. Results of field test.
IndicatorsStandard ValueAverage Measurement Value
WSCB/mm150~300193.70 ± 10.51
OSRR/%≥7084.82 ± 1.48
SD/mm≥250271.70 ± 1.82
SDS/%≥85%91.85 ± 2.99
SFR/%≥35%81.19 ± 1.69
Disclaimer/Publisher’s Note: The statements, opinions and data contained in all publications are solely those of the individual author(s) and contributor(s) and not of MDPI and/or the editor(s). MDPI and/or the editor(s) disclaim responsibility for any injury to people or property resulting from any ideas, methods, instructions or products referred to in the content.