Article

Dynamic Object Detection and Non-Contact Localization in Lightweight Cattle Farms Based on Binocular Vision and Improved YOLOv8s

1
College of Computer and Information Engineering, Xinjiang Agricultural University, Urumqi 830052, China
2
Agricultural Information Institute of CAAS, Beijing 100081, China
3
Ministry of Education Engineering Research Center for Intelligent Agriculture, Urumqi 830052, China
4
Xinjiang Agricultural Informatization Engineering Technology Research Center, Urumqi 830052, China
5
Institute of Agricultural Economics and Development of CAAS, Beijing 100081, China
*
Authors to whom correspondence should be addressed.
Agriculture 2025, 15(16), 1766; https://doi.org/10.3390/agriculture15161766
Submission received: 16 May 2025 / Revised: 14 August 2025 / Accepted: 15 August 2025 / Published: 18 August 2025

Abstract

The real-time detection and localization of dynamic targets in cattle farms are crucial for the effective operation of intelligent equipment. To overcome the limitations of wearable devices, including high costs and operational stress, this paper proposes a lightweight, non-contact solution. The goal is to improve the accuracy and efficiency of target localization while reducing the complexity of the system. A novel approach is introduced based on YOLOv8s, incorporating a C2f_DW_StarBlock module. The system fuses binocular images from a ZED2i camera with GPS and IMU data to form a multimodal ranging and localization module. Experimental results demonstrate a 36.03% reduction in model parameters, a 33.45% decrease in computational complexity, and a 38.67% reduction in model size. The maximum ranging error is 4.41%, with localization standard deviations of 1.02 m (longitude) and 1.10 m (latitude). The model is successfully integrated into an ROS system, achieving stable real-time performance. This solution offers the advantages of being lightweight, non-contact, and low-maintenance, providing strong support for intelligent farm management and multi-target monitoring.

1. Introduction

In the modernization process of global animal husbandry, the widespread application of information technology and intelligent equipment is profoundly transforming traditional production methods. Developed countries such as the United States, the Netherlands, and New Zealand have achieved remarkable progress in the construction of smart farms, animal health monitoring, intelligent feeding systems, and related technologies to promote the livestock industry toward high efficiency, sustainability, and precision [1]. With the continued advancement of technologies such as the Internet of Things, artificial intelligence, and big data, the global animal husbandry sector is gradually entering the era of “smart farming”, not only improving production efficiency but also significantly enhancing animal welfare and food safety assurance [2]. As a major animal husbandry country, China is actively exploring this transformation and is committed to promoting informatization and intelligentization in livestock farming. However, challenges remain, including disparities in infrastructure, difficulty in technology adoption, and regional development imbalances [3]. The deep integration of intelligent equipment and pastoralism has become a crucial path toward realizing smart animal husbandry [4], covering key aspects such as the optimal allocation of pasture resources [5], precision feeding [6], and early disease warning and control [7], with broad application prospects and practical significance.
The real-time detection and localization of individual cattle form the foundation of intelligent cattle farm management [8]. Such capabilities not only provide critical information on cattle activity trajectories, locations, and health status for breeders but also offer effective decision-making support for managers. By monitoring cattle in real time, breeders can detect abnormal behaviors or health problems in individual animals and take appropriate measures at the earliest possible time. In large-scale cattle farms, real-time activity monitoring is particularly essential, especially in scenarios such as estrus detection, sudden illness, transhumance, or cattle escape. In these cases, intelligent systems can respond rapidly and implement countermeasures effectively.
As the primary subjects of monitoring, cattle activities, locations, and health conditions need to be continuously tracked using high-precision sensors [9]. Current localization and detection methods, both domestically and internationally, primarily rely on collars [10], RFID (Radio Frequency Identification) technology [11], and LiDAR [12]. While collar-based systems can offer accurate positioning, they involve high hardware and software costs, are inconvenient to wear and replace, and may cause stress responses in animals [13]. RFID technology is relatively cost-effective and suitable for large-scale deployment; however, signal transmission can be affected by terrain and environmental conditions, leading to inaccurate data when cattle move across wide areas [14]. Furthermore, both collar and RFID systems are typically limited to monitoring a single individual at a time, making them costly and difficult to manage in large-scale breeding facilities. LiDAR-based vision systems can detect multiple dynamic targets non-invasively using a single setup and provide high-precision ranging information. However, these systems consume significant power, and the computational load required to process point cloud data is substantial, which shortens battery life in intelligent devices such as inspection robots, precision feeders, and automatic manure removal equipment. This makes large-scale deployment particularly challenging in open field ranches [15]. Binocular vision technology presents notable advantages in cattle ranch environments by capturing high-resolution image data for the real-time monitoring of cattle and individual targets [16]. It also enables accurate depth estimation through the disparity between left and right images, facilitating cattle distance measurement and localization [17]. Therefore, a dynamic object detection and localization approach based on binocular stereo vision offers the benefits of lower cost, non-contact operation, and continuous multi-target tracking. It is also highly adaptable to complex ranch conditions, making it an ideal solution for intelligent herd management and automated grazing scenarios [18]. This paper focuses on the key challenges of dynamic multi-object detection and localization in smart ranching, proposing an innovative approach to address the following issues:
First, a lightweight, non-contact dynamic object detection and localization method based on the improved YOLOv8s model is introduced. Compared to traditional methods, it effectively reduces model parameters and computational complexity while maintaining detection accuracy, thereby improving deployment and operational efficiency on resource-constrained devices.
Second, a precise and reliable 3D localization model is built by integrating data from the ZED2i binocular camera, GPS, and IMU. This multimodal fusion significantly enhances spatial awareness and overcomes the limitations of traditional GPS or vision-based systems.
Finally, the improved detection and localization model is successfully deployed onto the ROS platform, and its real-time performance and stability are validated through field tests in complex real cattle farm environments, providing reliable technical support for intelligent farm management.

2. Related Work

In recent years, there has been a growing interest in the integration of binocular stereo vision with object detection, particularly in agricultural applications. Stereo vision systems are widely used for 3D localization and target tracking due to their ability to provide accurate depth information. Meanwhile, the YOLO framework has become a prominent tool for real-time object detection, with various improvements aimed at enhancing speed and efficiency. Luo et al. replaced the original YOLOv8 backbone with GhostNet to simplify the architecture and speed up detection. It also integrates a FasterNet Block with an efficient multi-scale attention mechanism into the C2f module for better feature fusion, and uses a lightweight multi-path detection head (ELMD) to reduce computational complexity through parallel structures and shared convolutional parameters [19]. Ze et al. adopted an improved YOLOv8 model to recognize calf behavior. By extracting video frames, they selected a calf daily behavior dataset containing 2918 images as the test benchmark. They introduced the P2 small object detection layer to improve the resolution of the input scene, significantly enhancing the model’s recognition accuracy, and used the Lamp pruning method to reduce the model’s computational complexity and storage requirements [20]. Zheng et al. improved cow behavior detection by replacing the CIoU loss function with the NWD loss function to reduce positional bias. They introduced a Context Information Augmentation Module (CIAM) to enhance contextual information using cow mounting behavior and added a Triple Attention Module (TAM) in the Backbone network to improve the focus on individual estrous cows through cross-dimensional interactions [21]. Ni et al. proposed an improved YOLOv8s model, which enhances small object detection accuracy in UAV images by introducing a multi-scale feature extraction module, a scale compensation feature pyramid network, and an ultra-small-object detection layer [22]. Ni et al. proposed an improved indoor object detection method, based on an enhanced ResNet50 network and a multi-scale contextual information extraction module, which improves feature extraction and information transmission capabilities. At the same time, an improved dual-threshold non-maximum suppression algorithm is employed to address the occlusion problem [23].
Despite recent advances in livestock monitoring, existing dynamic object detection and localization technologies still face numerous challenges, especially in their application in complex agricultural environments. Most traditional methods rely on expensive and high-energy-consuming equipment, which is unsuitable for large-scale farm deployment. Therefore, lightweight and non-contact detection and localization technologies are crucial.
To address these issues, this paper proposes a lightweight dynamic object detection and non-contact localization method based on the improved YOLOv8s, aimed at providing an efficient solution suitable for resource-constrained environments. The main contributions of this paper are as follows:
  • A multi-modal data fusion scheme based on the ZED2i stereo camera is proposed, which combines GPS and IMU data for high-precision target localization, significantly improving the model’s applicability in complex farm environments.
  • The C2f_DW_StarBlock module is designed and optimized to replace the original module in YOLOv8s, achieving a 36.03% reduction in parameters, a 33.45% decrease in computational complexity, and a 38.67% reduction in model size while maintaining high detection accuracy.
  • An efficient target localization module is proposed, which combines binocular vision depth estimation and sensor data fusion to effectively solve the high-precision localization of dynamic targets.
  • The method has been successfully deployed on the NVIDIA Jetson Orin NX platform, and its real-time application feasibility in resource-constrained environments has been verified through field testing, demonstrating its potential for smart farming applications.

3. Materials and Methods

3.1. Overall Framework of the Study

This study addresses the key challenges faced in dynamic object detection and localization in cattle farms. These challenges include the reliance on large and complex models for high detection accuracy, the high cost and maintenance complexity of contact-based localization devices, and the lack of lightweight, non-contact solutions. To address these issues, a novel approach is proposed, which utilizes a binocular stereo vision system with a ZED2i camera. The YOLOv8s [24] model is selected as the base, and is optimized by integrating the specially designed C2f_DW_StarBlock module, thereby improving detection performance and computational efficiency. A key component of this framework is the construction of a target localization model, which combines multimodal data from GPS (UM621A, Beidou Navigation Satellite System Co., Ltd., Haidian, Beijing, China), IMU (Inertial Measurement Unit, IM948, Chenying Electronic Technology Co., Ltd., Huangshan, Anhui, China), and visual images, forming a comprehensive ranging and localization system. This allows for real-time, accurate tracking and the localization of dynamic targets. Ultimately, the system is a lightweight and non-contact detection and localization model, specifically designed for cattle farms. It leverages binocular vision and the improved YOLOv8s algorithm to ensure efficient and accurate target detection and localization. The model is integrated into an inspection robot, which operates on a cross-platform ROS (Robot Operating System) system, as shown in Figure 1.

3.2. Data Acquisition

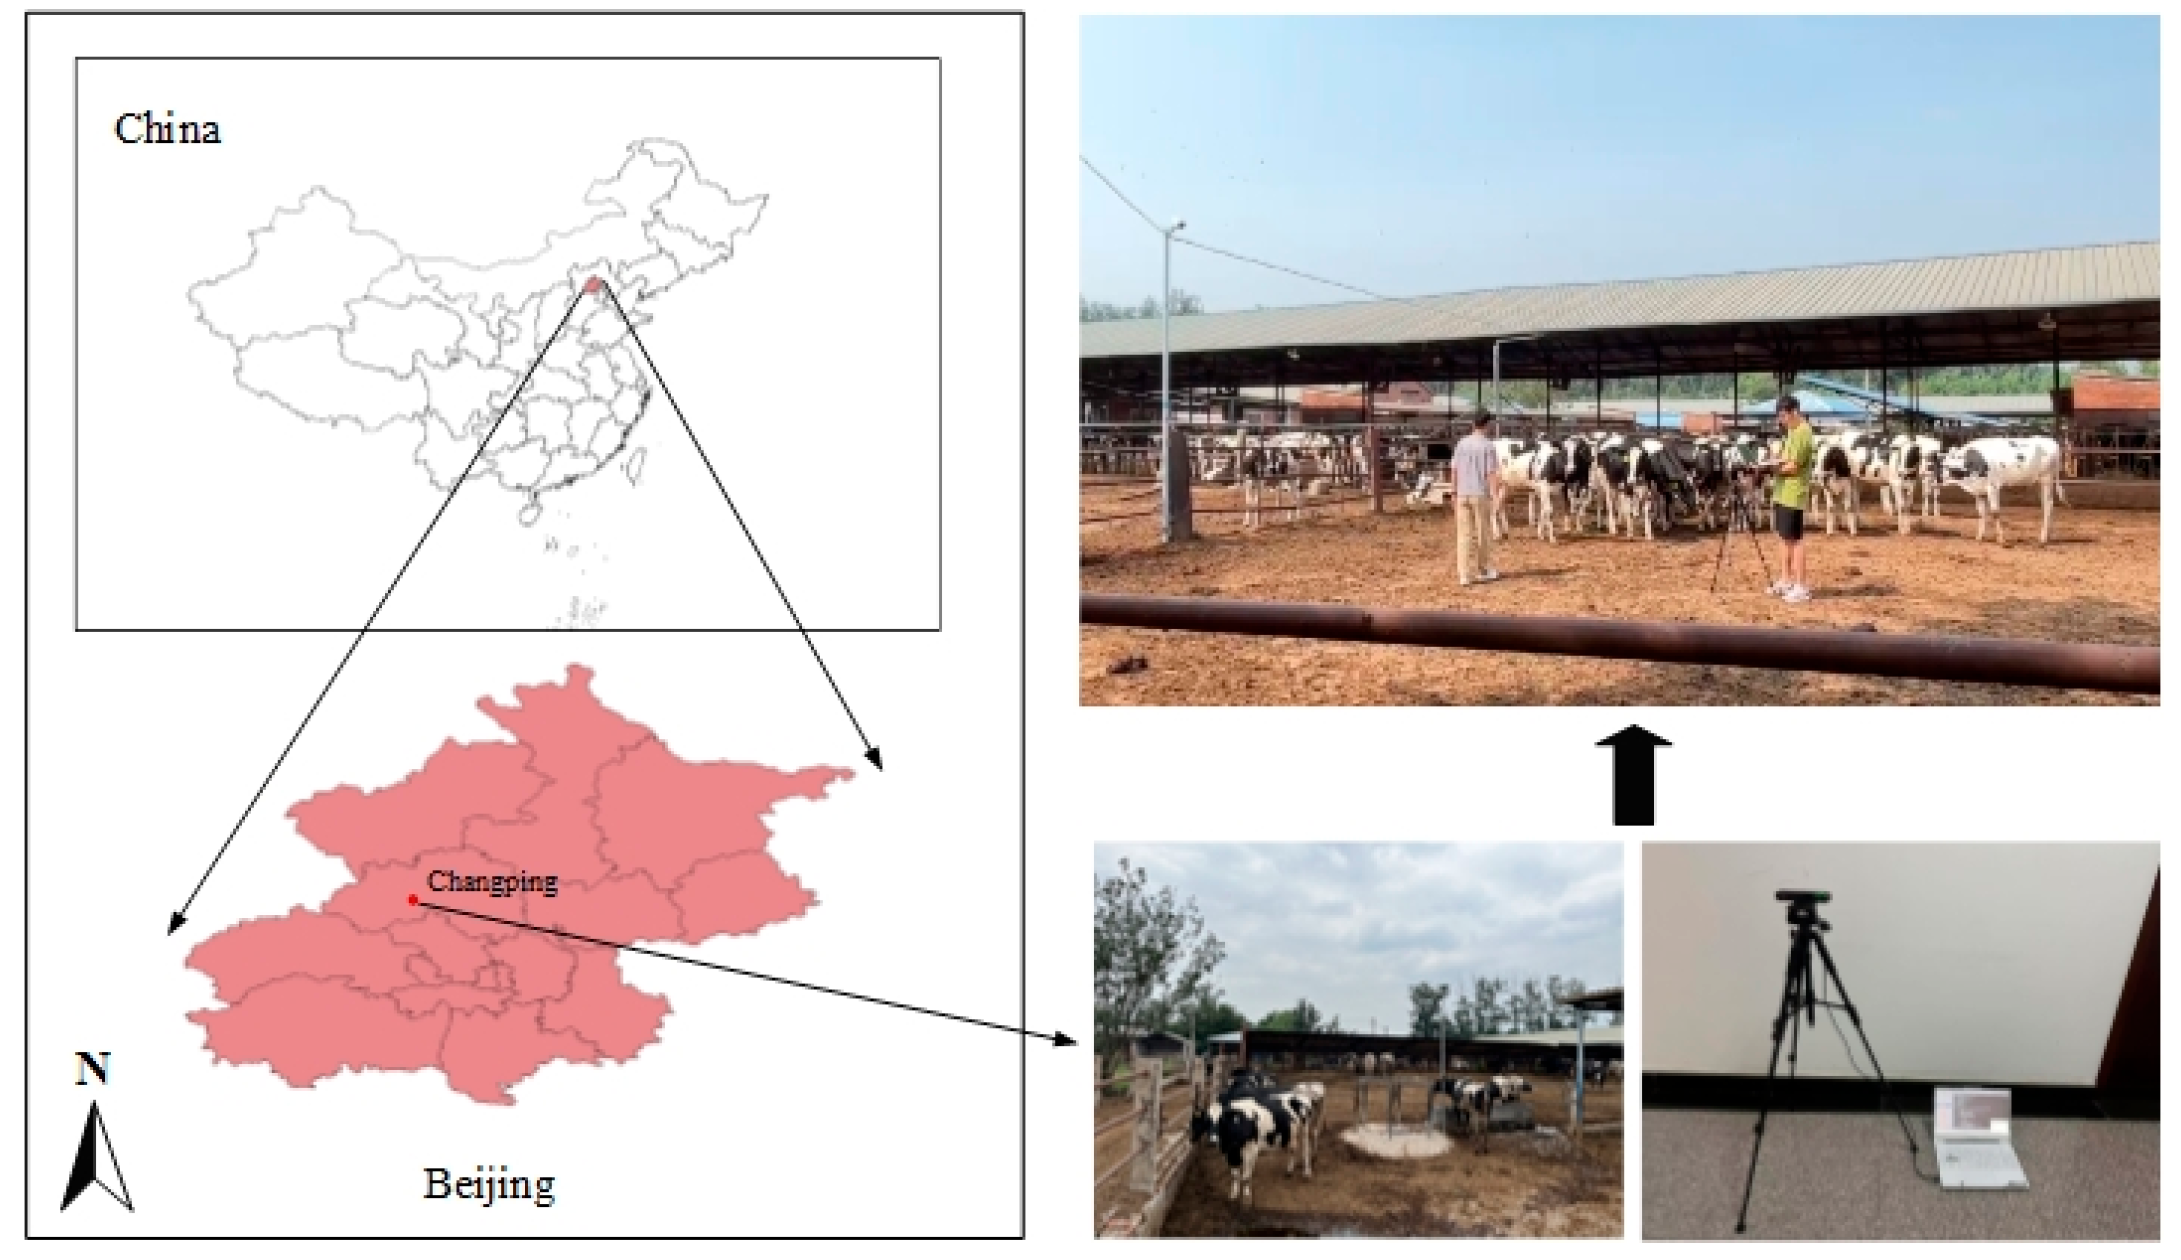
The experimental area for this study was the dairy farm at the Beijing Agricultural Machinery Experiment Station, located in the National Breeding Base of Dairy Cattle, Changping District, Beijing, China. All participating cows were Holstein, totaling 450, including 75 calves, 83 cows aged 3–6 months, 69 cows aged 6–12 months, and 223 adult lactating cows. Data collection was conducted at the Beijing Agricultural Machinery Experiment Station from 10 July to 17 July 2024. The acquisition device used was a ZED2i camera from Stereolabs (Mountain View, CA, USA); the Stereolabs ZED2i stereo camera was used for dynamic object detection and localization. The camera features a resolution of 1080p and a frame rate of 30fps, with a horizontal field of view of 110° and a vertical field of view of 75°. The baseline between the left and right cameras is 120 mm, with a depth measurement accuracy of ±5 cm, and a measurement range from 0.5 m to 20 m. The camera’s exposure and gain are automatically adjusted according to the lighting conditions to ensure stability under varying light environments. During data collection, a person walked freely through various areas of the cattle farm to drive the cows, while both the person’s trajectory and the cows’ locations were recorded through video tracking. To simulate the perspective of an inspection robot or other intelligent equipment, the camera was positioned at a height of 0.8 to 1 m throughout the acquisition period. Different shooting angles and scene variations were achieved by adjusting the distance between the camera and the target objects, without changing the camera height. The data acquisition process is illustrated in Figure 2.
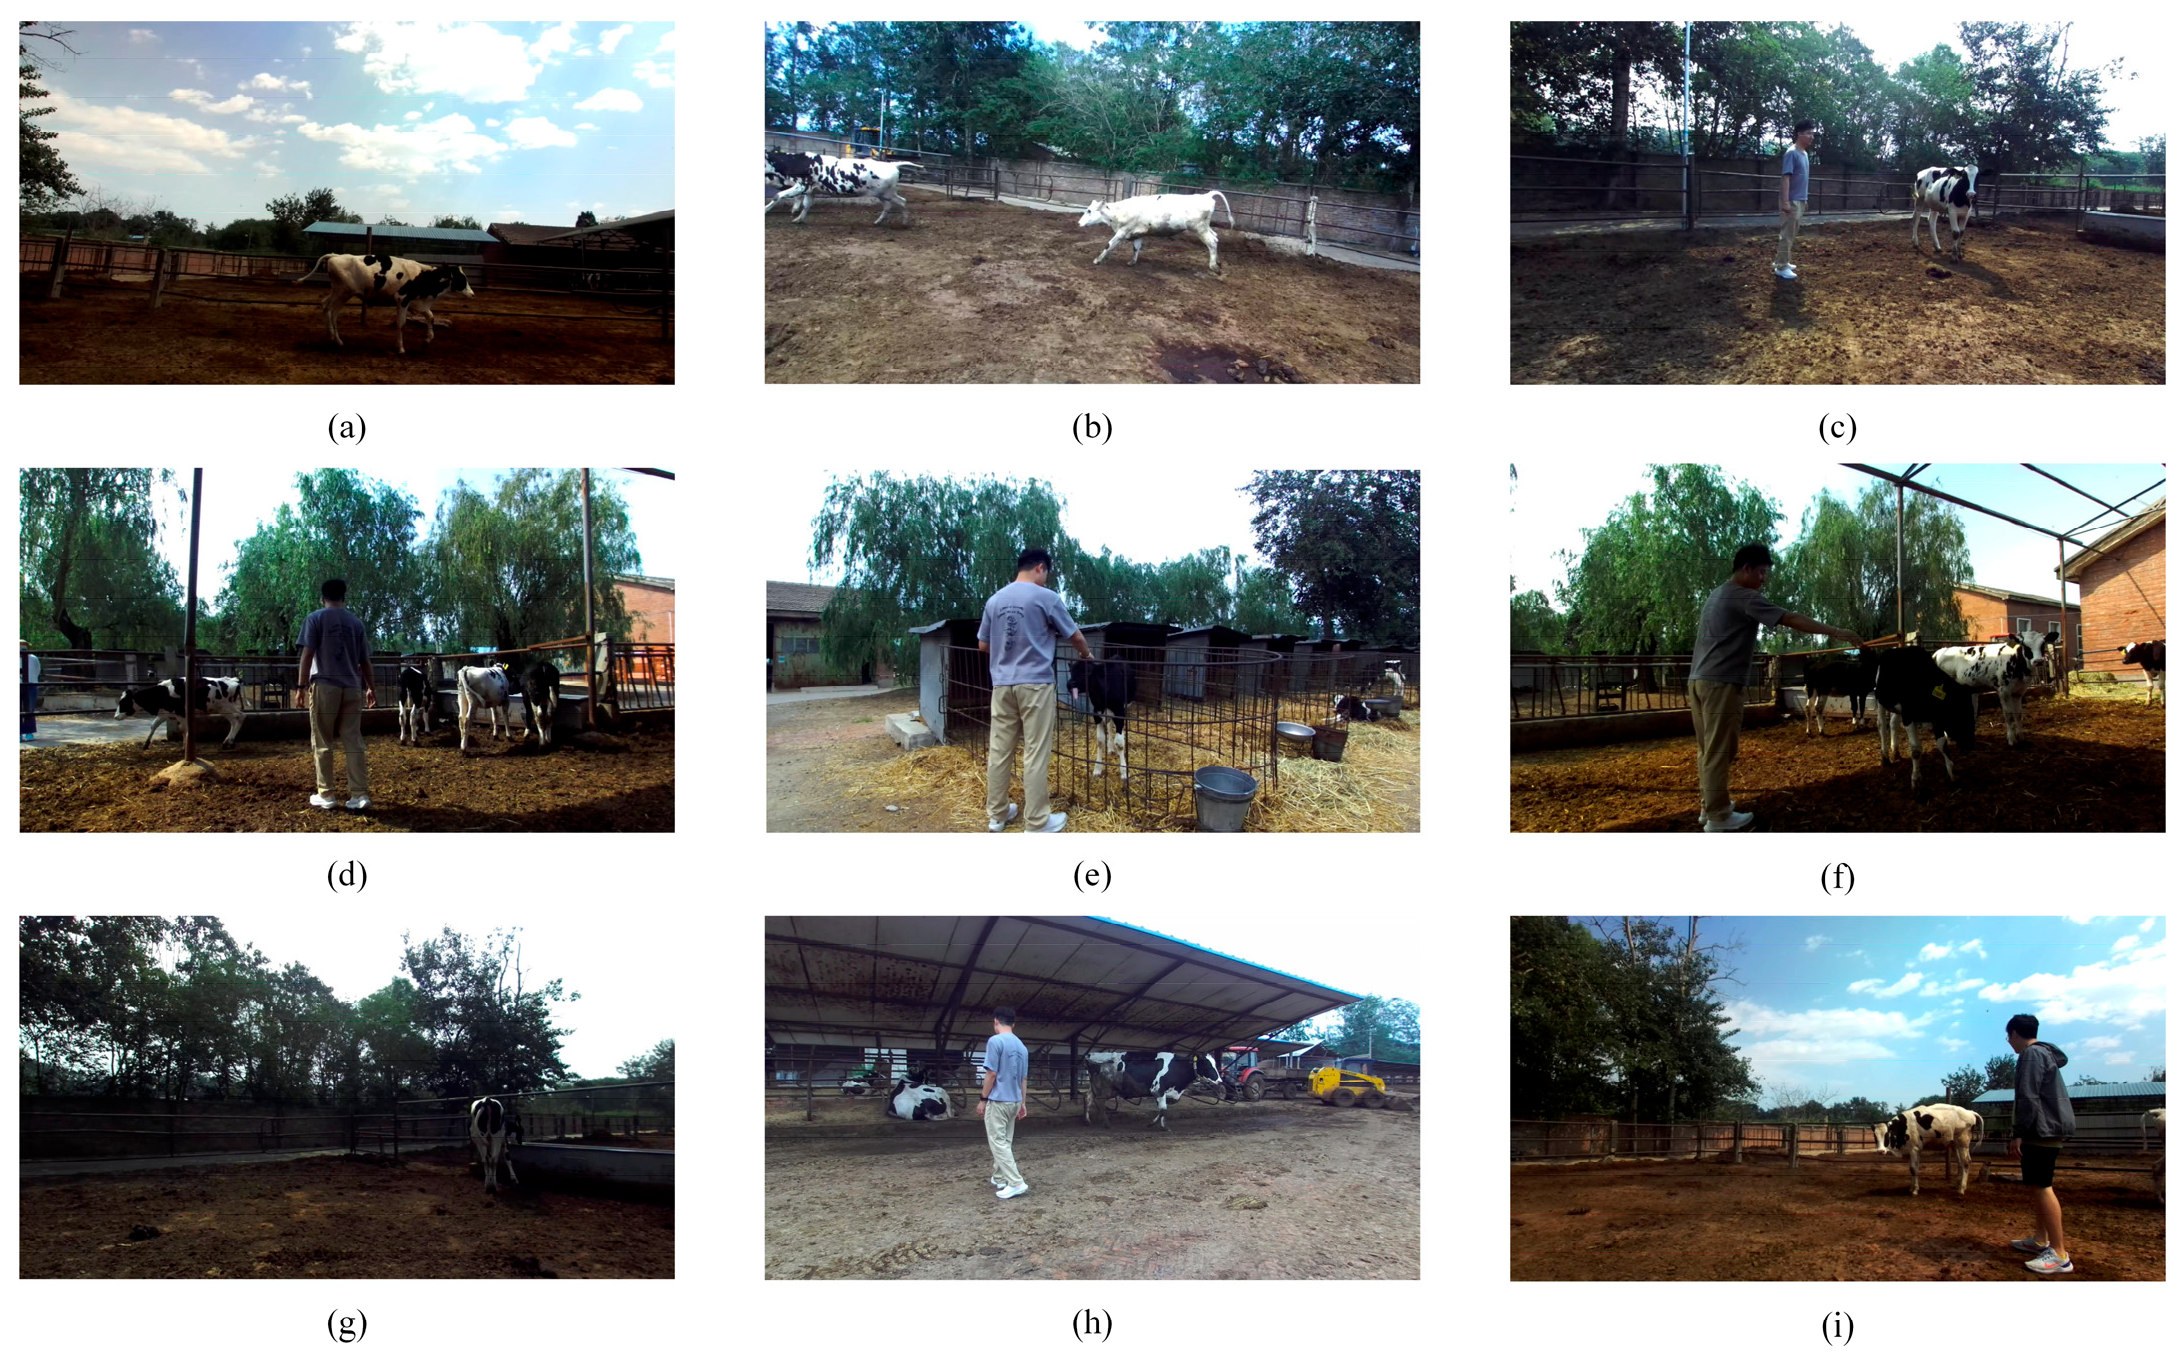
In order to enhance the robustness of the model in the complex environment of the farm, the effects of various factors such as lighting, meteorology, growth stages of the cattle, and the number of individual cattle were considered when constructing the research dataset. When collecting data, different time periods such as morning, noon, and evening, different weather conditions such as sunny and cloudy days, different feeding stages of cattle (calves, 3–6 months old, 6–12 months old, adult dairy cows, dry cows, etc.), differences in the number of individuals in the herd (single target for a single class, single target for a single class, multiple targets for multiple classes, etc.), as well as lighting conditions such as smooth light and backlight were selected for the continuous shooting of the video data; part of the data set is shown in Figure 3. It helps to improve the adaptability and accuracy of the image processing algorithm in the complex environment of farming. After the data acquisition was completed, 1623 image samples containing cattle and pedestrians were obtained by the frame extraction and image segmentation processing of the video data and saved in .jpg format. After manual screening, images that were blurred or did not contain the target object were eliminated, and 1580 valid images were retained, including 79 images containing only cattle, 4 images containing only pedestrians, and 1497 images containing both cattle and pedestrians.
All images were manually labeled using LabelImg (version 1.8.6) [25], resulting in 1685 pedestrian detection frames and 4793 cattle detection frames. For the 1580 labeled images, the dataset was randomly divided according to a preset ratio: 90% of the images were used for training and 10% for testing.

3.3. Object Detection Model Construction Based on YOLOv8

3.3.1. YOLOv8 Series Model Preferred

Object detection is a computer vision task aimed at identifying target objects within images or videos and annotating their bounding boxes and categories [26]. With the advancement of deep learning, algorithms such as R-CNN [27], YOLO [28], and SSD [29] have continuously driven progress in object detection. By integrating feature extraction, classification, and regression into a unified framework, these algorithms enable end-to-end training and prediction, significantly improving real-time performance [30]. Among them, the YOLO series reformulates object detection as a regression problem, offering a favorable balance between accuracy and processing speed [31]. In cattle farm environments—characterized by a large number of animals and frequent movements—detection systems require strong real-time capabilities and multi-object perception, making the YOLO algorithm particularly promising for such scenarios [32].
To achieve efficiency, stability, and resource-friendliness in object detection tasks, this study conducts a comparative analysis of five YOLOv8 models during the validation phase. Under the premise of ensuring real-time multi-object detection accuracy, the optimal model should feature a lower parameter count, smaller model size, and strong adaptability for edge deployment, in order to meet the resource-constrained conditions commonly found in cattle farms. Therefore, YOLOv8s is selected as the base model for subsequent optimization, providing a rational foundation for structural enhancement.
As shown in Table 1, YOLOv8s demonstrates notable improvements in precision and recall compared to YOLOv8n, and maintains stable performance across key metrics such as mAP@0.5 and mAP@0.5:0.95. Although it slightly lags behind YOLOv8m and YOLOv8l in terms of precision, it consumes fewer resources and offers better adaptability, making it especially suitable for edge computing and other deployment-constrained scenarios.

3.3.2. YOLOv8s Model Lightweight Improvements

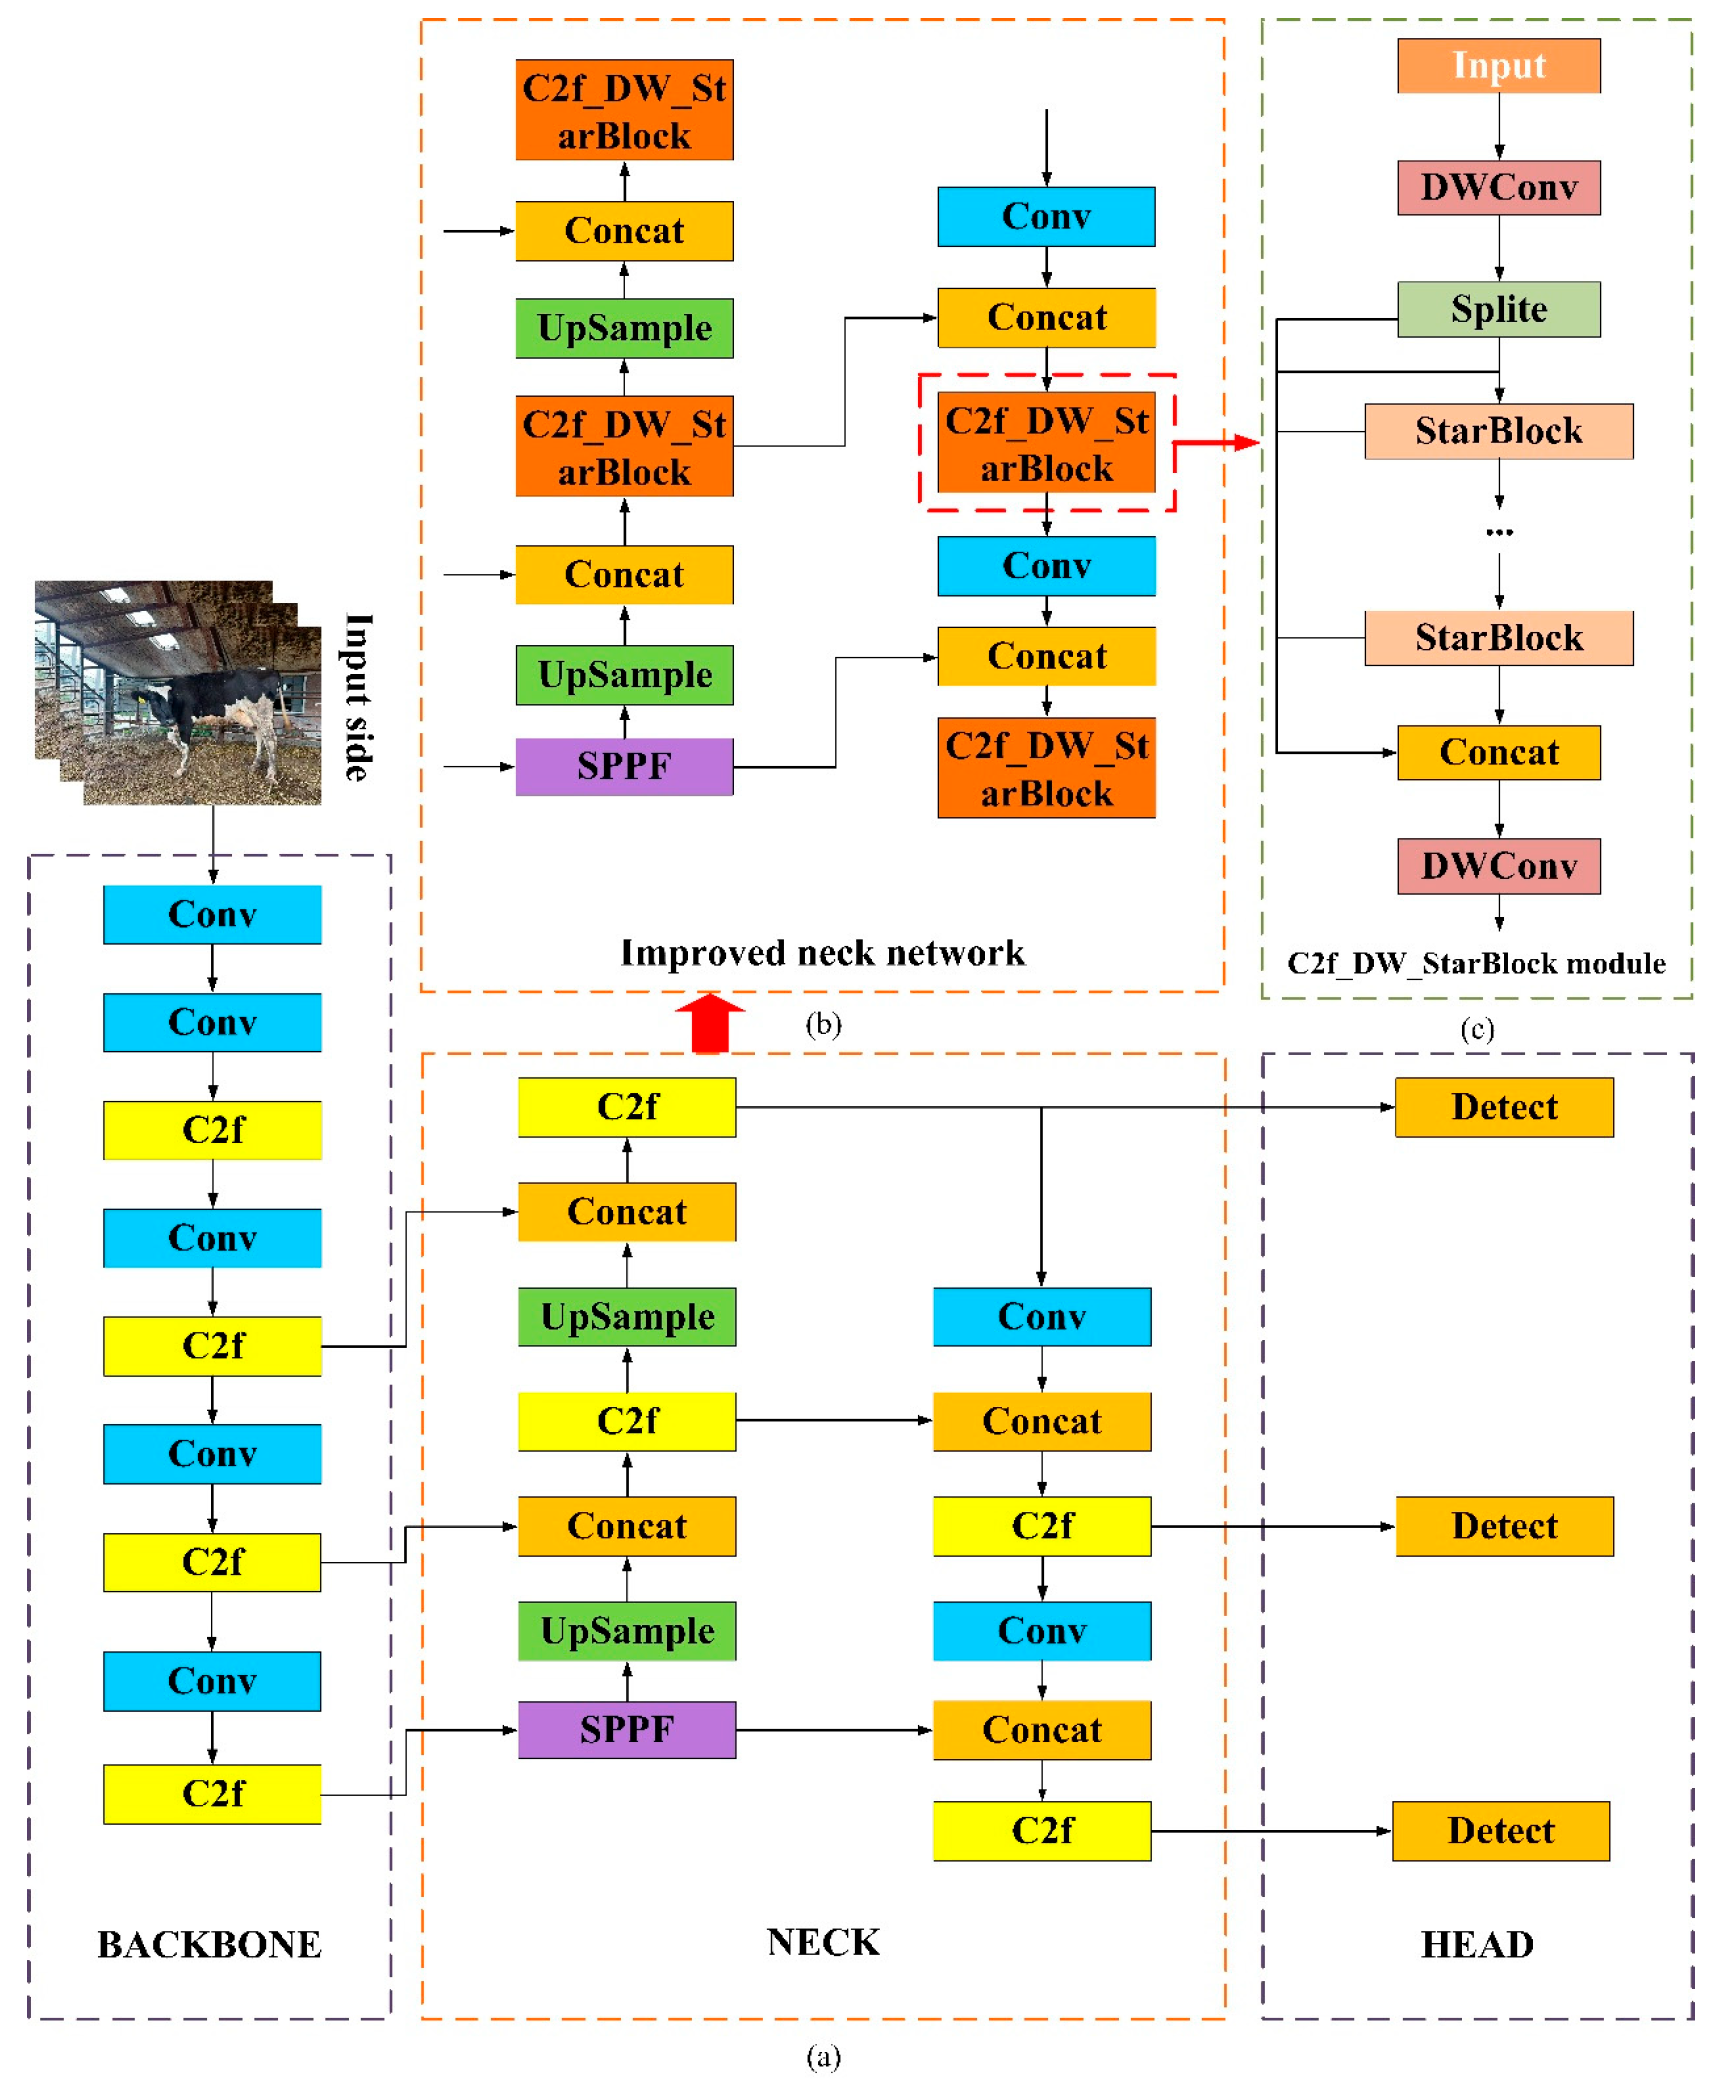
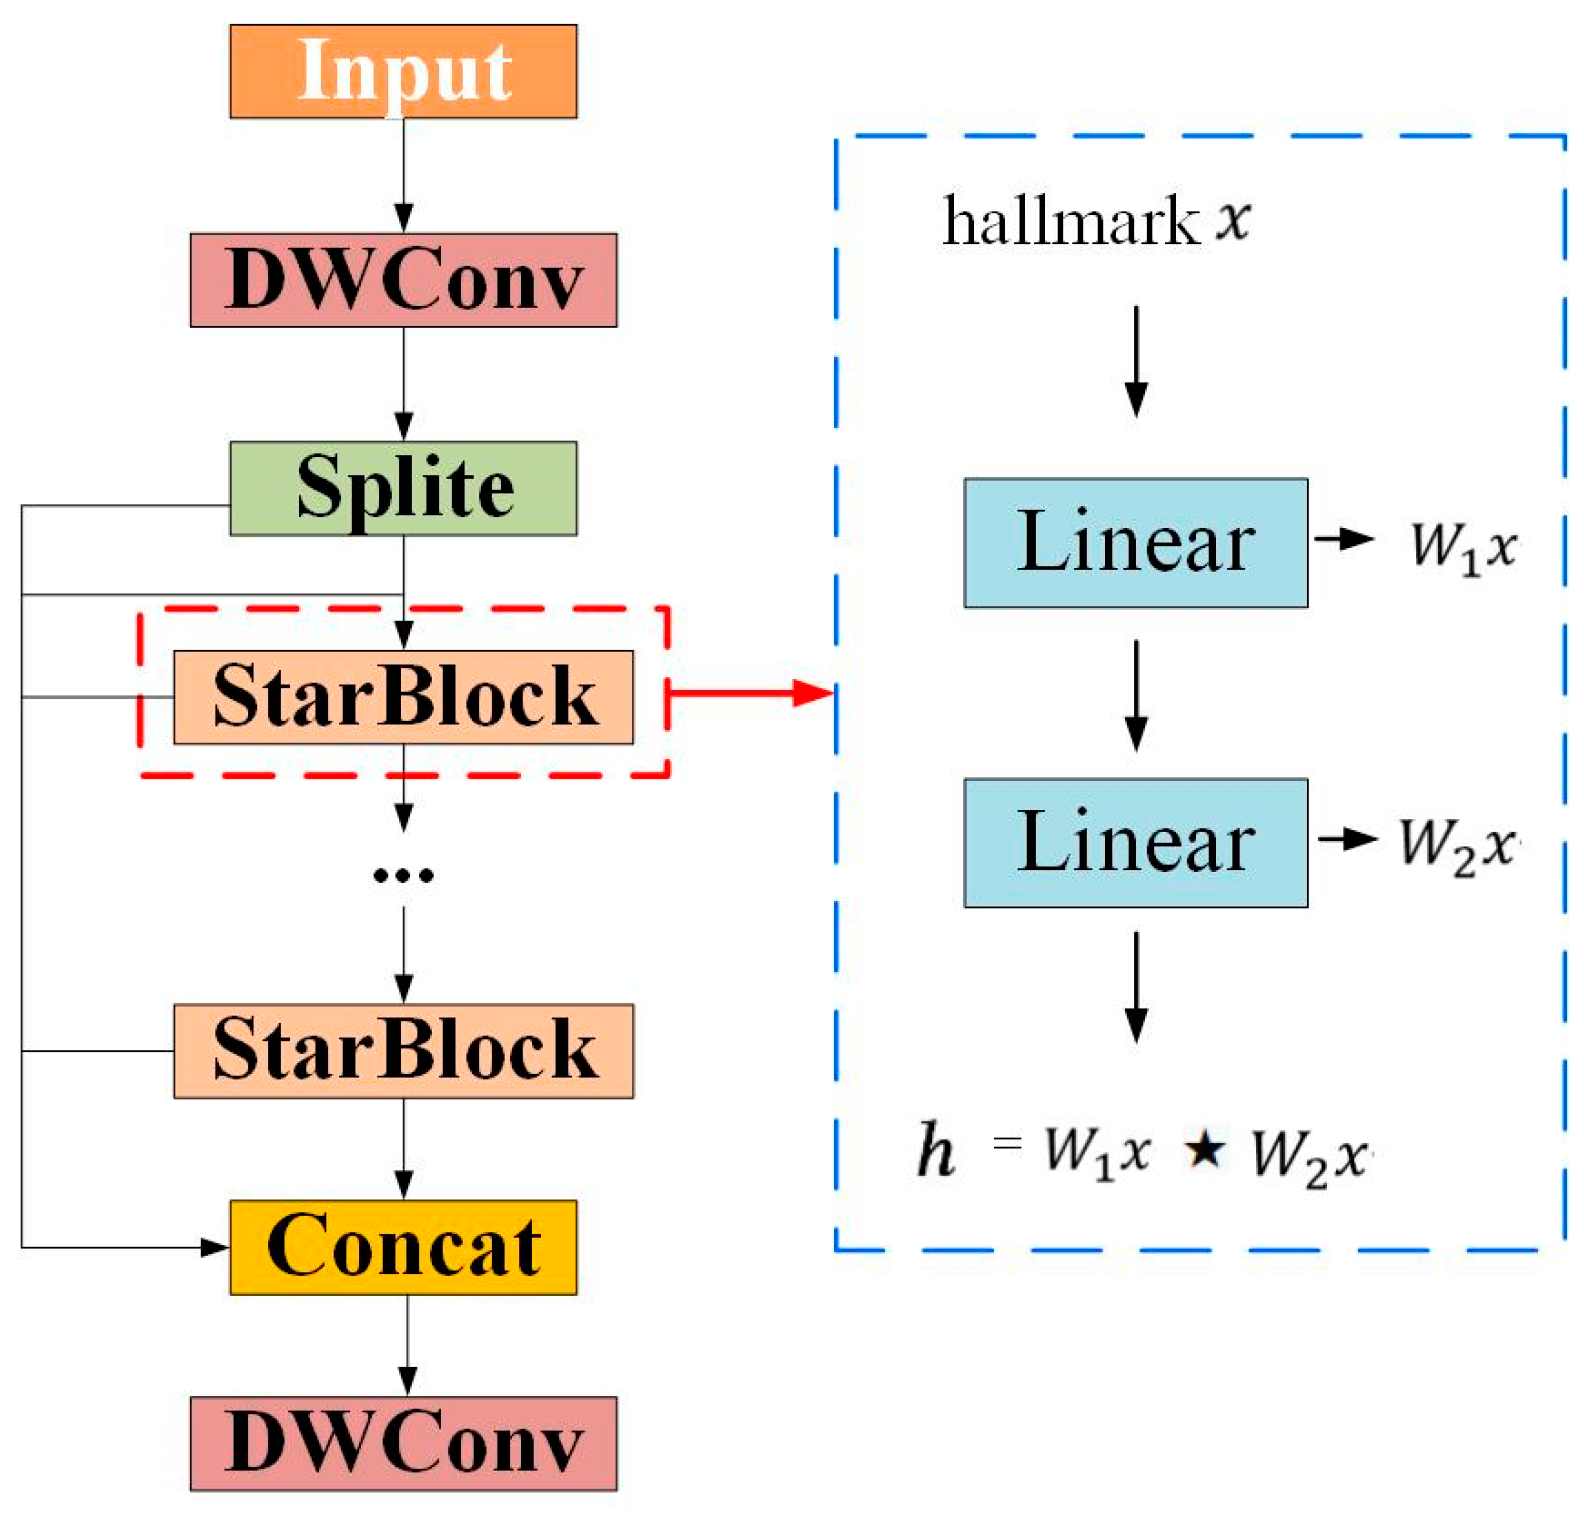
YOLO (You Only Look Once) is a deep learning algorithm that formulates object detection as a single regression task. It processes the entire image through a unified convolutional neural network, directly predicting both the bounding boxes and class probabilities of objects. By balancing localization and classification, YOLO offers the advantages of high speed and efficiency, making it widely used in real-time object detection scenarios [33]. The improved network structure proposed in this study is illustrated in Figure 4. It is based on the module replacement and architectural optimization of the original YOLOv8 design. While maintaining the Backbone and Head structures, all original C2f modules in the Neck are replaced with the enhanced C2f_DW_StarBlock module. To provide a clearer specification, the C2f_DW_StarBlock module is composed of two depthwise convolutional layers and one 1 × 1 pointwise convolutional layer for channel fusion. All depthwise convolutions use a 3 × 3 kernel with a stride of 1 and padding of 1 to maintain the spatial dimensions of the feature maps, while the pointwise convolution uses a 1 × 1 kernel with a stride of 1. The input and output channels are configurable, with a default setting of 64 channels for both input and output. Additionally, each StarBlock contains two fully connected layers (FC1 and FC2) used in the star operation, where the hidden layer dimension is set to half the original channel size. The entire C2f_DW_StarBlock module replaces the original C2f modules in the Neck of YOLOv8, and multiple StarBlocks are stacked within each stage to improve the model’s nonlinear representation capability. This new module integrates Depthwise Convolution and the StarBlock structure, effectively reducing the number of parameters and computational cost. As a result, the model is further lightweighted without compromising detection performance.
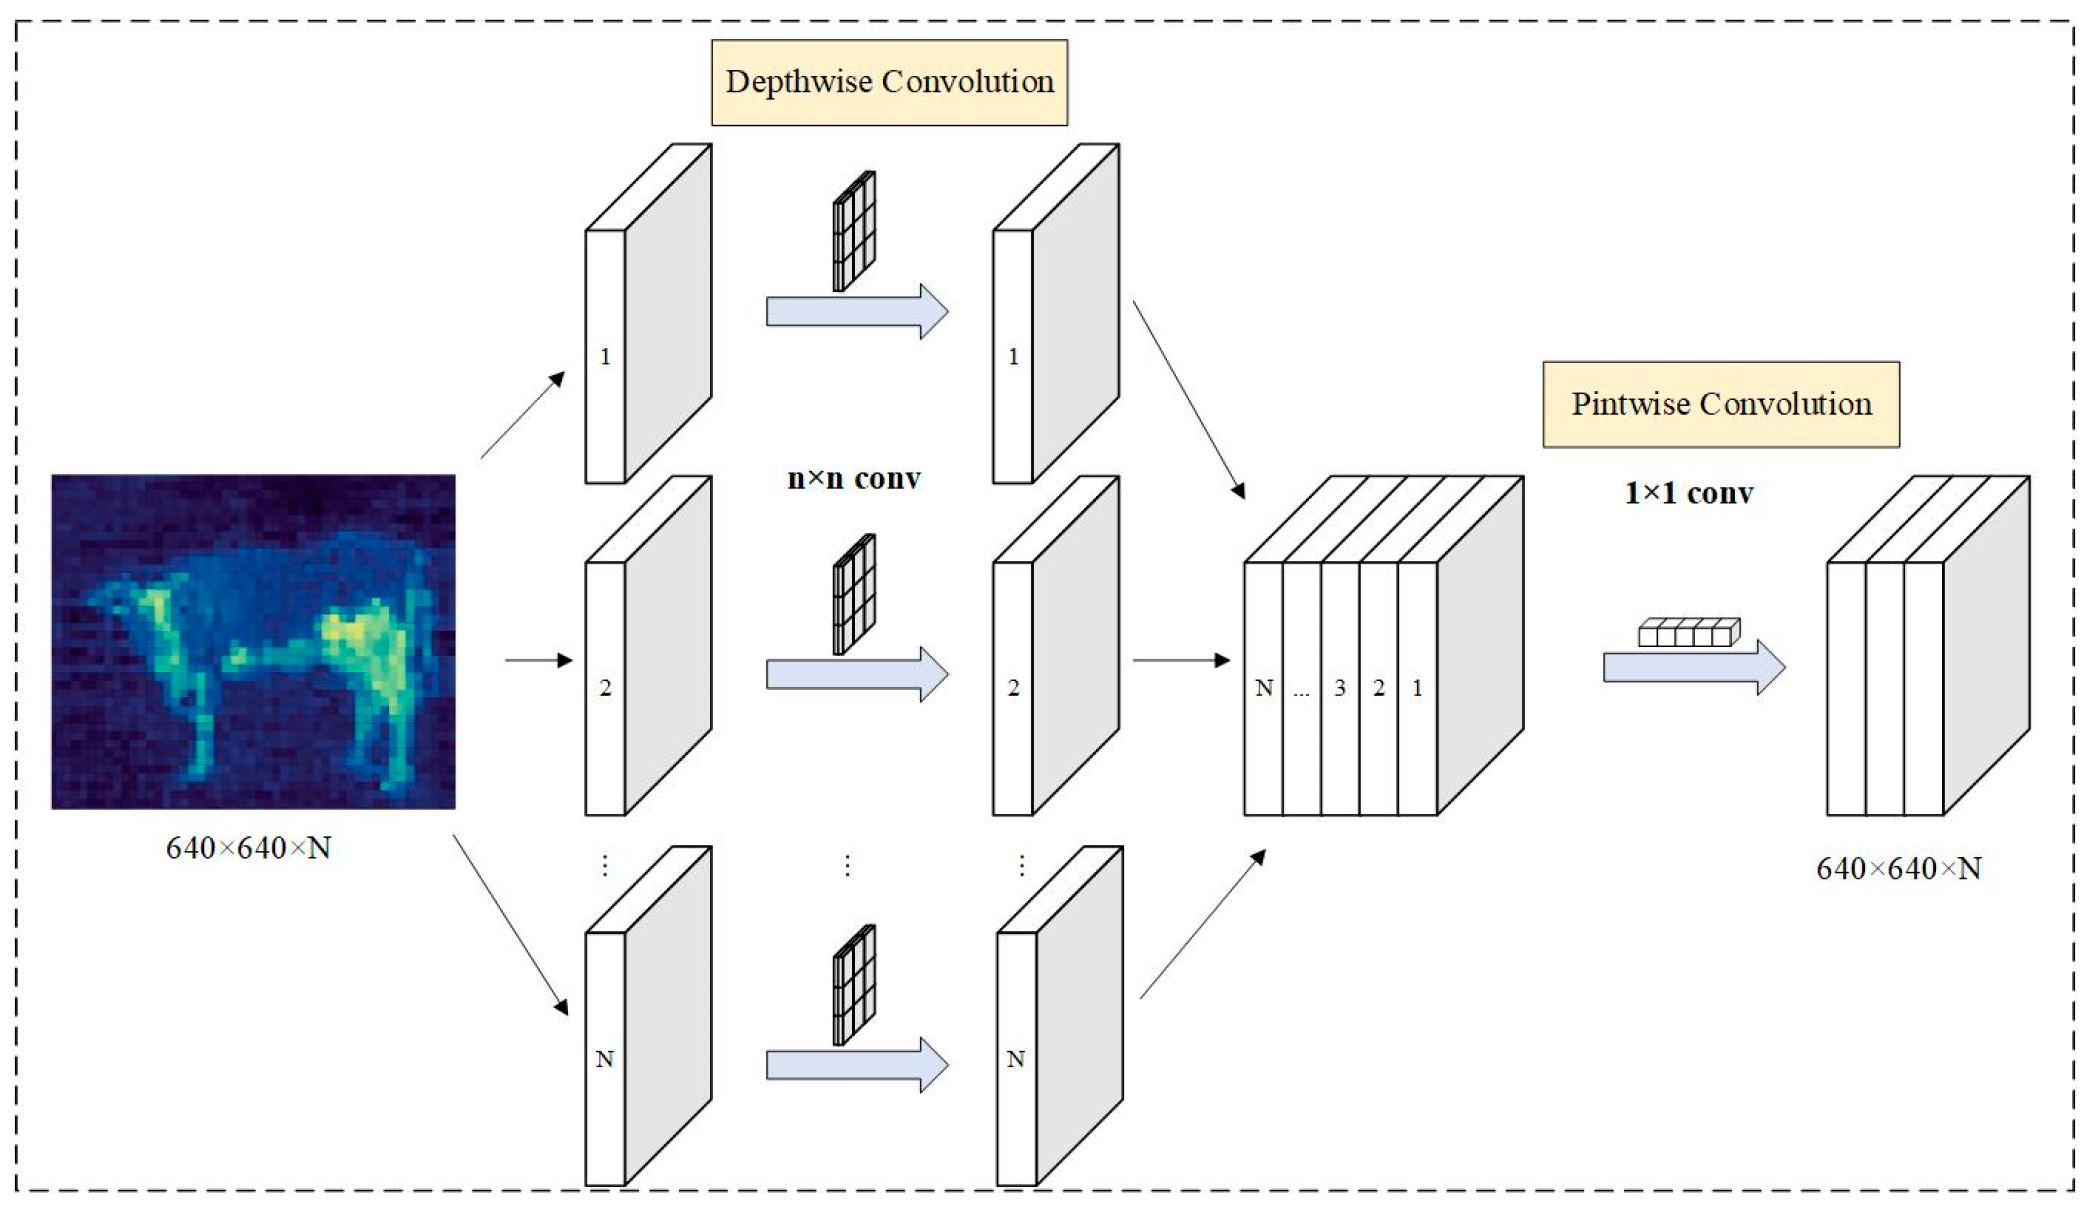
DWConv (depthwise separable convolution) [34] is called Depthwise Separable Convolution. It consists of two parts: depth convolution and point-by-point convolution. The structure is shown in Figure 5.
Figure 5 illustrates the structural flow of depthwise separable convolution, which consists of two stages. First, an n × n convolution is independently applied to each input channel through depthwise convolution to extract spatial features. Then, a 1 × 1 pointwise convolution is used to fuse all channels and integrate inter-channel information. This structure significantly reduces the number of parameters and computational cost while effectively preserving the feature representation capability, making it well-suited for building lightweight object detection models. To further quantify the advantages of this structure in terms of model complexity, the depth-separable convolution is analyzed in the following in terms of both parametric and computational dimensions:
Number of parameters:
Depthwise Convolution: Depthwise convolution has a convolution kernel size of D K × D K × 1 , the number of convolution kernels is M, and the number of parameters is D K × D K × M .
Pointwise Convolution: The convolution kernel size for pointwise convolution is 1 × 1 × M , the number of convolution kernels is N, and the number of parameters is M × N .
Therefore, the total number of parameters for depthwise separable convolution is
  D K × D K × M + M × N
Computational volume:
Depthwise Convolution: Depthwise convolution with a kernel size of D K × D K × 1 , a total of M convolution kernels, and a computational complexity of D K × D K × M × D F × D F .
Pointwise Convolution: Pointwise convolution with a kernel size of 1 × 1 × M , a total of N convolution kernels, and a computational complexity of: M × N × D F × D F . Therefore, the computational volume of the depth separable convolution is
  D K × D K × M × D F × D F + M × N × D F × D F
Comparison of the Number of Parameters and Computational Volume with Standard Convolution:
Parametric quantity ratios:
  D e e p l y   s e p a r a b l e   c o n v o l u t i o n S t a n d a r d   c o n v o l u t i o n = D K × D k × M + M × N D K × D K × M × N = 1 N + 1 D K 2
Calculate the quantity ratio:
  D e e p l y   s e p a r a b l e   c o n v o l u t i o n S t a n d a r d   c o n v o l u t i o n = D K × D K × M × D F × D F + M × N × D F × D F D K × D K × M × N × D F × D F = 1 N + 1 D K 2
where D K is the spatial dimension of the convolution kernel and D F is the spatial dimension of the output feature map. M denotes the number of input channels; N represents the number of output channels in the convolution operation.
From Equations (3) and (4), it can be seen that, when the dimension of the input feature map, the size of the convolution kernel, and the requirements for the output feature map change, depthwise separable convolution can flexibly adapt to these changes and significantly reduce the number of parameters and computational volume while ensuring effective feature extraction. This allows depthwise separable convolution to play a key role in various deep learning tasks, especially in resource-constrained environments or applications requiring high computational efficiency.
The star operation is a nonlinear interaction method that fuses two transformed feature vectors through element-wise multiplication (a multiplication similar to the “star” notation) and has demonstrated excellent performance and effectiveness in various research domains [35]. This operation has the unique advantage of enabling efficient computation in low-dimensional space while implicitly generating high-dimensional feature representations, all with minimal parameter overhead. It is particularly effective in enhancing the expressiveness of lightweight networks, as illustrated in Figure 6.
In a single-layer neural network, the formula for the star operation is given as follows: ( W 1 T X ) × W 2 T X , where W = W , B T , X = X , 1 T . The essence is to fuse two linearly transformed features through element-wise multiplication. To elaborate specifically, assume that ω 1 , ω 2 , x R d + 1 × 1 (d is the number of input channels); in general, the star operation can be written as
  ω 1 T x × ω 2 T x = i = 1 d + 1 ω 1 i x i × j = 1 d + 1 ω 2 j x j = i = 1 d + 1 j = 1 d + 1 ω 1 i ω 2 j x i x j
= α 1,1 x 1 x 1 + + α d + 1 , d + 1 x d + 1 x d + 1
Use i , j to index the channels and α as the coefficient for each item:
  α i , j = ω 1 i ω 2 j ω 1 i ω 2 j + ω 1 j ω 1 i       i = j       i j
Further expansion yields d + 2 d + 1 2 distinct terms, all of which are nonlinearly associated with x except α d + 1 , : x d + 1 x . Therefore, when computing in a d-latitude space, the star operation allows us to obtain a representation in the implied dimensional feature space of d 2 2 d 2 , significantly increasing the feature dimension without adding additional computational overhead within a single layer. When stacking multiple layers of the star operation, the implied dimensionality grows exponentially in a recursive form, approaching infinity. Assuming an initial network layer width of   d , applying a star operation once yields i = 1 d + 1 j = 1 d + 1 ω 1 i ω 2 j x i x j , which gives a representation in the implied feature space of R d 2 2 1 . Let O l denote the output of the l star operation; then, there is
  O 1 = i = 1 d + 1 j = 1 d + 1 ω 1,1 i ω 1,2 j x i x j R d 2 2 1
O 2 = W 2,1 T O 1 × W 2,2 T O 1 R d 2 2 2
O 3 = W 3.1 T × W 3,2 T O 2 R d 2 2 3
in a similar fashion,
  O l = W l , 1 T O l 1 × W l , 2 T O l 1 R d 2 2 l
With l layers, one can implicitly obtain a feature space of dimension R d 2 2 l . By stacking multiple layers, even only a few, the star operation can significantly amplify the implicit dimensionality exponentially.
In order to validate the modeling capability and application potential of “star operations” in deep networks, this study introduces the lightweight model StarNet [36] as a proof-of-concept. StarNet emphasizes the overall design philosophy of “minimalist structure + efficient expression” and centers on the core structural unit StarBlock, aiming to fully leverage the advantages of star operations in feature interaction modeling while minimizing human intervention. As shown in Figure 7, StarNet adopts a four-stage hierarchical structure (Stage 1–Stage 4), progressively extracting high-level semantic features from shallow to deep layers. In each stage, the basic building block consists of a convolutional layer (Conv) followed by several StarBlocks. These StarBlocks serve as the primary implementation modules of the star operation within the network. Internally, each StarBlock incorporates a star connection strategy, enabling cross-channel information interaction by introducing multiple fully connected (FC) layers. Depthwise convolution (DW-Conv) is employed at the input and output ends of the module, facilitating lightweight yet efficient feature transformation. The structure of a StarBlock is illustrated on the right side of the figure. Stacked repeatedly within each stage, StarBlocks form the expressive backbone of the StarNet architecture. As such, StarNet is essentially a deep network constructed with StarBlock as its core component, serving as the key vehicle for verifying the effectiveness of star operation-based modeling in convolutional neural networks.

3.4. Target Localization Model Construction for Multimodal Data Fusion

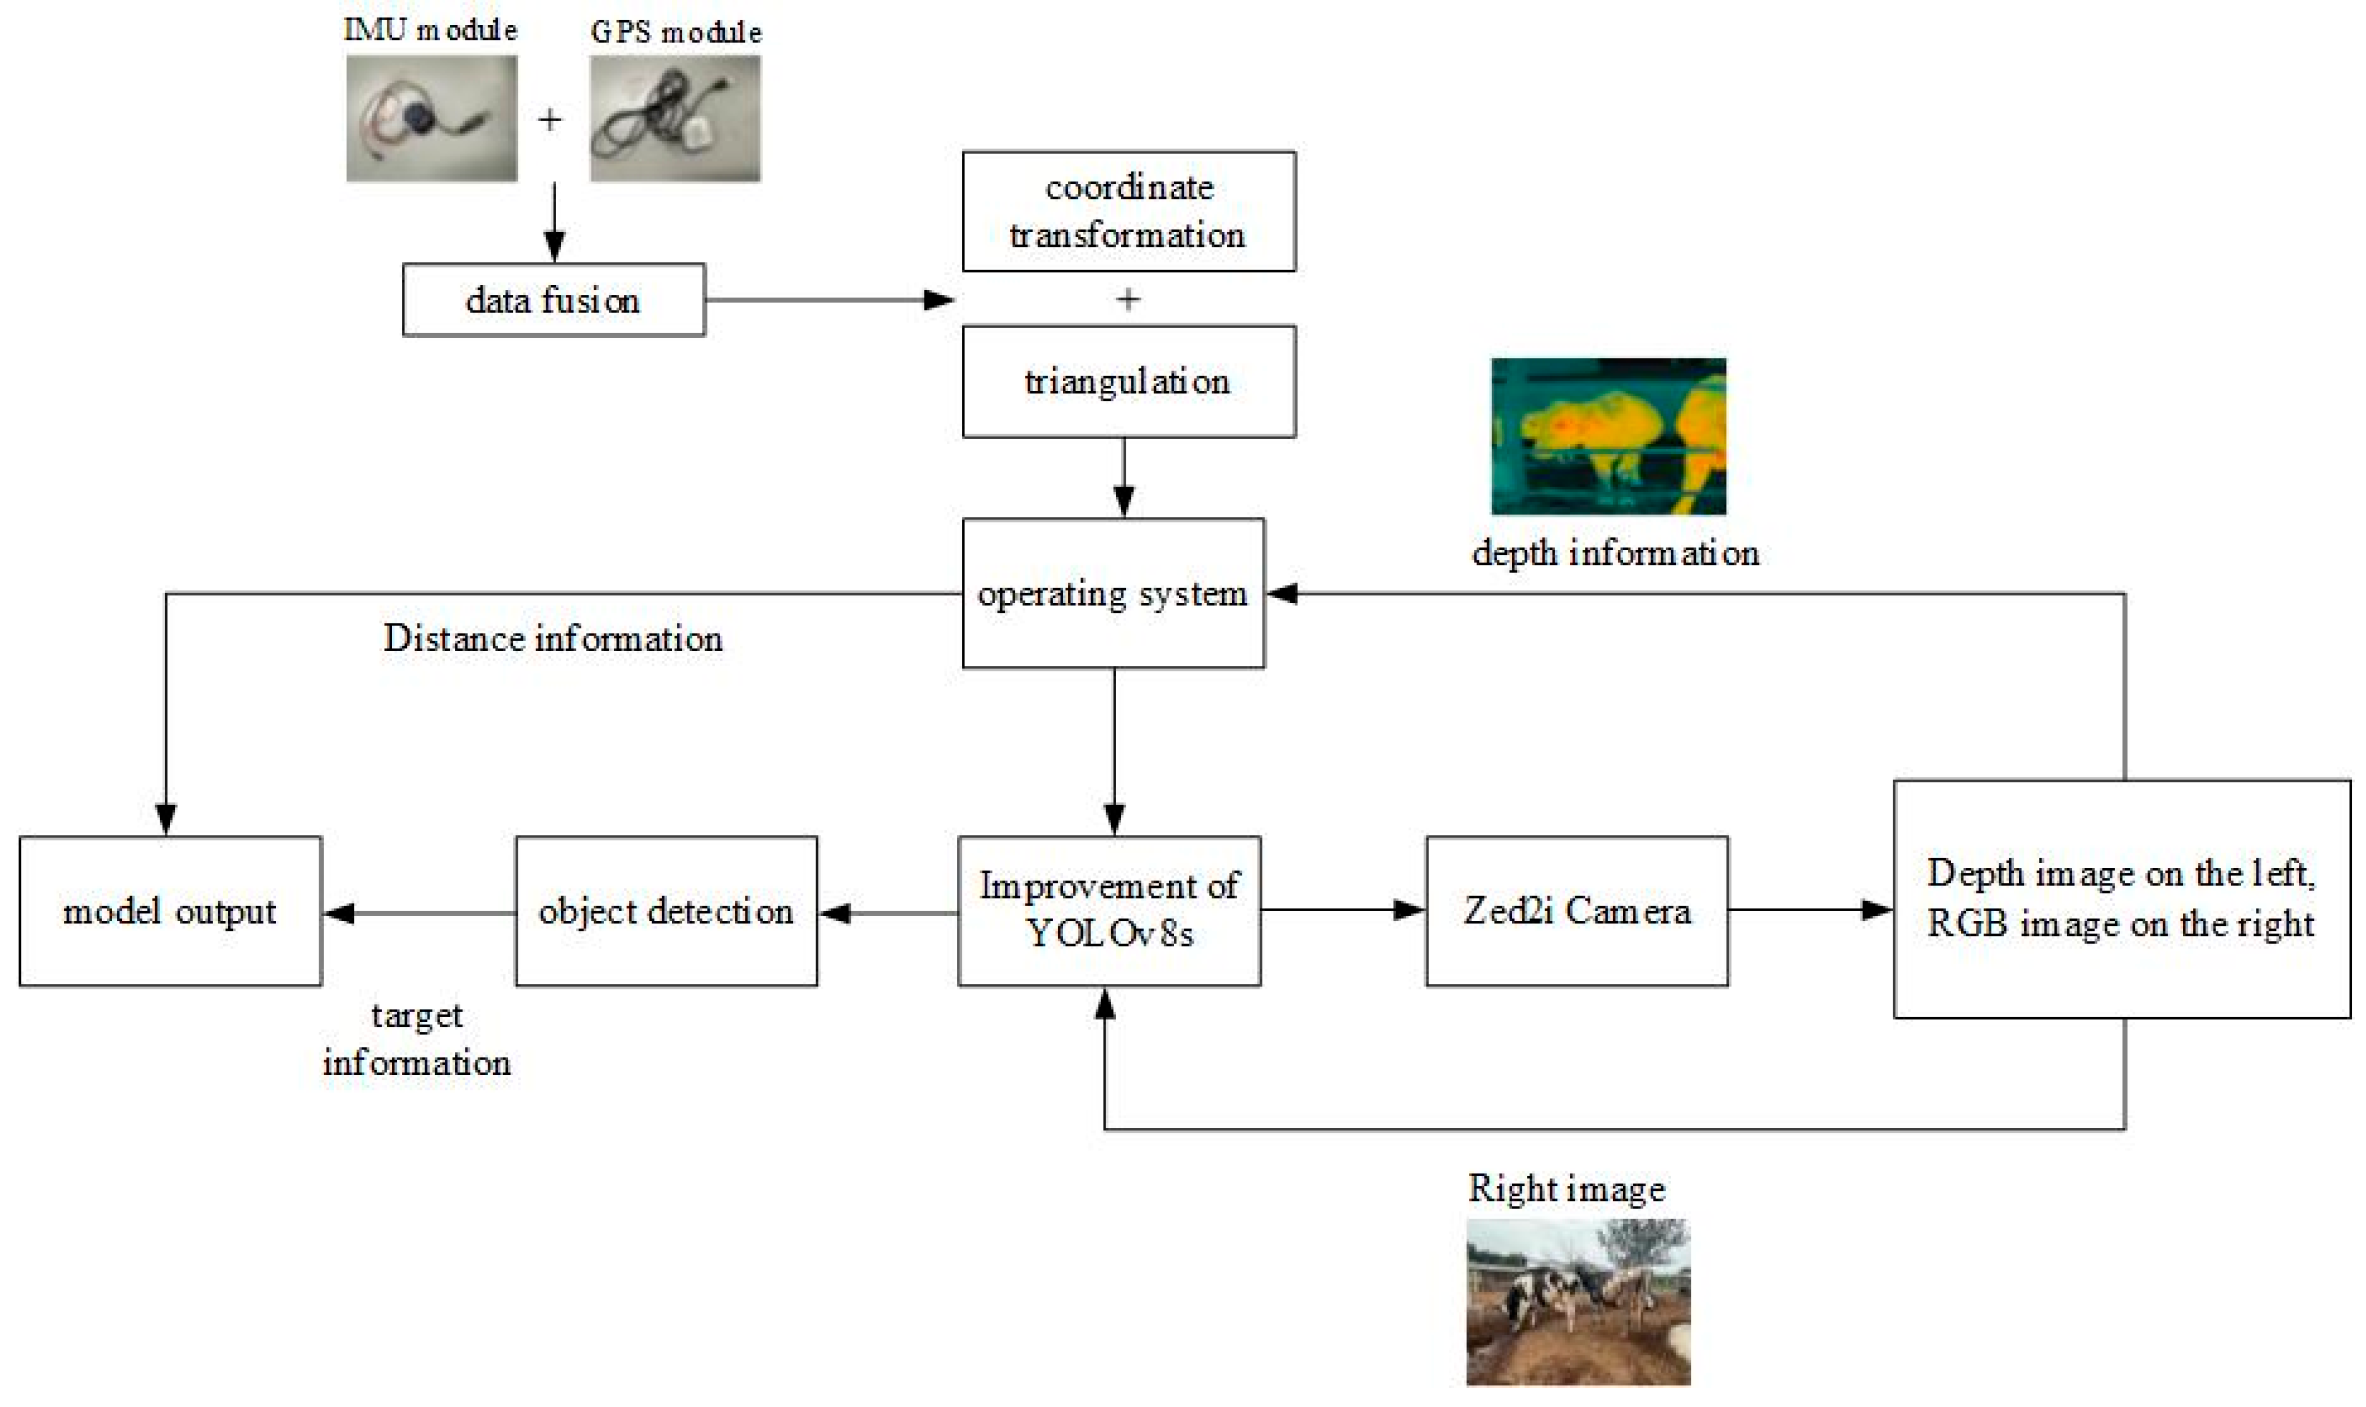
In order to realize the non-contact detection and localization of dynamic targets in the cattle field, the overall flow of the model is shown in Figure 8. First, the ZED binocular camera synchronously acquires the left depth image and the right RGB image, and completes the camera calibration. The images are fed into the improved YOLOv8s model for object detection to obtain the position information of the target in the image. Subsequently, the operating system combines the depth information with the detection results to obtain the spatial coordinates of the target by triangulation. At the same time, the system fuses the data from IMU and GPS sensors and performs coordinate transformation to realize the mapping from the camera coordinate system to the actual geographic coordinates. Eventually, the comprehensive result containing the target category and spatial location is output.

3.4.1. Precise Calibration of Binocular Camera Parameters

In the task of 3D localization of dynamic targets in cattle farms, binocular camera calibration is the core step to realize the mapping from the image coordinate system to the real world coordinate system. Considering that cattle move frequently, have variable postures, and are easily occluded in natural environments, the calibration method needs to have high robustness and accuracy. In this paper, the Zhang Zhengyou calibration method [37] is adopted to calibrate the ZED2i binocular camera with internal and external parameters, and then establish the transformation relationship from 2D image coordinates (u,v) to 3D spatial coordinates (X,Y,Z):
  s u v 1 = K R t X Y Z 1
where K is the camera internal reference matrix; R, t are the rotation matrix and translation vector to describe the spatial geometric relationship between the left and right cameras, respectively; s is the scale factor.
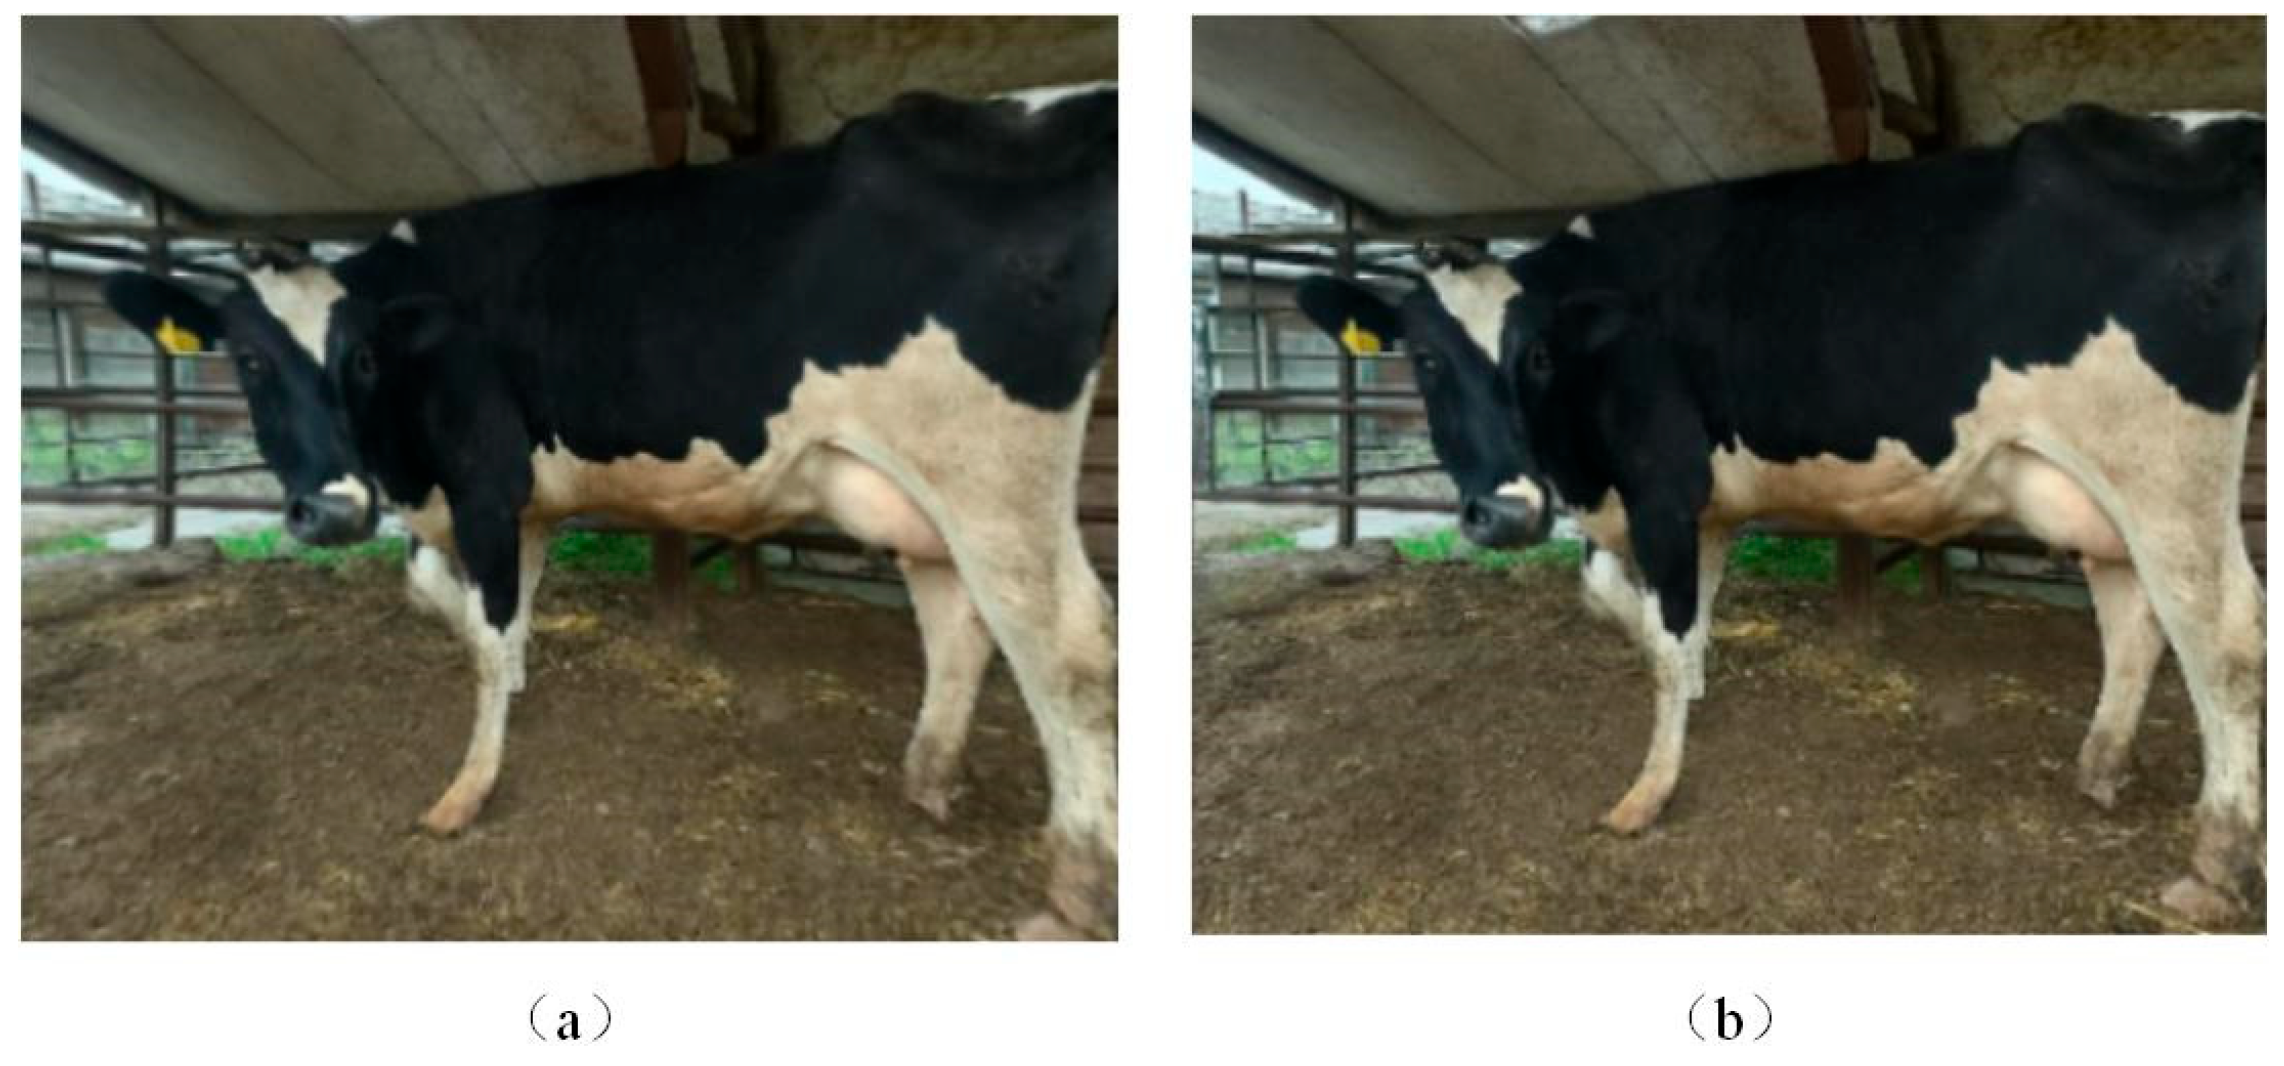
Figure 9 shows the comparison of the image acquisition results before and after camera calibration. After calibration and distortion correction, the geometric distortion of the image is significantly reduced, and the structure of the scene is more realistically reproduced, which provides a more stable input basis for the subsequent depth calculation and 3D localization.

3.4.2. Binocular Vision Ranging Algorithm Design

In cattle farms, to achieve the non-contact and high-precision ranging of dynamic targets such as cattle and pedestrians, this study employs binocular stereo vision technology, which enables the real-time calculation of the distance between the target and the camera by simulating the principle of human binocular depth perception [38]. The binocular stereo vision system consists of two cameras that simultaneously capture the same scene from different angles with a fixed baseline distance.
Due to the positional difference between the two cameras, the same target projects to different horizontal positions in the two images, resulting in a phenomenon known as “parallax.” By calculating this parallax and combining it with the baseline length and the camera’s focal length, the system estimates the depth of the target—i.e., its distance from the camera—based on the principles of triangulation geometry [39].
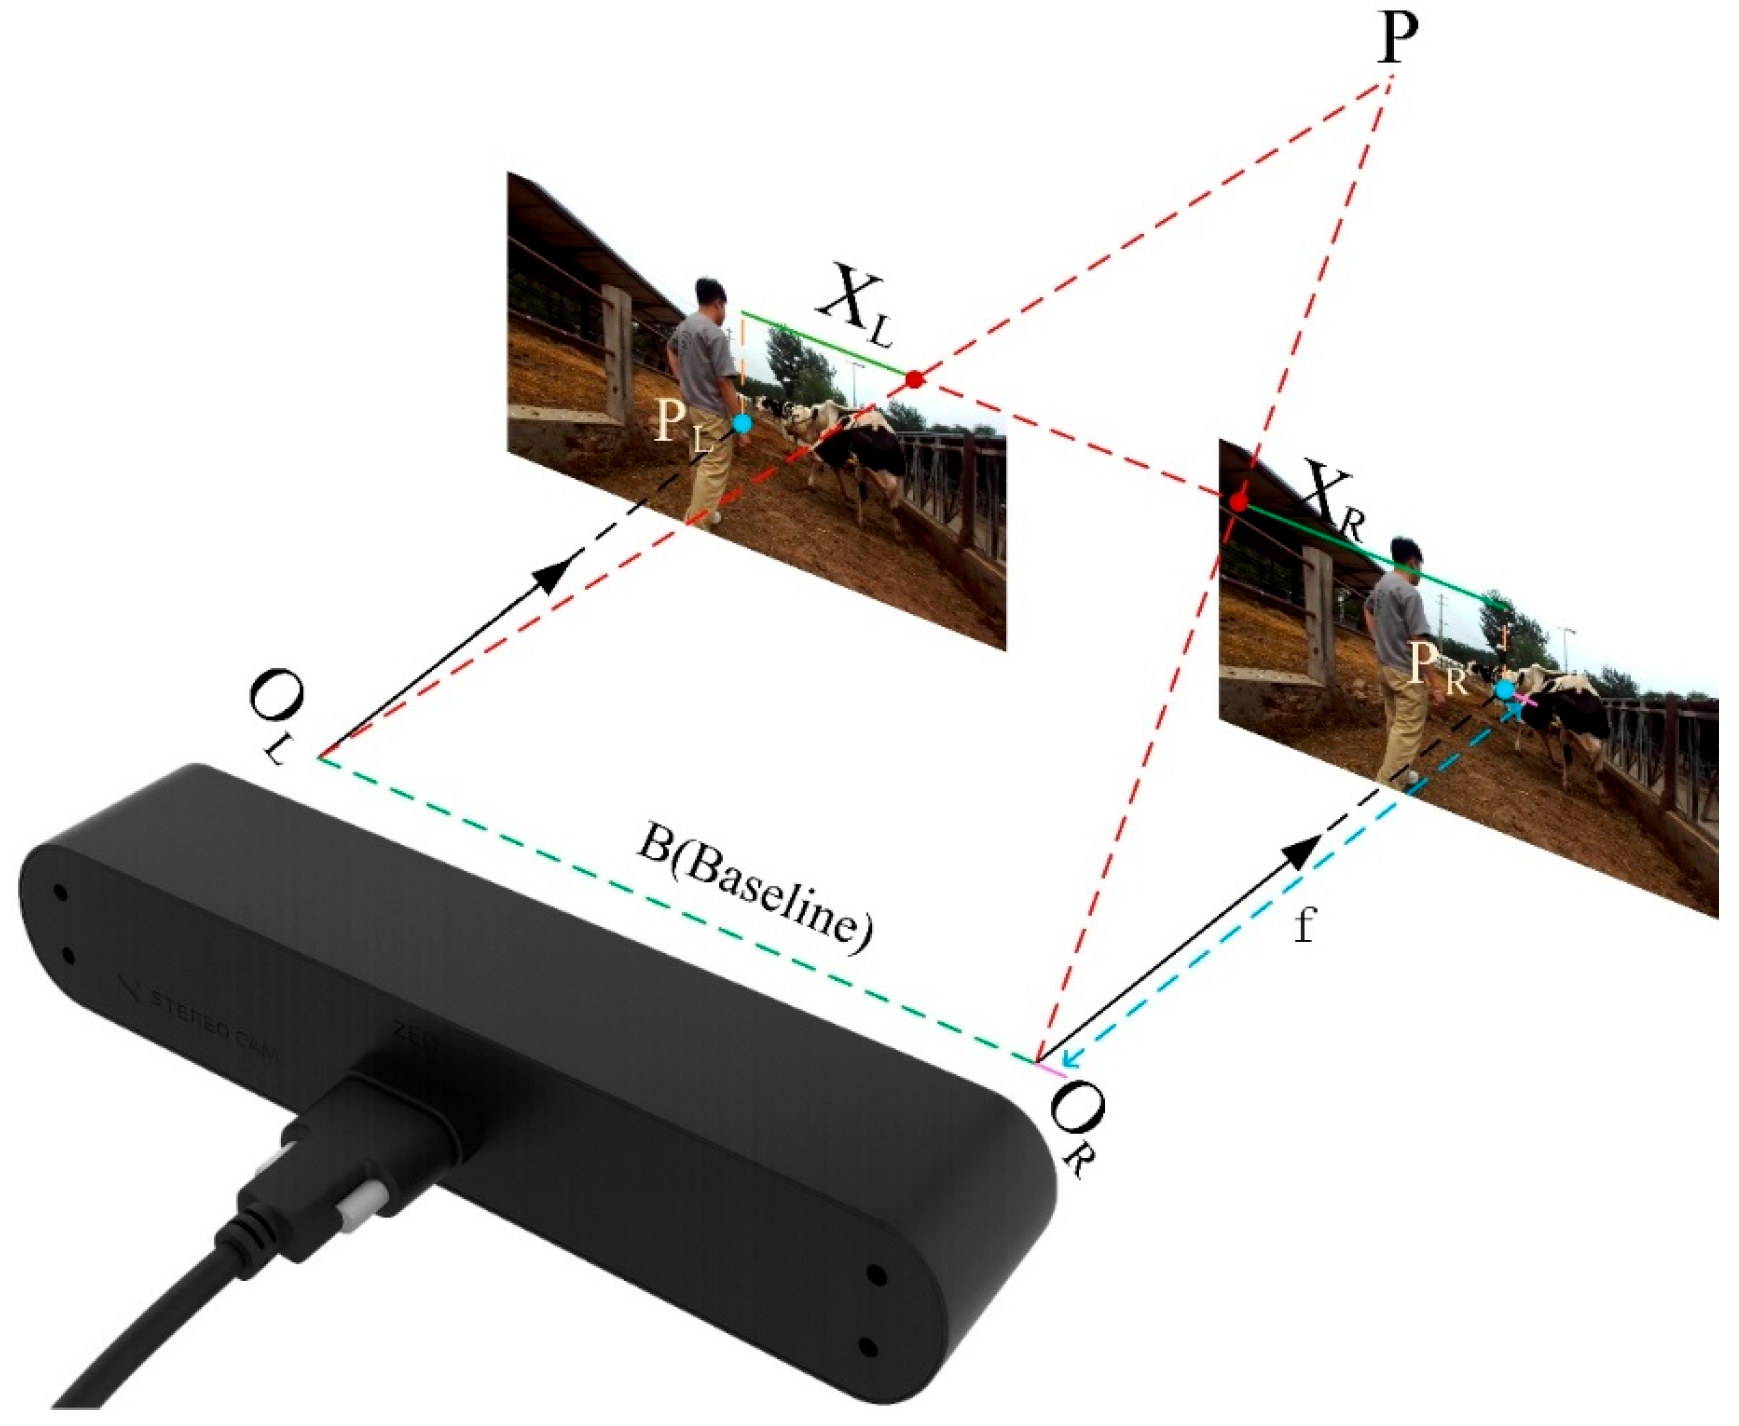
Figure 10 shows the schematic diagram of binocular stereo vision ranging, in which P is a point on the object to be measured, and O L and O R are the optical centers of the left and right cameras, respectively. The imaging points of point P on the two camera photoreceptors are P L and P R , respectively. f represents the focal length of the camera, B is the baseline distance between the two cameras, and Z is the depth information being calculated. If the distance from O L to P is denoted as D , then
  D = B X L X R
According to the principle of similar triangles, it can be concluded that Δ A B C and Δ D E F are similar:
  D B = Z f Z
Substituting into Equation (12) gives
  B X L X R B = Z f Z
The collation formula yields the following result:
  Z = f B X L X R

3.4.3. Binocular Visual Localization Coordinate System Conversion

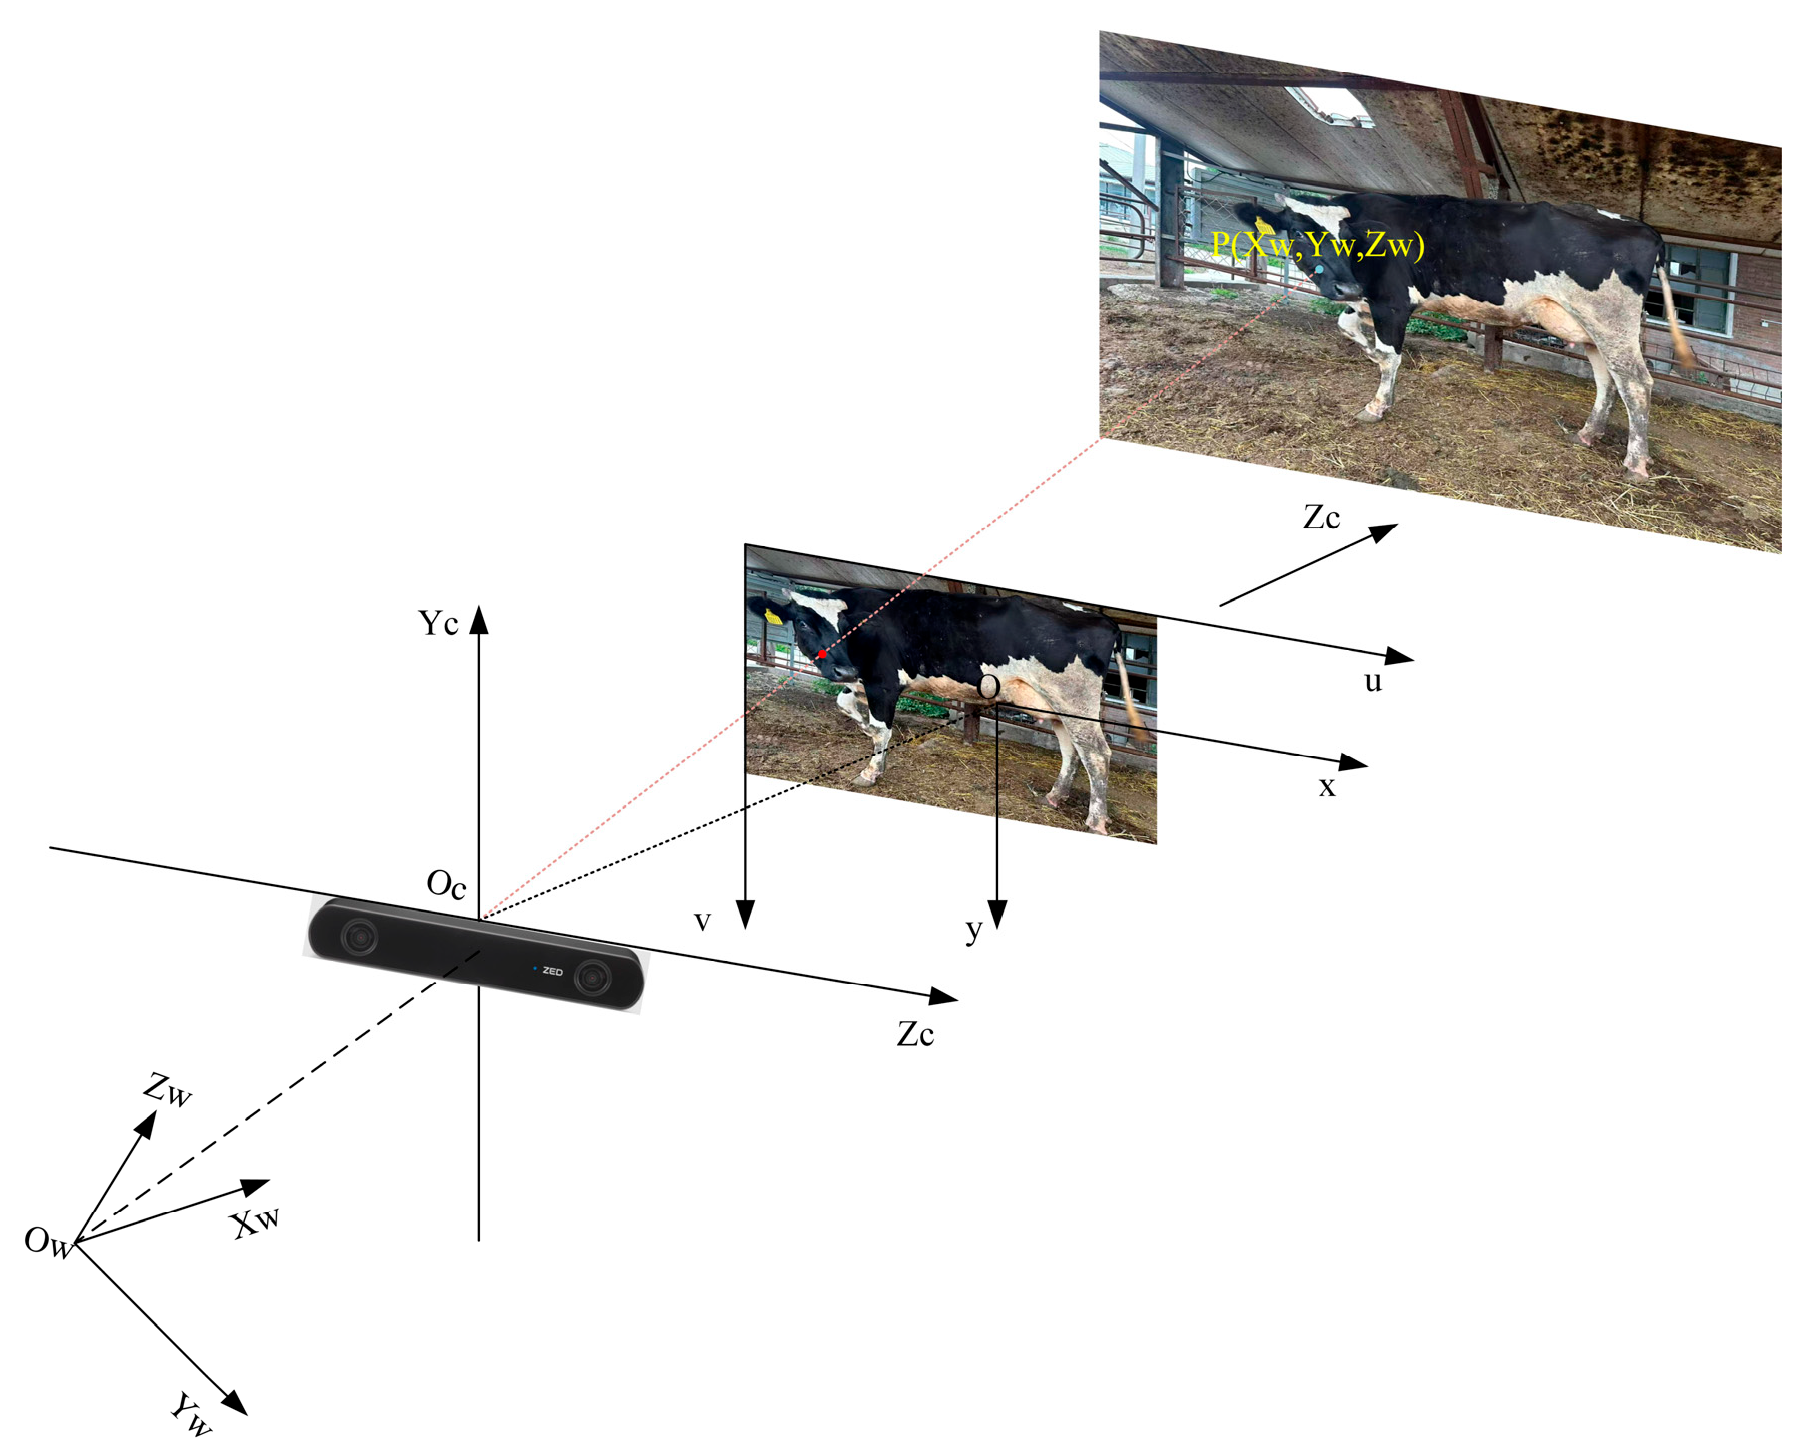
The purpose of the 3D spatial localization of binocular cameras is to determine the correlation between the 3D geometric position of a point in space and its corresponding point in the image. In order to achieve this goal, the binocular vision system needs to establish an accurate geometric model and complete the mapping of image data to 3D spatial coordinates by transforming between coordinate systems [40]. In dynamic target localization in cattle yards, the binocular vision system estimates the distance between the centroid of the detection frame and the optical center of the camera by capturing an image of a target, such as a cow, and calculating the parallax in the image. This process relies on four key coordinate systems: the world coordinate system, the camera coordinate system, the image coordinate system, and the pixel coordinate system. By interconverting these coordinate systems, the binocular vision system is able to accurately convert the target information in the image into actual 3D spatial coordinates, thus supporting the precise localization of dynamic targets such as cows.
In this process, image discretization [41], central projection transformation [42] (implemented by the inner reference matrix K), and rigid-body transformation [43] (implemented by the outer reference matrix consisting of the rotation matrix R and translation vector T) are involved. First of all, the target point captured in the image is expressed in pixel coordinates (u,v), and its position is transformed into normalized coordinates (x,y) in the image coordinate system by the camera’s internal reference matrix K. This transformation satisfies the following equation:
  s u v 1 = K x y 1 = f x 0 c x 0 f y c y 0 0 1 x y 1
where f x , f y is the focal length of the camera in the horizontal and vertical directions, c x , c y are the coordinates of the main point, and s is the scaling factor.
Then, based on the known depth value Z of the point, it can be back-projected from the image coordinate system to the camera coordinate system to obtain its three-dimensional coordinates X c , Y c , Z c :
  X c Y c Z c = Z · K 1 u v 1
Finally, the point needs to be transformed from the camera coordinate system to the world coordinate system defined within the cattle farm by introducing the camera’s extrinsic parameters—namely, the rotation matrix R and the translation vector T—to perform the rigid body transformation:
  X w Y w Z w = R X c Y c Z c + T
where X w , Y w , Z w denotes the spatial position of the target in the world coordinate system.
Through the above step-by-step transformation, the system realizes the accurate mapping from image pixel points to 3D world coordinates, and the cow field coordinate transformation is shown in Figure 11.

3.4.4. Multimodal Localization Data Fusion

In order to further enhance the spatial accuracy and robustness of dynamic target localization, this paper proposes a multimodal fusion model that integrates GPS, IMU, and visual images. The model fully leverages the complementary characteristics of the three types of sensors to achieve the precise spatial perception of target objects in cattle farm environments. The GPS module provides global geographic coordinates with absolute positioning capability and broad coverage, making it suitable for the large-scale tracking of targets in open fields. However, GPS suffers from low update frequency and is susceptible to interference from occlusion and multipath effects, leading to short-term drift. To address these limitations, the model incorporates an Inertial Measurement Unit (IMU), which uses accelerometers and gyroscopes to acquire 3D acceleration and angular velocity data. It calculates the device’s attitude angles in real time (including roll, pitch, and yaw), enabling the high-frequency, continuous estimation of motion states. An Extended Kalman Filter (EKF)-based fusion strategy is adopted to effectively couple GPS and IMU data. In the prediction phase, high-frequency motion data from the IMU is used to predict the current position and orientation of the device. In the update phase, GPS data serves as the observation input to correct the predicted state, effectively mitigating drift errors caused by long-term IMU integration. Moreover, when GPS signals are degraded or temporarily lost, the IMU maintains continuous short-term state estimation; once GPS data resumes, EKF promptly corrects the accumulated error, thus compensating for GPS drift and enhancing localization stability.
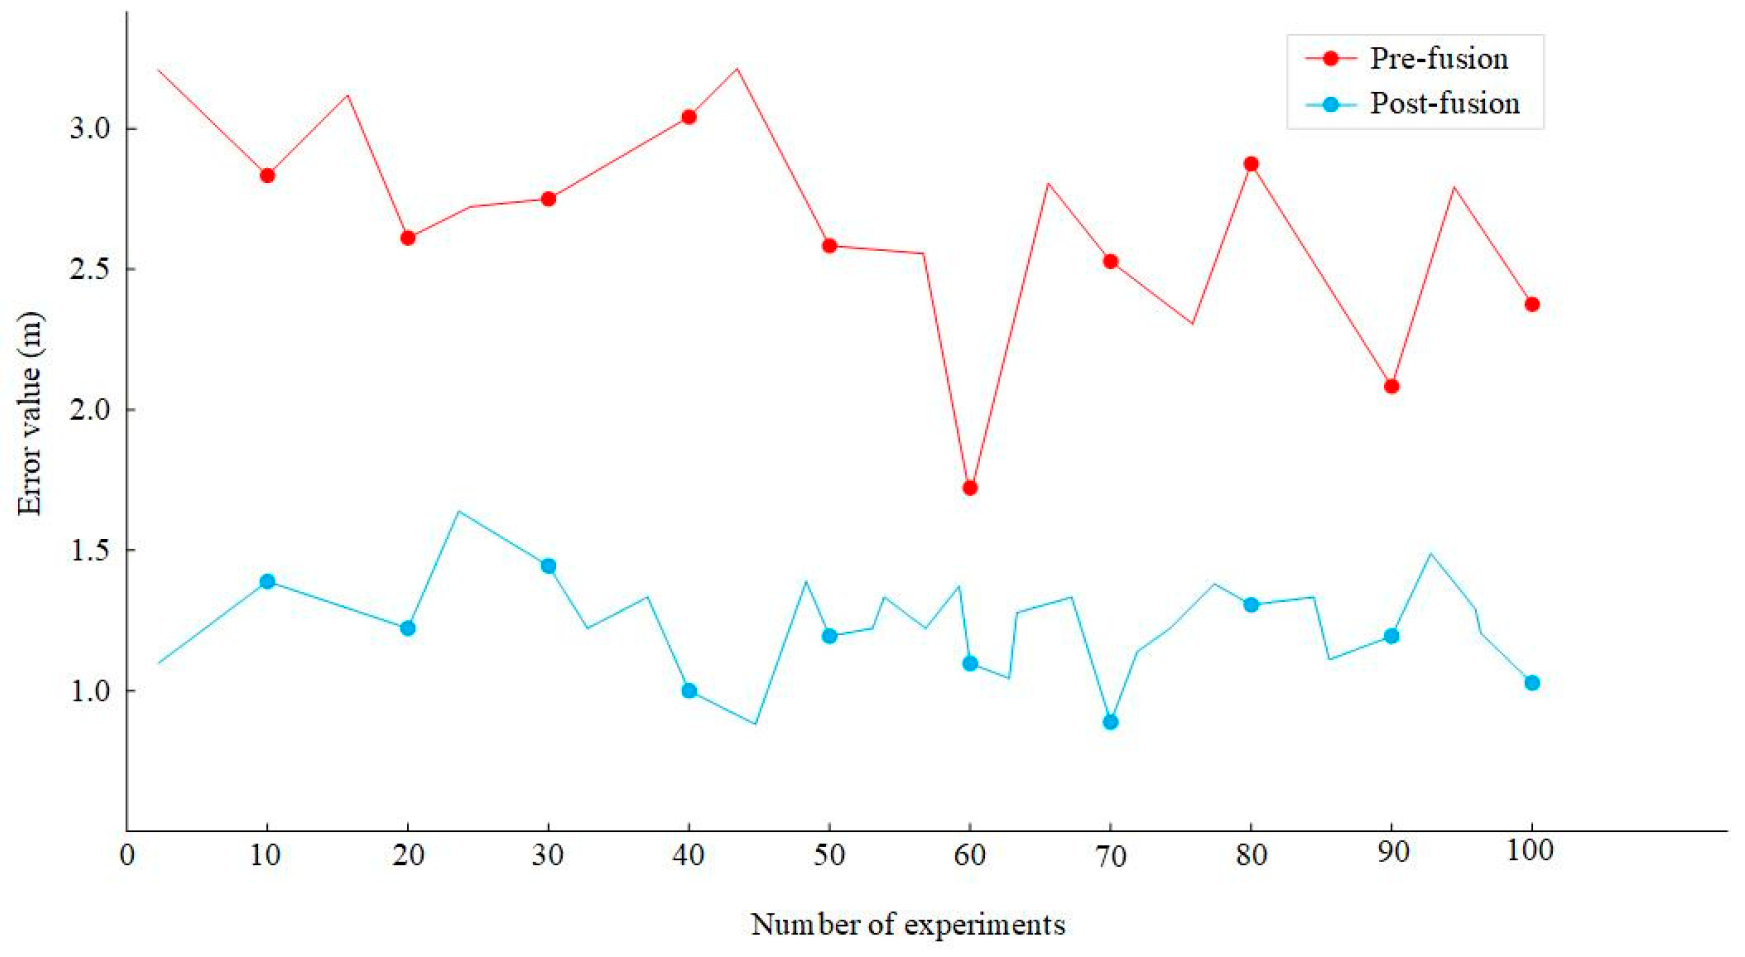
On this basis, the model further integrates binocular vision images as a third data source, providing high-resolution local depth information and object recognition capabilities. The binocular vision module calculates the relative 3D position of targets in the camera coordinate system using parallax estimation, and, in combination with the improved YOLOv8s model, performs object detection and classification, identifying dynamic targets such as cattle and pedestrians. The resulting image coordinates and depth data are first back-projected into the 3D camera coordinate system using intrinsic camera parameters. This data is then transformed into the device reference coordinate system using the attitude angles provided by the IMU. Subsequently, the relative position information is aligned with the position output from the GPS/IMU fusion module and mapped into the global geographic coordinate system, yielding a localization result with absolute geographic semantics. Through this tri-modal data fusion process, the model achieves an accurate transformation from image pixels to real-world geographic coordinates. Figure 12 presents a comparison of target localization errors before and after sensor fusion.
As can be seen from the figure, there is a significant difference in the localization accuracy of the model before and after multimodal fusion in the localization task of the same target object. In each experiment, the same cow is used as the target object, its spatial position is detected in the image by the binocular vision system, and the estimation results are compared with the baseline value to calculate the localization error. The localization error in this experiment refers to the Euclidean spatial position error of the target object in the 3D world coordinate system, which is calculated as follows:
I n a c c u r a c i e s = P e s t i m a t e P t r u e v a l u e
The P e s t i m a t e represents the fused positioning result output by the model, and the P t r u e   v a l u e is the “approximate true value coordinates” obtained by RTK differential GPS system and manual measurement method. The red curve in the figure reflects that the error value before fusion is generally higher than 2.0 m, and there is a certain degree of volatility. The blue curve shows that the error after fusion is significantly reduced, and most of the experiments are controlled between 1.0 and 1.5 m, with reduced volatility and improved positioning stability.

3.5. Cross-Platform Migration and Deployment of Intelligent Equipment

In order to meet the real-time detection and high-precision localization requirements of cattle and pedestrians in cattle farm scenarios, this paper realizes the cross-platform transplantation and end-side deployment of the model from a general-purpose computing platform (Windows) to a robot operating system platform (ROS) on the basis of improved object detection and multimodal fusion localization algorithms. Through modularized design and a multi-thread scheduling mechanism, the whole process of data closure from sensing, recognition, and localization to release is completed, which significantly improves the real-time adaptability of the model in field deployment. The process is shown in Figure 13. In the process of system deployment, four core functional nodes are constructed and integrated, which are responsible for image data acquisition, object detection and processing, position information fusion, and target spatial localization, forming a complete visual–inertial–geographic tri-modal perception link:
(1)
Perception node (camera): it is responsible for processing the video stream collected by the depth camera, completing the temporal and spatial synchronization and calibration of the visible and depth images, and ensuring that the downstream module acquires a consistent data source. This node serves as an input interface for visual information, providing original support for target recognition and depth estimation.
(2)
Detection node (YOLOv8s): integrating the lightweight and improved object detection model proposed in this paper, it is responsible for fast target recognition of the input image frames, and outputs information such as target category, location, and confidence level. This node supports high-frequency real-time operation, which can provide accurate 2D observation data for the subsequent localization module.
(3)
Fusion node (GNSS-IMU): integrates the geographic position information provided by the global navigation satellite system (GNSS) and the attitude information output from the Inertial Measurement Unit (IMU) to construct a highly robust position–posture fusion result. The fusion strategy is based on the attitude correction and filtering model, which effectively improves the stability of the positioning system in the dynamic environment and provides a reliable basic reference for target geo-mapping.
(4)
Localization node: undertake the task of spatial transformation of image depth information and 2D detection results. This module reconstructs the 3D spatial position of the target under the camera coordinate system by integrating visual depth, target image coordinates, and position information, and outputs the geographic position of the target with absolute spatial semantics based on coordinate transformation and geographic alignment. This module is the core node of multimodal information integration.

3.6. Experimental Configuration and Model Evaluation Metrics

3.6.1. Experimental Configuration

The computer configuration used for model training was Intel Xeon W9-3495X (56 cores, 112 threads, 1.90 GHz, up to 4.80 GHz), 96 GB of RAM, NVIDIA RTX A6000 graphics card (48 GB of video memory), operating system Ubuntu 20.04.6, CUDA version 11.4, CUDNN version 8.2.1. The training parameters were set as follows: imgsz = 640, cache = True, epochs = 200, batch = 32, device = 0, workers = 12, patience = 200.
The ranging and localization experiments were done through a portable computer with the following main configurations: a Windows 11 system, an AMD Ryzen 7 6800H processor (3.20 GHz), 16 GB of operating memory, and an AMD Radeon (TM) Graphics card.
The model was trained using the default YOLOv8s configuration, with SGD optimizer (initial learning rate of 0.01), cosine learning rate scheduler, and standard loss components for classification, objectness, and bounding box regression.
The mobile vehicle used in this study is the Unitree Robotics quadrupedal robot, which has a high level of environmental adaptability and task-loading capability. The platform weighs about 12 kg, has a maximum load of 10 kg, operates at a maximum speed of 3.7 m/s, is IP66-rated for dust and water resistance, and can adapt to complex outdoor climatic conditions from −20 °C to 55 °C. The platform is equipped with an 8-core high-performance CPU and a graphics card. It is equipped with an 8-core high-performance CPU and a 64 GB memory module to support high real-time image processing and inference calculation tasks; an integrated IMU for attitude estimation, a built-in high-definition wide-angle camera for target sensing, and an extended 4D LIDAR to enhance environment mapping and autonomous navigation capabilities. In addition, the robotic platform supports multiple communication modes, including Wi-Fi 6, Bluetooth 5.2, and 4 G networks (with a built-in patch SIM card), and can supply power to external devices through the DC 28.8 V (300 W max) and DC 12 V (60 W max) interfaces.

3.6.2. Evaluation Indicators

Precision, recall, and mAP are introduced as evaluation metrics to comprehensively assess the model’s performance. Precision is defined as the number of correctly predicted positive instances out of all positive predictions and is used to measure the classification ability of the object detection model. Recall, on the other hand, is the proportion of detected targets among all true labels and evaluates the model’s capability to recognize targets. Meanwhile, mAP (mean average precision) represents the average precision across multiple categories, where mAP@0.5 denotes the mean average precision at an IoU threshold of 50%.
  P r e c i s i o n = T P T P + F P
R e c a l l = T P T P + F N
m A P = 1 n k = 1 k = n A P k
where TP is the number of correctly predicted positive cases (i.e., the number of samples predicted to be positive and actually positive); F P is the number of incorrectly predicted positive cases (i.e., the number of samples predicted to be positive but actually negative); F N is the number of incorrectly predicted negative cases (i.e., the number of samples that are actually positive but predicted to be negative); A P k is the average precision of category k; and n is the total number of categories.
To evaluate the model performance more comprehensively, three key metrics are introduced: the number of parameters (Params), computational complexity (GFLOPs), and model size (Model Size). The number of parameters reflects the complexity of the model, GFLOPs indicates the computational cost during inference, and model size represents the storage requirements. These metrics provide a more detailed analysis of the model’s efficiency and resource requirements across different scenarios.

4. Results

4.1. Comparison and Field Validation of Object Detection Models

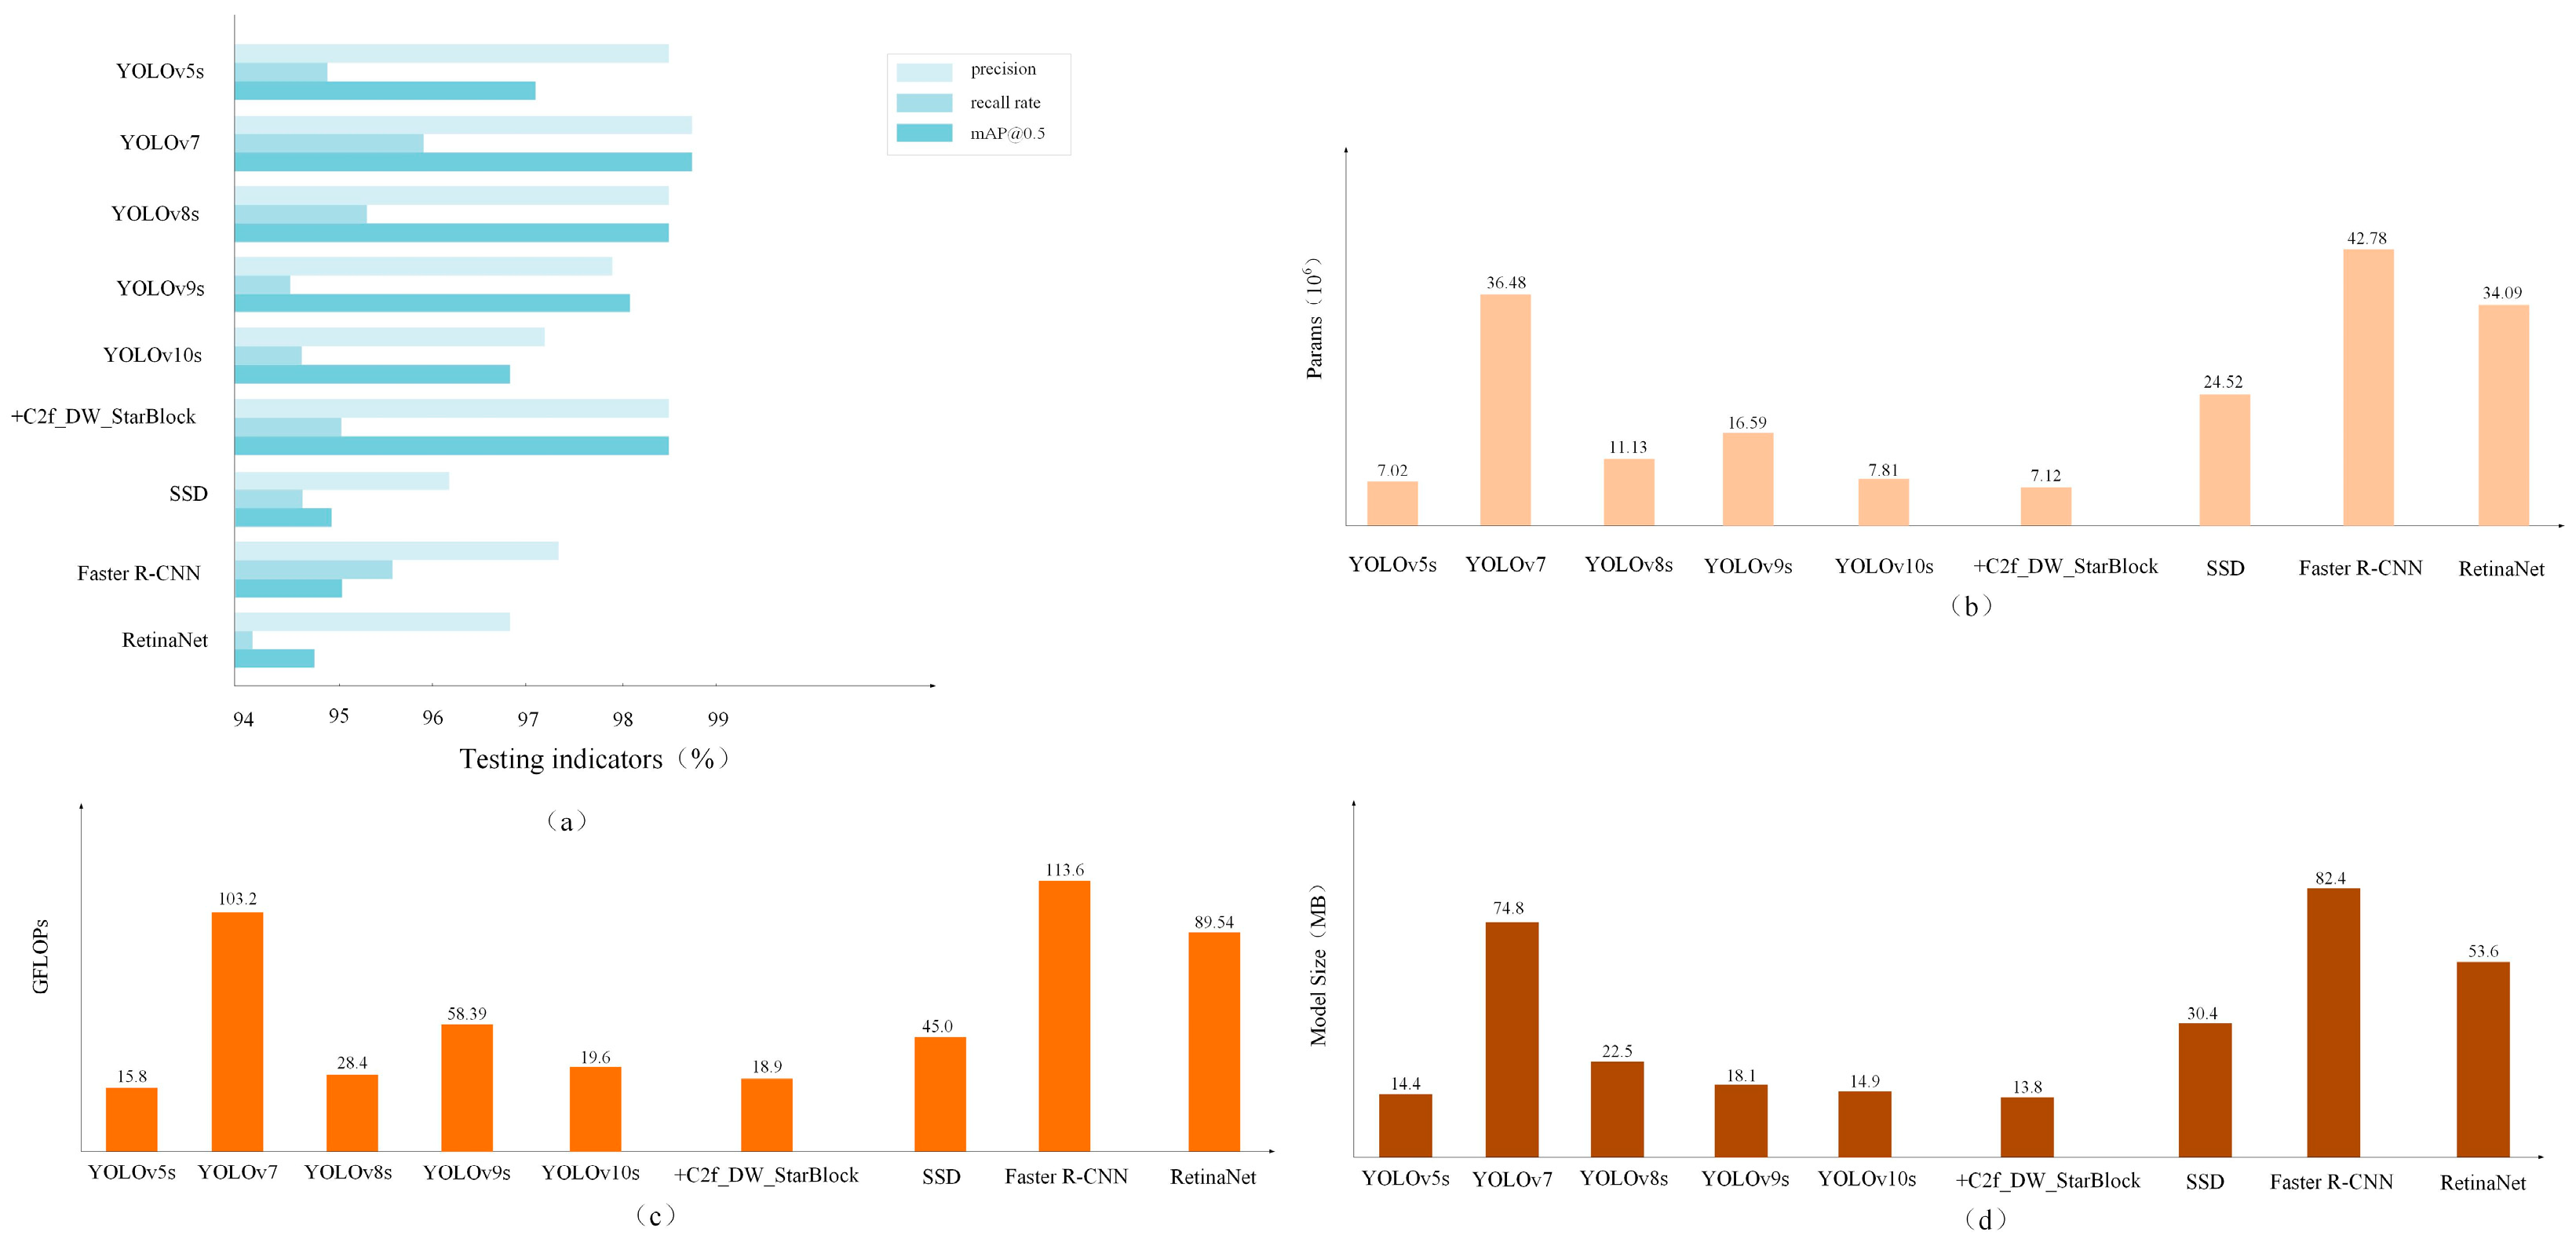
After the model improvement is completed, the current mainstream object detection models are selected for comparison, and a comprehensive evaluation is conducted in terms of precision, recall, mAP@0.5, computation, number of parameters, model size, etc., in order to objectively measure the performance enhancement of the improved model, as shown in Table 2.
As shown in the comparison table, the +C2f_DW_StarBlock model demonstrates significant advantages in terms of lightweight design compared with YOLOv7, YOLOv8s, YOLOv9, and YOLOv10. The model has only 7.12 M parameters, representing a reduction of 80.5% and 36% compared to YOLOv7 (36.48 M) and YOLOv8s (11.13 M), respectively. Compared to YOLOv9s (16.59 M) and YOLOv10s (7.81 M), it achieves a reduction of 57.1% and 8.8%. Its computational cost is only 18.9 GFLOPs, which is 81.7% lower than YOLOv7 (103.2 GFLOPs), 33.45% lower than YOLOv8s (28.4 GFLOPs), 67.6% lower than YOLOv9s (58.39 GFLOPs), and 3.6% lower than YOLOv10s (19.6 GFLOPs). The model size is merely 13.8 MB, reduced by 81.5% compared to YOLOv7 (74.8 MB), 38.67% compared to YOLOv8s (22.5 MB), 23.8% compared to YOLOv9s (18.1 MB), and 7.4% compared to YOLOv10s (14.9 MB), highlighting its remarkable lightweight advantage.
In terms of detection performance, the model achieves 98.5% precision and 98.5% mAP@0.5, which is on par with the best-performing YOLOv7 (precision: 98.7%, mAP@0.5: 98.7%) and surpasses YOLOv9s (precision: 97.9%, mAP@0.5: 98.1%) and YOLOv10s (precision: 97.3%, mAP@0.5: 96.8%). Additionally, its mAP@0.5 shows a 1.4% improvement over YOLOv5s.
Overall, the +C2f_DW_StarBlock model achieves significant optimization in parameters, computation, and model size, while maintaining high detection performance, thus achieving a well-balanced trade-off between lightweight design and accuracy. In addition to the comparison within YOLO-based models, we also evaluated the performance of the proposed model against other mainstream detection algorithms, including SSD, Faster R-CNN, and RetinaNet. The +C2f_DW_StarBlock model achieves higher precision (98.5%) and mAP@0.5 (98.5%) than SSD (precision: 96.2%, mAP: 94.8%), Faster R-CNN (precision: 97.3%, mAP: 95.1%), and RetinaNet (precision: 96.8%, mAP: 94.7%), demonstrating superior detection performance. Moreover, it maintains a much smaller model size (13.8 MB) compared to SSD (30.4 MB), Faster R-CNN (82.4 MB), and RetinaNet (53.6 MB), and significantly lower computational cost (18.9 GFLOPs vs. 45.0, 113.6, and 89.54 GFLOPs, respectively). These results confirm that the proposed model not only excels in accuracy but also exhibits substantial advantages in computational efficiency and model compactness, making it especially suitable for deployment on edge devices in livestock monitoring applications. Visualization results are shown in Figure 14.

4.2. Ablation Experiment

To further validate the effectiveness of the proposed C2f_DW_StarBlock module, we conducted a series of ablation experiments by incrementally introducing the key components—depthwise separable convolution (DWConv) and StarBlock—into the original YOLOv8s architecture. These experiments aimed to isolate the contribution of each component and evaluate their individual and combined impacts on model performance and efficiency. The experimental results are summarized in Table 3.
As shown in Table 3, the original YOLOv8s model achieves high detection performance, with a precision and mAP@0.5 of 98.5%. However, it suffers from relatively large parameter count (11.13 M), high computational complexity (28.4 GFLOPs), and a sizeable model size (22.5 MB), which pose challenges for deployment on resource-constrained devices. Introducing either DWConv or StarBlock individually leads to noticeable reductions in parameters and computation, but with a slight drop in detection accuracy, indicating that neither component alone can fully balance efficiency and performance. In contrast, the full integration of the proposed C2f_DW_StarBlock module maintains the original accuracy (98.5%) while significantly reducing the parameter count to 7.12 M, the computational cost to 18.9 GFLOPs, and the model size to 13.8 MB. This clearly demonstrates the effectiveness of the combined module in achieving a superior trade-off between accuracy and lightweight design.

4.3. Binocular Stereo Vision Ranging Accuracy Analysis

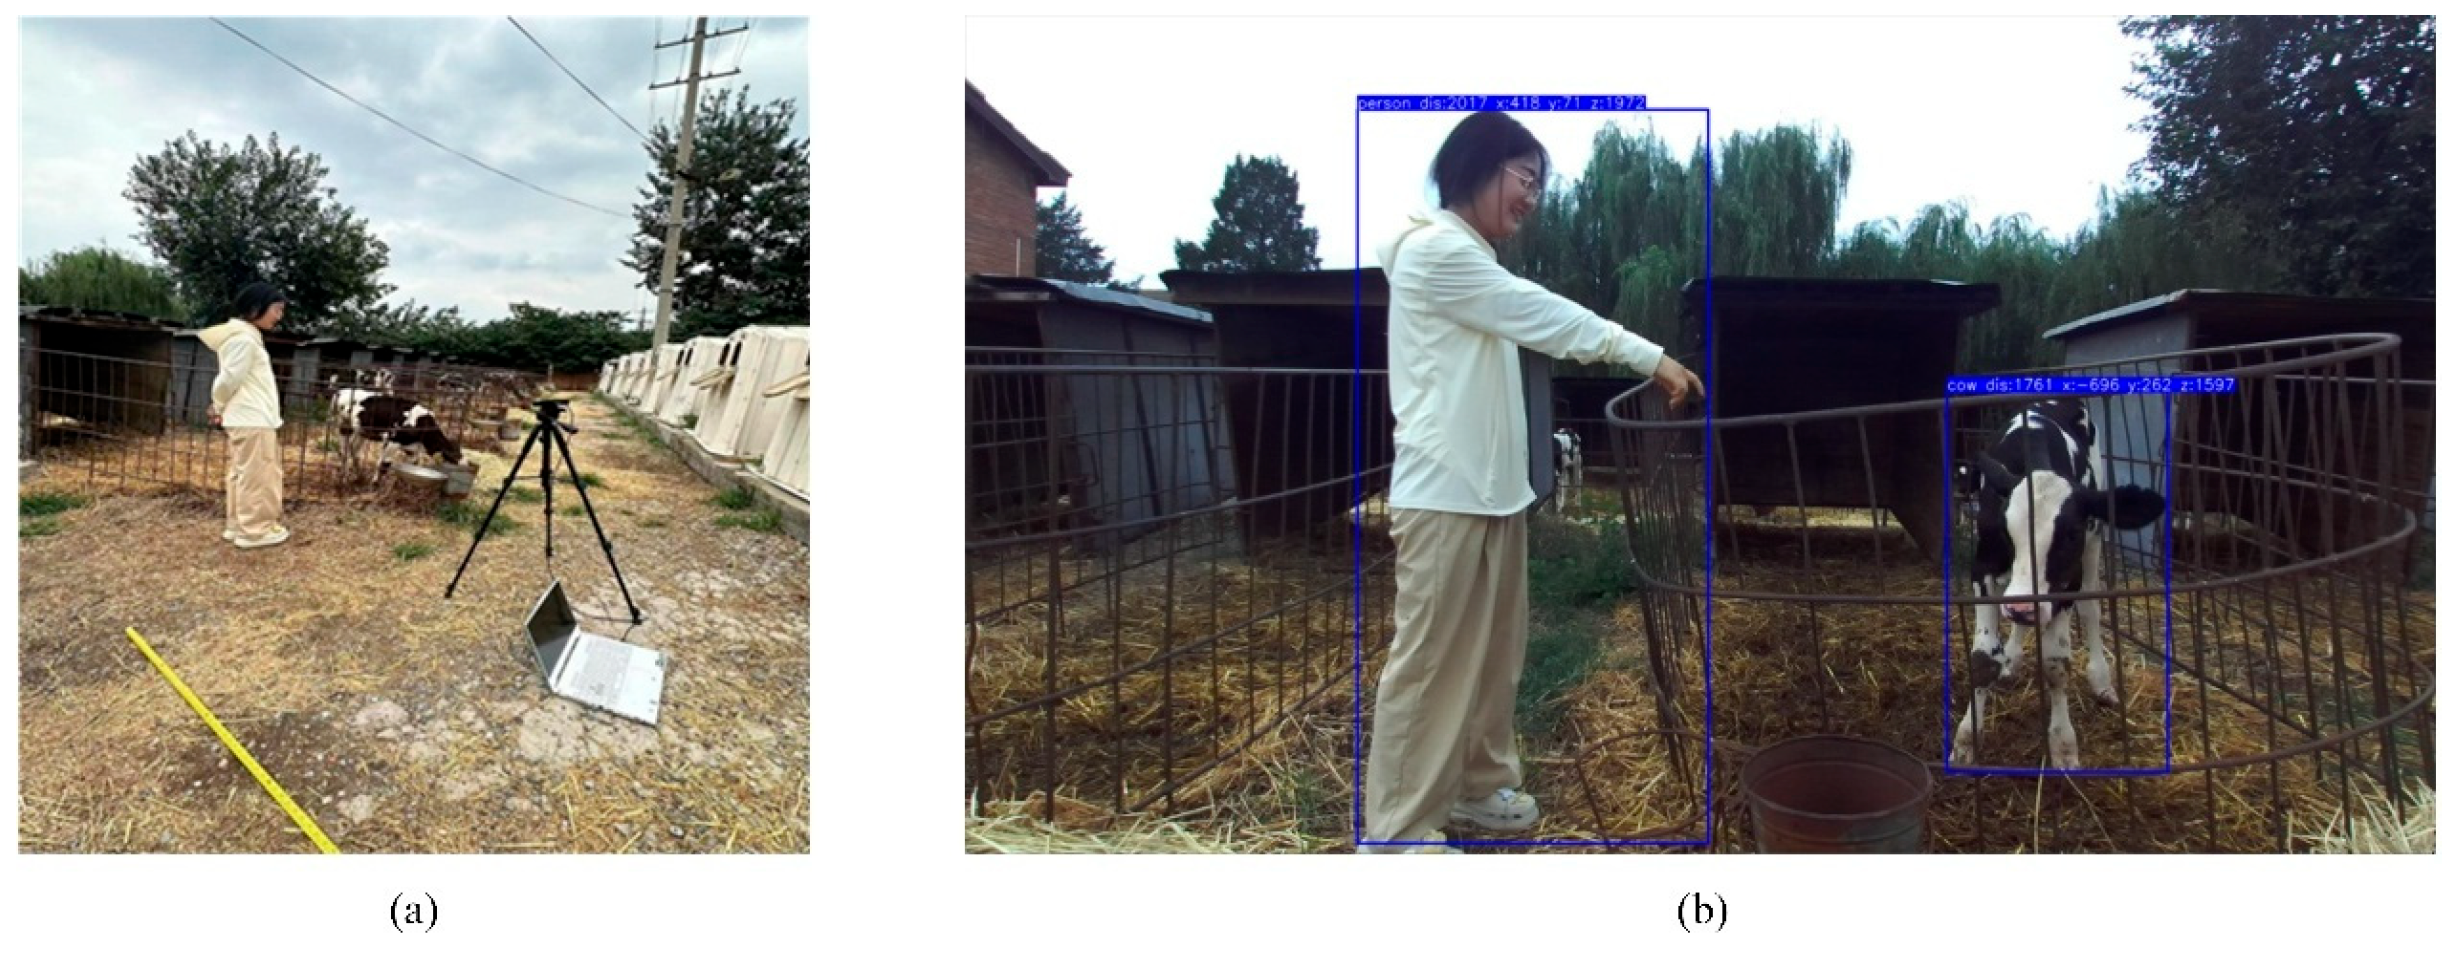
The ZED2i camera was selected for this test, which operates within a range of 0.5 m to 20 m. The primary objective of the test was to evaluate the accuracy of the camera in localizing targets within its field of view at this range. During the experiment, distance measurements and accuracy tests were performed on cattle and pedestrians that could be recognized within the ZED2i camera’s field of view. To ensure the comprehensiveness of the experiment, the measurements included cattle and pedestrians positioned at various distances. The results are shown in Figure 15.
The experimental site was located at the dairy farm of the China Agricultural Machinery Experiment Station, affiliated with the China Agricultural Machinery Institute (CAMEI), in Changping District, Beijing, to test the positioning accuracy of cows and pedestrians in the farm. During the experiment, a bracket was used to fix the ZED camera at a specified position, and several points were randomly selected in the cattle farm for testing. The positioning model was run in a Python (version 3.9.13) environment on a Windows system, and five targets were selected for measurement one by one based on the targets identified by the model. To analyze the performance of the model in different distance ranges in greater detail, the test distances were divided into four intervals: 0.5–5 m, 5–10 m, 10–15 m, and 15–20 m. The true distances were recorded alongside the model’s measured distances. The true distance was used as a benchmark value to compare against the model’s measurements and calculate the model error. The experimental comparison results are shown in Table 4.
From Table 4, it can be observed that, at short distances (0.5–10 m), the measurement accuracy is high, with the error ratio ranging from 0.08% to 1.6%. At medium distances (10–15 m), the error ratio increases slightly but remains below 1.5%, demonstrating good stability. At long distances (15–20 m), although the error increases, the maximum error ratio is 4.41%, which is still within the acceptable range. The model performs well at short to medium distances and provides effective measurement data even at long distances, making it suitable for a variety of practical measurement scenarios.

4.4. Targeting Model Accuracy Analysis

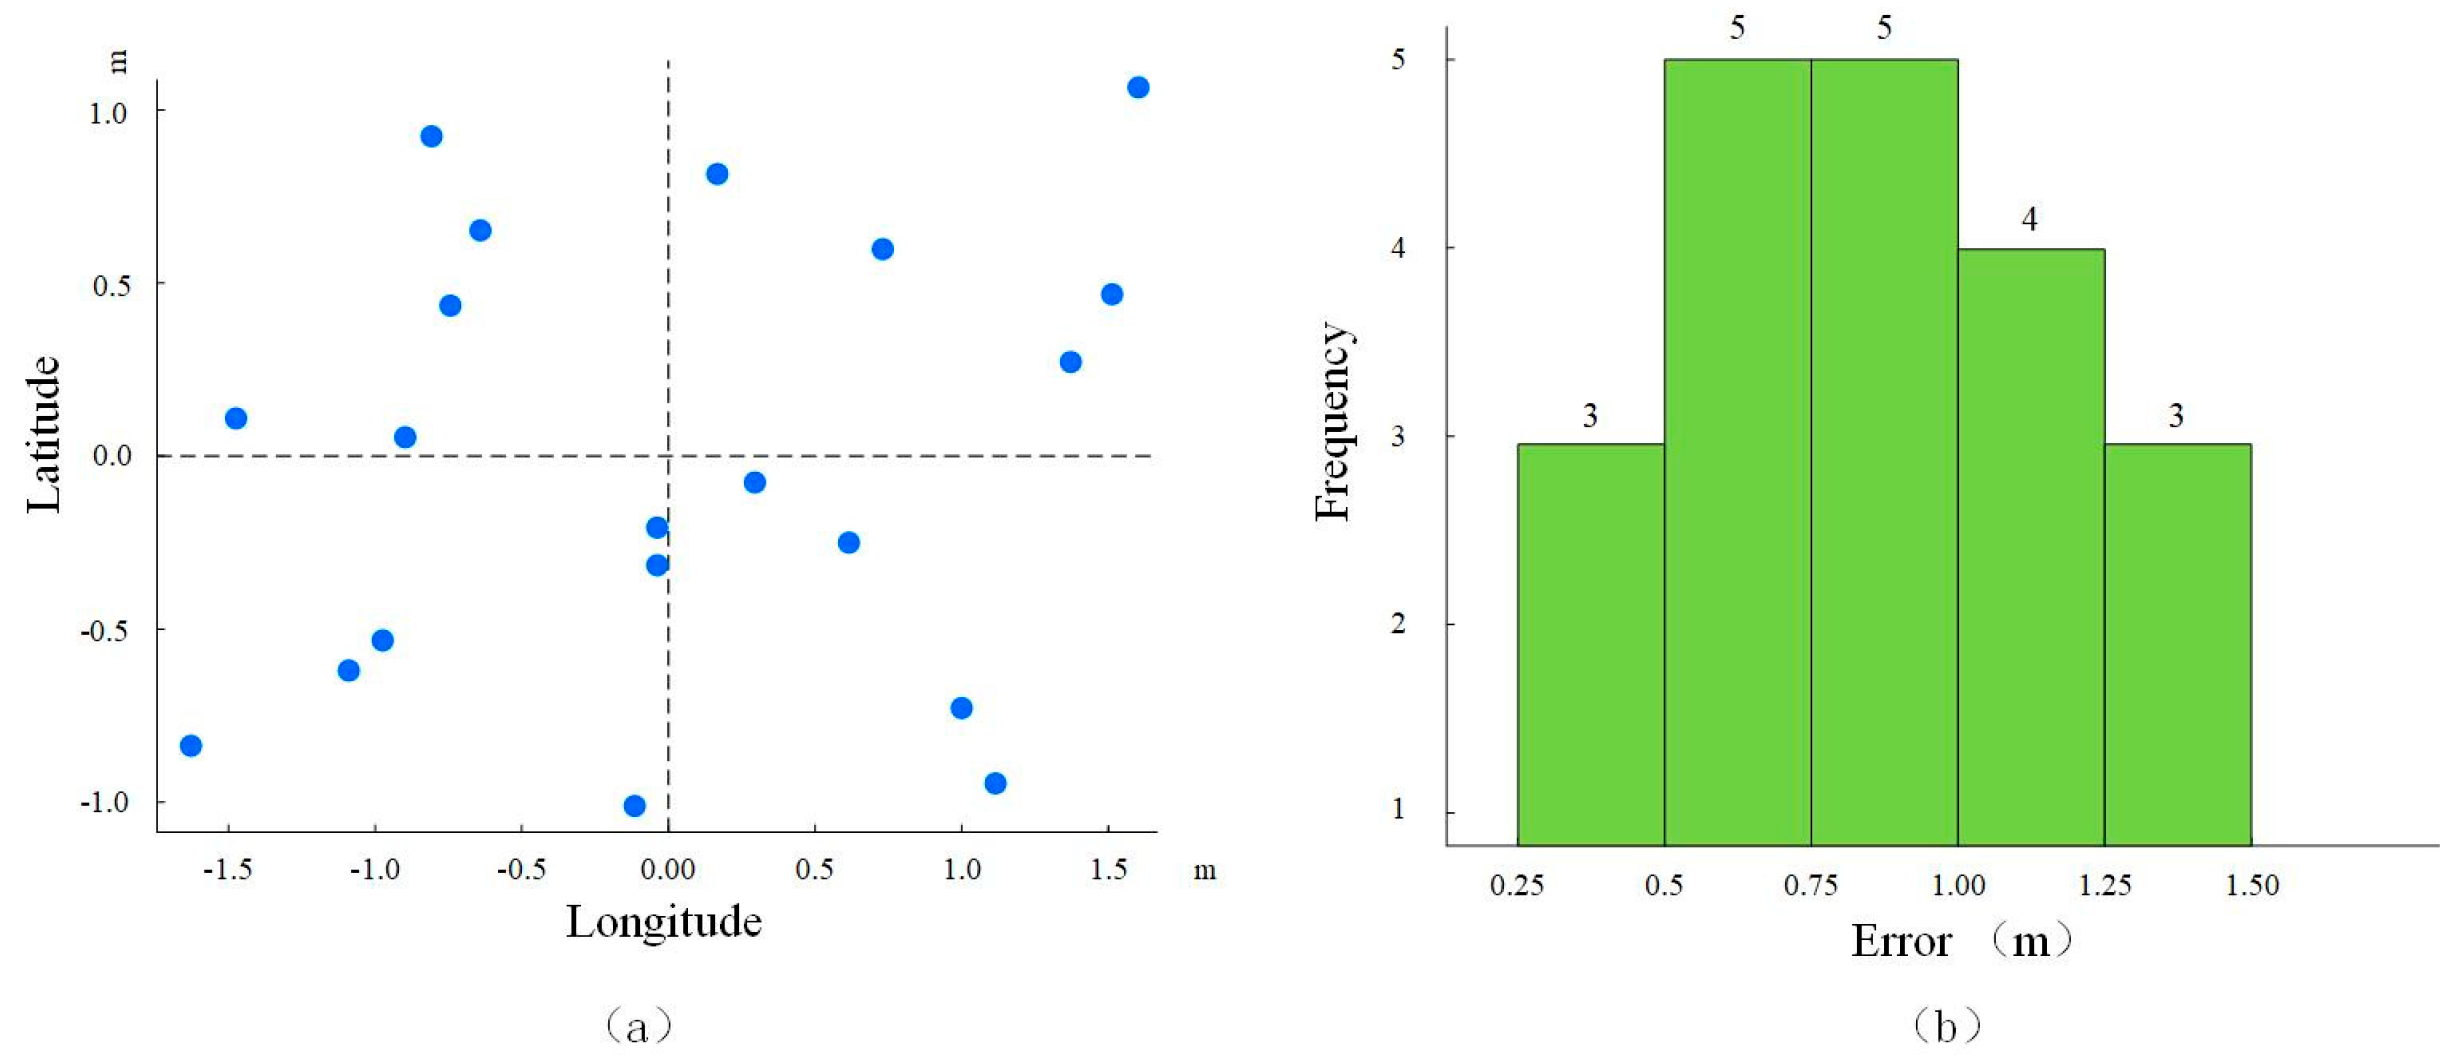
To evaluate the positioning stability and accuracy of the model, this study conducts multiple repeated measurement experiments on the same target after fusing GPS and IMU data. Based on the collected results, the spatial offset of each measurement relative to the average value is calculated. An error scatter plot and error histogram are generated, as shown in Figure 16. The visualized distributions in the figure intuitively reveal the concentration trend and dispersion degree of the system error, allowing for a more comprehensive assessment of the actual performance of the positioning system.
The error scatter plot in the figure shows the spatial distribution of each measurement point relative to the average position, and it can be seen that most of the sample points are distributed in the direction of longitude and latitude within the range of ±1 m, which shows a relatively uniform and no obvious offset state. Combined with the error histogram on the right side, it can be further observed that most of the errors are concentrated in the range of 0.5 m to 1.0 m, of which the proportion of samples with errors within 1.5 m is more than 95%, indicating that the model has strong robustness and consistency.
Combining the image results with the standard deviation calculation values (about 1.02 m for latitude and 1.10 m for longitude), it can be concluded that the present model significantly improves the localization accuracy and stability after fusing the multi-source information from GPS, IMU, and visual detection, and can meet the demand of dynamic target localization in complex environments.

4.5. Model Smart Equipment Porting Test Analysis

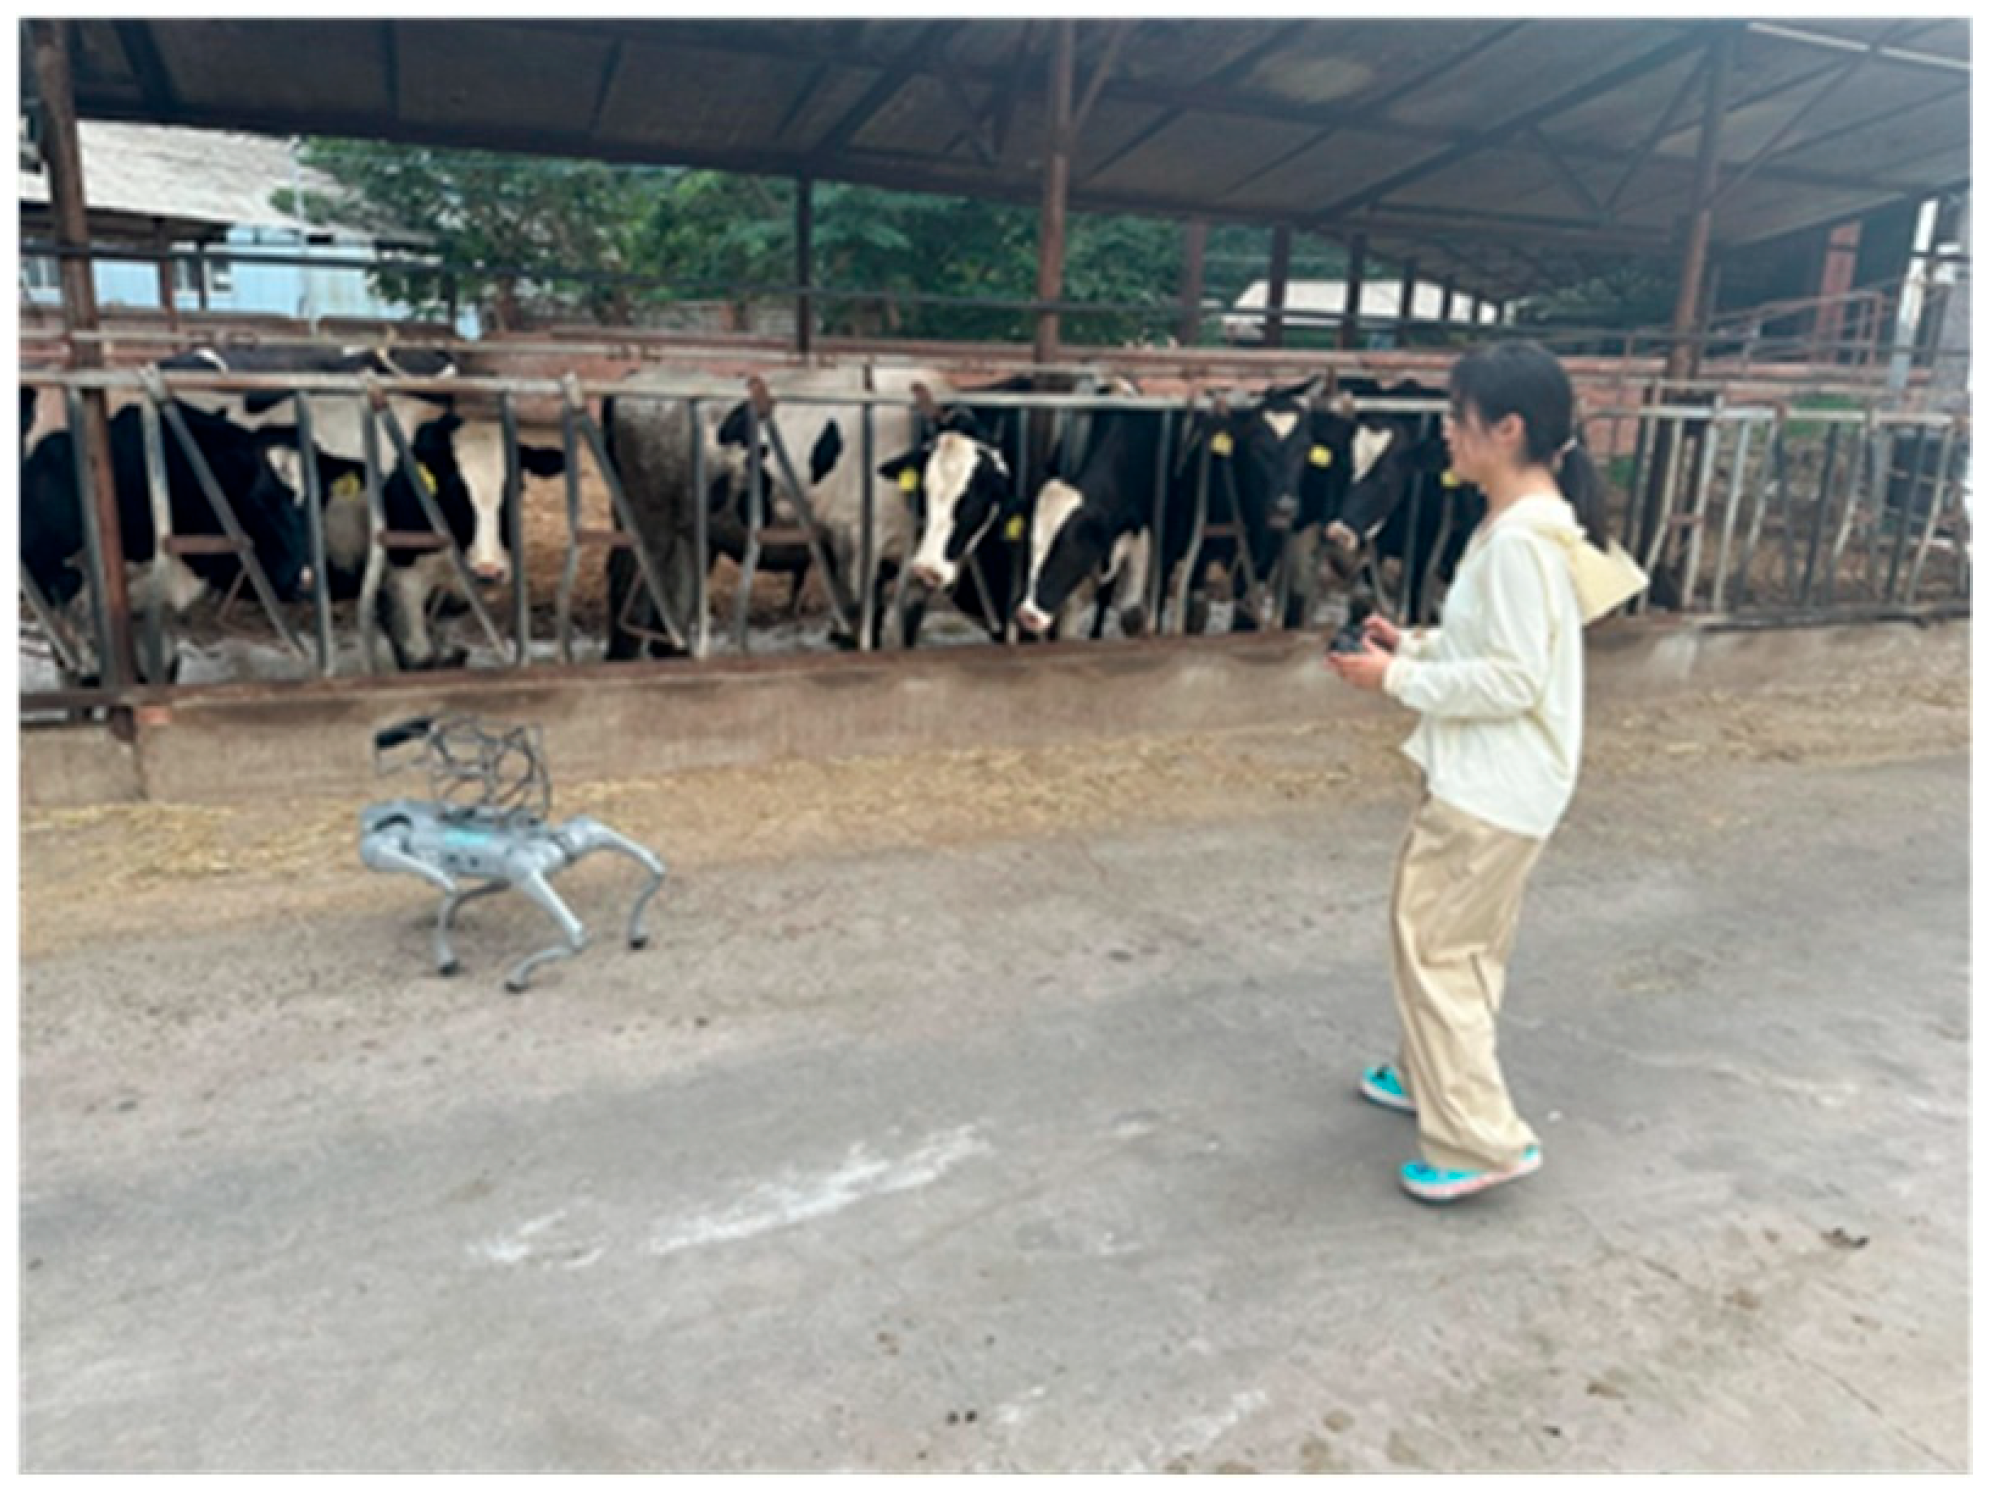
The model was successfully deployed to the ROS system after training and optimization, and was tested in real scenarios. The field test is shown in Figure 17.
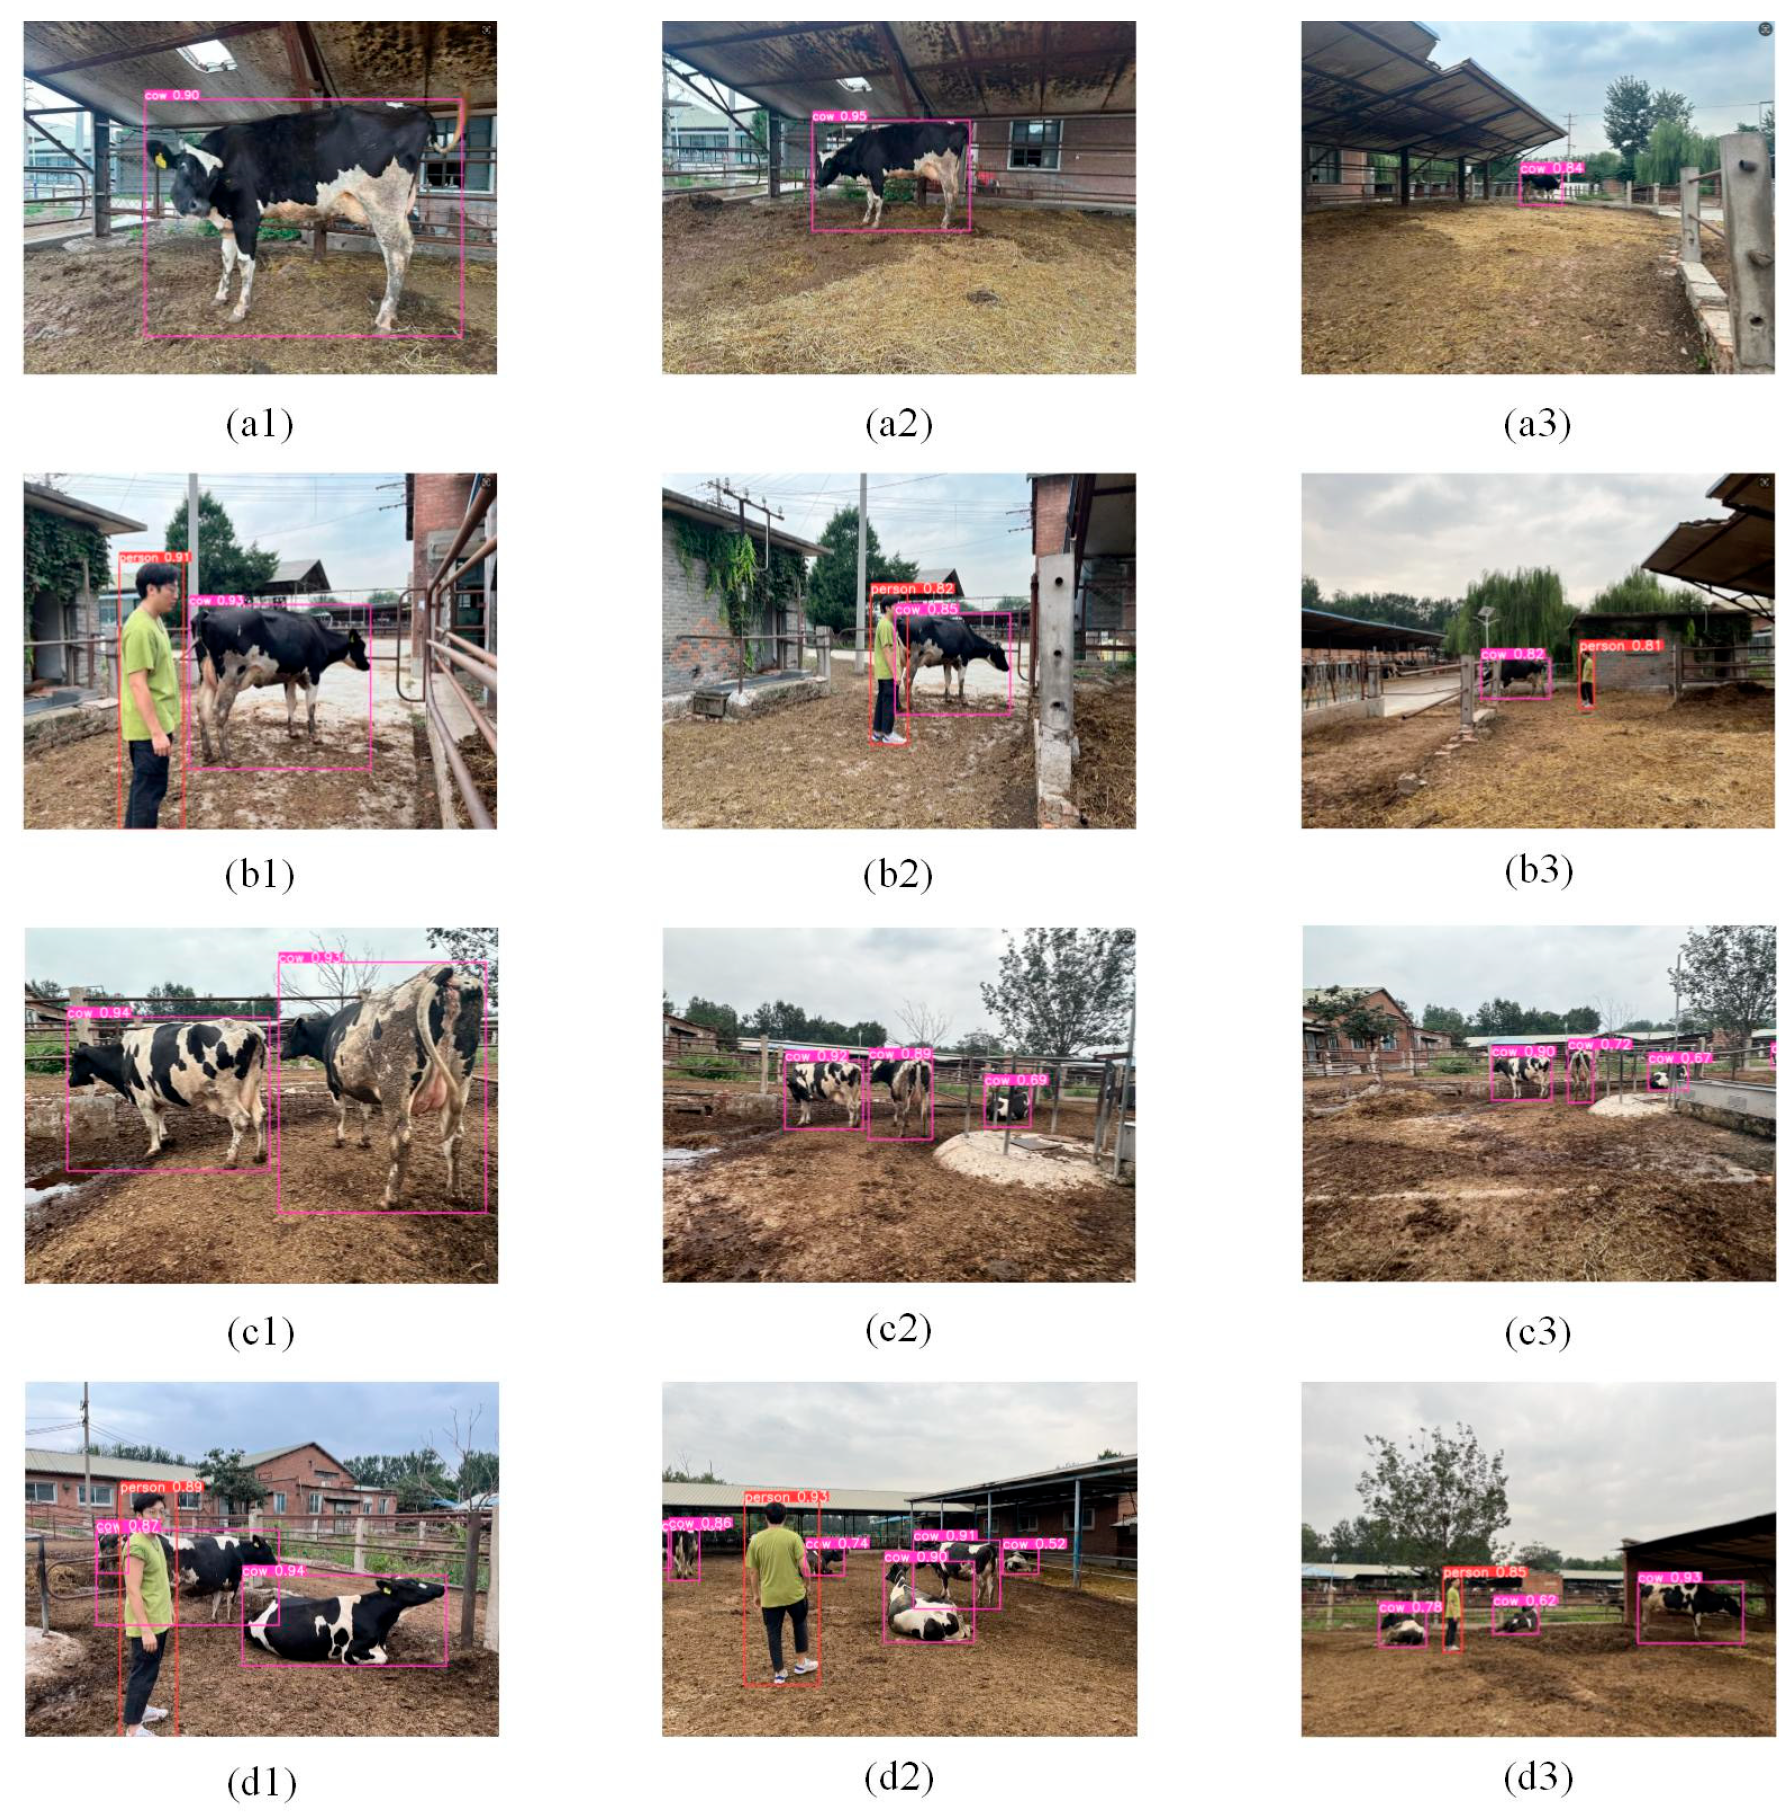
After completing the model transplantation, it was tested in real scenarios in multiple dimensions to verify the model’s object detection ability under different complex conditions. The results are shown in Figure 18.
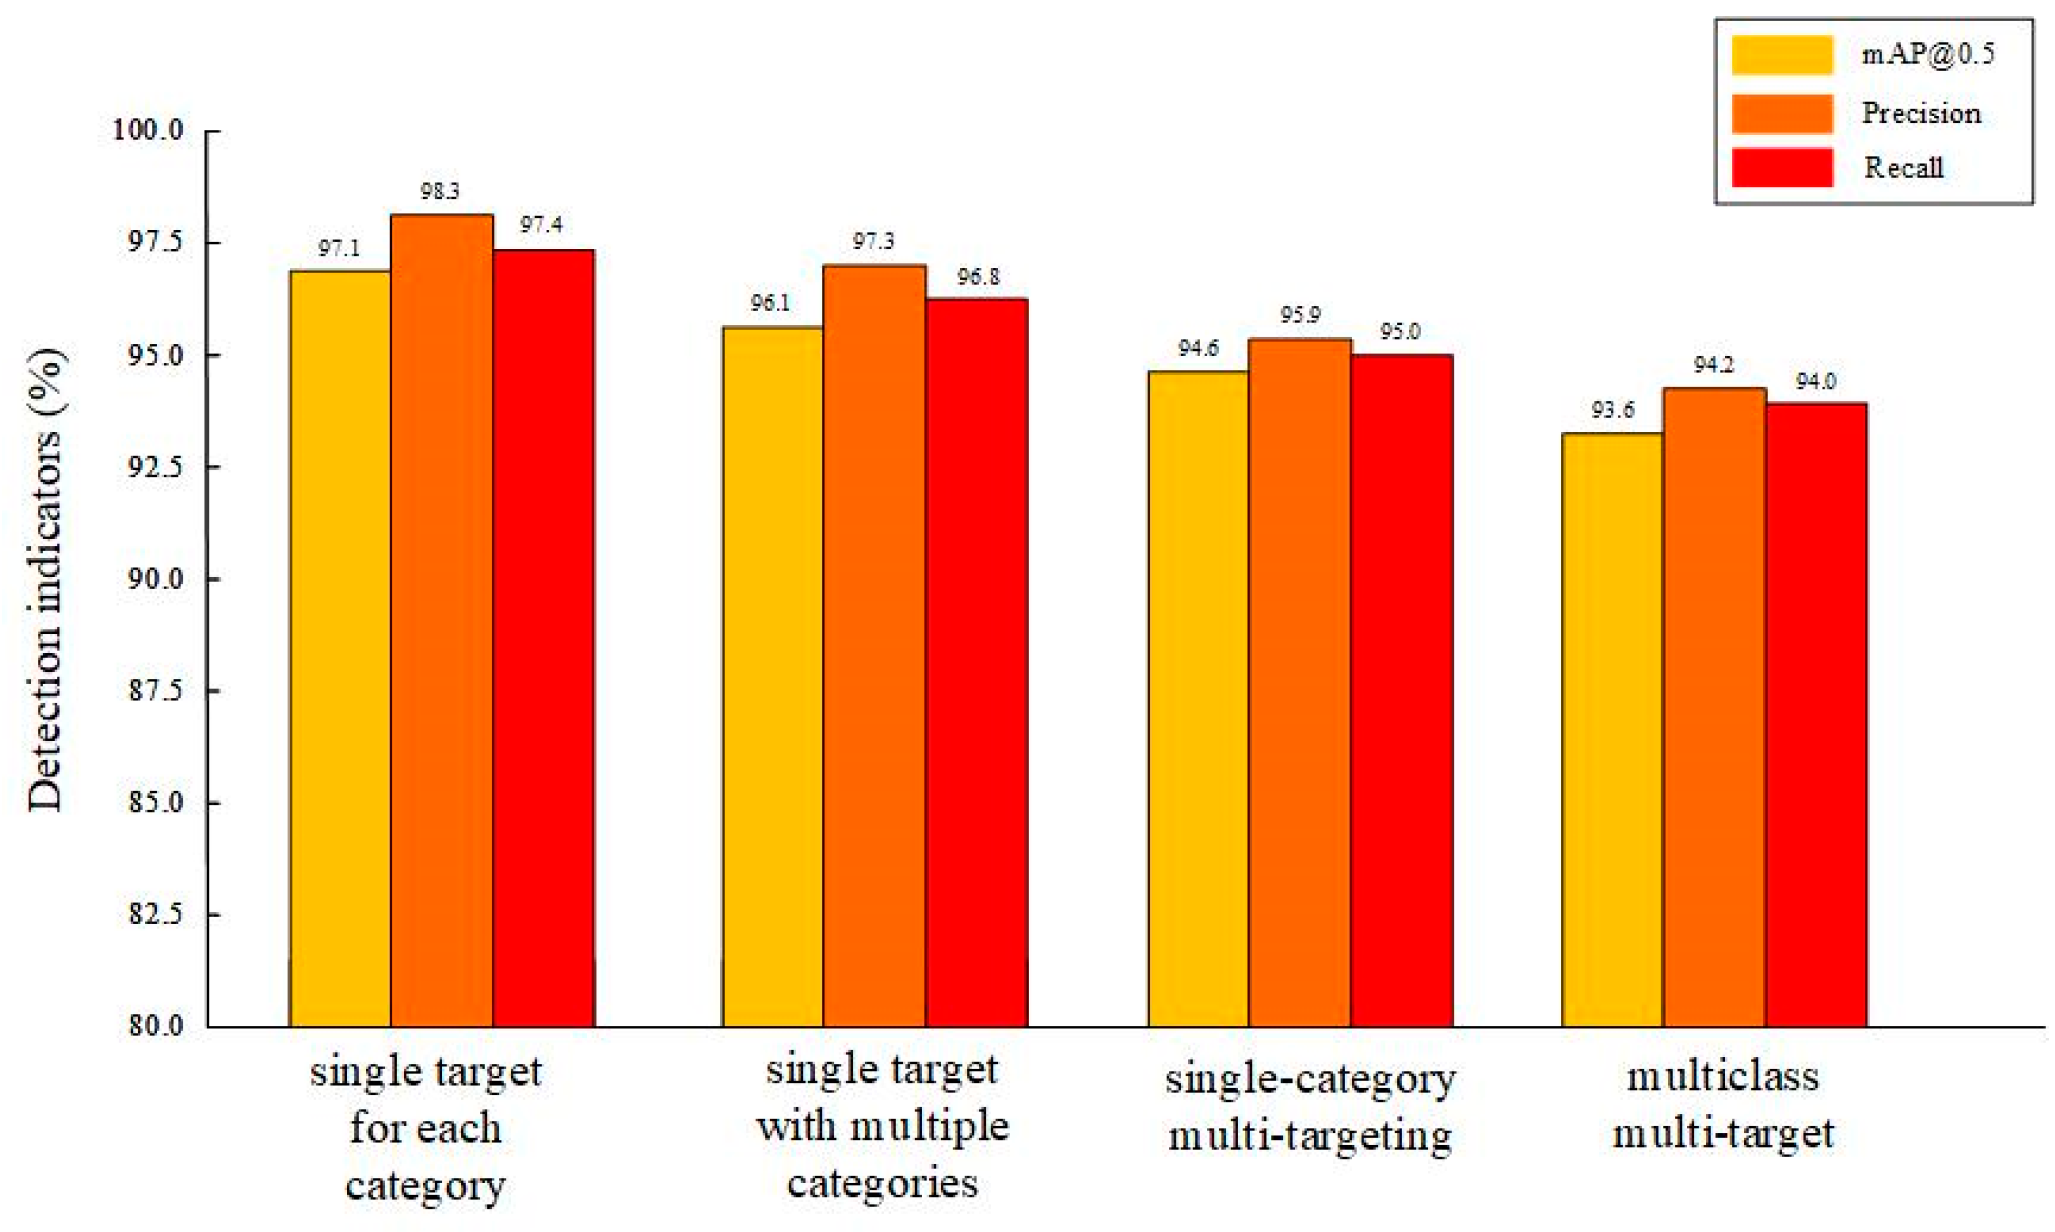
In the field test, the model shows good detection performance in different scenarios. In the single-class single-target scenario, mAP@0.5, precision, and recall reach 97.1%, 98.3%, and 97.4%, respectively, indicating that the model has high accuracy and stability in recognizing a clear single target; in the multi-class single-target scenario, the three indexes are 96.1%, 97.3%, and 96.8%, respectively, and the model is able to distinguish between different classes of targets better. In the single-class multi-target scenario, mAP@0.5 is 94.6%, and precision and recall are 95.9% and 95.9%, respectively. In the single-class multi-target scenario, mAP@0.5 is 94.6%, and precision and recall are 95.9% and 95.0% respectively, which indicates that the model has good multi-target recognition ability; in the most complex multi-class multi-target scenario, the model still maintains the high performance of 93.6%, 94.2%, and 94.0%, which reflects the model’s robustness under the interference factors such as target occlusion, overlapping, and other interference factors. This shows the robustness of the model under the interference factors such as target occlusion and overlapping, as shown in Figure 19.
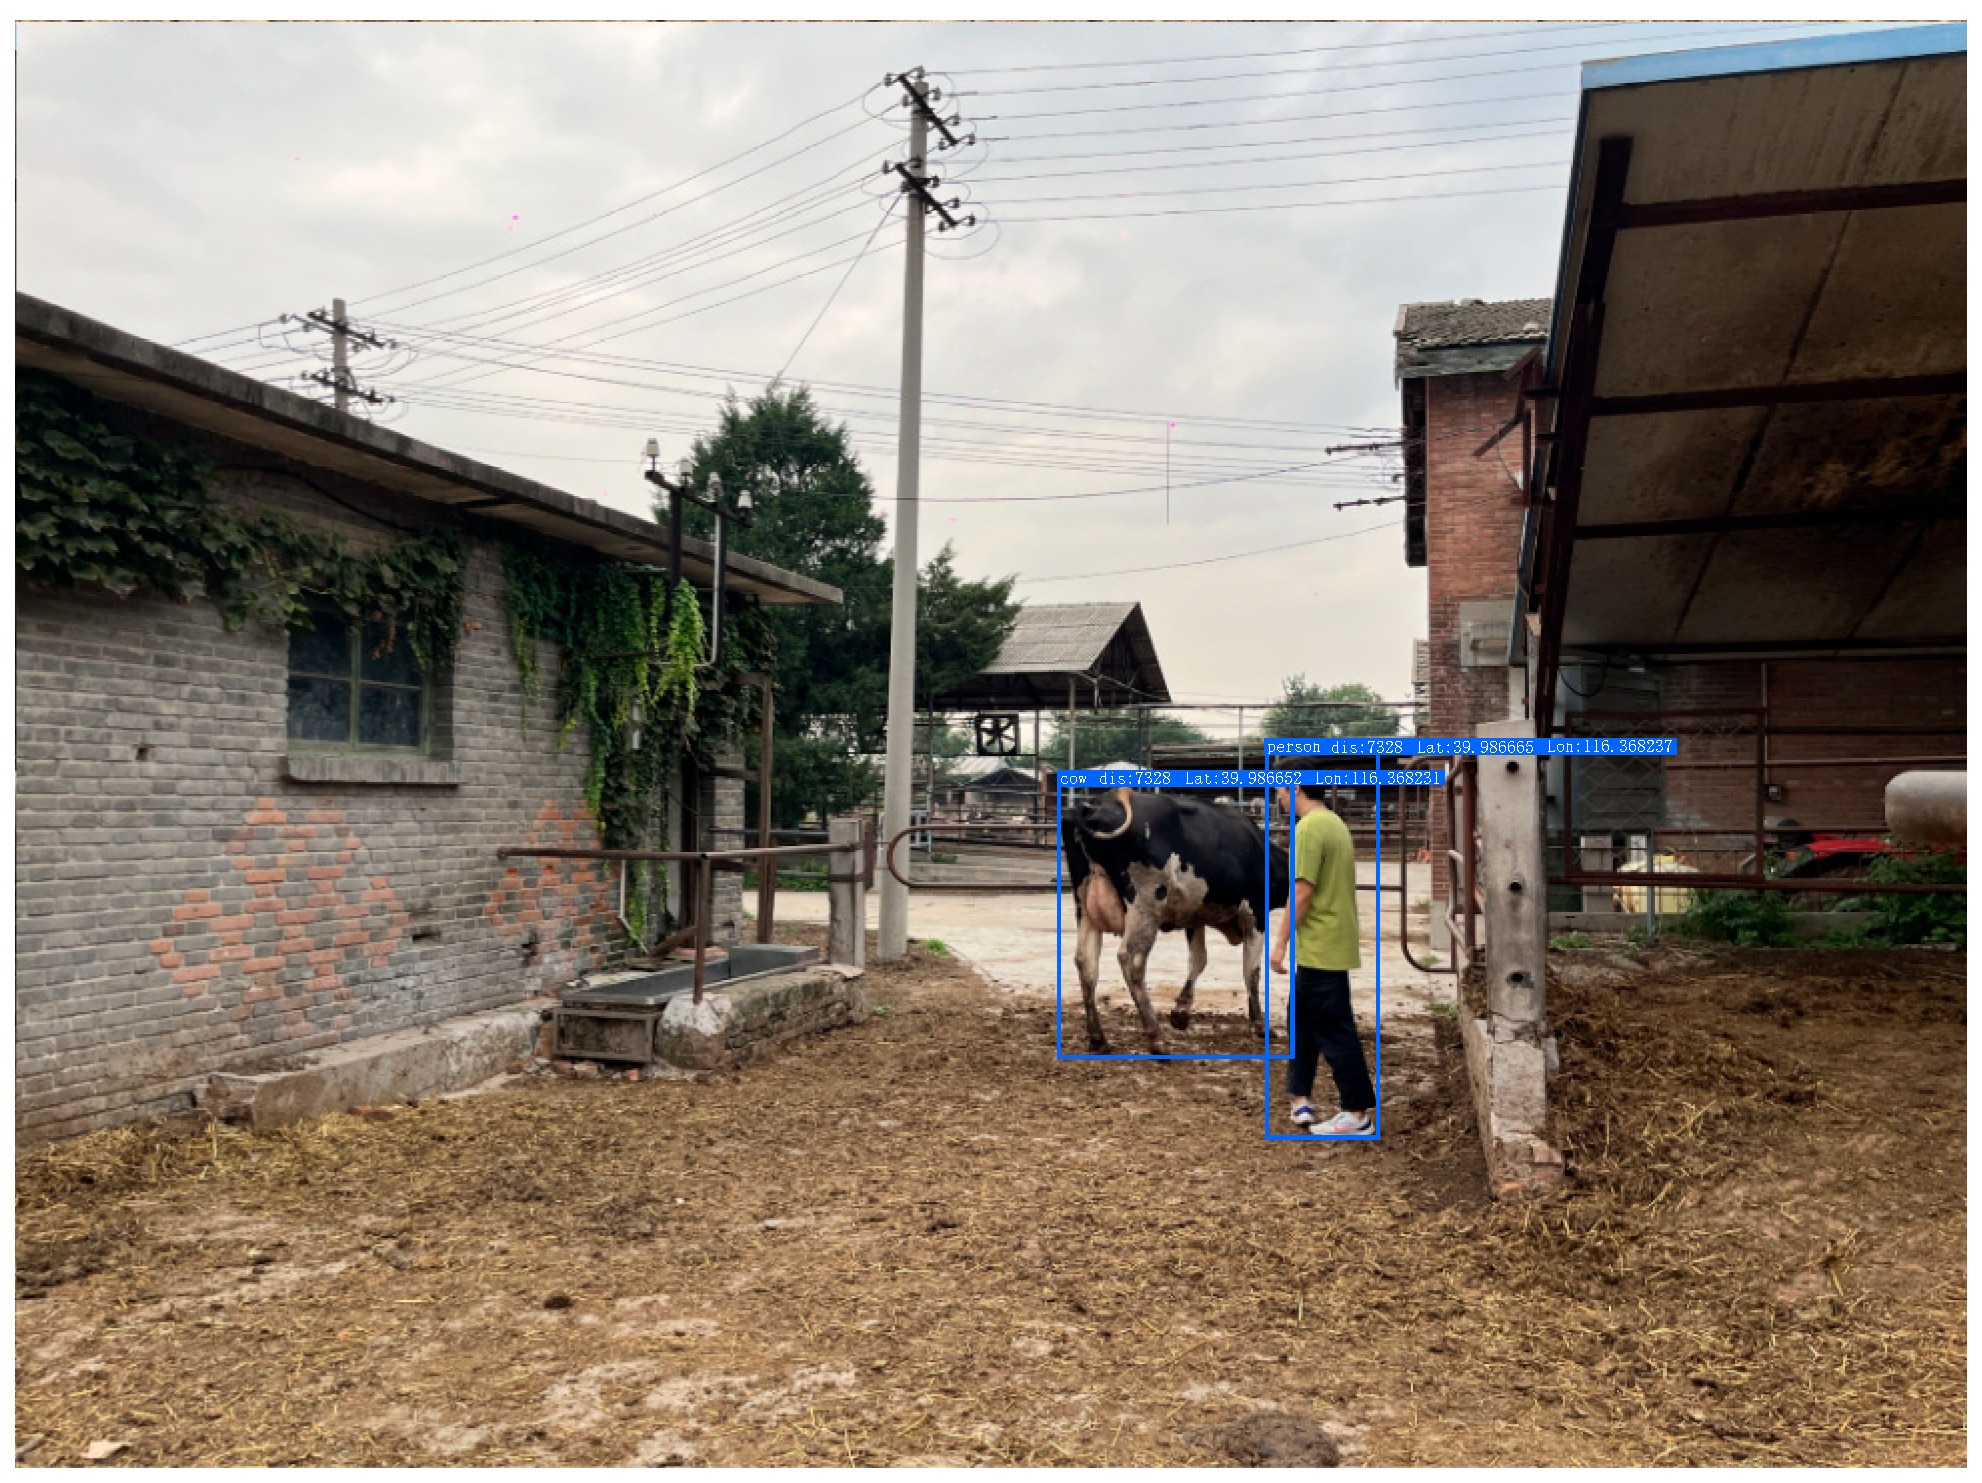
After completing the multi-model fusion and ROS platform deployment, this system has realized the real-time detection and spatial localization function of the target. As shown in Figure 20, the model can stably identify and frame the specified target in the actual farm environment, and output the corresponding latitude and longitude information synchronously. The statistical results of the field test show that the average value of the model’s detection confidence in multiple inference can reach 0.93, and the average processing delay is only 0.032 sec/frame, demonstrating high real-time performance and accuracy and verifying the potential of the system to be applied in complex scenarios.
In addition, compared with the traditional target recognition means based on contact devices such as collars, the system proposed in this study has the significant advantages that one set of equipment can continuously detect multiple dynamic targets at the same time and is non-contact, lightweight, and easy to maintain. Compared with traditional contact solutions such as collars, this system realizes the continuous identification and localization of multiple dynamic targets at the same moment with a non-contact and lightweight architecture, which has significant advantages in terms of equipment maintenance, adaptability, and animal welfare, and provides a more cost-effective and efficient intelligent monitoring path for large-scale breeding scenarios.

5. Discussion

A lightweight non-contact object detection and localization method based on improved YOLOv8s algorithm and binocular vision fusion is constructed around the practical needs of dynamic object detection and localization in large-scale cattle farms. Through field deployment and experimental evaluation, the system shows good performance in terms of model accuracy, computational efficiency, ranging error, and localization stability, which verifies the feasibility and practicability of the method in smart ranch scenarios.
From the technical path, the proposed improved model of YOLOv8s realizes a 36.03% reduction in model parameters, a 33.45% reduction in computational complexity, and a 38.67% reduction in model volume by introducing the C2f_DW_StarBlock module, while keeping the detection accuracy unchanged. This is a significant advantage in real edge device deployment. In comparison with the performance of Myat Noe et al. (2025) [32] in a multi-camera YOLOv8 cattle-only tracking study, this study further improves the efficiency of the model’s operation on resource-constrained platforms (e.g., inspection robots) and reduces the deployment cost. In terms of target recognition and ranging, the binocular vision ranging model constructed in this paper can achieve high-precision measurements in the range of 0.5–20 m, with the short–medium distance error controlled within 1.5% and the maximum error of 4.41%. This result outperforms the accuracy performance of Sohan et al. (2024) [44], who used YOLOv5 with a monocular camera solution in pig house object detection, and also circumvents the problems of high equipment cost, energy consumption, and the complex operation and maintenance of LiDAR-based methods (e.g., Reger et al., 2022 [15]). In addition, through GPS and IMU data fusion positioning, the system can output stable target latitude and longitude information in dynamic scenes, and the standard deviation of measurement is controlled on the order of 1 m, which meets the needs of daily inspection, health monitoring and behavior management.
Compared with contact devices such as collars and RFIDs, which are commonly used at home and abroad, this study has multiple advantages of being non-contact, easy to deploy, and easy to maintain. Traditional contact devices are usually configured in a one-to-one configuration, which does not allow for the simultaneous monitoring of multiple targets and suffers from inconveniences of wearing, battery life limitation, and animal stress (e.g., Agouridis et al., 2003 [45]; Ruiz-Garcia et al., 2011 [14]). In this study, the continuous identification and localization of multiple dynamic targets, such as cattle and pedestrians, can be achieved without disturbing the animals, which is more suitable for the dual requirements of “cost reduction and efficiency” and animal welfare in the current smart ranch management.
However, this technology still presents some limitations and areas for improvement. We recognize that the current system validation was conducted on a single cattle farm, which may restrict the generalization capability of the proposed model across diverse ranch environments. Although our dataset incorporates variations in lighting, weather, animal growth stages, and target quantity, it does not fully capture the diversity of real-world deployment scenarios, such as differences in geographic terrain, facility layout, and livestock management practices. To address this limitation, we plan to carry out broader validation experiments in future studies. These will involve testing on multiple cattle farms with varying structural and operational characteristics (e.g., open pastures vs. confined barns), and under more complex environmental conditions, including rain, snow, and nighttime scenes. In addition, we will assess the system’s performance across different hardware platforms and computational resource constraints to evaluate its adaptability and robustness. These extended trials are expected to improve the system’s applicability in diversified intelligent farming scenarios.
Moreover, the system shows a noticeable increase in depth estimation error at long distances (15–20 m). This issue is mainly caused by the short baseline of the binocular camera, which results in insufficient disparity for accurate triangulation at greater ranges. The limited resolution of the camera further constrains localization accuracy, especially when the target occupies only a small number of pixels in the image. Environmental factors such as lighting variation, background complexity, and occlusions can further impact feature extraction and matching quality. To overcome these challenges, we consider the following improvements: (1) employing binocular or multi-camera systems with longer baselines to enhance long-range disparity estimation; (2) using higher-resolution sensors or super-resolution reconstruction to preserve distant target details; and (3) fusing auxiliary positioning systems such as RTK GPS or lightweight LiDAR to calibrate and support vision-based ranging. These measures are anticipated to significantly reduce depth errors at long range and improve the robustness of the localization module under complex conditions.

6. Conclusions

In this paper, for the real-time detection and localization needs of dynamic targets such as cows and pedestrians on large-scale cattle farms, a lightweight non-contact detection and localization method integrating binocular stereo vision and improved YOLOv8s algorithm is proposed. In terms of model construction, the C2f_DW_StarBlock module is designed and embedded into the YOLOv8s structure, which realizes a 36.03% reduction in model parameters, 33.45% reduction in computational complexity, and 38.67% reduction in model volume compared with YOLOv8s without reducing the detection accuracy. In the localization process, by integrating the ZED2i binocular vision system with GPS and IMU multimodal data, the system achieves high-precision ranging within the range of 0.5–20 m, with the maximum error controlled within 4.41%; the standard deviation of latitude and longitude localization is around 1.1 m, showing strong robustness and stability. Finally, the overall system is successfully deployed on the ROS platform, and the field test verifies the real-time practicality of the model.
The non-contact, lightweight multi-object detection and localization scheme proposed in this research breaks through the high cost, poor adaptation, difficult maintenance, and other limitations of traditional collars, RFID, and other contact means in the intelligent application of cattle farms. It possesses the significant advantages of the simultaneous monitoring of multiple targets, flexible deployment, and convenient operation and maintenance. The research results can provide technical support for health monitoring, inspection management, and precision grazing in the intelligent ranch, and also provide a feasible path for the application of lightweight detection models in intelligent agricultural equipment. Follow-up research can further expand the dataset under multi-time and multi-environment conditions to enhance the generalization ability and cross-scene adaptability of the model.

Author Contributions

Conceptualization, S.L. and W.S.; Methodology, S.L.; Software, S.L.; Validation, S.L., S.C., and P.W.; Formal analysis, S.L.; Investigation, S.L.; Resources, F.K.; Data curation, S.L.; Writing—original draft preparation, S.L.; Writing—review and editing, S.C. and W.S.; Visualization, P.W.; Supervision, W.S. and F.K.; Project administration, W.S.; Funding acquisition, F.K. All authors have read and agreed to the published version of the manuscript.

Funding

This work was supported by the National Key R&D Program of China (Grant No. 2024YFD2000305), the Key R&D Project of Jilin Province (Grant No. 20240303079NC), and the Leading Talent Support Program of the Agricultural Science and Technology Elite Program of the Chinese Academy of Agricultural Sciences (Grant No. 10-IAED-RC-09-2024).

Institutional Review Board Statement

Not applicable.

Data Availability Statement

The data supporting the findings of this study are available upon request from the readers.

Acknowledgments

The authors would like to thank the Beijing Agricultural Machinery Experiment Station for providing access to the dairy farm and technical support during the data collection process.

Conflicts of Interest

The authors declare no conflicts of interest.

References

  1. Pivoto, D.; Waquil, P.D.; Talamini, E.; Finocchio, C.P.S.; Dalla Corte, V.F.; de Vargas Mores, G. Scientific development of smart farming technologies and their application in Brazil. Inf. Process. Agric. 2018, 5, 21–32. [Google Scholar] [CrossRef]
  2. Mishra, S. Internet of things enabled deep learning methods using unmanned aerial vehicles enabled integrated farm management. Heliyon 2023, 9, e18659. [Google Scholar] [CrossRef] [PubMed]
  3. Jiang, B.; Tang, W.; Cui, L.; Deng, X. Precision livestock farming research: A global scientometric review. Animals 2023, 13, 2096. [Google Scholar] [CrossRef]
  4. Dayoub, M.; Shnaigat, S.; Tarawneh, R.A.; Al-Yacoub, A.N.; Al-Barakeh, F.; Al-Najjar, K. Enhancing animal production through smart agriculture: Possibilities, hurdles, resolutions, and advantages. Ruminants 2024, 4, 22–46. [Google Scholar] [CrossRef]
  5. García, R.; Jiménez, M.; Aguilar, J. A multi-objective optimization model to maximize cattle weight-gain in rotational grazing. Int. J. Inf. Technol. 2024, 1–12. [Google Scholar] [CrossRef]
  6. Su, J.; Tan, B.e.; Jiang, Z.; Wu, D.; Nyachoti, C.; Kim, S.W.; Yin, Y.; Wang, J. Accelerating precision feeding with the internet of things for livestock: From concept to implementation. Sci. Bull. 2024, 69, 2156–2160. [Google Scholar] [CrossRef]
  7. Denis, L.; Tembo, M.D.; Manda, M.; Wilondja, A.; Ndong, N.; Kimeli, J.K.; Phionah, N. Leveraging Geospatial Technologies for Resource Optimization in Livestock Management. J. Geosci. Environ. Prot. 2024, 12, 287–307. [Google Scholar] [CrossRef]
  8. Swain, S.; Pattnayak, B.K.; Mohanty, M.N.; Jayasingh, S.K.; Patra, K.J.; Panda, C. Smart livestock management: Integrating IoT for cattle health diagnosis and disease prediction through machine learning. Indones. J. Electr. Eng. Comput. Sci. 2024, 34, 1192–1203. [Google Scholar] [CrossRef]
  9. Luo, W.; Zhang, G.; Yuan, Q.; Zhao, Y.; Chen, H.; Zhou, J.; Meng, Z.; Wang, F.; Li, L.; Liu, J. High-precision tracking and positioning for monitoring Holstein cattle. PLoS ONE 2024, 19, e0302277. [Google Scholar] [CrossRef]
  10. Rahman, A.; Smith, D.; Little, B.; Ingham, A.; Greenwood, P.; Bishop-Hurley, G. Cattle behaviour classification from collar, halter, and ear tag sensors. Inf. Process. Agric. 2018, 5, 124–133. [Google Scholar] [CrossRef]
  11. Huhtala, A.; Suhonen, K.; Mäkelä, P.; Hakojärvi, M.; Ahokas, J. Evaluation of instrumentation for cow positioning and tracking indoors. Biosyst. Eng. 2007, 96, 399–405. [Google Scholar] [CrossRef]
  12. Gygax, L.; Neisen, G.; Bollhalder, H. Accuracy and validation of a radar-based automatic local position measurement system for tracking dairy cows in free-stall barns. Comput. Electron. Agric. 2007, 56, 23–33. [Google Scholar] [CrossRef]
  13. Jukan, A.; Masip-Bruin, X.; Amla, N. Smart computing and sensing technologies for animal welfare: A systematic review. ACM Comput. Surv. (CSUR) 2017, 50, 1–27. [Google Scholar] [CrossRef]
  14. Ruiz-Garcia, L.; Lunadei, L. The role of RFID in agriculture: Applications, limitations and challenges. Comput. Electron. Agric. 2011, 79, 42–50. [Google Scholar] [CrossRef]
  15. Reger, M.; Stumpenhausen, J.; Bernhardt, H. Evaluation of LiDAR for the free navigation in agriculture. AgriEngineering 2022, 4, 489–506. [Google Scholar] [CrossRef]
  16. Zhang, Y.; Tian, K.; Huang, J.; Wang, Z.; Zhang, B.; Xie, Q. Field Obstacle Detection and Location Method Based on Binocular Vision. Agriculture 2024, 14, 1493. [Google Scholar] [CrossRef]
  17. Zhou, H.; Li, C.; Sun, G.; Yin, J.; Ren, F. Calibration and location analysis of a heterogeneous binocular stereo vision system. Appl. Opt. 2021, 60, 7214–7222. [Google Scholar] [CrossRef] [PubMed]
  18. Ding, J.; Yan, Z.; We, X. High-accuracy recognition and localization of moving targets in an indoor environment using binocular stereo vision. ISPRS Int. J. Geo-Inf. 2021, 10, 234. [Google Scholar] [CrossRef]
  19. Luo, Y.; Lin, K.; Xiao, Z.; Lv, E.; Wei, X.; Li, B.; Lu, H.; Zeng, Z. PBR-YOLO: A lightweight piglet multi-behavior recognition algorithm based on improved yolov8. Smart Agric. Technol. 2025, 10, 100785. [Google Scholar] [CrossRef]
  20. Yuan, Z.; Wang, S.; Wang, C.; Zong, Z.; Zhang, C.; Su, L.; Ban, Z. Research on Calf Behavior Recognition Based on Improved Lightweight YOLOv8 in Farming Scenarios. Animals 2025, 15, 898. [Google Scholar] [CrossRef]
  21. Wang, Z.; Hua, Z.; Wen, Y.; Zhang, S.; Xu, X.; Song, H. E-YOLO: Recognition of estrus cow based on improved YOLOv8n model. Expert Syst. Appl. 2024, 238, 122212. [Google Scholar] [CrossRef]
  22. Ni, J.; Zhu, S.; Tang, G.; Ke, C.; Wang, T. A small-object detection model based on improved YOLOv8s for UAV image scenarios. Remote Sens. 2024, 16, 2465. [Google Scholar] [CrossRef]
  23. Ni, J.; Shen, K.; Chen, Y.; Yang, S.X. An improved ssd-like deep network-based object detection method for indoor scenes. IEEE Trans. Instrum. Meas. 2023, 72, 1–15. [Google Scholar] [CrossRef]
  24. Wang, A.; Qian, W.; Li, A.; Xu, Y.; Hu, J.; Xie, Y.; Zhang, L. NVW-YOLOv8s: An improved YOLOv8s network for real-time detection and segmentation of tomato fruits at different ripeness stages. Comput. Electron. Agric. 2024, 219, 108833. [Google Scholar] [CrossRef]
  25. Sager, C.; Janiesch, C.; Zschech, P. A survey of image labelling for computer vision applications. J. Bus. Anal. 2021, 4, 91–110. [Google Scholar] [CrossRef]
  26. Zhao, Z.-Q.; Zheng, P.; Xu, S.-t.; Wu, X. Object detection with deep learning: A review. IEEE Trans. Neural Netw. Learn. Syst. 2019, 30, 3212–3232. [Google Scholar] [CrossRef]
  27. Ren, S.; He, K.; Girshick, R.; Sun, J. Faster r-cnn: Towards real-time object detection with region proposal networks. arXiv 2015, arXiv:1506.01479. [Google Scholar] [CrossRef]
  28. Jiang, P.; Ergu, D.; Liu, F.; Cai, Y.; Ma, B. A Review of Yolo algorithm developments. Procedia Comput. Sci. 2022, 199, 1066–1073. [Google Scholar] [CrossRef]
  29. Zhai, S.; Shang, D.; Wang, S.; Dong, S. DF-SSD: An improved SSD object detection algorithm based on DenseNet and feature fusion. IEEE Access 2020, 8, 24344–24357. [Google Scholar] [CrossRef]
  30. Wu, Z.; Chen, X.; Gao, Y.; Li, Y. Rapid target detection in high resolution remote sensing images using YOLO model. Int. Arch. Photogramm. Remote Sens. Spat. Inf. Sci. 2018, 42, 1915–1920. [Google Scholar] [CrossRef]
  31. Wang, C.-Y.; Liao, H.-Y.M. YOLOv1 to YOLOv10: The fastest and most accurate real-time object detection systems. APSIPA Trans. Signal Inf. Process. 2024, 13. [Google Scholar] [CrossRef]
  32. Myat Noe, S.; Zin, T.T.; Kobayashi, I.; Tin, P. Optimizing black cattle tracking in complex open ranch environments using YOLOv8 embedded multi-camera system. Sci. Rep. 2025, 15, 6820. [Google Scholar] [CrossRef]
  33. Ali, M.L.; Zhang, Z. The YOLO framework: A comprehensive review of evolution, applications, and benchmarks in object detection. Computers 2024, 13, 336. [Google Scholar] [CrossRef]
  34. Khan, Z.Y.; Niu, Z. CNN with depthwise separable convolutions and combined kernels for rating prediction. Expert. Syst. Appl. 2021, 170, 114528. [Google Scholar] [CrossRef]
  35. Elliott, J. Functorial properties of star operations. Commun. Algebra 2010, 38, 1466–1490. [Google Scholar] [CrossRef]
  36. Wang, X.; Yang, W.; Qi, W.; Wang, Y.; Ma, X.; Wang, W. STaRNet: A spatio-temporal and Riemannian network for high-performance motor imagery decoding. Neural Netw. 2024, 178, 106471. [Google Scholar] [CrossRef] [PubMed]
  37. Zhang, Z. A flexible new technique for camera calibration. IEEE Trans. Pattern Anal. Mach. Intell. 2002, 22, 1330–1334. [Google Scholar] [CrossRef]
  38. Mahammed, M.A.; Melhum, A.I.; Kochery, F.A. Object distance measurement by stereo vision. Int. J. Sci. Appl. Inf. Technol. (IJSAIT) 2013, 2, 05–08. [Google Scholar]
  39. Schmid, H.H. Worldwide geometric satellite triangulation. J. Geophys. Res. 1974, 79, 5349–5376. [Google Scholar] [CrossRef]
  40. Ashkenazi, V. Coordinate systems: How to get your position very precise and completely wrong. J. Navig. 1986, 39, 269–278. [Google Scholar] [CrossRef]
  41. Thompson, W. Coordinate systems for solar image data. Astron. Astrophys. 2006, 449, 791–803. [Google Scholar] [CrossRef]
  42. Shashua, A.; Navab, N. Relative affine structure: Canonical model for 3D from 2D geometry and applications. IEEE Trans. Pattern Anal. Mach. Intell. 1996, 18, 873–883. [Google Scholar] [CrossRef]
  43. Davis, M.H.; Khotanzad, A.; Flamig, D.P.; Harms, S.E. A physics-based coordinate transformation for 3-D image matching. IEEE Trans. Med. Imaging 2002, 16, 317–328. [Google Scholar] [CrossRef] [PubMed]
  44. Sohan, G.N.; Sanjay, G.; Saraswathi, S. Real-Time Snake Prediction and Detection System Using the YOLOv5. In Proceedings of the 2024 4th International Conference on Ubiquitous Computing and Intelligent Information Systems (ICUIS), Gobichettipalayam, India, 12–13 December 2024; pp. 1135–1142. [Google Scholar]
  45. Agouridis, C.T.; Stombaugh, T.S.; Workman, S.R.; Koostra, B.K.; Edwards, D.R. Examination of GPS collar capabilities and limitations for tracking animal movement in grazed watershed studies. In 2003 ASAE Annual Meeting; American Society of Agricultural and Biological Engineers: St. Joseph, MI, USA, 2003. [Google Scholar]
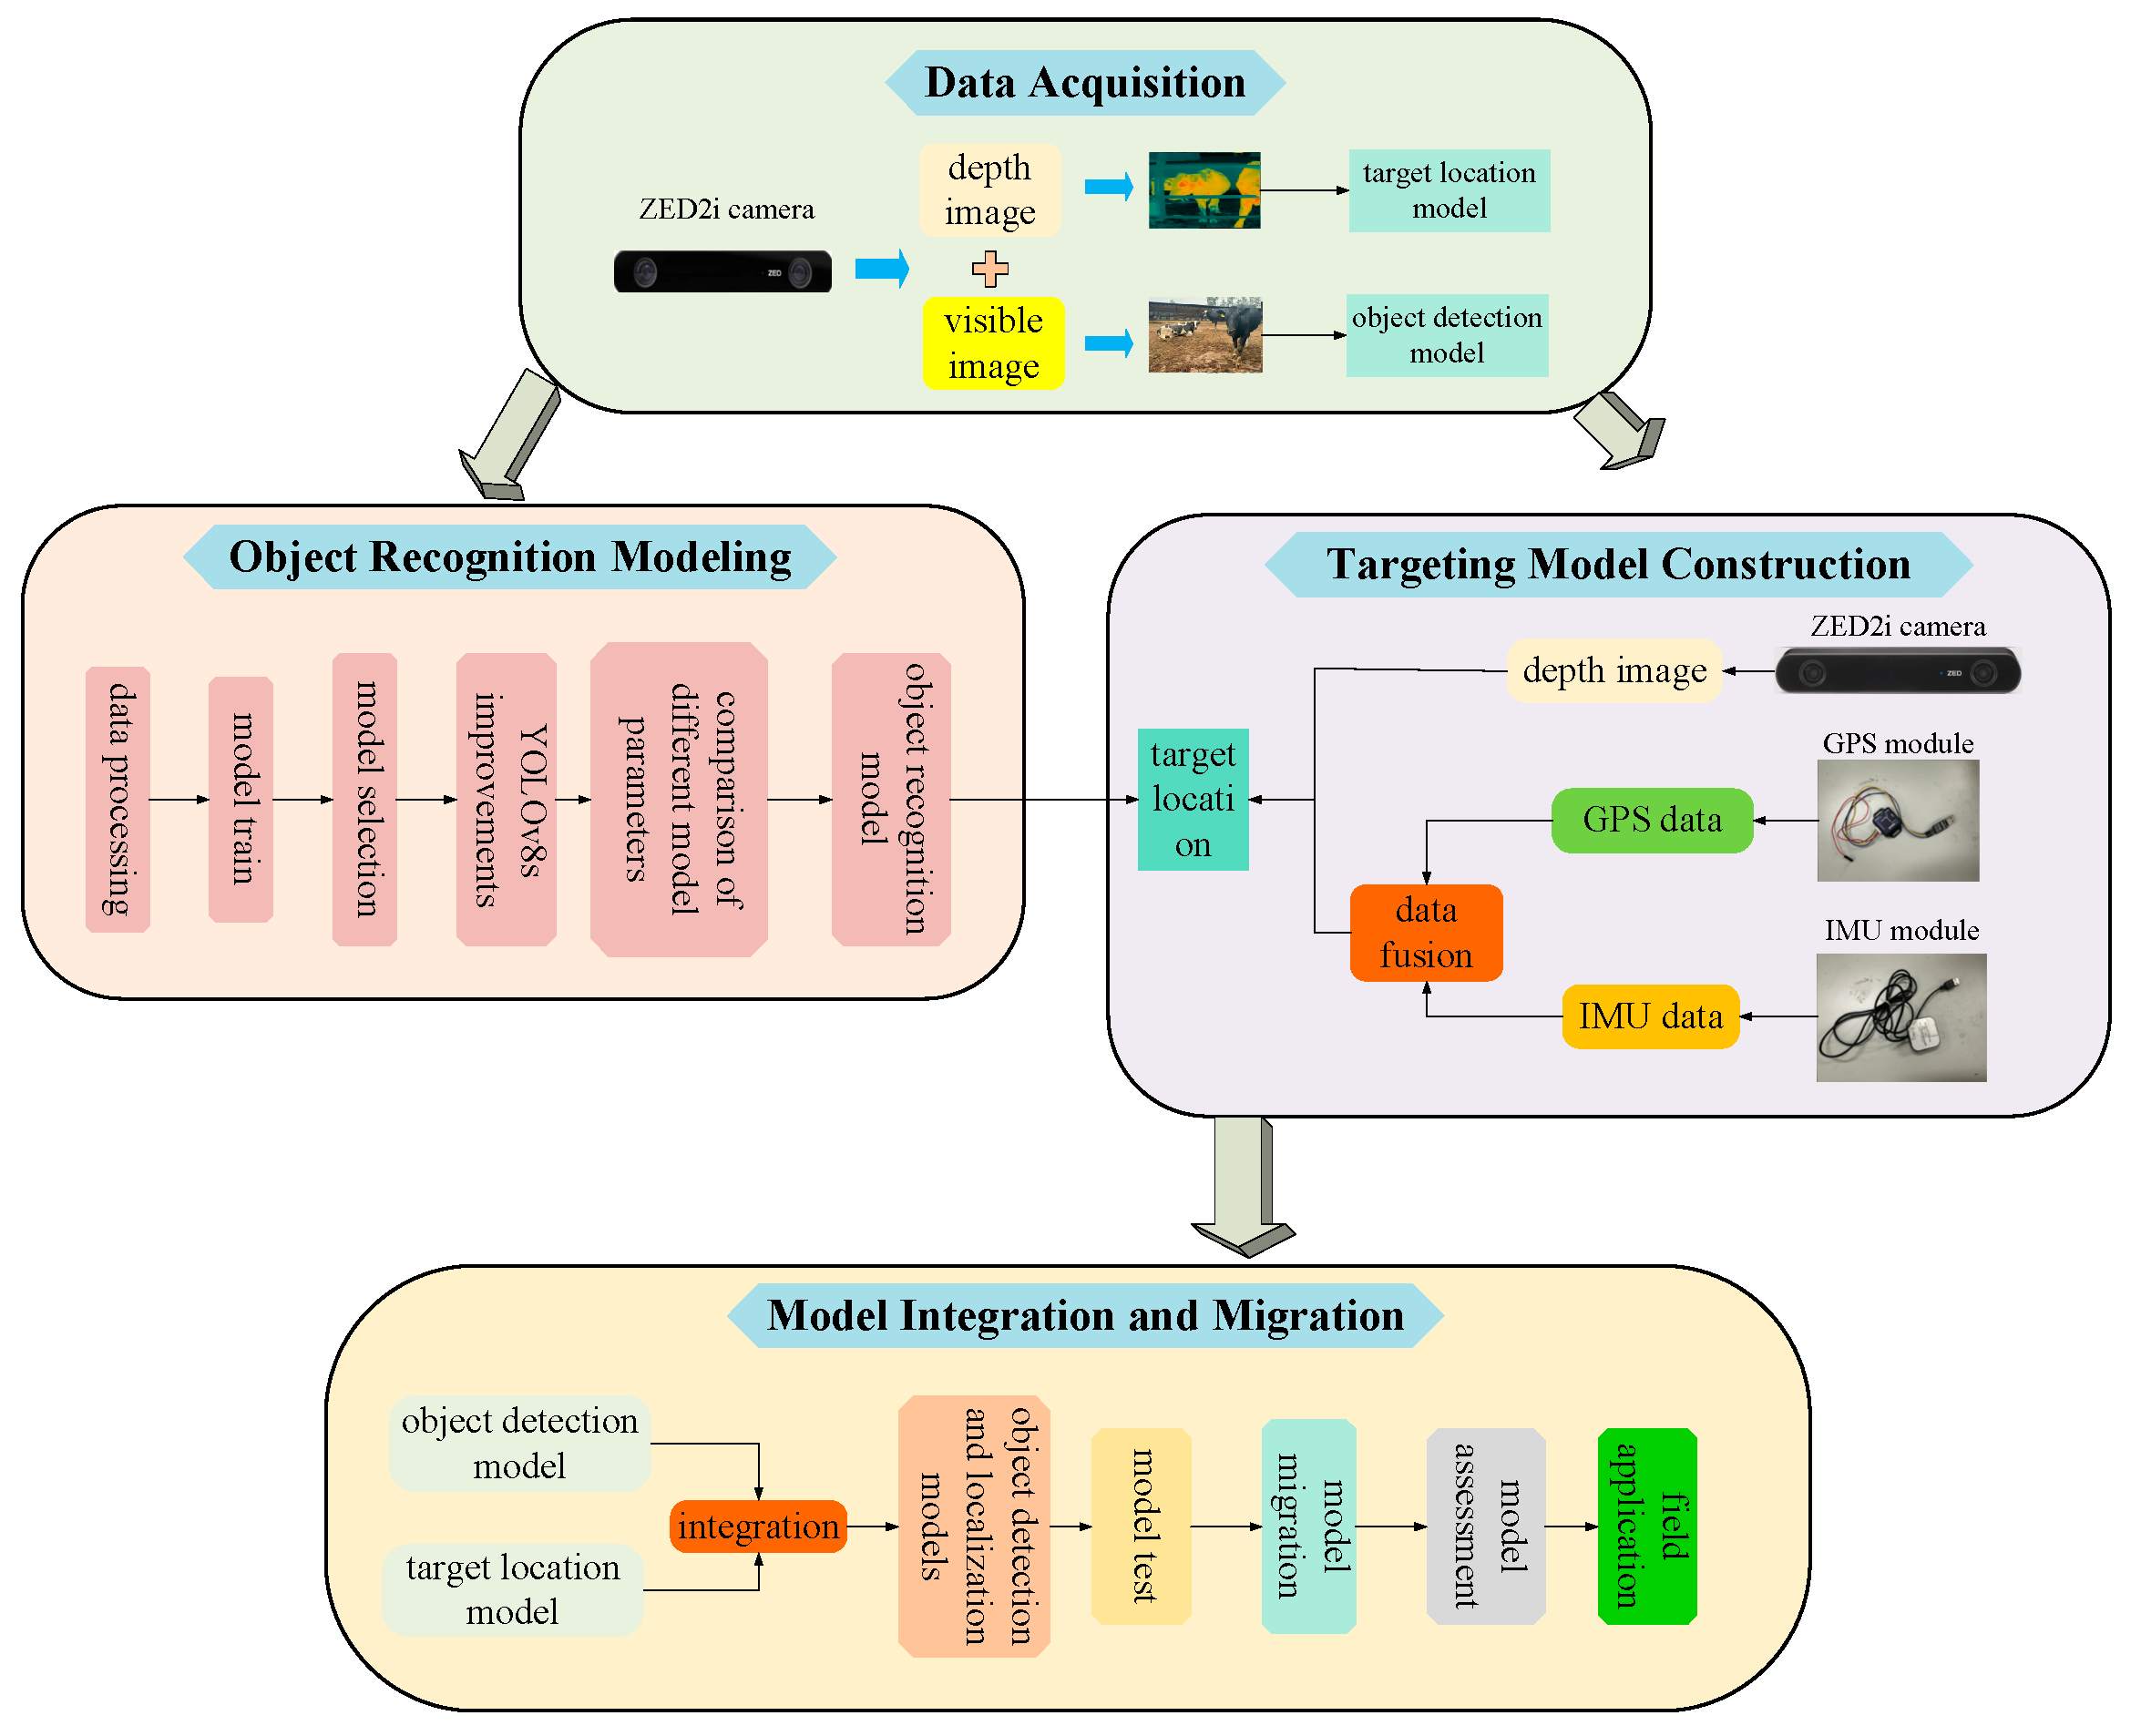
Figure 1. Research framework.
Agriculture 15 01766 g001
Figure 2. Data collection location and method.
Agriculture 15 01766 g002
Figure 3. Partial dataset images. (a) Single-class single-target. (b) Single-class multi-target. (c) Multi-class single-target. (d) Multi-class multi-target. (e) Occluded. (f) With the light. (g) Backlight. (h) Cloudy. (i) Clear sky.
Agriculture 15 01766 g003
Figure 4. Diagram of YOLOv8 and its improved network architecture. (a) YOLOv8 network on the composition diagram. (b) Improved neck network structure diagram. (c) C2f_DW_StarBlock structure diagram.
Agriculture 15 01766 g004
Figure 5. Depthwise separable convolutional architecture diagram.
Agriculture 15 01766 g005
Figure 6. Star operation structure diagram.
Agriculture 15 01766 g006
Figure 7. StarNet structure.
Agriculture 15 01766 g007
Figure 8. Targeting flowchart.
Agriculture 15 01766 g008
Figure 9. Camera calibration before and after comparison picture. (a) Before calibration. (b) After calibration.
Agriculture 15 01766 g009
Figure 10. Schematic diagram of binocular stereo vision ranging.
Agriculture 15 01766 g010
Figure 11. Coordinate conversion schematic.
Agriculture 15 01766 g011
Figure 12. Comparison of accuracy before and after fusion.
Agriculture 15 01766 g012
Figure 13. Model migration flowchart.
Agriculture 15 01766 g013
Figure 14. Model performance comparison chart. (a) Comparison of detection performance. (b) Comparison of number of parameters. (c) Comparison of computational complexity. (d) Comparison of model size.
Agriculture 15 01766 g014
Figure 15. Diagram of the ranging experiment. (a) Experimental scene layout. (b) Example of ranging results.
Agriculture 15 01766 g015
Figure 16. Plot of scatter and frequency analysis of localization measurement errors. (a) Error scatter plot. (b) Error histogram.
Agriculture 15 01766 g016
Figure 17. Diagram of field test equipment after deployment of the ROS system.
Agriculture 15 01766 g017
Figure 18. Model field validation plots. (a1a3): Single-class, single-target at near, medium, and far distances. (b1b3): Multi-class, single-target at near, medium, and far distances. (c1c3): Single-class, multi-target at near, medium, and far distances. (d1d3): Multi-class, multi-target at near, medium, and far distances.
Agriculture 15 01766 g018
Figure 19. Comparison of model detection performance in different real-world scenarios.
Agriculture 15 01766 g019
Figure 20. Post-deployment field validation maps.
Agriculture 15 01766 g020
Table 1. YOLOv8 performance comparison table for each model.
ModelPrecision (%)Recall (%)mAP@0.5 (%)mAP@0.5:0.95 (%)
YOLOv8n97.797.198.993.3
YOLOv8s97.997.499.094.7
YOLOv8m98.097.398.994.9
YOLOv8l98.197.899.095.0
YOLOv8x98.297.399.195.0
Table 2. Comparative performance analysis table with mainstream models.
ModelPrecision (%)Recall (%)mAP50 (%)Params (106)GFLOPsModel Size (MB)
YOLOv5s98.594.997.17.0215.814.4
YOLOv798.795.998.736.48103.274.8
YOLOv8s98.595.398.511.1328.422.5
YOLOv9s97.994.598.116.5958.3918.1
YOLOv10s97.394.796.87.8119.614.9
+C2f_DW_StarBlock98.595.198.57.1218.913.8
SSD96.294.594.824.5245.030.4
Faster R-CNN97.395.495.142.78113.682.4
RetinaNet96.894.194.734.0989.5453.6
Table 3. Ablation study results of the C2f_DW_StarBlock module.
Scheme NameDWConv UsedStarBlock UsedPrecision (%)mAP@0.5 (%)Params (M)GFLOPsModel Size (MB)
Original YOLOv8s××98.598.511.1328.422.5
YOLOv8s + DWConv×98.498.19.522.519.6
YOLOv8s + StarBlock×98.497.98.920.518.2
YOLOv8s + C2f_DW_StarBlock98.598.57.1218.913.8
Table 4. Comparison of model-measured and actual distances across different ranges.
SpotModel Measuring Distance (mm)Actual Measuring Distance (mm)Tolerance (mm)Tolerance Ratio (mm)
Position 1 (0.5–5 m)75374490.61
1467147691.21
2139213450.23
37753822471.23
41714158130.31
Position 2 (5–10 m)55345447871.60
63866359270.42
765377551021.32
8635864270.08
97359829940.96
Position 3 (10–15 m)10,44110,529880.84
11,74311,799560.47
12,67512,5361391.11
13,31713,291260.20
14,34414,5431991.37
Position 4 (15–20 m)16,16415,4816834.41
16,37816,1762021.25
18,09917,4726273.46
18,87018,2156553.60
20,56119,7877743.67
Disclaimer/Publisher’s Note: The statements, opinions and data contained in all publications are solely those of the individual author(s) and contributor(s) and not of MDPI and/or the editor(s). MDPI and/or the editor(s) disclaim responsibility for any injury to people or property resulting from any ideas, methods, instructions or products referred to in the content.