Article

Design and Experiment of DEM-Based Layered Cutting–Throwing Perimeter Drainage Ditcher for Rapeseed Fields

1
College of Electrical and Mechanical Engineering, Hunan Agricultural University, Changsha 410128, China
2
Hunan Modern Agricultural Equipment Engineering and Technology Research Center, Changsha 410128, China
*
Author to whom correspondence should be addressed.
Agriculture 2025, 15(15), 1706; https://doi.org/10.3390/agriculture15151706
Submission received: 5 July 2025 / Revised: 5 August 2025 / Accepted: 5 August 2025 / Published: 7 August 2025
(This article belongs to the Section Agricultural Technology)

Abstract

To address compacted soils with high power consumption and waterlogging risks in rice–rapeseed rotation areas of the Yangtze River, this study designed a ditching machine combining a stepped cutter head and trapezoidal cleaning blade, where the mechanical synergy between components minimizes energy loss during soil-cutting and -throwing processes. We mathematically modeled soil cutting–throwing dynamics and blade traction forces, integrating soil rheological properties to refine parameter interactions. Discrete Element Method (DEM) simulations and single-factor experiments analyzed impacts of the inner/outer blade widths, blade group distance, and blade opening on power consumption. Results indicated that increasing the inner/outer blade widths (200–300 mm) by expanding the direct cutting area significantly reduced the cutter torque by 32% and traction resistance by 48.6% from reduced soil-blockage drag; larger blade group distance (0–300 mm) initially decreased but later increased power consumption due to soil backflow interference, with peak efficiency at 200 mm spacing; the optimal blade opening (586 mm) minimized the soil accumulation-induced power loss, validated by DEM trajectory analysis showing continuous soil flow. Box–Behnken experiments and genetic algorithm optimization determined the optimal parameters: inner blade width: 200 mm; outer blade width: 300 mm; blade group distance: 200 mm; and blade opening: 586 mm, yielding a simulated power consumption of 27.07 kW. Field tests under typical 18.7% soil moisture conditions confirmed a <10% error between simulated and actual power consumption (28.73 kW), with a 17.3 ± 0.5% reduction versus controls. Stability coefficients for the ditch depth, top/bottom widths exceeded 90%, and the backfill rate was 4.5 ± 0.3%, ensuring effective drainage for rapeseed cultivation. This provides practical theoretical and technical support for efficient ditching equipment in rice–rapeseed rotations, enabling resource-saving design for clay loam soils.

1. Introduction

China’s oilseed self-sufficiency rate falls below 50% [1], posing a severe challenge to the security of its oilseed supply. As a crucial source of edible vegetable oil in China, rapeseed production is vital for safeguarding national grain and oil security [2,3]. The rice–rapeseed rotation areas in the middle and lower reaches of the Yangtze River constitute the primary winter rapeseed production region [4]. However, abundant rainfall during the planting season combined with heavy, compacted soil frequently leads to waterlogging damage during the seedling and flowering stages, causing significant yield reductions. Consequently, the practice of excavating three types of ditches (waist ditches, ridge ditches, and perimeter ditches) during sowing operations is essential for drainage.
Waist ditches are the main drainage channels perpendicular to crop rows; border ditches run parallel to crop rows between planting beds, serving dual purposes for field operations and auxiliary drainage; perimeter ditches connect field waist ditches, border ditches, and external drainage canals, and their required ditching depth exceeds that of waist and border ditches (≥400 mm), presenting challenges including high excavation resistance, susceptibility to ditch wall collapse, and non-uniform soil distribution during throwing. Therefore, developing specialized perimeter ditching equipment applicable to heavy clay soils with low power consumption is imperative. This addresses critical issues like waterlogging susceptibility in rapeseed within the rice–rapeseed rotation areas of the middle and lower Yangtze River, significantly ensuring rapeseed yield stability and safeguarding China’s grain and oil security.
Currently, disc-type ditching machines dominate deep field ditching operations [5,6]. These machines offer advantages including high operational efficiency, minimal backfill, stable ditch formation, and suitability for diverse soil types [7,8]. The cutter head and ditch-cleaning blade, as core ditching components, significantly impact operational effectiveness and power consumption [9,10,11]. Extensive research has been conducted on disc-type ditching machines domestically and internationally. For instance, Liu Dawei et al. [12] investigated factors influencing power consumption in ditching components, identifying the primary influencing factors in descending order: blade roller type > forward speed > roller rotational speed > ditching depth; Zeng Yi et al. [13,14] designed a layered cutting–throwing ditching blade group, effectively reducing operational power consumption while enhancing ditch depth stability; Wang Lizong et al. [9,15,16] developed a propeller-like ditch opener for furrow ditching, improving operational efficiency and ditch formation stability while lowering power consumption; Ye Zeng et al. [17] addressed the high ditching resistance in southern clay loam soils by designing a ditching implement equipped with a self-excited vibration device, achieving a 12.3% reduction in ditching resistance; Ahmadi et al. [18] established kinematic and dynamic models for the ditching process of blades, analyzing and optimizing the ditching blade power consumption; Zhang J et al. [19] simulated and optimized the interaction between blades, soil, and straw during deep plowing, providing a theoretical basis for optimized design and parameter selection to reduce power consumption in complex environments; Ucgul et al. [20,21] utilized Discrete Element Method (DEM) models to predict tool performance and analyze soil disturbance processes, offering valuable insights into the power reduction mechanisms of layered blade groups.
While the existing research has enhanced ditching efficiency and ditch stability through cutter head layout optimization and novel cutting structure development, most of the current ditching machines employ a central-mounted cutter head with a rectangular or trapezoidal configuration. This design suffers from ditch wall instability, high power consumption, and an inability to operate close to field ridges. Consequently, it fails to meet the demand for deep, single-side perimeter ditching in the heavy, clayey soils prevalent in southern China.
This study proposes a lateral single-disc layered cutting–throwing and dynamic ditch-cleaning synergistic design to achieve low-resistance, high-efficiency ditching and stable ditch formation. 1. Mathematical models for cutter head soil-cutting, soil-throwing, and ditch-cleaning blade traction power consumption were established through theoretical analysis; 2. Discrete Element Method (DEM) simulations were employed to conduct single-factor experiments investigating the effects of the inner/outer blade group widths, blade group distance, and cleaning blade opening on power consumption, with Box–Behnken simulation optimization and genetic algorithm-based multi-objective optimization implemented; 3. field trials validated the simulation and optimized solutions. This provides theoretical foundations and technical support for efficient, low-consumption ditching equipment in rice–rapeseed rotation areas.

2. Materials and Methods

2.1. Overall Structure and Working Principle

2.1.1. Overall Structure

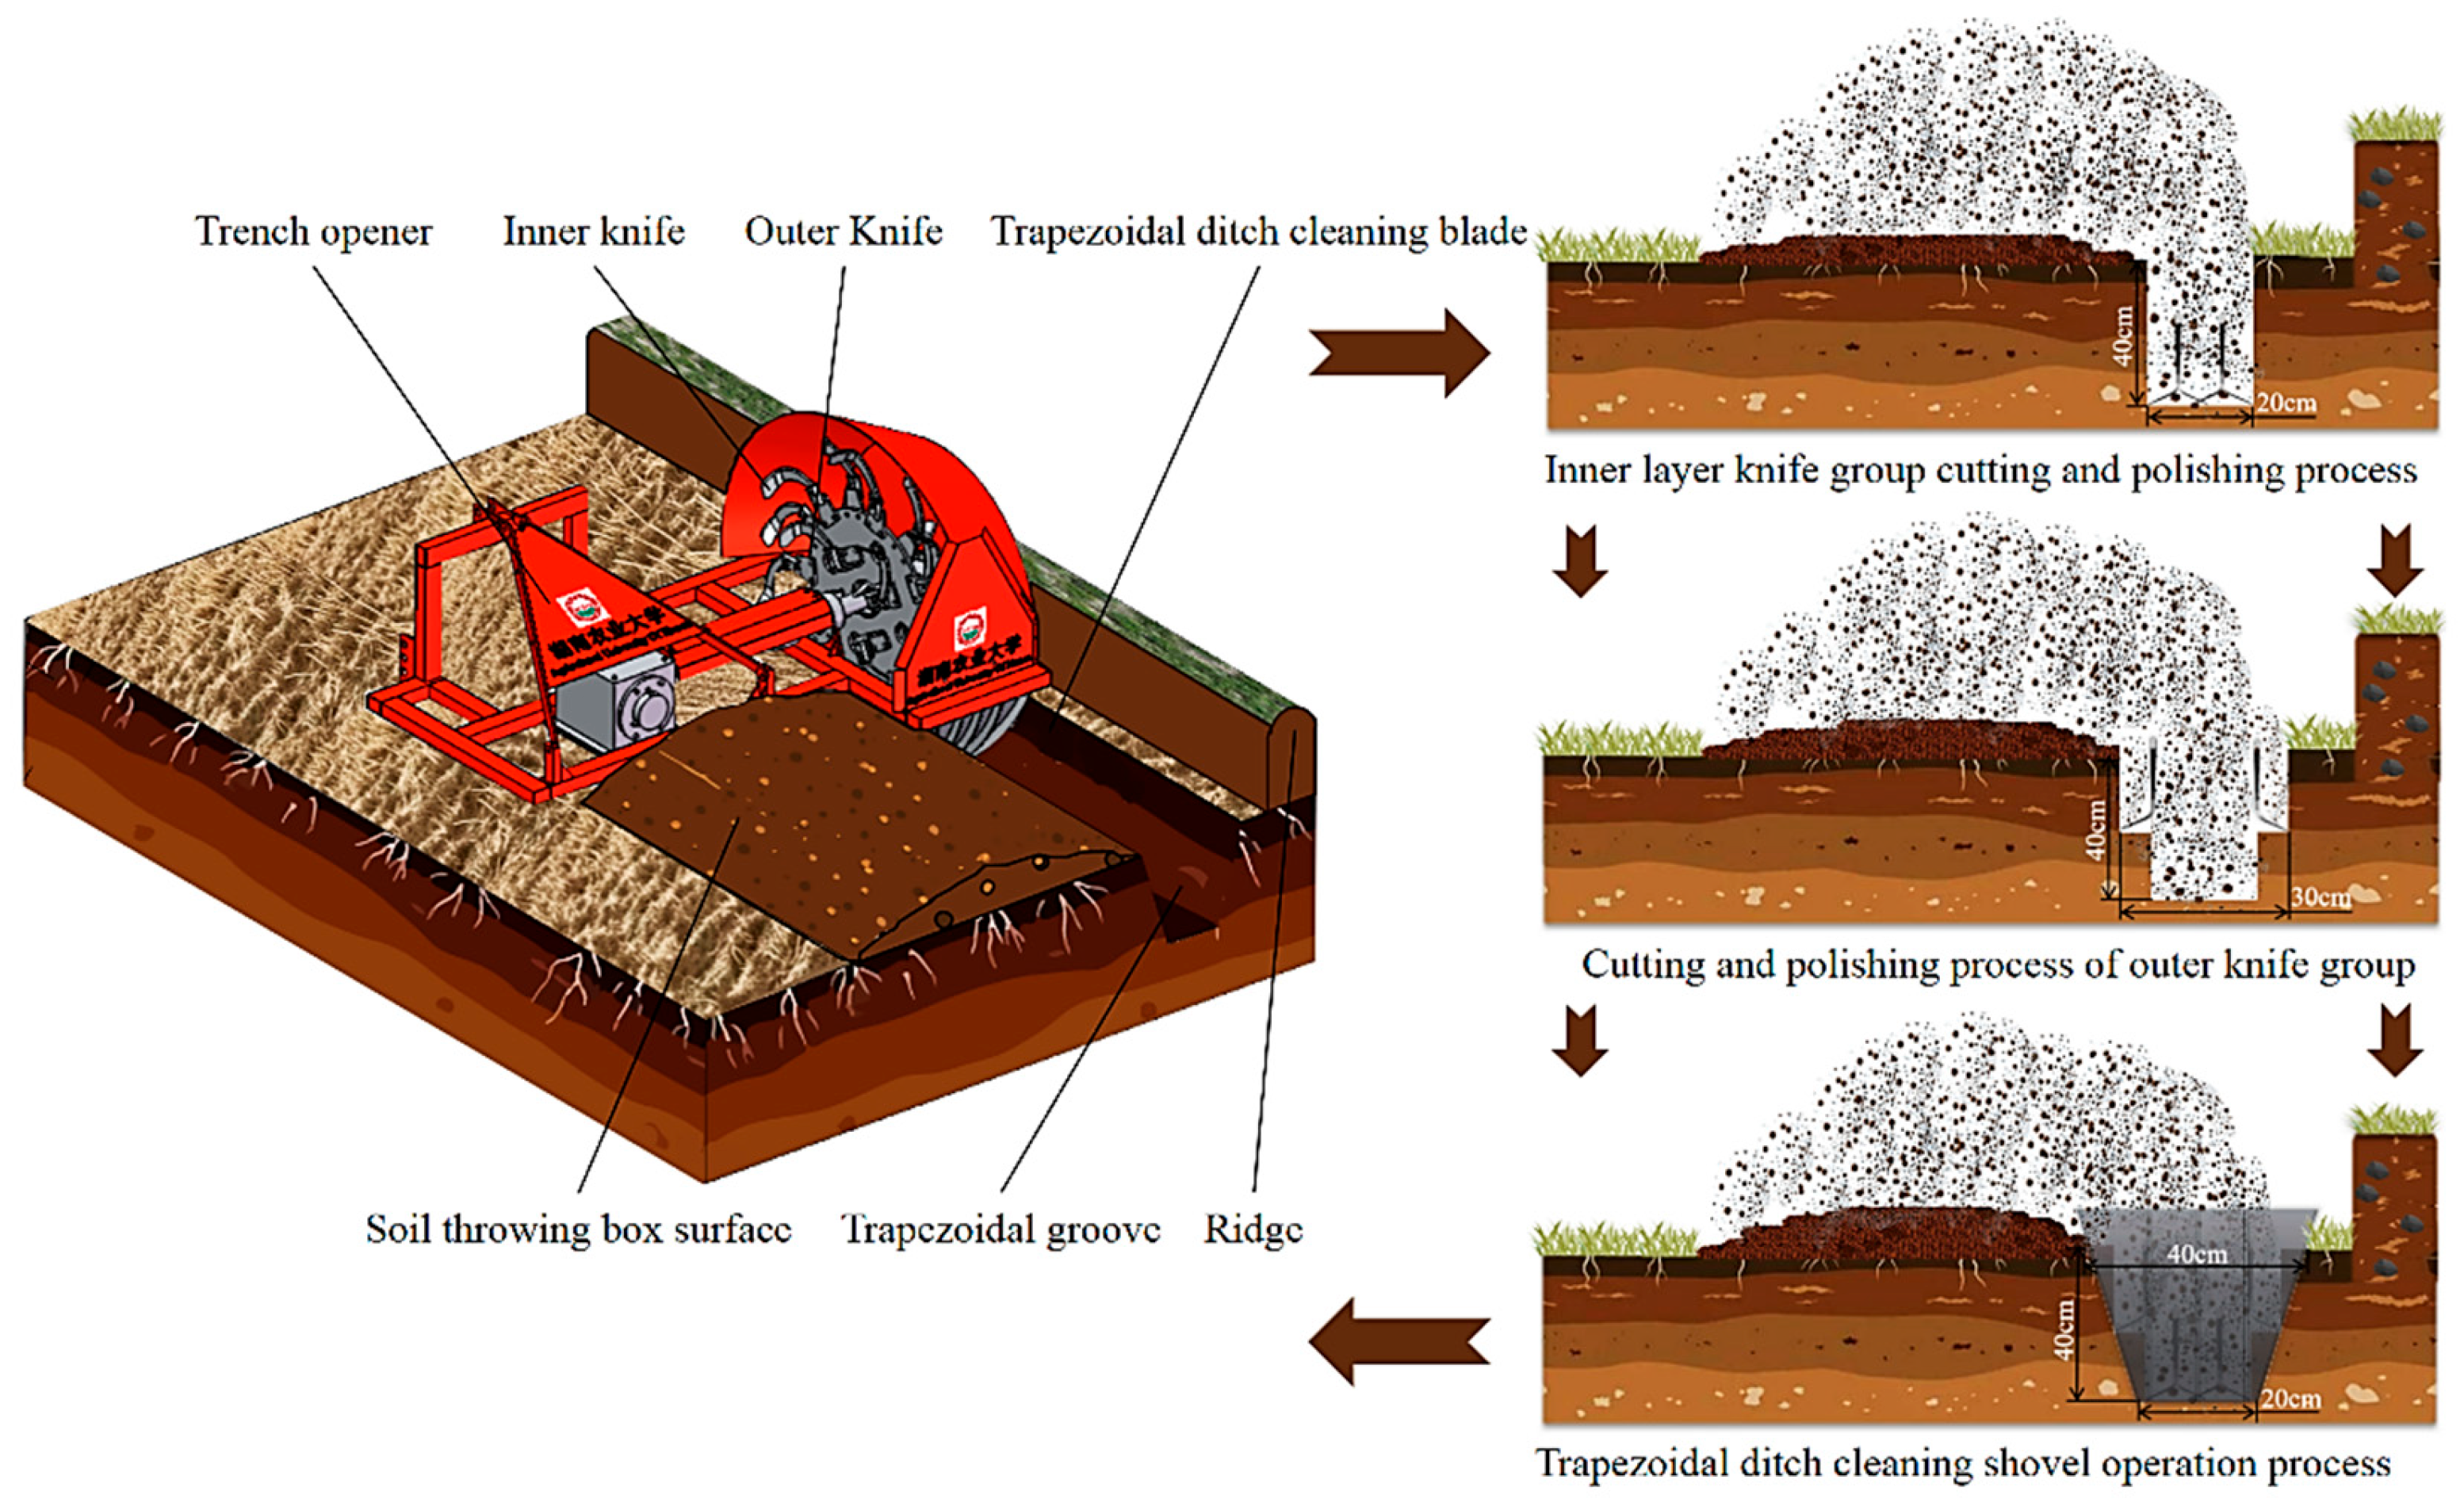
The overall structure of the perimeter ditch discarding machine is illustrated in Figure 1. It comprises key components including a stepped cutter head, a trapezoidal ditch-cleaning blade (shovel), a soil deflector, a gearbox, and a frame. This configuration enables the synergistic operation of deep, single-side perimeter ditch excavation combined with dynamic ditch cleaning. The soil deflector provides directional guidance for the thrown soil. Key technical parameters are detailed in Table 1.
Specifically, the stepped cutter head features inner and outer blade groups arranged in a staggered, stepped configuration. This design facilitates the formation of a trapezoidal ditch profile through layered cutting and throwing. The trapezoidal ditch-cleaning blade is formed by bending a trapezoidal steel plate along an arcuate guide curve. The soil deflector ensures directional throwing of the excavated soil. Collectively, these three core components establish a coordinated operational mechanism: layered cutting–throwing, dynamic ditch cleaning, and directional soil throwing, ensuring effective soil removal and placement.

2.1.2. Working Principle

The working principle of the machine is depicted in Figure 2. During operation, power from the tractor’s Power Take-Off (PTO) shaft is transmitted via the gearbox to drive the transmission shaft, which subsequently rotates the stepped cutter head. The rotating cutter head cuts and throws the soil within the target area. This action primarily accomplishes two tasks: forming an initial stepped-profile ditch and discharging the excavated soil.
Following the cutter head, the trapezoidal ditch-cleaning blade engages with the stepped ditch. It performs several critical functions: further shaping the ditch into a trapezoidal cross section, compacting the ditch walls to enhance stability, and removing fragmented soil debris remaining within the ditch.
Simultaneously, the soil deflector intercepts the soil thrown by the cutter head and provides directional guidance, channeling the soil towards the inner side of the field. This achieving the objectives of single–side soil discharge, effective burial of surface straw, and the formation of a uniform, level seedbed surface.

2.2. Design of Ditching Components for Rapeseed Field Perimeter Ditch Discarding Machine Agricultural Engineering

2.2.1. Ditching Unit Working Process

During the ditching operation, the cutter head advances in a counter-rotating motion (relative to the direction of travel) to engage the soil within the target area. Its rotation disturbs the surrounding soil, promoting soil separation. A portion of the soil within the working zone is directly thrown by the cutter head onto the seedbed surface. The remaining soil collides with the soil deflector and is subsequently guided onto the seedbed surface. Following this, the ditch-cleaning blade acts upon residual soil adhering to the ditch walls. It performs the cutting and shearing of this soil, compresses the ditch walls for stability, and consolidates any backfill soil that has fallen back into the ditch. Some soil accumulated within the cleaning blade may interact again with the cutter head, re-entering the throwing process. Another portion of the soil slides along the curved surface of the cleaning blade and is discharged rearward out of the blade surface into the area beyond the ditch.

2.2.2. Soil-Cutting Pitch Design

The inner and outer blade groups operate on distinct soil zones. Consequently, each group possesses an independent soil cutting pitch (L), expressed as
L = v t   60 ω z
where vt is the machine’s operating speed (m/s), ω is the rotational speed of the cutter head (r/min), and z is the number of blades on the same circumference.
The heavy and compacted soils characteristic of the rice–rapeseed rotation areas in the middle and lower reaches of the Yangtze River necessitate a soil-cutting pitch (L) of less than 90 mm to ensure seedbed surface levelness and uniform soil distribution [22]. In the preliminary design, the inner blade group was configured with 7 blades on the same circumference, while the outer blade group featured 4 blades on the same circumference. Under actual field operating conditions, when the tractor operates in gear 1 with an output speed of 720 r/min, it is suitable for deep ditching operations in heavy soils. At this stage, the ditcher’s forward speed fluctuates approximately 0.6 m/s, and the blade roller rotational speed fluctuates around 240 r/min. The soil-cutting pitches for the inner blade group (Li) and outer blade group (Lo) measure 21.4 mm and 37.5 mm, respectively, both satisfying the design requirements.

2.2.3. Stepped Cutter Head Layout

Figure 3 illustrates the schematic of the stepped cutter head layout, which comprises inner and outer blade groups arranged in a staggered configuration at distinct radial and axial positions on the same cutter disc. Under the conditions of satisfying the soil-cutting pitch and avoiding structural interference of the cutter disc, the inner and outer blade groups are configured with 7 and 4 Model 195 rotary tiller blades on the left and right sides, respectively, ensuring a satisfactory field operation performance, to guarantee the soil-throwing performance of the cutter disc and balanced force distribution. To optimize the soil-throwing performance and ensure balanced force distribution across the cutter head, one centrally symmetric blade on each side (left and right) of the inner blade group is mounted inwards (toward the rotation axis), while the remaining blades adopt the conventional outward soil-throwing orientation. An axial staggered arrangement of the blades guarantees comprehensive coverage, ensuring all areas within the working width are directly engaged by the rotary tiller blades.

2.2.4. Curved Surface Design of Ditch-Cleaning Shovel

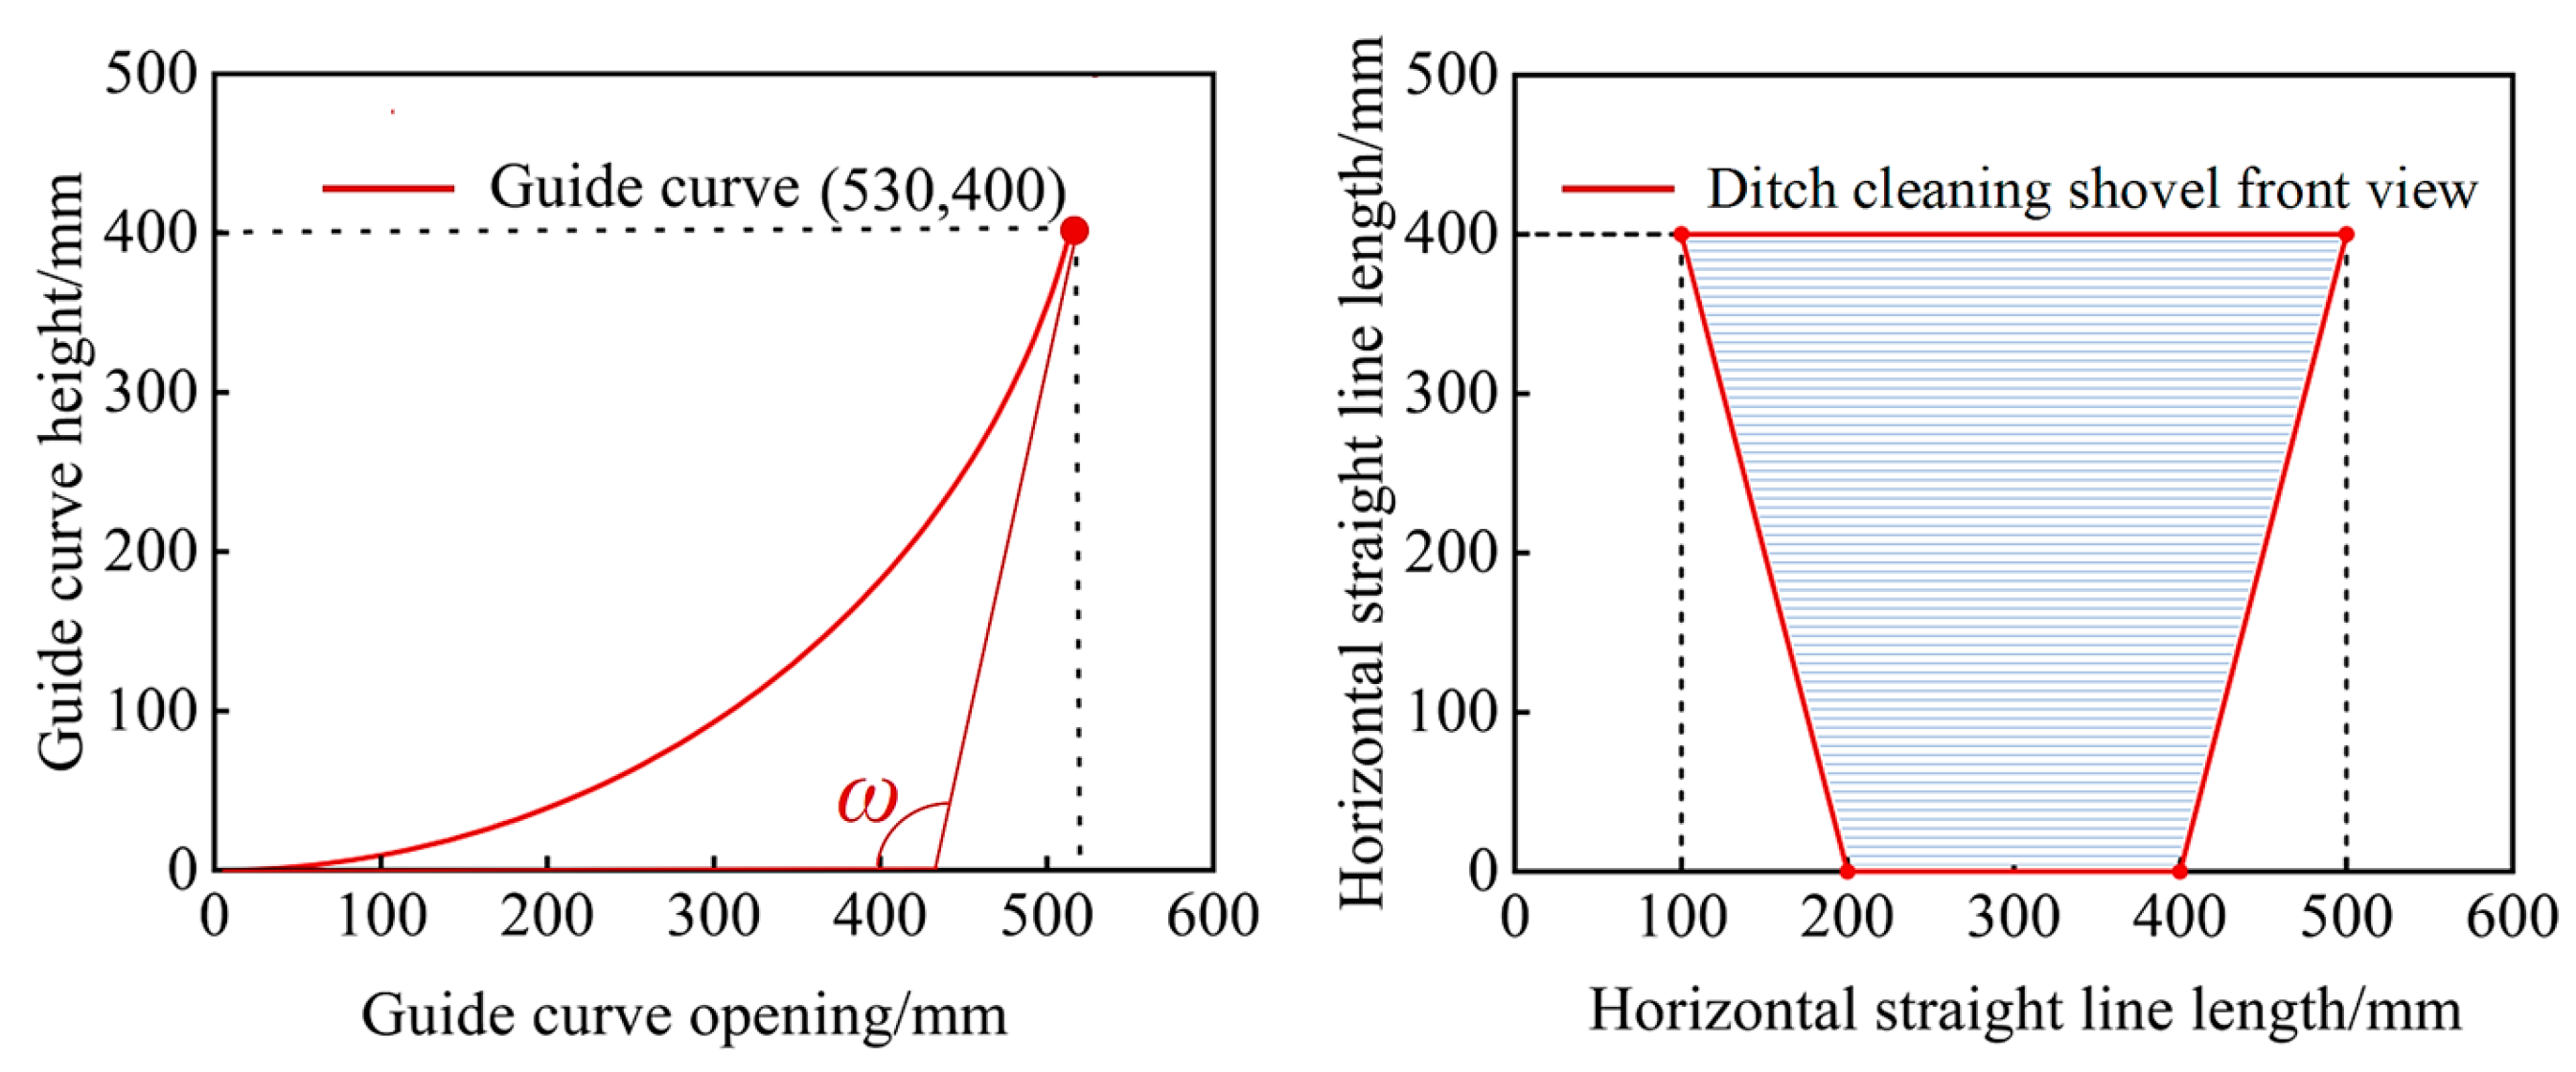
The ditch-cleaning blade is primarily responsible for cutting soil within the ditch that was not removed by the stepped cutter head, consolidating fragmented soil that has fallen back into the ditch, and compressing the ditch walls. Its function and structure are analogous to that of a moldboard plow body. Consequently, this study adopts the design methodology for plow body surfaces in designing the ditch-cleaning blade. Current methods for constructing plow body surfaces include the horizontal straight generatrix method, the inclined straight generatrix method, and the curved generatrix method. Compared to the inclined straight generatrix method (prone to distortion due to parameter coupling) and the curved generatrix method (difficult to optimize due to high-dimensional equations), the horizontal straight generatrix method becomes a universal choice for plow body surface design owing to its continuous soil flow without abrupt changes, uniform stress distribution, low stress peaks, and low manufacturing cost [23]. Based on this method, the surface of the ditch-cleaning blade is formed by sweeping horizontal straight generatrices along a guide curve at varying heights while maintaining a constant generatrix angle. The final trapezoidal ditch-cleaning blade shape is achieved by adjusting the length of these horizontal straight generatrices at different heights.
The geometric morphology of the ditch-cleaning blade’s guide curve is determined by its height, opening width, and the tangents at its two endpoints [23] (Figure 4). Parameters used in the preliminary design are listed in Table 2. The height corresponds to the maximum vertical dimension of the blade surface and is consistent with the target ditching depth. A smaller opening width results in a steeper blade profile and reduced soil accumulation on the blade surface; however, it impedes the rearward sliding of soil along the curved surface. Conversely, a larger opening width produces a flatter blade profile, facilitating soil movement rearward along the surface, but it increases soil accumulation between the cutter head and the cleaning blade.

2.3. Identifying Key Parameters

The operational power consumption is a crucial determinant in the performance of ditch-forming machines; hence, key parameters are selected based on the minimum power consumption. The total power consumption of the perimeter ditch discarding machine is primarily composed of the cutter head’s soil-cutting power consumption, direct soil-conveying and -throwing power consumption, indirect soil-conveying and -throwing power consumption, and the ditch-cleaning blade’s traction power consumption. Collectively, these components account for 70% to 80% of the total power consumption. Therefore, analyzing the characteristics of the cutter head’s soil-cutting power consumption, soil-conveying and -throwing power consumption, and the cleaning blade’s traction power consumption enables the identification of key factors influencing the overall machine power consumption [22].

2.3.1. Factors Affecting Power Consumption in Soil Cutting by Disc Cutters

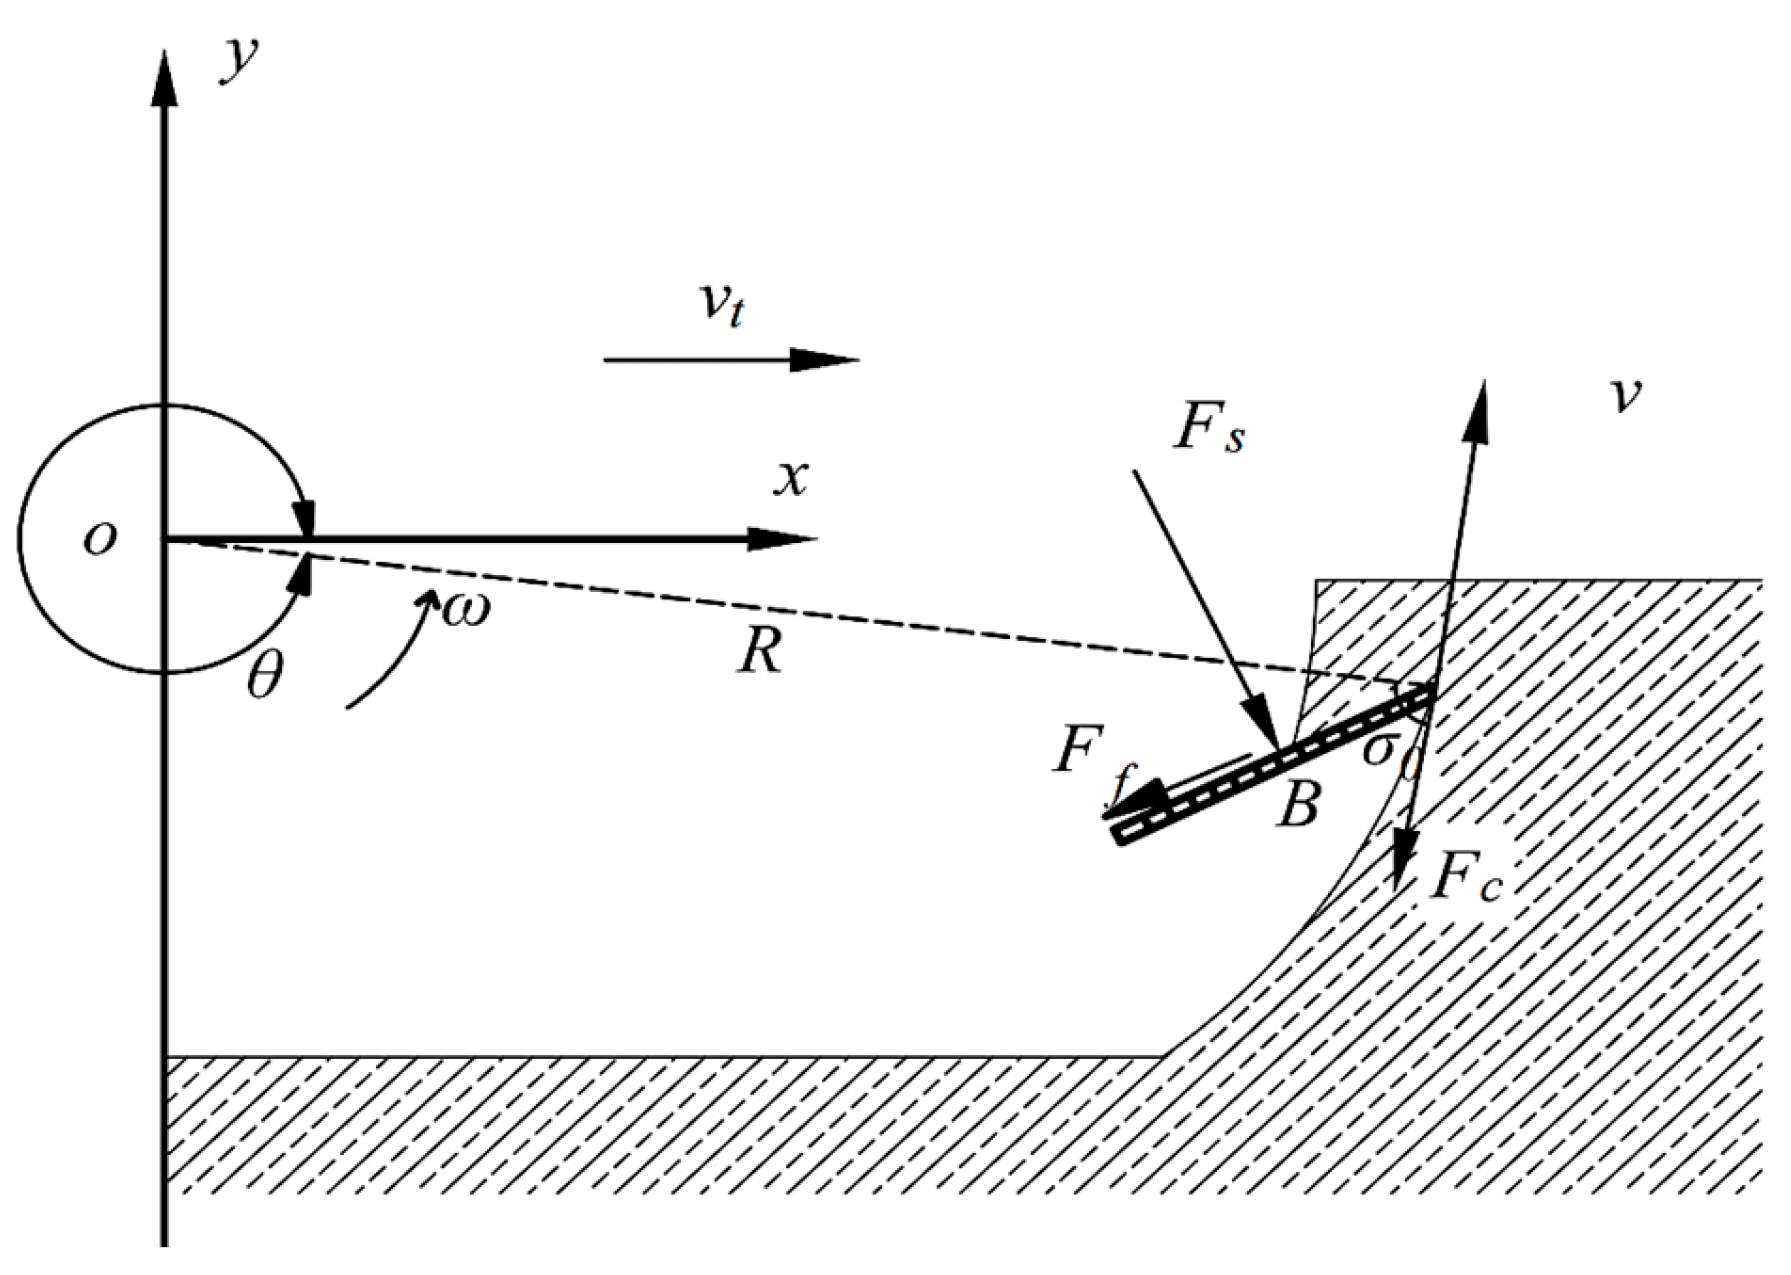
During operation of the stepped cutter head, power is consumed to overcome two main resistance components. Firstly, the soil-cutting resistance torque arises from overcoming the soil shear strength and friction during the cutting action. Secondly, the soil compression resistance (Figure 5) is generated by the tangent plane of the rotary tiller blade pressing against the soil during cutting. Although soil deformation during cutting is relatively small, making the power consumed directly by the compression resistance negligible, this resistance significantly influences the magnitude of the soil-cutting resistance and the frictional resistance. Research by Song Jiannong et al. [12,24] demonstrates that the total resistance acting on a blade during soil cutting comprises three components: the soil-cutting resistance at the blade edge, the soil compression resistance generated by the tangent plane pressing against the soil, and the frictional resistance between the soil and the blade surface. The total soil compression resistance, Fs, can be calculated using the following formula:
F S = F S i + F S o
F s i = K s i B l δ i ω s i n σ λ × R i 2 R i B s i n σ 0 + B 2 4 1 2 λ i s i n θ i + λ i 2
F s o = w o w i 2 × K s o l δ o ω s i n σ λ × R o 2 w o w i 2 R 2 s i n σ 0 + ( w o w i ) 2 16 × 1 2 λ o s i n θ o + λ o 2
where Fsi and Fso are the soil compression resistances for the inner and outer blades, respectively (N). Ksi and Kso are the soil compression resistance coefficients for the inner and outer blades, respectively, determined experimentally. These coefficients depend on the soil’s mechanical properties, the soil-cutting speed, the thickness of the soil fragment cut by the inner blade (δi), the thickness of the soil fragment cut by the outer blade (δo), and the curved length (l) of the leading edge on the blade’s tangent plane. Wi and Wo are the widths of the inner and outer blade groups, respectively (m). σ is the blade’s skew cutting angle (rad). λi = Riω/vt and λo = Roω/vt are the rotary tillage speed ratios for the inner and outer blade groups, respectively. Ri and Ro are the radii of the inner and outer blade groups, respectively (m). θi and θo are the angles between the blade’s radius of rotation and the vertical direction for the inner and outer blades, respectively (rad).
As indicated by Equations (3) and (4), the total soil compression resistance (Fs) varies with the soil fragment thickness (δi, δo) and the cutter disc rotation angle (θ) (which changes the specific cutting position). The soil fragment thickness itself is related to the widths of the inner and outer blade groups and the soil-cutting pitch. Experimental studies establish that the frictional resistance (Ff) depends on the soil characteristics and the normal pressure on the blade contact surface. It can be expressed by Equation (5):
F f i / f o = C u A i / o + K f F s i / s o
where Ffi and Ffo are the frictional resistances for the inner and outer blades, respectively (N). Cu is the soil’s adhesion coefficient (kPa). Ai is the area of the inner blade’s tangent plane (m2). Ao is the sum of the tangent plane areas of the inner and outer blades minus the overlapping area between them (m2). Kf is the coefficient of friction between the blade and the soil.
The total soil-cutting resistance (Fc) acts at the blade edge, opposing the soil-cutting velocity direction, and is calculated by Equations (6) and (7):
F c =   F c i   + F c o
F c i / c o = K c i / c o δ i / o v c i / c o l
where Fci and Fco are the soil-cutting resistances for the inner and outer blades, respectively (N). Kci and Kco are the soil-cutting resistance coefficients for the inner and outer blades, respectively (kPa). These coefficients, determined experimentally, depend on the blade parameters and soil mechanical properties. vci and vc are the soil-cutting velocities of the inner and outer blades, respectively (m/s). l is the curved length of the leading edge on the blade’s tangent plane (m).
The absolute soil-cutting velocity (v) at the blade tip is the vector sum of the machine’s forward travel speed (vt) and the tangential velocity due to blade rotation about the shaft. It can be represented as follows:
ν = ν t 2 + R 2 ω 2 + 2 ν t R ω c o s θ
Therefore, the total cutter head soil-cutting power consumption (Pc) is given by Equation (9):
P c = F f i + F c i ν i + F f o + F c o ν o = K c i δ i R i ω l + C u A i + K f F S i ν i + K c o δ o R o ω l + C u A o + K f F S o ν o
where vi and vo are the absolute soil-cutting velocities for the inner and outer blades, respectively (m/s).
Equation (9) demonstrates that the primary factors influencing soil-cutting power consumption are the soil’s mechanical properties, the structural parameters of the blade groups (inner/outer widths, soil-cutting pitch, inner/outer radius), and the operational parameters (forward speed, cutter shaft rotational speed).

2.3.2. Factors Influencing Soil-Conveying and -Throwing Power by Disc Cutters

The cutter head’s soil-conveying and -throwing power consumption is categorized into that associated with directly engaged soil and that associated with indirectly engaged soil. Directly engaged soil refers to the soil initially contacted by the cutter head during forward motion. Indirectly engaged soil primarily consists of soil accumulated on the ditch-cleaning blade, which itself originates from soil scraped off the ditch walls by the cleaning blade and backfill soil that has fallen into the ditch.
(1)
Power Consumption for Direct Soil Conveying and Throwing
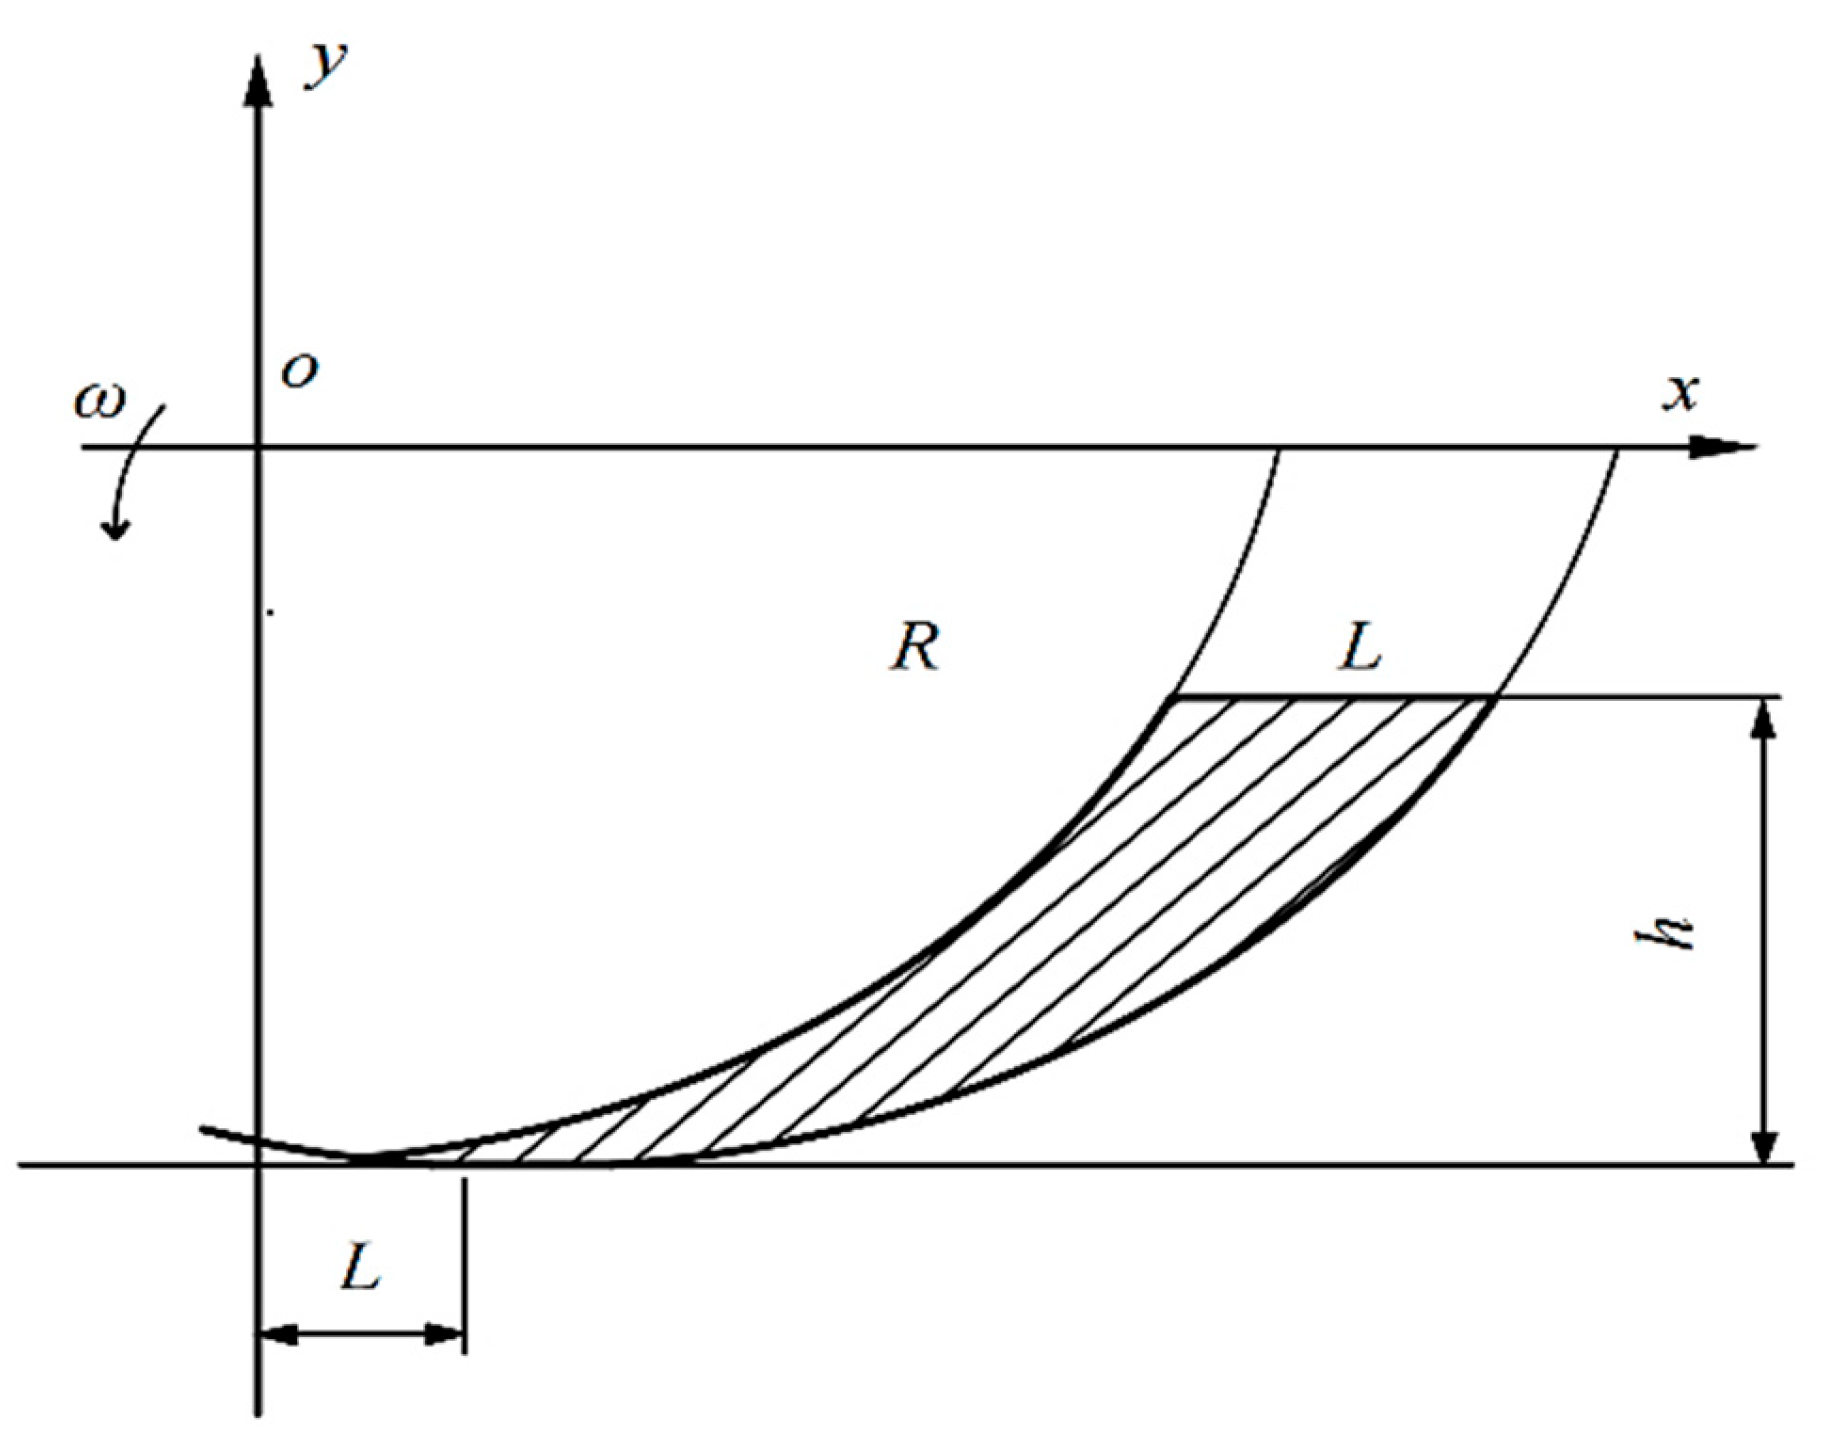
Assuming the cut soil fragment remains an integral unit until thrown (Figure 6), its longitudinal section shape is defined by the area enclosed by the cutting trajectory lines of two adjacent blades and a straight line segment equal in length to the soil-cutting pitch (L), with a height corresponding to the ditching depth (h). The width of the soil fragment cut by the inner blade group is equal to the inner blade group width (Wi), while the width of the fragment cut by the outer blade group is equal to the difference between the outer and inner blade group widths (Wo–Wi). The mass of these soil fragments can be expressed as follows:
m i / o = ρ L i / o h i / o o W i / o
where ρ is the soil bulk density (kg/m3), Li, Lo are the soil-cutting pitches for the inner and outer blade groups, respectively (mm), and hi, ho are the ditching depths achieved by the inner and outer blade groups, respectively (mm).
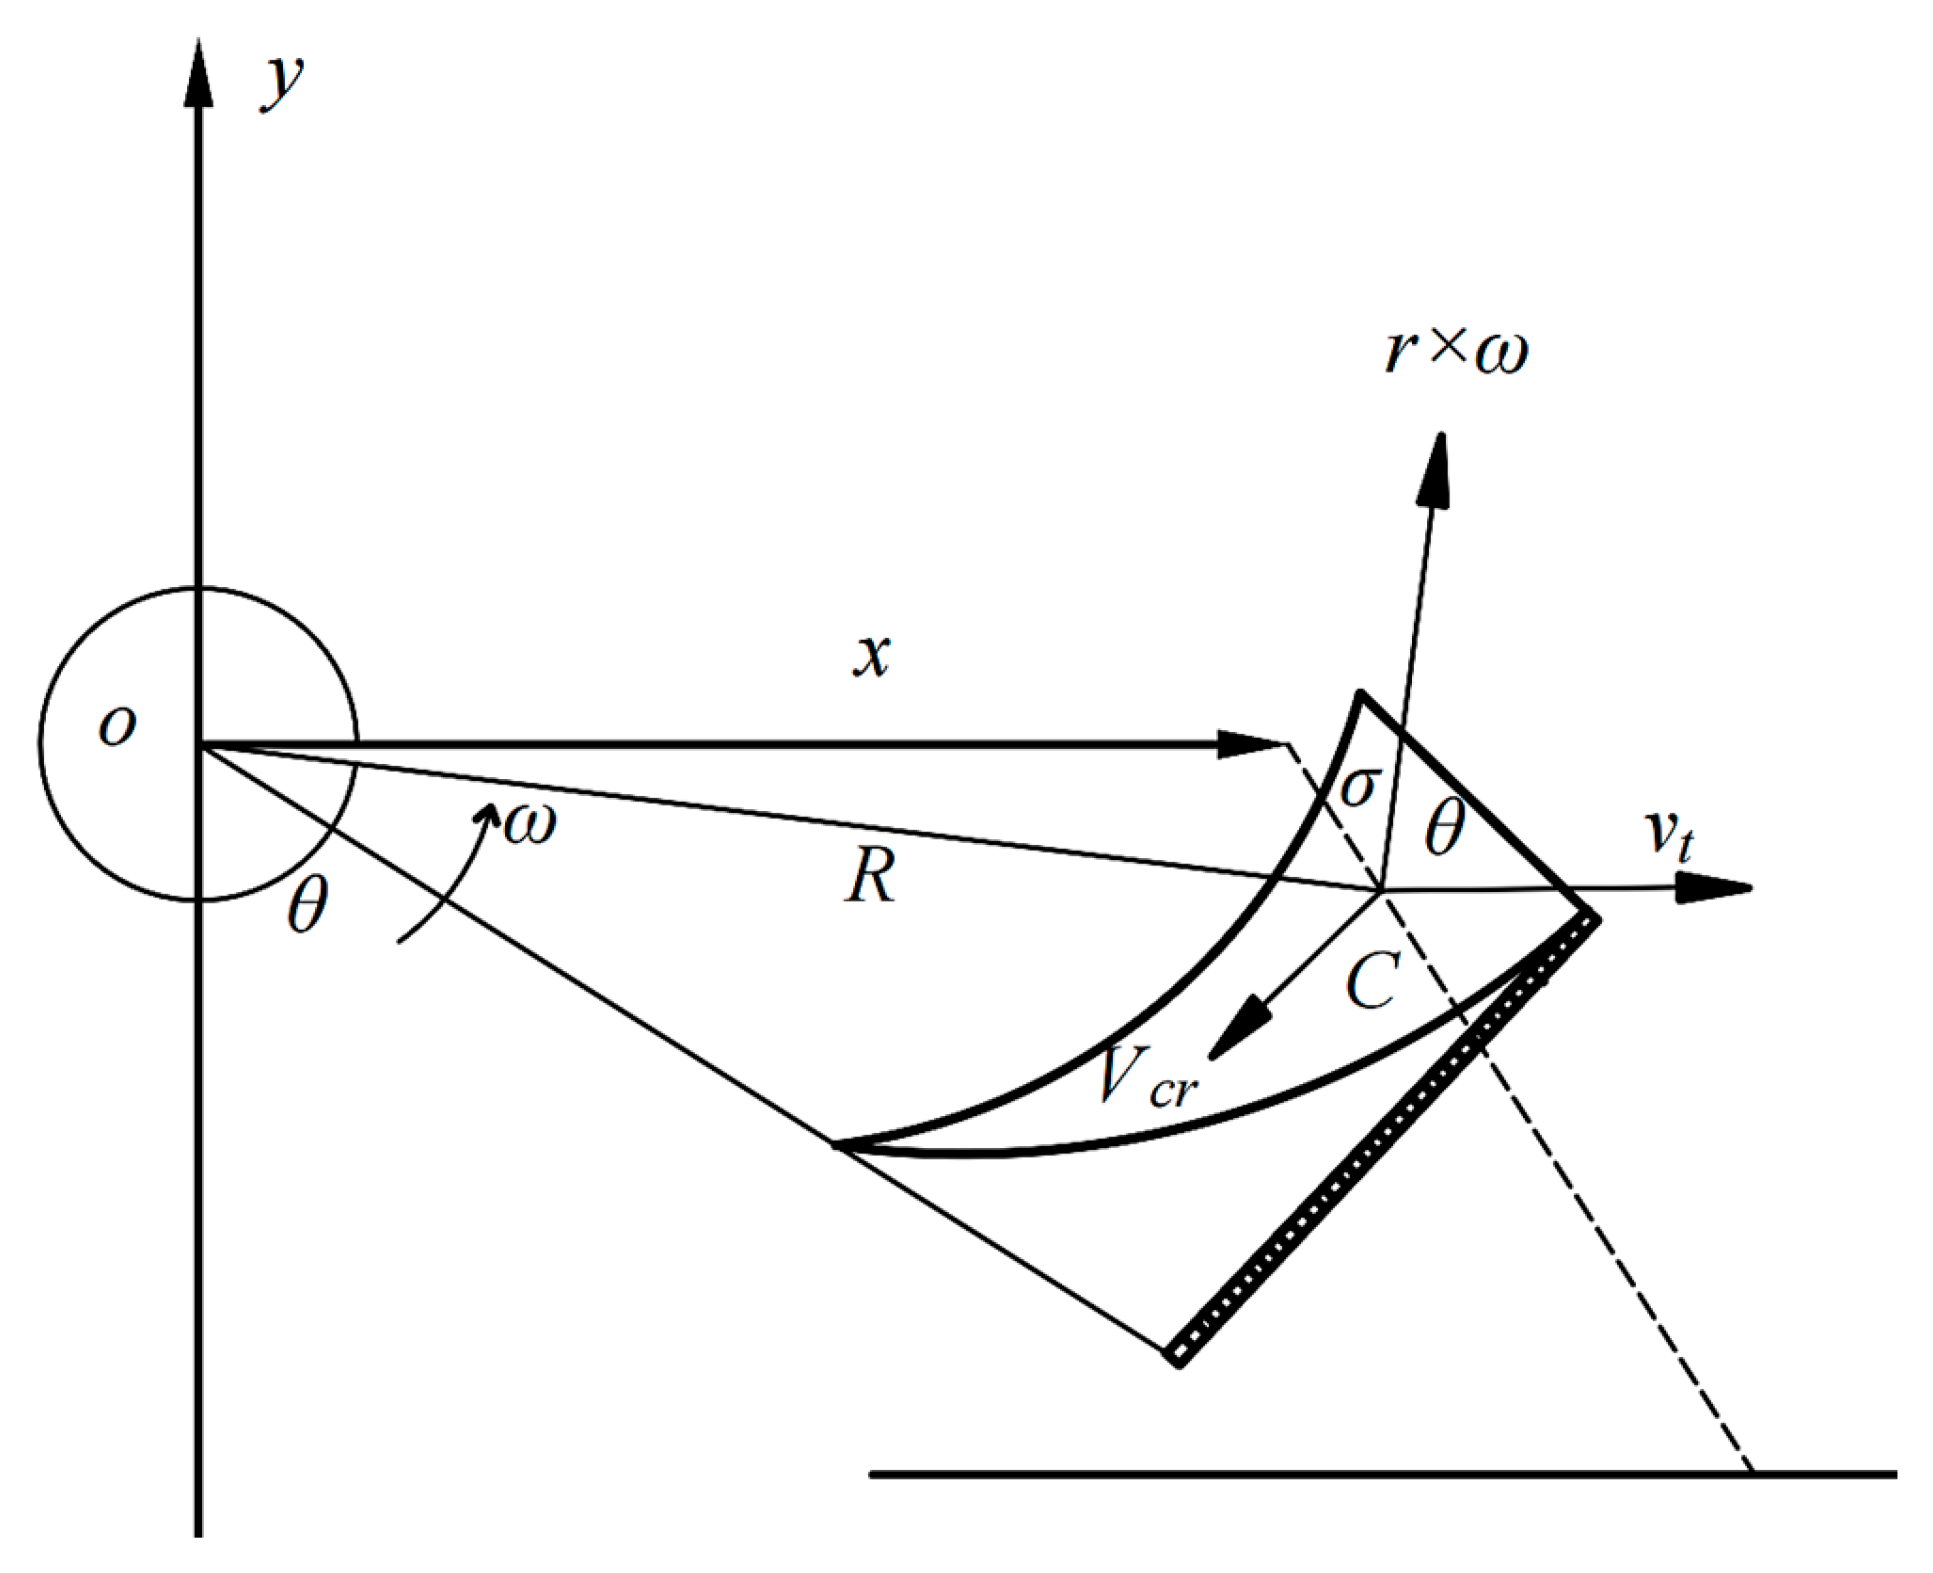
During the movement of the soil fragment, the cutter head must overcome the sliding friction force between the blade’s tangent plane and the soil fragment and the moment generated by the soil fragment’s gravity about the rotation axis (Figure 7). The soil fragment detaches from the blade when the normal pressure exerted by the soil fragment on the blade’s tangent plane becomes zero. Subsequently, its center of mass undergoes oblique projectile motion. To simplify the analytical model, the velocity component of the soil fragment’s center of mass along the axial direction of the rotation axis is neglected. Consequently, the center-of-mass motion is confined to the plane defined by the machine’s forward direction and the vertical direction. According to the theorem of velocity composition, the absolute velocity of the fragment’s center of mass is given by
ν c a i / c a o = ν c e i / c e o + ν c r i / c r o = ν t + r i / o × ω + ν c r i / c r o = ν t x + r i / o ω cos θ i / o x + r i / o ω sin θ i / o y ν c r i / c r o s i n ( θ i / o + σ ) x + ν c r i / c r o c o s ( θ i / o + σ ) y
where vcai, vcei, vcri, vcao, vceo, vcro represent the absolute velocity, the transport (entrainment) velocity, and the relative velocity of the inner/outer soil fragment’s center of mass, respectively (m/s). x, y are the unit vectors in the positive direction of the coordinate axes. rI, ro are the radii of the circumference at the center of mass of the inner/outer soil fragment (m). Assuming the fragment thickness is half the soil-cutting pitch, ri/o = Ri/oLi/o/2.
Based on the operational characteristics of the stepped cutter head, the power consumption for direct soil conveying and throwing can be expressed as follows:
P P 1 = M z i ω + M z o ω = m i ν c r i ν t cos θ i + σ + m i r i sin σ d ν c r i d t ω + m o ν c r o ν t cos θ o + σ + m o r o sin σ d ν c r o d t ω
where Mzi, Mzo are the combined moments acting on the cutter head shaft due to the frictional torque between the soil fragment and the rotary tiller blade and the gravitational moment of the soil fragment cut by the inner/outer blade group (N·m). σ is the blade’s skew cutting angle (rad). ω is the angular velocity of the cutter head (rad/s).
(2)
Power Consumption for Indirect Soil Conveying and Throwing
The indirect soil conveying and throwing handled by the cutter head involves soil accumulated on the ditch-cleaning blade. The calculation method for this power consumption is similar to that for direct soil conveying and throwing. However, field observations indicate that interaction between the outer blade group and soil accumulated on the cleaning blade is minimal; therefore, its contribution can be neglected in calculations. Consequently, the inner blade group dominates the indirect conveying and throwing power consumption. Furthermore, due to the synergistic action of the cutter head’s direct operation and the cleaning blade, both the interparticle cohesive forces within the soil on the cleaning blade and the friction between the soil and the blades are reduced compared to the region of direct contact with the cutter head. The power consumption for indirect soil conveying and throwing can thus be expressed as follows:
P P 2 = m 2 ν c r 2 ν t cos θ i + σ + m 2 r i sin σ d ν c r 2 d t ω
where m2 is the mass of the soil fragment involved in indirect conveying and throwing (kg). Its value depends on the cleaning blade shape, the thickness of accumulated soil on the blade, the density of accumulated soil, the inner blade group width, and the soil-cutting pitch. vcr2 is the relative velocity of the soil fragment (m/s).
Combining Equations (12) and (13), the total cutter head soil-conveying and -throwing power consumption is given by
P P = P P 1 + P P 2 =     m i ν c r i ν t cos θ i + σ + m i r i sin σ d ν c r i d t ω + m o ν c r o ν t cos θ o + σ + m o r o sin σ d ν c r o d t ω + m 2 ν c r 2 ν t cos θ i + σ + m 2 r i sin σ d ν c r 2 d t ω
Equation (14) reveals that the primary factors influencing the soil-conveying and -throwing power consumption are the machine’s forward speed, the cutter head’s angular velocity, and the blade’s skew cutting angle. Additionally, factors such as the inner/outer blade group widths, the distance between the inner and outer blade groups, and the cleaning blade structure affect the mass of soil being conveyed and thrown. The ditcher’s soil fragmentation capability and the radii of the inner/outer blade groups indirectly influence the relative velocity of the soil fragment with respect to the tangent plane during conveying. These factors consequently impact the conveying and throwing power consumption. Specifically, an increase in the widths of the inner and outer blade groups and a decrease in the distance between them lead to a reduction in the mass of soil involved in indirect conveying and throwing, thereby decreasing the corresponding power consumption.

2.3.3. Factors Affecting Tractive Power Consumption of Ditch-Cleaning Shovel

The types of resistances encountered by the ditch-cleaning blade during soil pushing share similarities with the soil-cutting resistance of the cutter head. The blade must overcome (1) the soil shear strength, (2) the friction between the blade and the ditch wall soil, and (3) the additional resistance generated by the movement of soil accumulated on the blade itself. Concurrently, the front face of the cleaning blade body compresses the soil, generating soil compression resistance. Although the degree of soil deformation during compression is relatively small, rendering the power consumed directly by this resistance negligible, it nevertheless influences the magnitude of the soil-cutting resistance and frictional resistance. Therefore, the traction power consumption can be represented as follows:
P b = C P c c + P c b
where C is a conversion coefficient relating the sum of the cleaning blade’s soil-cutting power consumption and soil-conveying power consumption to the traction power consumption. Its value depends on the coupled effects of the cleaning blade geometry, soil mechanical properties, and operational parameters. Pc is the soil-cutting power consumption of the cleaning blade (kW). Pcb is the soil-conveying power consumption of the cleaning blade (kW).
The soil-cutting power consumption is primarily influenced by the soil mechanical properties, operational parameters (operating speed, working range of the cleaning blade), and structural parameters (e.g., cleaning blade opening width). Since the cutter head structure modifies the soil mechanical properties in the region where the cleaning blade operates, it consequently affects Pcc. The soil-conveying power consumption is mainly related to the operating speed and the mass of soil accumulated on the cleaning blade. Parameters such as the inner blade group width, cutter shaft rotational speed, cleaning blade opening width, and cutter head’s soil fragmentation capability alter the mass of accumulated soil on the cleaning blade, thereby also influencing Pcb.
In summary, the power consumption of the ditching components is determined by the soil mechanical properties, operational parameters (forward speed, cutter shaft rotational speed), and structural parameters (inner/outer blade group widths, soil-cutting pitch, distance between inner and outer blade groups, cleaning blade opening width, blade skew cutting angle).

2.4. Operational Simulation of Ditching Unit

To investigate the influence mechanism of the cutter head and ditch-cleaning blade structural parameters on the operational power consumption of the ditching components, single-factor simulation experiments based on the Discrete Element Method (DEM) were conducted, focusing on the inner blade group width, outer blade group width, distance between the inner and outer blade groups, and ditch-cleaning blade opening width. Building upon the single-factor results, Box–Behnken simulation experiments were performed using these four parameters as influencing factors. A genetic algorithm was employed to determine the optimal parameter combination, which was compared with the pre-optimization cutter head and cleaning blade configuration. In the pre-optimization ditcher, the cutter head comprised only the inner blade group with a width of 200 mm, and the cleaning blade had an opening width of 530 mm; all other parameters remained consistent with the optimized configuration.

2.4.1. Discrete Element Model

The DEM is widely used to predict soil–tool interaction mechanisms and mechanical performance [25,26]. Considering the cohesive and elastoplastic characteristics of soils in rapeseed fields within the hilly, mountainous areas of the middle and lower Yangtze River and southern regions [27], the Hertz–Mindlin with JKR Cohesion contact model—specifically designed for simulating cohesive wet particles—was adopted for interactions between soil particles. This model comprehensively accounts for the influence of cohesive forces between soil particles on their motion [28,29,30,31,32]. The cutter head material was selected as 45# steel. Basic physical parameters for both soil and steel, referenced from [27,33], are detailed in Table 3. The simulation utilized a soil bin model with dimensions of 2000 mm (length) × 600 mm (width) × 500 mm (height). The DEM simulation model is illustrated in Figure 8.

2.4.2. Evaluation Metrics and Methods

The power consumption of the perimeter ditch discarding machine primarily comprises the cutter head soil-cutting power consumption, soil-conveying and -throwing power consumption, and cleaning blade traction power consumption. Among these, Pc and Pp are predominantly influenced by the cutter head resistance torque (T), while Pb is directly related to the cleaning blade traction resistance (F). Consequently, both the single-factor experiments and the Box–Behnken optimization experiments used the cutter head resistance torque (T) and cleaning blade traction resistance (F) as evaluation metrics. The total operational power consumption was calculated using Equations (16)–(18):
P = K P c + P p + P b
P c + P p = T n 9550
P b = F v 1000
where P is the total operational power consumption (kW); Pc is the cutter head soil-cutting power consumption (kW); Pp is the cutter head soil-conveying and -throwing power consumption (kW); Pb is the cleaning blade traction power consumption (kW); K is the conversion coefficient relating Pc, Pp, and Pb to P, which is 70–80% [22]; n is the rotational speed of the cutter shaft (r/min); v is the machine forward speed (m/s).

2.5. Field Experiments

2.5.1. Test Conditions and Equipment

To validate the operational performance of the optimized ditch discarding machine, field trials were conducted in April 2025 at the Rapeseed Demonstration Base of the Yingchang Agricultural Machinery Cooperative in Shashi Town, Liuyang City. The test site coordinates were (E113.5°, N28.3°). Equipment included a Lovol wheeled tractor (rated power: 58.8 kW), the KX-40 rapeseed field perimeter ditch discarding machine, an NJTY3 wireless measurement system for tractor three-point hitch and traction force, a DHS-10A soil moisture meter, a JK-750-I soil penetrometer, a soil core sampler, tape measures, a steel ruler, a stopwatch, and an electronic scale. The test plot measured 40 m long × 35 m wide. The soil is clay loam, with the mass fractions for particle sizes >5 mm, 5–2.5 mm, 2.5–1 mm, and <1 mm being 11.64%, 24.38%, 42.89%, and 21.09%, respectively. Within the 0–400 mm soil depth, the average soil firmness is 2850 kPa, the moisture content is 15.9%, and the bulk density is 1.42 g/cm3.

2.5.2. Test Methods and Evaluation Metrics

Testing was conducted along the length of the plot near the field ridge. Two sets of experiments were performed: Test 1 (Control Group) utilized the pre-optimization discarding machine configuration (cutter head with only the inner blade group, width: 200 mm; trapezoidal cleaning blade: 530 mm). Test 2 (Test Group) utilized the optimized configuration (stepped cutter head and trapezoidal cleaning blade). All other parameters were identical between the two configurations.
During operation, the tractor operated in gear 1, maintaining a speed of about 0.6 m/s. The tractor Power Take-Off (PTO) speed was set to 720 r/min, and the working depth was fixed at 400 mm. Each test group was replicated three times. The operator monitored the engine tachometer and an onboard GPS speedometer, adjusting the throttle to ensure stable PTO speed and tractor travel speed.
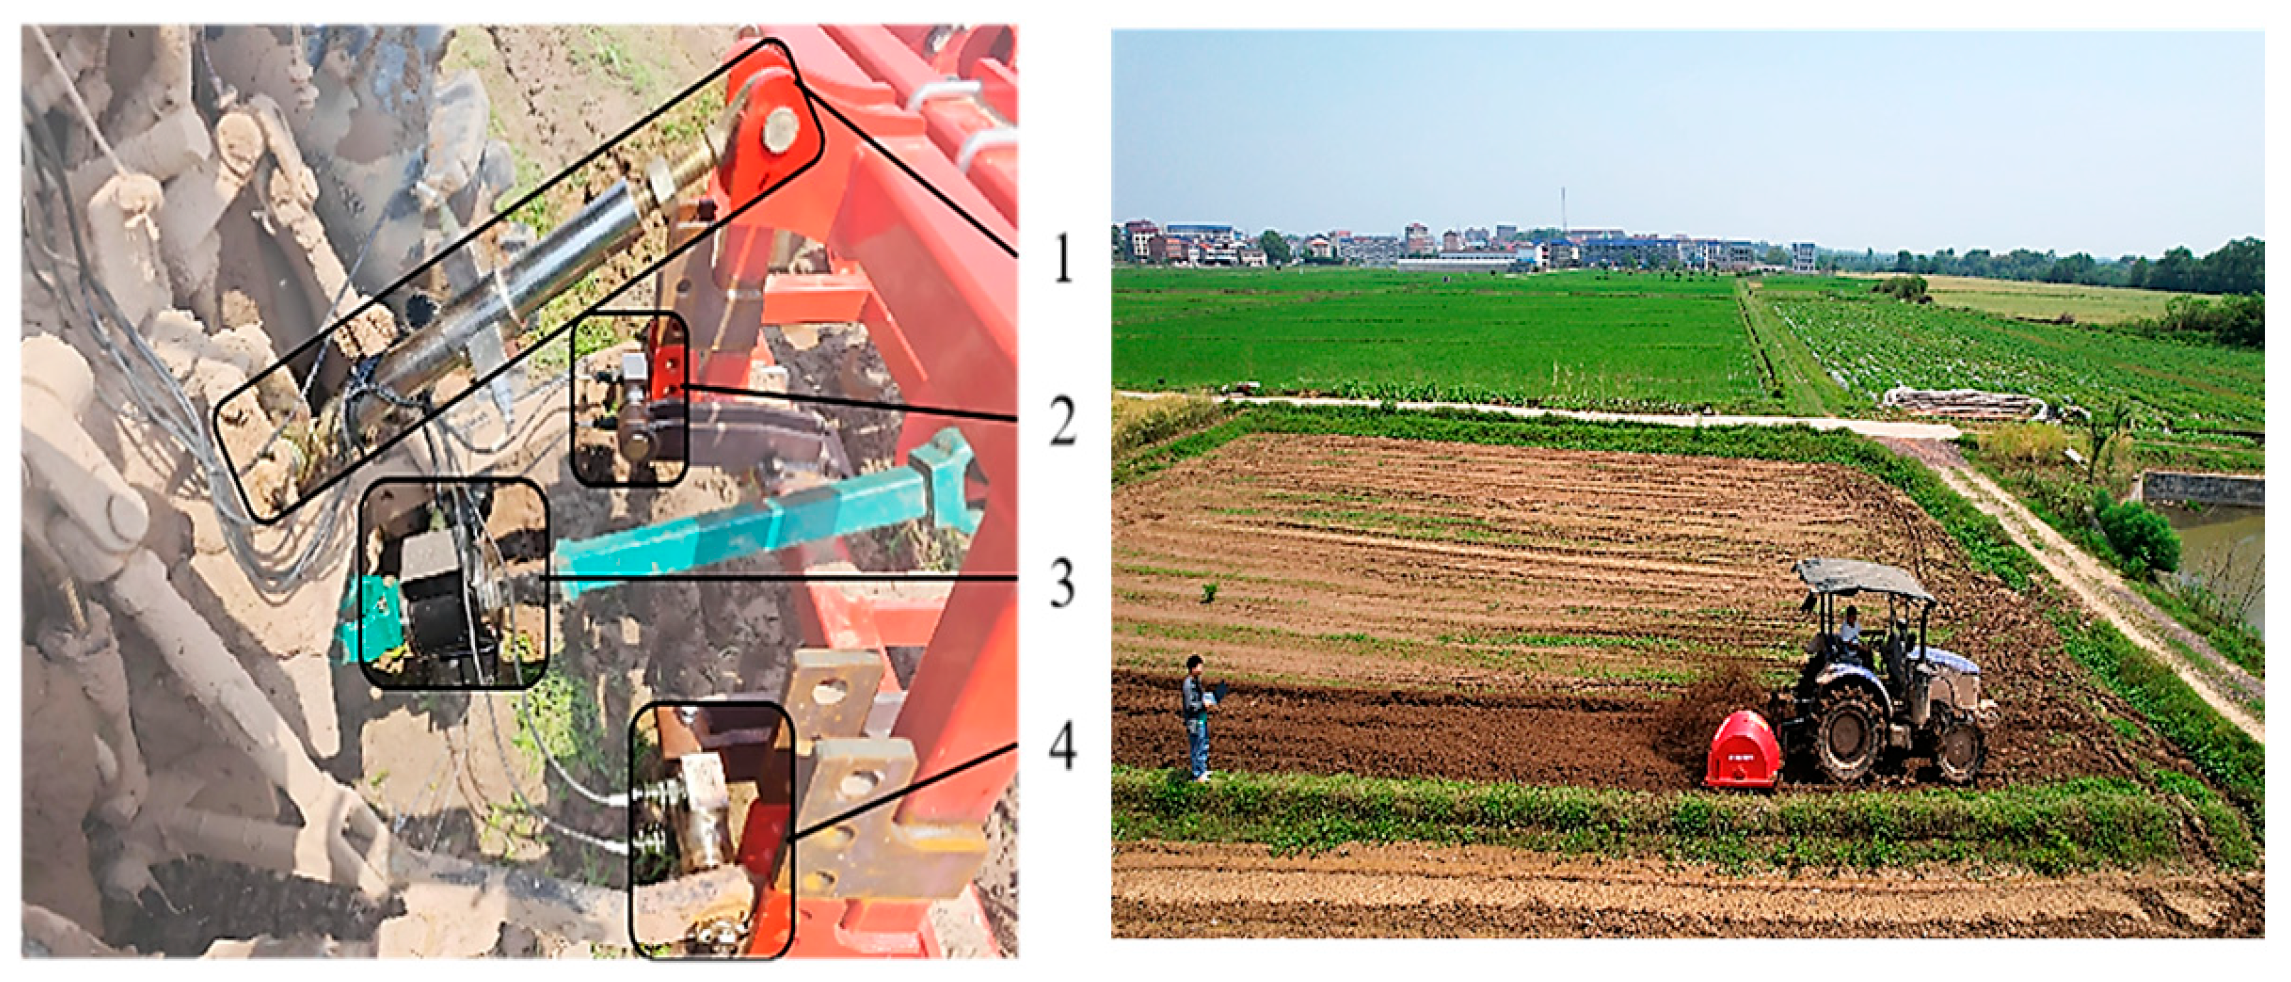
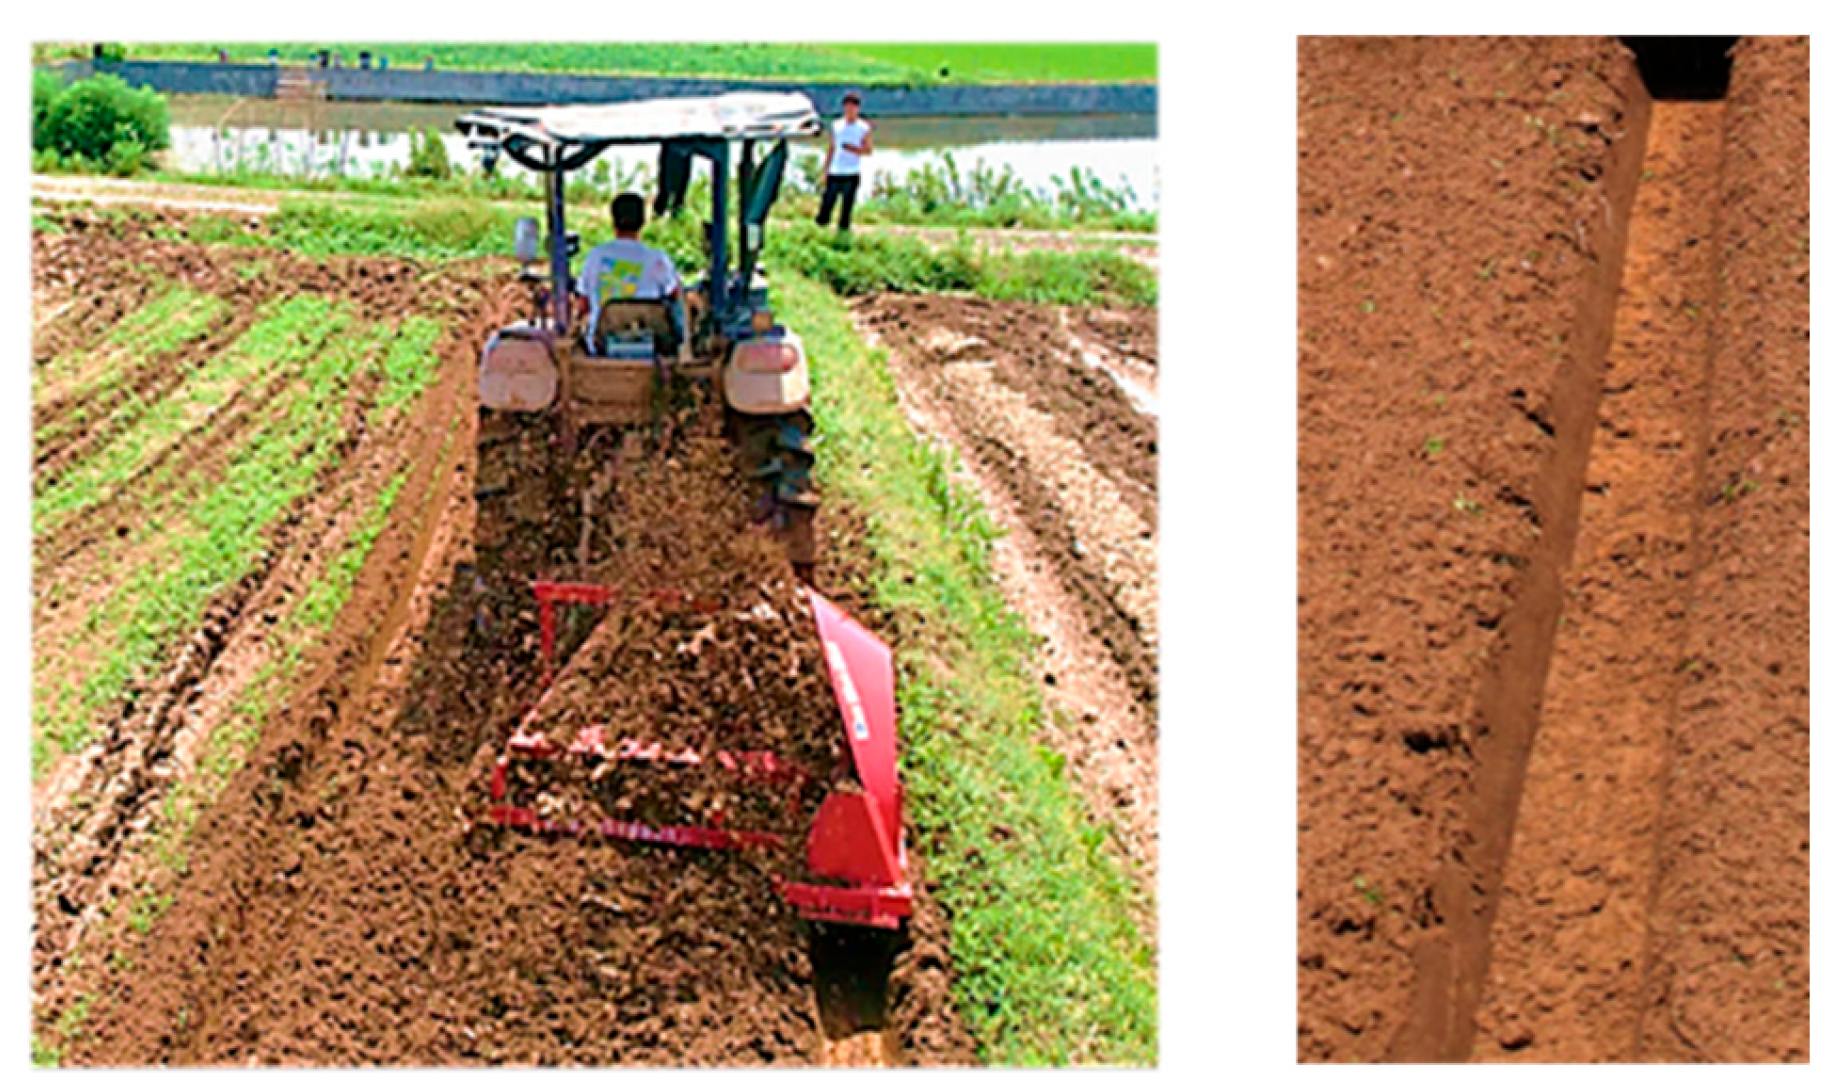
Each test run spanned 30 m. To minimize the influence of start–stop transients on data collection, the central 20 m section was designated as the data acquisition zone. At 2 m intervals along this zone, sampling points were established. At each point, the ditch depth, upper top width, bottom width, and backfill soil thickness were measured using a tape measure. Stability coefficients and backfill rates were subsequently calculated. Operational power consumption was measured using the wireless three-point hitch and traction force system installed on the ditch discarding machine. This system transmitted torque and traction force data in real time to a digital display unit, and the measured data was transferred to host computer software for power consumption calculation. The field testing process is depicted in Figure 9.

3. Results and Discussion

3.1. Single-Factor Experiments and Result Analysis

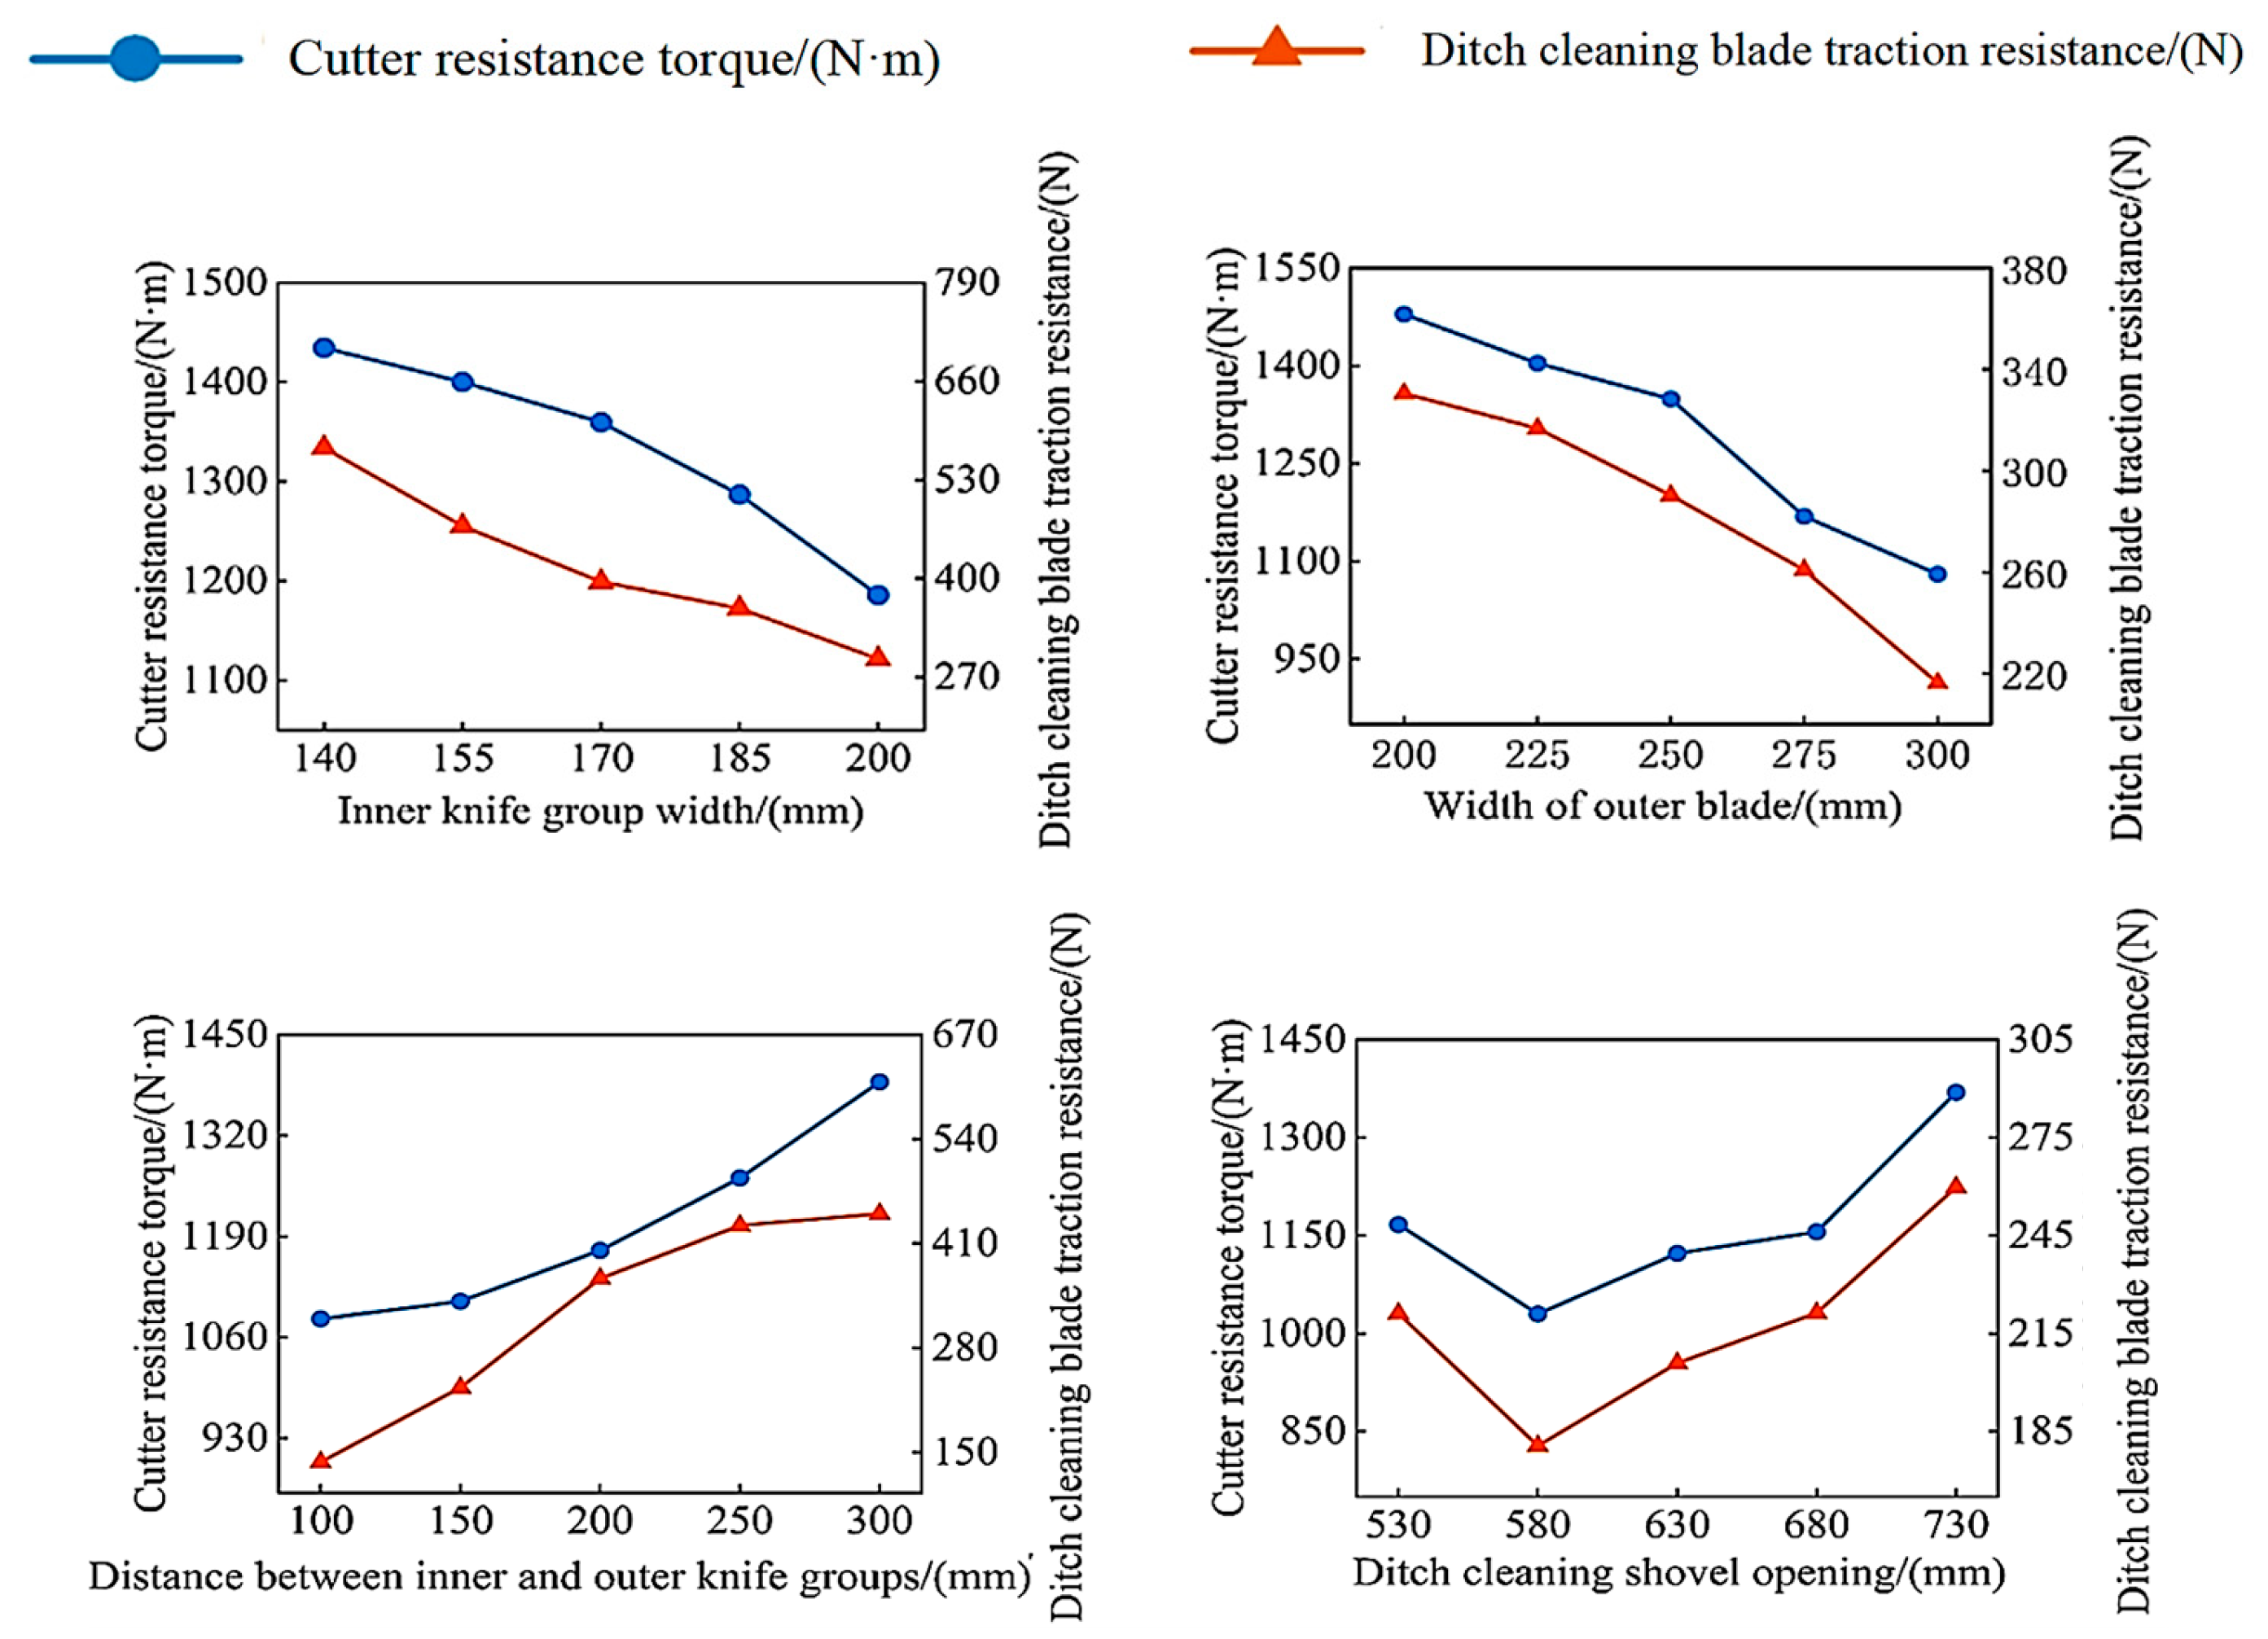
To explore the influence patterns of the inner blade group width, outer blade group width, distance between the inner and outer blade groups, and cleaning blade opening width on the cutter head resistance torque and cleaning blade traction resistance, single-factor experiments were conducted with five levels for each factor (Table 4), determined by integrating agronomic requirements, structural constraints, and pre-experimental results. The simulation parameters were set as follows: operating speed = 0.6 m/s, cutter head rotational speed = 240 r/min, and operating depth = 400 mm. When studying the effect of one factor on the performance metrics, the other three factors were maintained at their intermediate levels.

3.1.1. Influence of Inner Blade Group Width on Ditching Power Consumption

Simulation results (Figure 10) indicate that both the cutter head resistance torque and cleaning blade traction resistance decrease as the inner blade group width increases. When the inner blade group width increased from 140 mm to 200 mm, the cutter head resistance torque decreased by 17.34%, and the cleaning blade traction resistance decreased by 48.63%. This demonstrates that increasing the inner blade group width significantly reduces the operational power consumption of the ditch discarding machine, with a more pronounced regulatory effect on the cleaning blade traction resistance. Analysis via experimental and theoretical formula verification reveals that within the tested range of the inner blade group width, although increasing its width elevates the soil-cutting resistance and soil-conveying and -throwing resistance for the inner group itself, it concurrently reduces the soil-cutting resistance and conveying–throwing resistance for the outer blade group. Simultaneously, the reduction in soil accumulation on the cleaning blade decreases the indirect conveying–throwing resistance. These combined effects result in a greater overall reduction in resistance, leading to a gradual decline in the cutter head resistance torque. Furthermore, the increased inner blade group width reduces both the soil-scraping area of the cleaning blade and the quantity of accumulated soil, thereby causing a substantial decrease in the cleaning blade traction resistance.

3.1.2. Influence of Outer Blade Group Width on Ditching Power Consumption

Simulation results (Figure 10) show that both the cutter head resistance torque and cleaning blade traction resistance decrease as the outer blade group width increases. When the outer blade group width increased from 200 mm to 300 mm, the cutter head resistance torque decreased by 26.98%, and the cleaning blade traction resistance decreased by 34.57%. This indicates that increasing the outer blade group width within its operational range significantly reduces the machine’s power consumption. Analysis using experimental and theoretical formulas shows that within the tested outer blade group width range, although increasing its width raises the soil-cutting resistance and conveying–throwing resistance for the outer group itself, the reduction in soil accumulation on the cleaning blade decreases the indirect conveying–throwing resistance. This net effect produces a greater overall resistance reduction, resulting in a gradual decline in the cutter head resistance torque. Moreover, the increased outer blade group width reduces both the soil-scraping area of the cleaning blade and the volume of accumulated soil, leading to a significant decrease in the cleaning blade traction resistance.

3.1.3. Influence of Distance Between Blade Groups on Ditching Power Consumption

Simulation results (Figure 10) reveal that both the cutter head resistance torque and cleaning blade traction resistance increase as the distance between the inner and outer blade groups increases. When this distance increased from 100 mm to 300 mm, the increases were 28.19% and 224.28%, respectively. This indicates that increasing the inter-group distance significantly elevates the operational power consumption, with the cleaning blade traction resistance exhibiting higher sensitivity than the cutter head resistance torque. Analysis of the test results indicates that a larger inter-group distance reduces the volume of soil directly cut and thrown by the cutter head while increasing the volume of soil that undergoes secondary throwing after accumulating on the cleaning blade, resulting in a net increase in resistance torque. Additionally, the increased distance reduces the effective cutting and throwing area of the cutter head, thereby increasing the soil-scraping area of the ditch-cleaning blade. This results in a substantial increase in traction resistance. Simultaneously, the accumulation of soil on the ditch-cleaning blade increases, leading to a rise in additional resistance generated during its movement and soil compression resistance. The increased soil compression resistance indirectly causes an increase in the soil-cutting resistance and friction resistance of the ditch-cleaning blade.

3.1.4. Influence of Cleaning Blade Opening Width on Ditching Power Consumption

Simulation results (Figure 10) demonstrate a non-linear relationship: when the cleaning blade opening width increased from 530 mm to 580 mm, both the cutter head resistance torque and cleaning blade traction resistance decreased, by 11.74% and 18.34% respectively. Conversely, when the opening width increased further from 580 mm to 730 mm, both resistance metrics increased significantly, by 32.95% and 43.91%. This suggests that an optimal cleaning blade opening width exists for minimizing power consumption. Analysis reveals that increasing the opening width enlarges the soil contact area of the blade and allows more soil to enter the blade before being discharged; however, accumulated soil slides more readily rearward along the curved surface. Within the range of 530 mm to 580 mm, the increased blade surface promotes the lateral sliding of accumulated soil, reducing both the volume of soil requiring indirect interaction with the cutter head and the friction between the blade bottom and the soil, leading to a net reduction in resistance. However, when the opening width increases beyond 580 mm to 730 mm, the extended surface displacement path increases soil accumulation. This simultaneously elevates the cleaning blade’s soil-cutting resistance and friction, causing a sharp rise in traction resistance. Furthermore, the energy consumption associated with secondary throwing due to the coupled action between the cutter head and the cleaning blade is significantly amplified.

3.2. Box–Behnken Optimization Experiment

3.2.1. Experimental Design

Subject to the geometric constraints of the trapezoidal ditch and the structural limitations of the ditching components, coupling relationships exist between the feasible ranges of the inner blade group width (X1), the outer blade group width (X2), and the distance between the inner and outer blade groups (X3) (Equations (19)–(21)). To determine the optimal parameter combination and investigate the interactions between factors, a four-factor Box–Behnken experimental design was implemented. The independent variables were X1, X2, X3 and the ditch-cleaning blade opening width (X4). The response variables were the cutter head resistance torque (Y1) and cleaning blade traction resistance (Y2). The coding scheme for the experimental factors is presented in Table 5.
X 3 2 + 200 X z
X 2 X 1
140 X 1 200

3.2.2. Results and Analysis

(1)
Regression Model and Analysis of Variance (ANOVA)
The results of the Box–Behnken experiment are listed in Supplementary Materials Table S1.
Multiple regression fitting was performed using Design-Expert 13 software. Based on the ANOVA results presented in Supplementary Materials Table S2, the regression equations relating the cutter head resistance torque and cleaning blade traction resistance to the various factors were derived as Equations (22) and (23):
Y 1 = 1280.46 169.74 x 1 199.98 x 2 + 165.92 x 3 15.57 x 4 0.1 x 1 x 2 46.57 x 1 x 3 7.1 x 1 x 4 + 0.125 x 3 x 4 89.91 x 1 2 33.04 x 2 2 59.8 x 2 x 3 + 68.1 x 3 2 + 87.77 x 4 2 0.325 x 2 x 4
Y 2 = 467.38 193.8 x 1 54.87 x 2 + 176.15 x 3 4.97 x 4 0.075 x 1 x 2 46.43 x 1 x 3 2.55 x 1 x 4 + + 0.025 x 3 x 4 + 63.28 x 1 2 32.22 x 2 2 9.8 x 2 x 3 86.7 x 3 2 + 37.1 x 4 2 0.075 x 2 x 4
Additional file Table 2 indicates that the second-order response surface models for both Y1 and Y2 were highly significant (p < 0.01), and their lack-of-fit terms were not significant (p > 0.05). This confirms the high fitting accuracy of the regression models, validating their use for subsequent optimization analysis of the ditching component parameters. For the cutter head resistance torque (Y1), factors X1 (inner blade group width), X2 (outer blade group width), and X3 (distance between blade groups) exhibited highly significant (p < 0.01) effects. Quadratic terms X12, X32, and X42 (cleaning blade opening width) showed significant (p < 0.05) effects, while all other terms were non-significant. The primary influencing factors on Y1, in descending order, were as follows: the outer blade group width (X2) > inner blade group width (X1) > distance between blade groups (X3) > cleaning blade opening width (X4). For the cleaning blade traction resistance (Y2), factors X1, X2, and X3 and the quadratic terms X12 and X32 exhibited highly significant (p < 0.01) effects. The interaction term X1X3 and the quadratic term X42 showed significant (p < 0.05) effects, with all other terms being non-significant. The primary influencing factors on Y2, in descending order, were as follows: the inner blade group width (X1) > distance between blade groups (X3) > outer blade group width (X2) > cleaning blade opening width (X4).
(2)
Analysis of Interaction Effect Influence
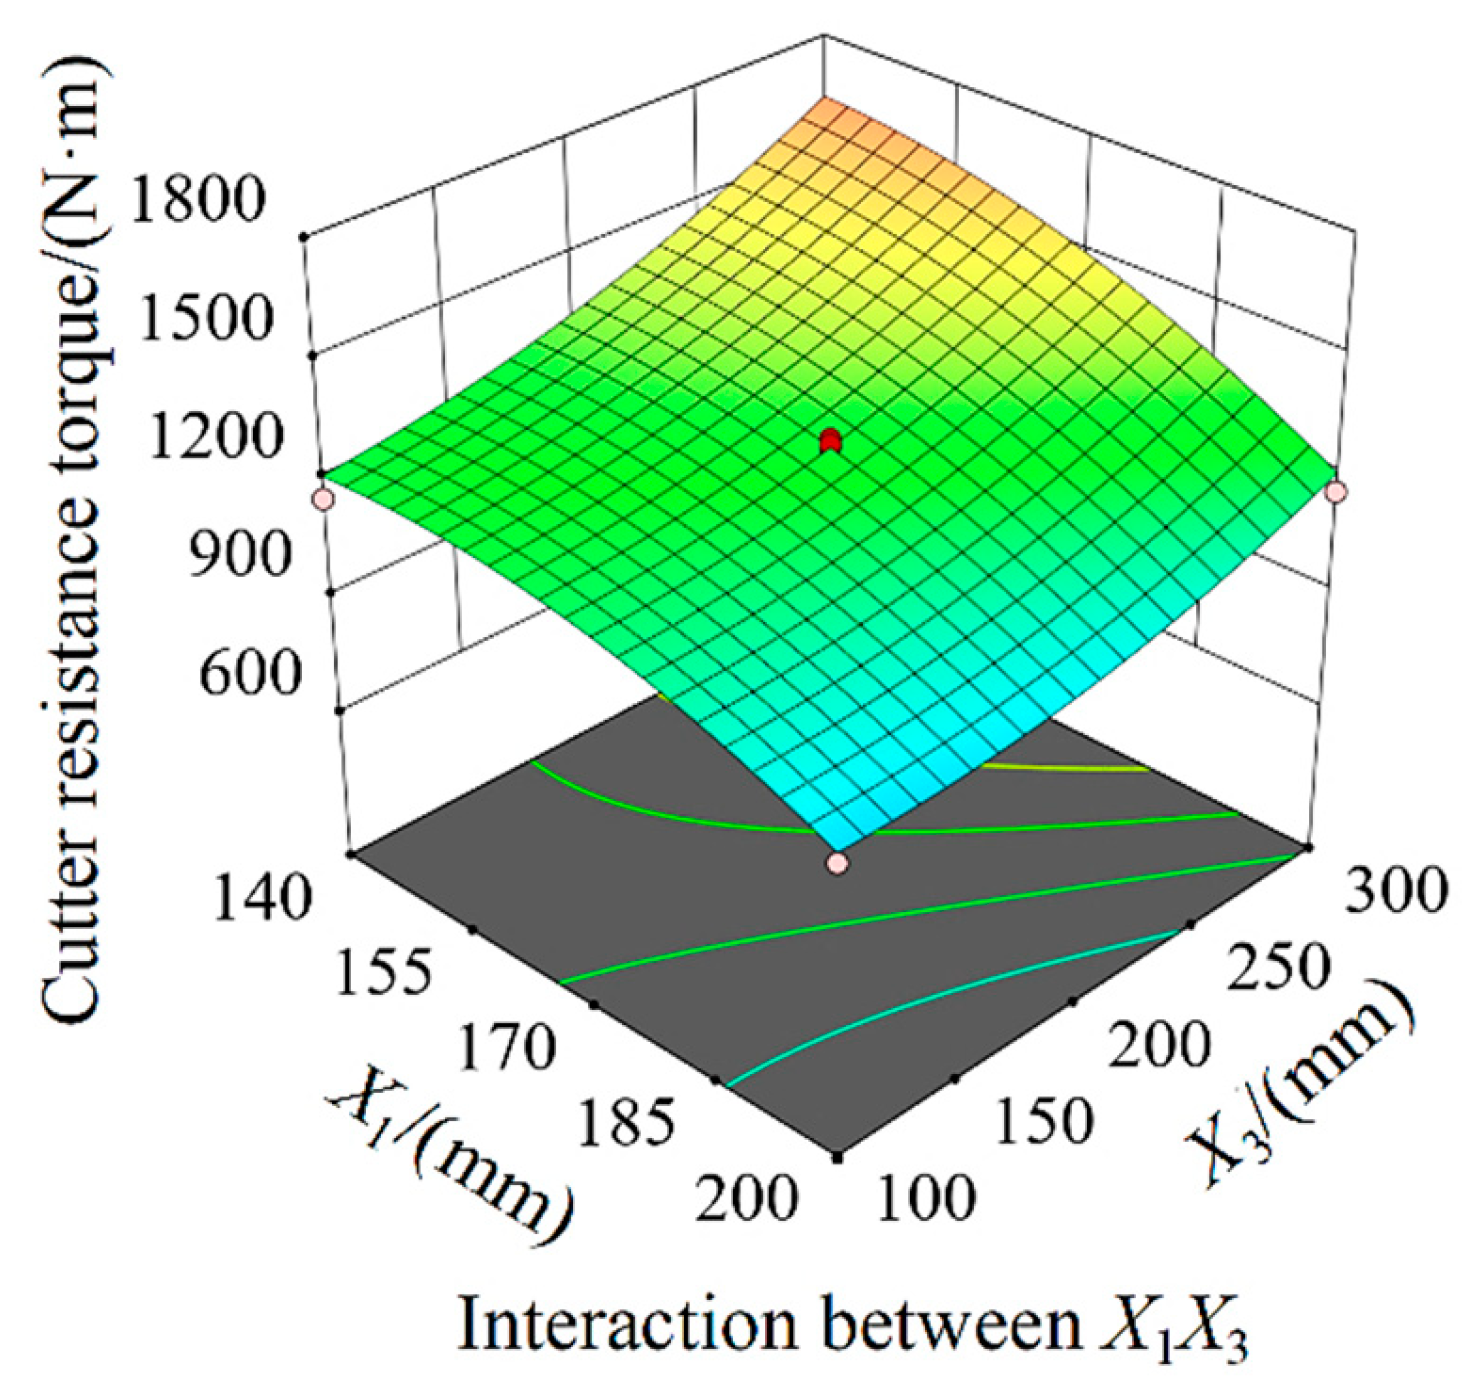
Analysis of the ANOVA results (Supplementary Materials Table S2) revealed that, within the tested ranges of the factors, only the interaction between the inner blade group width (X1) and the distance between blade groups (X3) had a significant effect on the cleaning blade traction resistance (Y2). Specifically, smaller inner blade group widths combined with larger distances between blade groups resulted in higher cleaning blade traction resistance (Figure 7). The interactions of the remaining factors were not significant, so response surface analysis was not performed.
(3)
Multi-Objective Optimization Based on Genetic Algorithm
To analyze the optimal parameter combination for the ridge-trenching machine, a multi-objective optimization analysis was conducted targeting the cutter head resistance torque (Y1) and cleaning blade traction resistance (Y2). Based on Equations (22) and (23), the cutter head’s soil-cutting power consumption (Pc), soil-throwing power consumption (Pp), and the cleaning blade’s traction power consumption (Pb2) were calculated.
A multi-objective optimization was performed on the cutter head soil-cutting power consumption (Pc), soil-throwing power consumption (Pp), and cleaning blade traction power consumption (Pb). According to simulation results, the primary sources of power consumption for the ridge-trenching machine are the cutter head’s soil-cutting and soil-throwing operations. Consequently, for optimization, the combined weight of the soil-cutting and soil-throwing power consumption was set the highest at 0.8, while the cleaning blade traction power consumption was assigned a secondary weight of 0.2. The objective optimization function (P) is defined as follows:
P = 0.8 ( P b + P p ) + 0.2 P b
Multi-objective optimization was performed for the ridge-trenching machine’s parameter combinations under specific operation conditions: a working speed of 0.6 m/s, a cutter head rotational speed of 240 r/min, and a working depth of 400 mm. Subject to the geometric constraints of the trapezoidal ditch being formed and the structural constraints of the ditching components, the objective function and constraint conditions are formulated as follows:
m i n P X 1 ,   X 2 ,   X 3 ,   X 4 s . t . 140 X 1 200 200 X 2 300 100 X 3 300 530 X 4 630 X 2 X 1 X 3 2 + 200 X 2
Multi-objective optimization was performed using the gamultiobj function in MATLAB R2023b software. This process yielded a series of feasible parameter combinations satisfying the constraints. From these, the parameter combination exhibiting the lowest cutter head soil-cutting power consumption, soil-throwing power consumption, and cleaning blade traction power consumption was selected as the optimized result. Under the operating conditions of 0.6 m/s forward speed, 240 r/min cutter head rotational speed, and 400 mm working depth, the optimal parameters are as follows: inner blade group width: 200 mm; outer blade group width: 300 mm; distance between inner and outer blade groups: 200 mm; ditch-cleaning blade opening width: 586 mm. Simulation results for this optimized configuration showed a total operational power consumption of 27.07 kW. In contrast, simulation of the pre-optimization configuration (cutter head with only the inner blade group at 200 mm width and cleaning blade opening at 530 mm) resulted in a total power consumption of 32.78 kW. This represents a significant reduction in power consumption of 17.4% after optimization (Figure 11).
In conclusion, the synergistic interaction between the optimized stepped cutter head and trapezoidal cleaning blade significantly reduced the soil-cutting power consumption, soil-throwing power consumption, and cleaning blade traction power consumption. The optimized ridge-trenching machine meets the design requirements for both operational performance and energy efficiency.
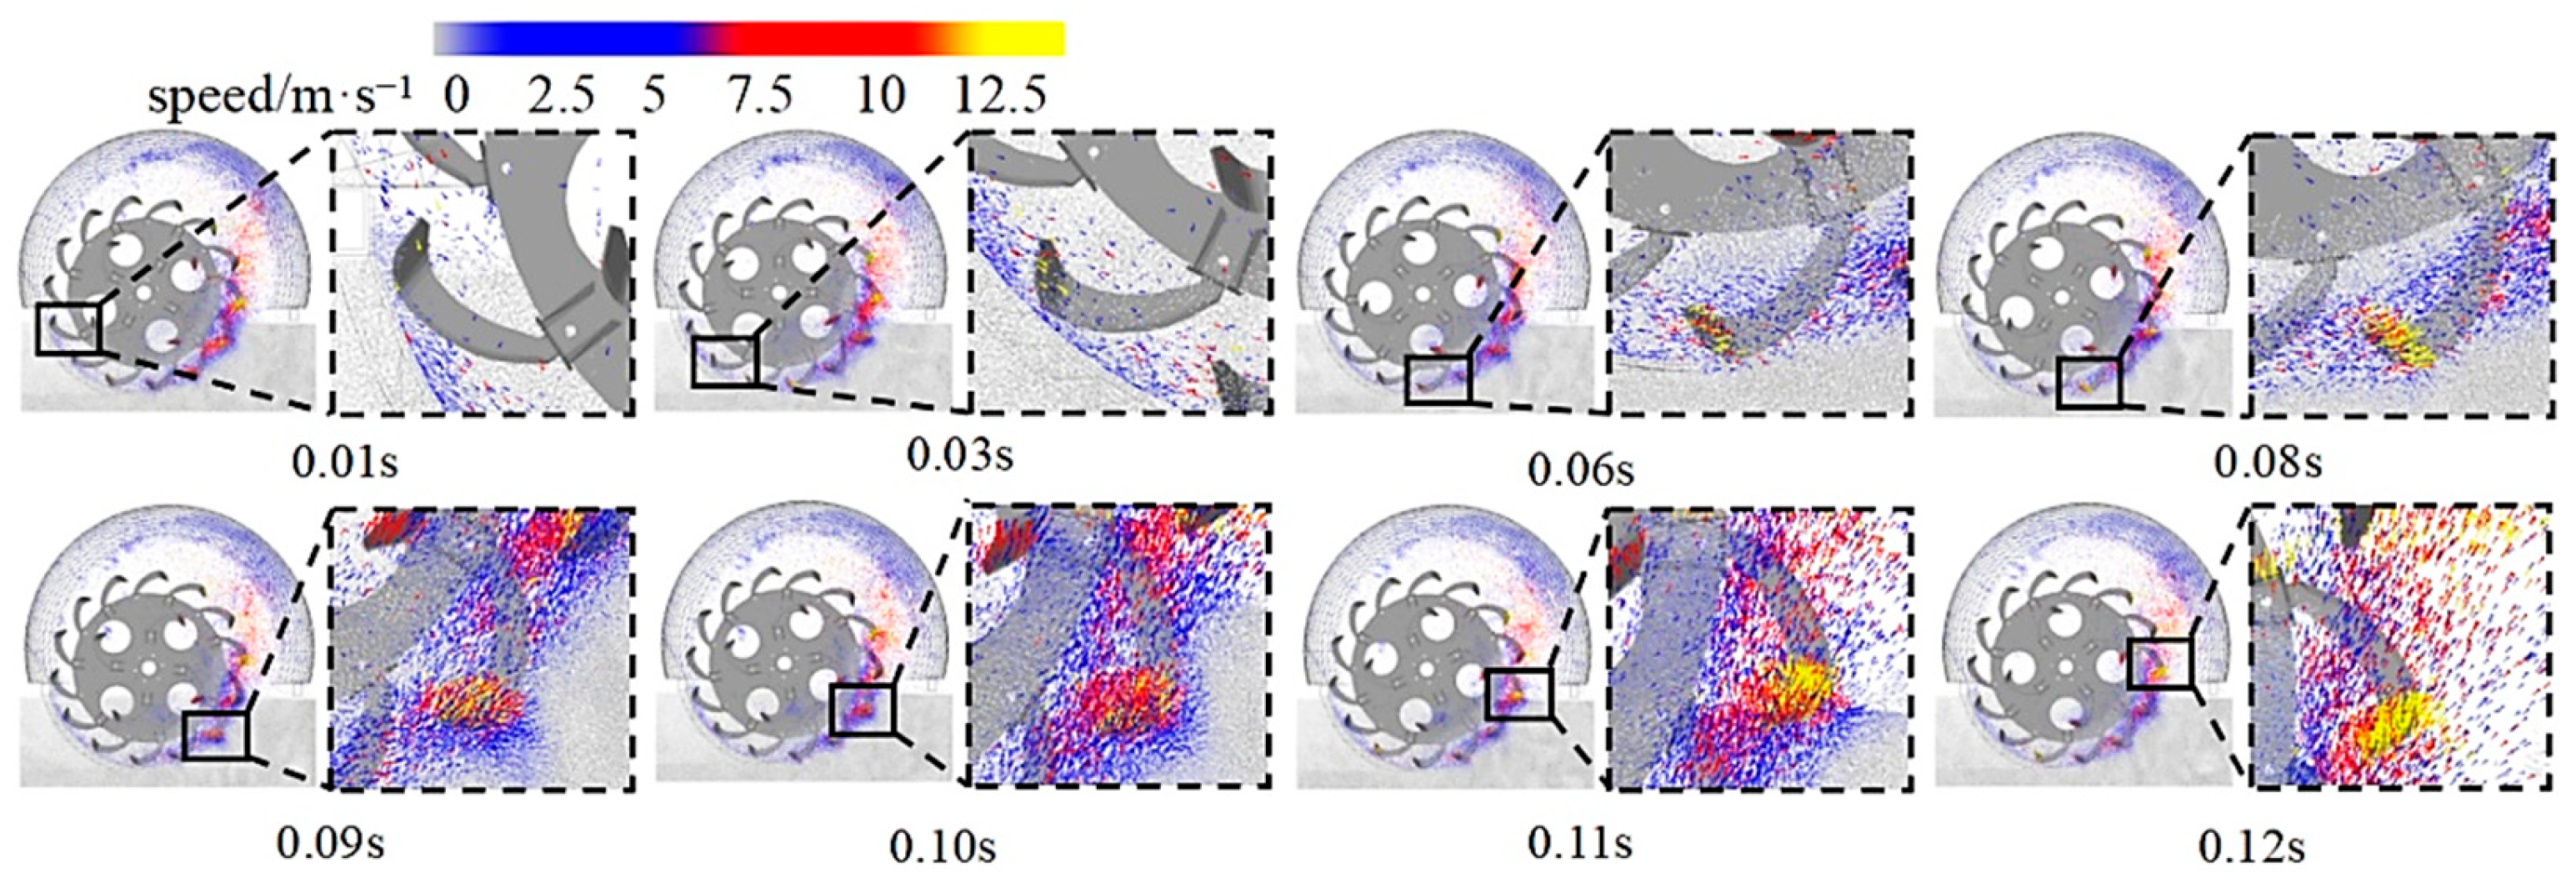
To investigate the movement of soil cut and thrown during ridge-trenching operations in rapeseed fields, the operation process of a single rotary tiller blade was analyzed (Figure 12). At 0.01 s, the blade penetrates the ditch and contacts soil accumulated within the cleaning blade; from 0.01 s to 0.08 s, the blade accelerates the accumulated soil along the cutter head circumference. At 0.08 s, the blade begins cutting and throwing previously undisturbed soil; from 0.08 s to 0.11 s, the blade continues cutting and throwing undisturbed soil. Soil adhering to the blade moves along the circumference, with the mass and velocity increasing continuously. Soil closer to the blade tip experiences the fastest velocity increase. During operation, some soil detaches from the blade due to inertia, some collides with soil ahead, and the remaining soil moves with the blade as it decelerates. At 0.11 s, the blade approaches the point of exiting the soil layer, and the adhering soil initiates oblique projectile motion; at 0.12 s, the blade completely exits the soil layer, and the majority of the adhering soil detaches, continuing in oblique projectile motion.
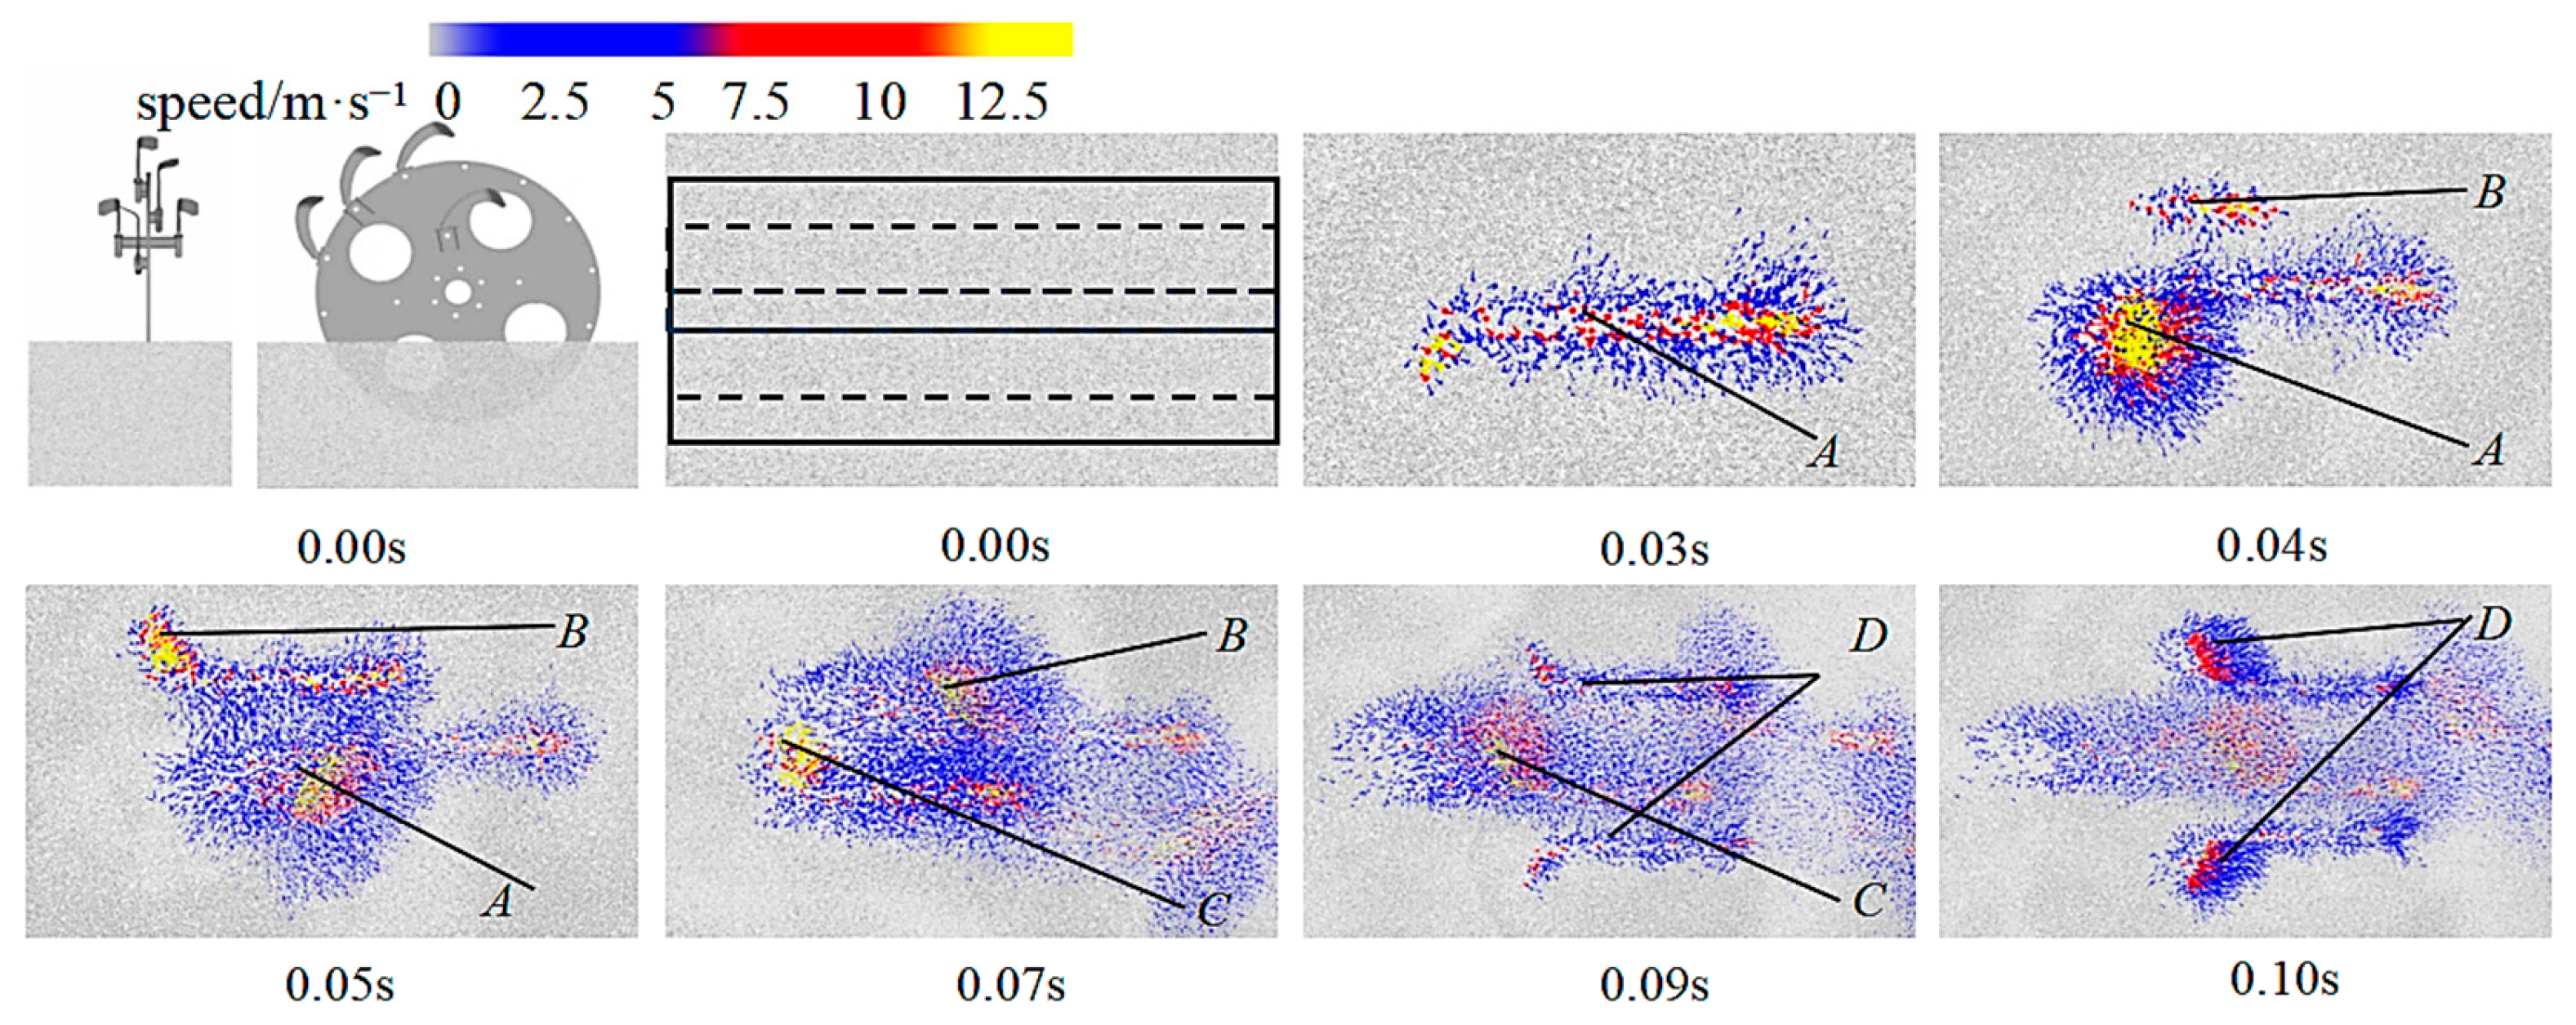
To explore the soil disturbance characteristics resulting from different blade-mounting orientations during rapeseed ridge trenching, the process of forming a complete stepped-profile ditch within a specific zone was analyzed (Figure 13). Zones 1 to 5 represent distinct soil areas cut and thrown by the inner and outer blades. At 0.03 s, the first outward-facing rotary tiller blade of the inner group commences cutting and throwing Zone 2, simultaneously disturbing adjacent areas along both sides of its cutting edge. At 0.04 s, this first inner outward-facing blade fully engages Zone 2, while a second outward-facing blade of the inner group begins penetrating Zone 3. Soil closest to the blade edge or tip experiences the most rapid velocity increase. At 0.05 s, the second inner outward-facing blade fully enters Zone 3, continuing to disturb adjacent soil. At 0.07 s, an inward-facing rotary tiller blade of the inner group operates on Zone 1. The top view between 0.05 s and 0.07 s reveals collisions occurring between soil within Zones 1, 2, and 3 due to the disturbance, further fragmenting compacted soil clods. From 0.09 s to 0.10 s, outward-facing blades of the outer group cut and throw Zones 4 and 5, completing the final formation of the stepped-profile ditch.
This analysis demonstrates that the layered cutting–throwing soil disturbance mechanism applied to different zones effectively reduces the interaction force between a single rotary tiller blade and the soil. Simultaneously, it promotes the fragmentation and disturbance of compacted soil clods. This mechanism is particularly advantageous for addressing the challenges of high trenching resistance and the requirement to form a level seedbed surface during rapeseed field perimeter ditching operations.

3.3. Test Results

3.3.1. Operational Power Consumption

The comparative test results for the perimeter ditch discarding power consumption are presented in Table 6. The average power consumption measured in field trials was 34.75 ± 0.5 kW for the Control Group and 28.73 ± 0.3 kW for the Test Group. The relative error between field-measured and simulated power consumption was less than 10%, validating the reliability of the simulation model. The lower simulated power consumption compared to field results is attributable to the presence of rice stubble and weeds in the actual field environment.

3.3.2. Operational Quality

The ditch quality is illustrated in Figure 14. Equations (26)–(28) are the calculation formulas for the stability coefficients of the ditch depth/ditch width. Measurements of the trapezoidal ditch depth, upper top width, bottom width, backfill soil thickness, stability coefficients, and backfill rate at each sampling point are summarized in Table 7. The relative error between simulation and field trial results was consistently below 10%, indicating that the established simulation model accurately captured soil particle motion. For the optimized machine (Test Group) in field trials, the ditch depth stability coefficient was 95.9 ± 1.2%, the upper top width stability coefficient was 94.2 ± 1.1%, the bottom width stability coefficient was 96.4 ± 1.3%, and the backfill rate was 4.5 ± 0.3%. Compared to the Control Group, the stability coefficients increased by 7.7%, 8.5%, and 7.2%, respectively, while the backfill rate decreased by 6.8%. The ditch depth stability coefficient meets the technical requirements specified in the Chinese Agricultural Industry Standard JB/T 11908-2014 “Agricultural Disc Ditchers” [34].
S = i = 1 n h i h 2 n 1
V = S h × 100 %
U = 1 V
In the formula, S represents the standard deviation of the ditch depth/ditch width (cm); V denotes the coefficient of variation for the ditch depth/ditch width; U signifies the stability coefficient of the ditch depth/ditch width.

4. Discussion of Limitations and Prospects

This study achieves significant results through the combined design of a stepped disc cutter for layered cutting and throwing and a trapezoidal ditch-cleaning shovel, reducing power consumption during ditching operations by 17.3% compared to existing ditch-forming machines, while improving the ditch depth and width stability coefficients by 7% to 9%, with both consistently exceeding 90%, Compared with other existing ditching machines, this study achieved a 6–10% improvement in the ditch depth stability coefficient and a 4–7% reduction in the soil backfill rate, demonstrating enhanced operational efficiency and ditch formation quality in heavy clay soil conditions [6,10,35]. The core mechanism lies in the coupled effect of layered cutting–throwing and dynamic ditch cleaning: increasing the widths of the inner and outer blade groups to 200 mm and 300 mm, respectively, expanded the direct cutting area, reducing secondary processing by the cleaning blade and decreasing traction resistance by 48.6%; optimizing the distance between the inner and outer blade groups to 200 mm balanced cutting–throwing efficiency with soil backflow, avoiding resistance surges; optimizing the cleaning blade opening to 586 mm refined the soil flow trajectory, achieving equilibrium between anti-accumulation and anti-collapse. DEM simulation and field test errors were less than 10%, validating the accurate characterization of cohesive soil particle bonding by the Hertz-Mindlin with JKR model, demonstrating the DEM’s viability as an alternative to high-cost trial-and-error experiments.
Current limitations include restricted soil adaptability (without considering rice stubble root effects), unquantified dynamic loads, and regional universality challenges (parameters calibrated for clay loam in the middle–lower Yangtze). Future work requires introducing root–soil coupling models, optimizing structures via fatigue life analysis, and extending validation to dry/sandy soil regions. The next phase will explore a “ditching–seeding–soil covering” integrated operation mode to further enhance planting efficiency in rice–rapeseed rotation areas.

5. Conclusions

This study addresses the issues of high power consumption and unstable ditch formation in heavy clay soils within rice–rapeseed rotation areas of the middle and lower reaches of the Yangtze River by innovatively designing a synergistic mechanism combining a stepped cutter head and a trapezoidal ditch-cleaning blade. Mathematical models for cutter head soil-cutting and -throwing and cleaning blade traction power consumption were established. Discrete Element Method (DEM) simulations and single-factor experiments revealed the influence mechanisms of key structural parameters on power consumption. Multi-objective optimization via Box–Behnken experimental design and genetic algorithms yielded the optimal parameter combination, achieving a simulated power consumption of 27.07 kW. Field validation demonstrated that the optimized ditcher operated at 28.73 kW, representing a 17.3 ± 0.5% reduction compared to the Control Group, with ditch depth and width stability coefficients exceeding 90% and a soil backfill rate of only 4.5 ± 0.3%. This provides a reliable solution for low-power, high-efficiency ditching equipment in heavy clay soil regions.

Supplementary Materials

The following supporting information can be downloaded at: https://www.mdpi.com/article/10.3390/agriculture15151706/s1, Supplementary Materials Table S1. Box-Behnken test results. Supplementary Materials Table S2. Riance analysis of response surface regression models.

Author Contributions

Conceptualization, Z.K., Z.Z. and X.J.; investigation, Z.P. and Y.O.; resources, Z.K. and X.J.; writing–original draft preparation, Z.K.; writing—review and editing, M.W. and X.J.; supervision, H.L. and W.Q.; project administration, H.L., W.Q., M.W. and X.J.; funding acquisition, M.W. and X.J. All authors have read and agreed to the published version of the manuscript.

Funding

This research was funded by the National Key R&D Program (2022YFD2300103); Hunan Provincial Key R&D Program (2024JK2033); Hunan Oil Industry Technology System (HARS-03).

Institutional Review Board Statement

Not applicable.

Data Availability Statement

Data are contained within the article and Supplementary Materials.

Conflicts of Interest

The authors declare no conflicts of interest.

References

  1. Yan, M.L.; Zhou, J.; Tian, T.; Wu, Y.Y.; Zhao, C.; Zhang, Y. Study on China’s oilseed self-sufficiency rate and its influencing factors. Trans. China Oils Fats 2025, 50, 1–13. [Google Scholar]
  2. Cao, C.; Yang, J.; Yuan, G.J. Import dependence and import safety of oilseeds in China. Trans. China Oils Fats 2025, 50, 1–8. [Google Scholar]
  3. Xiong, Q.Q. Size of grain net import and its self-sufficiency rate in China. J. China Agric. Univ. Soc. Sci. Ed. 2022, 21, 85–101. [Google Scholar]
  4. Peng, D.Z.; Dai, Y.; Zhang, Q.; Chen, H.; Yang, L.; Zhang, Z. Study on difference of seedling growth and physiological characteristics between three-way cross rapeseed and its parents under different water stress. Chin. Agric. Sci. Bull. 2024, 40, 20–26. [Google Scholar]
  5. Peng, Q.J.; Kang, J.M.; Jian, S.C.; Yang, X.J.; Liu, L.J. Parameter optimization and power consumption and kinematics analyses of clockwise and counterclockwise ditching. J. China Agric. Univ. 2018, 23, 151–159. [Google Scholar]
  6. Qin, K.; Liang, X.; Cao, C.; Ding, W.; Wu, Z.; Fang, L. Design and experiment of combined cutting and throwing ditching blade for tea garden. Trans. Chin. Soc. Agric. Mach. 2021, 52, 74–82. [Google Scholar]
  7. Liu, M.Z.; Xie, F.P.; Liu, D.W.; Wang, X. Analysis and experiment of the power of blade roller in reverse-rotary ditching machine based on the granular scale effect. Trans. Chin. Soc. Agric. Eng. 2024, 40, 83–92. [Google Scholar]
  8. Kang, J.M.; Li, S.J.; Yang, X.J.; Liu, L.; Wang, C. Virtual simulation and power test of disc type ditcher based on multi-body dynamics. Trans. Chin. Soc. Agric. Mach. 2017, 48, 57–63. [Google Scholar]
  9. Wang, L.Z.; Liao, Q.X.; Li, M.L.; Shan, Y.; Li, X.; Zhang, Q.; Liao, Y. Drive-type ditching device of the high-speed no-tillage direct seeder for rapeseed. Trans. Chin. Soc. Agric. Eng. 2023, 39, 15–26. [Google Scholar]
  10. Niu, M.M.; Yang, H.W.; Zhang, Q.Y.; Qi, P.; Wang, S.; Fang, H.; Wen, H. Experimental and simulation study on the ditching and backfilling characteristics of a 3DGZ-50A self-propelled orchard ditching machine. Horticulturae 2025, 11, 171. [Google Scholar] [CrossRef]
  11. Wang, L.J.; Zhou, B.; Wan, C.; Zhou, L. Structural parameter optimization of a furrow opener based on EDEM software. Int. J. Agric. Biol. Eng. 2024, 17, 115–120. [Google Scholar] [CrossRef]
  12. Liu, D.W.; Xie, F.P.; Ye, Q.; Ren, S.; Li, X.; Liu, M. Analysis and experiment on influencing factors on power of ditching parts for 1K-50 orchard ditching. Trans. Chin. Soc. Agric. Eng. 2019, 35, 20–29. [Google Scholar]
  13. Zeng, Y.; Jiang, X.H.; Wu, M.L.; Zhao, Z.; Tang, L.; Li, P. Development of the layered cut and throw ditching blade groups for oil tea forest based on DEM-MBD. Trans. Chin. Soc. Agric. Eng. 2024, 40, 30–42. [Google Scholar]
  14. Yang, Q.Z.; Yang, X.Y.; He, M.S.; Zhang, R.; Wen, T.; Shi, A. Design and experiment of the rotary throwing knife of wine grape cleaning machine. Trans. Chin. Soc. Agric. Eng. 2022, 38, 44–51. [Google Scholar]
  15. Wang, L.Z.; Liao, Q.X.; Zhang, Z.L.; Li, M.; Zhang, Q.; Wang, L.; Liao, Y. Optimization and experiments of the blade group of ditching devices in rapeseed direct seeder. Trans. Chin. Soc. Agric. Eng. 2024, 40, 37–49. [Google Scholar]
  16. Zhang, Q.S.; Qi, T.; Ao, Q.; Shu, C.; Liao, Y.; Liao, Q. Design and experiment of rapeseed direct seeding machine with furrow opener and shallow plowing. Trans. Chin. Soc. Agric. Mach. 2023, 54, 52–63. [Google Scholar]
  17. Zeng, Y.; Li, J.; Li, H.C.; Zhang, Q.; Li, C.; Li, Z.; Jiang, R.; Mai, C.; Ma, Z.; He, H. Research on the ditching resistance reduction of self-excited vibrations ditching device based on MBD-DEM coupling simulation. Front. Plant Sci. 2024, 15, 1372585. [Google Scholar] [CrossRef] [PubMed]
  18. Ahmadi, I. A torque calculator for rotary tiller using the laws of classical mechanics. Soil Tillage Res. 2017, 165, 137–143. [Google Scholar] [CrossRef]
  19. Zhang, J.; Xia, M.; Chen, W.; Yuan, D.; Wu, C.; Zhu, J. Simulation analysis and experiments for blade-soil-straw interaction under deep ploughing based on the discrete element method. Agriculture 2023, 13, 136. [Google Scholar] [CrossRef]
  20. Ucgul, M.; Saunders, C.; Li, P.; Lee, S.-H.; Desbiolles, J.M. Analyzing the mixing performance of a rotary spader using digital image processing and discrete element modelling (DEM). Comput. Electron. Agric. 2018, 151, 1–10. [Google Scholar] [CrossRef]
  21. Tekeste, M.Z.; Way, T.R.; Syed, Z.; Schafer, R.L. Modeling soil-bulldozer blade interaction using the discrete element method (DEM). J. Terramechanics 2020, 88, 41–52. [Google Scholar] [CrossRef]
  22. Zhang, X.A. Agricultural Machinery Design Handbook; China Agriculture Press: Beijing, China, 2007. [Google Scholar]
  23. Liao, Q.X.; Zhang, J.Q.; Zhang, Q.S.; Du, W.; Lin, J.; Wang, L. Design and test of rapeseed seed bed preparation device combined with parallel plow group turnbuckle and rotary tillage. Trans. Chin. Soc. Agric. Mach. 2024, 55, 190–201. [Google Scholar]
  24. Song, J.N.; Li, Z.H. Theoretical studies of reverse rotary tillage. J. Beijing Agric. Eng. Univ. 1990, 10, 15–22. [Google Scholar]
  25. Zhang, C.L.; Xu, J.; Zheng, Z.H.; Wang, W.W.; Liu, L.C.; Chen, L.Q. Three-dimensional DEM tillage simulation: Validation of a suitable contact model for a sweep tool operating in cohesion and adhesion soil. J. Terramech. 2023, 108, 59–67. [Google Scholar] [CrossRef]
  26. Yang, Q.Z.; Shi, L.; Shi, A.P.; He, M.; Zhao, X.; Zhang, L.; Addy, M. Determination of key soil characteristic parameters using angle of repose and direct shear stress test. Int. J. Agric. Biol. Eng. 2023, 16, 143–150. [Google Scholar] [CrossRef]
  27. Xiang, W.; Wu, M.L.; Lu, J.N.; Quan, W.; Ma, L.; Liu, J. Calibration of simulation physical parameters of clay loam based on soil accumulation test. Trans. Chin. Soc. Agric. Eng. 2019, 35, 116–123. [Google Scholar]
  28. Zhao, Z.H.; Wu, M.L.; Xie, S.P.; Luo, H.; Li, P.; Zeng, Y.; Jiang, X. Parameter calibration for the discrete element simulation of soil-preceding rice stubble and its rotary tillage trajectory. Trans. Chin. Soc. Agric. Eng. 2024, 40, 72–82. [Google Scholar]
  29. Zhao, Z.; Wu, M.L.; Jiang, X. A review of contact models’ properties for discrete element simulation in agricultural engineering. Agriculture 2024, 14, 238. [Google Scholar] [CrossRef]
  30. Zeng, Z.W.; Ma, X.; Cao, X.L.; Li, Z.; Wang, X. Critical review of applications of discrete element method in agricultural engineering. Trans. Chin. Soc. Agric. Mach. 2021, 52, 1–20. [Google Scholar]
  31. Xiao, M.H.; Niu, Y.; Wang, K.X.; Zhu, Y.; Zhou, J.; Ma, R. Design of self-excited vibrating rotary tiller and analysis of its performance in reducing torsion and consumption. Trans. Chin. Soc. Agric. Mach. 2022, 53, 52–63. [Google Scholar]
  32. Cheng, J.; Zheng, K.; Xia, J.; Liu, G.; Jiang, L.; Li, D. Analysis of adhesion between wet clay soil and rotary tillage part in paddy field based on discrete element method. Processes 2021, 9, 845. [Google Scholar] [CrossRef]
  33. Zeng, Y.; Chen, C.; Wu, Q. Calibration parameter of soil discrete element based on area difference method. Agriculture 2023, 13, 648. [Google Scholar] [CrossRef]
  34. JB/T 11908-2014; Agricultural Disc Ditching Machine. Ministry of Industry and Information Technology of the People’s Republic of China, Machine Press: Beijing, China, 2014.
  35. Shi, Z. Research on Lifting Foldable Double-Sided Disc-Type Orchard Ditcher. Master’s Thesis, Huazhong Agricultural University, Wuhan, China, 2019. [Google Scholar]
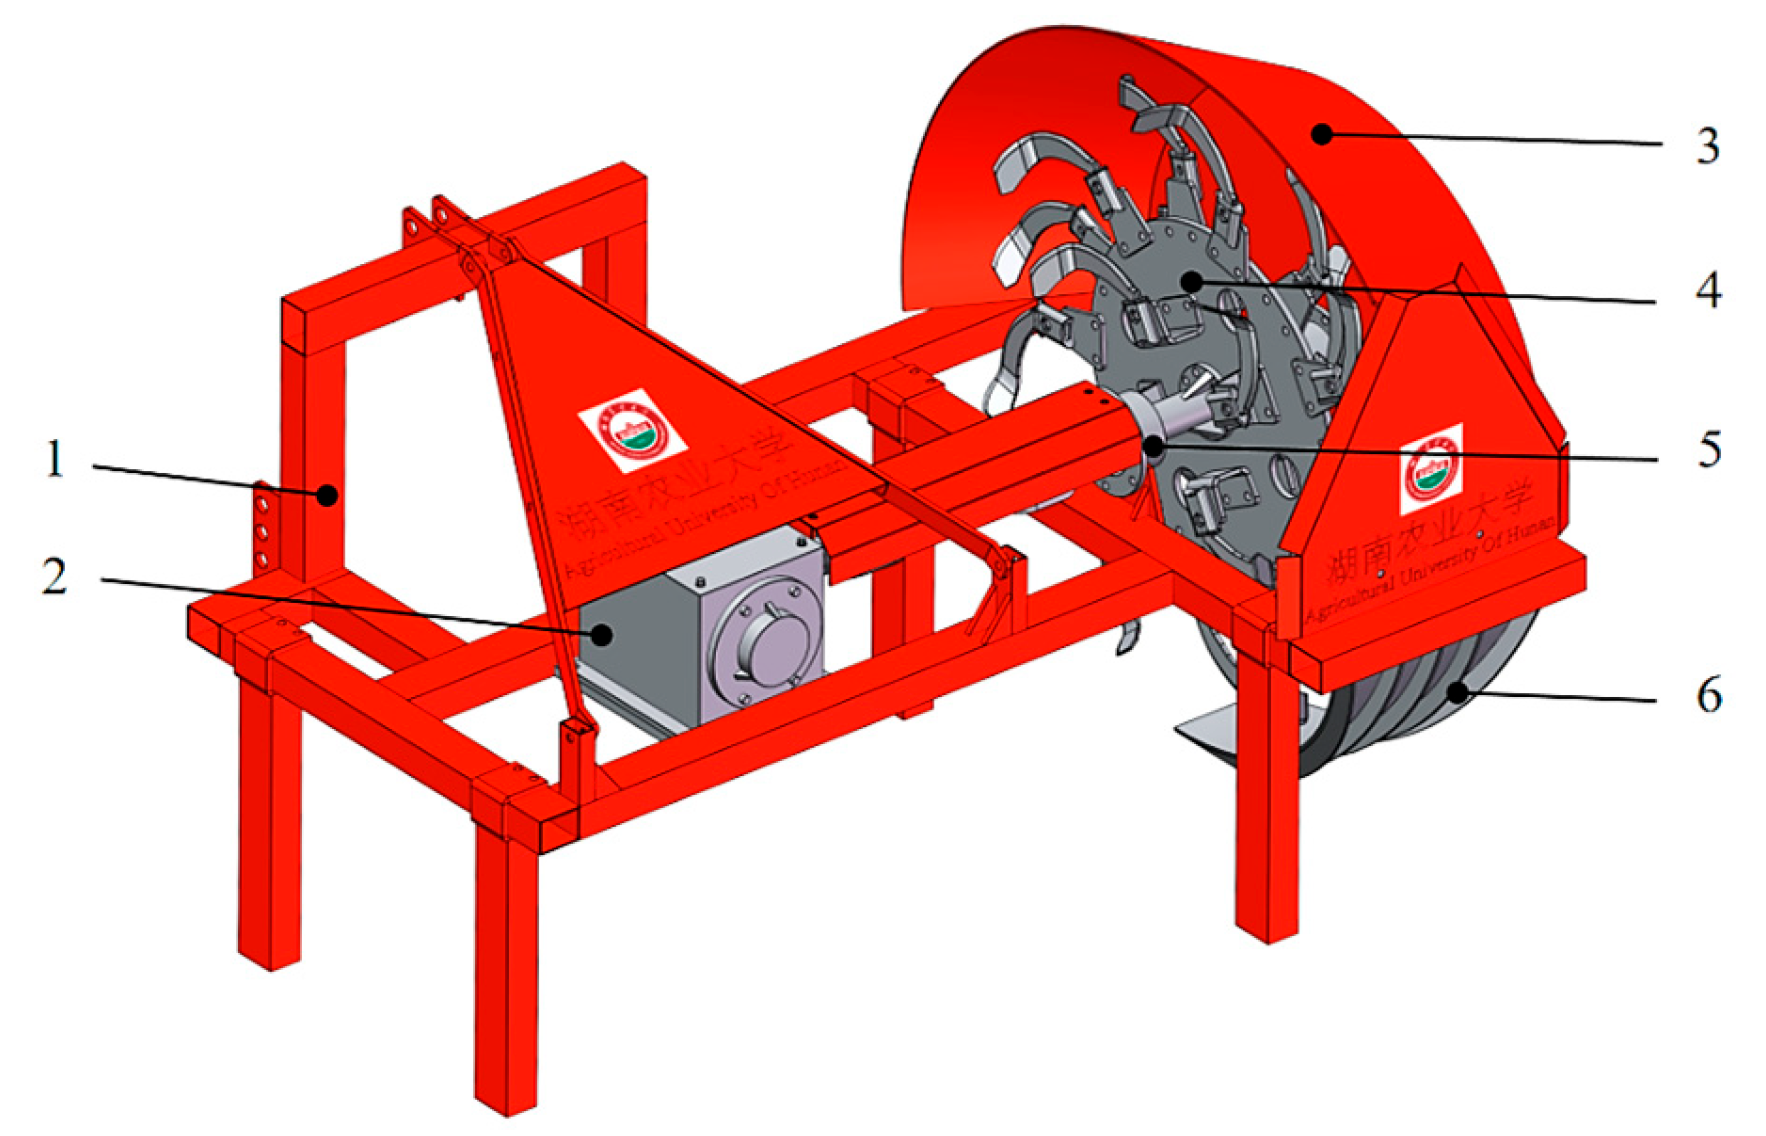
Figure 1. Overall structure. 1. Frame; 2. gearbox; 3. soil guide plate; 4. stepped cutter head; 5. transmission shaft; 6. trapezoidal ditch-cleaning blade.
Agriculture 15 01706 g001
Figure 2. Schematic diagram of the operation of the trenching machine in rapeseed field achieving the objectives of single-side soil discharge, effective burial of surface straw/residues, and the formation of a uniform, level seedbed surface.
Agriculture 15 01706 g002
Figure 3. Stepped-profile cutting disc. a. Outer blade group width; b. inner blade group width; c. distance between inner and outer blade groups; d. inward-mounted rotary tiller blade.
Agriculture 15 01706 g003
Figure 4. Ditch-cleaning blade surface shovel.
Agriculture 15 01706 g004
Figure 5. Schematic diagram of cutting resistance of blade. Note: For analytical simplification, the tangent plane of the blade is approximated as a flat surface, where θ is the blade rotation angle [rad]; ω is the angular velocity of the blade roller [rad/s]; R is the blade roller radius [m]; σ0 is the blade installation angle [rad]; Fs is the soil compression resistance [N]; Ff is the frictional resistance [N]; Fc is the soil-cutting resistance [N]; B is the blade width [m]; vm is the machine forward speed [m/s]; v is the absolute velocity at the blade tip [m/s].
Agriculture 15 01706 g005
Figure 6. Schematic diagram of unit cymbal shape.
Agriculture 15 01706 g006
Figure 7. Schematic diagram of centrifugal force during earth moving. Note: vcr is the relative velocity at the center of mass of the soil fragment [m/s], and σ is the skew cutting angle of the blade [rad].
Agriculture 15 01706 g007
Figure 8. Discrete Element Simulation Model.
Agriculture 15 01706 g008
Figure 9. Field trials. 1. Upper tie rod sensor; 2. lower suspension pin sensor—right; 3. lower suspension pin sensor—left; 4. torque sensor, output shaft speed sensor.
Agriculture 15 01706 g009
Figure 10. Diagram of single-factor test.
Agriculture 15 01706 g010
Figure 11. Interaction between the width of the inner blade group and the distance between blade groups.
Agriculture 15 01706 g011
Figure 12. The interaction between a single rotary tiller and the soil at different times (side view).
Agriculture 15 01706 g012
Figure 13. Disturbance of soil by different blades at different times (top view). Note: A is inner layer outward rotary tiller blade 1; B is inner layer outward rotary tiller blade 2; C is inner layer inward rotary tiller blade 1; D is outer layer outward rotary tiller blade 1.
Agriculture 15 01706 g013
Figure 14. Grooving quality.
Agriculture 15 01706 g014
Table 1. Main technical parameters.
ParameterValue
Overall Dimensions (L × W × H) (mm)2480 × 1800 × 1600
Working Width (mm)2480
Required Power (kW)≥66.2
Operating Speed (km/h)1.8–5.4
Total Transmission Ratio3:1
Max. Radius of Trapezoidal Disc (mm)550
Ditch ProfileTrapezoidal
Top Width of Perimeter Ditch (mm)400
Bottom Width of Perimeter Ditch (mm)200
Depth of Perimeter Ditch (mm)400
Width of Seedbed Surface (mm)≥1000
Table 2. Ditch-cleaning shovel guide curve.
NameGuide Curve TypeGuide Curve
Height (h/mm)
Guide Curve Opening (L/mm)Tangent Angle Between Two End Points (ω/(°))
1KX-40
Rapeseed Field Perimeter Ditch Discarding MachineArc400530108
Table 3. Basic physical parameters of soil and blade.
CategoryParameterValue
SteelDensity/(kg·m−3)7850
Poisson’s ratio0.3
Shear modulus/(Pa)7 × 1010
SoilParticle density/(kg·m−3)2680
Poisson’s ratio0.38
Shear modulus/(Pa)1.2 × 106
JKR surface energy/(J·m2)12.73
Particle size/mm5
Soil–soilStatic friction coefficient0.84
Rolling friction coefficient0.1
Collision restitution coefficient0.55
Soil–steelStatic friction coefficient0.6
Rolling friction coefficient0.1
Collision restitution coefficient0.3
Table 4. Test factors and levels.
LevelsInner Knife Group Width/(mm)Outer Knife Group Width/(mm)Distance Between Inner and Outer Knife Groups/(mm)Ditch-Cleaning Shovel Opening/(mm)
1140200100530
2155225150580
3170250200630
4185275250680
5200300300730
Table 5. Experimental factor level coding.
Code ValueInner Knife Group Width/(mm)Outer Knife Group Width/(mm)Distance Between Inner and Outer Knife Groups/(mm)Ditch-Cleaning Shovel Opening/(mm)
−1140200100530
0170250200580
1200300300630
Table 6. Comparison of power consumption.
TypeAverage Power Consumption of Trenching Machine/kW
Field TestSimulation Test
Control Group34.75 ± 0.532.78
Experimental Group28.73 ± 0.327.07
Power Consumption Reduction Rate17.3 ± 0.5%17.4%
Table 7. Comparison of ditch-opening quality.
TypeControl GroupExperimental Group
Test 1Simulation 1Test 2Simulation 2
Average furrow depth/cm41.6 ± 0.540.541.1 ± 0.540.5
Stability coefficient of furrow depth/%88.2 ± 1.191.395.9 ± 1.296.8
Average upper top width/cm44.3 ± 0.642.541.7 ± 0.540.8
Stability coefficient of upper top width/%85.7 ± 190.194.2 ± 1.195.6
Average bottom width/cm22.8 ± 0.320.921.5 ± 0.320.3
Bottom width stability coefficient/%89.2 ± 1.292.996.4 ± 1.397.4
Average backfill thickness/cm4.5 ± 0.14.11.8 ± 0.11.5
Backfill rate/%11.3 ± 0.210.34.5 ± 0.33.6
Disclaimer/Publisher’s Note: The statements, opinions and data contained in all publications are solely those of the individual author(s) and contributor(s) and not of MDPI and/or the editor(s). MDPI and/or the editor(s) disclaim responsibility for any injury to people or property resulting from any ideas, methods, instructions or products referred to in the content.