Article

Establishment of Hollow Flexible Model with Two Types of Bonds and Calibration of the Contact Parameters for Wheat Straw

1
College of Mechanical and Electrical Engineering, Henan Agricultural University, Zhengzhou 450002, China
2
Key Laboratory of Swine Facilities Engineering, Ministry of Agriculture, Harbin 150030, China
*
Author to whom correspondence should be addressed.
Agriculture 2025, 15(15), 1686; https://doi.org/10.3390/agriculture15151686
Submission received: 29 June 2025 / Revised: 24 July 2025 / Accepted: 2 August 2025 / Published: 4 August 2025
(This article belongs to the Section Agricultural Technology)

Abstract

In view of the lack of accurate model in the discrete element study during straw comprehensive utilization (crushing, mixing, and baling), wheat straw was taken as the research object to calibrate the simulation parameters using EDEM 2023. The intrinsic and contact mechanical parameters of wheat straw were measured, and a test of the angle of repose (AOR), extrusion test and bending test were carried out. On this basis, a discrete element model (DEM) of hollow flexibility by using cylindrical particles was developed. The optimal combination of contact mechanical parameters was obtained through AOR tests based on the Box–Behnken design (BBD), coefficients of static friction, rolling friction, and restitution between wheat straw and wheat straw-45 steel are separately 0.227, 0.136, 0.479, 0.271, 0.093, and 0.482, AOR is 18.66°. Meanwhile, optimal combinations of bond contact parameters were determined by the BBD. The calibrated parameters were used to conduct extrusion and bending tests. Results show that the average values of peak extrusion force and peak bending pressure are 23.20 N and 3.92 N, which have relative discrepancy of 3.25% and 3.59% compared to physical test measurements. The results can provide model reference for the optimization design such as feed processing equipment, baler, and mixer.

1. Introduction

Wheat is one of the three major food crops across the world, and the most important food crop in China. The cultivated area and total yield of wheat both account for more than half of the total cultivated area and yield of food crops in China [1,2], with the annual output of wheat straw being more than 18% of all straw resources [3].
Wheat straw, as a natural organic material with multiple uses, plays an important role in aspects including animal feed, organic fertilizer, industrial raw material, soil reclamation, and energy utilization [4]. The harvest, storage, and transportation are key to the comprehensive utilization of straw. The techniques used to remove straws from the field in bundles, transport, and storage of straws are one of the effective methods to achieve comprehensive utilization thereof [5,6,7,8]. To realize fully mechanized and even intelligent harvesting of straws, it is necessary to explore the law governing the motion of wheat straw and the complex interaction between wheat straw and mechanical parts for optimizing the operating performance of machinery [9]. With the gradual improvement of the computer simulation function, numerical simulations have become more scientific and accurate than physical tests and can shorten the development period, so they have become an effective approach to solving such a problem.
In recent years, the discrete element method has been widely applied to the modelling of agricultural machinery and equipment due to its ability to study the movement and dynamic behavior of particulate matter, then predict mechanical performance, and optimize design schemes. Researchers in China and abroad have calibrated the discrete element simulation parameters of various granular and rod-shaped materials [10,11,12,13]. Gong et al. [14] calibrated the contact mechanical parameters with the angle of repose as the test index. Shu et al. [15] constructed the discrete element model of rape stalk by spherical particle filling method, and its contact mechanical parameters were calibrated, and the bench experiment was carried out. Zhou et al. [16] established a bond model that reflected the root flexibility and tuber detachment mechanical characteristics by using the discrete element method. Hou et al. [17] calibrated the contact parameters and bonding parameters of rice straw with the stacking angle tests and three-point bending tests by discrete element simulation. Liao et al. [18] combined round particles to establish a particle discrete element model (DEM) of rapeseed stems for feed use and calibrated parameters of the contact model with the angle of repose (AOR) as the response value. Ma et al. [19] formed a DEM of hollow, elliptical, cylindrical rice straw by combining spherical particles, and applied Hertz–Mindlin elements in their model of the bonding between particles. Taking the AOR and shearing resistance as response indices, they obtained the bond contact parameters between particles, as well as the optimal combination of the coefficients of restitution, static friction, and dynamic friction between straws through Box–Behnken tests. Tong et al. [20] established a simulation model of bilayer corn stalks (including the rind and pith of corn stalks) by combining spherical particles. They obtained the optimal combination of relevant contact parameters between the rind and pith through Plackett–Burman and Box–Behnken regression in orthogonal tests while keeping the bond-contact parameters of the particles unchanged. Chen et al. [21] developed a particle DEM of cassava stems using the multi-sphere aggregation modelling method. They also calibrated and optimized the contact parameters and the bond contact parameters between particles by conducting tests on the AOR and the cassava-stem cutting tests. Through accumulation of spherical particles, Chen et al. [22] built a DEM of alfalfa stems, and calibrated the physical and bonding parameters based on the Hertz–Mindlin (no slip) and Hertz–Mindlin elements with bonding contact models. By filling in spherical particles and using the Hertz–Mindlin model with bonding contact model, Zhang et al. [23] established a DEM bond model of banana stalks. Taking the shear force as the response value, they determined the optimal combination of the normal contact stiffness, tangential contact stiffness, critical normal stress, and critical tangential stress in the bond model of banana stalks using a response surface methodology (RSM) based on central composite design.
In summary, most models of crops straw are rigid ones, while there is little research involving flexible models established based on additional simulations including bonding. Additionally, establishing a model by approximate stacking multiple spherical particles can reduce the efficiency and authenticity of such operations, and it is impossible to accurately describe the complex interaction between straw fibers. The present research took wheat straw as the research object, and used EDEM 2023 software to build a DEM for hollow flexible wheat straw integrating two Bonding V2 models. Taking the AOR, peak extrusion force, and peak bending pressure of wheat straw as evaluation indices, the Plackett–Burman tests and BBD-RSM optimization tests were conducted to calibrate the contact parameters and bond contact parameters of wheat straw. Under the optimal combination of parameters, the extrusion and bending tests on single wheat straw and the simulation tests on the compression of wheat straw clusters were undertaken to verify the reliability and authenticity of parameter calibration. The research aims to provide a discrete element modeling method and support for the optimal design of harvesting processing equipment for straw.

2. Materials and Methods

2.1. Intrinsic Parameters of Wheat Straw

2.1.1. Geometric Size

The straws of “Zhengmai 1860” cultivated in Nanyang City, Henan Province, China were selected as the test object, of which the moisture content was 12.232%.
The wheat straw could be sampled in the early June. The wheat variety is stress tolerant, disease resistant, and lodging resistant. To ensure the feasibility of scale operation of the wheat straw model established later, the wheat straw could be simplified by eliminating the root and the ear of wheat while only retaining the stem. A total of 40 wheat straws with good growth conditions were selected randomly in the tests, of which the broken parts at both ends were cut off, and the remaining part was cut into 120 short straws with a unit length of 100 mm (Figure 1). A digital caliper with the precision of 0.01 mm was adopted to measure the outer diameters in both ends D and the wall thickness h (Figure 2). It was computed that the average outer diameter and the average wall thickness were separately 4.045 mm and 0.416 mm (Table 1). Origin 2024b was used to plot the frequency distribution of wheat straw in geometric size ranges. The distributions of the outer diameter and wall thickness are both shown as typical curves that are higher in the middle while lower at both ends, largely conforming to the normal distribution (Figure 3).

2.1.2. Density

By comprehensively considering characteristics of wheat straw, the research came up with a method to indirectly calculate the actual density based on the relative mass per unit length. The relative mass per unit length is defined as the mass per unit length of a single wheat straw and is calculated using the following formula:
W m = m 2 L
where Wm is the relative mass per unit length (g/m). m2 is the mass of wheat straw (g). L is the total length of all single straws (m).
A high-precision electronic balance was used and five samples of wheat straw of 100 g were randomly selected to measure the total length of each sample (Figure 4). The results of the relative mass per unit length were obtained (Table 2). The average length and relative mass per unit length of 100 g of wheat straw were found to be 104.674 m and 0.955 g/m, which laid a basis for subsequent density calibration.

2.2. Measurement of Contact Mechanical Parameters

2.2.1. Coefficient of Static Friction

The inclined-plane test method was adopted to measure the coefficients of static friction between wheat straw and between wheat straw and steel by randomly selecting 20 short wheat straw elements to be tested. The test platform for the frictional properties is shown in Figure 5.
A plate measuring 100 mm × 200 mm for placing the wheat straw (wheat-straw plate) was made before tests. The wheat straw elements were put on a horizontal steel plate and the wheat-straw plate. Under traction of a rope, the rotatable base plate was elevated around the axis of rotation until wheat straw on the rotatable base plate tended to be in a state of relative slip. The angle θ between the horizontal base plate and the rotatable base plate at the moment of each slide was recorded. Each wheat straw element was tested three times and the mean average value of the angle was recorded. The coefficient of static friction is given by:
F s = μ 1 F n
F s = m g sin θ
F n = m g cos θ
μ 1 = tan θ
where Fs is the maximum static frictional force (N); m is the mass of wheat straw unit (kg); g is the acceleration of gravity (m/s2); Fn is the positive pressure (N); θ is the angle between the horizontal base plate and the rotatable base plate when sliding trend (°); μ1 is the coefficient of static friction.
The coefficients of static friction between wheat straw and steel and between wheat straws are calculated using Equation (5) to be 0.33 and 0.35, respectively.

2.2.2. Coefficient of Rolling Friction

The coefficient of rolling friction is the resistance coefficient of matter during rolling due to the deformation and energy dissipation of the contact surface, and it is affected by factors including the elastic modulus, surface roughness, rolling speed, and temperature of materials. To avoid interference from additional factors, 20 wheat straw elements with good roundness of cross-sections, clean, burr-free surfaces were selected, the test was carried out by the above test platform for the frictional properties. The angle β between the horizontal base plate and the rotatable base plate at the onset of rolling was recorded. Tests on each wheat straw element were repeated three times, and the mean average value of the angle was recorded.
Considering the difficulty in measuring the kinetic energy at the end of wheat straw in the test process and the negligible increase in the rolling speed, the coefficient of rolling friction is approximated using the energy conservation method by eliminating the influence of kinetic energy. The coefficient of rolling friction is calculated as follows:
W 1 = Δ E p
F n 1 = m g cos β
F f = μ 2 F n 1
W 1 = F f S
Δ E p = m g S sin β
where W1 is the energy dissipation of the rolling process (J); ΔEp is the difference of gravitational potential energy (J); Fn1 is the Normal support force (N); β is the angle between the horizontal base plate and the rotatable base plate at the moment of rolling (°); Ff is the force of rolling friction (N); μ2 is the coefficient of rolling friction (-); S is the moving distance of wheat straw on the rotatable base plate (mm).
By combining Equations (6)–(10), Equation (11) is attained:
μ 2 = t a n β
The coefficients of rolling friction between wheat straw and steel and between wheat straws are calculated using Equation (11) to be 0.093 and 0.110, respectively.

2.2.3. Coefficient of Restitution

The coefficient of restitution is a key parameter that describes the recovery capacity of kinetic energy in the collision process and directly influences the particle rebound speed, energy dissipation, and system behavior after collision in discrete elements. The measurement of the coefficient of restitution is crucial for the accuracy of any such simulation. Given the materials, the coefficient of restitution is the ratio of the post-collision separation rate to the approach rate of objects. The principle of determination is shown in Figure 6.
In accordance with the law of energy conservation, the calculation process of the coefficients of restitution between wheat straw and steel and between wheat straws can be simplified as follows:
m g h 1 = 1 2 m v 1 2
m g h 2 = 1 2 m v 2 2
where h1 is the normal displacement from the initial position to the landing site (mm); h2 is the normal displacement between the landing site and the highest rebound site (mm); v1 is the maximum normal velocity before falling (m/s); v2 is the normal velocity of instantaneous rebound (m/s).
The wheat straw elements experience free-fall drops in the tests and then rebound after reaching the landing site. The free fall h1 and rebound h2 along the vertical direction were recorded at each time, and each wheat straw element was tested three times to calculate the mean average value. By using Equation (14), the coefficients of restitution between wheat straw and steel and between wheat straws are calculated to be 0.482 and 0.479, respectively.
e = v 2 v 1 = 2 g h 2 2 g h 1 = h 2 h 1
where e is the coefficient of restitution.

2.3. Measurement of Test Indices

2.3.1. Test Measurement of the AOR

The method of lifting a cylinder and decreasing the axial length-diameter ratio of materials was used to measure the AOR of wheat straw. Wheat straws were cut into short lengths (15 ± 1) mm, and those with broken ends due to cutting or burrs were eliminated. A total of 2000 granular wheat straws were used as test materials for calibration. The test platform for measuring the AOR is displayed in Figure 7a, which includes a horizontal base plate with dimensions of 400 mm × 400 mm (length × width), and a cylinder with the inner diameter of 96 mm, outer diameter of 100 mm, and height of 200 mm. An inclined plane tester was adopted to adjust the horizontal base plate to the horizontal. After fixing the chain clamp, metal cylinder, and horizontal support as a whole, 2000 wheat straws, 15 ± 1 mm long, were placed in the metal cylinder. After standing for 1 min, the metal cylinder was lifted vertically along the support bar at a rate of around 0.05 m/s. After the wheat straw accumulated on the horizontal base plate, the angle between the stable slope of wheat straw and the horizontal plane is the AOR. MATLAB™ R2024b was used to identify single-side images of the pile of granular wheat straw [24,25,26,27], as shown in Figure 7b; after grey-scale processing, Figure 7c is attained; after binarization of grey-scale images, Figure 7d is obtained; finally, after least squares linear fitting, the slope k of the fitted lines is obtained (Figure 7e). To improve the accuracy of measurement of the AOR, the test was repeated five times. The conical pile of granular wheat straw formed after each test was equally divided into four portions to process the profile curves of each portion separately. The mean average value and standard deviation were summarized (Table 3). The average AOR is 18.35°.

2.3.2. Extrusion Tests on Wheat Straw

Wheat straw specimens were simplified as cylindrical structures formed by axial arrangement of lignocellulose. Extrusion tests were conducted to explore the bond mechanical properties of bonding between these axially arranged lignocellulose.
Studies of the mechanical properties through trial tests reveals that breakage at both ends of wheat straw due to cutting greatly decreases the extrusion pressure and thus leads to distortion; the extrusion pressure acting on wheat straw tends to increase at first, then decline, and finally increases to a positive infinite value. If the outer diameters differ too much in the length range of the cut wheat straw, the stress curve of wheat straw under the upper pressing plate ascends irregularly when successively characterizing this property in different axial regions. Therefore, wheat straw used in the extrusion tests cannot be too short, or the measured mechanical parameters may be too low due to slight damage to the cross-sections at both ends. If the wheat straws are too long, it also cannot ensure the controllable variation of the outer diameter in the length range, thus influencing the analysis of variation of the stress trend. After multiple trial tests, wheat straw specimens 90 mm long were finally selected as the material for these extrusion tests. The equipment used in the extrusion tests is displayed in Figure 8.
The test equipment was composed of a universal testing machine, a base plate for compression, a top plate for compression, a PC data acquisition device, and a camera. Ten wheat straw specimens, 90-mm long, were selected and placed horizontally, one-by-one, on the base plate for subsequent compression. After aligning the midpoint of the camera with the axis of wheat straw specimen, the universal testing machine was turned on. The top plate for compression vertically pressed wheat straw downward. The information acquisition system began to calculate the pressure borne by sensors from the moment that the top plate for compression came into contact with the wheat straw. The data obtained pertaining to the pressure-compressive displacement relationship and the compression of wheat straw are shown in Figure 9.
As shown in Figure 9a, the curve is the original data of one of the tests, and parameters change consistently in the ten tests. Variation of the pressure-compressive displacement curves reveals that the compression of wheat straw is mainly divided into two stages: elastic deformation and plastic deformation. In the elastic deformation stage (Figure 9b), the pressure increases in a non-linear manner with increasing compressive displacement, and the slope of the curve first increases, then decreases. Wheat straw began to be damaged and rapidly burst into four pieces until the bond force between axially arranged lignocellulose reached the ultimate value when the pressure reached the peak (Figure 9c). In this process, the pressure drops abruptly, while the pressure rapidly rises when the four pieces of broken wheat straw were reconnected closely and came into contact again, that is, they were flattened (Figure 9d).
After analyzing the pressure-displacement figures, the peak pressure at the intersection of elastic and plastic deformation was taken as the reference for calibration. Results of ten repeated tests were summarized and it was calculated that the mean average value of peak extrusion force of 90 mm long specimens was 23.98 N. The test data are listed in Table 4.

2.3.3. Bending Tests of Wheat Straw

Wheat straw, as a flexible material, also undergoes bending deformation during harvesting, in addition to compression. The bending of wheat straw when the moisture content is low also reflects the breakage and fracture characteristics of wheat straw. This is related not only to the bond force between axially arranged lignocellulose, but also to the tensile and compressive strengths of lignocellulose themselves. Based on related research, a bending fixture was developed independently and mounted on the platform of the universal testing machine (Figure 10).
Ten wheat straw specimens, 240 mm long, were selected for testing. The spacing between support points in both sides was 130 mm, and the bottom fixing base was horizontally placed, with the U-shaped groove facing the camera. The wheat straw specimens were placed into the V-shaped slot (with a flat bottom, which did not induce friction that could otherwise affect the test data). The tool was mounted on the fixture of the universal testing machine and moved vertically downwards, until the fracture of the wheat straw. The vertical displacement–pressure relationship of the tool was recorded (Figure 11).
It can be seen from Figure 11 that the bending pressure-displacement relationship is simple: the pressure constantly increases with the enlargement of displacement, until fracture of wheat straw when the pressure drops to 0. Results from 10 tests were summarized. It was found that the displacement under peak pressure is always between 2 mm and 4 mm and the mean average value of peak bending pressure of wheat straw is 3.784 N. The peak pressures are listed in Table 5.

2.4. Establishment of the EDM of Wheat Straw

2.4.1. Bonding V2 Model and Meta-Particle Modelling Method

In this study, a discrete element model of hollow flexible wheat straw was created based on the Meta-Particle modeling method using the Bonding V2 model. We can use the Bonding contact model to bond particles with a finite-sized ‘glue’ bond. This bond can resist tangential and normal movement up to a maximum normal and tangential shear stress, at which point the bond breaks. Thereafter the particles interact as hard spheres [28].
When the two particles come into contact within the set bonding time and meet the condition requirements of the bonding distance, the bonding bond is formed. After bonding, the forces (F,t)/torques (M,t) on the particle are set to zero and are adjusted incrementally every Time Step, as shown in Formulas (15)–(18):
δ F n = v n S n A δ t
δ F t = ν t S t A δ t
δ M n = ω n S t J δ t
δ M t = ω t S n J 2 δ t
A = π R B 2
J = 1 2 π R B 4
σ max < F n A + 2 M t J R B
τ max < F t A + M n J R B
where Fn is the normal strength (N); Ft is the shear strength (N); Mn is the normal torque (N·m); Mt is the shear torque (N·m); vn is the normal velocity (m/s); vt is the shear velocity (m/s); Sn is the normal stiffness per unit area (N/m3); St is the shear stiffness per unit area (N/m3); δt is the time step (s); ωn is the normal angular velocity (rad/s); ωt is the shear angular velocity (rad/s); RB is the radius of the “glue” (mm).
When the normal and tangential stress exceed the predetermined value, the bonding breaks. These key forces or torques occur outside the two particles, so the contact radius should be higher than the actual radius. Based on the above operation relationship, a small gap must be retained between each basic particle when using the model.
The Meta-Particle method is compatible with cylindrical particles, which can greatly reduce the number of particles required for modeling compared with spherical particles in the modeling of rod-shaped and thin wall thickness. It supports GPU-CUDA solvers and can dynamically generate flexible model [29,30,31,32,33]. Compared with the original Bonding V1, which requires API particle replacement to create flexible model, the simulation setup process and computational efficiency can be simplified.

2.4.2. Establishment of the DEM of Wheat Straw

Type-P1 and type-P2 fiber monomers are formed by separately connecting P1 in series and P2 in series. Then, 12 type-P1 and 12 type-P2 fiber monomers are separately interleaved around the circumferential direction to form a wheat straw model composed of 24 fiber monomers, as displayed in Figure 12. By comprehensively balancing and considering the modelling dimensions approximated to physical measurements and the modelling requirements, the diameter of the base circle formed by fibers on the cross-section of the finally selected wheat straw model was 3.60 mm, and the length and diameter of P1/P2 basic particles are separately 15 mm and 0.42 mm. Tiny clearances were left between the basic P1 and P2 particles and between segments around the circumferential direction. Each segment of wheat straw included 12 P1 basic particles and 12 P2 basic particles. The length of the wheat straw model can be set to different numbers of segments as needed.
It can be seen from Figure 12 that the contact of wheat straw includes three forms: P1-P1, P2-P2, and P1-P2 contacts. Each of the parameters of the P1 and P2 basic particles including the geometric dimensions, material properties, and contact properties are the same, so the wheat straw model only entails two bonding relationships, separately represented as Bonding V2-B1 and Bonding V2-B2. The two separately approximately simulate the bonding strength between fibers in the circumferential direction and that of fibers of wheat straw themselves [34,35].

3. Results

3.1. Density Calibration of Wheat Straw

The density calibration tests were conducted based on the aforementioned measurement results of the relative mass per unit length. EDEM 2023 software was utilized to write a group of random material densities, which were set to produce a wheat straw model with the length of 104.674 m. Mass sensors were adopted to measure and yield the total mass of wheat straw. Taking 100 g as the final calibration mass, then the density calculation method is expressed as Equation (23).
ρ 0 ρ 1 = m 5 m 6
where ρ0 is the random density (kg/m3); ρ1 is the density (kg/m3); m5 is the mass at random density (kg); m6 is the calibration reference mass of 0.1 kg (kg).
It is calculated that the density of basic particles of wheat straw is 300 kg/m3, which is substituted into simulations to generate wheat straw of a total length of 104.674 m, and the mass measurement results are displayed in Figure 13. The results show that the mass of the model is 0.100679 kg, that is, the difference is less than 1%, indicative of successful calibration.

3.2. Calibration of Test Parameters Affecting the AOR of Wheat Straw

3.2.1. Simulation Tests on the AOR and Screening of Contact Mechanical Parameters

In the simulation tests on the AOR, SolidWorks 2024 software was used to build a cylinder with same dimensions as those in the physical tests. The cylindrical model was imported in the EDEM 2023 software in the format of STEP. The value ranges of simulation parameters of wheat straw, of steel, between wheat straw and steel, and between wheat straws were determined based on the pre-simulation tests on the AOR (Table 6).
On this basis, a cylindrical particle factory that was coaxial and had the same height with the cylinder was set to produce 2000 wheat straw particles of 15 mm long at the rate of 1 × 10⁴ per second. After production, the particles were allowed to undergo free-fall motion and accumulate on the bottom of the cylinder. After standing to t = 0.5 s, the cylinder was vertically lifted upwards at 0.05 m/s to 100 mm [36]. After standing to t = 4 s, images of the wheat straw piles on four sides of +X, +Y, −X, and −Y planes were extracted. The value of AOR was measured through physical tests, and the EDEM simulation tests are displayed in Figure 14.
To determine the optimal combination of the three contact mechanical parameters influencing the AOR, six parameters including the coefficients of static friction, rolling friction, and restitution were separately represented by A to F. Two levels (one high and one low) were set for each parameter, and the specific levels of each factor are displayed in Table 7. Taking the AOR as the response value, Design-Expert 10.0.7.0 software was adopted to conduct Plackett–Burman tests, to screen parameters that significantly influence the response value [37]. A total of 12 tests were designed, in each of which the test schemes was repeated three times to allow calculation of the mean average value of indices. The scheme design and results of the simulation tests are summarized in Table 8.
Parameters in the simulation tests of the model were subjected to significance analysis, and results are given in Table 9. The simulation model for the AOR test is extremely significant, with the coefficient of determination R2 being 0.9890, which suggests a high degree of fit. The p values for the static friction between wheat straw and steel and between wheat straws are both less than 0.01, which means that they exert an extremely significant influence on the AOR; the p value for the rolling friction between wheat straw is less than 0.05, suggesting that the parameter significantly affects the AOR in the simulation tests; the p values exceed 0.1 for other parameters in the simulation tests, indicative of their extremely low influences on the AOR in the simulation tests.

3.2.2. Optimization of Contact Mechanical Parameters

Factors that most influence the AOR were screened through Plackett–Burman tests. BBD-RSM optimization tests of parameters were conducted by taking static friction between wheat straw and steel, static friction between wheat straws, and rolling friction between wheat straws as test factors. Other contact mechanical parameters were given their median values as per Table 7. The levels and codes of test parameters are listed in Table 10, and the BBD test design and results are summarized in Table 11.
BBD test results were subjected to analysis of variance (Table 12). The resulting coefficient of determination R2 is 0.9122, and the p value of the fitting model is less than 0.0001, suggesting an extremely significant relationship between the AOR and the regression model. The p value of the lack-of-fit is 0.1166 (>0.05), indicating the high goodness-of-fit of the model; the coefficient of variation (CV) is 5.62%, which suggests that the tests are highly reliable. Its binary regression equation is:
Y 2 = 22.24 + 1.54 A + 4.90 D 0.1844 E
The influence of the interactions of different factors on the AOR was revealed through response surface analysis of the test results. The results are displayed in Figure 15.
From Figure 15a–c, it can be seen that, with the increase of the coefficients of static friction between wheat straw and steel, the value of AOR shows an increasing trend. With the increase of the coefficient of rolling friction between wheat straws, the value of AOR shows a slight downward trend. With the increase of the coefficients of static friction between wheat straws, the value of AOR increases obviously.
The model was optimized based on Design-Expert 10.0.7.0 software, and the AOR in the physical test was used as the optimal condition, the optimal values of parameters were determined. In this way, the obtained coefficients of static friction between wheat straw and steel, static friction between wheat straws, and rolling friction between wheat straws are 0.271, 0.227, and 0.136, respectively. The contact mechanical parameters were reset in the pre-processing to assess the AOR. Results of verification tests show that the AOR is 18.66°, which has a relative discrepancy of 1.69% with that in the physical tests, indicating that the established AOR and the regression model are favorable.

3.3. Calibration of Bond Contact Parameters of Bonding V2-B1 Model for Simulation Tests on the Compression of Wheat Straw

The Bonding V2 contact model mainly involves parameters including the normal stiffness coefficient per unit area, tangential stiffness coefficient per unit area, ultimate normal stress, ultimate tangential stress, and Bonded Disk Scale. These parameters all exert different degrees of influence on the deformation and force feedback characteristics of wheat straw in the extrusion tests. According to the establishment mode of the DEM of wheat straw, the bonding strength-plastic deformation relationships between fibers (P1-P2) and of fibers themselves (P1-P1 and P2-P2) in the wheat straw model are separately represented by Bonding V2-B1 and Bonding V2-B2.
It is known that the DEM of wheat straw in the research is an ideal cylindrical structure. In the extrusion tests on wheat straw, theoretically two basic particles connected by a Bonding V2-B2 model are relatively static and exert only slight influences on the test indices. In the bending tests on wheat straw, Bonding V2-B1 and Bonding V2-B2 both participate in deformation, so the bond contact parameters of the Bonding V2-B1 model for the extrusion tests on wheat straw were firstly optimized.
In simulation tests on the extrusion of wheat straw, the value ranges of various bond contact parameters of the Bonding V2-B1 model were obtained by multiple pre-simulation tests conducted in the early stage. Median values were taken for various bond contact parameters in the Bonding V2-B1 model, while intrinsic parameters of the wheat straw model were consistent with those in Table 6. The values of the six contact mechanical parameters were optimization results of simulation tests on the AOR. Considering that Bonded Disk Scale exerts too large an influence on the overall properties of the model, its definite value was determined combining with pre-simulation tests. The specific parameters of simulation tests on the extrusion of wheat straw are as listed in Table 13.
On this basis, EDEM 2023 software was adopted to establish a wheat straw model with the same length as that in the physical extrusion tests on wheat straw. Meanwhile, a base plate and a top plate with the length of 20 mm and interval of 50 mm were set. After the developed DEM of a single wheat straw was stabilized on the base plate, the top plate was moved downwards at a constant speed until the wheat straw model was compressed and flattened. The original data concerning changes in the extrusion force of wheat straw with time in the extrusion tests were exported using the software, thus obtaining the peak extrusion force in each simulation test on the extrusion of wheat straw. The EDEM simulation tests are shown in Figure 16.
To obtain optimal values of various bond contact parameters of Bonding V2-B1 model, four-factor three-level BBD tests were conducted for optimal design, with the four parameters of Bonding V2-B1 model as influencing factors while the peak extrusion force of wheat straw as the index. The levels and codes of test factors, as well as the test design and results are separately listed in Table 14 and Table 15.
The analysis of variance was performed on data from BBD-based extrusion tests of the Bonding V2-B1 model (Table 16). The resulting coefficient of determination R2 is 0.9061 and the p value of the fitting model is less than 0.0001, suggesting that the regression model is extremely significant; the p value of the lack-of-fit is 0.0714 (>0.05), indicative of a high goodness-of-fit of the model; the CV is 5.09%, suggesting that the tests are highly reliable. Its binary regression equation is:
Y 4 = 25.45 + 0.0825 H 2 + 5.63 I 2 + 0.7792 J 2 + 0.0333 K 2
The model was optimized based on Design-Expert 10.0.7.0 software, the optimal parameters were determined by taking the average value (23.98 N) of peak extrusion force of 90 mm long wheat straw specimens as the objective. In this way, the normal stiffness coefficient per unit area H2, tangential stiffness coefficient per unit area I2, ultimate normal stress J2, and ultimate tangential stress K2 are separately 4.00 × 10¹¹, 1.53 × 10¹³, 6.27 × 10¹⁰, and 2.20 × 10¹². After substituting these parameters into the DEM, simulation tests on the extrusion of wheat straw were performed. The verification shows that the peak extrusion force of wheat straw is 23.54 N, which has a relative discrepancy of 1.83% with the physical test value, indicating that the calibrated test parameters of Bonding V2-B1 model and the regression model are good.

3.4. Calibration of Bond Contact Parameters of Bonding V2-B2 Model for Simulation Tests on the Bending of Wheat Straw

Based on the aforementioned optimized values of bond contact parameters of Bonding V2-B2 model, EDEM 2023 software was used to conduct simulation tests on the bending of wheat straw. The value ranges of various bond contact parameters of Bonding V2-B2 model are obtained by numerous pre-simulation tests conducted in the early stage of the present research. The intrinsic parameters of the wheat straw model are set in accordance with those listed in Table 6. The contact mechanical parameters and Bonded Disk Scale are set in accordance with those listed in Table 13. The specific parameters in simulation tests on the bending of wheat straw are in accordance with those listed in Table 17.
On this basis, the model of the test equipment established using SolidWorks 2024, matching that in the physical bending tests, was imported into EDEM 2023. Thus, a wheat straw model with the same length as that in the physical bending test on wheat straw was constructed. After the EDM of a stable wheat straw was formed in the V-shaped slot, the tool 50 mm from the V-shaped slot was moved vertically downwards at a constant speed, until fracture of the wheat straw model. The original data concerning changes in the bending pressure with time in the bending tests on wheat straw were exported from the software, thus obtaining the peak bending pressure in each simulation test on the bending of wheat straw. The EDEM simulation test is shown in Figure 17.
The four key bond contact parameters of Bonding V2-B2 model were taken as influencing factors while the peak bending pressure of wheat straw was used as the test index for subsequent four-factor, three-level BBD tests for optimal design. The levels and codes of test factors, as well as the test design and results are listed in Table 18 and Table 19.
The BBD-RSM test data were subjected to the analysis of variance, as shown in Table 20. The resulting coefficient of determination R2 is 0.9652, and the p value of the model is less than 0.0001, suggesting that the regression model is extremely significant. The p value of the lack-of-fit is 0.0848 (>0.05), indicative of the high goodness-of-fit of the model; the CV is 4.00%, indicating that the tests are highly reliable. Its binary regression equation is:
Y 5 = 3.47 + 0.7658 H 3 0.25 I 3 + 0.1083 J 3 0.0092 K 3 0.1450 H 3 I 3 0.1650 H 3 J 3 0.0875 H 3 K 3                   0.1325 I 3 J 3 0.0725 I 3 K 3 + 0.0525 J 3 K 3 0.0033 H 3 2 0.0155 I 3 2 + 0.1470 J 3 2 0.0268 K 3 2
The model was optimized based on Design-Expert 10.0.7.0 software, the optimal parameters were determined taking the average value (3.784 N) of peak bending pressure of wheat straw as the objective under a spacing of 130 mm between support points. The obtained normal stiffness coefficient per unit area H3, tangential stiffness coefficient per unit area I3, ultimate normal stress J3, and ultimate tangential stress K3 are separately 1.244 × 10¹², 7.500 × 10¹¹, 6.570 × 10⁹, and 1.200 × 10⁹. These parameters were substituted into the DEM before subsequent simulation tests on bending. In the verification test, the obtained peak bending pressure of wheat straw is 3.66 N, a discrepancy of 3.27% with the physical test value, indicating that the calibrated test parameters of Bonding V2-B2 model and the regression model are good.

3.5. Verification Tests

Through physical tests and virtual simulation, an optimal combination of the contact mechanical parameters and the bond contact parameters of Bonding V2 models was calibrated. EDEM 2023 software was adopted to perform verification tests on extrusion and bending, and the measurement results are listed in Table 21. The obtained average values of the peak extrusion force and peak bending pressure of wheat straw are separately 23.20 N and 3.92 N, differing by 3.25% and 3.59% from the peak extrusion force and peak bending pressure attained in physical tests. This further verifies the reliability and authenticity of calibration of simulation tests.
Meanwhile, to prove that the calibrated wheat straw model can simulate the bending and compression characteristics of wheat straw in the harvest process, EDEM 2023 software was used to conduct compression tests on wheat straw clusters [38,39]. The simulation model mainly comprised two parts, namely, a bottom box and a pressing plate. The pressing plate was a square plate measuring 900 mm × 900 mm × 100 mm, which, together with the bottom box, constituted a cubic cavity with the side length of 900 mm. After generating and accumulating a hollow wheat straw model with a mass of 2 kg on the bottom of the cavity, the pressing plate was moved vertically downwards to compress the wheat straw cluster. The geometric simulation model is shown in Figure 18. Results show that the wheat straw cluster is significantly bent and is compressed to different extents in the test process, proving the accuracy and applicability of parameter calibration for the DEM of wheat straw.

4. Discussion

The research developed a discrete element model (DEM) of hollow flexible by using cylindrical particles, combining with two types of bonds, as shown in Figure 12. Bonding V2-B1 and Bonding V2-B2 approximately simulate the bonding strength between fibers in the circumferential direction and that of fibers of wheat straw themselves, The modeling method is different from the single particle filling method in the previous literatures [19,20]. However, when the wheat straw model established by the non-single bond model is applied to the extrusion test, the wheat straw presents the deformation stage basically consistent with the literature [34]. The difference is that the wheat straw model established by the author can also appear the four pieces state basically consistent with the physical test.
In this study, the applicability of the model under different working conditions was ensured by collaborative optimization of multiple response indexes (AOR, peak extrusion force and peak bending pressure). Most of the previous studies [14,17] calibrated the contact mechanical parameters, bond contact parameters or relatively single response indexes of straw.
The model used in this study assumes that the wheat straw is a uniform hollow cylinder, which simplifies the microstructure of the actual wheat straw, such as uneven section and wall thickness. The hardness of the stalk section is higher than that of the stalk body. After simplification, the local stress concentration during bending may be underestimated, resulting in a slight deviation between the simulated value of the bending pressure peak and the physical test. At the same time, this model has certain limitations for large-scale straw harvesting simulation research and straw dynamic crushing simulation research. In the future research, new modeling methods can be found to improve the authenticity of the model. GPU parallel computing based on NVIDIA CUDA architecture can improve the speed of DEM simulation by 10–70 times, which provides more possibilities for large-scale simulation.

5. Conclusions

(1)
By conducting physical tests, the average values of the outer diameter and wall thickness of wheat straw were separately found to be 4.045 mm and 0.416 mm, and the density was 300 kg/m3. Meanwhile, the coefficients of static friction, rolling friction, and restitution between wheat straw and wheat straw-45 steel are separately 0.227, 0.136, 0.479, 0.271, 0.093, and 0.482 by the self-made test platform. Through use a lifted cylinder, the average AOR of 18.35° was attained; the average values of peak extrusion force and peak bending pressure were found to be 23.98 N and 3.784 N separately through extrusion and bending tests on single wheat straw.
(2)
Based on the Meta-Particle modelling method, the DEM of hollow flexible wheat straw was established using two Bonding V2 models. Factors that greatly affect the AOR were screened by taking the AOR as the test index to conduct Plackett–Burman tests. Design-Expert 10.0.7.0 software was used to perform BBD-RSM optimization tests, through which the coefficients of static friction between wheat straw and steel, static friction between wheat straws, and rolling friction between wheat straws were determined to be 0.271, 0.227, and 0.136.
(3)
Four-factor three-level BBD–RSM tests were conducted, the obtained optimal combination of bond contact parameters of Bonding V2-B1 model is as follows: the normal stiffness coefficient per unit area, tangential stiffness coefficient per unit area, ultimate normal stress, and ultimate tangential stress are separately 4.00 × 10¹¹, 1.53 × 10¹³, 6.27 × 10¹⁰, and 2.20 × 10¹². Under the condition, the peak extrusion force of wheat straw is 23.54 N. The obtained optimal combination of Bonding V2-B2 model includes the normal stiffness coefficient per unit area, tangential stiffness coefficient per unit area, ultimate normal stress, and ultimate tangential stress separately of 1.244 × 10¹², 7.500 × 10¹¹, 6.570 × 10⁹, and 1.200 × 10⁹, and the peak bending pressure of wheat straw is 3.66 N.
(4)
Extrusion and bending tests on single wheat straws were conducted. By doing so, the average values of the peak extrusion force and peak bending pressure were obtained to be 23.20 N and 3.92 N, differing separately by 3.25% and 3.59% from the peak extrusion force and peak bending pressure obtained in physical tests. The research provides dynamic harvesting model support for simulation analysis during the harvest and process of wheat straw.

Author Contributions

Conceptualization, H.H. and Z.L.; methodology, H.H. and Z.L.; project administration, H.H. and Z.L.; funding acquisition, H.H. and Z.L.; software, Y.Z. (Yan Zhang); validation, Y.Z. (Yan Zhang); formal analysis, Y.Z. (Yan Zhang); writing—original draft, Y.Z. (Yan Zhang); writing—review and editing, G.H., B.S., H.Y., Z.F., Y.Z. (Yangfan Zhuang), H.T. and L.L.; supervision, G.H., B.S., H.Y., Z.F., Y.Z. (Yangfan Zhuang), H.T. and L.L. All authors have read and agreed to the published version of the manuscript.
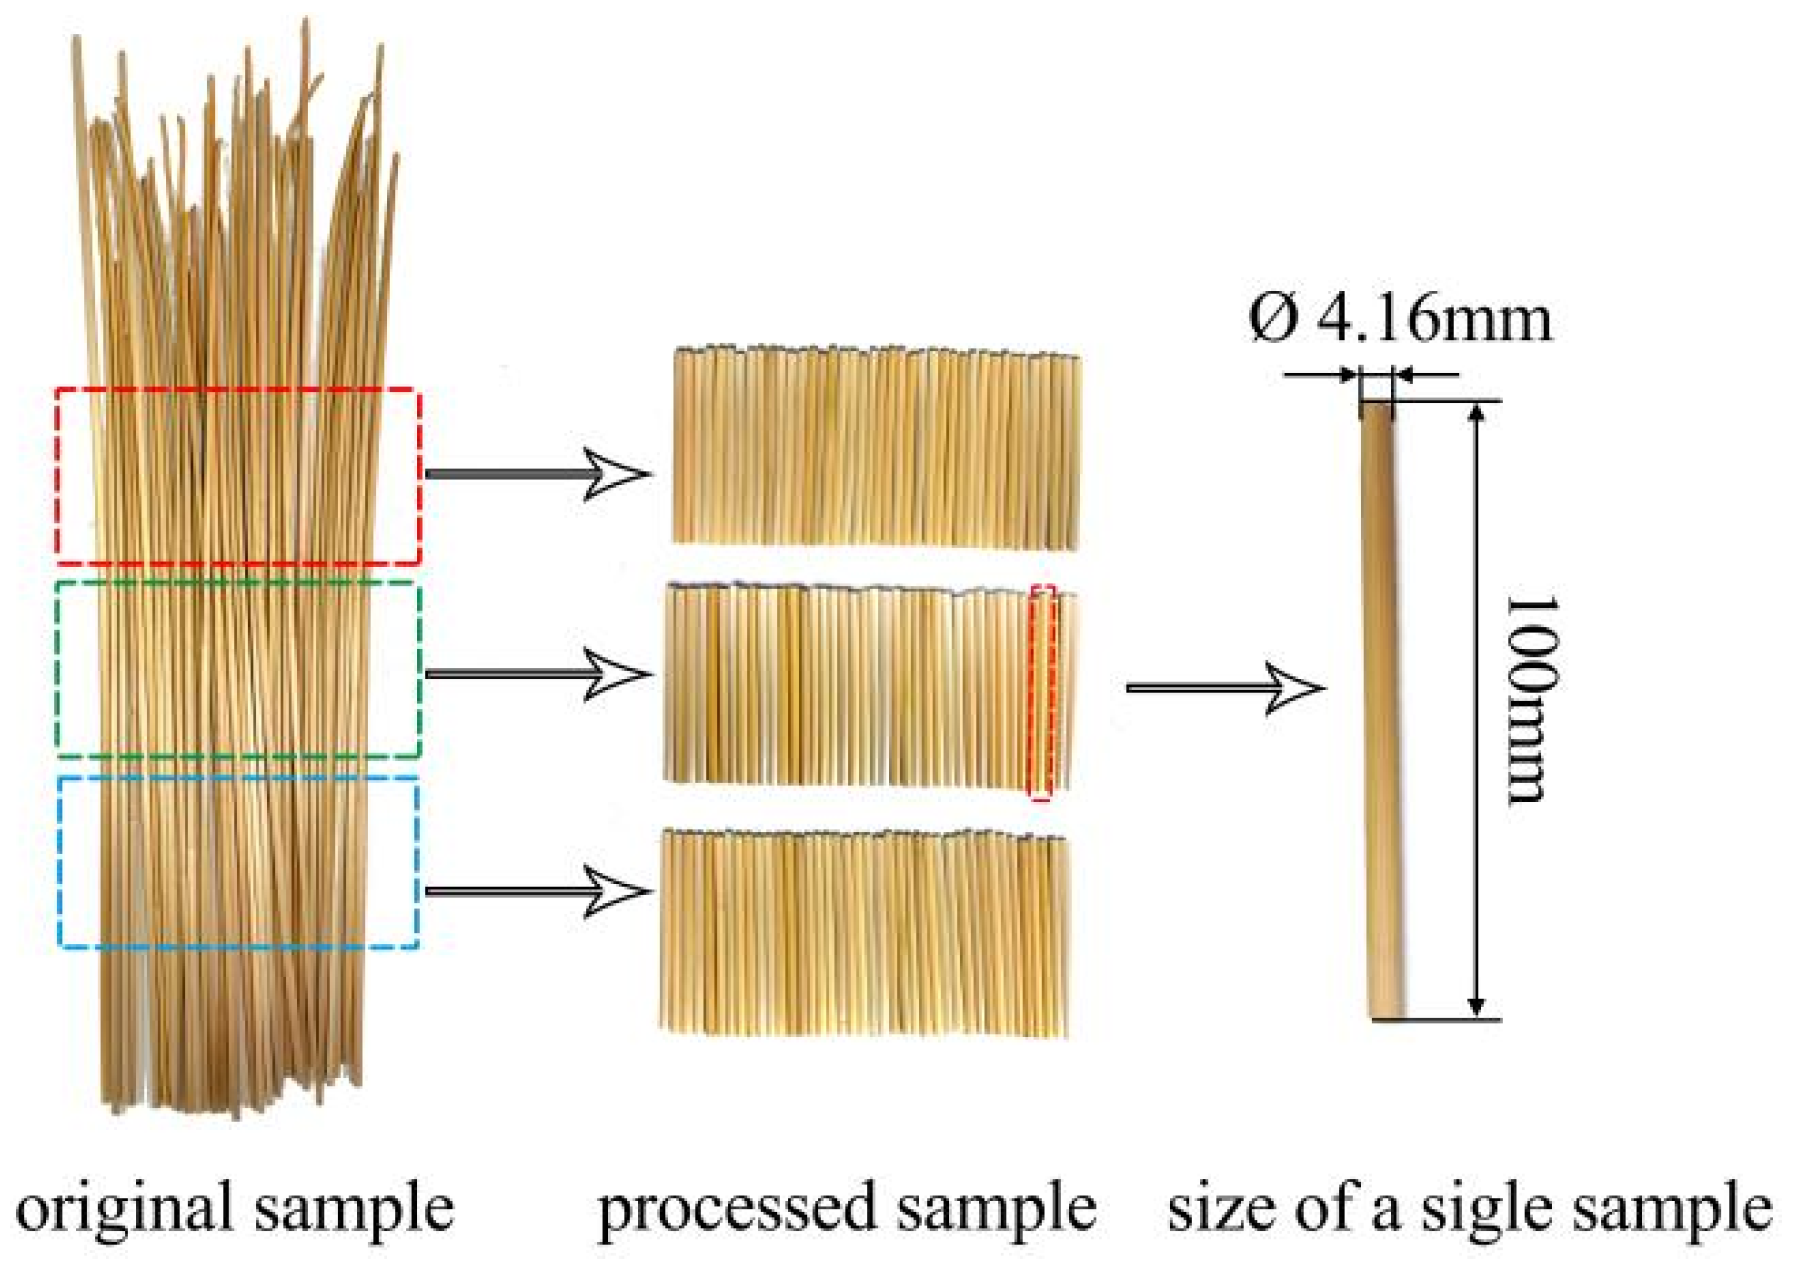
Funding

This research was financially supported by National Natural Science Foundation of China [grant number 52205261], the Henan Province Science and Technology Research Project [grant number 252102110350] and the Henan Province Science and Technology Research Project [grant number 252102111177].

Institutional Review Board Statement

Not applicable.

Informed Consent Statement

Not applicable.

Data Availability Statement

The data used to support the findings of this study are available from the corresponding author upon request.

Acknowledgments

The authors would like to thank their college and the laboratory, as well as gratefully appreciate the reviewers who provided helpful suggestions for this manuscript.

Conflicts of Interest

The authors declare no conflicts of interest.

References

  1. Zhao, R.; Cao, J.; Zhu, T.T. Analysis on the international trade and competitiveness of Chinese wheat. J. Chuzhou Univ. 2021, 23, 14–19+41. [Google Scholar]
  2. Jiang, Y.; Wang, X.D. Analysis on the current situation problems and countermeasures of Wheat Industry Development in China. South China Agric. 2020, 14, 31–34+46. [Google Scholar] [CrossRef]
  3. Zhang, Q. Analysis of straw burning and comprehensive utilization. Agric. Henan 2021, 19, 7–8. [Google Scholar]
  4. Carrillo, S.D.; Jian, F.; Jayas, S.D.; Paliwal, J. Characterisation of pore structure of bulk wheat mixed with dockage using X-ray micro-computed tomography and deep learning. Biosyst. Eng. 2024, 240, 62–76. [Google Scholar] [CrossRef]
  5. Zhang, R. Promotion and application of wheat straw mechanical picking and baling. Mod. Agric. Mach. 2012, 1, 24–25. [Google Scholar]
  6. Shi, D.Y. Analysis on the Current Situation and Countermeasures of Comprehensive Utilization of Crop Straw in Henan Province. Master’s Thesis, Jilin Agricultural University, Changchun, China, 2023. [Google Scholar]
  7. Zhao, Z.; Huang, H.; Yin, J.; Yang, S.X. Dynamic analysis and reliability design of round baler feeding device for rice straw harvest. Biosyst. Eng. 2018, 174, 10–19. [Google Scholar] [CrossRef]
  8. Sun, Q.; Wang, P.; Shi, S. The round baler modeling design based on unconscious quantification. Appl. Nanosci. 2022, 13, 2419–2430. [Google Scholar] [CrossRef]
  9. Song, C.; Hu, X.J.; Yang, S.; Xu, J.; Chen, C.; Liu, G. Drawdown and suspension of corn straw in the non-Newtonian fluid in stirred tank. Particuology 2025, 99, 173–183. [Google Scholar] [CrossRef]
  10. Wang, L.; He, X.W.; Hu, C.; Guo, W.S.; Wang, X.F.; Xing, J.F. Measurement of the physical parameters and calibration of discrete element simulation parameter of coated cotton seed. J. China Agric. Univ. 2022, 27, 71–82. [Google Scholar]
  11. Hou, Z.F.; Dai, N.Z.; Chen, Z.; Yi, Q.; Zhang, X. Measurement and calibration of physical property parameters for Agropyron seeds in a discrete element simulation. Trans. Chin. Soc. Agric. Eng. 2020, 36, 46–54. [Google Scholar]
  12. Du, X.; Liu, C.L.; Jiang, M.; Yuan, H.; Dai, L.; Li, F. Calibration of bonding model parameters for coated fertilizers based on discrete element method. Trans. Chin. Soc. Agric. Mach. 2022, 53, 141–149. [Google Scholar]
  13. Niu, Z.Y.; Kong, X.R.; Shen, B.S.; Li, H.; Geng, J.; Liu, J. Parameters calibration of discrete element simulation for pellet feed attrition. Trans. Chin. Soc. Agric. Mach. 2022, 53, 132–140+207. [Google Scholar]
  14. Gong, F.; Hu, M.; Bao, A.H.; Li, D.; Gao, T.; Wang, C. Parameter Calibration and Significance Analysis of Rice Straw based on Hertz-Mindlin Model. J. Southwest Univ. 2022, 44, 186–196. [Google Scholar]
  15. Shu, C.X.; Yang, J.; Wan, X.Y.; Yuan, J.; Liao, Y.; Liao, Q. Calibration and experiment of the discrete element simulation parameters of rape threshing mixture in combine harvester. Trans. Chin. Soc. Agric. Eng. 2022, 38, 34–43. [Google Scholar]
  16. Zhou, J.; Sun, W.T.; Liang, Z.A. Construction of Discrete Element Flexible Model for Jerusalem Artichoke root—Tuber at Harvest Stage. Trans. Chin. Soc. Agric. Mach. 2023, 54, 124–132. [Google Scholar]
  17. Hou, J.; Xie, F.P.; Wang, X.S.; Liu, D.; Chen, Z. Measurement of Contact Physical Parameters of Flexible Rice Straw and Discrete Element Simulation Calibration. Acta Agric. Univ. Jiangxiensis 2022, 44, 747–758. [Google Scholar] [CrossRef]
  18. Liao, Y.T.; Wang, Z.T.; Liao, Q.X.; Wan, X.; Zhou, Y.; Liang, F. Calibration of Discrete Element Model Parameters of Forage Rape Stalk at Early Pod Stage. Trans. Chin. Soc. Agric. Mach. 2020, 51, 236–243. [Google Scholar]
  19. Ma, Z.T.; Zhao, Z.H.; Quan, W.; Shi, F.; Gao, C.; Wu, M. Calibration of Discrete Element Parameter of Rice Stubble Straw Based on EDEM. J. Agric. Sci. Technol. 2023, 25, 103–113. [Google Scholar] [CrossRef]
  20. Tong, S.H.; Shao, M.X.; Cao, M.; Zhao, J. Parameter calibration of corn straw discrete element model based on DEM. J. Chin. Agric. Mech. 2023, 44, 69–75. [Google Scholar]
  21. Chen, L.T.; Xue, J.X.; Mou, X.W.; Ma, X.; Liu, W.; Liu, Y.; Xiang, J. Research on the calibration method of cassava seed stem simulation parameters based on discrete element. Jiangsu Agric. Sci. 2023, 51, 198–205. [Google Scholar] [CrossRef]
  22. Chen, T.; Yi, S.J.; Li, Y.F.; Tao, G.; Qu, S.; Li, R. Establishment of Discrete Element Model and Parameter Calibration of Alfalfa Stem in Budding Stage. Trans. Chin. Soc. Agric. Mach. 2023, 54, 91–100. [Google Scholar]
  23. Zhang, X.R.; Hu, X.H.; Liu, J.X.; Yang, Y.; Li, Y. Calibration and Verification of Bonding Parameters of Banana Straw Simulation Model Based on Discrete Element Method. Trans. Chin. Soc. Agric. Mach. 2023, 54, 121–130. [Google Scholar]
  24. Chen, Y.; Gao, X.X.; Jin, X.; Ma, X.; Hu, B. Calibration and analysis of seeding parameters of Cyperus esculentus seeds based on discrete element simulation. Trans. Chin. Soc. Agric. Mach. 2023, 54, 58–69. [Google Scholar]
  25. Wójcik, A.; Klapa, P.; Mitka, B.; Sładek, J. The use of the photogrammetric method for measurement of the repose angle of granular materials. Measurement 2018, 115, 19–26. [Google Scholar] [CrossRef]
  26. Marvin, J.; Alexander, P.M.; Frankie, H.; Useldinger, R.; Baller, J. Determination of the angle of repose of hard metal granules. Powder Technol. 2022, 407, 117695. [Google Scholar] [CrossRef]
  27. Al-Hashemi, B.M.H.; Al-Amoudi, B.S.O. A review on the angle of repose of granular materials. Powder Technol. 2018, 330, 397–417. [Google Scholar] [CrossRef]
  28. Shi, C.; Yang, W.K.; Yang, J.X.; Chen, X. Calibration of micro-scaled mechanical parameters of granite based on a bonded-particle model with 2D particle flow code. Granul. Matter 2019, 21, 38. [Google Scholar] [CrossRef]
  29. Xua, J.; Qi, H.; Fang, X.; Lu, L.; Ge, W.; Wang, X.; Xu, M.; Chen, F.; He, X.; Li, J. Quasi-real-time simulation of rotating drum using discrete element method with parallel GPU computing. Particuology 2011, 9, 446–450. [Google Scholar] [CrossRef]
  30. Fu, S.Q.; Huang, P.; Ding, Y.F. Research on particle motion simulation method based on discrete element method and GPU acceleration. J. HEFEI Univ. Technol. 2019, 42, 1602–1607. [Google Scholar]
  31. Wang, Y. Implementation and Optimization of 3D Discrete Element Method Simulation Software Based on CUDA. Master’s Thesis, Jilin Agricultural University, Changchun, China, 2019. [Google Scholar]
  32. Liu, C.L.; Niu, Z.Z.; Liao, Z.X.; Dong, Y. Design and Development of Discrete Element Software Based on GPU Parallel. Software 2021, 42, 70–74. [Google Scholar]
  33. Ye, J.H.; Wang, J. Application of GPU-based parallel computing method for DEM in large engineering structures. Eng. Mech. 2021, 38, 1–7. [Google Scholar]
  34. Ben, Z.; Zhang, X.; Yang, D.; Chen, K. An Experimental and Numerical Study for Discrete Element Model Parameters Calibration: Gluten Pellets. Agriculture 2023, 13, 744. [Google Scholar] [CrossRef]
  35. Müller, P.; Tomas, J. Simulation and calibration of granules using the discrete element method. Particuology 2014, 12, 40–43. [Google Scholar] [CrossRef]
  36. Kodicherla, S.P.K.; Nandyala, D.K. Morphological effects on the angle of repose of granular materials: A discrete element investigation. Granul. Matter 2023, 25, 71. [Google Scholar] [CrossRef]
  37. Xu, N.N.; Tang, S.; Lin, D.D.; Geng, R.; Wang, X.; Liang, X. Complex granular flows of sticky-wet material on flip-flow screens: Calibration of discrete element simulations. Particuology 2024, 84, 290–308. [Google Scholar] [CrossRef]
  38. Zhang, Z.; Mei, F.; Xiao, P.; Zhao, W.; Zhu, X. Discrete element modelling and simulation parameters calibration for the compacted straw cube. Biosyst. Eng. 2023, 230, 301–312. [Google Scholar] [CrossRef]
  39. Mei, F.; Li, B.; Xu, Z.; Li, X.; Zhu, X. Discrete element modeling of straw bale: An innovative approach to simulate the compression mechanics of fiber-based materials. Comput. Electron. Agric. 2025, 231, 110002. [Google Scholar] [CrossRef]
Figure 1. Wheat straw selection and treatment.
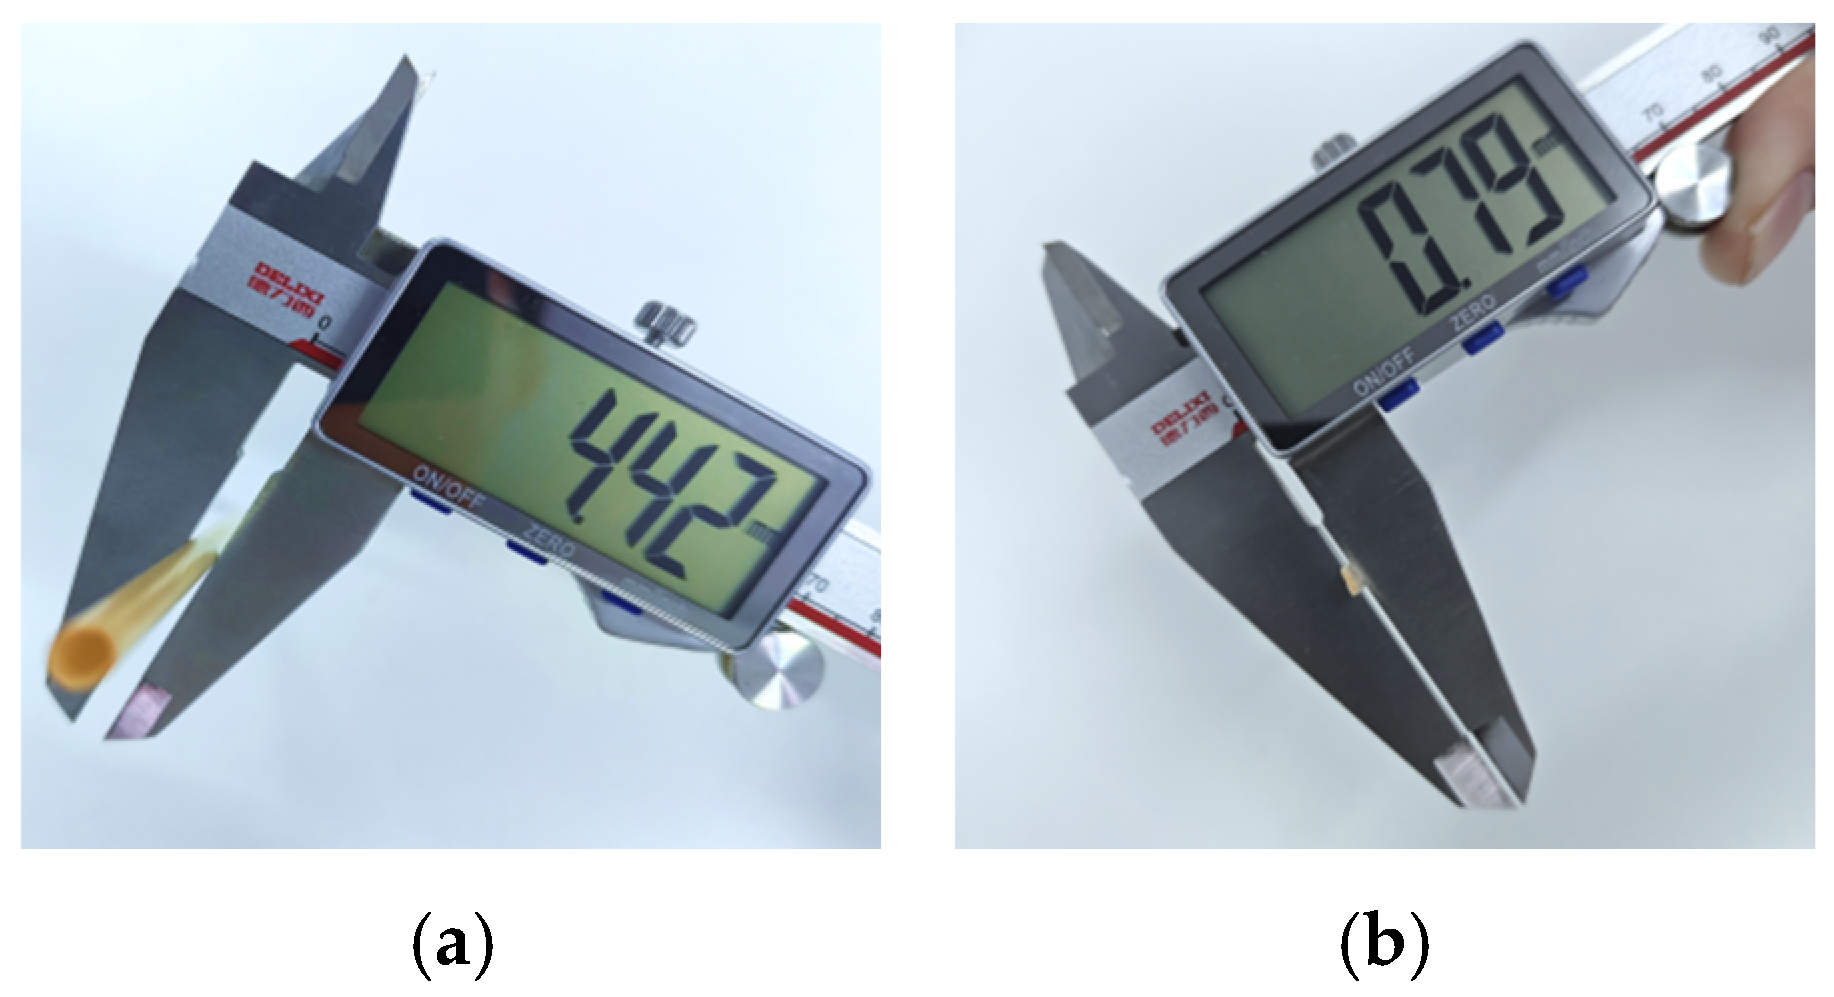
Agriculture 15 01686 g001
Figure 2. Geometric size measurement of wheat straw: (a) determination of outer diameter of wheat straw; (b) determination of wall thickness.
Agriculture 15 01686 g002
Figure 3. The frequency distribution of geometric characteristics of wheat straw: (a) outer diameter distribution; (b) wall thickness distribution.
Agriculture 15 01686 g003
Figure 4. Mass determination of wheat straw.
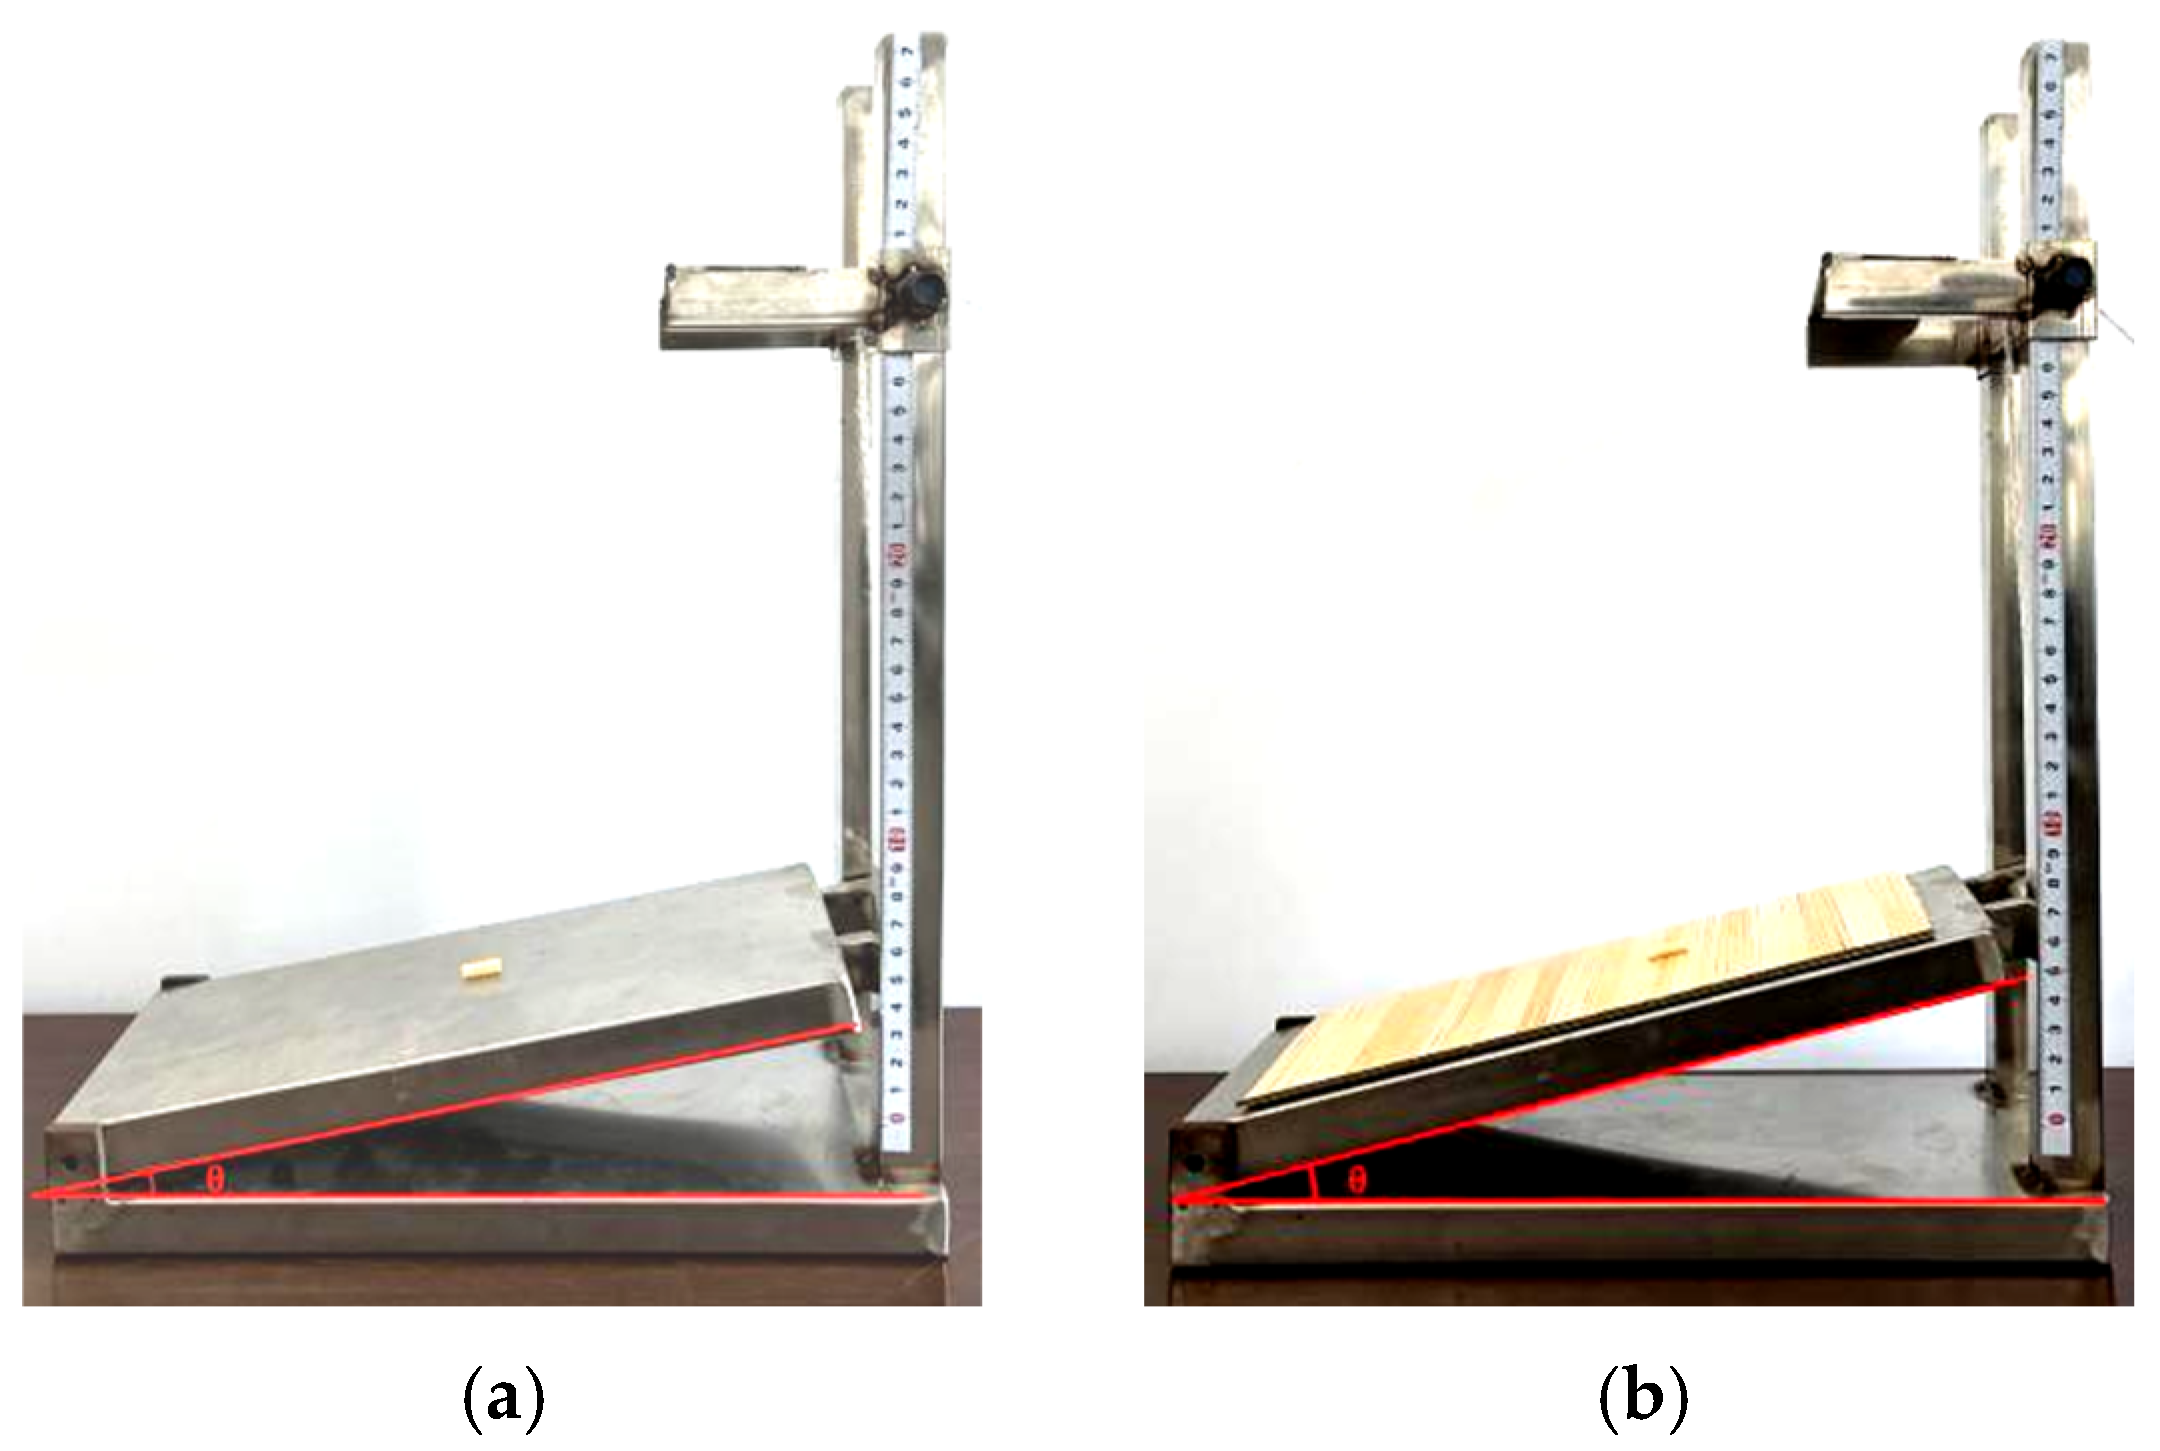
Agriculture 15 01686 g004
Figure 5. The test platform for the frictional properties: (a) the coefficients of static friction between wheat straw and steel; (b) the coefficients of static friction between wheat straw.
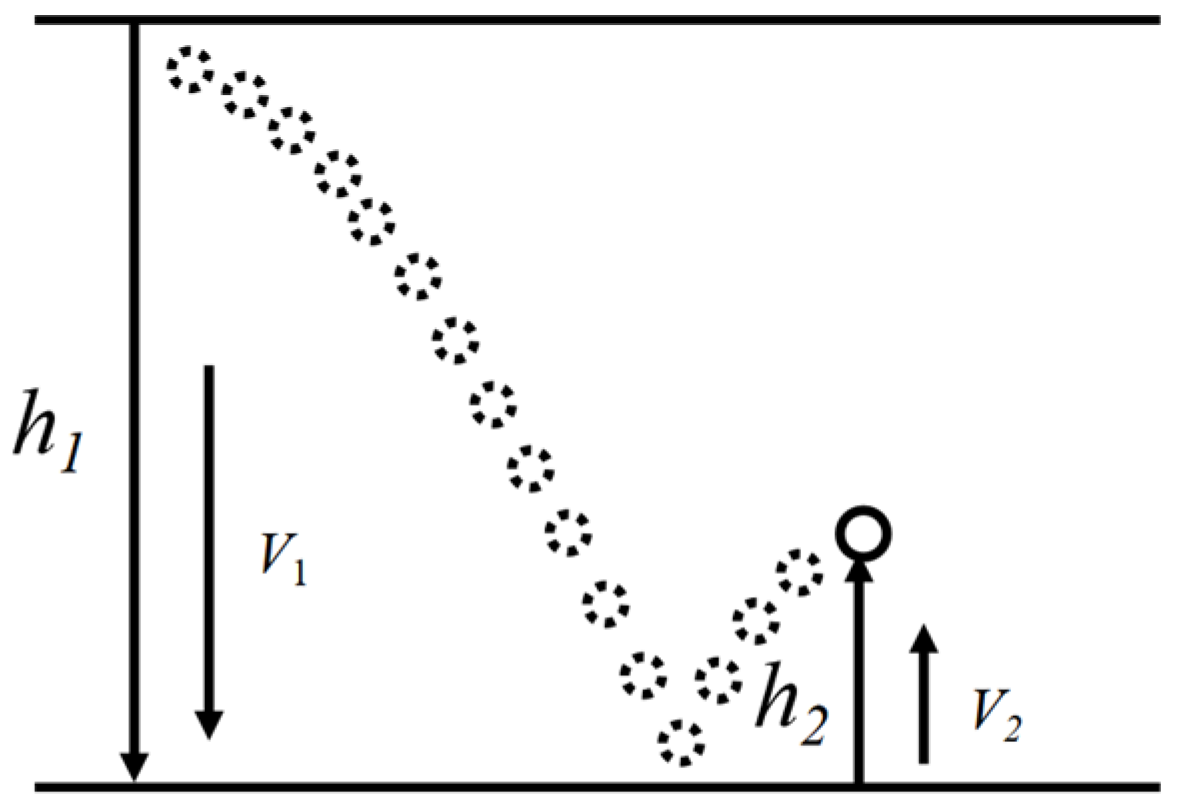
Agriculture 15 01686 g005
Figure 6. Determination principle of coefficient of restitution.
Agriculture 15 01686 g006
Figure 7. Test measurement of the AOR: (a) the test platform for measuring the AOR; (b) single-side images of the pile of wheat straw; (c) images of grey-scale; (d) binarization diagram; (e) fitted lines.
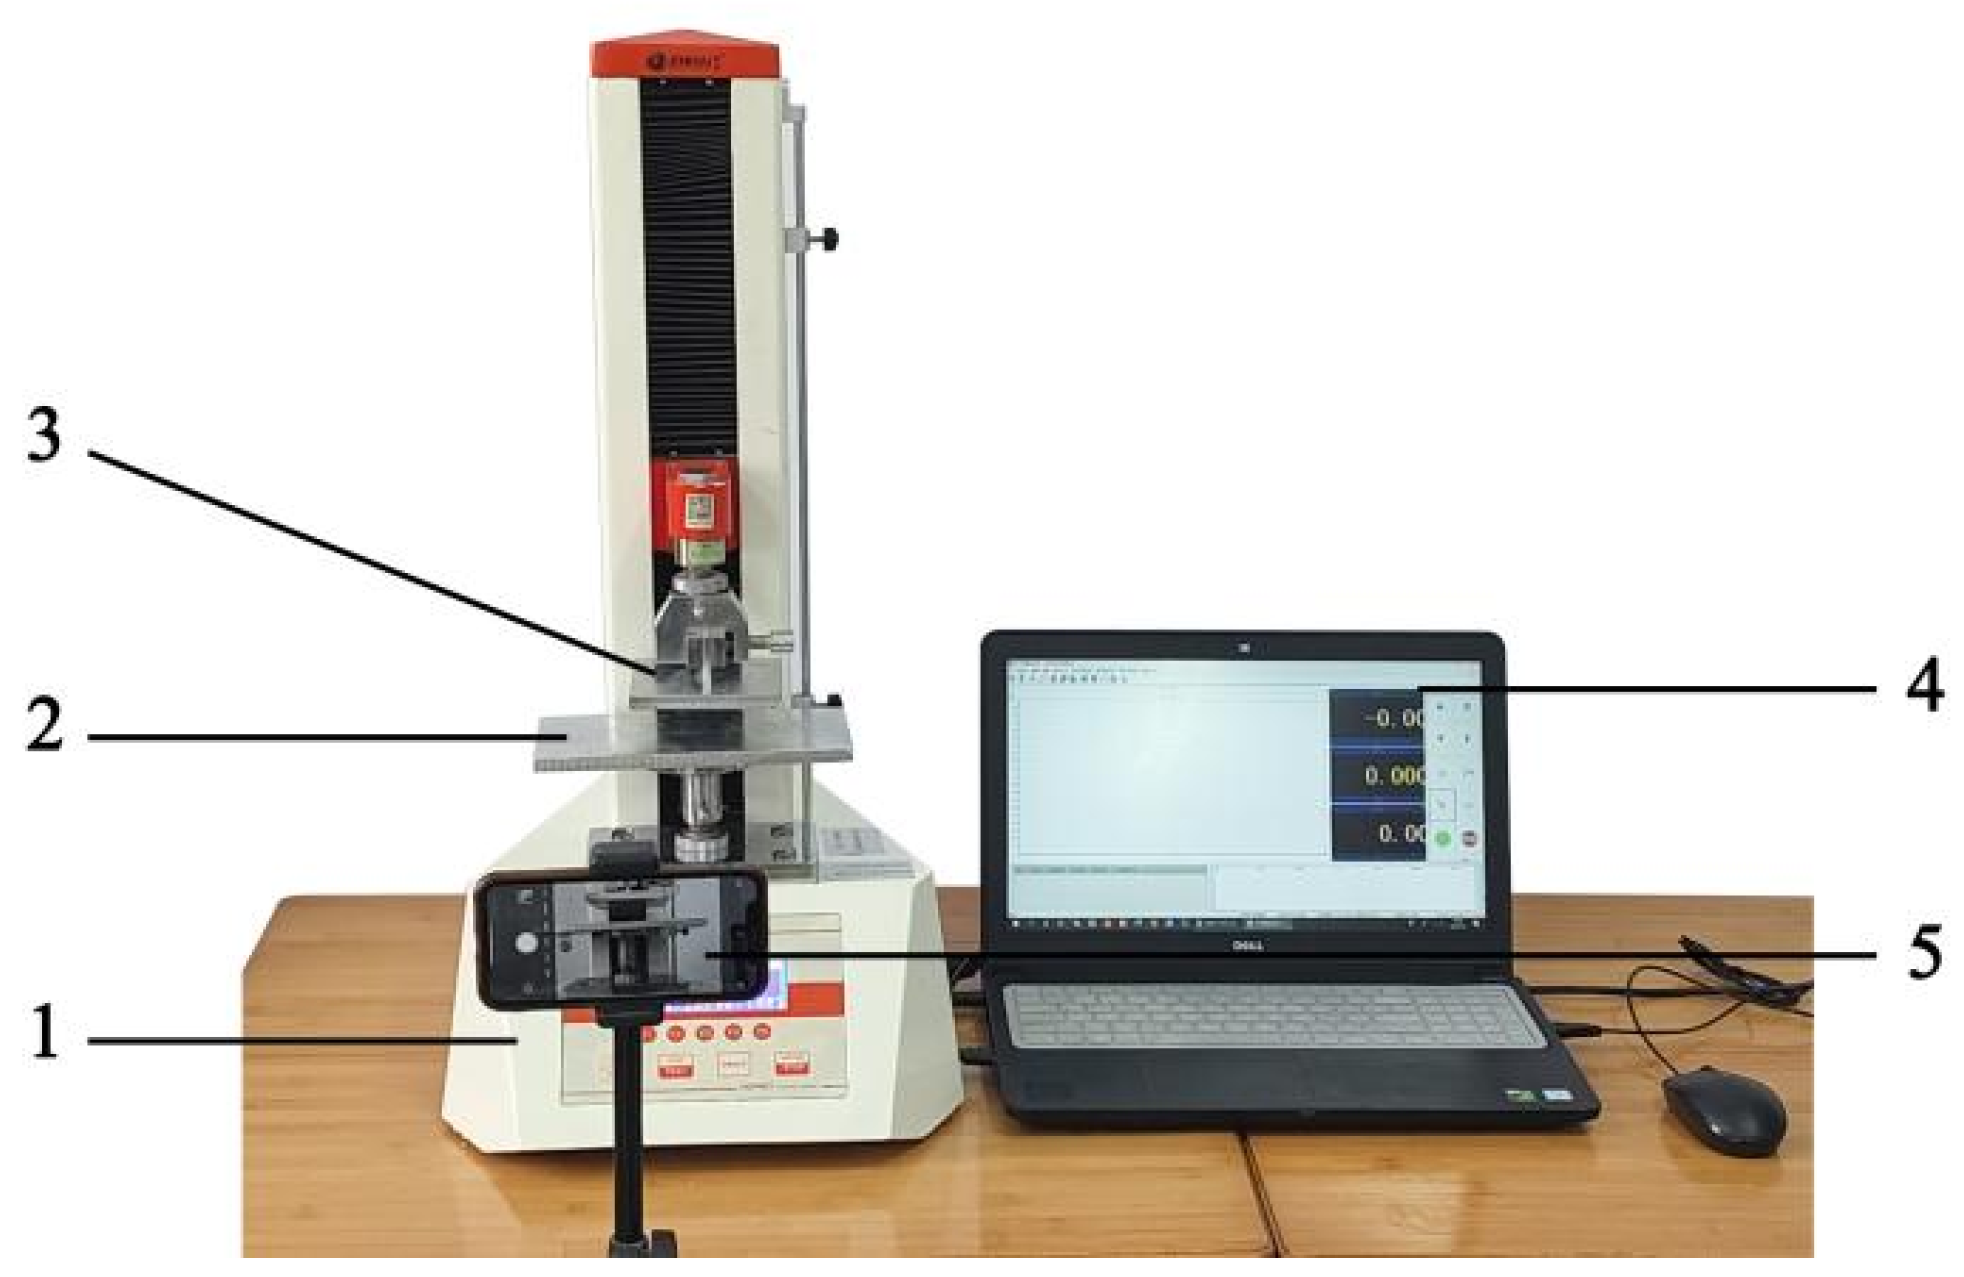
Agriculture 15 01686 g007
Figure 8. Device of extrusion tests for wheat straw. 1. Universal testing machine; 2. Base plate for compression; 3. Top plate for compression; 4. PC data acquisition device; 5. Camera.
Agriculture 15 01686 g008
Figure 9. Extrusion test image: (a) relationship diagram of extrusion force-compressive displacement; (b) the stage of elastic deformation; (c) the early and middle stage of plastic deformation (four pieces); (d) late plastic deformation (flattened).
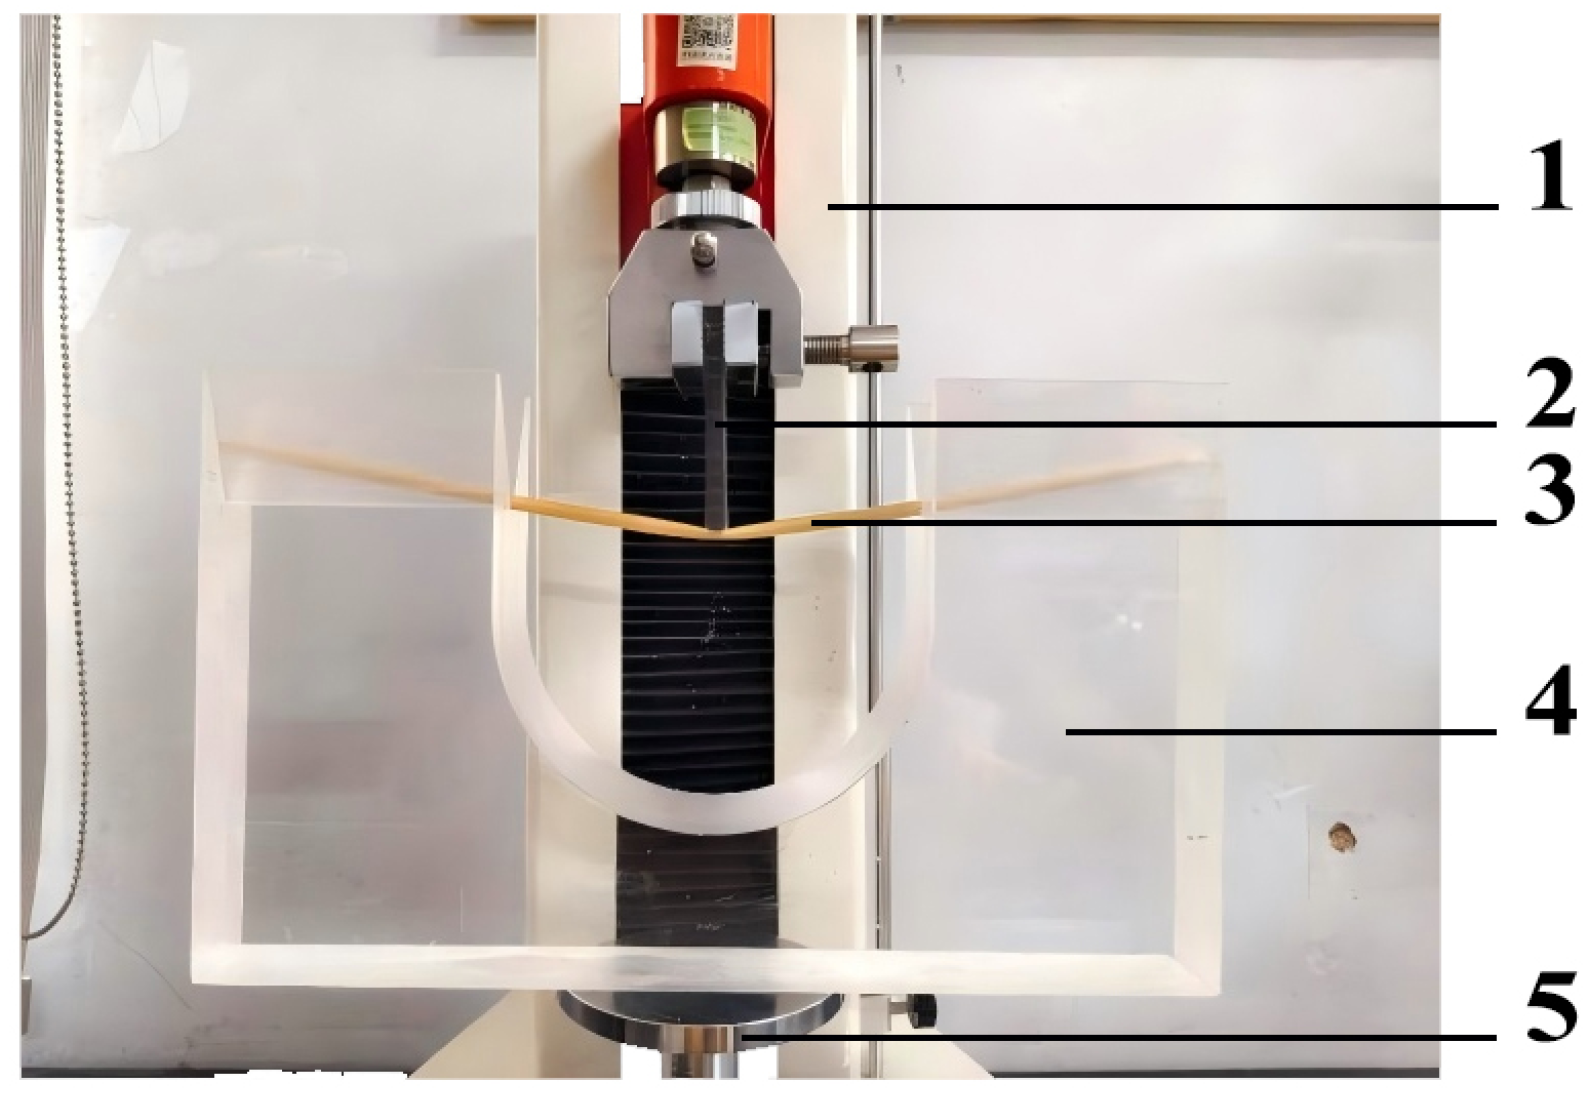
Agriculture 15 01686 g009
Figure 10. Bending tests device. 1. Universal testing machine; 2. Extrusion tool; 3. Wheat straw; 4. U-shaped groove; 5. The bottom fixing base.
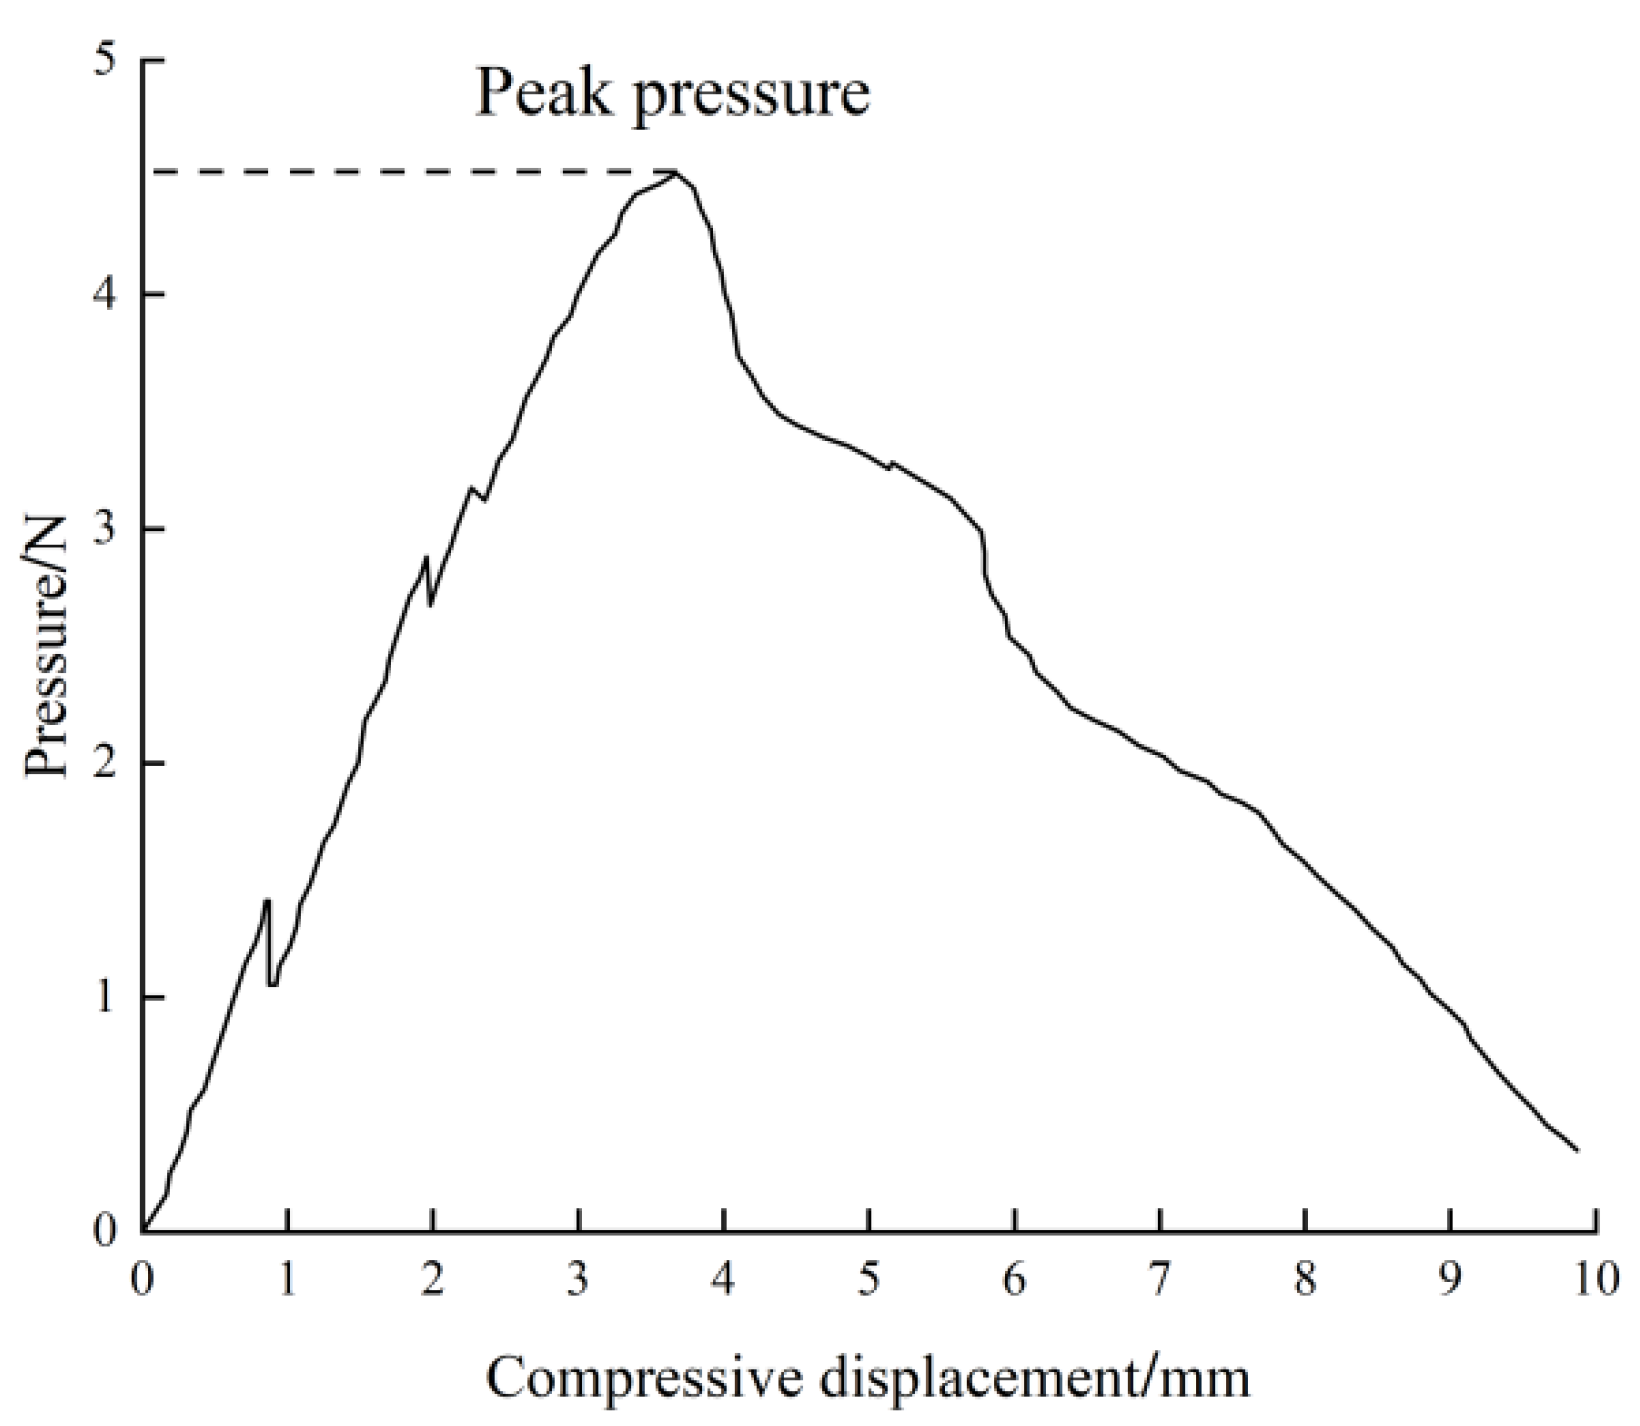
Agriculture 15 01686 g010
Figure 11. Relationship diagram of bending pressure-compressive displacement.
Agriculture 15 01686 g011
Figure 12. Discrete element simulation model of wheat straw: (a) the interleaved arrangement of type-P1 fiber monomer and type-P2 fiber monomer and the two Bonding V2 generated between them; (b) key size description of wheat straw model.
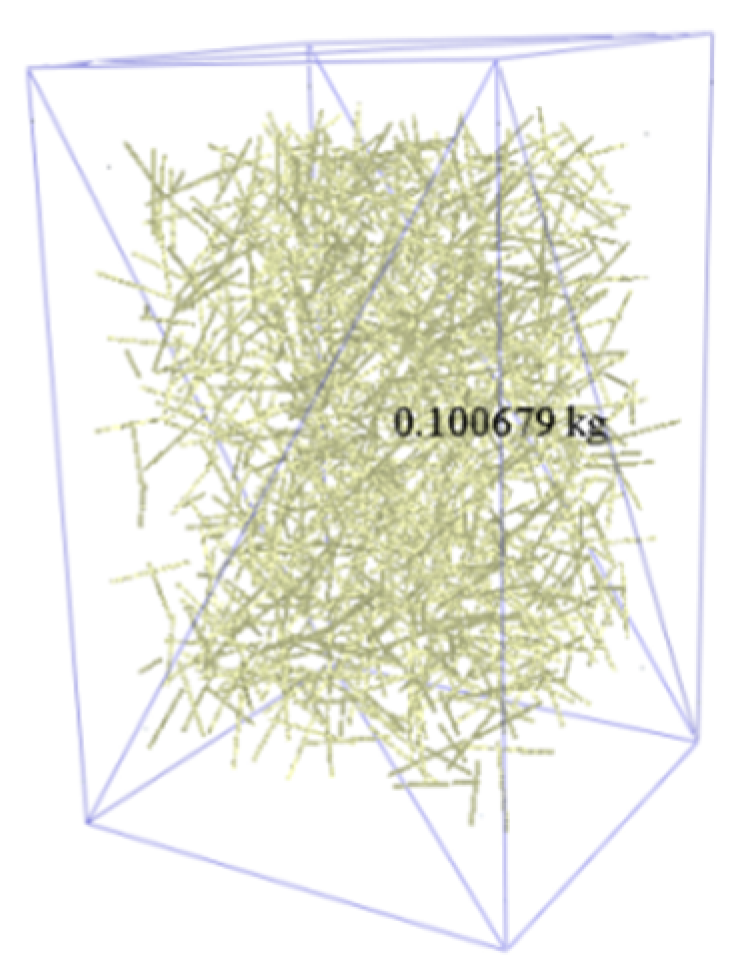
Agriculture 15 01686 g012
Figure 13. Mass statistics of wheat straw model under 104.674 m length.
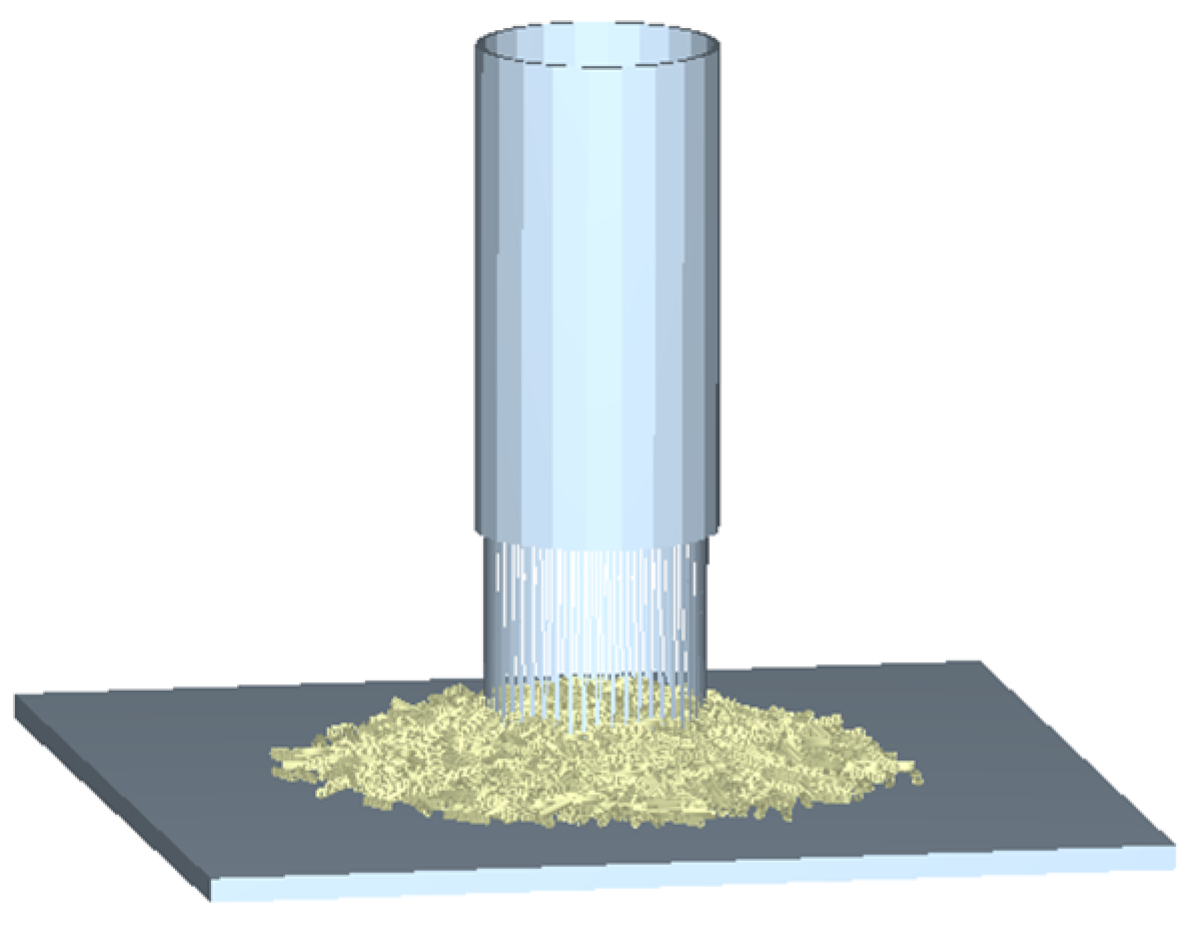
Agriculture 15 01686 g013
Figure 14. Simulation test model of AOR.
Agriculture 15 01686 g014
Figure 15. Response surface diagrams for BBD tests of the AOR. (a) The influence of the coefficients of static friction between wheat straw and steel and the rolling friction between wheat straws on AOR. (b) The influence of the static friction between wheat straws and the static friction between wheat straw and steel on AOR. (c) The influence of the static friction between wheat straws and the rolling friction between wheat straws on the impurity rate.
Agriculture 15 01686 g015
Figure 16. Extrusion simulation test: (a) extrusion simulation test model; (b) wheat straw deformation in different extrusion stages.
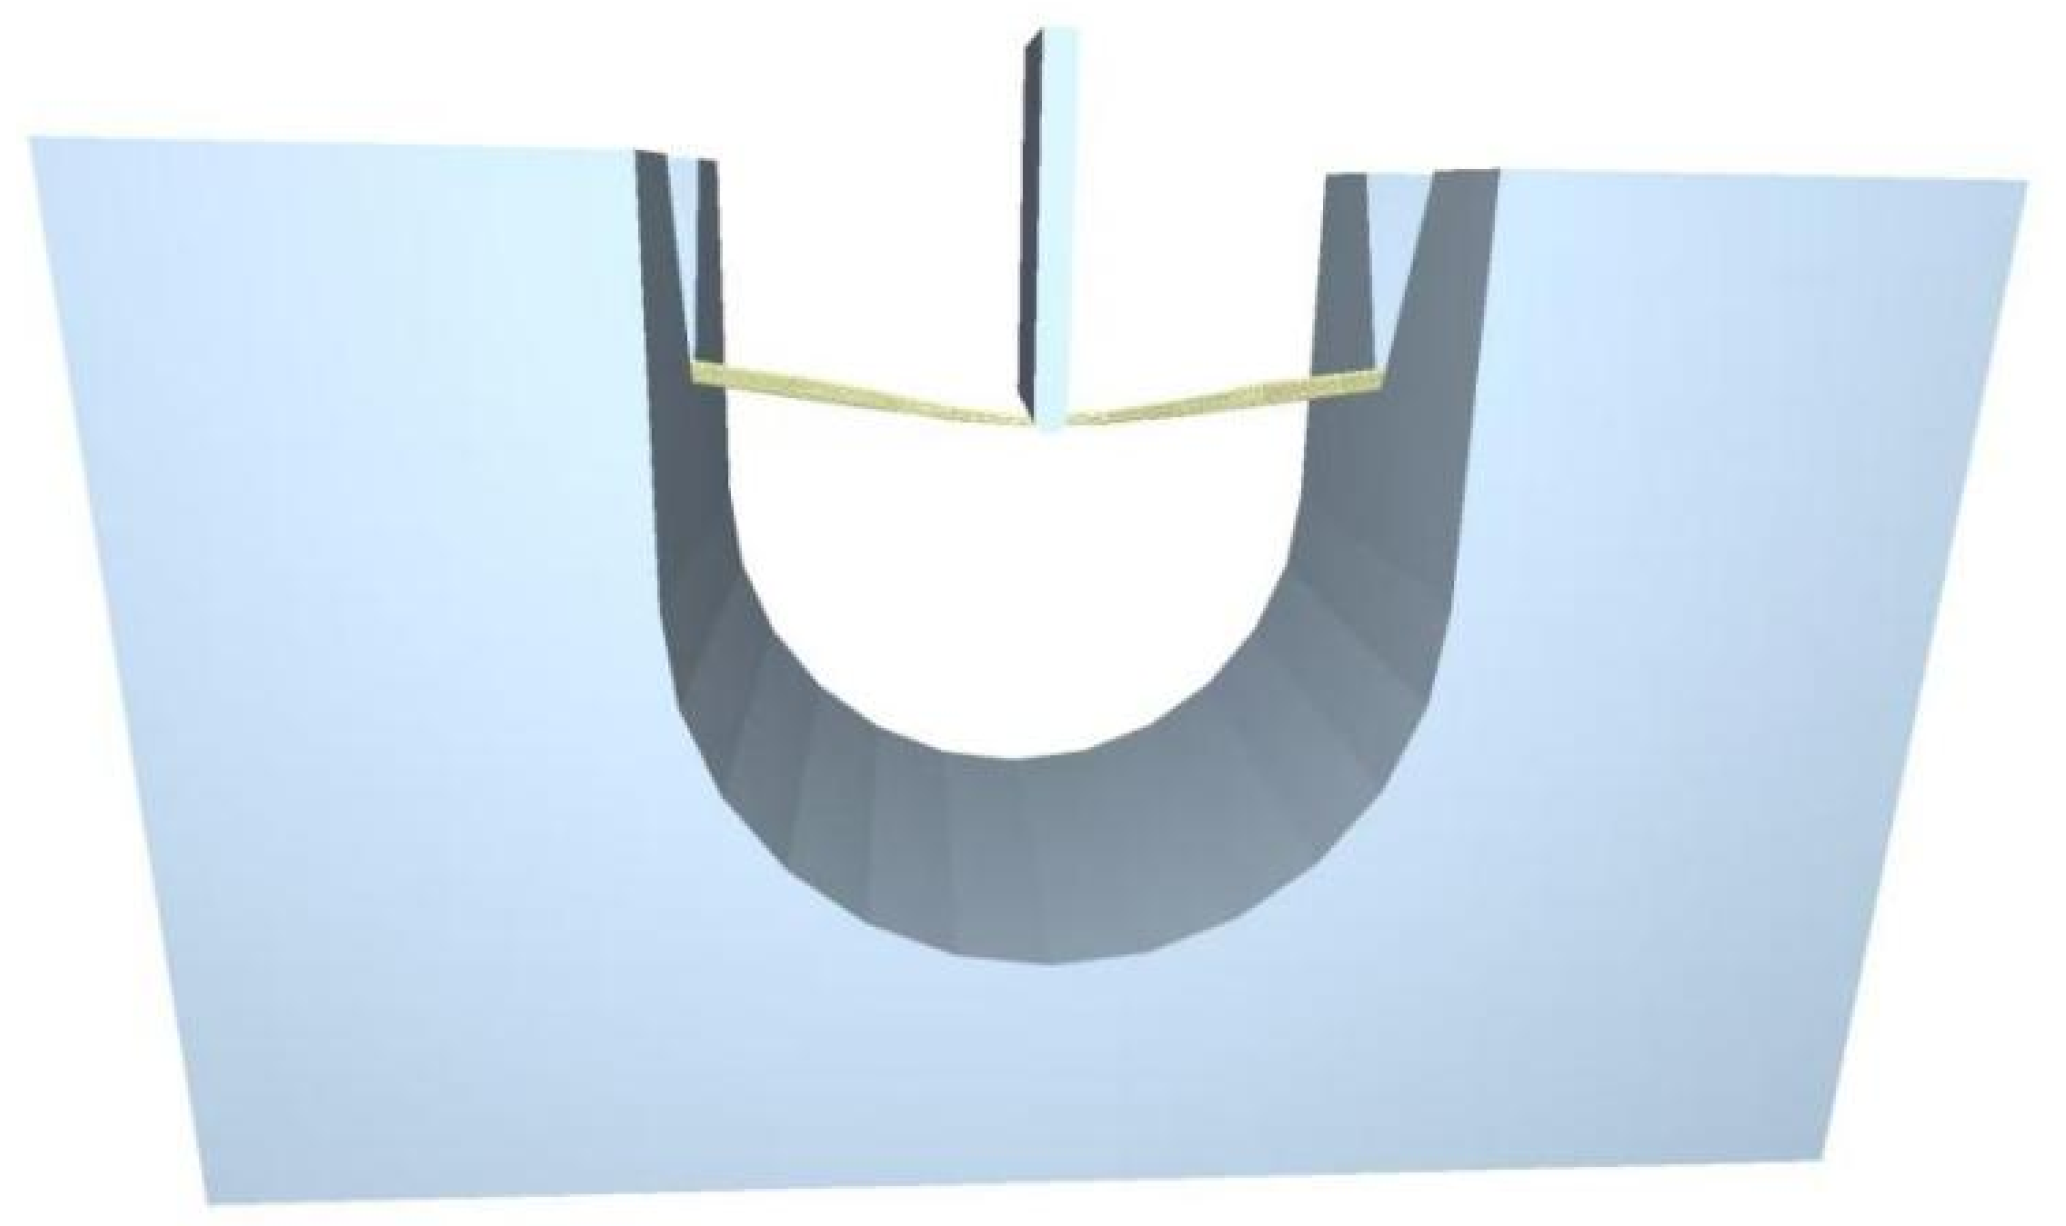
Agriculture 15 01686 g016
Figure 17. Bending simulation test model.
Agriculture 15 01686 g017
Figure 18. Compression verification test of wheat straw group: (a) cubic cavity simulation model; (b) compression and bending posture of wheat straw.
Agriculture 15 01686 g018
Table 1. Geometric size characteristics of wheat straw.
ParameterMin ValueMax ValueAverageStandard Deviation
Outer diameter
D/mm
3.304.704.0450.2913
Wall thickness h/mm0.651.050.4160.0756
Table 2. The results of total length of 100 g wheat straw.
Test NumberLength of 100 g Wheat Straw/m
1102.650
2107.690
3100.740
4104.033
5108.258
Average104.674
Table 3. Measurement result of the AOR.
IndexTest Number
12345
AOR/°18.0518.2818.7018.3218.40
Average18.35°
Standard Deviation0.2
Table 4. Value of peak extrusion force.
Test NumberPeak/NTest NumberPeak/NTest NumberPeak/NTest NumberPeak/NTest NumberPeak/N
123.66220.58328.41421.55524.32
626.07720.45821.89928.341024.53
Average23.98 N
Table 5. Value of peak bending pressure.
Test NumberPeak/NTest NumberPeak/NTest NumberPeak/NTest NumberPeak/NTest NumberPeak/N
13.2424.4634.7843.3653.04
64.1273.9283.7693.08104.08
Average3.784 N
Table 6. Simulation parameter setting of AOR.
ParametersValues
Density of wheat straw ρ1/(kg·m−3)300
Density of steel ρ2/(kg·m−3)7850
Poisson’s ratio of wheat straw µ10.30
Poisson’s ratio of steel µ20.30
Shear modulus of wheat straw G1/Pa4,000,000
Shear modulus of steel G1/Pa4,000,000
Straw-steel static friction A0.13~0.53
Straw-steel rolling friction B0.043~0.143
Straw-steel restitution coefficient C0.382~0.582
Straw-straw static friction D0.15~0.55
Straw-straw rolling friction E0.060~0.160
Straw-straw restitution coefficient F0.379~0.579
Table 7. The levels and codes of Plackett–Burman test.
FactorsLevels
−101
A0.130.330.53
B0.0430.0930.143
C0.3820.4820.582
D0.150.350.55
E0.0600.1100.160
F0.3790.4790.579
Table 8. Plackett–Burman experimental design and results.
Test NumberTest FactorsY/°
ABCDEF
1−111−1119.50
21−1−1−11−119.25
3−1−1−11−1118.25
4−1111−1−119.00
5111−1−1−117.50
611−1−1−1117.50
71−111−1129.00
8−1−1−1−1−1−19.75
9−1−11−11110.00
10−11−111−123.75
1111−111132.75
121−1111−130.75
Table 9. Significance analysis of test parameters.
ParametersDOFSum of SquaresF-Valuep-Value
Model6116.1974.96<0.0001 **
A1266.02171.63<0.0001 **
B10.75000.48390.5177
C12.521.630.2582
D1408.33263.44<0.0001 **
E118.7512.100.0177 *
F10.75000.48390.5177
Note: R2 = 98.90%, Adj R2 = 97.58%; ** means this item is highly significant (p < 0.01), * means this item is significant (p < 0.05), the same as below.
Table 10. The levels and codes of BBD test parameters.
ParametersLevels
−101
A0.180.280.38
D0.200.300.40
E0.0600.1100.160
Table 11. Results of AOR in BBD test.
Test NumberTest FactorsY2
ADE
10.180.30.1420.100
20.280.40.0829.450
30.280.20.1417.250
40.280.30.1123.490
50.280.30.1121.825
60.280.40.1426.025
70.380.20.1120.500
80.180.20.1114.900
90.280.30.1123.500
100.380.40.1126.800
110.280.30.1122.300
120.280.20.0816.875
130.180.30.0819.825
140.380.30.1423.800
150.280.30.1122.450
160.380.30.0822.500
170.180.40.1126.425
Table 12. Analysis of variance of BBD-RSM optimization tests for AOR.
Source of VariationDOFMean SquareF-Valuep-Value
Model370.3945.04<0.0001 **
A119.0712.20.004 **
D1191.84122.76<0.0001 **
E10.2720.1740.6834
Residual131.56
Lack-of-fit92.013.570.1166
Pure error40.5628
Cor total16
Note: R2 = 91.22%, Adj R2 = 89.20%; ** means this item is highly significant (p < 0.01).
Table 13. Simulation parameter setting of extrusion test for wheat straw.
ParametersValues
A0.271
B0.093
C0.482
D0.227
E0.136
F0.479
contact radius/mm0.260
Bonding V2-B1The normal stiffness per unit area H2/(N/m3)3.0 × 1011~5.0 × 10¹¹
The shear stiffness per unit area I2/(N/m3)1.1 × 1013~2.1 × 10¹³
The normal strength J2/Pa6.0 × 1010~1.2 × 10¹¹
The shear strength K2/Pa1.6 × 1012~2.8 × 10¹²
Bonded Disk Scale3
Bonding V2-B2The normal stiffness per unit area H3/(N/m3)1.0 × 1012
The shear stiffness per unit area I3/(N/m3)7.5 × 1011
The normal strength J3/Pa9.0 × 109
The shear strength K3/Pa1.2 × 109
Bonded Disk Scale1
Table 14. The levels and codes of BBD test parameters for Bonding V2-B1 model.
Parameters of Bonding V2-B1Levels
−101
H23.0 × 10114.0 × 10115.0 × 1011
I21.1 × 10131.6 × 10132.1 × 1013
J26.0 × 10109.0 × 10101.2 × 1011
K21.6 × 10122.2 × 10122.8 × 1012
Table 15. Design and results of BBD extrusion test.
Test NumberTest FactorsY4/N
H2I2J2K2
15.00 × 10111.60 × 10136.00 × 10102.20 × 101225.00
23.00 × 10111.60 × 10131.20 × 10112.20 × 101226.25
34.00 × 10112.10 × 10139.00 × 10101.60 × 101232.70
44.00 × 10111.60 × 10136.00 × 10101.60 × 101223.00
55.00 × 10112.10 × 10139.00 × 10102.20 × 101229.75
65.00 × 10111.60 × 10139.00 × 10102.80 × 101227.35
75.00 × 10111.60 × 10131.20 × 10112.20 × 101225.50
84.00 × 10111.60 × 10131.20 × 10111.60 × 101226.45
93.00 × 10112.10 × 10139.00 × 10102.20 × 101231.00
105.00 × 10111.10 × 10139.00 × 10102.20 × 101220.43
114.00 × 10111.60 × 10139.00 × 10102.20 × 101225.15
124.00 × 10111.60 × 10136.00 × 10102.80 × 101222.55
134.00 × 10111.60 × 10131.20 × 10112.80 × 101225.40
144.00 × 10111.10 × 10131.20 × 10112.20 × 101220.20
154.00 × 10111.10 × 10139.00 × 10102.80 × 101221.10
164.00 × 10112.10 × 10139.00 × 10102.80 × 101233.95
174.00 × 10111.10 × 10139.00 × 10101.60 × 101221.00
184.00 × 10111.60 × 10139.00 × 10102.20 × 101223.70
193.00 × 10111.60 × 10139.00 × 10101.60 × 101226.95
203.00 × 10111.60 × 10139.00 × 10102.80 × 101225.95
214.00 × 10111.60 × 10139.00 × 10102.20 × 101225.05
224.00 × 10112.10 × 10136.00 × 10102.20 × 101230.35
233.00 × 10111.10 × 10139.00 × 10102.20 × 101218.29
243.00 × 10111.60 × 10136.00 × 10102.20 × 101224.40
254.00 × 10111.10 × 10136.00 × 10102.20 × 101220.25
264.00 × 10111.60 × 10139.00 × 10102.20 × 101225.10
274.00 × 10111.60 × 10139.00 × 10102.20 × 101224.30
285.00 × 10111.60 × 10139.00 × 10101.60 × 101225.80
294.00 × 10112.10 × 10131.20 × 10112.20 × 101231.10
Table 16. Analysis of variance of BBD-RSM extrusion tests.
Source of VariationDOFMean SquareF-Valuep-Value
Model496.9957.88<0.0001 **
H210.08170.04870.8271
I21380.59227.13<0.0001 **
J217.294.350.0479 *
K210.01330.0080.9297
Residual241.68
Lack-of-fit201.934.710.0714
Pure error40.4093
Cor total28
Note: R2 = 90.61%, Adj R2 = 89.04%; * means this item is significant (p < 0.05); ** means this item is highly significant (p < 0.01).
Table 17. Simulation parameter setting of bending test.
ParametersValues
Bonding V2-B1The normal stiffness per unit area H2/(N/m3)4.00 × 1011
The shear stiffness per unit area I2/(N/m3)1.53 × 1013
The normal strength J2/Pa6.27 × 1010
The shear strength K2/Pa2.20 × 1012
Bonding V2-B2The normal stiffness per unit area H3/(N/m3)5.0 × 1011~1.5 × 10¹²
The shear stiffness per unit area I3/(N/m3)5.0 × 1011~1.0 × 10¹²
The normal strength J3/Pa6.0 × 109~1.2 × 10¹⁰
The shear strength K3/Pa8.0 × 108~1.6 × 10⁹
Table 18. The levels and codes of BBD test parameters for Bonding V2-B2 model.
Parameters of Bonding V2-B2 ModelLevels
−101
H35.0 × 10111.0 × 10121.5 × 1012
I35.0 × 10117.5 × 10111.0 × 1012
J36.0 × 1099.0 × 1091.2 × 1010
K38.0 × 1081.2 × 1091.6 × 109
Table 19. Design and results of BBD-RSM bending tests.
Test NumberTest FactorsY5/N
H3I3J3K3
11.00 × 10127.50 × 10111.20 × 10108.00 × 1083.63
21.50 × 10121.00 × 10129.00 × 1091.20 × 1094.08
31.00 × 10125.00 × 10116.00 × 1091.20 × 1093.34
41.00 × 10121.00 × 10121.20 × 10101.20 × 1093.50
51.50 × 10127.50 × 10119.00 × 1098.00 × 1084.09
61.00 × 10127.50 × 10119.00 × 1091.20 × 1093.50
71.00 × 10127.50 × 10119.00 × 1091.20 × 1093.50
81.50 × 10127.50 × 10111.20 × 10101.20 × 1094.80
91.50 × 10127.50 × 10119.00 × 1091.60 × 1094.19
101.50 × 10125.00 × 10119.00 × 1091.20 × 1094.36
111.00 × 10125.00 × 10119.00 × 1091.60 × 1093.59
121.00 × 10121.00 × 10129.00 × 1098.00 × 1083.36
131.00 × 10127.50 × 10119.00 × 1091.20 × 1093.49
145.00 × 10117.50 × 10119.00 × 1091.60 × 1092.53
155.00 × 10111.00 × 10129.00 × 1091.20 × 1092.97
161.00 × 10127.50 × 10116.00 × 1091.60 × 1093.57
171.00 × 10127.50 × 10119.00 × 1091.20 × 1093.51
181.00 × 10125.00 × 10111.20 × 10101.20 × 1093.90
191.00 × 10125.00 × 10119.00 × 1098.00 × 1083.24
201.00 × 10121.00 × 10126.00 × 1091.20 × 1093.47
211.00 × 10121.00 × 10129.00 × 1091.60 × 1093.42
221.00 × 10127.50 × 10111.20 × 10101.60 × 1093.66
235.00 × 10117.50 × 10119.00 × 1098.00 × 1082.78
241.00 × 10127.50 × 10116.00 × 1098.00 × 1083.75
255.00 × 10115.00 × 10119.00 × 1091.20 × 1092.67
261.00 × 10127.50 × 10119.00 × 1091.20 × 1093.33
271.50 × 10127.50 × 10116.00 × 1091.20 × 1094.10
285.00 × 10117.50 × 10116.00 × 1091.20 × 1092.72
295.00 × 10117.50 × 10111.20 × 10101.20 × 1092.76
Table 20. Analysis of variance of BBD-RSM bending tests.
Source of VariationDOFMean SquareF-Valuep-Value
Model140.548827.78<0.0001 **
H317.04356.23<0.0001 **
I310.00750.37960.5477
J310.14087.130.0183 *
K310.0010.0510.8245
H3I310.08414.260.0582
H3J310.10895.510.0341 *
H3K310.03061.550.2336
I3J310.07023.550.0803
I3K310.0211.060.3198
J3K310.0110.5580.4674
H3210.00010.00350.9539
I3210.00160.07890.7829
J3210.14027.090.0185 *
K3210.00460.23490.6354
Residual140.0198
Lack-of-fit100.02534.340.0848
Pure error40.0058
Cor total28
Note: R2 = 96.52%, Adj R2 = 93.05%; * means this item is significant (p < 0.05); ** means this item is highly significant (p < 0.01).
Table 21. Determination results of verification test.
TimesTest Indexes
Peak Extrusion Force/NPeak Bending Pressure/N
122.704.31
223.403.95
323.503.50
Average23.203.92
Disclaimer/Publisher’s Note: The statements, opinions and data contained in all publications are solely those of the individual author(s) and contributor(s) and not of MDPI and/or the editor(s). MDPI and/or the editor(s) disclaim responsibility for any injury to people or property resulting from any ideas, methods, instructions or products referred to in the content.

