Article

Effect of Auxiliary Air-Suction Seed-Filling Structure on Seed Discharge Performance of Peanut High-Speed Seed-Metering Machine

1
College of Mechanical and Electronic Engineering, Shandong Agricultural University, Taian 271018, China
2
College of Mechanical and Electrical Engineering, Qingdao Agricultural University, Qingdao 266109, China
3
Yellow River Delta Intelligent Agricultural Machinery Equipment Industry Academy, Dongying 257300, China
4
Industrial Research Institute of Saline and Alkaline High-Efficiency Agricultural Technology, Qingdao Agricultural University, Dongying 257300, China
*
Authors to whom correspondence should be addressed.
Agriculture 2025, 15(15), 1678; https://doi.org/10.3390/agriculture15151678
Submission received: 5 July 2025 / Revised: 28 July 2025 / Accepted: 31 July 2025 / Published: 2 August 2025
(This article belongs to the Section Agricultural Technology)

Abstract

Aiming to resolve the problem of the poor peanut seed-filling effect under high-speed operation when developing high-speed peanut sowing with precision, a peanut precision seed-metering machine with an auxiliary air-suction seed-filling device was designed. Focusing on the force analysis of peanuts in the seed chamber, the peanut seed disturbance principle in the seed-metering machine for the blowing structure of an auxiliary air-suction seed-filling device was clarified. The seed-filling process was analyzed via DEM-CFD coupled simulation, and three factors affecting the seed-filling effect were identified, namely the seed-filling chamber ‘V’ angle γ, the bottom blow-air-hole cross-sectional area S, and the bottom blow-air-hole airflow velocity vq, and the ranges of values of the three factors were determined. The Box–Behnken test was conducted using the seed-filling index and leakage index as the indexes. The results show that the seed-filling chamber ‘V’ angle γ is 56.59°, the bottom blowhole cross-sectional area S is 1088.4 mm2, and the blowhole air velocity vq is 12.11 m·s−1. At this point, the peanut seed suction qualification index and leakage index are optimal, the seed suction qualification index is 96.33%, and the seed leakage index is 2.59%. At the same time, the field test shows that a sowing operation speed of 8–12 km·h−1, a qualified index > 93%, and a leakage index < 4.5% are required to meet the agronomic requirements of peanut precision sowing.

1. Introduction

Peanut is a high-quality oilseed crop with a global planting area of about 69 million acres in 2022, including 9.6 million acres (or 14%) in China [1,2]. Notably, in 2021, worldwide peanut production reached 53.6 million tons, with over one-third, or 18.4 million tons, produced in China, mostly in Henan, Jiangsu, Guangdong, and Shandong provinces [3]. In 2024, peanut production in China faced successful domestic harvests but slower local demand, with slightly declining trends in US, Canada, and Brazil accompanied by regional setback in Argentina, where 70% of the peanut crop was dug up but only 15% harvested due to low sowing mechanization or large differences in cropping patterns. With the continuous improvements in the living standards of residents, the demand for peanut rice, peanut oil, and additional products is increasing, so the demand for peanut planting areas and production is increasing year by year. This proves that the mechanized high-speed sowing of peanuts is essential in the peanut production industry.
Pneumatic-assisted precision seed-metering machines provide high-speed seed-discharging operations, essentially improving the quality and speed of seed sowing [4,5,6,7]. Given the low requirements for seed shape, minor damage to seeds, and stable performance, it is widely used in high-speed seed-discharging operations for seeds [8,9,10]. The pneumatic-assisted precision seed-metering machine mainly adsorbs seeds with the help of the pressure difference between the inlet and outlet of the suction hole of the seed-discharging disk, which is susceptible to poor air pressure uniformity, low seed mobility, and other factors during high-speed sowing, resulting in seed leakage [11]. Therefore, many researchers have tried to optimize the shape of the air chamber and seed suction holes of the discharging disk, as well as the filling, clearing, and seed-discharging structure [12,13,14,15,16].
Seeds in the pneumatic-assisted precision seed-metering machine seed chamber are adsorbed by the seed suction holes, making contact with each other and moving in the airflow under complex and variable conditions difficult to describe quantitatively [17]. In this respect, the coupled discrete element method and computational fluid dynamics (DEM-CFD) are both quite instrumental. The coupled DEM-CFD simulation of the gas–solid two-phase flow has been widely used in agricultural research because of its remarkable characteristics for analyzing the motion and force processes of materials, and it can more intuitively and effectively analyze the motion of materials in complex and changing environments [18,19,20,21]. Huang et al. used DEM-CFD to study particle erosion phenomena in 90° pneumatic conveying pipes [22]. Its application to the research and design of pneumatic-assisted precision seed-metering machines has proved its high efficiency and convenience [23,24]. In particular, Xiao et al. used DEM-CFD coupling to analyze the seed movement characteristics in three types of seed tubes, providing design references for the study of conveying tubes [25]. Guzman et al. conducted CFD-DEM coupling simulations on the curved structures of seed conveying tubes to analyze the impact of curved structures on seed discharge performance [26]. Lei et al. numerically investigated the gas–solid flow field in a pneumatic-assisted precision seed-metering machine using coupled DEM-CFD to analyze the effects of the throat area, throat length, and other structures on the gas–solid flow field and particle motion [27]. Xu et al. simulated the gas–solid two-phase flow working process of the pneumatic-assisted precision seed-metering machine and applied DEM-CFD to study the influencing factors of quantitative seeding [28]. Gao et al. analyzed the effects of the seed-feeding volume and blowing pressure on seed supply uniformity [29], while Wang et al. investigated the seed-filling layer height’s effect on the seed-filling efficiency using coupled DEM-CFD to optimize the structure [30]. Ding et al. utilized the gas–solid two-phase flow coupling method to analyze the adsorption pressure of seeds at various stages in the pneumatic-assisted precision seed-metering machine to verify the feasibility and rationality of the parameter model [31]. Shi et al. utilized DEM-CFD to study the seed removal resistance, void ratio, and time and determined the various stages of the seed-filling performance evaluation indices [32]. Han et al. explored the effects of the side holes’ positions, widths, and average arc lengths using coupled DEM-CFD and clarified the primary and secondary factors and evaluation parameters affecting the seed-discharging performance [33].
The above research is highly significant for developing pneumatic-assisted precision seed-metering machines. However, due to the large size of peanut seeds (three-axis dimensions of 16 × 10 × 8.5 mm), which are significantly larger than those of wheat, rice, corn, and soybeans, their high weight, large three-axis particle size, irregular shape, and poor flowability make them difficult to be adsorbed, resulting in severe skipping during seeding. This study aimed to improve the seed-filling performance of peanut seeds in the pneumatic-assisted precision seed-metering machine. To this end, an auxiliary air-suction seed-filling device (AASD) was designed and optimized for the peanut pneumatic-assisted precision seed-metering machine based on the inherent material characteristics of peanut seeds.
To optimize the pneumatic-assisted precision seed-metering machine structure, a multiphase DEM-CFD coupled flow model was used in this study. It analyzed the forces and motion paths of peanut seeds to optimize the structural parameters of a pneumatic-assisted precision seed-metering machine, improve the mobility of the peanut seed population, and enhance seed-filling performance under high-speed operating conditions. By comparing simulation and experimental data, the feasibility and effectiveness of the proposed DEM-CFD coupled simulation of a pneumatic-assisted precision seed-metering machine were verified.

2. Materials and Methods

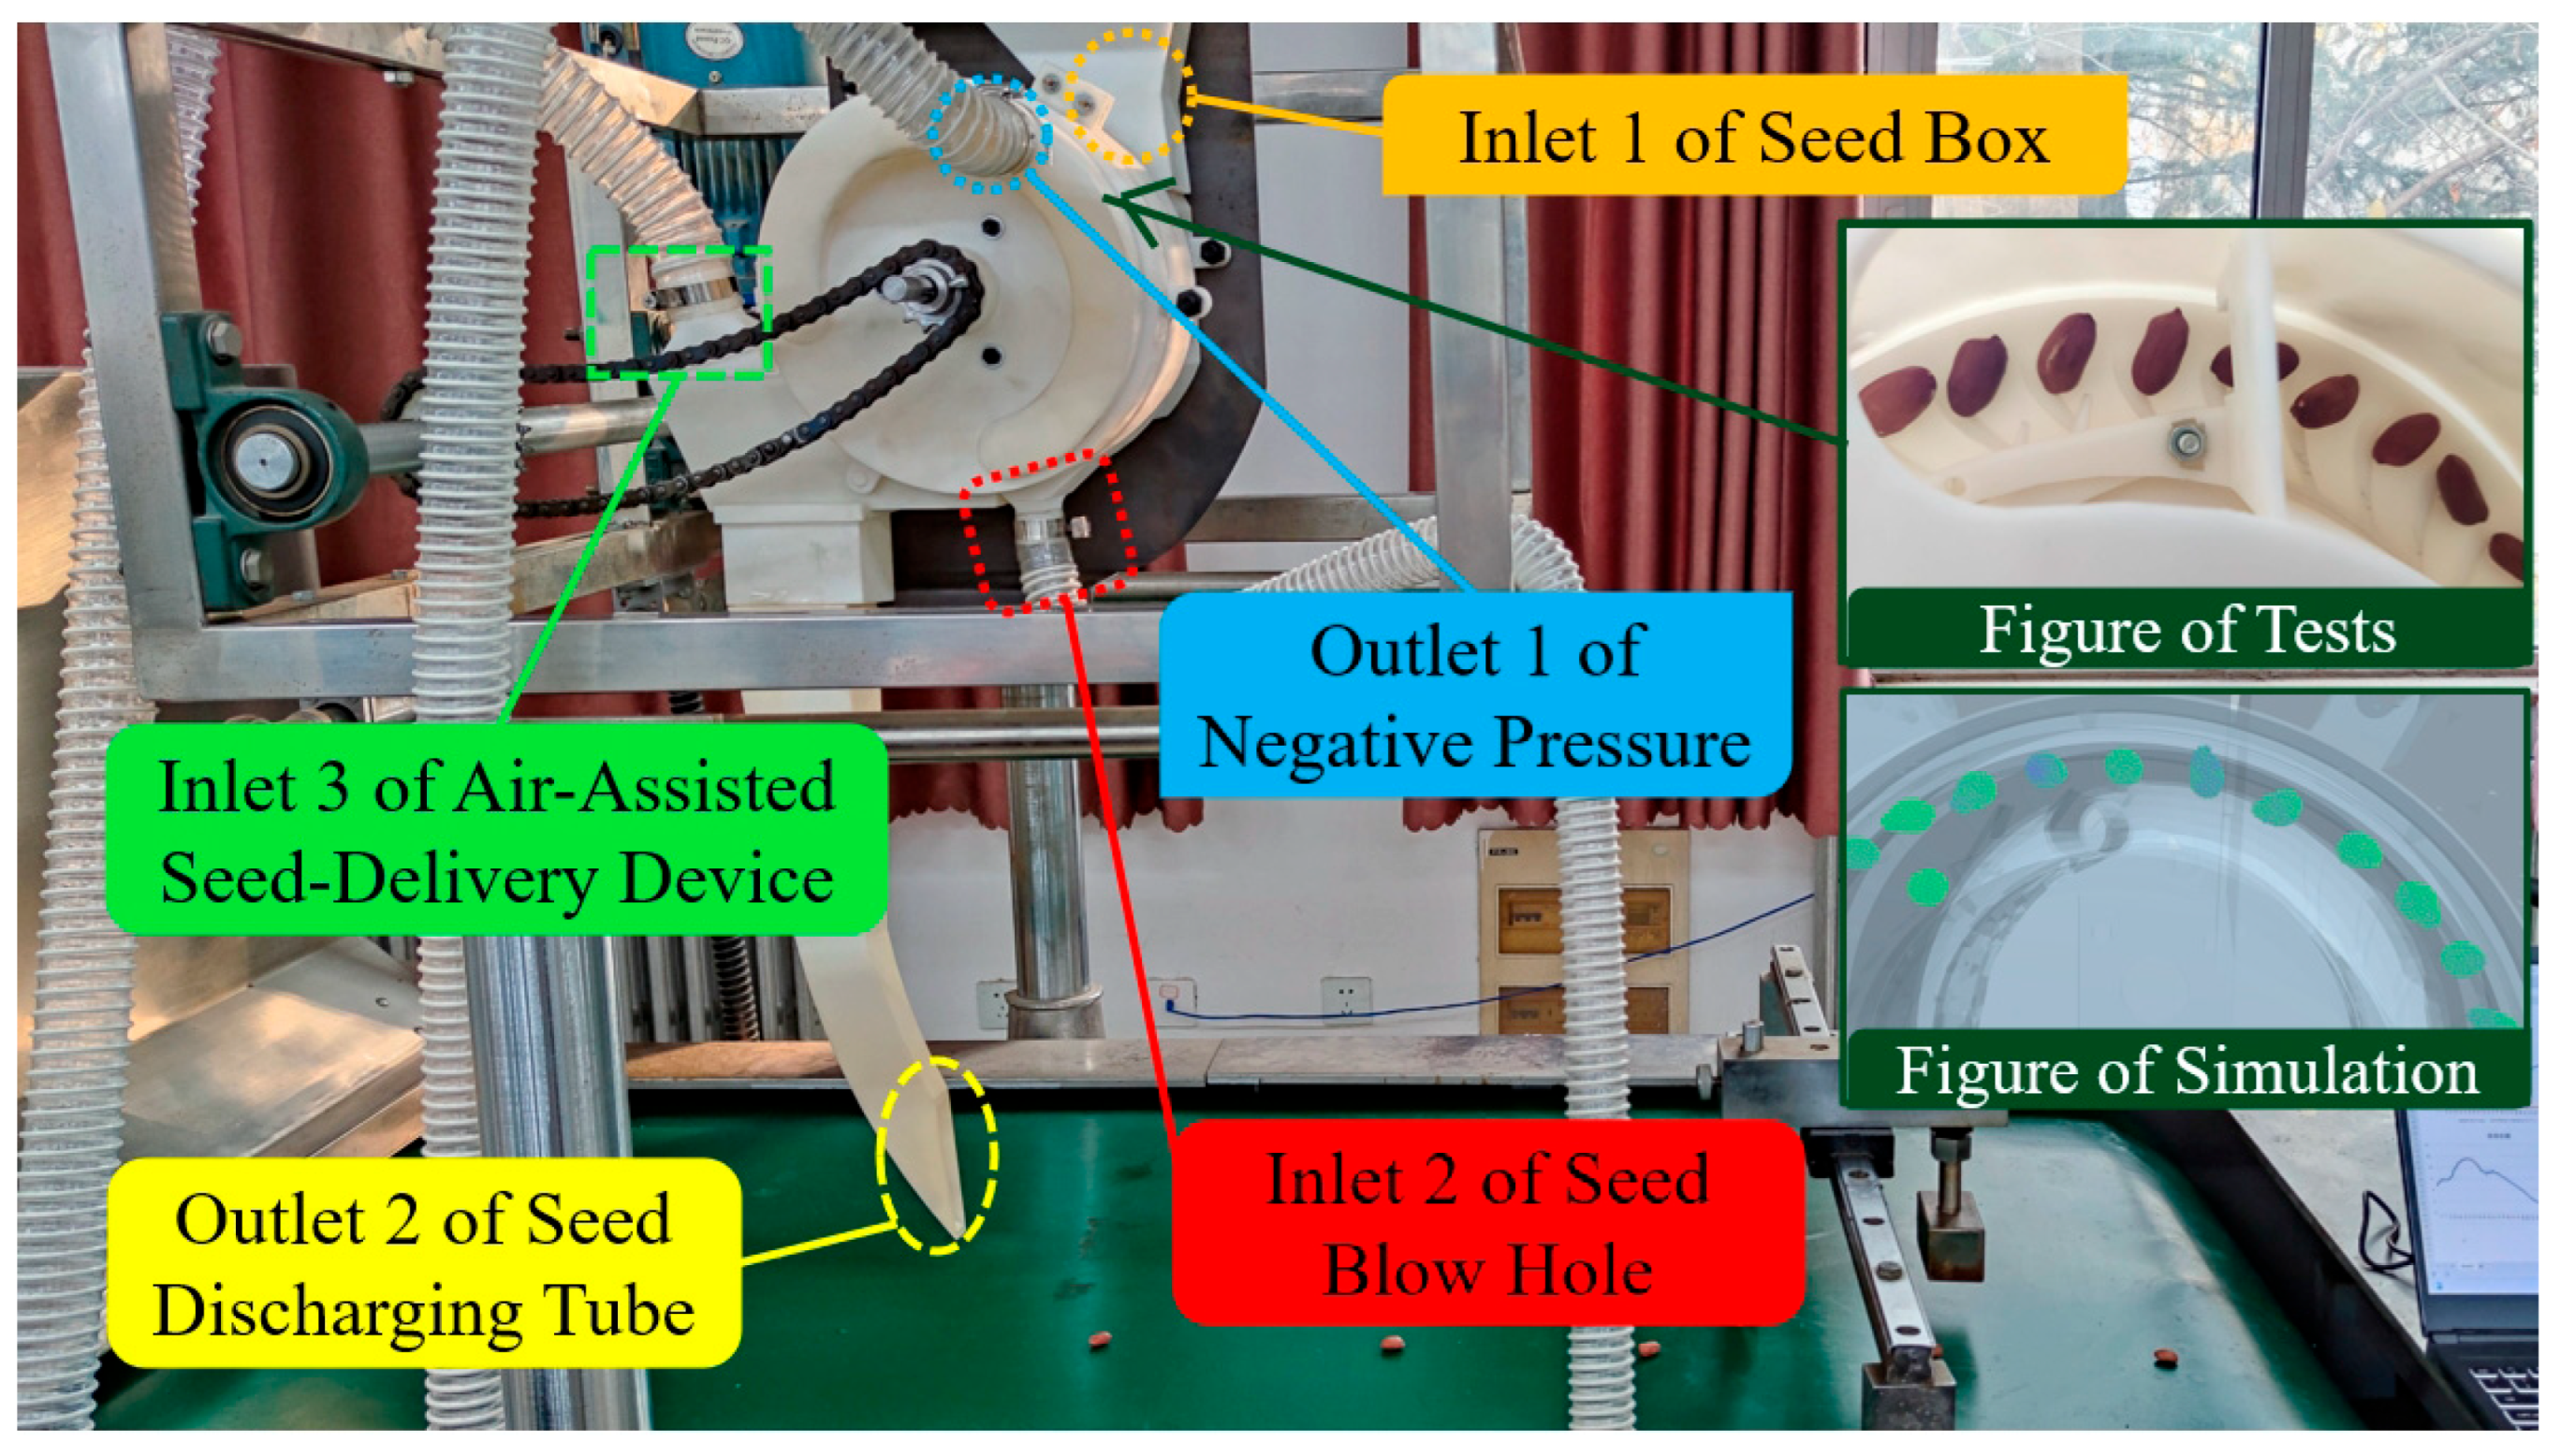
2.1. Structure and Principle of the Seed-Metering Device

The pneumatic peanut precision seed-discharging device consisted of a motor; a seed-discharging left casing; an air leakage-retaining ring; a seed-discharging disk; a drive shaft; a seed-discharging tube; a seed-cleaning device; a tile cover; a seed chamber for the right casing of the seed-discharging device; a seed-discharging tube over the casing and so on, in which the right casing of the seed-discharging device had a seed-entry opening on the right upper side of the right casing; a seed-storage box with a seed-storing plate on the outer side; a seed-clearing scraping board with an inner side and a flexible seed-clearing machine fixed on the upper side of the passenger body; and a pneumatic auxiliary air-suction seed-filling device on the lower side of the casing The seed-discharging disk was provided with seed suction holes and a seed-stirring groove, as shown in Figure 1a, which could effectively adsorb the seeds.
Peanut seeds fell into the seed-metering machine seed chamber from the seed inlet on the upper right side of the seed chamber of the right housing of the seed-discharging machine. They were subjected to the role of the auxiliary blowing device on the lower side of the seed chamber of the right housing of the seed-discharging machine for pneumatically disturbing the seeds, and the seed guided the grooves of the seed-discharging disk in churning it in motion, which ensured the fluidity of the peanut seed population. At the same time, the seed-discharging disk adsorbed peanut seeds by utilizing the pressure difference generated by the fan at the seed suction holes to complete the peanut seed-disturbing seed-filling process. At this time, the seed-discharging disk rotated at a uniform speed driven by the motor; carried the adsorbed peanut seeds in a circular motion; carried the peanut seeds from the seed-discharging disk of the seed-discharging machine to seed-filling area I and seed-clearing area II, as shown in Figure 1b; and cleared off the excess peanut seeds under the effect of the up and down bi-directional perturbing seed-cleaning device in the seed-clearing area. Moreover, the cleared-off peanut seeds were returned to the seed-filling area via the effect of gravity to ensure that every seed suction hole retained single peanut seeds and continued to rotate with the seed-discharging disk through seed-carrying area III into the seed-feeding area IV; at this time, the seed-discharging disk of the seed suction holes retained ring blocking via wind leakage, the suction pressure disappeared, the peanut seeds lost adsorption, and gravity and airflow caused the seeds to fall into the seed-discharging tube and then the seed trench.

2.2. DEM-CFD Coupling Model

2.2.1. Gas Governing Equation

To further study the performance of the pneumatic seed-filling device and the kinematic characteristics of peanut seeds, the seed suction process was simulated and analyzed using a coupled DEM-CFD method [34,35]. In this study, the simplified Navier–Stokes equation obtained was used to solve the gas phase, which followed the laws of continuity, conservation of momentum, and conservation of mass. The seed-metering machine materials used in this study were photosensitive resin and aluminum alloy material, and the porosity was not considered; at the same time, the temperature difference in the seed-filling device was not significant, and the temperature equations were not taken into account, so the gas control equations were as follows [36,37]:
t α f p ρ g a + · α f p ρ g a u g a = 0
t α f p ρ g a + · α f p ρ g a u g a = α f p P + · α f p τ F G S + α f p ρ g a g
where αfp is the volume fraction of the fluid phase in the grid; ρga is the gas density, kg·m−3; uga is the gas velocity, m·s−1; P is the static pressure, Pa; FGS is the interaction force between the gas and the particles, kg·m−2·s−2; τ is the viscous stress tensor, Pa; and g is the gravitational acceleration, m·s−2.
The turbulent motion of the fluid phase was solved for the flow field using the standard k-ε turbulence model with the following turbulence model equations [20]:
t α f p ρ g a k + · α f p ρ g a u g a k = · α f p μ + μ t σ k · k + α f p G k α f p ρ g a ε + F k
t α f p ρ g a ε + · α f p ρ g a u g a ε = · α f p μ + μ t σ ε · ε + α f p ε k C 1 ε G k α f p ε k C 2 ε ρ g a ε + F ε
where k is the turbulent kinetic energy, J; ε is the turbulent dissipation rate; t is the time, s; μ is the dynamical viscosity, Pa·s; μt is the turbulent viscosity coefficient; σk is the Planck number of the turbulent kinetic energy k, σk = 1.0; Fk is the turbulent kinetic energy generation term and Gk is the turbulent kinetic energy generated using the mean velocity gradient; σε is the Planck number of the turbulent dissipation rate ε, σε = 1.3; C1ε and C2ε are the empirical constants C1ε = 1.44 and C2ε = 1.92; and Fε is the customized source term.

2.2.2. Particle Governing Equation

In this study, white sand peanut seeds were used as the research object, and the seed particles were modeled using the bonded particle method (BPM). The discrete element method was used to describe the motion process of the particles, which was controlled by Newton’s second law of motion using the following equations of motion:
m i d u p a , i d t = n i j = 1 F n , i j + F t , i j + F D , i + m i g
I i d w p a , i d t = n i j = 1 T t , i j + T r , i j + T w p , i
where mi is the mass of the particle, kg; upa,i is the velocity of particle i, m·s−1; Fn,ij is the normal force on particle i by particle j, N; Ft,ij is the tangential force on particle i by particle j, N; FD,i is the trailing force on seed particle i by the fluid, N; Fwp,i is the contact force between the wall and the particle, N; Ii is the moment of inertia of the rotation of particle i, kg· m−2; wpa,i is the rotational velocity of the particle, rad·s−1; Tt,ij is the torque on the particle in the tangential direction, N·m; Tr,ij is the torque on the rolling friction, N·m; and Twp,i is the torque between the wall and particle i, N·m.
During the seed-metering machine filling process, the gas and the seed produced relative motion between the high-speed gas flow and the low-speed seed to exert a trailing force, which was transferred to the seed to realize seed movement, leaving the walls of the seed subject to the force shown in Figure 2, which was received in accordance with Equation (7) calculation as follows:
F F sin γ + F N + F D , i + F N S sin θ m i g sin γ f + F N S cos θ + F F cos γ = m i g cos γ f = μ F N
where FF is the buoyancy force applied to the seed by the air blowing process, N; FN is the support force applied to the seed by the inclined wall, N; γ is the angle between the inclined wall and the vertical direction, °; FNZ is the support force applied to the seed by the face of the other seeds, N; and θ is the angle between the direction of the support force applied to the seed by the other seeds and the inclined wall, °.
The buoyancy force on the seed during air blowing was calculated using Archimedes’ principle, shown as follows in Equation (8):
F F = 4 3 ρ g a g · π r 3 · C Z
where r is the radius of the particles that make up the seed, mm, while CZ is the coefficient of buoyancy to which the seed is subjected, which is a constant, CZ = 289.
The gas trailing force on the particles was related to the particle flow state and flow characteristics, as shown as follows in Equation (9):
F D , i = 3 π μ d p u g a v p a , Re p < 1 F D , i = 3 π μ d p u g a v p a · 1 + 0.15   Re p 0.687 , 1 < Re p < 1000 F D , i = 1 2 C D ρ g π d p 2 4 u g a v p a 2 , Re p > 1000 Re p = ρ g a d p u g a v p a u g a
where FD,i is the trailing force of the particles by the gas, N; dp is the particle diameter, mm; vpa is the particle velocity, m·s−1; Rep is the Reynolds number, which is a constant; and CD is the trailing coefficient.
In this paper, the seeds are disturbed by airflow at the bottom of the seed dispenser and in the seed dispensing area. Due to the high airflow velocity, at this point, 1000 < Rep ≤ 2 × 10⁵. CD ≈ 0.44. At the seed suction holes of the seed dispensing tray, the airflow velocity is low, 1 ≤ Rep ≤ 1000, so CD is 10/√Rep.

2.3. Simulation Model and Setting of Boundary Conditions

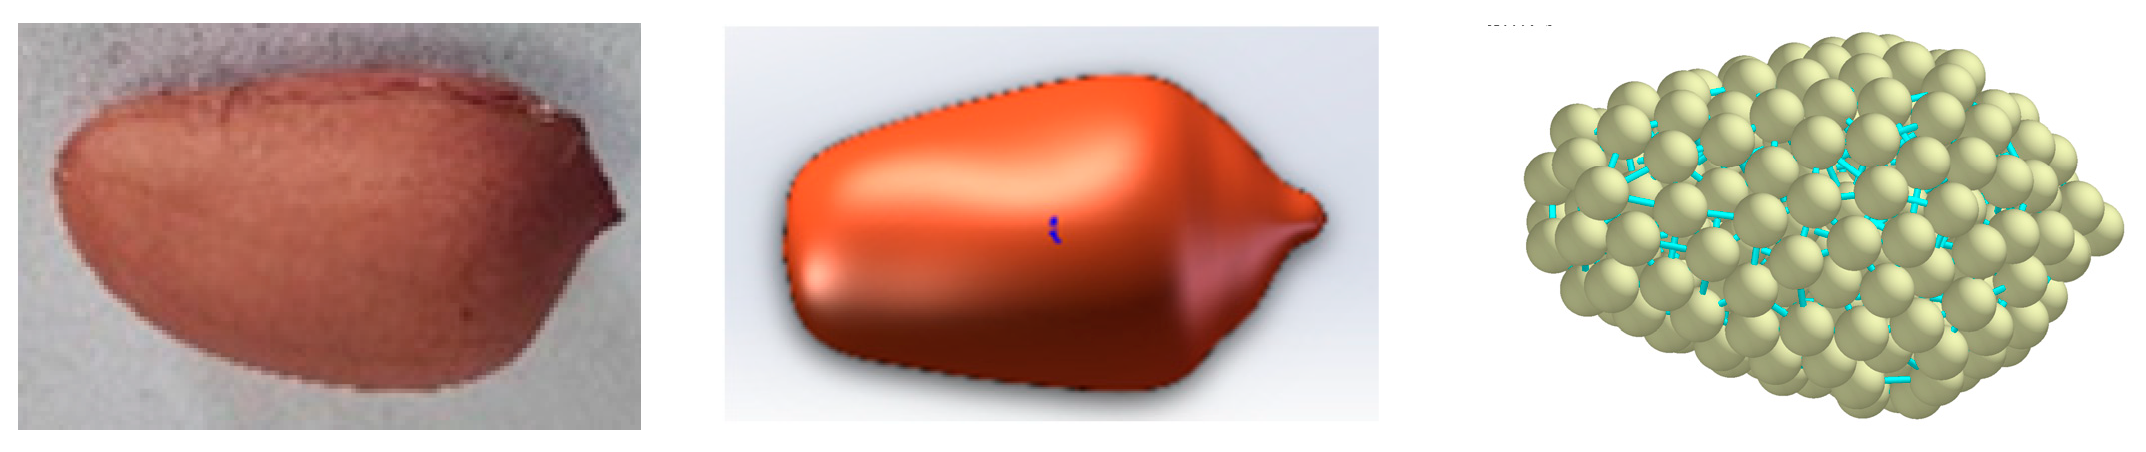
2.3.1. Particle Modeling

The DEM simulation of the seeds, mainly conducted through the multi-sphere method and bonding particle method for seed modeling, was used to create the three-dimensional model of spherical seed particles, using superimposed spherical particles to ensure that the shape of the seed model profile was the same as that of the seed profile, ensure the successful use of rice seed modeling and corn seed modeling, and analyze the shape of the seeds based on the irregularity of the shape considered in the analysis. The particle bonding method bonded smaller particles into a multi-particle bonded seed model with the same shape and contour as the seed model derived through the bonding bond, the Euler–Bernoulli theory was used to calculate the magnitude of the bonding force of the bonding method, and the bonded particle method was mainly used to simulate and analyze the deformation, fracture, and crushing of varied materials. For example, it has been successfully used to simulate and analyze various material shape changes during corn harvesting [38] and agglomerated particle crushing [39].
In this study, the Eulerian two-fluid coupling method was used for the DEM-CFD coupling of the peanut high-speed seed-discharging process, which required a particle mesh volume fraction of less than 70% [33]. Due to the large triaxial particle size of the Baisha peanut seeds, the seed particle model filled using the multi-sphere method was much larger than the grid size, which was not suitable for simulation and analysis, while the particle volume, after replacement by the bonded particle method, was smaller than the grid size, meeting the simulation requirements and ensuring that the simulation was more accurate. At the same time, the minimum grid volume after the flow field domain division was 2.9 mm3, and the fractional particle radius was 0.7 mm (V = 1.44 mm3). We used the BPM to form the peanut seed particle model, and to ensure that the bonding radius was larger than the particle radius, the peanut bonding particle radius was set to 0.84 mm, so the generated peanut seed particle model was suitable for studying the pneumatic-assisted precision seed-metering machine.
In this study, white sand peanut seeds, which are widely planted and have a high yield in China, were selected for the experiment, and their three-axis average size, thousand-grain weight, and water content measurements are shown in Table 1. A three-dimensional model of white sand seeds was constructed, and EDEM 2018 software (Engineering discrete element method, DEM Solution Ltd., Aylesbury, UK) was used to simulate the white sand peanut seed particle replacement model, as shown in Figure 3.

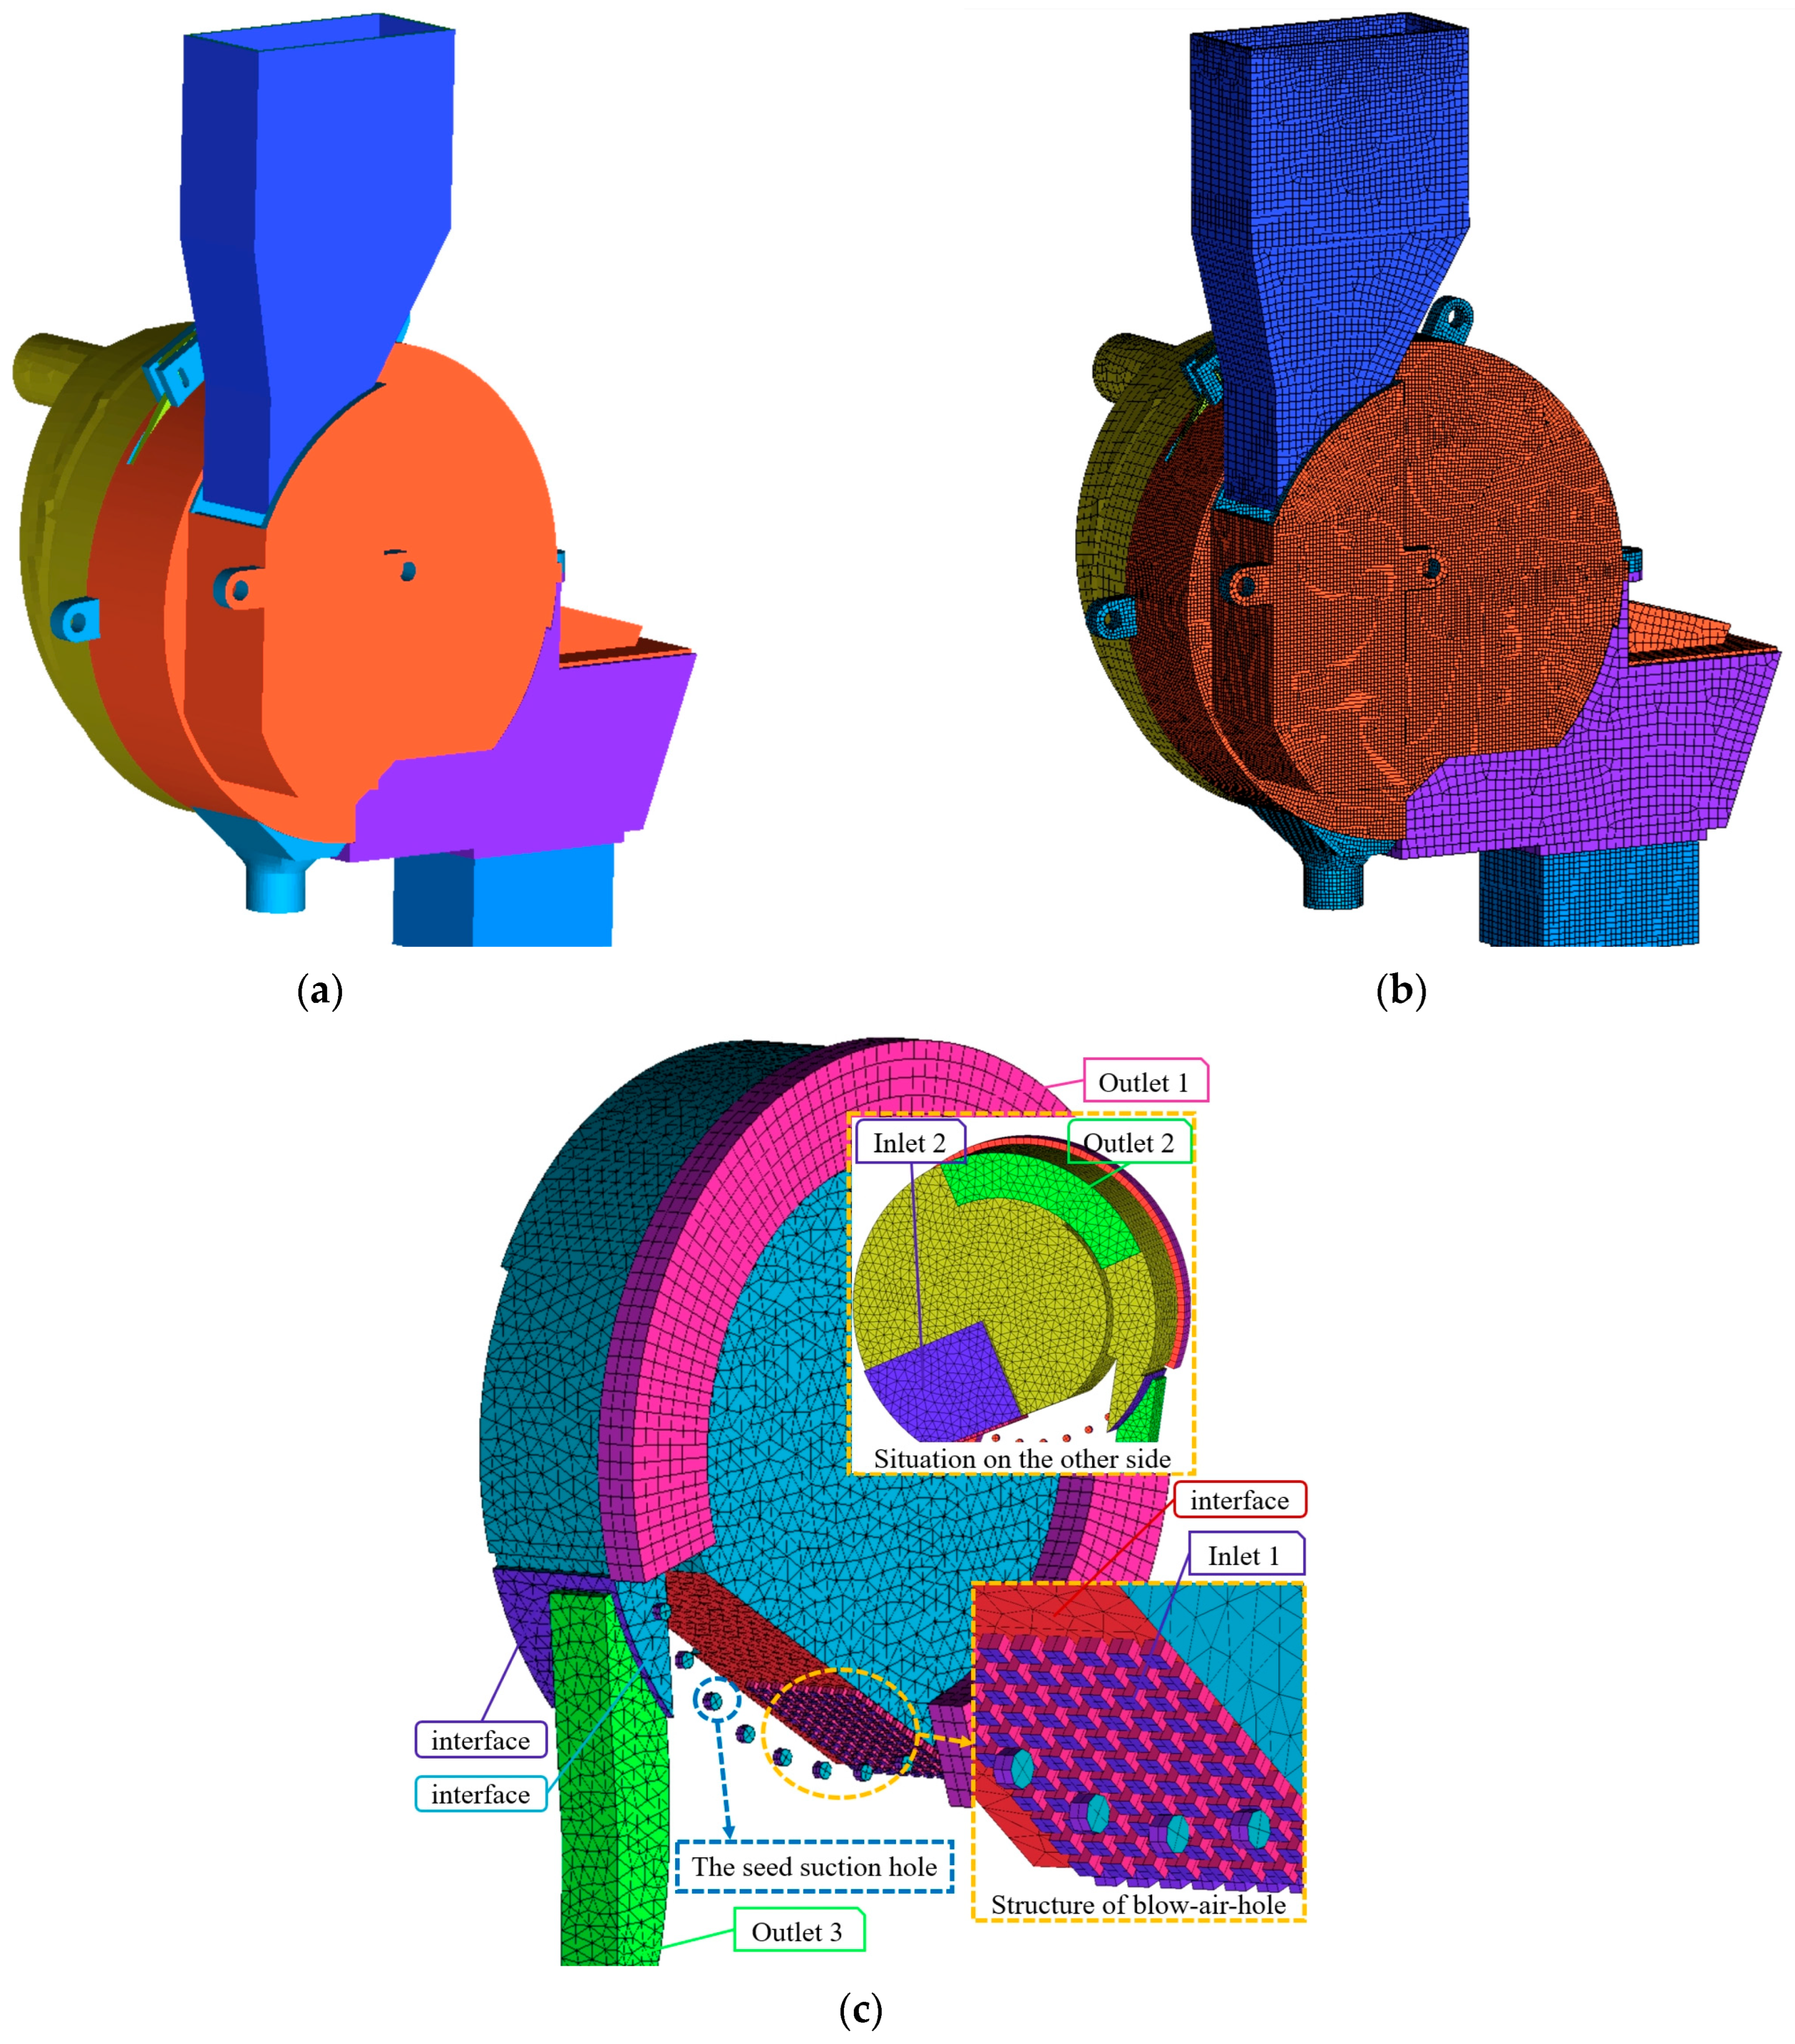
2.3.2. Geometry Modeling

Structural optimization of the air-suction peanut precision pneumatic-assisted precision seed-metering machine was carried out via ANSYS 2019, FLUENT, removing the motor drive and other parts that did not involve fluid motion; simplifying the parts of the pneumatic-assisted precision seed-metering machine’s left shell, air leakage baffle ring, seed expulsion disk, drive shaft, seed expulsion tube, seed cleaner, pneumatic-assisted precision seed-metering machine’s right shell seed chamber, and pneumatic-assisted precision seed-metering machine’s over-shell; and thus establishing a simplified model of the peanut pneumatic-assisted precision seed-metering machine simulation, as shown in Figure 4a. On this basis, a peanut high-speed seed displacer object and a fluid domain model were constructed, and the ICEM was utilized to perform face meshing on the seed displacer object, with 187,634 cell meshes, as shown in Figure 4b. When using the ICEM structural mesh to divide the flow field domain of the pneumatic-assisted precision seed-metering machine, the smaller the mesh division volume, the higher the number of meshes; the higher the simulation accuracy, the longer the time required for CFD simulation; and the larger the mesh division volume, the more difficult it is to ensure simulation accuracy, so the simulation requirements cannot be met. Thus, to ensure the success of the coupled EDM-CFD simulation and to maximize the simulation time, the fluid region of the pneumatic-assisted precision seed-metering machine was meshed in this study, and the minimum mesh volume after the division was 2.9 mm3 and 141,399 cell meshes were completed, as shown in Figure 4c.
This study imported the guest model in EDEM and set up large- and small-particle models called Whole and Fraction, respectively. Further, a virtual particle generator (Whole) was set up for generating large particles.

2.3.3. Calculation Conditions and Parameters

The EDEM simulation took more time as the number of particles under study increased. To improve the simulation efficiency, the total number of particles generated in the virtual particle generator in this simulation test was reduced to 100, meeting the minimum simulation requirements of gas-absorbing peanut suction seeding. The factory model generation file was set up in advance, setting the contact parameters between the particles in the physical field. At the same time, the particle-to-particle Hertz–Mindlin model with JKR particle contact was used, while the interaction between the airflow and peanut particles was defined as the Freestream equation resistance model. In FLUENT, the boundary conditions were set as the airflow velocity inlet and the airflow pressure outlet, the walls were formed of traditional aluminum alloy and plexiglass, and the motion of the gas phase was solved using the standard k-e two-equation turbulence model. The walls within the rotation zone rotated with the rotating fluid domain, and at the same time, we ensured that the rotational speed of the type holes in the fluid region in FLUENT had the same value and direction as those of the seed-discharging disk within EDEM.
DEM-CFD was simulated via the Eulerian multiphase flow DDPM gas–solid coupling method, and the standard turbulence was selected instead of the gas–fluid computational model to construct a pre-simulation module for the seed-filling operation of the pneumatic-assisted precision seed-metering machine. The simulation grid size was set at 3R in EDEM, the simulation time step was 2 × 10⁻⁶ s, the simulation time step was 1 × 10⁻⁴ s in FLUENT, and the total simulation time was 6.0 s. To better observe the motion information of the particles and the airflow in the fluid domain, as well as to extract the motion data of the particles and the fluids, it was necessary to record the data in detail. In EDEM, the data were saved every 0.02 s, and in FLUENT, they were recorded every 200 times to ensure synchronization between EDEM and FLUENT. In this study, the peanut planting spacing was 200 mm, the diameter of the seed discharge disk was 216 mm, 35 seed suction holes were present, the negative pressure was −3 kPa, the forward speed of the machine was 10 km·h−1, and normal atmospheric pressure was used as the basic simulation conditions. The relationship between the rotational speed of the seed discharge disk and the forward speed of the machine is shown in Table 2. The values of several key parameters, such as peanut and object parameter and contact force parameters, required in the coupled DEM-CFD simulation [40], are shown in Table 3.

2.4. Design of Experiments

2.4.1. Design of Experiments for Coupled Simulation Modeling

In this study, according to the previous theoretical analysis, the seed-filling chamber ‘V’ angle, the bottom blow-air-hole cross-sectional area, and the blow-air-hole air velocity were the main factors affecting the perturbation of the seed group. To more accurately obtain the influence of these factors on the performance of seed-filling, a seed-filling chamber ‘V’ angle γ of 50–65°, a bottom blow-air-hole cross-sectional area S of 800–1400 mm2, and a blow-air-hole air velocity vq of 10–16 m·s−1 were measured. Tests were carried out. Coupled DEM-CFD simulations were used to obtain a suitable range of factors.

2.4.2. Design of Experiments for Response Surface Analysis

To further verify the effect of disturbing the seed blowing device structure and airflow velocity of seed blowing holes on the disturbance of the seed-filling effect of peanuts and other large seeds during high-speed seed discharging, white sand peanut seeds were selected as the test material, and the JSP-12 seed sowing performance test stand (Qingdao Agricultural University, Qingdao, China) was utilized as the bench test apparatus, using negative pressure fans to generate strong negative pressure to ensure stable negative pressure for seed adsorption at the seed suction holes of the seed-discharging disk of the air-suction device, as well as using positive pressure fans to provide a stable airflow for seed blowing at the seed blowing holes. The test bench simulated the seed-discharging disk seed suction hole adsorption of seeds under the disturbance of peanut seeds through the structure of the seed blowing holes of the seed-discharging machine, observing seed adsorption in the seed-discharging disk through the observation port of the seed-discharging machine.
Based on the coupling test, the seed-filling chamber ‘V’ angle γ, the bottom blowhole cross-sectional area S, and the seed blowhole air velocity vq values were set as the range of influencing factors, then, using the seed-discharging disk suction hole suction-qualified index; the leakage index as an indicator; and Design-Expert 8.0.6 software, the BBD test method was used to carry out a three-factor three-level test. The test evaluation indexes followed GB/T 6973-2005, “Testing methods of single seed drills (precision drills)” [41].

2.4.3. Test Indicators and Measurement Methods

Based on the GB/T 6973-2005 “Single grain (precision) seed-metering machine test method”, when the seed-metering machine was working stably according to the established operating speed, seed-filling data sampling was carried out, and each time, the number of monitored seeds was 251, with monitoring repeated 3 times, and the average value was taken for counting. Taking the peanut seed-filling pass rate Y1 and the leakage rate Y2 as the test indexes, the calculation Formula (10) was defined as follows:
Y 1 = n 1 N × 100 % Y 2 = n 2 N × 100 %
where n1 is the number of seed suction holes filled with seeds, n2 is the number of seed suction holes without seeds, and N is the total number of seed suction holes monitored, N = 251.

3. Results and Discussion

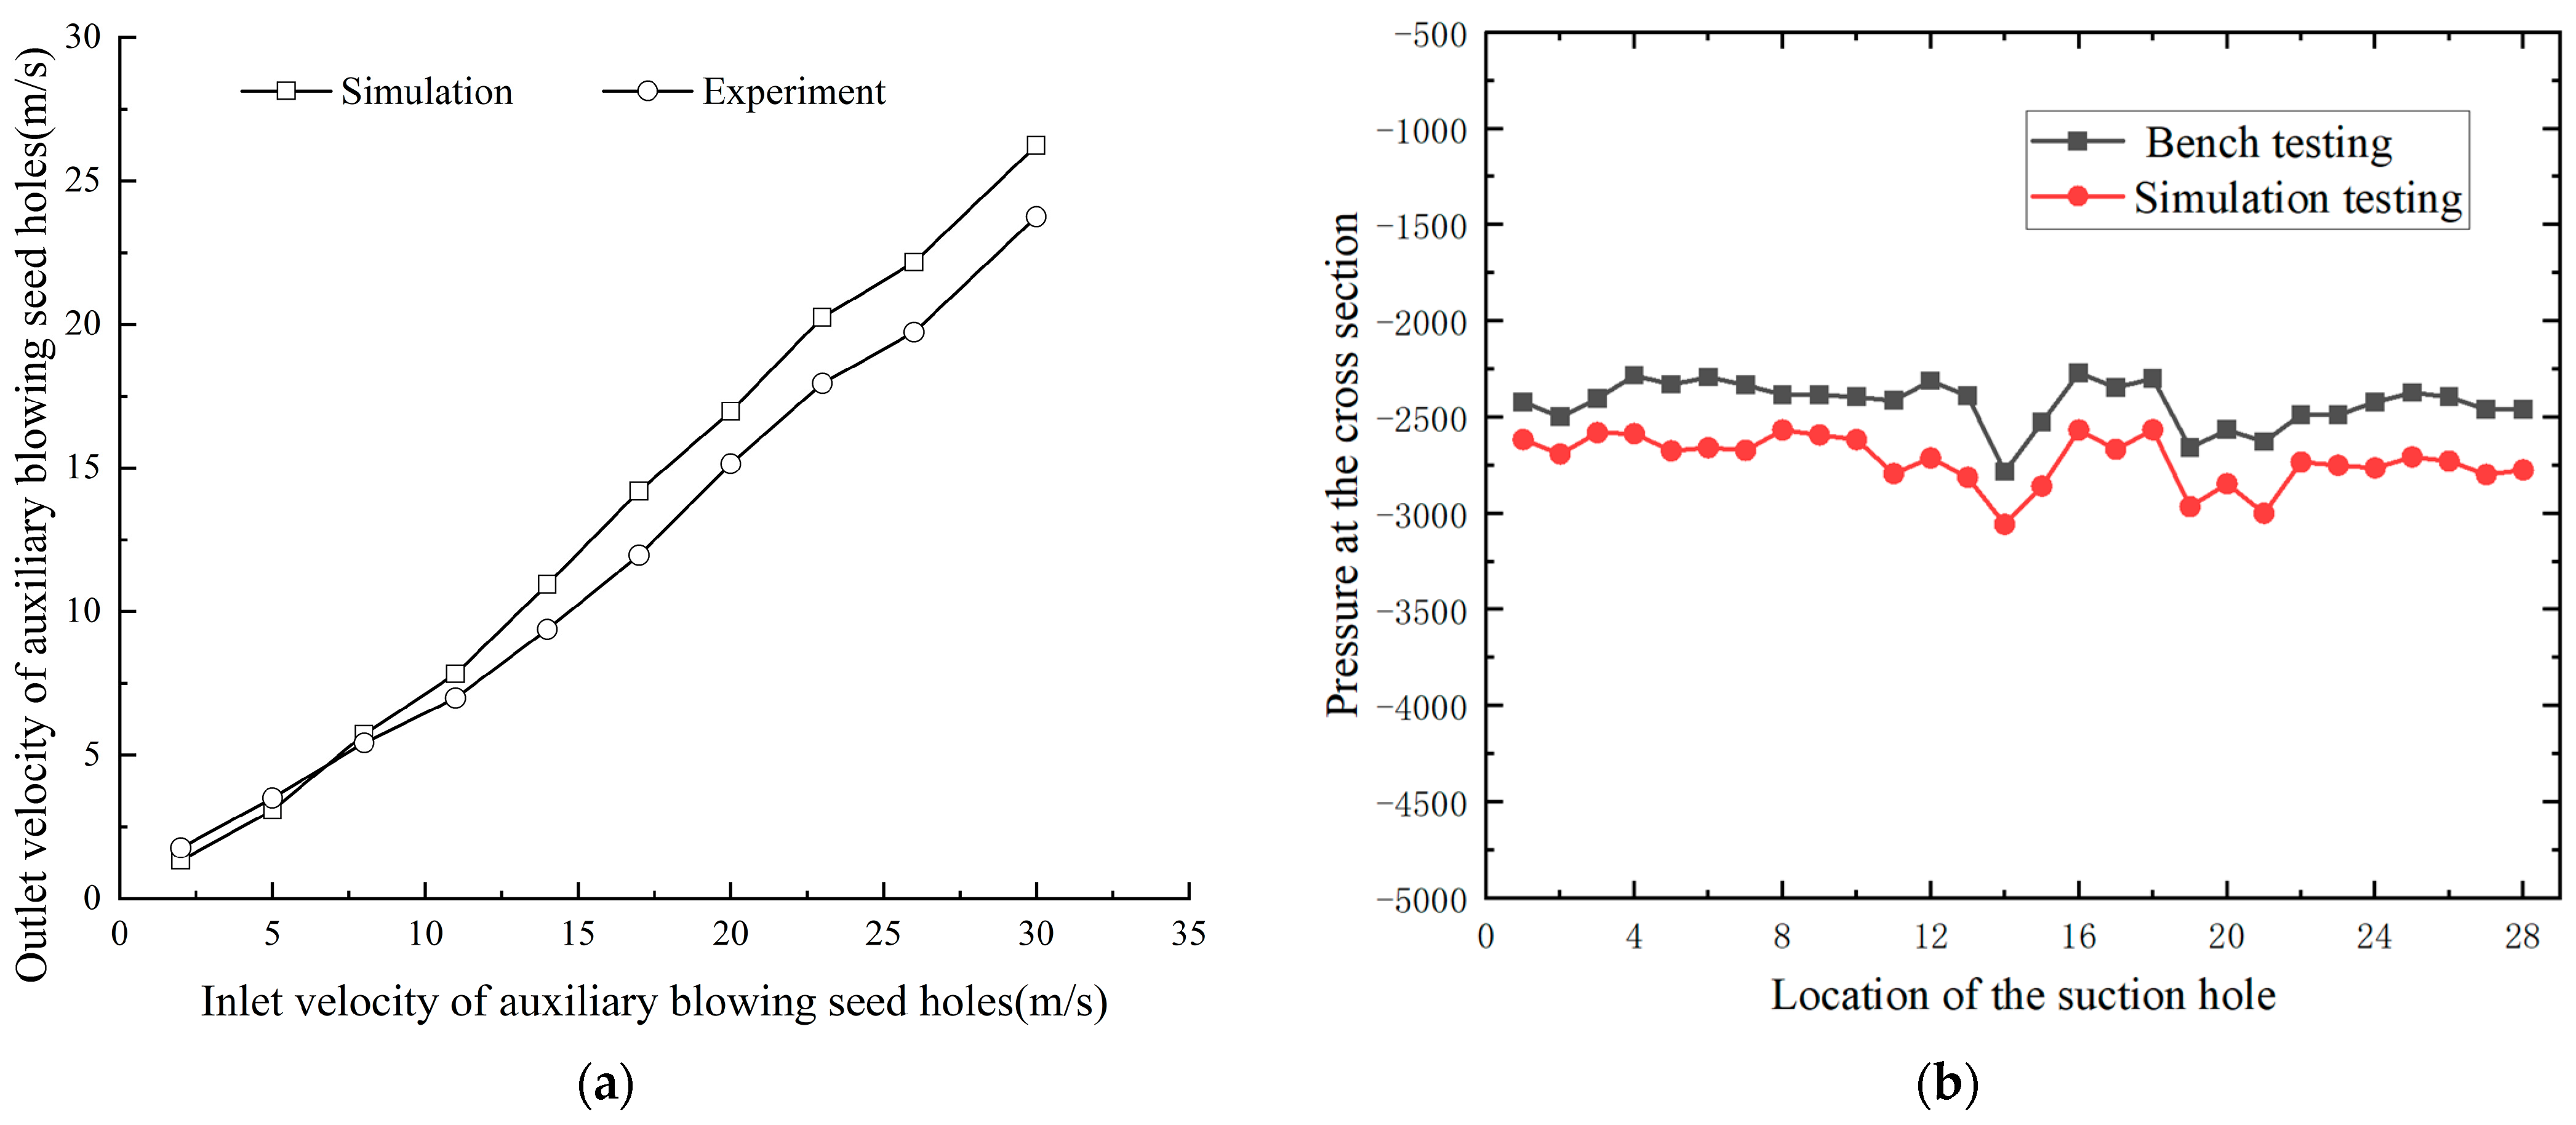
3.1. Model Validation Analysis

We performed a simulation analysis of the airflow inlet velocity and outlet velocity at the disturbed position of the pneumatic-assisted precision seed-metering machine, and at the same time, we used an anemometer to measure the outlet velocity at the disturbed position of the seed blowing structure of the auxiliary air-suction seed-filling device blowing seeds to compare and analyze the simulation and experimental results of the airflow velocity. The results are compared in Figure 5a. The figure shows that, under the same inlet velocities, the simulated airflow exit velocities systematically exceeded the experimental ones but followed the same trend. The AASD should be optimal for disturbing the seeds, so the airflow velocity here needed to be slightly larger than the suspension velocity of peanut seeds to realize peanut perturbation (10 m s−1). The proposed model could be used for the motion analysis of peanuts and other large-seeded seeds in a pneumatic-assisted precision seed-metering machine.
Additionally, to validate the model’s validity at the seed intake hole, the pressure of the seed dispenser was set to −4000 Pa, with the pressure inlet at 0 Pa, with all other surfaces set to wall. In the simulation, the turbulence model selected was the standard k-ε model, with the sub-relaxation factor kept at its default setting. The pressure SIMPLE algorithm was used to solve the transient problem, with a time step of 0.001 s, 5000 steps, and 80 inner iterations, with data saved every 50 steps. Pressure data at the center of the seed intake hole was extracted, and a digital pressure instrument was used to measure the pressure at the seed intake hole during the bench test. The pressure at the seed intake hole in the simulation and bench test is shown in Figure 5b. As can be seen from the figure, the test bench test results show significant numerical differences compared with the simulation test results, with the test bench test results being lower than the simulation test results, differing by 100–300 Pa. However, the trends of the two results are similar, indicating that the simulation test accurately models the actual seeding process.

3.2. Gas–Solid Coupling Simulation Analysis

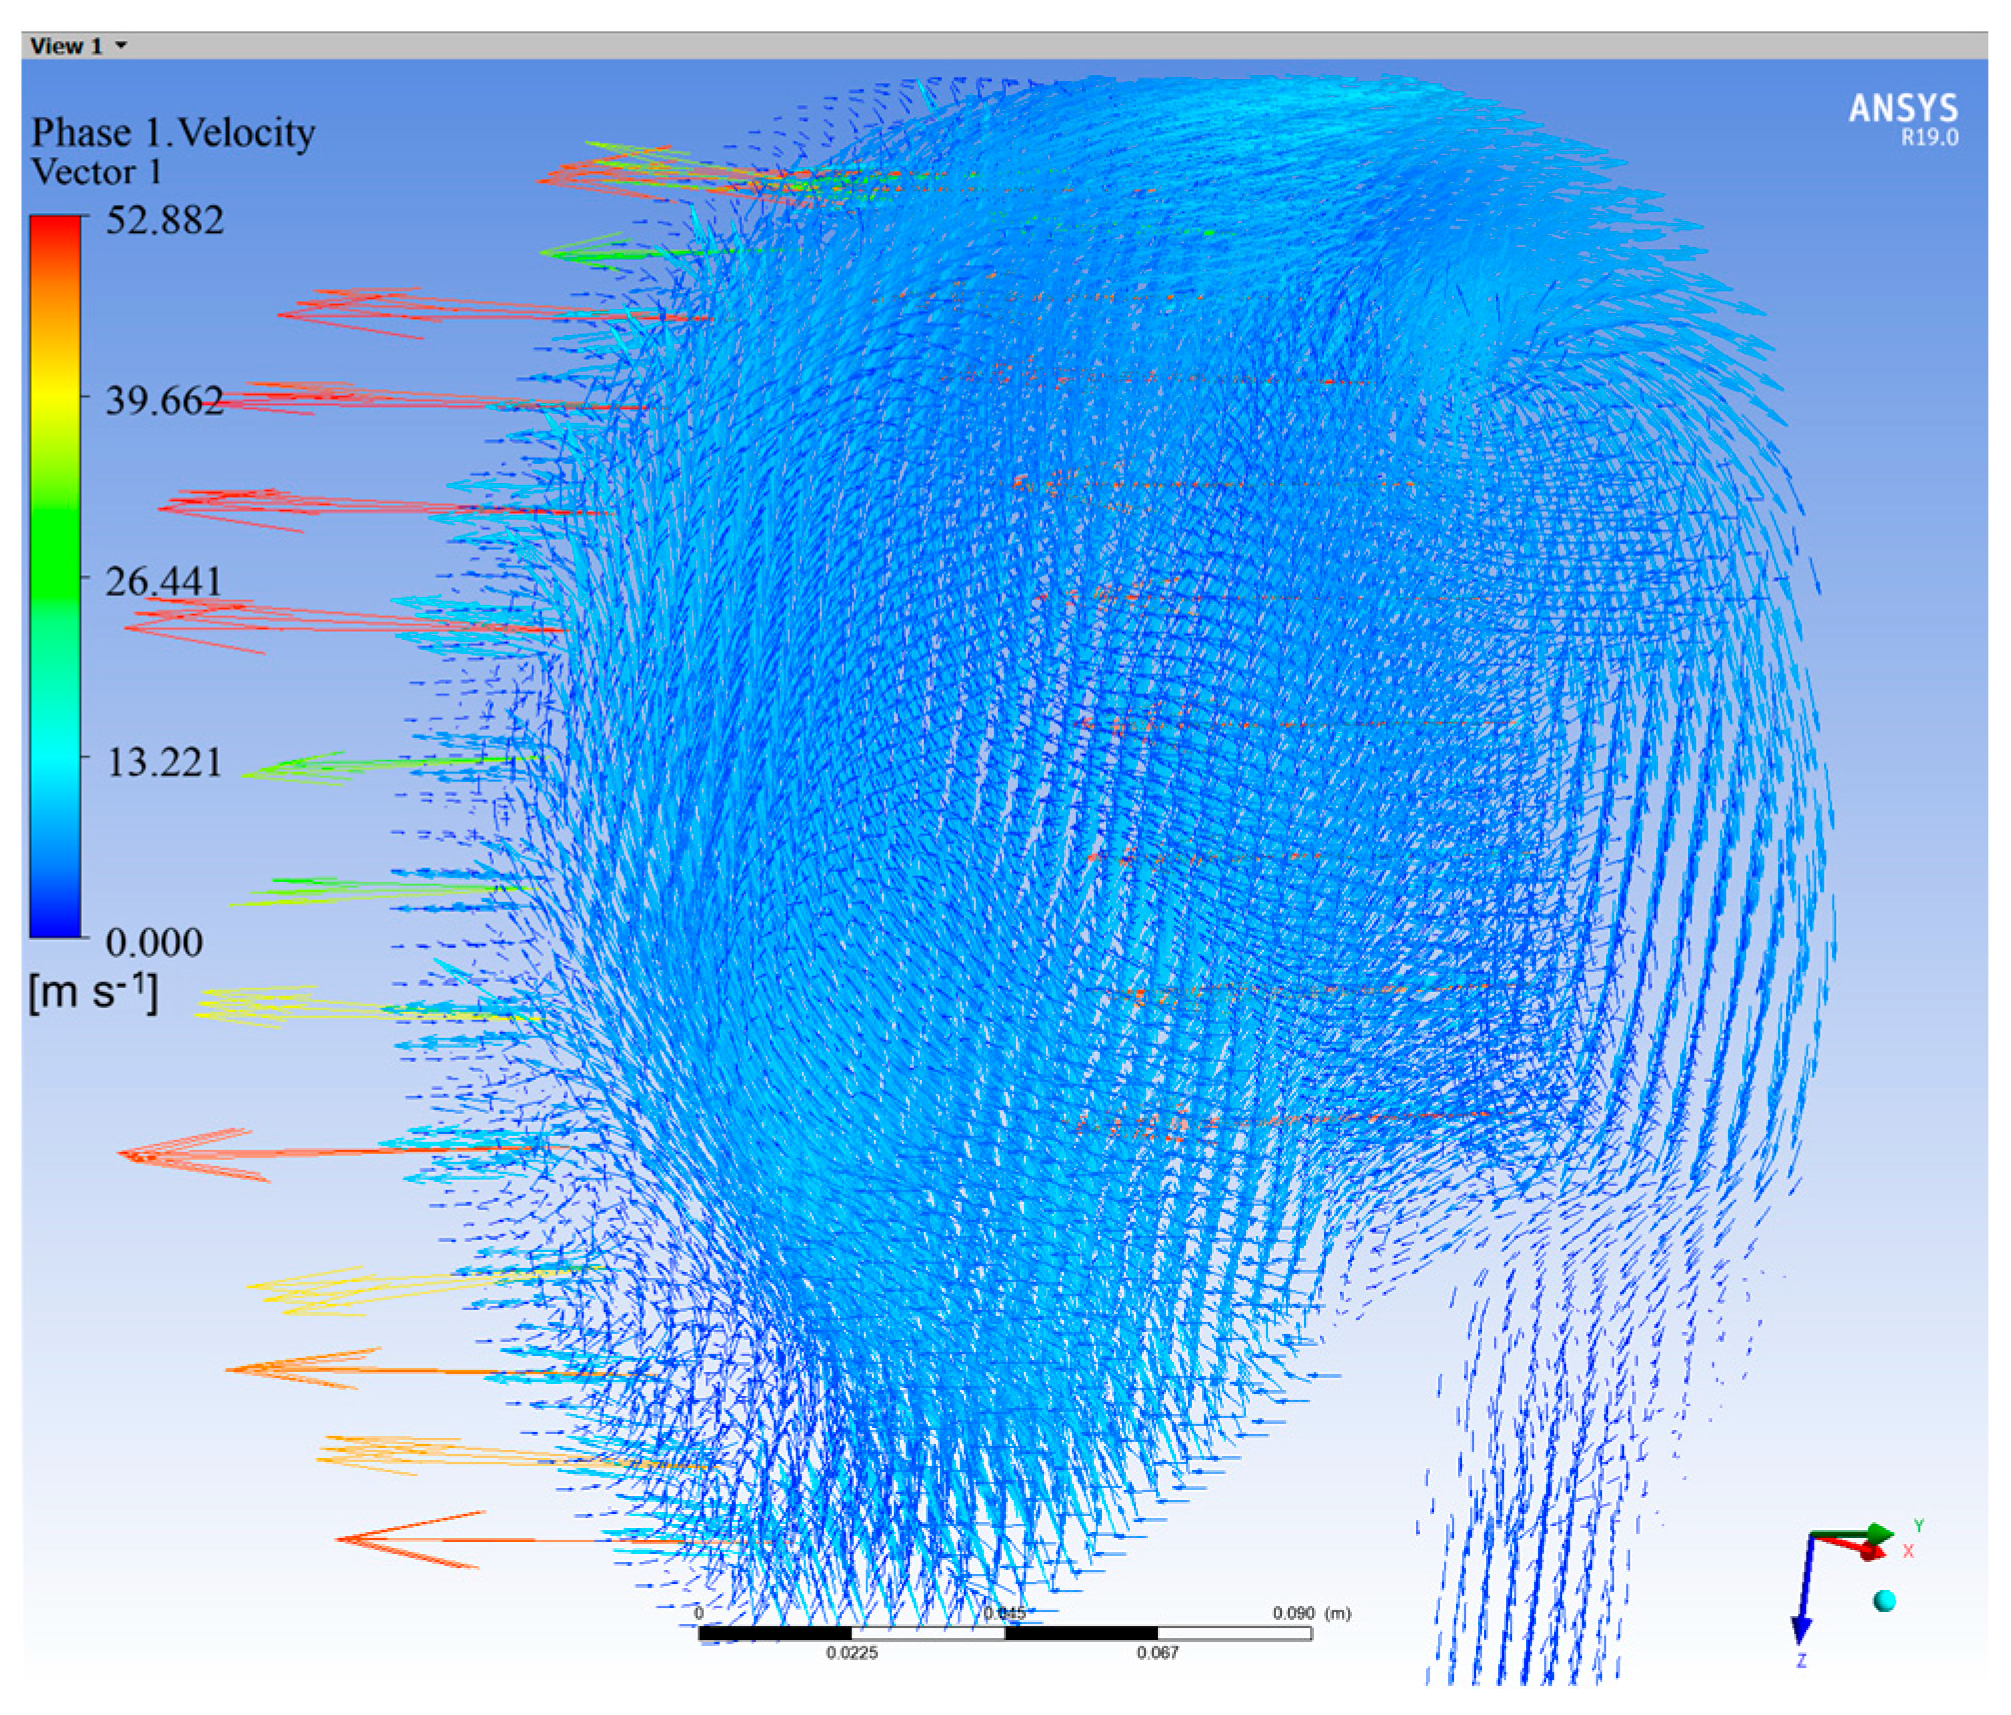
3.2.1. Characterization of the Airflow of Auxiliary Seed-Filling Devices

The airflow motion characteristics of the auxiliary seed-filling device provide the key basis for analyzing the motion characteristics of the peanut when the peanut seed is disturbed and filled, and the airflow velocity vector cloud diagrams from various places in the fluid domain are shown in Figure 6. The airflow is mainly concentrated in the seed chamber and presents the maximum airflow velocity at the seed suction holes, which is conducive to the adsorption of seeds.

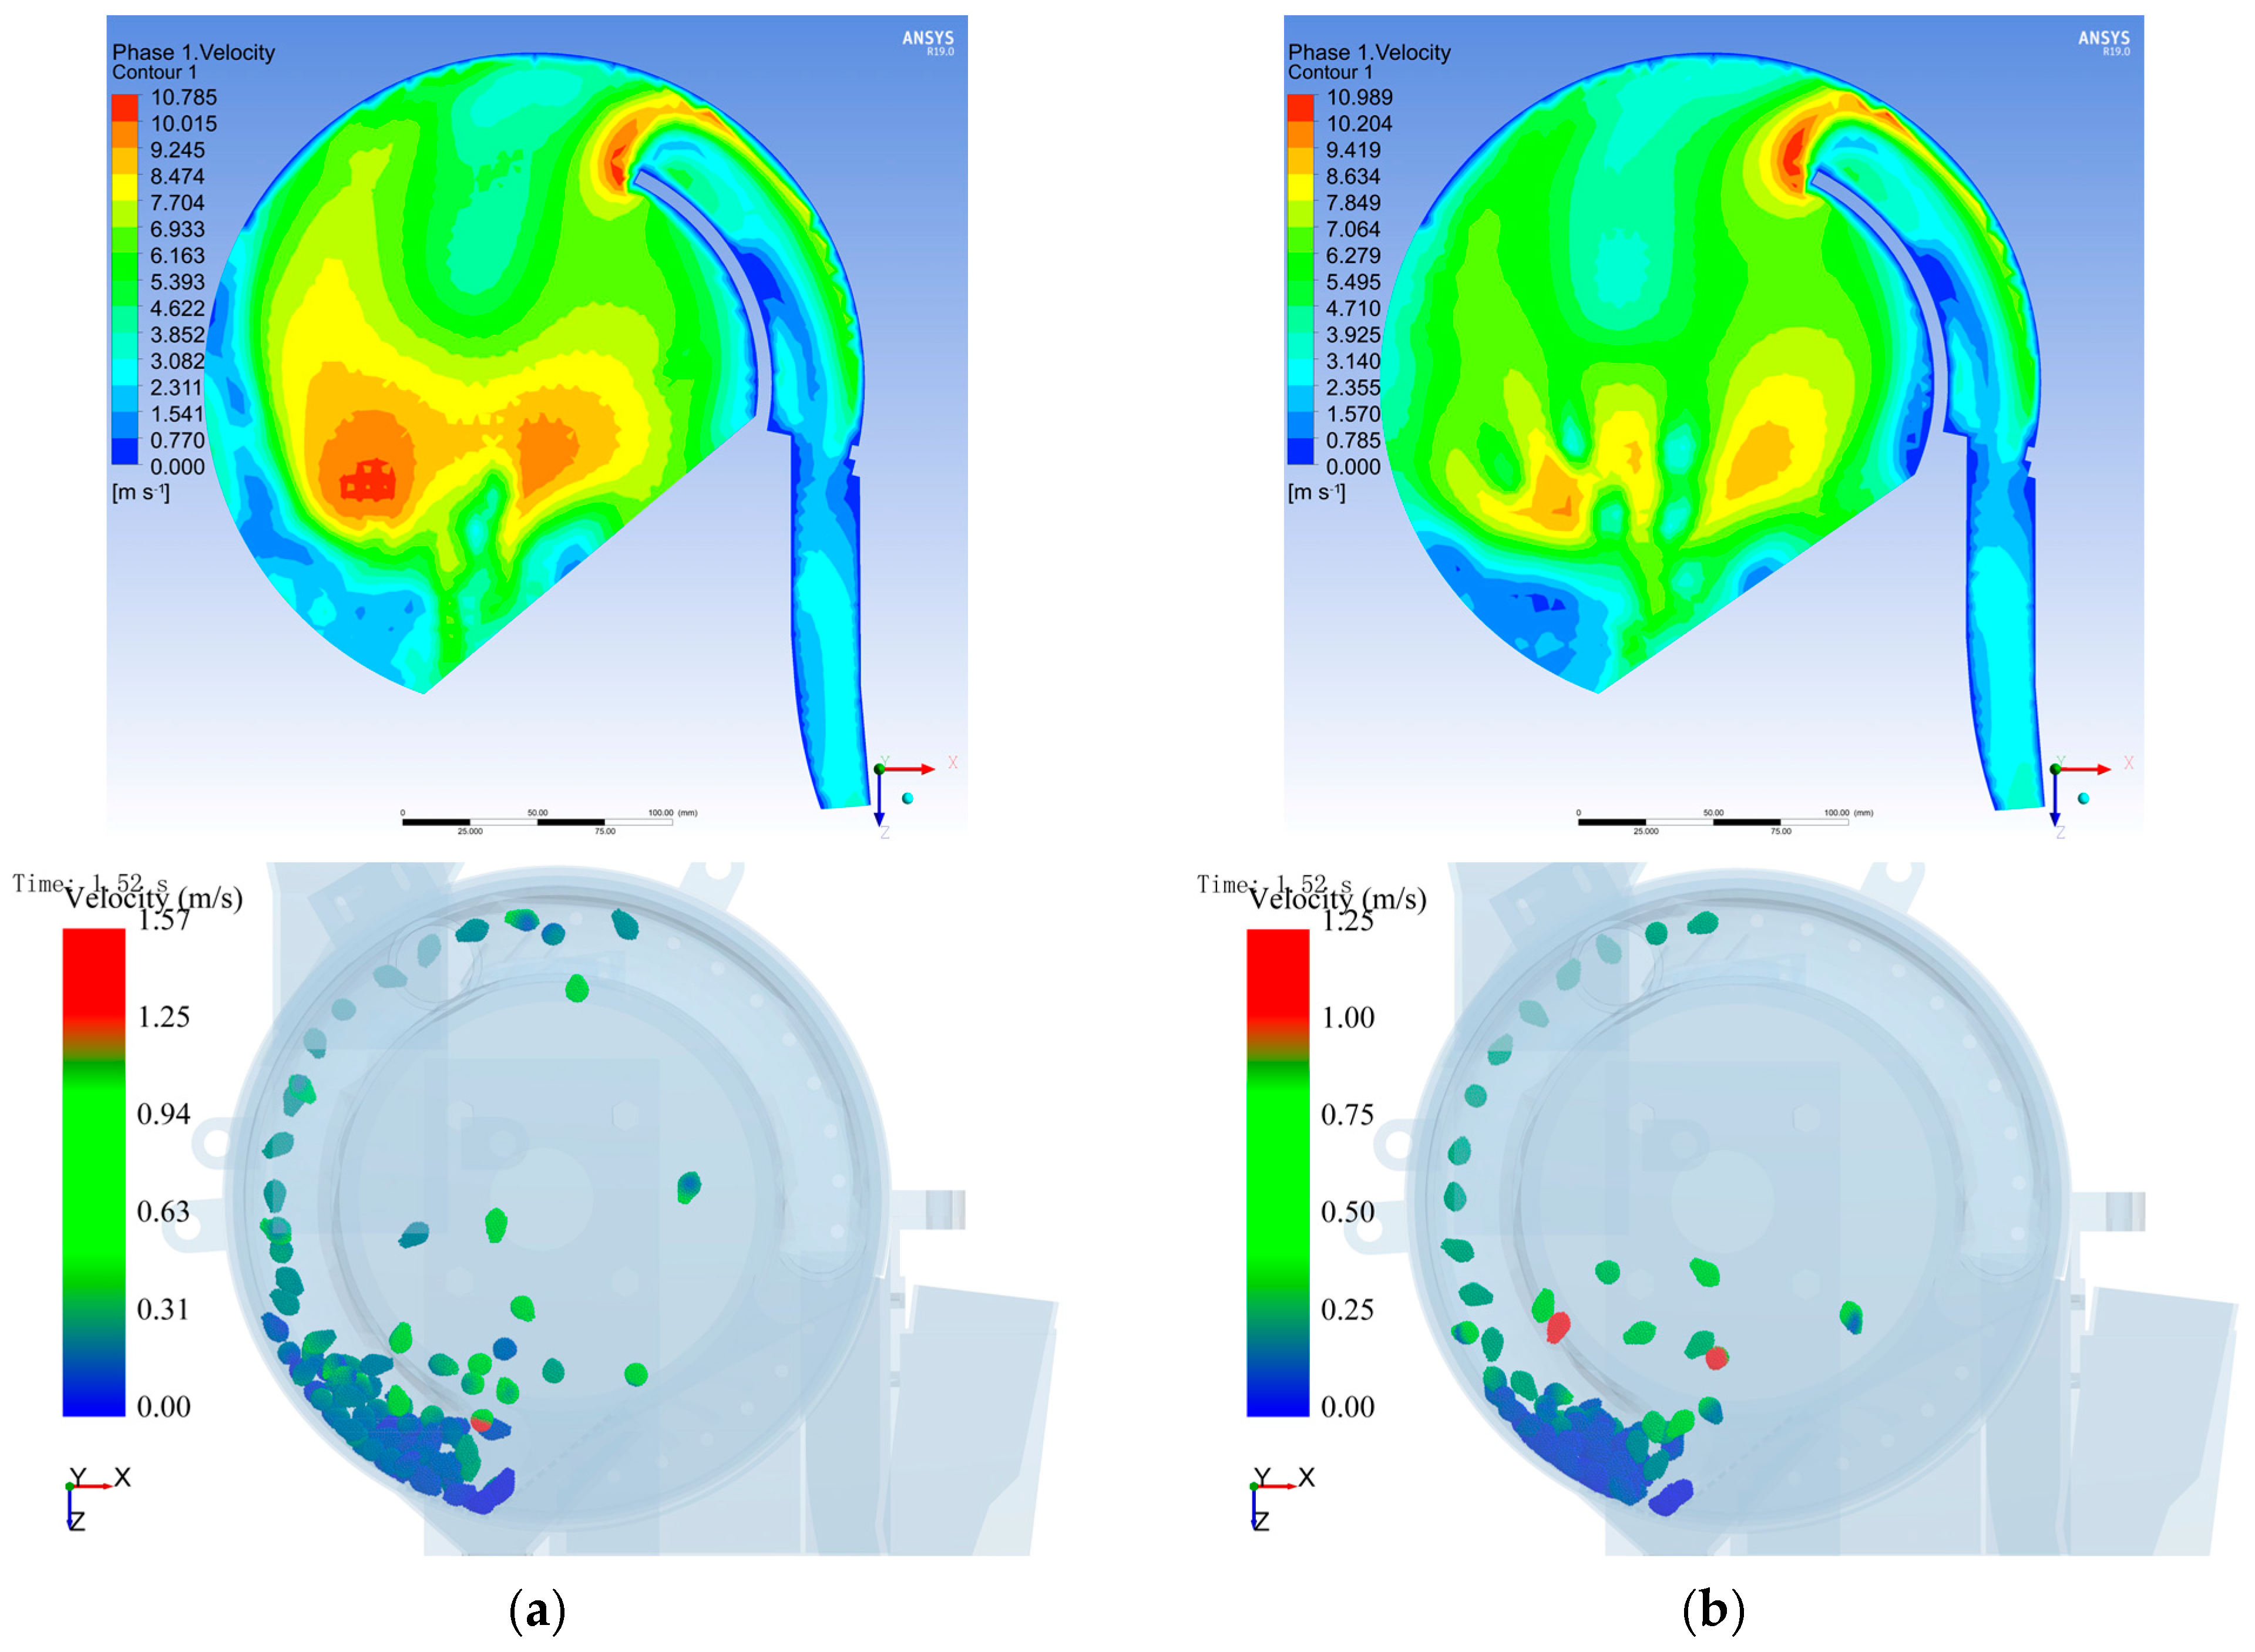
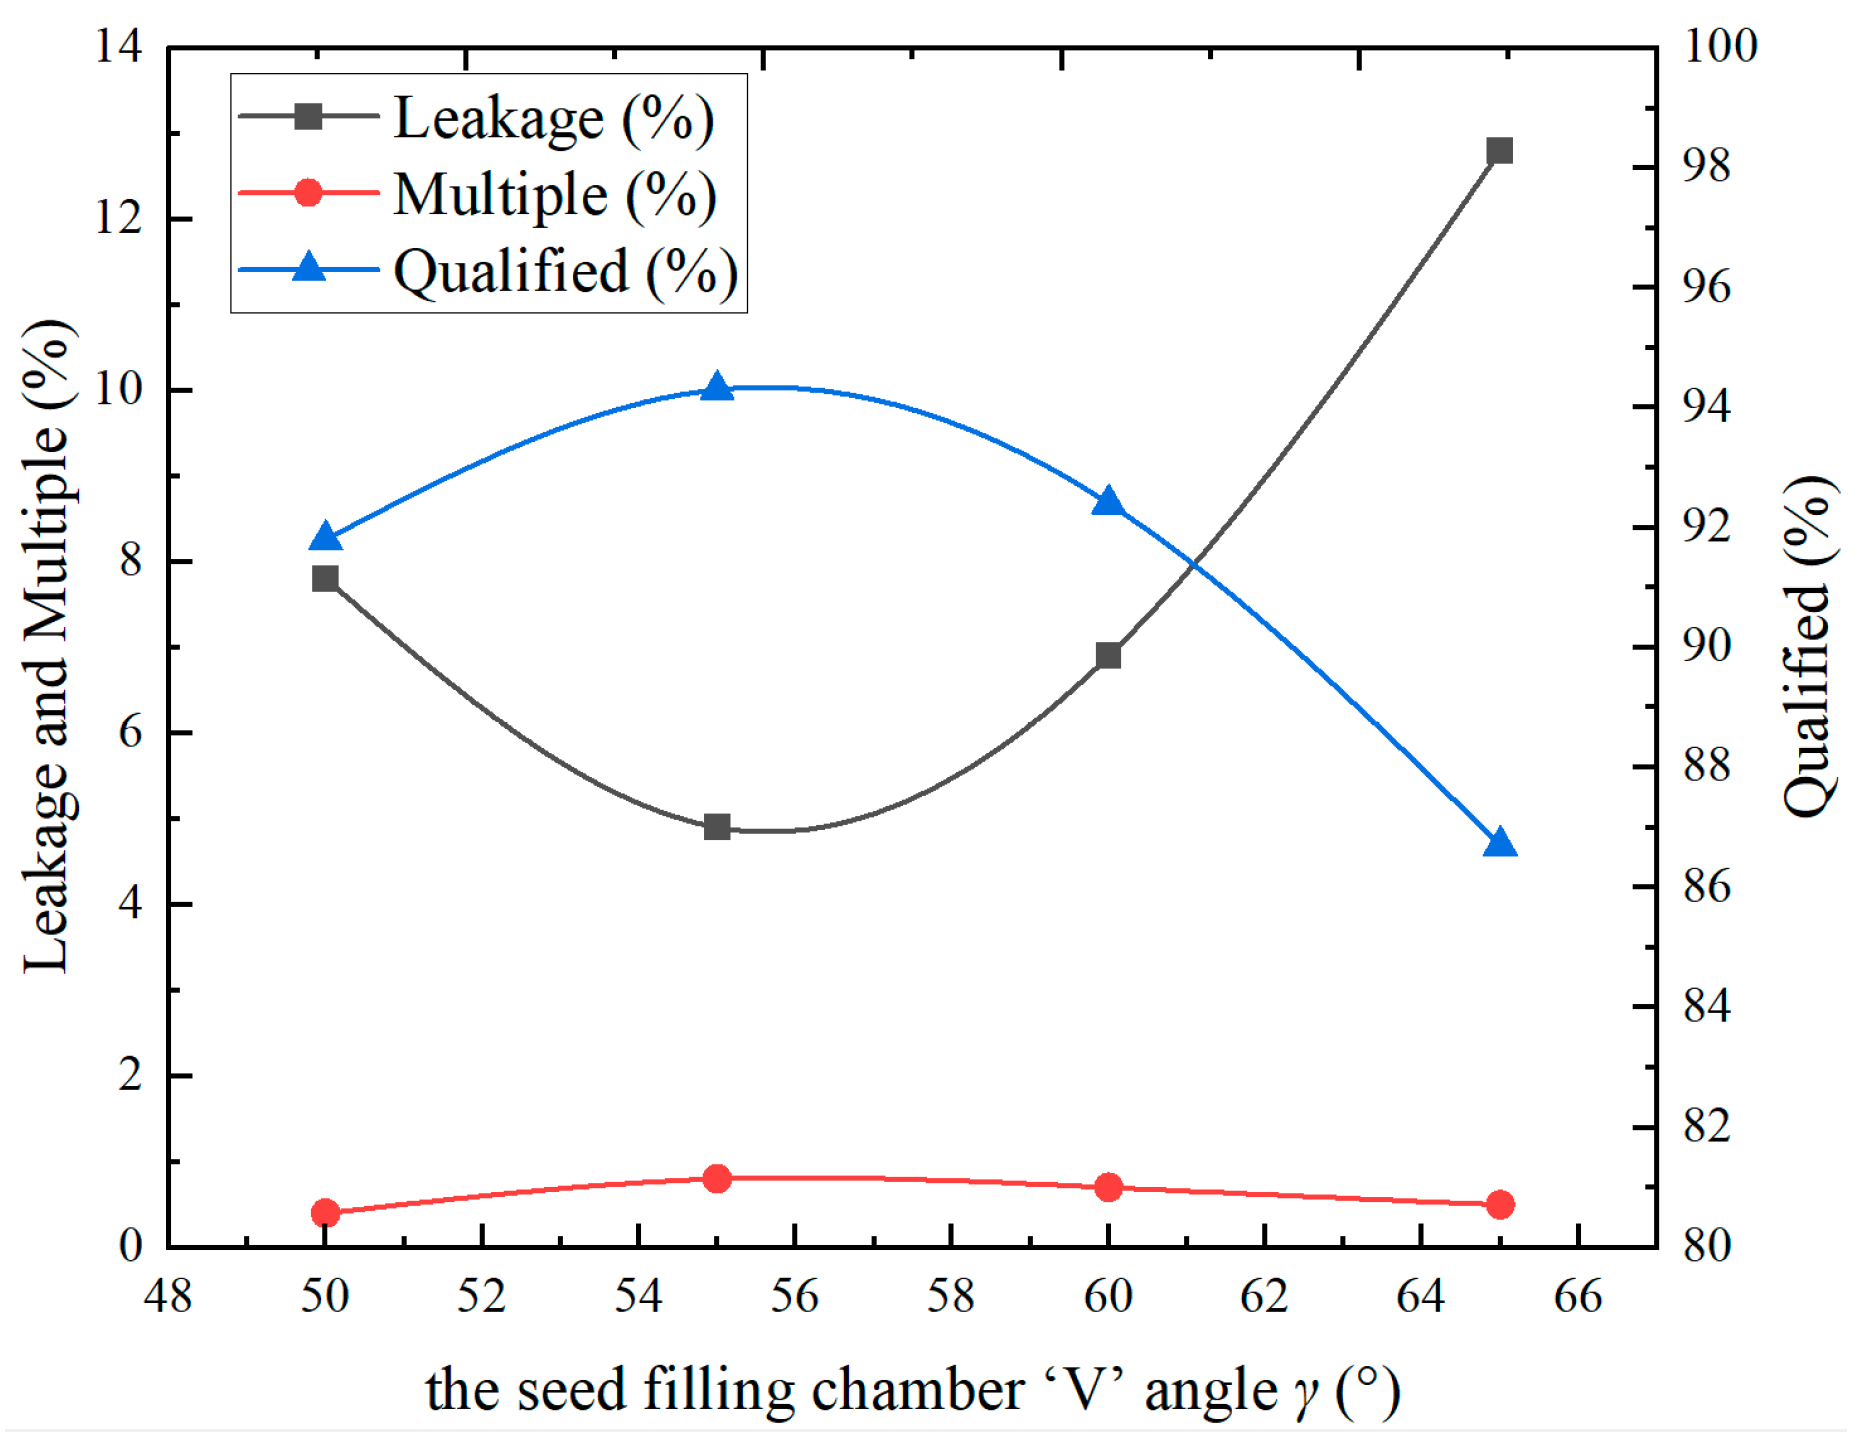
3.2.2. Single-Factor Simulation Test of the Seed-Filling Chamber ‘V’ Angle

To verify the effect of the auxiliary air-suction seed-filling device seed-filling chamber ‘V’ angle γ on the performance of indoor seed movement, in this study, the bottom blow-air-hole cross-sectional area S was set as 1200 mm2, and the blow-air-hole airflow velocity vq was set as 10 m·s−1. A single-factor simulation test was conducted with seed-filling chamber ‘V’ angles γ of 50°, 55°, 60°, and 65°. By observing the velocity cloud inside the seed-filling chamber, the seed movement and the seed absorption index were used to determine the influence of the arrangement angle of the seed-filling device on seed movement, as shown in Figure 7.
In Figure 7, there is a significant difference in the distribution of the air flow field within the seed-filling chamber. In Figure 7a–d, this can be seen in the clip angle of 50–60° of the air velocity field in the seed-filling chamber on the upper-right side of the seed with a higher velocity airflow, which indicates that the airflow on the bottom and left sides of the seed has a perturbing effect, and while making contact with the seed, the kinetic energy of the airflow will be transferred to the seed to drive the seed movement, ensuring that seed suction holes annexed to the seeds of the perturbing set improve the seed-filling effect. At the bottom of the seed-filling chamber, seed movement can be clearly seen, and as the angle becomes larger, the difference in movement in peanut seeds in the seed-filling chamber also becomes larger, so at an angle of 65° in the seed-filling chamber, seed movement, relative to the other angles, has a worse effect on the bottom of the seed-filling chamber. As can be seen in Figure 8, at an angle of 65° in the seed-filling chamber, the seed suction disk adsorption of the seed at the qualified rate compared with the highest value of the difference is 7.6%; the leakage rate compared with the lowest value of the difference is 7.9%. For comprehensive seed-filling chamber air velocity and seed-filling chamber seed movement differences, the seed-filling chamber ‘V’ angle γ takes a value of 50~60°, so the effect of seed suction is better.

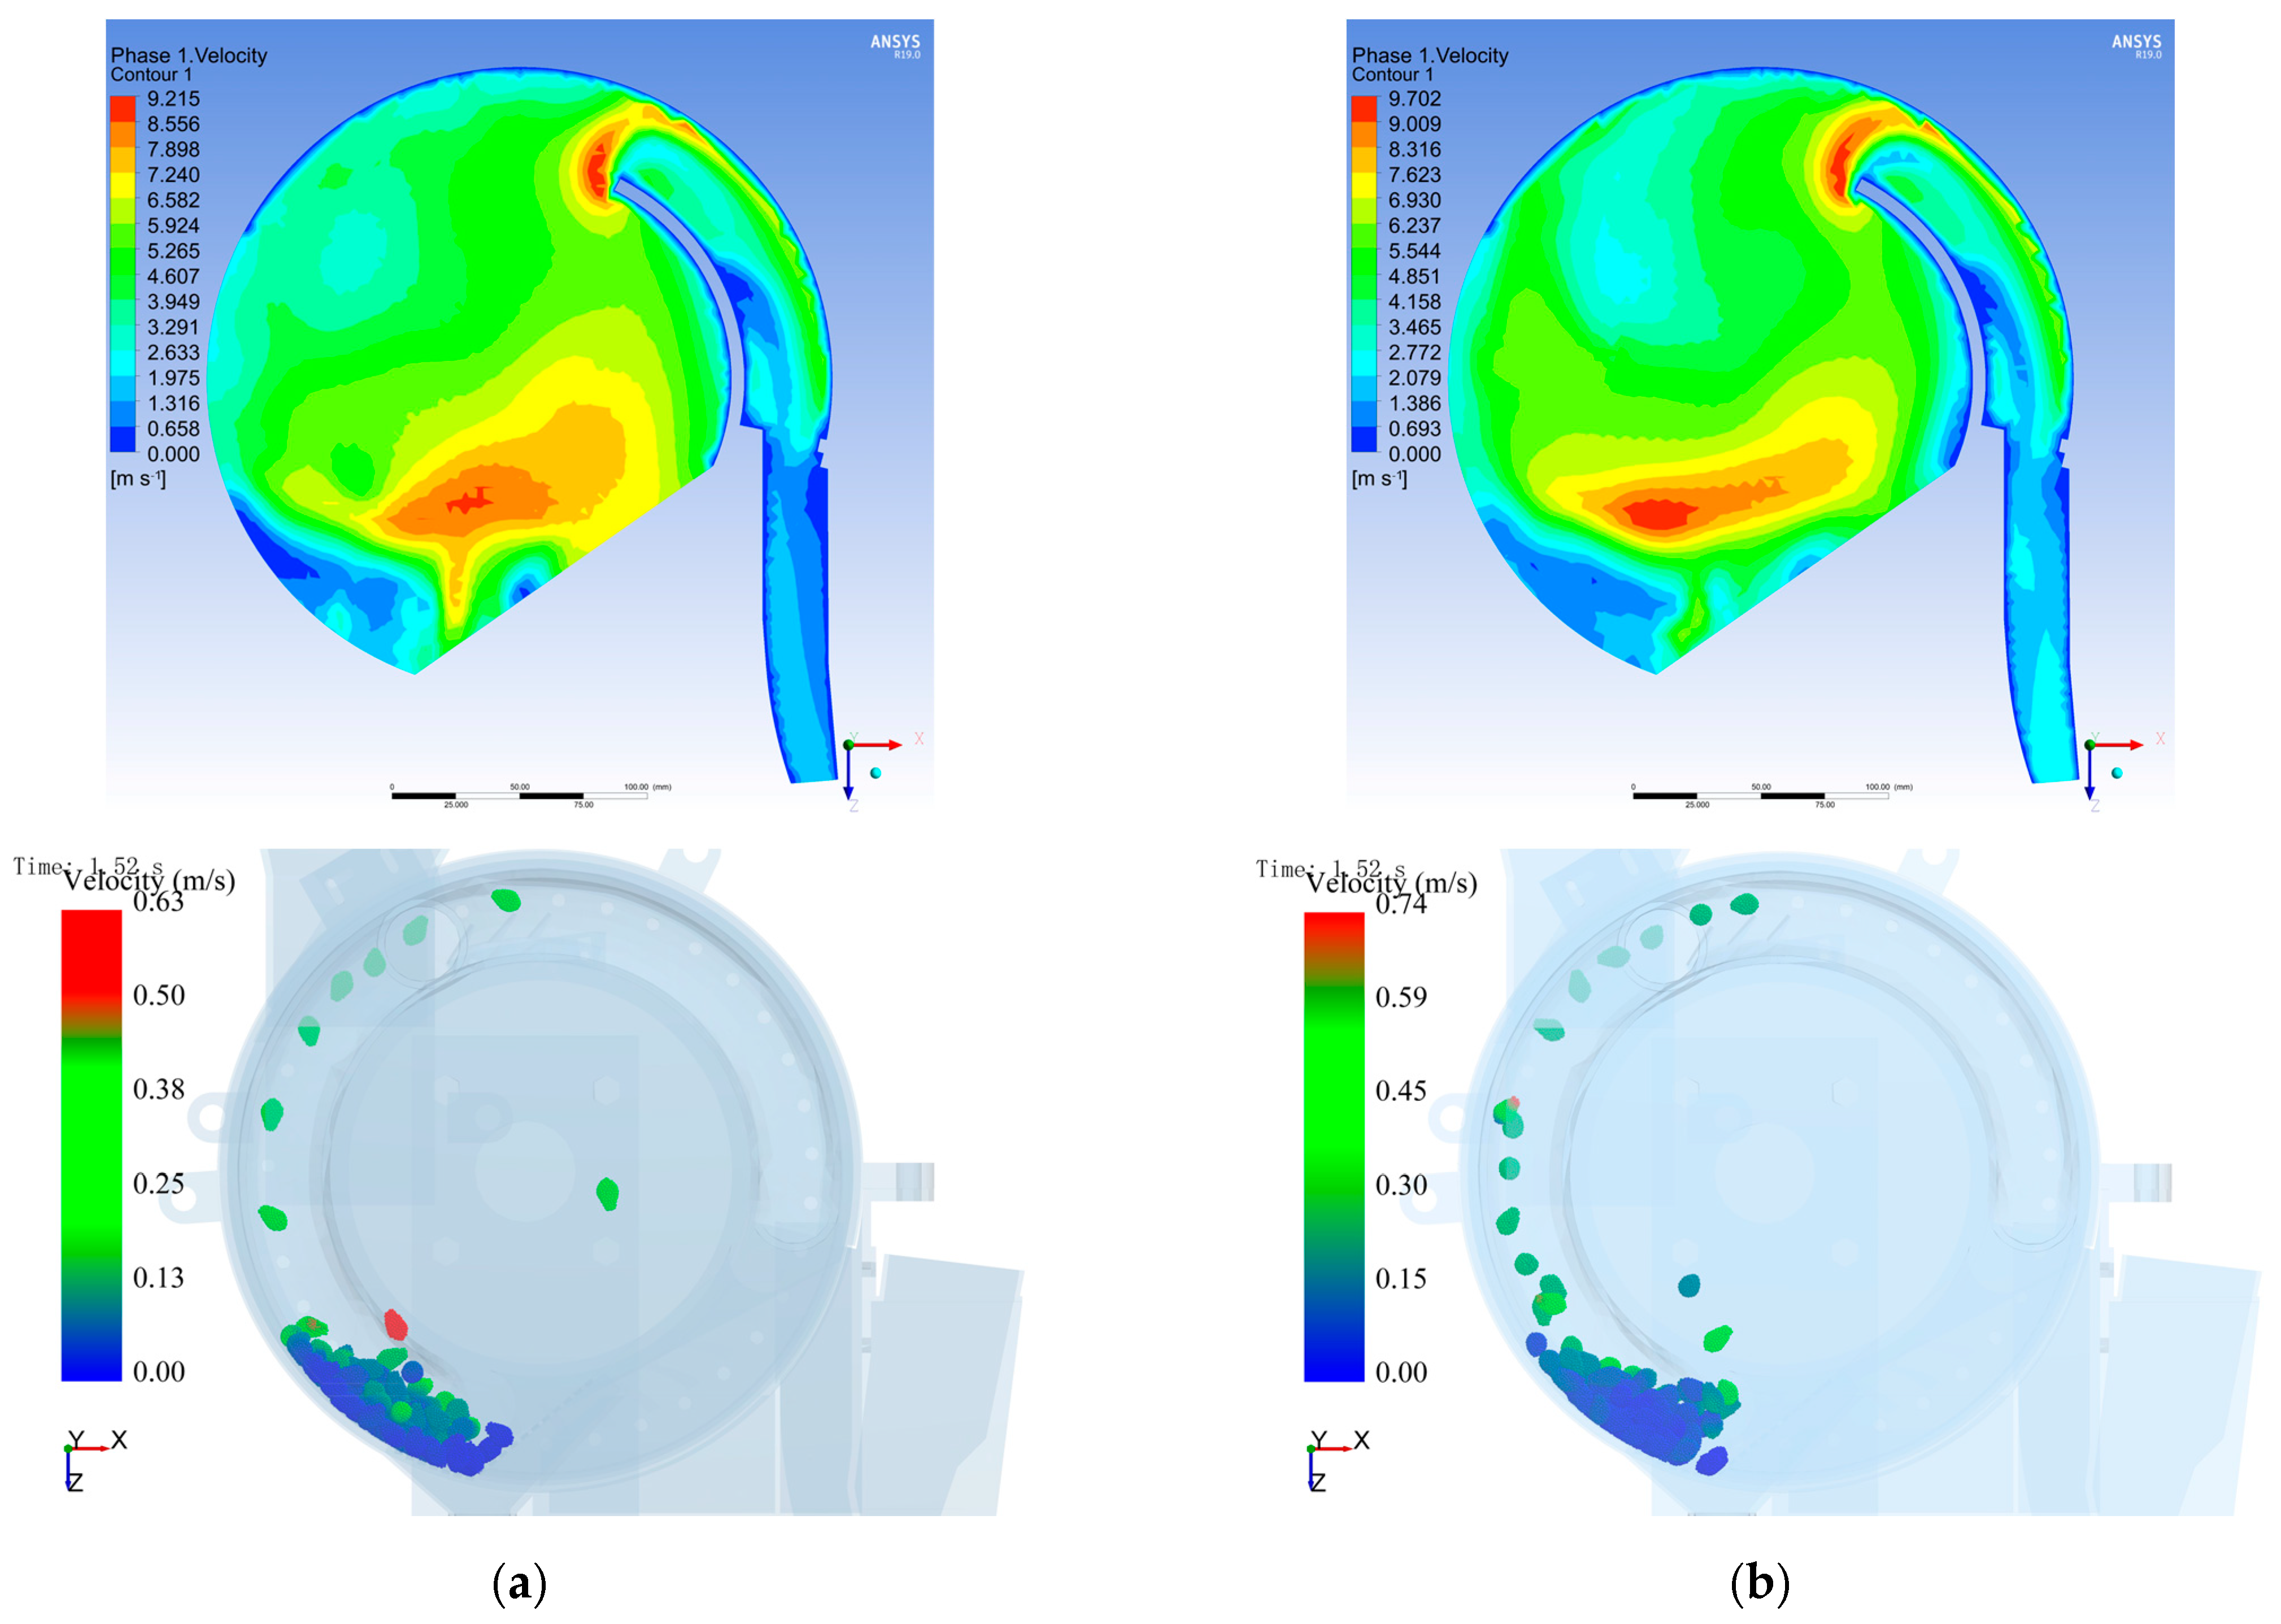
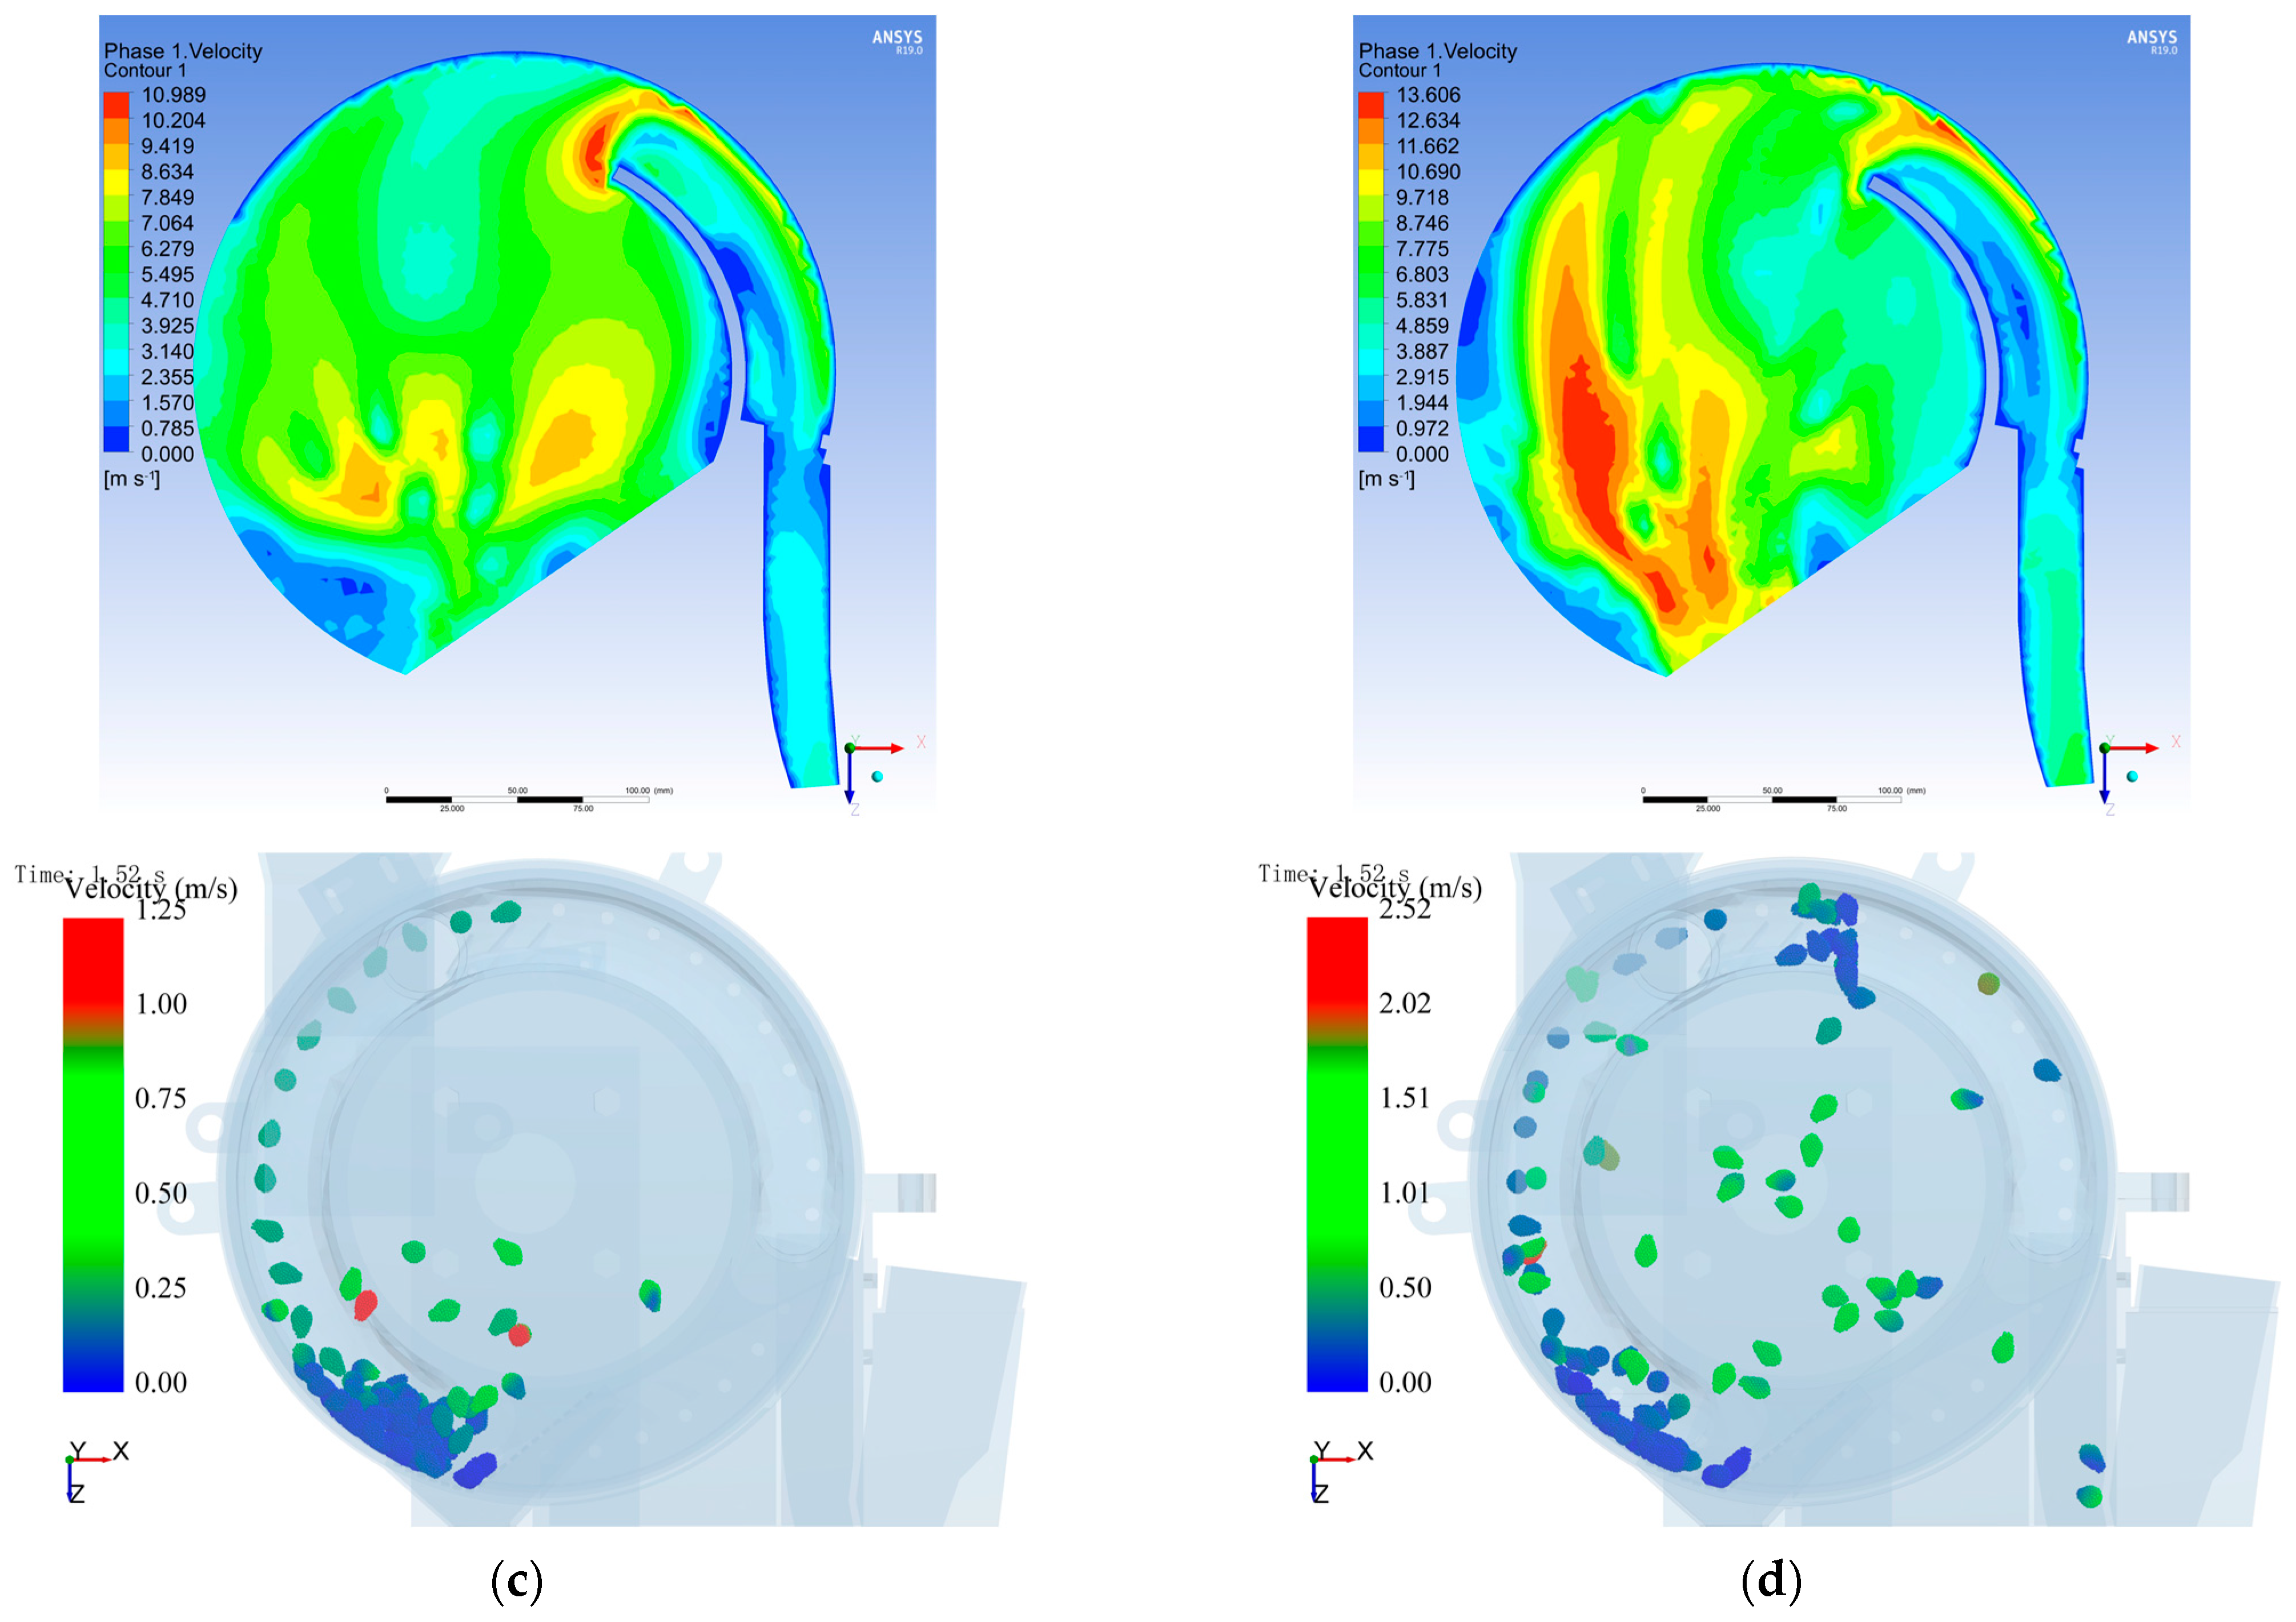
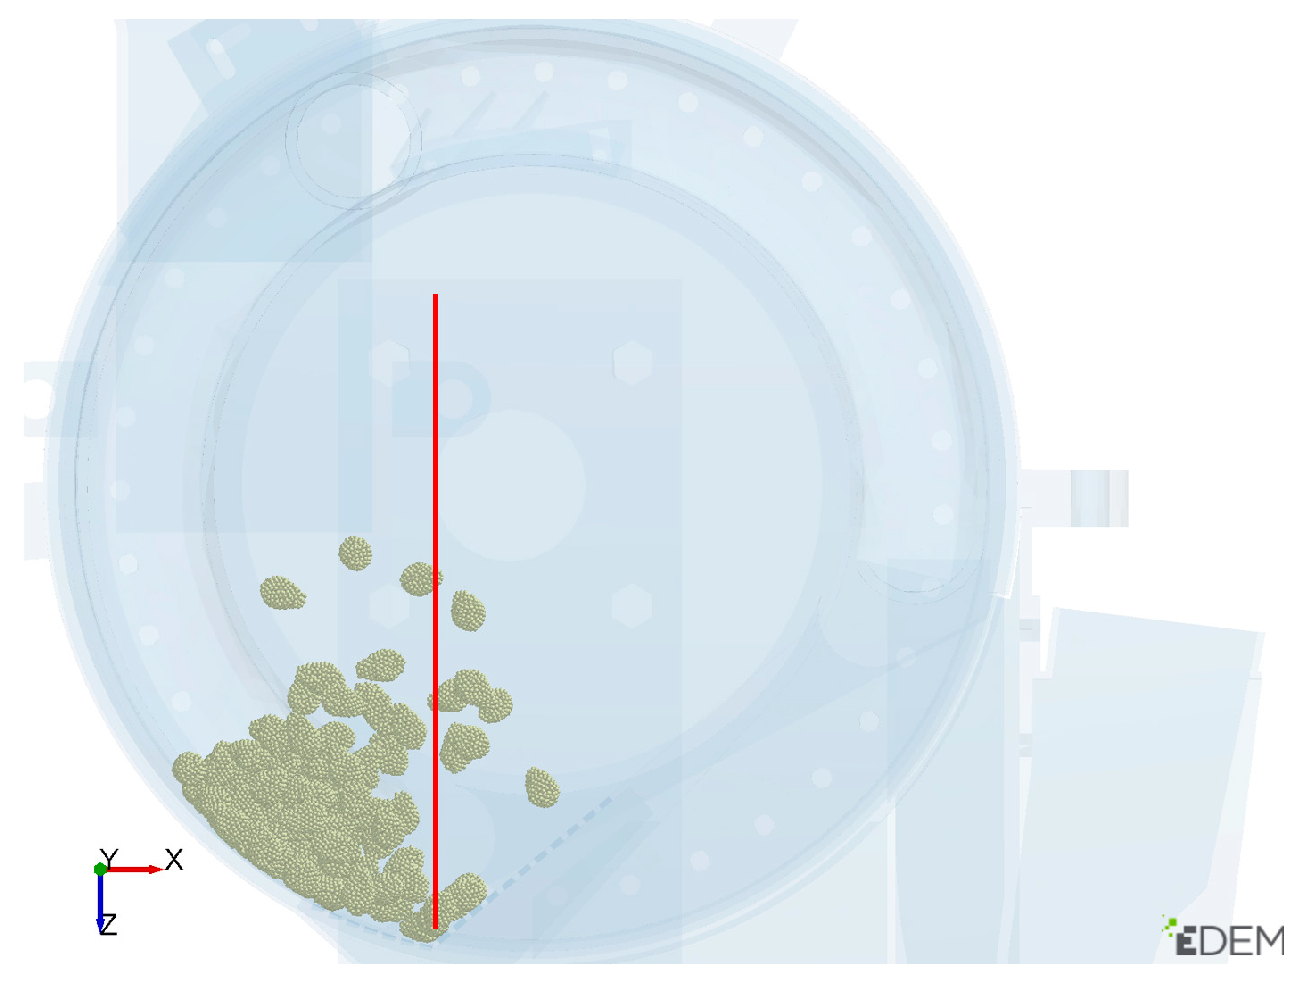
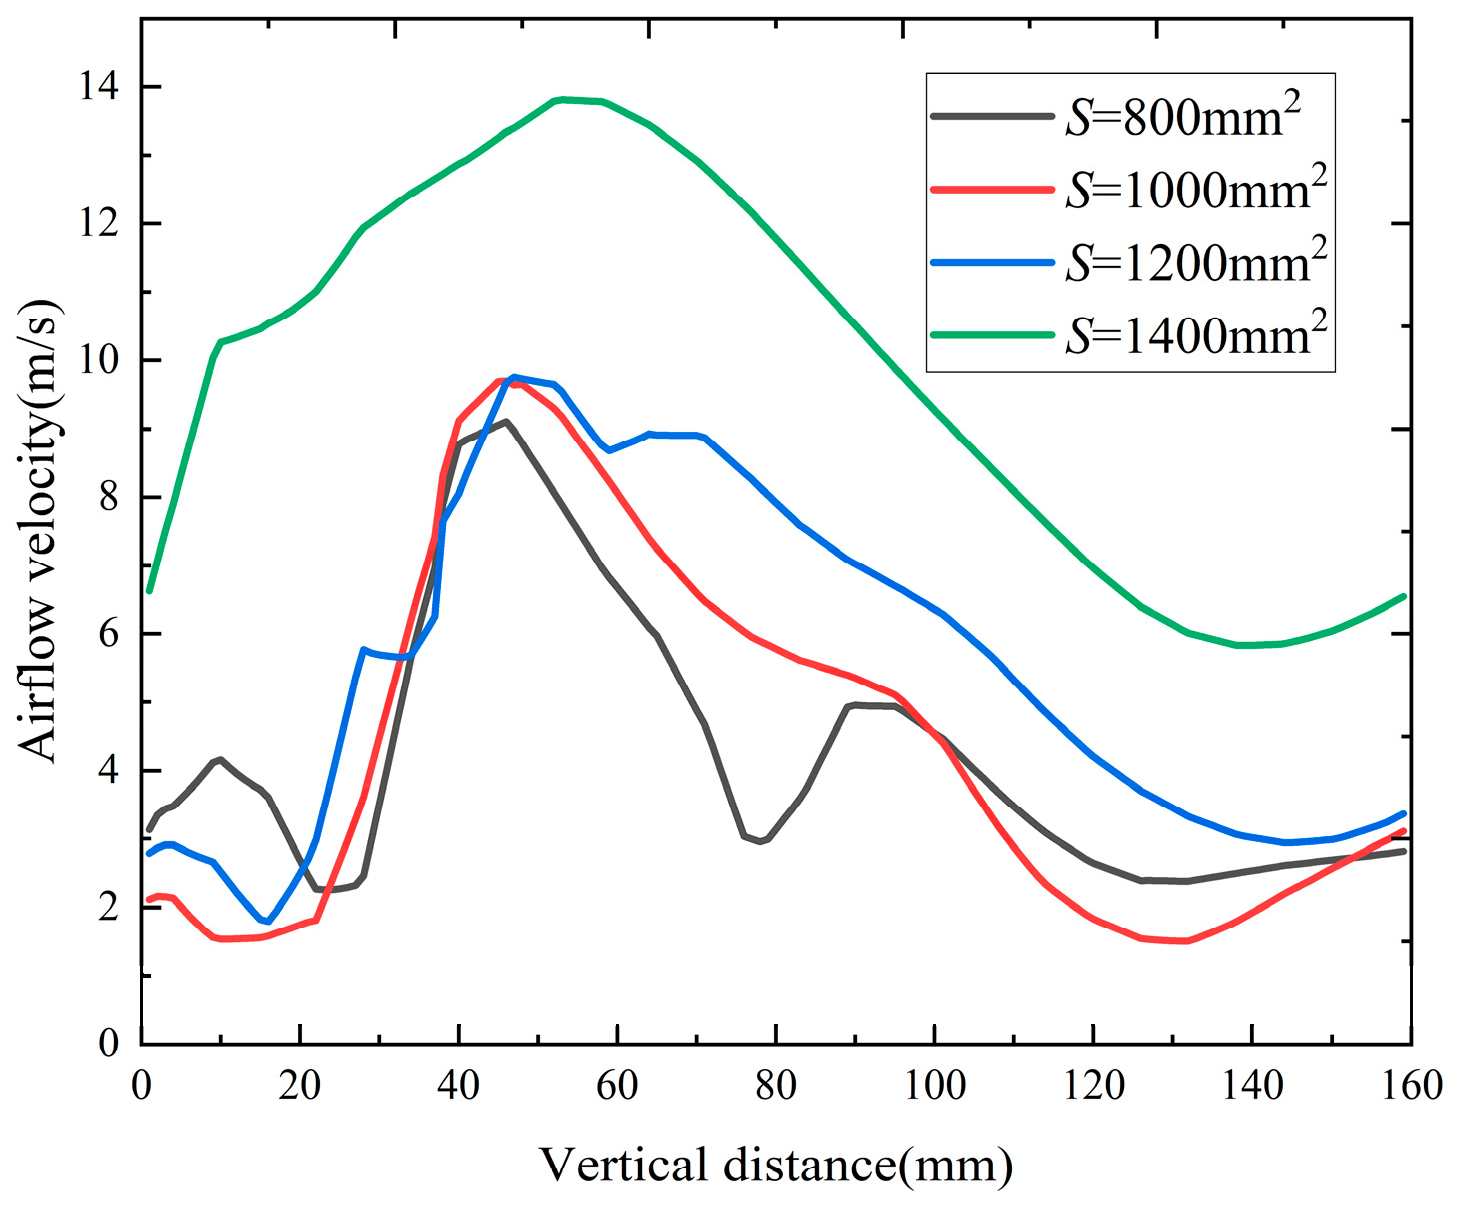
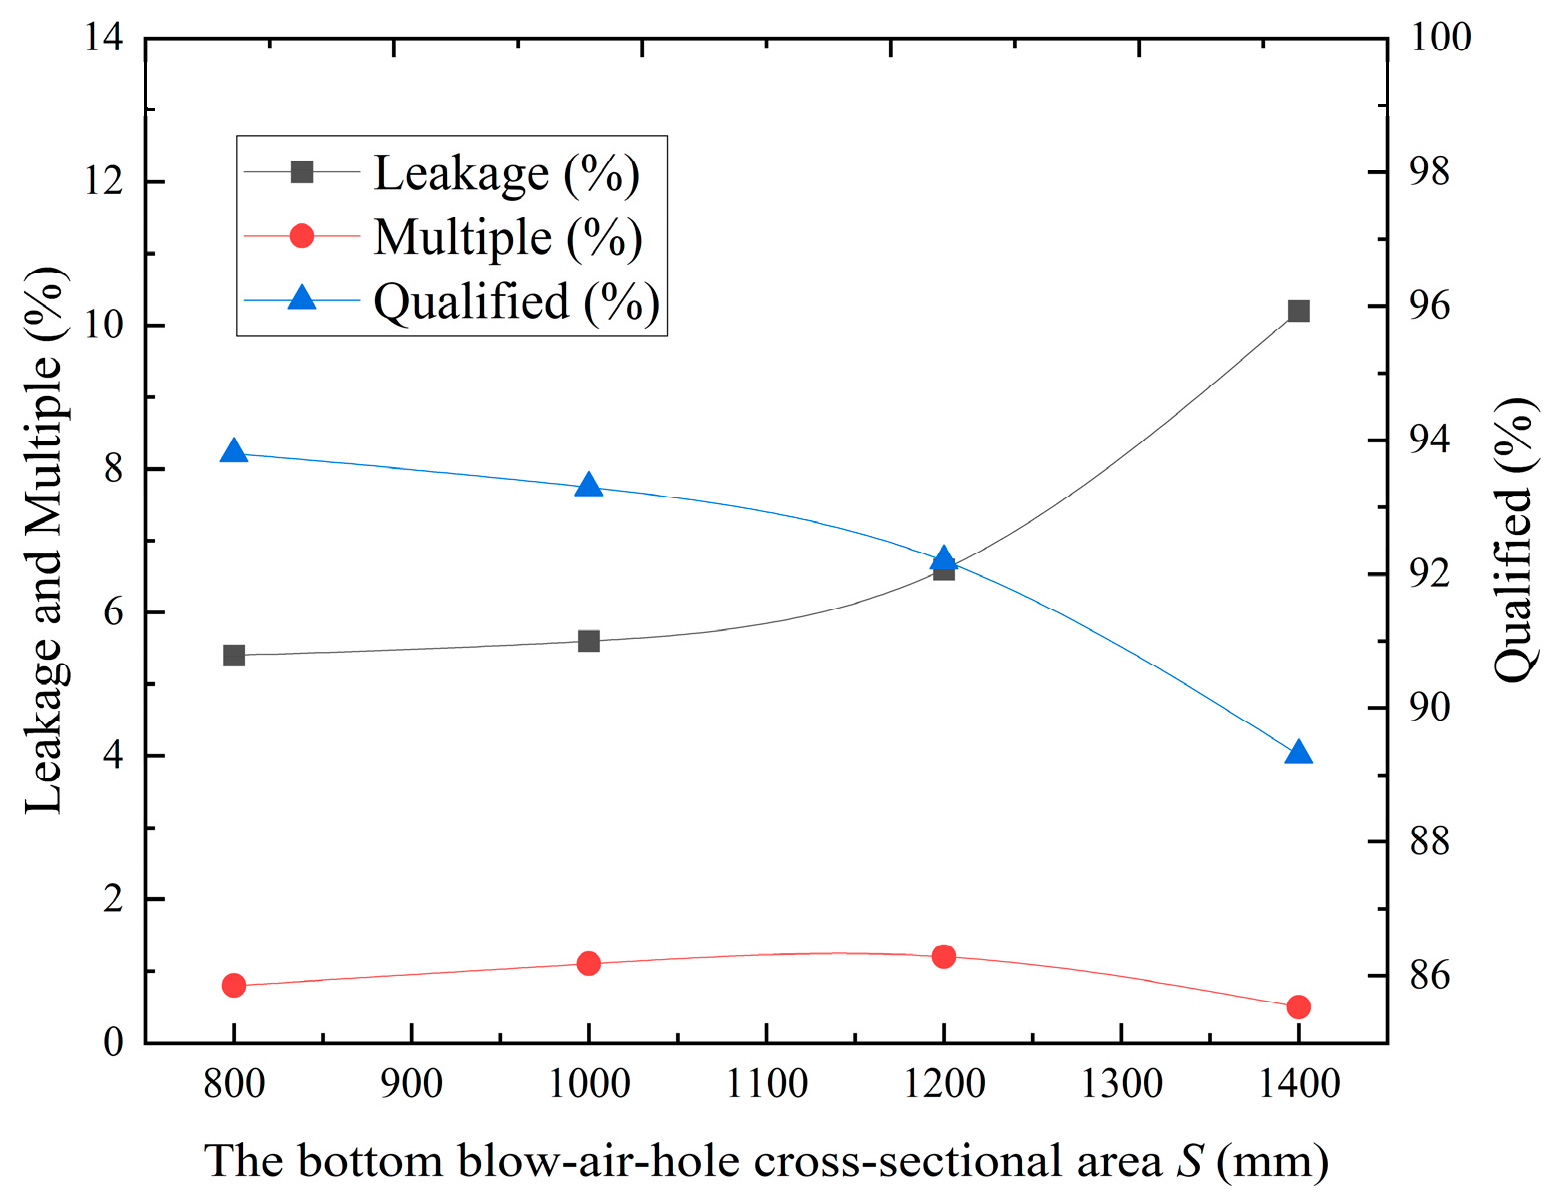
3.2.3. Single-Factor Simulation Test of the Bottom Blow-Air-Hole Cross-Sectional Area

To verify the effect of the bottom blow-air-hole cross-sectional area S of the seed-filling chamber on the performance of seed movement in the chamber, based on the above simulation, the seed-filling chamber ‘V’ angle γ was set to 55°, and the blow-air-hole airflow velocity vq was set to 10 m·s−1. A single-factor simulation test with bottom blow-air-hole cross-sectional area S values of 800 mm2, 1000 mm2, 1200 mm2, and 1400 mm2 was carried out. The effect of the bottom blowhole cross-section S of the seed-filling device on seed movement was determined by observing the velocity cloud, seed movement, and seed-filling index inside the seed-filling chamber, as shown in Figure 9.
In Figure 9a–d, it can be seen that the airflow velocity increases with the bottom blow-air-hole cross-sectional area S, and the airflow inside the seed-filling chamber also increases. For the bottom blow-air-hole cross-sectional area S of 1400 mm2, the airflow inside the seed-filling chamber is extremely large. On the graph of seed movement at the bottom of the seed-filling chamber, the seed movement inside the seed-filling chamber is clearly very intense and fills the seed chamber, which will cause the seeds to collide with the seed-metering machine shell and damage the seeds.
To better study the effect of the bottom blow-air-hole cross-sectional area S on the peanut seed perturbation performance, this study simulated and analyzed the airflow velocity at the seed perturbation position on the upper side of the blow-air-hole of the blowing structure of the auxiliary air-suction seed-filling device for different types. The location of data extraction is 0–160 mm in the vertical direction above the blowing hole of the auxiliary air-suction seed-filling device, as shown by the red line in Figure 10. In this study, the right side of the bottom of the seed-metering machine uniformly distributed blowing holes; airflow from the bottom of the blowing holes exited into the seed chamber, acting on the bottom of the peanut seed; and blowing holes on the top side in the vertical direction of the airflow velocity were affected by different types of cross-section, as shown in Figure 11. The bottom blow-air-hole cross-sectional area S significantly affected the airflow velocity inside the seed chamber of the seed-metering machine, the type IV airflow velocity was generally higher than those of the other types, and the seed inside the seed chamber was blown more. In the graph of the effect of different bottom blow-air-hole cross-sectional area S values on the airflow velocity in the vertical direction, it can be seen that different types of bottom blow-air-hole cross-sectional area S have the same trend of influence on the airflow velocity in the vertical direction, and the airflow velocity in the vertical direction increases sharply, reaching the maximum value at a height of about 40–100 mm. With the increase in vertical distance, the airflow velocity gradually decreases. Thus, the airflow out of the blowhole cross-section “V” structure ensures that the right side of the airflow moves to the upper left, so as the elevation of the spatial location of the airflow through the space becomes larger, the airflow velocity decreases.
As shown in Figure 12, when the bottom blow-air-hole cross-sectional area S is 1400 mm2, the seed-filling pass rate is lower, 89.3%. Considering the comprehensive seed-filling chamber air velocity and seed-filling chamber seed movement differences, for the bottom blow-air-hole cross-sectional area S for values of 800~1200 mm2, the effect of seed absorption is better.

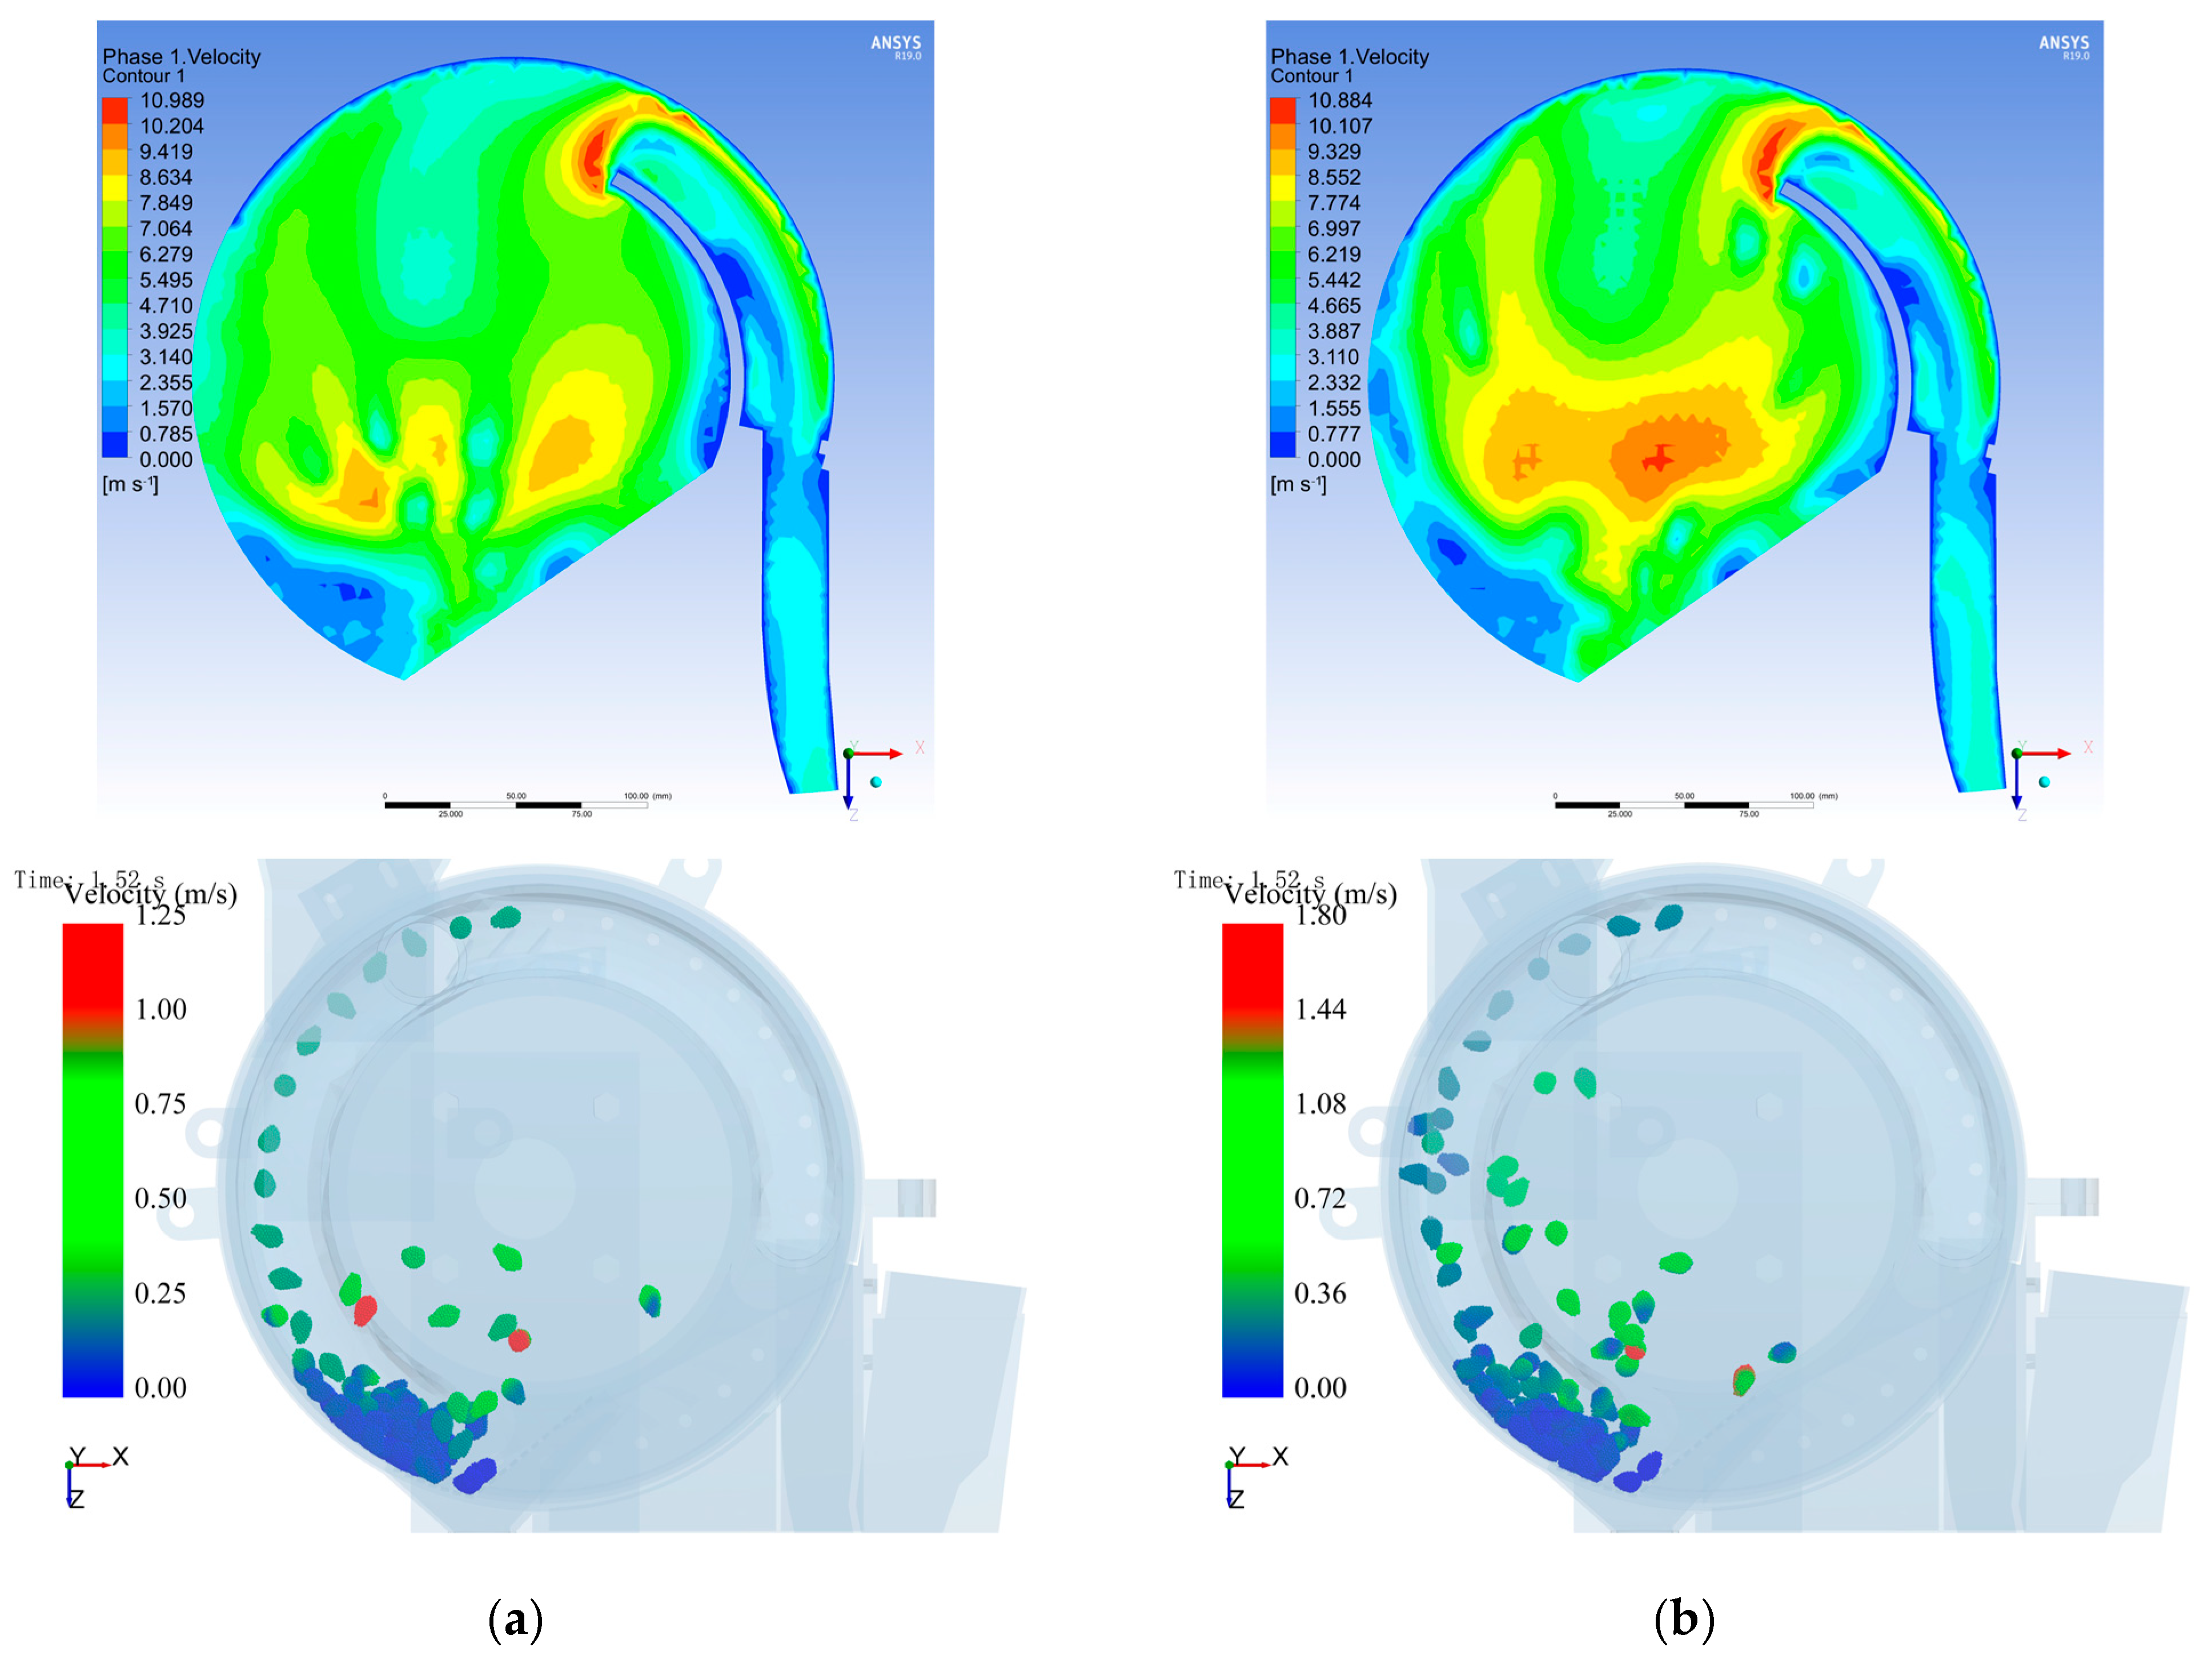
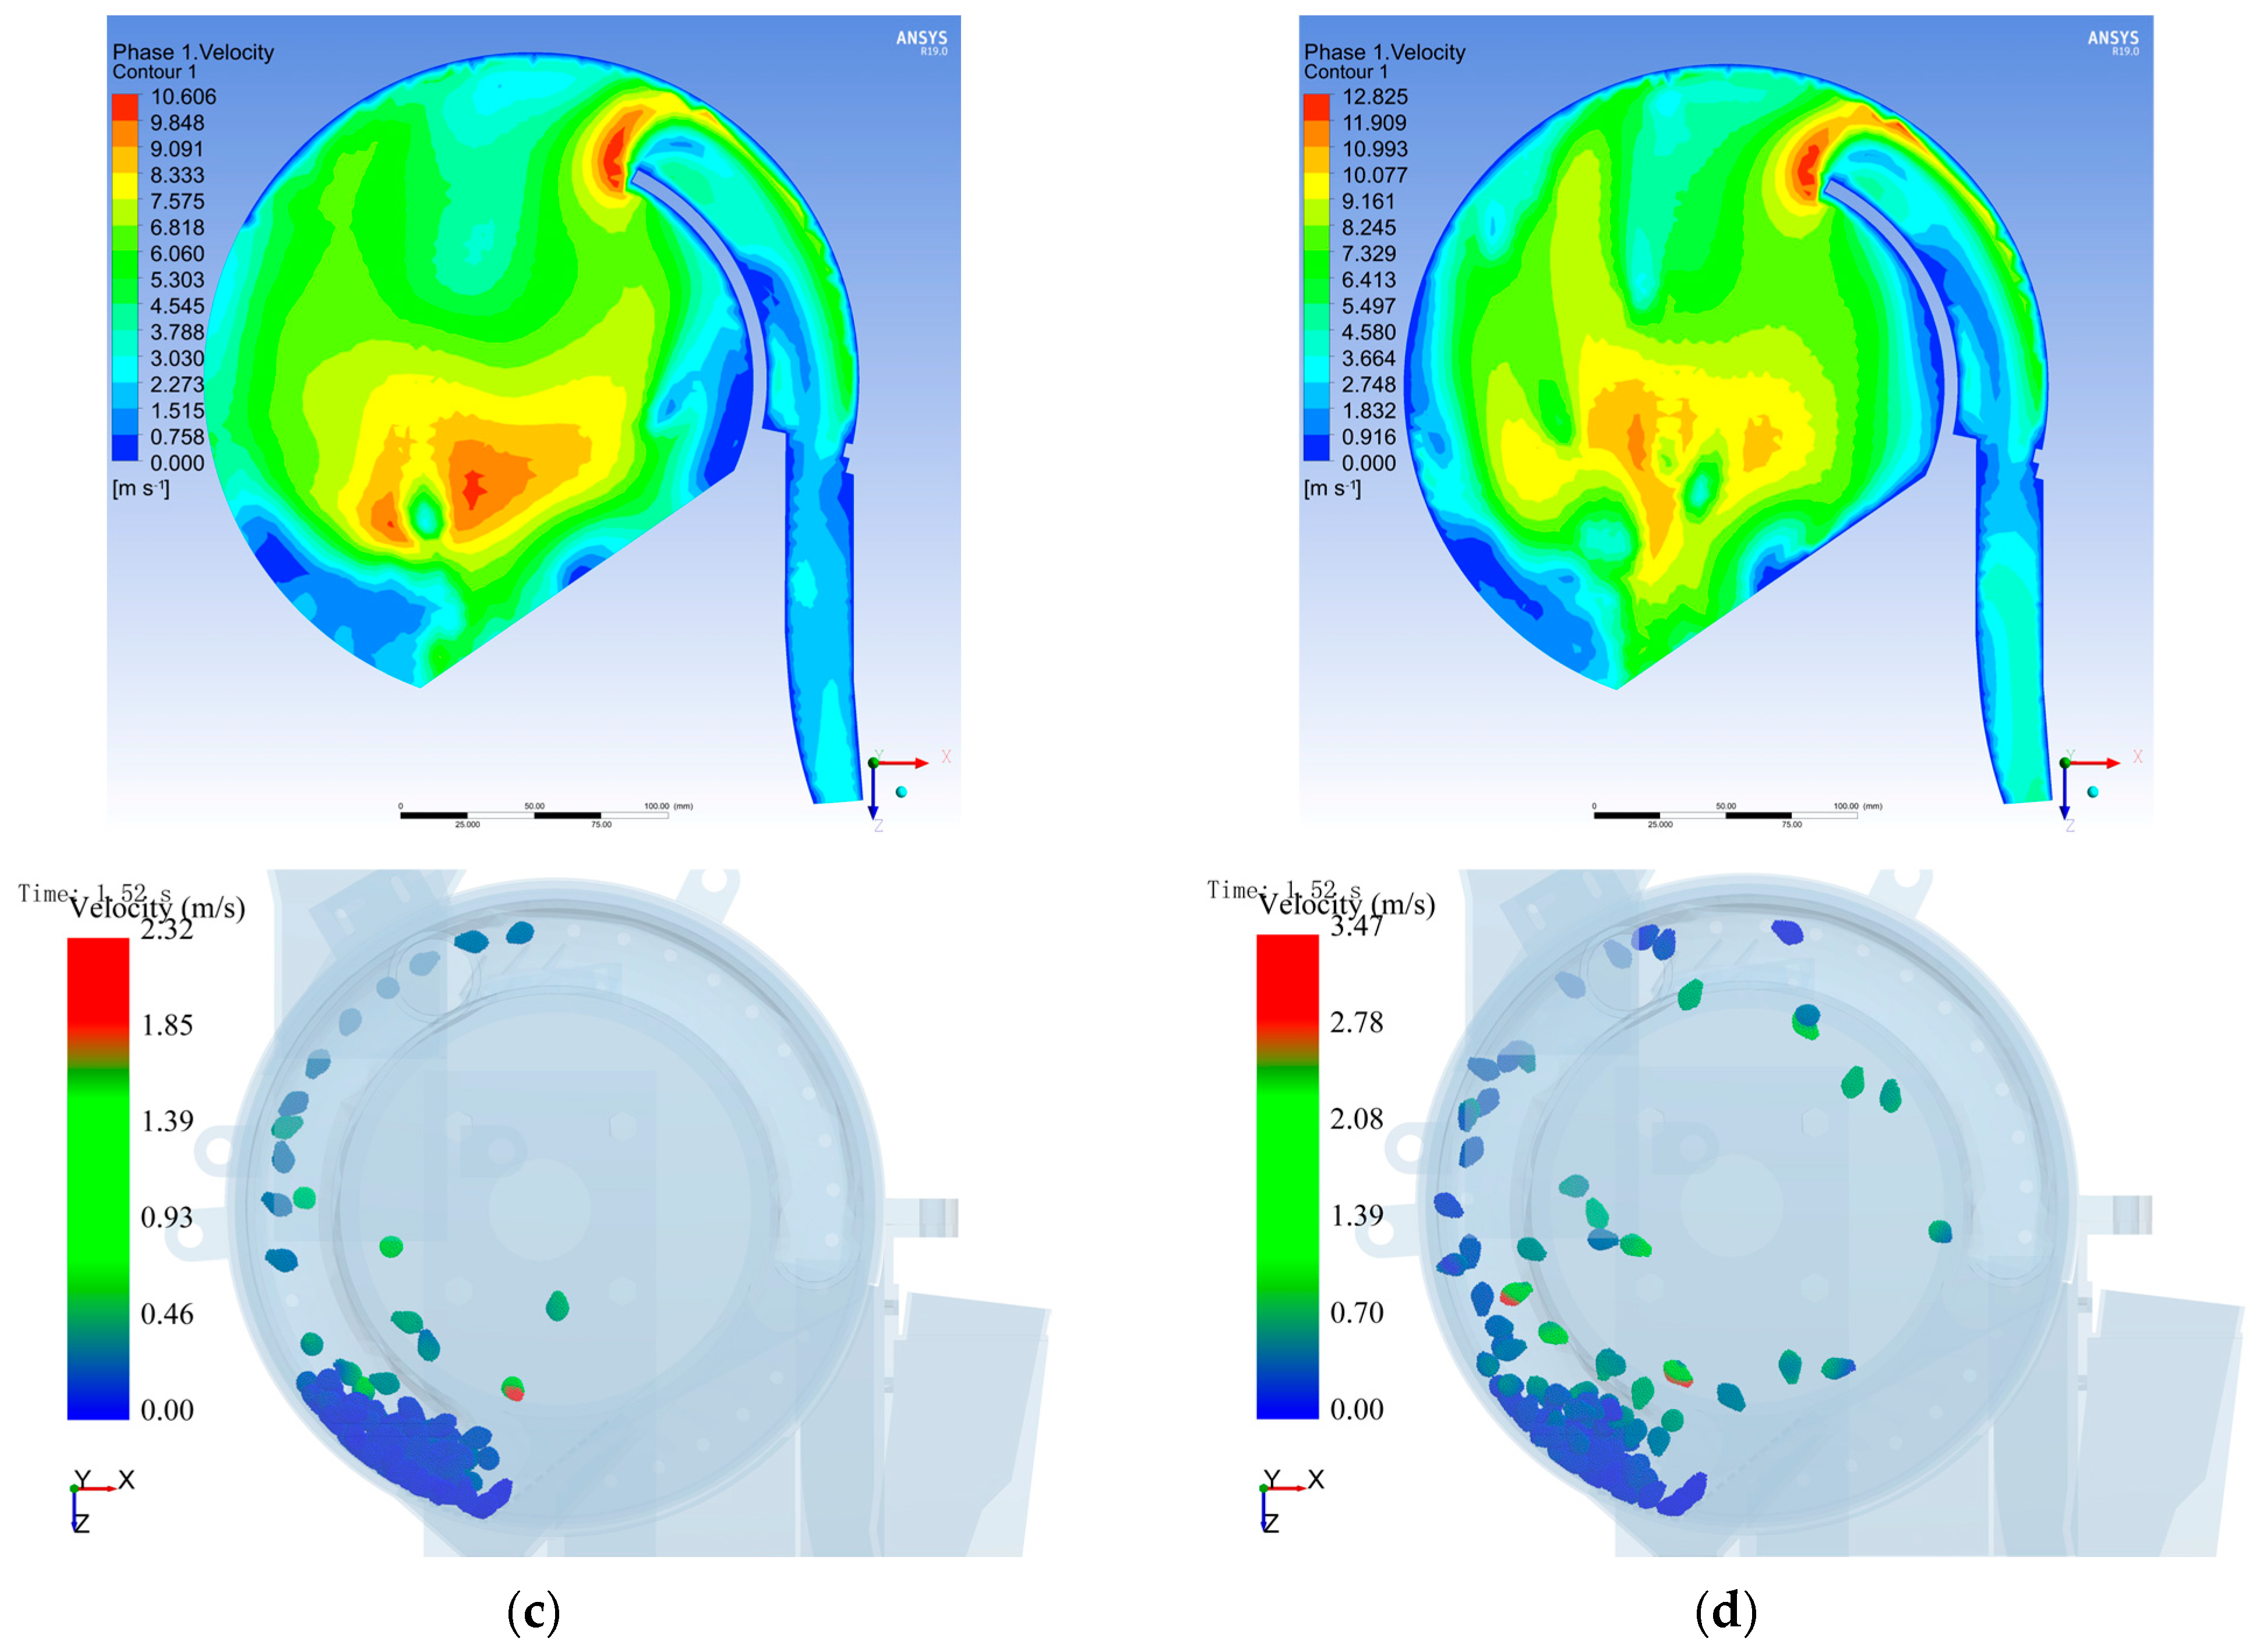
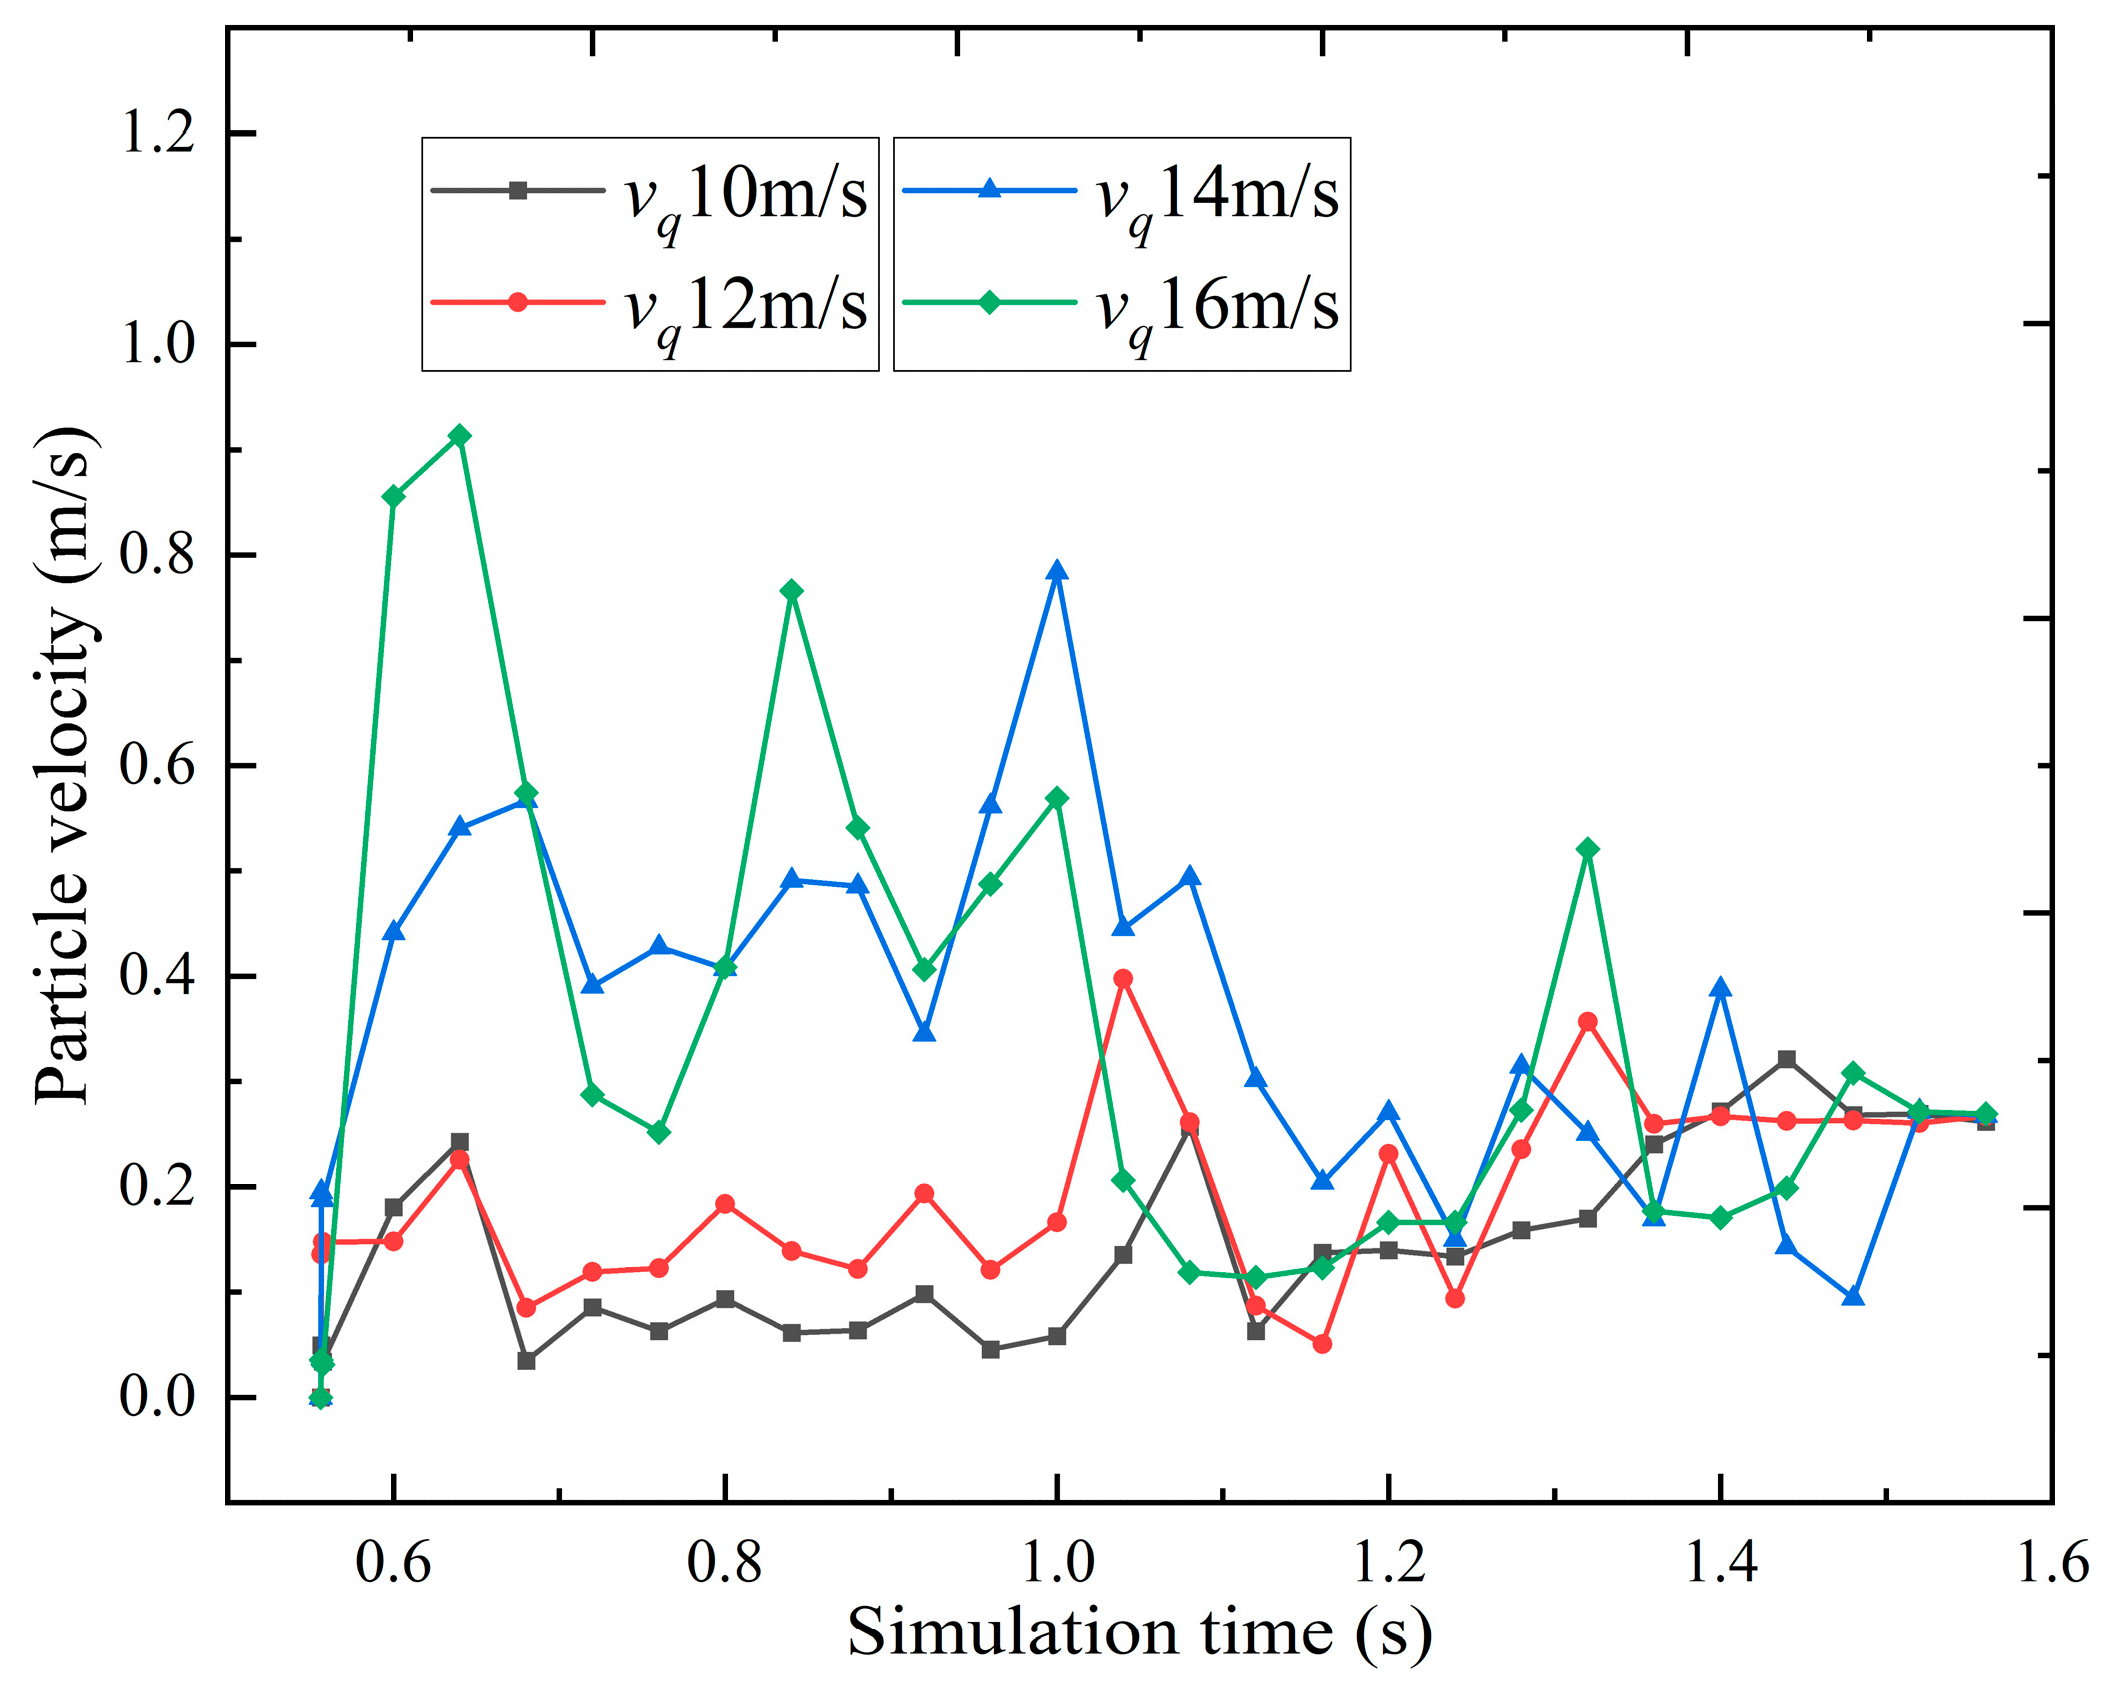
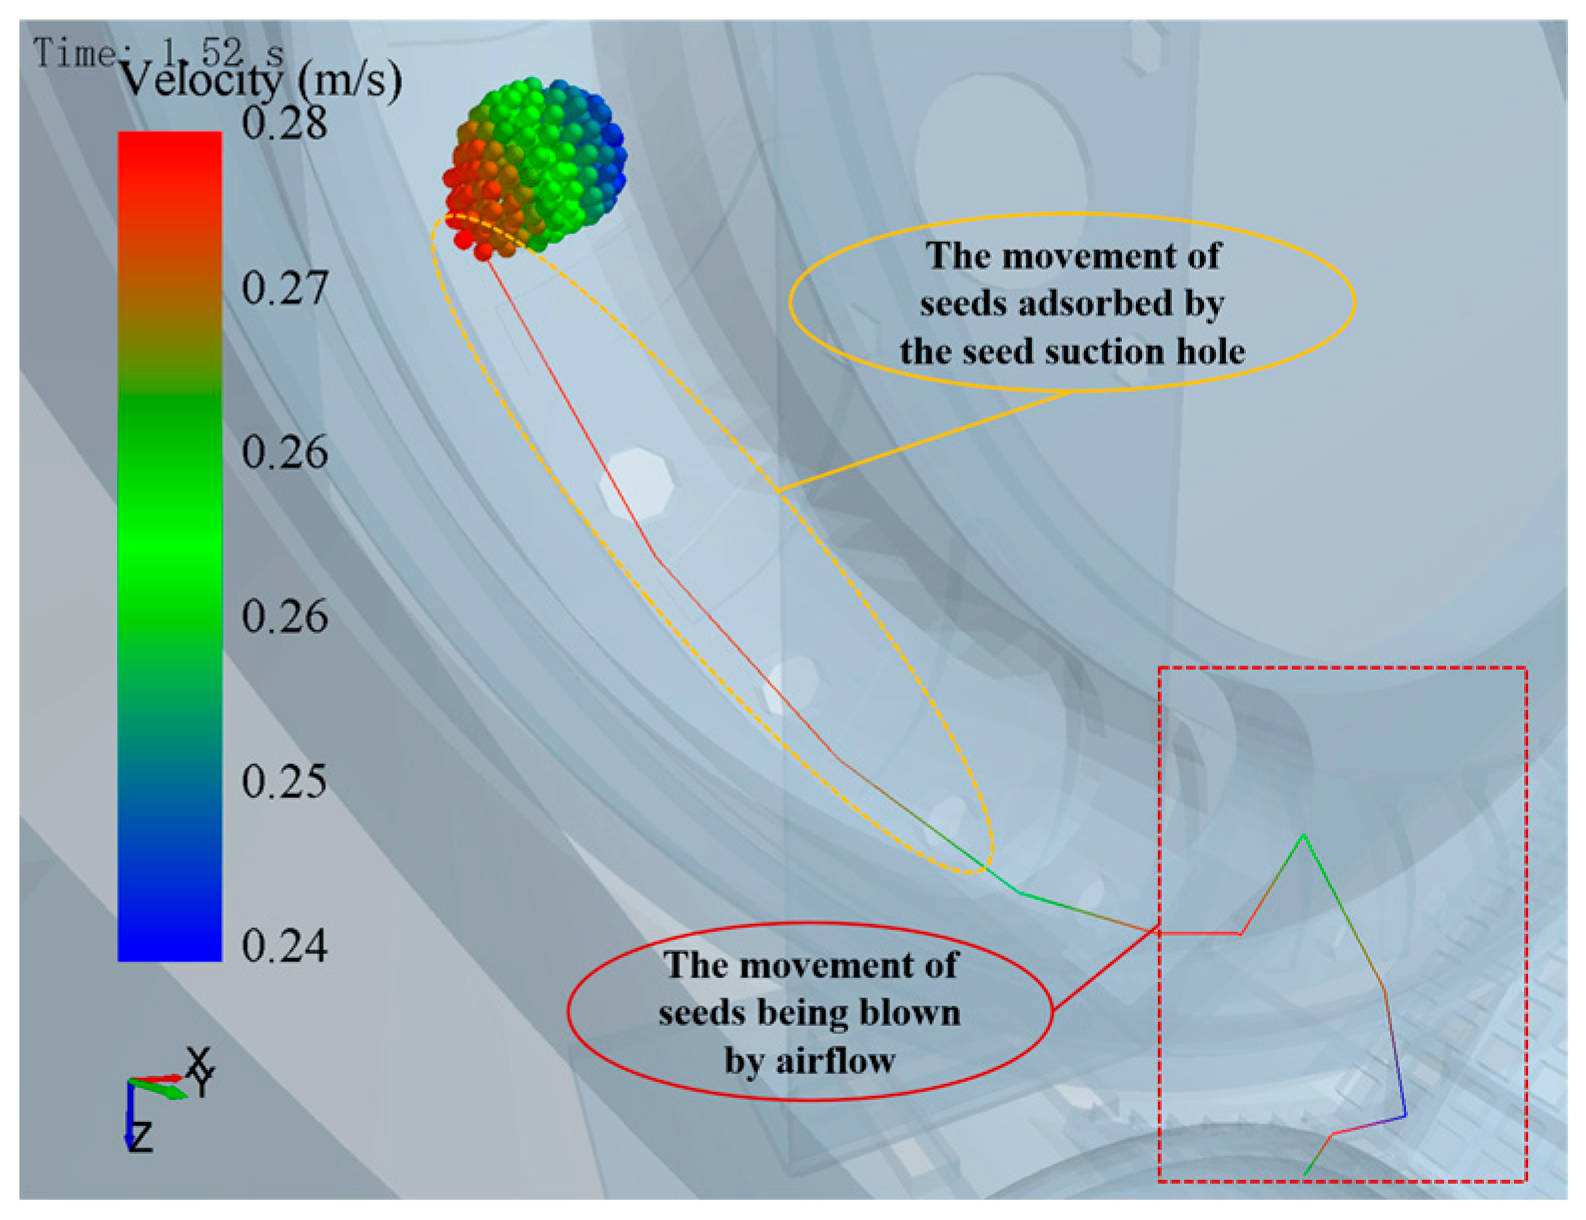
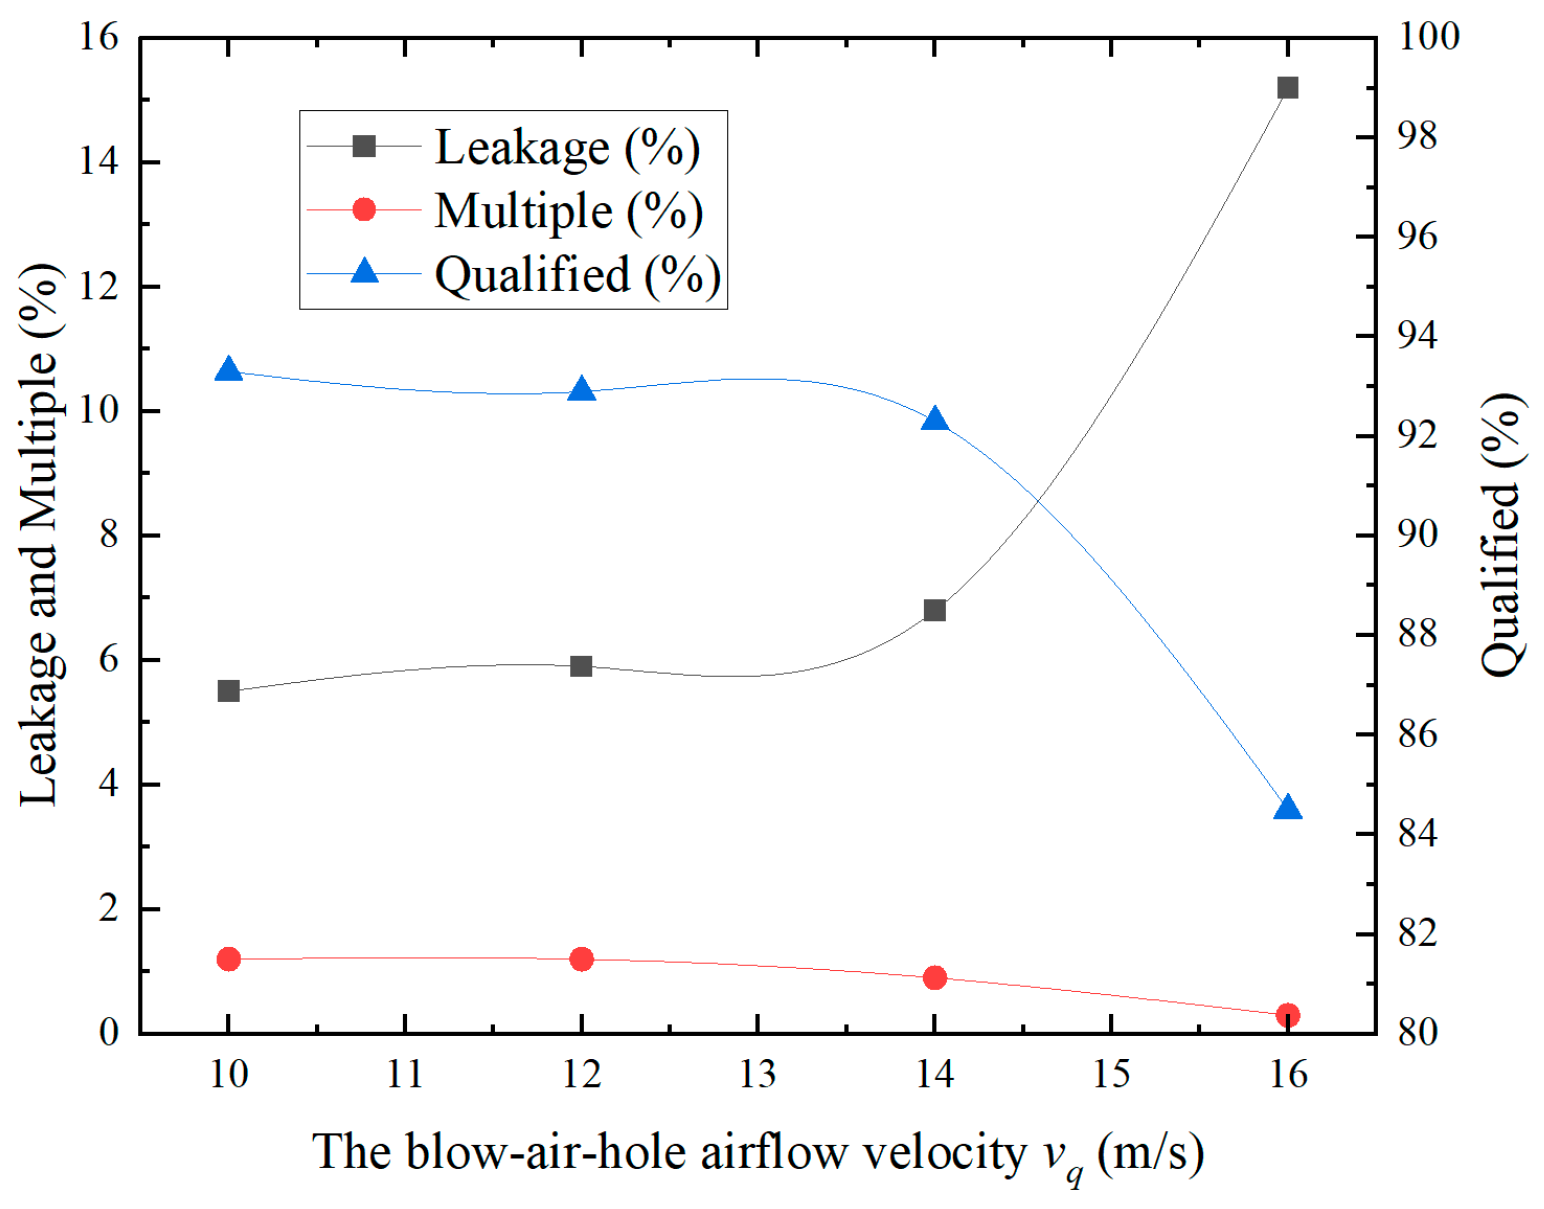
3.2.4. Single-Factor Simulation Test of the Blow-Air-Hole Airflow Velocity

To verify the effect of blow-air-hole airflow velocity vq on seed movement performance in the seed-filling chamber, based on the above simulation test, the seed-filling chamber ‘V’ angle γ was 55°, and the bottom blow-air-hole cross-sectional area S was 1200 mm2. A single-factor simulation test with blow-air-hole airflow velocity values vq of 10 m·s−1, 12 m·s−1, 14 m·s−1, and 16 m·s−1 was carried out. The effect of blow-air-hole airflow velocity vq on the seed-filling motion was determined by observing the velocity cloud inside the seed-filling chamber, as well as the seed motion, as shown in Figure 13.
As shown in Figure 13, columns (a–d) show the airflow velocity cloud diagrams in the mixing chamber and seed drop chamber and the seed particle movement diagrams under different blow-air-hole airflow velocity vq values. As the velocity cloud diagrams show, when the blow-air-hole airflow velocity vq is 16 m·s−1, the airflow velocity in the seed-filling chamber is extremely large, and the seeds gain a lot of kinetic energy and fly randomly in the filling chamber, which is less effective.
Figure 14 shows that, when the blow-air-hole airflow velocity vq is 10 m·s−1, 12 m·s−1, 14 m·s−1, or 16 m·s−1, the seed velocity absorbed by the seed sucking hole at 1.52 s is simulated. According to the figure, the greater the blowhole airflow velocity vq, the more violent the seed movement. When the blow-air-hole airflow velocity vq is in the 10–12 m·s−1 range, the seed produces a movement velocity of about 0.15 m·s−1. However, when the blow-air-hole airflow velocity vq is at 16 m·s−1, the seeds gain a larger kinetic energy and the velocity reaches 0.8 m·s−1, and the seed movement is extremely violent, verifying the above analysis. Figure 15 shows the movement trajectory of the adsorbed seed at a blow-air-hole airflow velocity vq of 12 m·s−1 at 1.52 s. The red area represents the process of the seed being blown by the airflow, and the yellow area represents the process of the seed being adsorbed by the seed suction holes with the seed-discharging disk.
Figure 16 shows the seed suction holes’ airflow velocity vq values at 10 m·s−1, 12 m·s−1, 14 m·s−1, and 16 m·s−1 for the peanut seed-metering machine seed-filling qualified index, the leakage index, and the reseeding index, and at a speed of below 14 m·s−1, the seed suction effect is better. When the speed reaches 16 m·s−1, the seed-filling qualified index is 84.5%, and the seed-metering machine’s seed absorption performance decreases greatly. Thus, it cannot meet the requirements of high-speed operation for peanuts.
In our comprehensive analysis, the final seed-filling chamber ‘V’ angle γ has a value of 50–60°, the bottom blow-air-hole cross-sectional area S has a value of 800–1200 mm2, the blow-air-hole airflow velocity vq has a value of 10–14 m·s−1, and the blow-air-hole suction peanut seed adsorption effect is better.

3.3. Response Surface Design Test Analysis

3.3.1. Test Setup

To verify the structural parameters of the seed-metering machine and the working parameters, we used gas–solid coupling simulation analysis to determine the seed-metering machine seed-filling chamber ‘V’ angle γ, the bottom blow-air-hole cross-sectional area S, and the range of seed blow-air-hole airflow velocity vq values. The seed-filling chamber ‘V’ angle γ was defined as X1, the bottom blow-air-hole cross-sectional area S was defined as X2, and the seed blow-air-hole air velocity vq was defined as X3. In order to focus on the seed suction quality of the seed suction holes, a seed suction hole qualification index is introduced. To measure the proportion of seeds not adsorbed by the seed suction holes of the seed distribution tray, a seed leakage index is introduced. Therefore, the seed-discharging disk seed suction holes’ suction qualified index was set as Y1, while the leakage index was set as Y2, to carry out a three-factor three-level test. Using Design-Expert 8.0.6 software to design the BBD test, three seed-filling chamber ‘V’ angles γ for 50°, 55°, and 60° and bottom blow-air-hole cross-sectional areas S for 800 mm2, 1000 mm2, and 1200 mm2 were fabricated using high-quality 3D printing technology. Three kinds of seed-filling devices were used to carry out BBD tests with airflow velocity vq values of 10–14 m·s−1 for the seed blowhole, and the test setup is shown in Figure 17. The rotational speed of the seed-discharging disk was 23.8 rpm, and the adsorption air pressure generated in the suction chamber was controlled at −3 kPa; the test factors and indexes are shown in Table 4, and the test results are shown in Table 5.

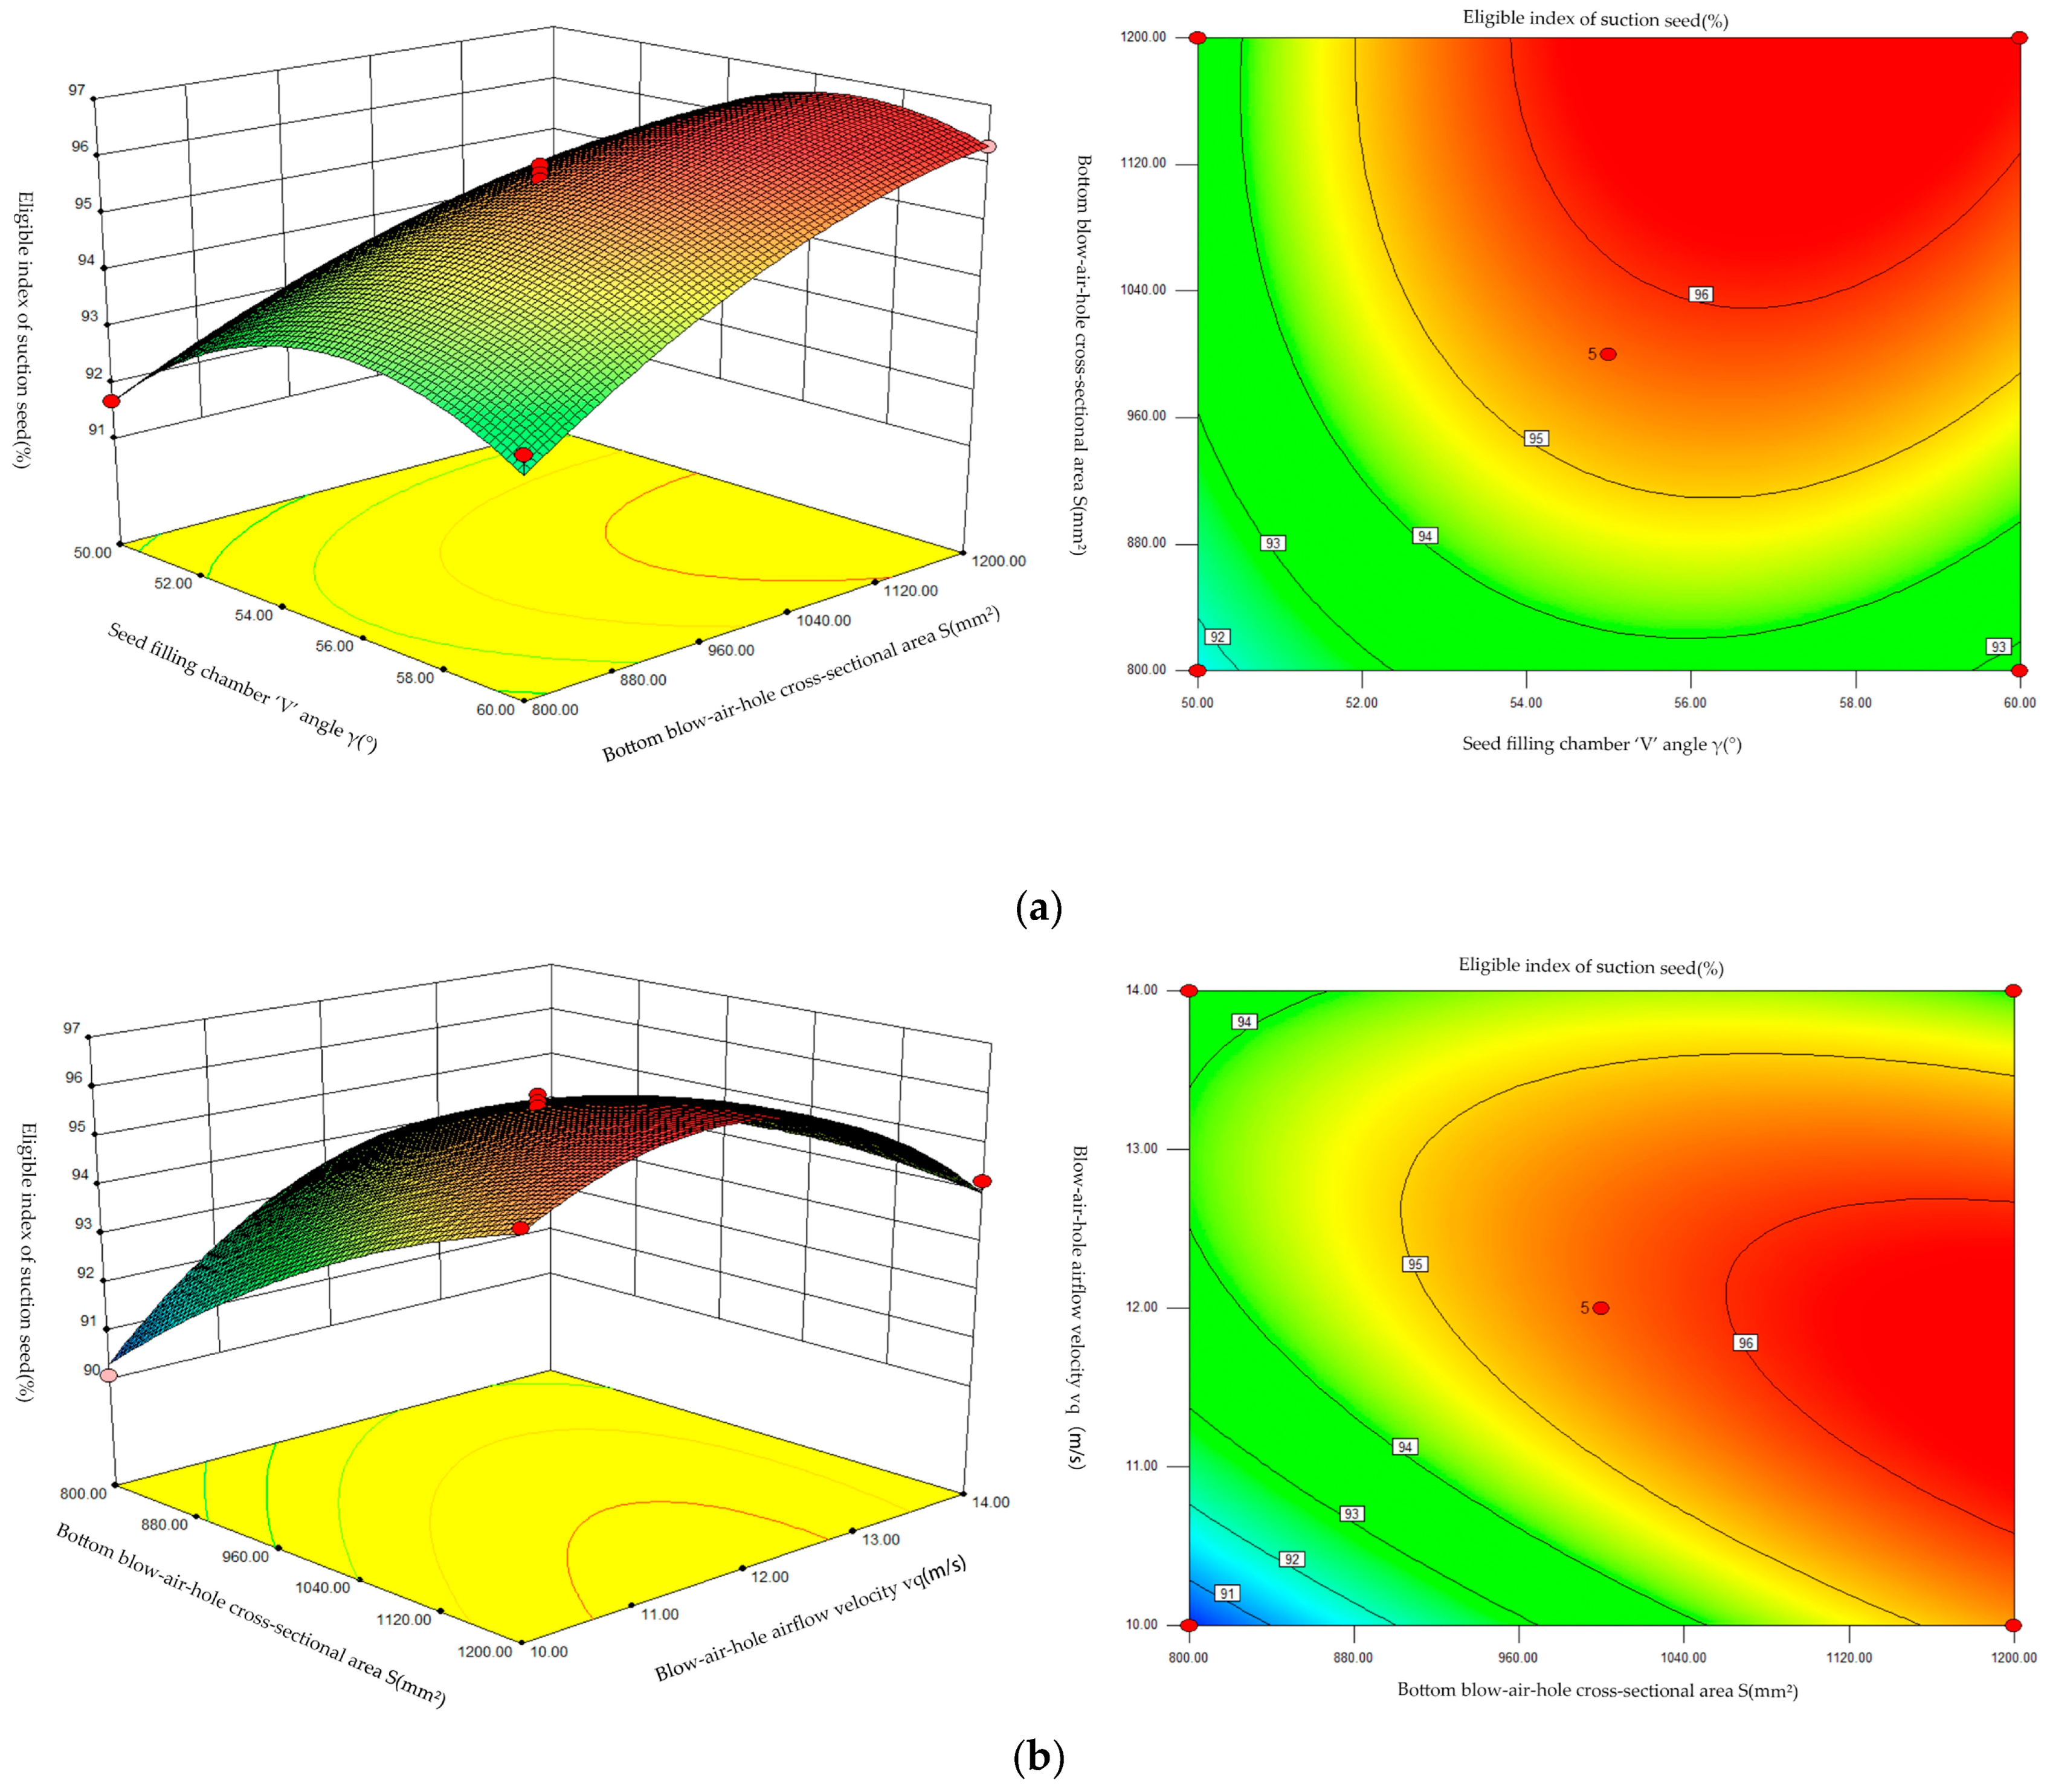
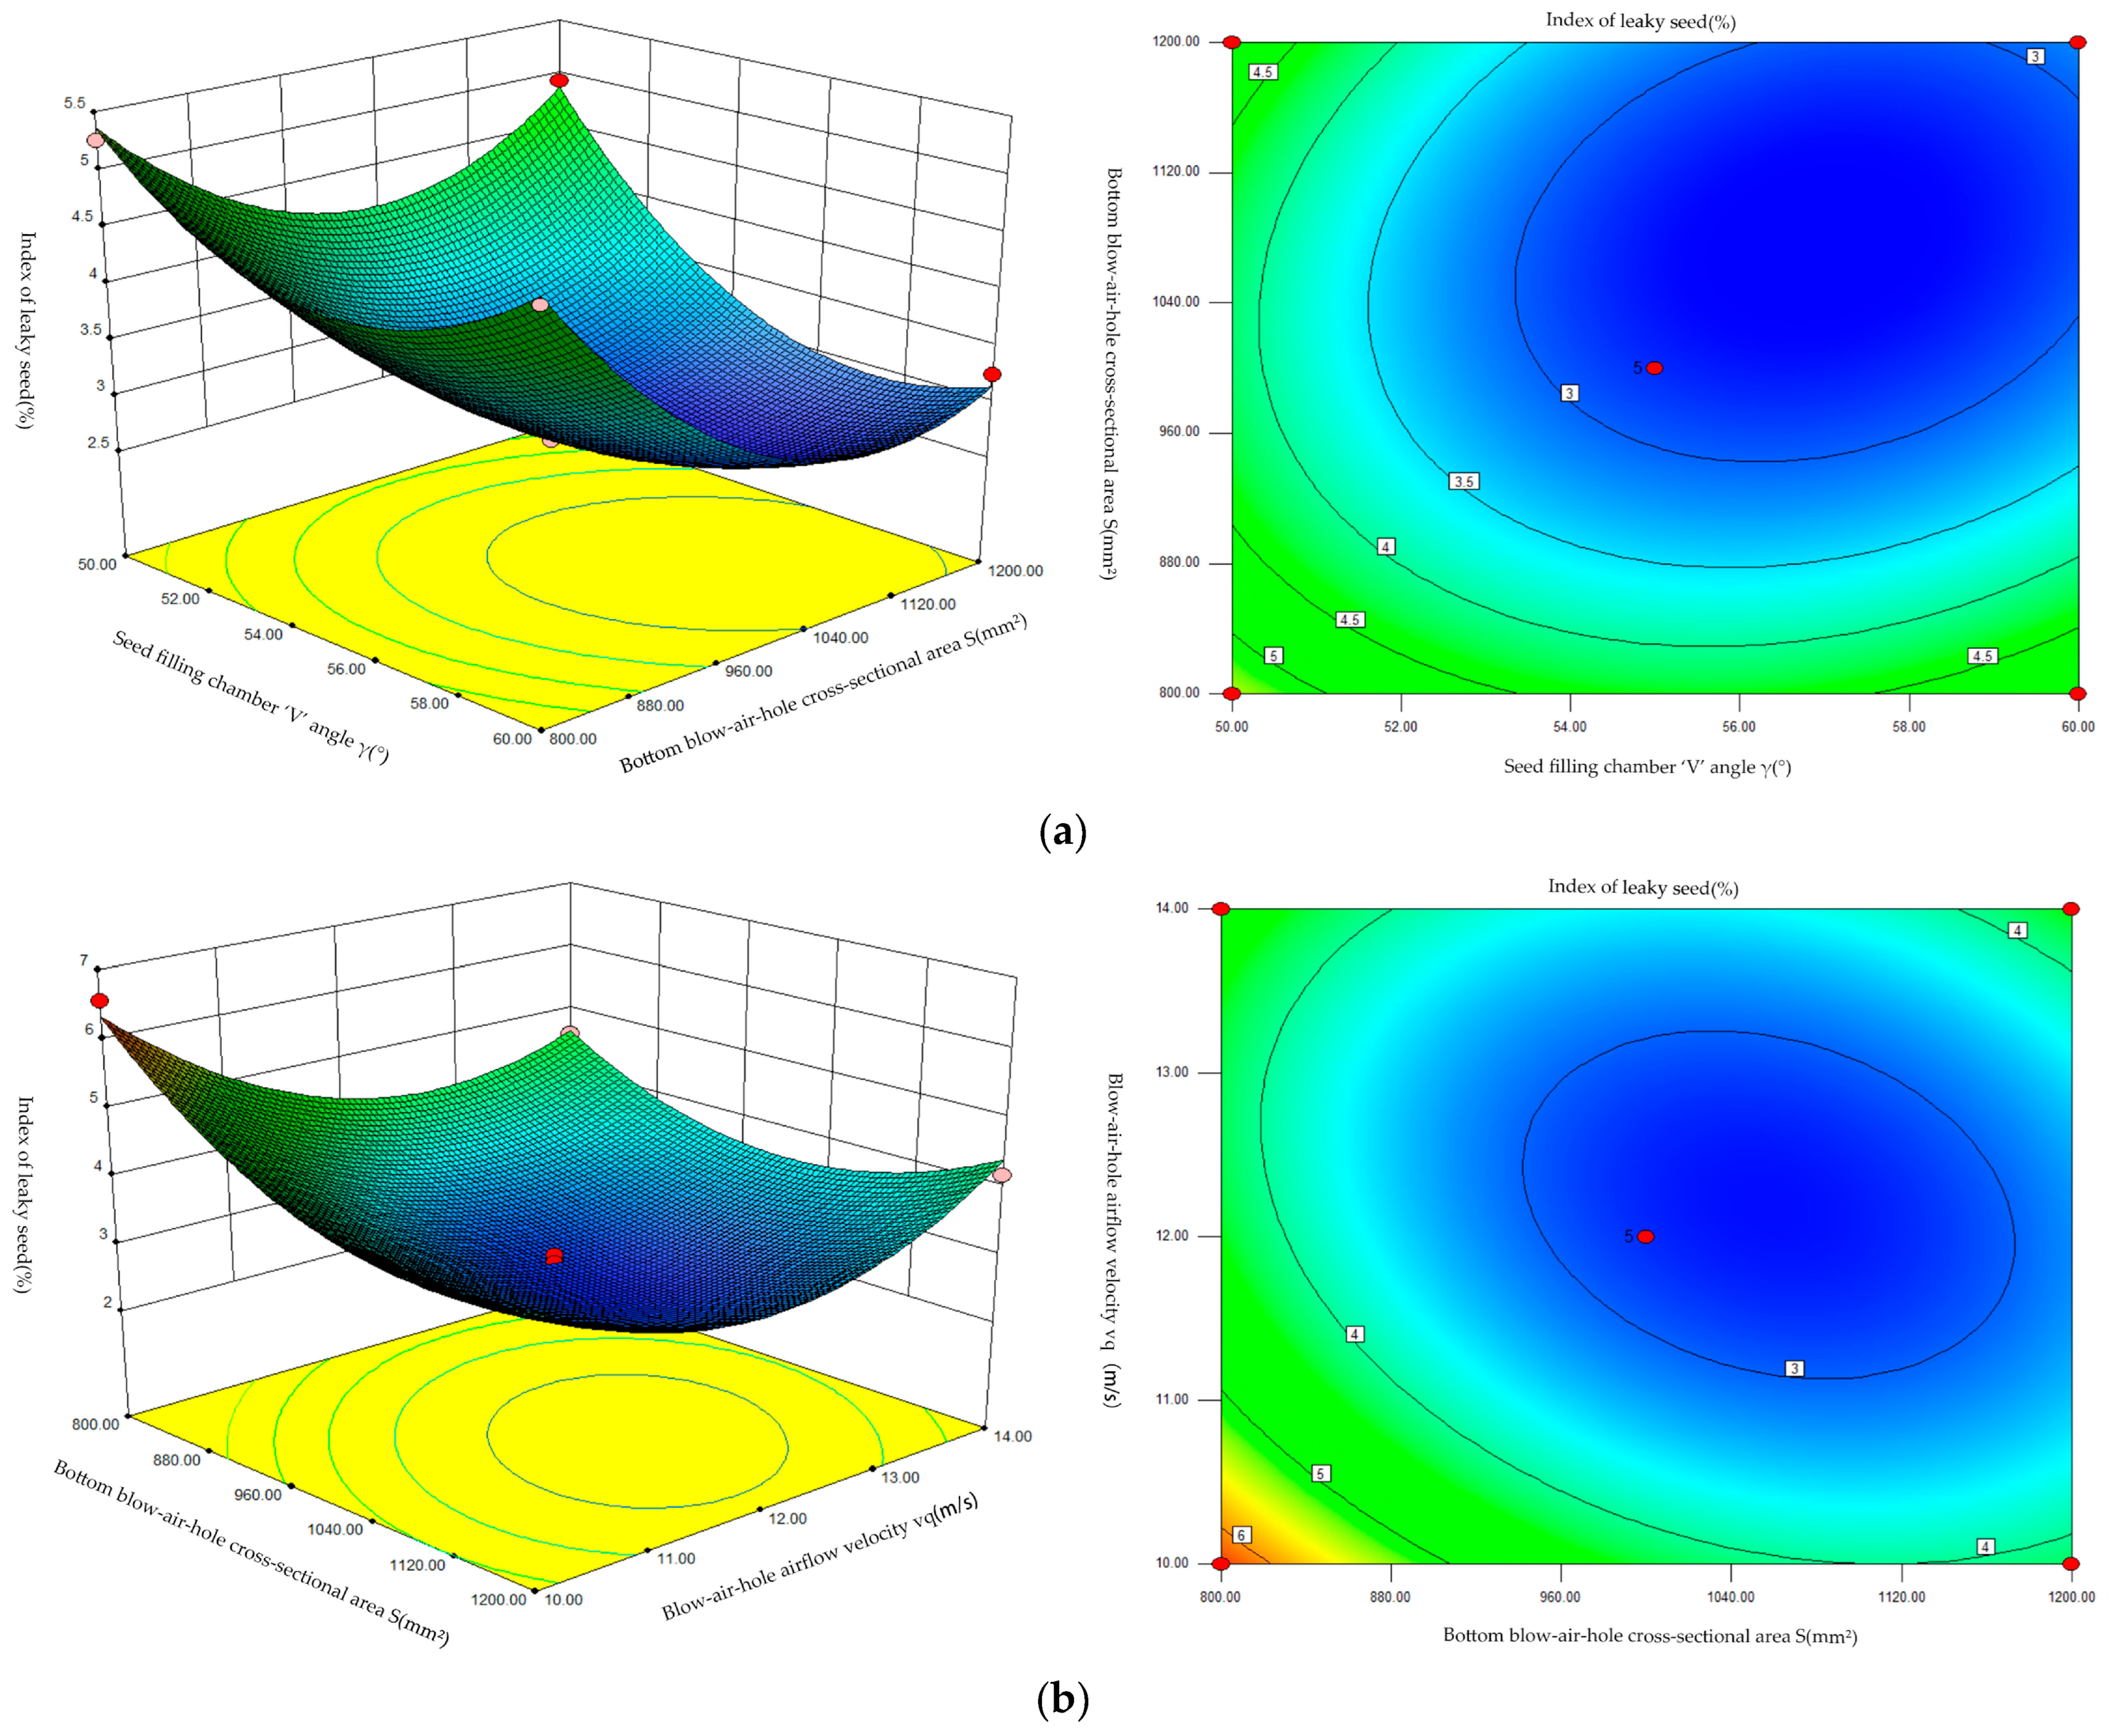
3.3.2. Analysis of Test Results

Using Design-Expert 8.0.6 software, analysis of variance (ANOVA) was used to analyze the results of the peanut seed-filling experiment with high-speed seeding via air flow. The ANOVA and significance test results of the regression model are shown in Table 6. A quadratic polynomial regression model was established to influence the suction qualification index and the leakage index of the suction hole of the seed tray. The regression equation is shown as follows:
Y 1 = 95.64 + 0.96 X 1 + 1.36 X 2 + 0.50 X 3 + 0.42 X 1 X 2 0.095 X 1 X 3 1.16 X 2 X 3 1.49 X 1 2 0.59 X 2 2 1.74 X 3 2
Y 2 = 2.8 0.51 X 1 0.6 X 2 0.36 X 3 0.35 X 1 X 2 1.6 X 1 X 3 + 0.47 X 2 X 3 + 0.84 X 1 2 + 0.96 X 2 2 + 1.14 X 3 2
As can be seen from Table 6, the model validation results show that the model R2 values are 0.9851 and 0.9875, respectively, and the Adj R2 values are 0.9659 and 0.9715, respectively, indicating that the model has a high degree of fit with the experimental data and can effectively reflect the relationship between the parameters and the response values. The p-values of the suction qualification index model and the leakage qualification index model are extremely significant (p < 0.01), while the p-value of the misfit term of the two is >0.05, indicating that the experimental design is reasonable and that the experimental fit is better and can be used for experimental testing and analysis.
Table 6 shows that the seed-filling chamber ‘V’ angle γ of X1, the bottom blow-air-hole cross-sectional area S of X2, the blow-air-hole airflow velocity vq of X3, and the interaction terms X2X3, X12, and X32 are all less than 0.01, indicating that these factors have extremely significant effects on the eligible index of suction seed, and the interaction terms X1X2 and X22 are < 0.05. The results show that this factor significantly affected the eligible index of suction seed, and the interaction term X1X3 > 0.05 indicates that this factor had no significant effect on the eligible index of suction. The index of leaky seed shows that the seed-filling chamber ‘V’ angle γ X1, the bottom blow-air-hole cross-sectional area S X2, the blow-air-hole airflow velocity vq X3, and the interaction terms X1X2, X2X3, X12, X22, and X32 were all less than 0.01, indicating that these factors extremely significantly affected the index of leaky seed and the interaction terms X1X3 > 0.05. The results show that this factor had no significant effect on the index of leaky seed. Furthermore, we removed the non-significant regression terms to ensure that the regression equation model was significant and re-fitted the regression equation of the eligible index of suction seed and the index of leaky seed using the following equations:
Y 1 = 95.64 + 0.96 X 1 + 1.36 X 2 + 0.50 X 3 + 0.42 X 1 X 2 1.16 X 2 X 3 1.49 X 1 2 0.59 X 2 2 1.74 X 3 2
Y 2 = 2.8 0.51 X 1 0.6 X 2 0.36 X 3 0.35 X 1 X 2 + 0.47 X 2 X 3 + 0.84 X 1 2 + 0.96 X 2 2 + 1.14 X 3 2
By analyzing the above regression coefficient, we can see that the main and secondary factors affecting the eligible index of suction seed and the index of leaky seed are the same, and their order is as follows: the bottom blow-air-hole cross-sectional area S, the seed-filling chamber ‘V’ angle γ, and the blow-air-hole airflow velocity vq.
Further, the interaction between the seed-filling chamber ‘V’ angle γ, the bottom blow-air-hole cross-sectional area S, and the blow-air-hole airflow velocity vq was analyzed. The response surface analysis focused on the interaction terms with significant influence, as shown in Figure 18 and Figure 19.
Figure 18a shows the interaction response surface diagram for the effect of the seed-filling chamber ‘V’ angle γ and the bottom blow-air-hole cross-sectional area S of the eligible index of suction seed when the blow-air-hole airflow velocity vq is 12 m·s−1. Figure 18a shows that the eligible index of suction seed gradually increases first and then slightly decreases with the increase in the seed-filling chamber ‘V’ angle γ. With the increase in the section S of the bottom blowhole, the seed-filling chamber ‘V’ angle γ is 55–59°, and the bottom blow-air-hole cross-sectional area S is 1050–1200 mm2. Figure 18b shows the response surface diagram for the interaction between the bottom blow-air-hole cross-sectional area S and the blow-air-hole airflow velocity vq affecting the eligible index of suction seed d when the seed-filling chamber ‘V’ angle γ is 55°. Among them, the eligible index of suction seed gradually increases with the increase in the bottom blow-air-hole cross-sectional area S, and the blow-air-hole airflow velocity vq increases. The eligible index of suction seed increases slightly and then decreases gradually. The eligible index of suction seed is better when the bottom blow-air-hole cross-sectional area S is 1120–1200 mm2 and the blow-air-hole airflow velocity vq is 12 m·s−1.
Figure 19a shows the response surface diagram for the interaction between the seed-filling chamber ‘V’ angle γ and the bottom blow-air-hole cross-sectional area S affecting the index of leaky seed when the blow-air-hole airflow velocity vq is 12 m·s−1. Figure 19a shows that the index of leaky seed decreases first and then increases as the seed-filling chamber ‘V’ angle γ increases. The increase in the bottom blow-air-hole cross-sectional area S shows a trend of decreasing and then slightly increasing when the seed-filling chamber ‘V’ angle γ is 54–60° and the bottom blow-air-hole cross-sectional area S is 1000–1160 mm2. Figure 19b shows the response surface diagram of the interaction between the bottom blow-air-hole cross-sectional area S and the blow-air-hole airflow velocity vq affecting the index of leaky seed when the seed-filling chamber ‘V’ angle γ is 55°. Among them, the index of leaky seed decreases first and then gradually increases with the increase in the bottom blow-air-hole cross-sectional area S, and it increases with the blow-air-hole airflow velocity vq. The index of leaky seed decreases slightly and then gradually increases. There is a better index of leaky seed when the bottom blow-air-hole cross-sectional area S is 1040 mm2 and the blow-air-hole airflow velocity vq is 12 m·s−1.
The above diagrams show that the factors and their interactions greatly influence peanut airflow disturbance re-entry. To obtain the best structural parameters and operating parameters for peanut airflow disturbance filling, it is necessary to optimize the reasonable matching degree among the parameters of the seed-filling chamber ‘V’ angle γ, the bottom blow-air-hole cross-sectional area S, and the blow-air-hole airflow velocity vq. Thus, optimal seed-filling performance for airflow disturbance is achieved.
According to the requirements of JB/T 10293-2013 “Specifications for single seed drills (precision drills)” [42], a parametric mathematical model was established to optimize the solution with the objective function and constraint conditions as follows:
Y 1 max ( X 1 , X 2 , X 3 ) Y 2 min ( X 1 , X 2 , X 3 )
s . t . Y 1 max 75 % Y 2 min 10 % 50 ° X 1 60 ° 800   mm 2 X 2 1200   mm 2 10   m / s X 3 14   m / s
The result optimization module of Design-Expert 8.0.6 software was used to optimize and solve the target, and the following optimal parameters were obtained: the seed-filling chamber ‘V’ angle γ was 56.59°, the bottom blow-air-hole cross-sectional area S was 1088.4 mm2, and the blow-air-hole airflow velocity vq was 12.11 m·s−1. In this case, the airflow-assisted blowing of peanut seeds has the best eligible index of suction seed and index of leaky seed, that is, the eligible index of suction seed and the index of leaky seed were 96.33% and 2.59%, respectively. Thus, it could realize the effective filling of peanut seed.

3.4. Confirmatory Experiment

To obtain the relationship between the seed discharge performance of the seed-metering machine and operating speed (6–10 km·h−1), as well as to verify the reasonableness of the optimal combination of the parameters of the seed-metering machine, a model of the seed-filling chamber ‘V’ angle γ of 56.59° and the bottom blow-air-hole cross-sectional area S of 1088.4 mm2 was produced using 3D printing technology. It was mounted on a peanut planter for field trials, as shown in Figure 20. The experimental setup included machine forward speeds of 6 km·h−1, 8 km·h−1, and 10 km·h−1; a negative vacuum of −3.0 kPa; a ridge spacing of 200 mm; and a blowhole airflow velocity vq of 12.11 m·s−1. The white sand peanut variety was selected for the experiment, and data on the seed suction holes on 251 seed-discharging disks were collected. The experiment was repeated three times to obtain the average value, and the experimental data are shown in Table 7.
As can be seen from the data in Table 7, under conditions without airflow-assisted seed-filling, the seed discharge performance is significantly lower than that under conditions with airflow-assisted seed-filling. Additionally, at a sowing operation speed of 10 km·h−1, the eligible index of suction seed and the index of leaky seed of the peanut seed-discharging disk are in line with the requirements for peanut operation. However, there is a certain difference between the measured value and the above predicted value, but the difference is relatively small, and the actual measured value closely corresponds to the predicted value, confirming the reliability of the regression model.

4. Conclusions

In this study, to overcome prominent problems such as the poor filling effect of peanut seeds with heavy weights and large particle sizes, an auxiliary air-suction seed-filling device for a pneumatic-assisted precise peanut seed-metering machine was designed. By improving the disturbance filling structure of the seed-metering machine, the disturbance movement of peanut seeds in the seed-filling chamber was realized to improve the seed-filling performance of the seed-metering machine. During this experiment, the following conclusions were drawn:
(a)
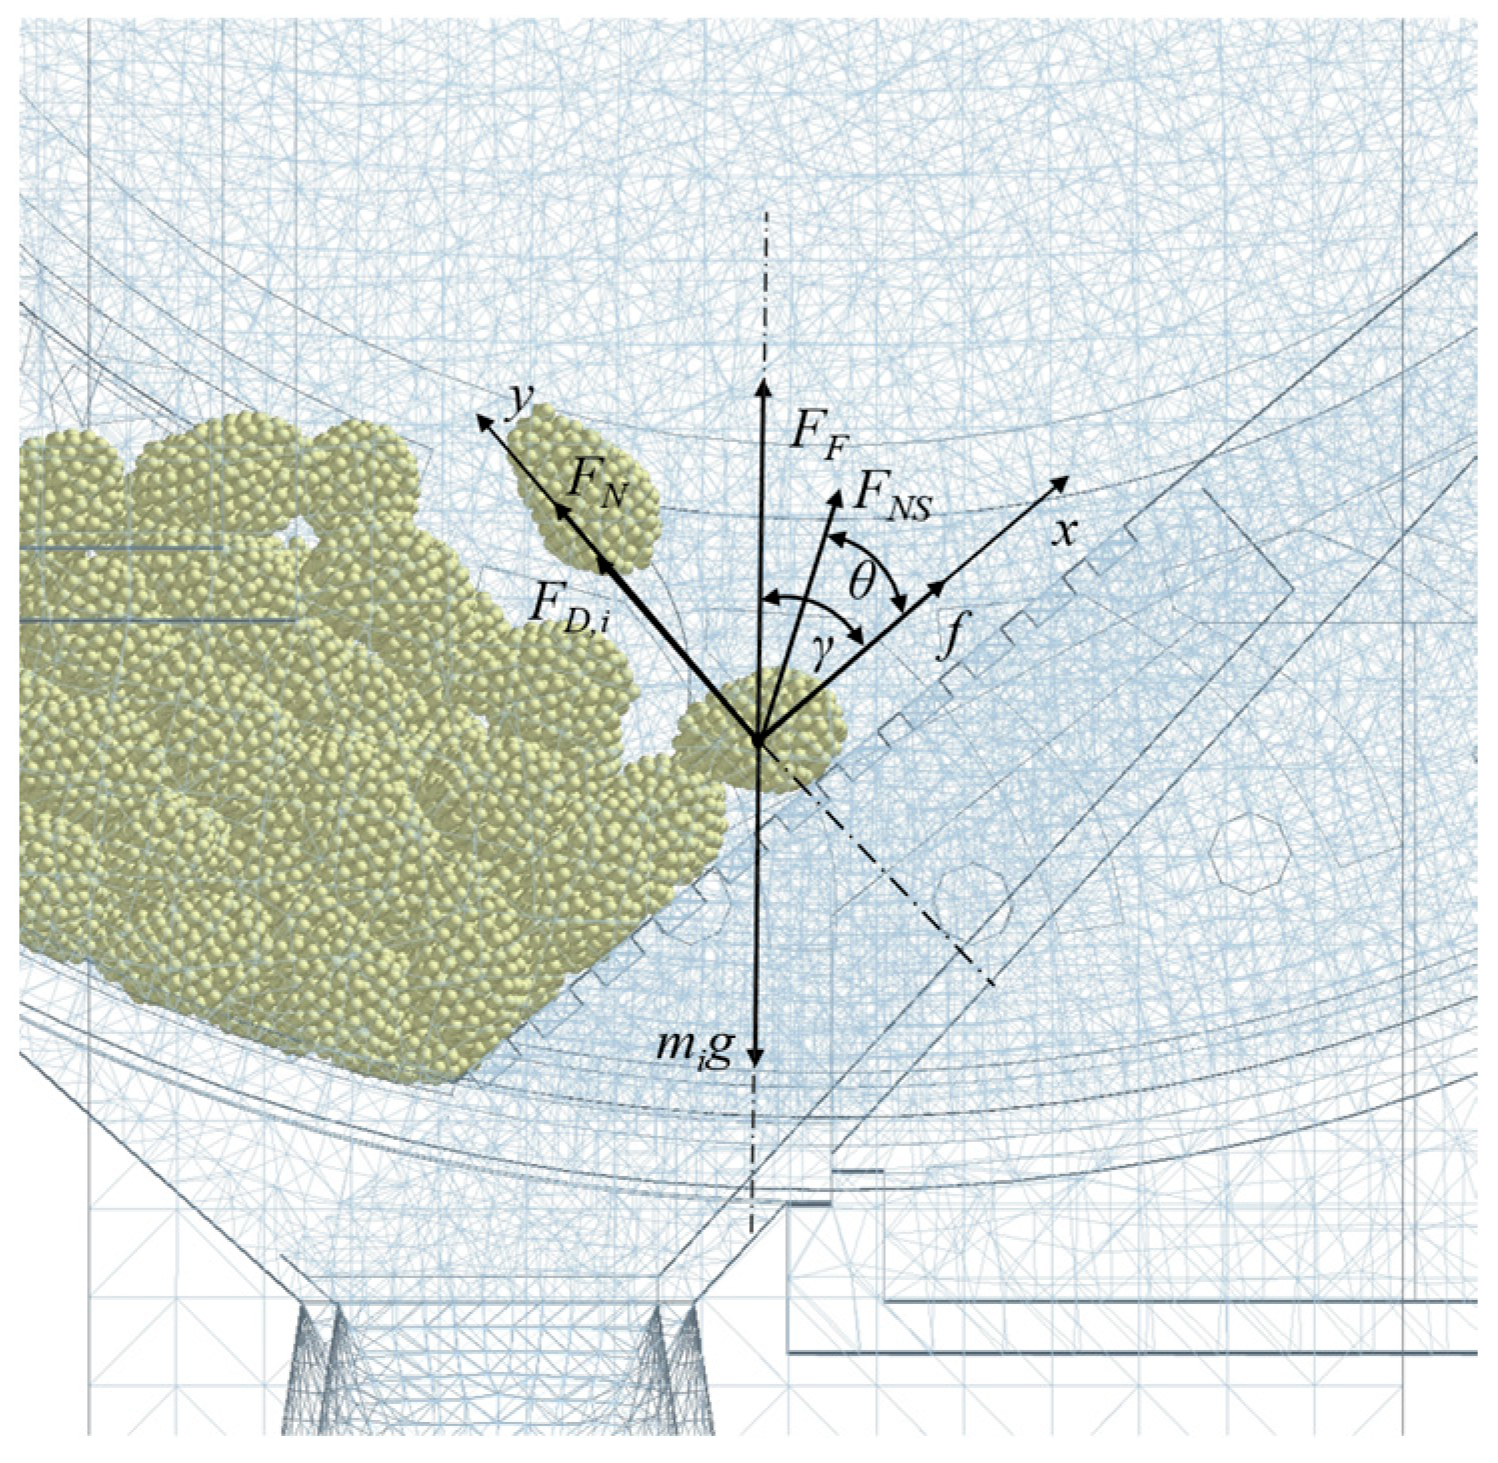
A stress analysis of peanuts in the seed-filling chamber was carried out to compare the stress of peanut seeds close to and away from the wall, and the disturbance principle of the blowing structure of the AASD for a pneumatic-assisted precision peanut seed-metering machine was explained. Using ANSYS 2019 and EDEM 2018 software, a coupling simulation was carried out on the air-assisted precision peanut seed-metering machine. By analyzing the effects of the seed-filling chamber ‘V’ angle γ, the bottom blow-air-hole cross-sectional area S, and the blow-air-hole airflow velocity vq on the seed motion velocity, the seed stress, and the airflow velocity field in the seed-filling chamber, we found the following results: The seed-filling chamber ‘V’ angle γ was 50–60°, the bottom blow-air-hole cross-sectional area S was 800–1200 mm2, and the blow-air-hole airflow velocity vq was 10–14 m·s−1. Moreover, the disturbance filling had a good performance.
(b)
The effects of the seed-filling chamber ‘V’ angle γ, the bottom blow-air-hole cross-sectional area S, and the blow-air-hole airflow velocity vq on the seed-filling performance were determined through experimental analysis. An optimization model was established to determine the optimal parameter combination and we found that the seed-filling chamber ‘V’ angle γ was 56.59°, the bottom blow-air-hole cross-sectional area S was 1088.4 mm2, and the blow-air-hole airflow velocity vq was 12.11 m·s−1. In this case, the eligible index of suction seed and the index of leaky seed of peanut seed assisted blowing for the airflow were optimal. The eligible index of suction seed was 96.33% and the index of leaky seed was 2.59%. The results of field validation trials met the agronomic requirements for the precise planting of peanuts. When processing peanut varieties with rough surfaces or seeds with a high moisture content and poor flowability, it is recommended that the seed-filling chamber ‘V’ angle be set to 50–55°. This slope can help reduce seed accumulation. Additionally, the base range for the blow-air-hole airflow velocity should be set to 10–14 m s−1, and this should be coordinated with the bottom blow-air-hole cross-sectional area to prevent seed collisions.

Author Contributions

Conceptualization, P.G., J.H. and D.W.; methodology, P.G.; software, P.G. and A.E.; validation, P.G.; formal analysis, P.G.; investigation, P.G., B.S. and X.Z.; resources, P.G. and D.W.; data curation, P.G.; writing—original draft preparation, P.G.; writing—review and editing, P.G., J.H., D.W. and S.S.; visualization, P.G. and F.E.; supervision, P.G. and Z.Z.; project administration, J.H., D.W. and S.S.; funding acquisition, D.W. and J.H. All authors have read and agreed to the published version of the manuscript.

Funding

This research was funded by the Shandong Province Key R&D Program (Science and Technology Demonstration Project) Project (No. 2022SFGC0203); the Shandong Province Agricultural Machinery R&D, Manufacturing, and Promotion Application Integration Pilot Project (No. NJYTHSD-202304); the National Key R&D Program of China (No. 2022YFD2300101); the Shandong Province Key R&D Program (Major Science and Technology Innovation Project) Project (No. 2021CXGC010813); the Science and Technology Program Projects in the City of Yantai (No. 2023ZDCX029); and the Shandong Province Base and Talent Program (‘Foreign Experts Double Hundred Plan’ Talent Category) Project (No. WSR2023093).

Data Availability Statement

Some data, models, and code generated or used during this study are available from the corresponding author upon request.

Conflicts of Interest

The authors declare no conflict of interest.

References

  1. Zhao, X.S.; Ran, W.J.; Hao, J.J. Design and experiment of the double-seed hole seeding precision seed metering device for peanuts. Int. J. Agric. Biol. Eng. 2022, 15, 107–114. [Google Scholar] [CrossRef]
  2. Wang, S.Y.; Hu, Z.C.; Chen, Y.Q. Integration of agricultural machinery and agronomy for mechanised peanut production using the vine for animal feed. Biosyst. Eng. 2022, 219, 135–152. [Google Scholar] [CrossRef]
  3. He, S.N.; Chen, Y.; Xiang, W. Carbon and nitrogen footprints accounting of peanut and peanut oil production in China. J. Clean. Prod. 2021, 291, 125964. [Google Scholar] [CrossRef]
  4. Wang, D.W.; Ji, R.Q.; He, X.N. Drive-guided Combination Slot-assisted Seed-attached Air-absorbing Peanut High-speed Precision Seed Meter. Transact. Chin. Soc. Agric. Mach. 2023, 54, 59–70+149. [Google Scholar] [CrossRef]
  5. Yin, X.W.; Yang, L.; Zhang, D.X. Design and experiment of balance and low-loss air allotter in air pressure maize precision planter. Transact. Chin. Soc. Agric. Eng. 2016, 32, 9–17. [Google Scholar]
  6. Zang, Y.; Huang, Z.S.; Qin, W. Design of hybrid rice air-suction single seed metering device. Transact. Chin. Soc. Agric. Eng. 2024, 40, 181–191. [Google Scholar] [CrossRef]
  7. Zhang, M.H.; Jiang, Y.C.; He, S.Y. Design and experiment of the air suction wheel precision seed metering device for vegetables. Transact. Chin. Soc. Agric. Eng. 2023, 39, 98–109. [Google Scholar] [CrossRef]
  8. Li, Y.H.; Yang, L.; Zhang, D.X. Design and Experiment of Pneumatic Precision Seed-metering Device with Single Seed-metering Plate for Double-row. Transact. Chin. Soc. Agric. Mach. 2019, 50, 61–73. [Google Scholar] [CrossRef]
  9. Li, Y.H.; Yang, L.; Zhang, D.X. Analysis and test of linear seeding process of maize high speed precision metering device with air suction. Transact. Chin. Soc. Agric. Eng. 2020, 36, 26–35. [Google Scholar] [CrossRef]
  10. Liu, R.; Liu, Z.J.; Liu, L.J. Design and Experiment of Corn High Speed Air Suction Seed Metering Device with Disturbance Assisted Seed-filling. Transact. Chin. Soc. Agric. Mach. 2022, 53, 50–59. [Google Scholar] [CrossRef]
  11. Chen, Y.L.; Liu, Z.Q.; Han, J. Design and experiments of the flat seed-adsorbing posture adjustment mechanism for the air-suction metering device. Transact. Chin. Soc. Agric. Eng. 2022, 38, 1–11. [Google Scholar] [CrossRef]
  12. Wang, Y.Y.; Li, J.D.; Wang, D.W. Orthogonal Experiment Optimization on Air-suction Precision Seed-metering Device. Transact. Chin. Soc. Agric. Mach. 2012, 43, 54–58+89. [Google Scholar] [CrossRef]
  13. Wang, Y.B.; Li, H.W.; Hu, H.N. A noncontact self-suction wheat shooting device for sustainable agriculture: A preliminary research. Comput. Electr. Agric. 2022, 197, 106927. [Google Scholar] [CrossRef]
  14. Yang, L.; Yan, B.; Cui, T. Global overview of research progress and development of precision maize planters. Int. J. Agric. Biol. Eng. 2016, 9, 9–26. [Google Scholar] [CrossRef]
  15. Wang, L.; Liao, Y.T.; Li, M.L. Motion characteristics of rapeseeds and wheat seeds within mixing components of air-assisted centralized metering device based on DEM-CFD. Comput. Electr. Agric. 2024, 221, 108986. [Google Scholar] [CrossRef]
  16. Yan, Y.Q.; Liu, L.J.; Liu, Y.Q. Design and Test of Four-stage Seed Cleaning Mechanism for Air-Suction Vagetables Seed-Metering Device. Transact. Chin. Soc. Agric. Mach. 2023, 54, 57–65. Available online: https://link.cnki.net/urlid/11.1964.S.20230913.1130.016 (accessed on 9 October 2024).
  17. Ding, L.; Yang, L.; Zhang, D.X. Effect of Seed Adsorption Posture of Corn Air-suction Metering Device on Seed Feeding Performance. Transact. Chin. Soc. Agric. Mach. 2021, 52, 40–50. [Google Scholar] [CrossRef]
  18. Gu, F.W.; Zhao, Y.Q.; Wu, F. Simulation analysis and experimental validation of conveying device in uniform rrushed straw throwing and seed-sowing Machines using CFD-DEM coupled approach. Comput. Electr. Agric. 2022, 193, 106720. [Google Scholar] [CrossRef]
  19. Guzman, L.; Chen, Y.; Landry, H. Coupled CFD-DEM Simulation of Seed Flow in an Air Seeder Distributor Tube. Processes 2020, 8, 1597. [Google Scholar] [CrossRef]
  20. Li, H.C.; Li, Y.M.; Gao, F. CFD-DEM simulation of material motion in air-and-screen cleaning device. Comput. Electr. Agric. 2012, 88, 111–119. [Google Scholar] [CrossRef]
  21. Wang, Y.B.; Li, H.W.; Hu, H.N. DEM-CFD coupling simulation and optimization of a self-suction wheat shooting device. Power Technol. 2021, 393, 494–509. [Google Scholar] [CrossRef]
  22. Huang, J.S.; Wen, J.P.; Li, H. Particle erosion in 90-Degree elbow pipe of pneumatic conveying System: Simulation and validation. Comput. Electr. Agric. 2024, 216, 108534. [Google Scholar] [CrossRef]
  23. He, S.Y.; Qian, C.; Jiang, Y.C. Design and optimization of the seed feeding device with DEM-CFD coupling approach for rice and wheat. Comput. Electr. Agric. 2024, 219, 108814. [Google Scholar] [CrossRef]
  24. Xing, H.; Cao, X.M.; Zhong, P. DEM-CFD coupling simulation and optimisation of rice seed particles seeding a hill in double cavity pneumatic seed metering device. Comput. Electr. Agric. 2024, 224, 109075. [Google Scholar] [CrossRef]
  25. Xiao, Y.; Ma, Z.T.; Wu, M.L. Numerical Study of Pneumatic Conveying of Rapeseed through a Pipe Bend by DEM-CFD. Agriculture 2022, 12, 1845. [Google Scholar] [CrossRef]
  26. Guzman, L.; Chen, Y.; Landry, H. Coupled CFD-DEM Simulation of Seed Flow in Horizontal-Vertical Tube Transition. Processes 2023, 11, 909. [Google Scholar] [CrossRef]
  27. Lei, X.L.; Liao, Y.T.; Liao, Q.X. Simulation of seed motion in seed feeding device with DEM-CFD coupling approach for rapeseed and wheat. Comput. Electr. Agric. 2016, 131, 29–39. [Google Scholar] [CrossRef]
  28. Xu, J.; Sun, S.L.; He, Z.K. Design and optimisation of seed-metering plate of air-suction vegetable seed-metering device based on DEM-CFD. Biosyst. Eng. 2023, 230, 277–300. [Google Scholar] [CrossRef]
  29. Gao, X.J.; Xu, Y.; Yang, L. Simulation and Experiment of Uniformity of Venturi Feeding Tube Based on DEM-CFD Coupling. Transact. Chin. Soc. Agric. Mach. 2018, 49, 92–100. [Google Scholar] [CrossRef]
  30. Wang, G.W.; Xia, X.M.; Zhu, Q.H. Design and Experiment of Soybean High-speed Precision Vacuum Seed Metering with Auxiliary Filling Structure Based on DEM-CFD. J. Jilin Technol. Univ. 2022, 52, 1208–1221. [Google Scholar] [CrossRef]
  31. Ding, L.; Yang, L.; Wu, D.H. Simulation and Experiment of Corn Air Suction Seed Metering Device Based on DEM-CFD Coupling Method. Transact. Chin. Soc. Agric. Mach. 2018, 49, 48–57. [Google Scholar] [CrossRef]
  32. Shi, S.; Liu, H.; Wei, G.J. Optimization and Experiment of Pneumatic Seed Metering Device with Guided Assistant Filling Based on EDEM CFD. Transact. Chin. Soc. Agric. Mach. 2020, 51, 54–66. [Google Scholar] [CrossRef]
  33. Han, D.D.; Zhang, D.X.; Jing, H.R. DEM-CFD coupling simulation and optimization of an inside-filling air-blowing maize precision seed-metering device. Comput. Electr. Agric. 2018, 150, 426–438. [Google Scholar] [CrossRef]
  34. Kuang, S.B.; Li, K.; Zou, R.P. Application of periodic boundary conditions to CFD-DEM simulation of gas-solid flow in pneumatic conveying. Chem. Eng. Sci. 2013, 93, 214–228. [Google Scholar] [CrossRef]
  35. Zhou, B.C.; Ma, S.C.; Li, W.Q. CFD-DEM coupling simulation and parameter optimization of sugarcane harvester extractor. Biosyst. Eng. 2025, 250, 80–93. [Google Scholar] [CrossRef]
  36. Kloss, C.; Goniva, C.; Hager, A. Models, algorithms and validation for opensource DEM and CFD-DEM. Prog. Comput. Fluid. Dyn. 2012, 12, 140–152. [Google Scholar] [CrossRef]
  37. Zhou, F.B.; Hu, S.Y.; Liu, Y.K. CFD-DEM simulation of the pneumatic conveying of fine particles through a horizontal slit. Particuology 2014, 16, 196–205. [Google Scholar] [CrossRef]
  38. Yu, Y.J.; Fu, H.; Yu, J.Q. DEM-based simulation of the corn threshing process. Adv. Powder Technol. 2015, 26, 1400–1409. [Google Scholar] [CrossRef]
  39. Antonyuk, S.; Khanal, M.; Tomas, J. Impact breakage of spherical granules: Experimental study and DEM simulation. Chem. Eng. Process 2006, 45, 838–856. [Google Scholar] [CrossRef]
  40. Wu, M.C.; Cong, J.L.; Yan, Q. Calibration and experiments for discrete element simulation parameters of peanut seed particles. Transact. Chin. Soc. Agric. Eng. 2020, 36, 30–38. [Google Scholar] [CrossRef]
  41. GB/T 6973-2005; Testing Methods of Single Seed Drills (Precision Drills). China Standards Press: Beijing, China, 2005.
  42. JB/T 10293-2013; Specifications for Single Seed Drills (Precision Drills). China Machine Press: Beijing, China, 2013.
Figure 1. Structure of peanut high-speed precision seed-metering machine. (a) Structure schematic diagram: (1) motor; (2) seed-discharging left housing; (3) leakage-retaining ring; (4) seed-discharging disk; (5) upper side seed cleaner; (6) lower side seed cleaner; (7) drive shaft; (8) seed box excess; (9) seed-discharging tube; (10) seed-discharging tube excessive housing; (11) seed-discharging right housing; (12) blowing connection parts. (b) Working process. (c) Working principle schematic. (I) seed-filling area; (II) seed-clearing area; (III) seed-carrying area; (IV) seed-feeding area; (ω) rotation speed.
Agriculture 15 01678 g001
Figure 2. Force analysis of peanut under air flow.
Agriculture 15 01678 g002
Figure 3. Actual, simplified, and multi-particle-simulated peanut seeds under study.
Agriculture 15 01678 g003
Figure 4. (a) Simplified model; (b) meshing of pneumatic-assisted precision seed-metering machine; (c) simplified fluid domain mesh. Color: blue represents the seed box, orange represents the seed chamber, yellow represents the seed suction chamber, purple represents the seed transition piece, and light blue represents the seed guide tube, in figure (a).
Agriculture 15 01678 g004
Figure 5. (a) Comparison of airflow simulation results with experimental results, (b) comparison of pressure simulation results and test results at the seed suction hole.
Agriculture 15 01678 g005
Figure 6. Vector cloud of air velocity at each place in the fluid domain.
Agriculture 15 01678 g006
Figure 7. The simulation results under different seed-filling chamber ‘V’ angle γ types: (a) γ = 50°, (b) γ = 55°, (c) γ = 60°, and (d) γ = 65°.
Agriculture 15 01678 g007aAgriculture 15 01678 g007b
Figure 8. The seed-filling index under different types of the seed-filling chamber ‘V’ angle γ.
Agriculture 15 01678 g008
Figure 9. Simulation results under different bottom blow-air-hole cross-sectional area S values: (a) S = 800 mm2, (b) S = 1000 mm2, (c) S = 1200 mm2, and (d) S = 1400 mm2.
Agriculture 15 01678 g009aAgriculture 15 01678 g009b
Figure 10. A schematic diagram of the vertical position of the upper side of the blowing hole of the seed blowing structure. Red line: 0–160 mm.
Agriculture 15 01678 g010
Figure 11. The velocity magnitude of airflow in the vertical direction for different bottom blow-air-hole cross-sectional area S values.
Agriculture 15 01678 g011
Figure 12. The seed-filling index under different types of bottom blow-air-hole cross-sectional area S.
Agriculture 15 01678 g012
Figure 13. Simulation results under different blow-air-hole airflow velocity vq values. (a) vq = 10 m·s−1, (b) vq = 12 m·s−1, (c) vq = 14 m·s−1, and (d) vq = 16 m·s−1.
Agriculture 15 01678 g013aAgriculture 15 01678 g013b
Figure 14. Velocities of individual peanut seeds at different blow-air-hole airflow velocities.
Agriculture 15 01678 g014
Figure 15. The trajectories of seeds blown and adsorbed at a blow-air-hole airflow velocity of 12 m·s−1.
Agriculture 15 01678 g015
Figure 16. Seed-filling index under different types of blow-air-hole airflow velocity vq.
Agriculture 15 01678 g016
Figure 17. A diagram of the test setup.
Agriculture 15 01678 g017
Figure 18. Response surface analysis of the eligible index of suction seed. (a) the effect of the seed-filling chamber ‘V’ angle γ and the bottom blow-air-hole cross-sectional area S of the eligible index, (b) the effect of the bottom blow-air-hole cross-sectional area S and the blow-air-hole airflow velocity vq of the eligible index.
Agriculture 15 01678 g018
Figure 19. Response surface analysis of the index of leaky seed. (a) the effect of the seed-filling chamber ‘V’ angle γ and the bottom blow-air-hole cross-sectional area S of the index of leaky seed, (b) the effect of the bottom blow-air-hole cross-sectional area S and the blow-air-hole airflow velocity vq of the index of leaky seed.
Agriculture 15 01678 g019
Figure 20. Field experiment.
Agriculture 15 01678 g020
Table 1. Physical properties of peanut seeds.
Physical PropertyParameters
Average size of three axes (mm)15 × 10 × 8.5
Thousand grains weight (g)7802.15
Densities (kg·m−3)1049
Moisture content (%)8.87
Table 2. The relationship between the rotation speed of the seed-discharging disk and the forward speed of the machine.
The Forward Speed of the Machine
(km·h−1)
The Rotation Speed of the Seed-Discharging Disk
(rpm)
1023.8
Table 3. Simulation parameters of peanut seed particles coupled with photosensitive resin materials.
TypeParameterPeanut SeedNylon Plastic
Solid phasePoisson’s ratio0.3620.38
Shear modulus (Pa)5.06 × 1073.11 × 109
Density (kg·m−3)1.04 × 1031130
Coefficient of restitution0.5010.519
Static friction coefficient0.2130.441
Rolling friction coefficient0.0350.126
Solid time step2 × 10−6
Gas phaseFluidAir
Gravity acceleration (m·s−2)9.81
Density (kg·m−3)1.225
Viscosity (kg·m−1·s−1)1.7984 × 10⁻⁵
Fluid time step1 × 10−4
Table 4. Encoding of experimental factors.
Level CodeExperimental Factors
X1 (°)X2 (mm2)X3 (m·s−1)
−15080010
055100012
160120014
Table 5. Experimental design and results.
Test NumberExperimental FactorsEligible Index of Suction SeedIndex of Leaky Seed
X1X2X3Y1%Y2%
1−10192.135.26
20−1193.514.62
300095.122.86
401194.264.19
5−1−1091.675.26
600095.782.62
700095.712.93
810193.533.86
91−1093.064.98
1001−195.424.24
1111096.293.25
1200095.922.77
1310−192.874.63
1400095.672.81
15−10−191.095.38
16−11093.224.93
170−1−190.056.56
Table 6. Analysis of variance.
SourceEligible Index of Suction SeedIndex of Leaky Seed
Sum of SquaresDegrees of FreedomFpSum of SquaresDegrees of FreedomFp
Model56.0993951.4265<0.000121.3407961.6682<0.0001
X17.2962160.19610.00012.1115154.91480.0001
X214.85131122.5278<0.00012.8920175.2135<0.0001
X32116.50070.00481.0368126.96440.0013
X1X20.705615.82140.04660.49112.74360.0091
X1X30.036110.29780.60220.105612.74700.1414
X2X35.3361144.02460.00030.8930123.22520.0019
X129.3792177.3815<0.00012.9958177.9116<0.0001
X221.4533111.99010.01053.90881101.6566<0.0001
X3212.78451105.476<0.00015.48161142.5618<0.0001
Residual0.84857 0.26927
Lack of fit0.474331.68980.30560.215335.32730.0699
Errors0.37424 0.05394
Total56.947816 21.609916
R2 = 0.9851, Adj R2 = 0.9659R2 = 0.9875, Adj R2 = 0.9715
Table 7. The results of the comparative test.
TypeWorking Speed
(km·h−1)
Eligible Index of Suction Seed
(%)
Index of Leaky Seed
(%)
Air-assisted seeding695.892.98
895.223.59
1093.224.13
No air-assisted seeding689.329.62
887.6811.21
1084.2614.69
Disclaimer/Publisher’s Note: The statements, opinions and data contained in all publications are solely those of the individual author(s) and contributor(s) and not of MDPI and/or the editor(s). MDPI and/or the editor(s) disclaim responsibility for any injury to people or property resulting from any ideas, methods, instructions or products referred to in the content.

