1. Introduction
Monitoring the condition of honeybee colonies is essential for ensuring pollination services, ecological sustainability, and the productivity of beekeeping operations. One of the most practical, non-invasive strategies for behavioral observation is the continuous visual monitoring of the hive entrance, which serves as a vital interface between the internal and external environments of the colony [
1,
2]. The entrance not only enables airflow, communication, and the exchange of foragers but also provides observable indicators related to the health and status of the hive.
Thermoregulatory behaviors such as wing fanning, which bees perform by vibrating their wings while remaining stationary, play a crucial role in regulating hive temperature and humidity [
3,
4]. This ventilation process is critical for brood development, pheromone distribution, and overall colony homeostasis. Visual signs of fanning behavior at the entrance offer valuable insights into the internal conditions of the hive, including thermal stress, brood care demands, and colony coordination [
5,
6]. Moreover, fanning frequency and body posture have been shown to respond to environmental variables and even pesticide exposure [
7], making it an informative indicator of external and internal stressors.
Traditional hive inspections involve opening the hive, which can be disruptive and stressful for the colony. In contrast, automated visual monitoring at the entrance allows beekeepers to infer internal hive dynamics without physically intervening [
8]. Several studies have demonstrated the potential of machine vision to detect and classify behaviors such as foraging, guarding, and robbing at the entrance [
9,
10]. This capability could be extended to thermoregulatory fanning using advanced detection models capable of capturing subtle motion signals like wing flapping.
Recent developments in deep learning have made it feasible to automate the recognition of specific honeybee behaviors from video data. By leveraging single-shot object detection frameworks such as YOLO and adapting them for spatiotemporal analysis, it becomes possible to detect behaviors that are characterized not just by static postures but also by dynamic wing or abdominal movement [
11,
12]. Advances in zero-shot object detection and automated labeling workflows have further demonstrated the potential of foundation models for behavior detection in specialized visual domains [
13]. In parallel, hyperspectral imaging has also emerged as a promising tool for detecting parasites like
Varroa destructor, offering an alternative spectral-based approach for health monitoring of bees [
14]. Such systems offer the potential for real-time, edge-capable monitoring, reducing the labor demands on beekeepers and improving responsiveness to colony needs.
Multiple types of bee behavior are expressed at the entrance ramp, including fanning, foraging, guarding, trophallaxis, and swarming [
9]. Accurately identifying these behaviors, especially those related to thermal regulation, requires comprehensive datasets and robust detection models capable of operating under varying lighting conditions, occlusions, and visual similarity between behavioral classes. In this study, we focus on fanning detection as a representative behavior that is both functionally significant and visually subtle, requiring temporal modeling for accurate identification.
Our main contributions are as follows:
A new dataset collected, annotated, and publicly provided for detecting fanning behavior of honeybees at the hive entrance. It contains:
- –
4 different beehives, 18,000 annotated frames, with 84% containing fanning behavior and 16% without visible fanning patterns.
- –
57,597 instances of fanning bees, including a wide range of postures, occlusions, body orientations, spatial locations, shadow contrasts, and degrees of wing visibility.
Evaluated state-of-the-art object detection models for detecting fanning behavior in honeybees using three input encoding strategies: standard RGB frames, Temporally Stacked Grayscale (TSG), and Temporally Encoded Motion (TEM).
Conducted experiments on both high-performance (RTX 4080 Super, 16 GB) and edge computing platforms (Jetson AGX Orin, 64 GB) to assess model efficiency and deployability.
2. Related Works
Recent advances in computer vision and sensing technologies have opened new avenues for the automated monitoring of honeybee behavior. A number of studies have explored video-based analysis and AI systems that support the detection of specific bee activities, laying a strong foundation for the development of automated fanning detection.
2.1. Automated Fanning Detection
Siefert et al. [
15] provided a detailed qualitative and quantitative account of honeybee behavior within the hive using long-term video analysis. Their innovative side-view setup enabled continuous observation of subtle behaviors such as thermoregulation, brood care, and trophallaxis, demonstrating the value of visual tracking in constrained environments. Similarly, Crawford et al. [
16] introduced a multi-camera observational methodology for capturing rare behaviors, including air-circulatory and Nasonov pheromone fanning, at the hive entrance. They emphasized the feasibility of using video data to quantify fanning behavior and outlined potential integration with AI systems. This insight directly aligned with the goals of this study.
High-speed video approaches have also been employed to detect wing-flapping activity associated with bee flight. Shimasaki et al. [
17] analyzed pixel-level brightness fluctuations in 500 fps recordings to extract temporal frequency components of flying bees. Their later work with Li et al. [
18] integrated YOLOv8 with K-Nearest Neighbors to achieve real-time flapping detection at 1000 fps, underscoring the potential of frequency-based motion analysis. Though these methods focused on flight, the technical principles extend to fanning behavior, which involves similar repetitive wing movements.
Several studies have demonstrated the feasibility of object detection and tracking for behavioral monitoring at hive entrances. Chiron et al. [
19] presented a stereo vision-based system for the 3D tracking of honeybees using Kalman filtering and Global Nearest Neighbor data association. Their hybrid segmentation method, incorporating both intensity and depth images, showed robust performance in cluttered, outdoor conditions. Likewise, Svec and Ganguly [
20] applied YOLO11 for classifying worker roles (e.g., pollen carriers) in hive entrance footage. While not focused on fanning, these systems establish a technical baseline for real-time, non-invasive monitoring of complex bee behaviors using vision-based models.
Biomechanical analyses offer critical insight into the kinematics of fanning and its distinction from other wing-related behaviors. Peters et al. [
3] compared ventilatory fanning, Nasonov scenting, and hovering flight using high-speed video and flow visualization. They reported that fanning is characterized by lower flapping frequencies (174 Hz), larger stroke amplitudes, and a distinct stroke plane angle, differentiating it from other wing-flapping behaviors. Yang et al. [
21] and Seko et al. [
22] documented defensive behaviors such as fan-blowing and wing-slapping, respectively, that also involve wing movement but serve purposes like predator deterrence. The visual similarity between these behaviors and thermoregulatory fanning underscores the need for spatiotemporal models that can capture fine-grained motion dynamics. Oliver et al. [
7] further showed that pesticide exposure subtly alters fanning frequency and duration, emphasizing the importance of detecting nuanced behavioral changes.
Understanding the collective and social dynamics behind fanning helps contextualize why its detection is challenging. Cook et al. [
5] examined how group size and the rate of environmental temperature change influence fanning onset, showing that bees in larger groups begin fanning earlier during rapid heating. Kaspar et al. [
6] highlighted the influence of experienced individuals in triggering fanning among workers, indicating that behavioral contagion can modulate activation thresholds. Egley and Breed [
23] described the flexible, non-age-linked nature of fanning, revealing that bees dynamically switch tasks based on ambient stimuli. Peters et al. [
24] modeled collective ventilation, showing that bees spatially organize into inflow and outflow clusters at the hive entrance to maximize cooling efficiency, an emergent pattern crucial for group-level thermoregulation. These findings highlight that fanning is not only visually subtle but also socially and environmentally adaptive.
Beyond vision-based approaches, researchers have also explored indirect sensing methods to monitor fanning. Lima et al. [
25] demonstrated that increased sound intensity levels, captured via a smartphone app, correlate with thermoregulatory fanning inside the hive. This non-invasive acoustic proxy validates the potential of integrating passive sensing for behavioral inference. Stabentheiner et al. [
4] and Bourrel et al. [
26] investigated thermal homeostasis in colonies, noting that behaviors like fanning are initiated at specific temperature thresholds and modulated by hive configuration. Their findings support the development of sensor-guided detection models that consider environmental triggers for behavioral activation.
These studies reveal a rich spectrum of biological, mechanical, and technological insights relevant to automated fanning detection. However, while prior research has established strong foundations in both video analysis and behavioral ecology, a gap remains in unifying these domains for the specific, automated recognition of thermoregulatory fanning at the hive entrance. This work addresses that gap by evaluating state-of-the-art visual detection models trained explicitly for this purpose.
2.2. Spatiotemporal Modeling
Given the dynamic and often subtle nature of fanning behavior, its accurate identification necessitates spatiotemporal modeling approaches that move beyond static image analysis. Recent advances in video-based action detection provide valuable frameworks for addressing this challenge through the integration of temporal context, motion encoding, and actor tracking.
Luo et al. [
27] introduced TrAD, a two-stage tracking-based spatiotemporal action detection framework that prioritizes video-level consistency. Their system generates action track proposals across video frames using a YOLOv7-based tracker, followed by track-aligned pooling and motion-consistent proposal scaling. This design not only improves classification accuracy but also reduces computational overhead by 58% compared to SlowFast, showcasing the benefits of incorporating consistent motion paths and temporal structure, principles applicable to capturing sustained wing movements during bee fanning.
Zhu et al. [
28] developed YOWOv3, a lightweight real-time spatiotemporal network designed for deployment on edge devices. The model combines a YOLOv8-based 2D spatial backbone with a lightweight 3D temporal extractor and a channel fusion and attention convolution mix module. It avoids the computational load of 3D convolutions by using a temporal shift module to maintain temporal sensitivity. This balance between efficiency and temporal expressiveness aligns with the design constraints of embedded honeybee monitoring systems.
Telegraph and Kyrkou [
29] proposed a spatiotemporal object detection method for aerial vehicle tracking that extends YOLOv5 with temporal attention and frame differencing. Their model achieved over 16% performance gains by highlighting motion areas and suppressing static regions, a strategy directly related to our use of temporally encoded motion input, which enhances detection of subtle fanning behavior via temporal pixel differencing.
Alzahrani et al. [
30] presented YOLO-Act, a unified spatiotemporal action detection framework extending YOLOv8. By extracting the first, middle, and last frames of an action, and combining them through late fusion, the model captures key temporal dynamics with minimal computational load. YOLO-Act outperformed transformer-based approaches such as LART on the AVA dataset, highlighting the effectiveness of temporally structured, low-overhead input encodings, complementary to our temporally stacked grayscale and difference-based representations.
Peng et al. [
31] proposed a real-time anomaly detection system using a two-stream spatial–temporal transformer network. Their method integrates pose estimation, object interaction modeling, and transformer-based sequence encoding to identify abnormal behaviors in industrial environments using CPU-only setups. Their emphasis on efficient temporal modeling through motion information and acceleration vectors resonates with our goal of detecting subtle wing vibrations and fanning patterns using lightweight, motion-enhanced visual representations.
These studies demonstrate a growing trend toward compact, high-resolution temporal modeling for dynamic action recognition. They collectively inform the architectural and representational strategies employed in this work, including temporal stacking, pixel-wise differencing, and motion-emphasized feature design for detecting honeybee fanning behavior.
3. Materials and Methods
To support the automated identification of thermoregulatory fanning behavior, a comprehensive experimental framework was established. This section outlines the dataset collection process, input encoding strategies, model architectures, and evaluation metrics used throughout the study. The methodology is designed to ensure reproducibility, enable fair model comparisons, and reflect practical deployment scenarios for both high-performance and edge computing platforms.
3.1. Dataset
A dataset was created from video recordings of hive landing boards at a local apiary in the Vilnius district during the 2023 beekeeping season. A stationary camera mounted approximately 30 cm above the landing boards captured footage at a resolution of
pixels and 30 fps. The choice of
resolution at 30 fps balances visual detail and manageable processing load. This resolution ensures sufficient spatial granularity for detecting wing movement while allowing real-time frame extraction and compression, especially critical for the edge-deployment scenarios later discussed in
Section 5. Since the quality of captured frames affects detection accuracy, especially under varying lighting or motion blur conditions, selecting or preprocessing frames with higher visual quality can be beneficial [
32]. Recordings were made under both sunny and cloudy conditions to capture a range of environmental variability. Individual frames were extracted from the raw video for annotation. The dataset comprises high-resolution images collected from four different beehives, each corresponding to a colony exhibiting fanning behavior, capturing diverse environmental contexts and insect activity. All images were carefully annotated for the detection of fanning bees using the
LabelImg (
https://github.com/tzutalin/labelImg, accessed on 15 May 2025) tool. In total, the dataset contains 18,000 frames, representing 10 minutes of continuous video, of which 15,111 frames include visible fanning bees. Across these, 57,597 individual instances of fanning behavior were annotated. The dataset is publicly available for download. Similar to other specialized object detection tasks, where synthetic and real-world image datasets have been employed to train and evaluate deep learning models [
33], our dataset was developed to account for diverse visual scenarios around the hive entrance.
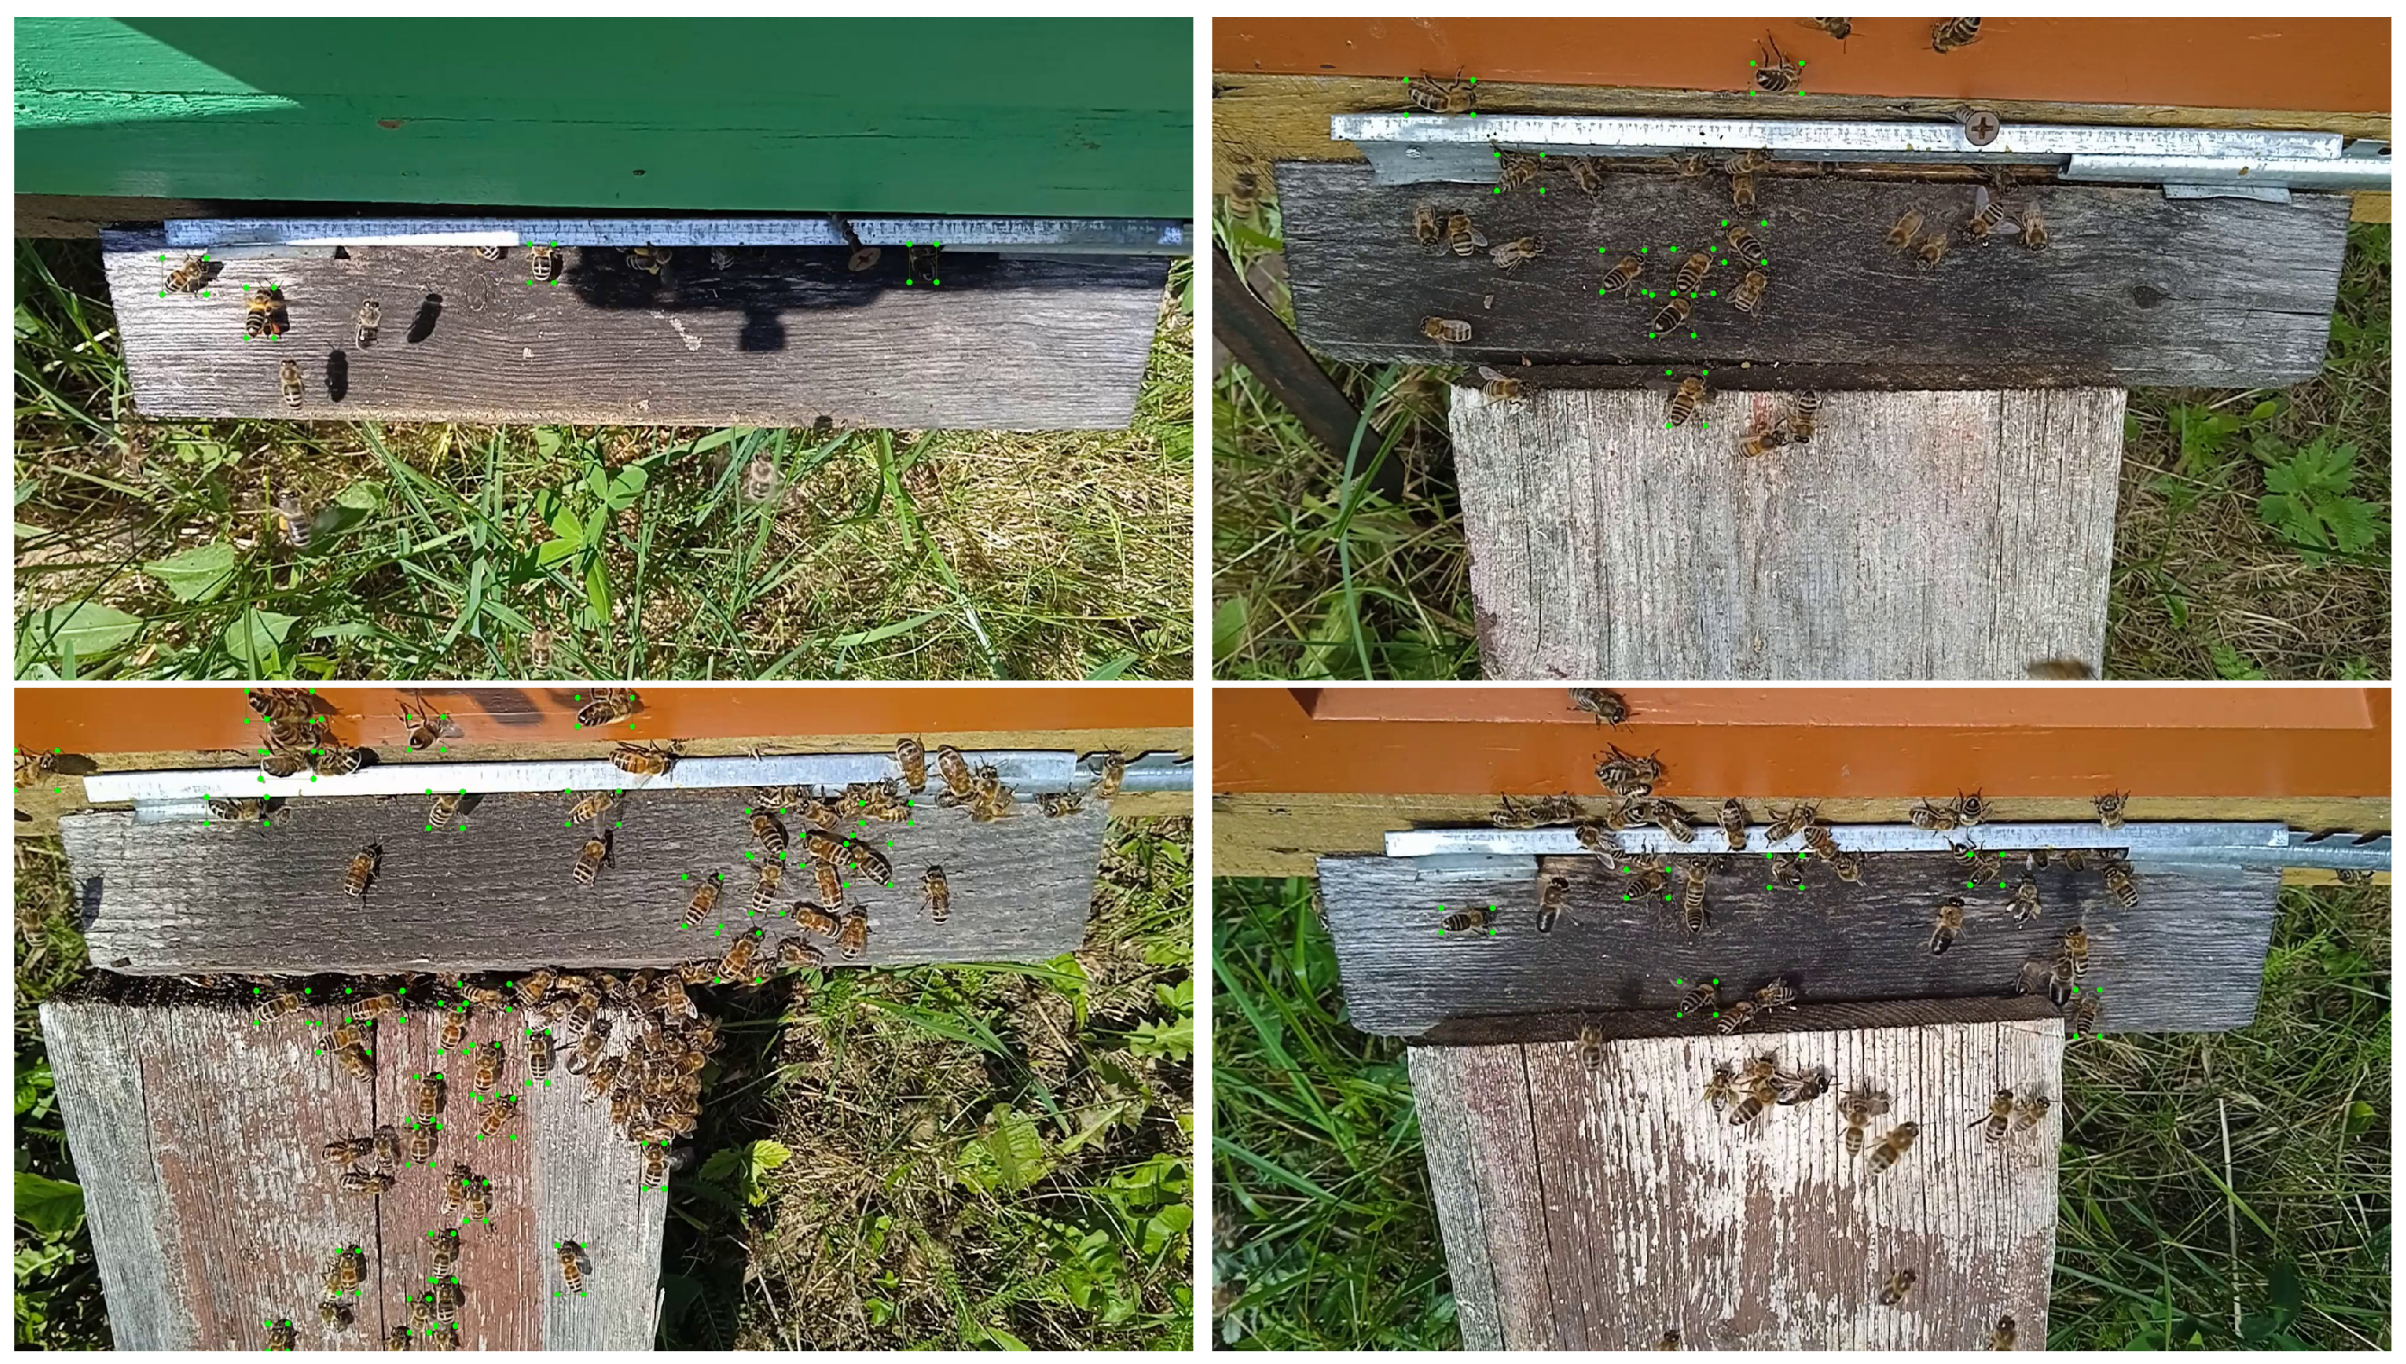
Figure 1 illustrates sample annotated images from the dataset, highlighting diverse fanning scenarios at the hive entrance. These examples include various lighting conditions and angles, offering visual diversity critical for training robust detection models. Notably, body orientation, shadow contrast, and wing visibility differ significantly between sunny and overcast conditions, posing additional challenges for consistent annotation and model generalization.
Figure 2 provides a broader view of the annotation scope, presenting instances of fanning bees across distinct hive structures.
Figure 2a–g show typical fanning postures on the landing board surface, generally considered the canonical context for fanning recognition.
Figure 2h–n capture bees fanning on the metallic entrance gate, while
Figure 2o–q extend the detection context to the hive’s vertical front wall.
Figure 2r–u illustrate cases of partial occlusion, where bees are either obstructed by other individuals or hive structures. These images emphasize the need for detection models to be resilient to variable backgrounds, occlusions, and spatial positions.
Figure 3 presents representative cases of behavioral variability.
Figure 3a–c show regular fanning behavior, with bees in a stationary posture and visible wing motion patterns.
Figure 3d,e depict occluded individuals whose behavior must be inferred from partial indications, such as visible wing blur or elevated abdomens.
Figure 3f captures a fanning bee in motion, highlighting that fanning is not always performed in a fixed location. Finally,
Figure 3g shows a bee briefly pausing during fanning, reflecting the intermittent nature of this behavior. These nuanced examples are essential for informing spatiotemporal model design, as they demonstrate that fanning cannot always be defined by static posture alone but requires temporal analysis of motion patterns such as wing vibration and abdominal positioning.
Figure 4 illustrates the three input encoding strategies evaluated in this study for detecting fanning behavior in honeybees.
Figure 4a presents the standard RGB image captured at time
n, serving as a baseline input format. This representation maintains the natural color composition and spatial detail of the scene, which is commonly used in object detection tasks. However, it does not incorporate any temporal information, which is crucial for identifying dynamic behaviors such as fanning that are characterized by subtle wing motion.
Figure 4b depicts a temporally stacked grayscale input, where the Blue, Green, and Red channels correspond to grayscale images at times
,
n, and
, respectively. This configuration enables the model to implicitly access short-term motion data through adjacent frames, while remaining compatible with standard architectures that expect three-channel input. By encoding temporal progression as a channel-wise sequence, the model can leverage visual differences caused by repetitive wing motion or posture changes without architectural modification.
Figure 4e presents a temporally encoded motion input. Here, the Green channel retains the grayscale frame at time
n, while the Blue and Red channels represent the pixel-wise backward
(
Figure 4c) and forward
(
Figure 4d) differences, computed as
and
, respectively. This configuration explicitly emphasizes temporal changes in the scene, helping the model to isolate and attend to regions exhibiting motion indicative of fanning. By suppressing static background content and highlighting dynamic elements, this representation enhances the model’s ability to detect subtle wing vibrations and abdominal shifts associated with fanning behavior.
3.2. Evaluation Metrics
To evaluate the performance of the fanning detection models, we employed the mean Average Precision () metric, a standard measure in object detection tasks. This metric assesses how accurately the model predicts object locations by comparing predicted bounding boxes with ground truth annotations using the Intersection over Union (IoU) criterion. For , a predicted bounding box is considered a correct detection (true positive) if its IoU with the corresponding ground truth box is at least 0.5.
The Average Precision (
) at IoU threshold 0.5 is calculated as the area under the Precision–Recall (P–R) curve:
where
denotes precision as a function of recall. In our case, since only one object class (fanning bee) is considered, the
simplifies to the AP for that class:
We also report precision and recall to provide further insight into the model’s detection quality. Precision measures the proportion of correct positive predictions out of all predicted positives:
where
is the number of true positives and
is the number of false positives.
Recall quantifies the proportion of actual positives that are correctly detected:
where
denotes false negatives. A detection is counted as a true positive if its IoU with the ground truth is greater than or equal to 0.5.
3.3. Applied Models and Input Formats
This study evaluates three single-shot object detection architectures, YOLOv8, YOLO11 [
34], and YOLO12 [
35], each trained to detect thermoregulatory fanning behavior in honeybees at the hive entrance. These models are selected for their compatibility with real-time inference, their proven effectiveness in visual detection tasks, and their adaptability to custom datasets. YOLOv8 serves as the baseline model in this comparison due to its widespread adoption, modular design, and strong performance across multiple domains. YOLO11 and YOLO12 are more recent architectures under experimental evaluation, designed to improve upon the accuracy–efficiency trade-off of YOLOv8 by incorporating architectural enhancements such as optimized convolutional backbones, improved neck designs, and refined detection heads.
To assess how input representation affects model performance, each model is trained and tested on three distinct image formats:
Standard RGB—a single frame at time n, using natural color input without temporal encoding.
Temporally Stacked Grayscale (TSG)—a pseudo-RGB format where the Blue, Green, and Red channels represent grayscale frames at , n, and , respectively. This format enables temporal context while preserving compatibility with the standard input formats used in object detection models.
Temporally Encoded Motion (TEM)—a temporal input encoding where the Green channel contains the frame at n, the Blue channel contains the backward difference , and the Red channel contains the forward difference . This format explicitly highlights motion dynamics relevant to fanning.
All models are trained under consistent conditions using the same dataset split, hyperparameters, and augmentation settings to ensure fair comparison. The performance evaluation focuses on both detection accuracy (mAP, precision, recall) and inference efficiency across GPU platforms, including the RTX 4080 and NVIDIA Jetson AGX Orin.
4. Results
All experiments were conducted using a GeForce RTX 4080 Super GPU with 16 GB of VRAM. The training environment included Ultralytics version 8.3.80, Python 3.12.9, PyTorch 2.5.1, and CUDA 12.6. For deployment on the NVIDIA Jetson AGX Orin, trained PyTorch models were converted to TensorRT-optimized engines using TensorRT version 8.6.2.
The input resolution for all models was fixed at
px. The dataset was split into 80% for training and 20% for validation/testing, and all models were trained and evaluated on the same split to ensure consistency. Specifically, images from three different hives (Hives 1–3), as presented in
Figure 1, were used exclusively for training, while images from the fourth hive were reserved for validation and testing. Hives 1–3 varied slightly in landing board structure, background clutter, and surface materials, offering a diversity of visual contexts that helped improve generalization. Hive 4 featured a higher crowding density. This hive-wise split was designed to evaluate the model’s ability to generalize across different colony contexts and visual environments. Data augmentation techniques included image translation by ±10% of image width, scaling with a gain of ±0.5, and a left–right horizontal flip with a probability of 0.5. Color augmentation was applied using HSV adjustments with parameters set to
= 0,
= 0, and
= 0.2. Mosaic augmentation was disabled during the final 10 training epochs to stabilize learning.
Model training used the AdamW optimizer [
36], with a learning rate of 0.001, momentum of 0.9, and weight decay regularization. The maximum number of training epochs was set to 1000, with model checkpoints saved every 10 epochs. Early stopping was enabled with a patience of 100 epochs, terminating training if no improvement was observed over that period to avoid overfitting and unnecessary computation. Batch size was adjusted dynamically between 6 and 32, depending on the complexity of the model architecture, to best utilize available VRAM and optimize training efficiency. Across all models, convergence to minimal loss typically occurred between 100 and 200 epochs.
The total loss function used for training the detection models is defined as:
where the loss gains (
) balance the contributions of the respective components:
for bounding box regression,
for classification, and
for distribution focal loss.
4.1. Investigation of Precision vs. Inference Time
Figure 5 presents a comprehensive comparison of detection performance versus inference speed for multiple YOLO-based object detection models applied to the task of identifying honeybee fanning behavior. The x-axis indicates the average inference time per image (in milliseconds), while the y-axis shows the corresponding mean Average Precision at IoU threshold 0.5. Each curve represents a specific model and input encoding combination, with marker labels (’n’, ’s’, ’m’, ’l’, ’x’) denoting YOLO model sizes (nano, small, medium, large, and extra-large, respectively).
Figure 5 shows the superior performance of the YOLOv8 and YOLO11 architectures when combined with temporally enhanced input encodings. These variants consistently achieved higher mAP50 values at relatively low inference costs, outperforming standard RGB inputs. YOLOv8-TEM and -TSG (cyan and light blue lines) achieved the best trade-off, reaching up to 84% mAP50 at just under 10 ms per image, while YOLO11-TSG (orange) also demonstrated strong results with balanced precision and efficiency.
By contrast, YOLO12 models, while highly accurate in their largest configurations (especially with TSG and TEM inputs), achieved significantly longer inference times (up to 22 ms), making them more suitable for offline or batch processing rather than real-time deployment. YOLO12-RGB (dark gray) performed worse in both speed and accuracy, showing that using input formats with motion information is important for detecting fanning behavior effectively.
Interestingly, YOLO12 performed relatively poorly in its RGB variant, with lower mAP50 and longer inference times. This could be attributed to two key factors: First, YOLO12 has a more complex backbone optimized for large-scale datasets [
35], which may not generalize well on the moderately sized honeybee dataset used here. Second, without motion-aware inputs like TSG or TEM, the model fails to leverage temporal signals critical for distinguishing fanning from static behaviors. The dataset size, although substantial, may not be sufficient to fully leverage the potential of deeper models like YOLO12.
TSG and TEM input encodings show a notable performance improvement over their corresponding RGB variants across all tested YOLO models, particularly in terms of precision at comparable or even lower inference times. YOLOv8m with TSG reaches approximately 81% mAP50 at around 8 ms, while the YOLOv8m RGB variant achieves only about 76% mAP50 at a similar inference time, an improvement of 5% in precision. YOLO11m with TSG improves from 76% (RGB) to 84% (TSG) while maintaining an inference time of 10 ms, offering an 8% gain in precision with no latency trade-off. In the YOLO12l model, TSG boosts accuracy from 74% (RGB) to 84%. Here, a 10% gain in precision comes with no increase in inference time.
4.2. Deployment on Jetson AGX Orin Platform
To evaluate the practical viability of the proposed models for real-time edge deployment, we conducted inference benchmarking on the NVIDIA Jetson AGX Orin platform. This assessment considered both raw model throughput and total latency, including the preprocessing and postprocessing steps necessary for deployment in production scenarios.
Figure 6 illustrates the performance trends of the YOLOv8 and YOLO11 models with temporally stacked grayscale input across both RTX 4080 and Jetson AGX Orin platforms. As expected, the overall throughput on AGX is reduced compared to the RTX GPU, but model ranking trends and relative performance differences remain consistent.
Accuracy degradation due to TensorRT conversion was minimal across precision levels. FP16 models provided a good balance between accuracy and efficiency, often achieving near-FP32 precision levels while nearly doubling frame rate compared to PyTorch inference. For example, YOLO11m’s inference time is reduced from 40 ms to 22 ms when using FP16 precision, with no observed drop in accuracy. On average, models converted to INT8 achieve even faster processing speeds, but this comes at the cost of a slight reduction in precision. Notably, the smaller the model, the greater the drop in mAP50, typically ranging from 1% to 5%, excluding nano models, where the reduction often exceeds 10%.
Table 1 provides a detailed breakdown of the maximum achievable frames per second (fps) for YOLOv8, YOLO11, and YOLO12 models on the Jetson AGX Orin across different TensorRT precision modes (FP32, FP16, INT8). Among the evaluated models, INT8 quantization achieved the highest inference speed, with YOLOv8n reaching up to 33 fps and YOLO12x up to 17 fps. When considering the full pipeline, including preprocessing and postprocessing overhead, the practical frame rates are influenced by an additional latency component. For PyTorch inference on AGX, the combined overhead was measured at 15 ms (10 ms preprocessing + 5 ms postprocessing). For TensorRT-accelerated models (regardless of FP32, FP16, or INT8), this increased slightly to 18 ms (12 ms + 6 ms). For comparison, the same PyTorch model running on RTX 4080 incurred only 11 ms total overhead (7.5 ms + 3.5 ms), highlighting the advantage of high-end GPUs for end-to-end processing.
4.3. Visualizations
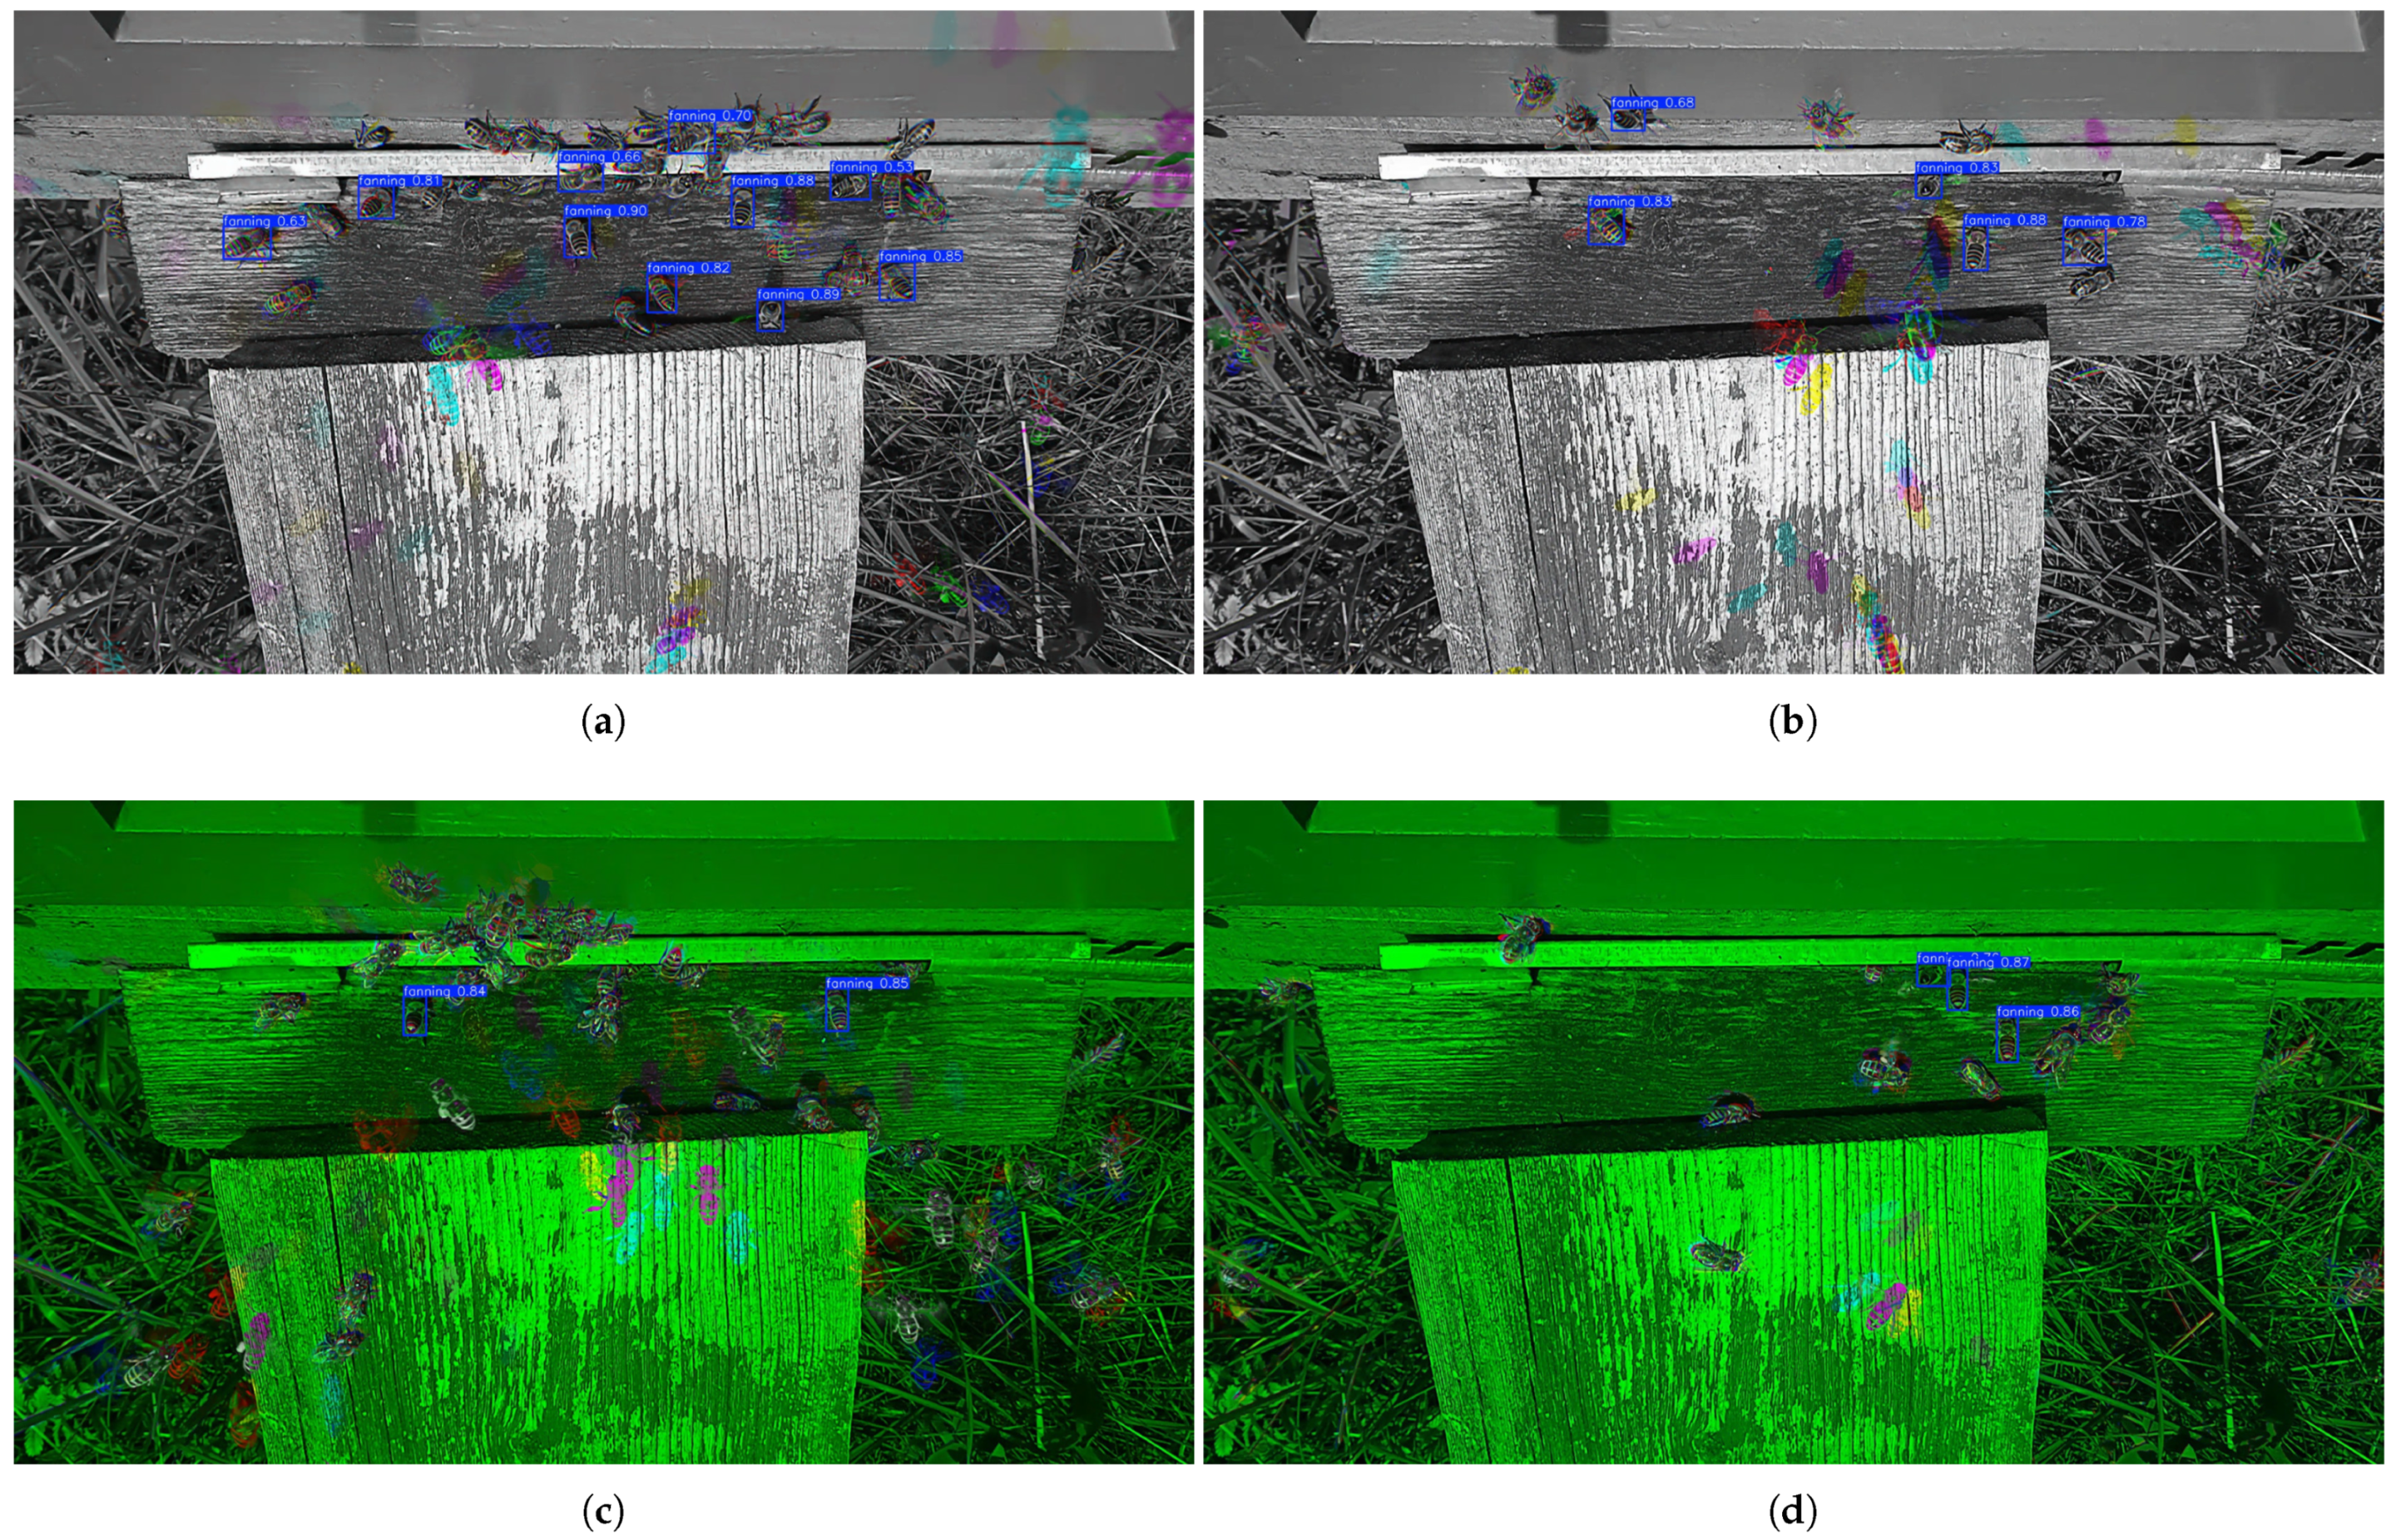
Figure 7 illustrates representative examples of fanning detection using two high-performing model–input combinations: YOLO11m with temporally stacked grayscale input,
Figure 7a,b, and YOLOv8l with temporally encoded motion input,
Figure 7c,d. These visualizations highlight the models’ ability to accurately localize fanning bees in complex visual scenes characterized by high bee density, variable lighting, and partial occlusion.
In
Figure 7a,b, YOLO11m-TSG consistently detects fanning individuals even in crowded environments, with bounding boxes placed tightly around bees exhibiting the characteristic stationary posture and wing motion blur. This demonstrates the model’s robustness in handling background clutter and overlapping individuals, which are common challenges at hive entrances.
Figure 7c,d show YOLOv8l-TEM in action, effectively leveraging temporal motion encoding to isolate and detect subtle fanning behaviors, even when the visual features are faint or partially obscured. The use of difference-based temporal encoding in TEM enhances the visibility of wing motion patterns, enabling the model to disambiguate fanning from other behaviors like walking or resting.
The qualitative results confirm the quantitative findings reported earlier: both TSG and TEM input formats significantly improve detection reliability by incorporating temporal context. These visualizations affirm that medium-to-large YOLO variants with temporally enriched inputs can support accurate and stable detection in real-world field conditions, enabling real-world deployment in hive monitoring systems.
5. Discussion
The evaluation results demonstrate that several YOLO-based detection models achieve high accuracy and favorable inference times, particularly when combined with temporally enriched input formats such as TSG and TEM. However, real-time performance is highly dependent on the target hardware platform. On the RTX 4080 GPU, all tested models efficiently meet real-time processing requirements for the 30 fps video data used during dataset collection. Even larger models like YOLOv8x and YOLO12x exceed 30 fps under PyTorch inference, indicating that high-precision detection can be achieved without compromising throughput on powerful desktop GPUs.
Contrary to initial expectations, several lightweight models on the Jetson AGX Orin platform do meet the 30 fps real-time requirement when all processing stages are included, as reported in
Table 1. Specifically, YOLOv8n and YOLO11n in FP16 mode achieve 31 fps, while INT8 versions of YOLOv8n (33 fps), YOLOv8s (30 fps), and YOLO11n (31 fps) also surpass the 30 fps threshold. However, these configurations come with a notable trade-off in detection precision, particularly for nano and small model variants, where mAP50 may drop by up to 10% or more in INT8 mode. Most mid- and large-sized models operate in the 16–25 fps range on AGX, falling short of real-time performance.
To bridge this gap and enable real-time deployment on edge devices like Jetson AGX Orin, several optimizations are recommended. The current resolution of px offers a good balance between detail and model accuracy; however, down-scaling (e.g., to or ) could significantly reduce inference time with minimal impact on detection performance, especially for larger models. Operating the input camera at a lower frame rate (e.g., 20–25 fps) can reduce the processing load while still capturing sufficient temporal information for detecting fanning behavior, which typically involves slower, repetitive motions. Applying lightweight model compression techniques could further reduce latency without retraining from scratch. Processing only every second frame and interpolating results for skipped frames is another potential trade-off strategy in latency-critical applications.
While processing efficiency has been evaluated primarily in terms of fps, power consumption plays a critical role in edge deployments, especially in battery- or solar-powered scenarios. In this study, the Jetson AGX Orin 64 GB model was operated in MAXN mode, which allows the device to scale up to 60W total system power for peak performance. During model inference, actual system power draw ranged from 30 to 40W with YOLOv8s in FP16 mode and from 26 to 34 W using INT8 quantization, depending on ambient temperature and workload intensity. Applying input downscaling or frame skipping reduced average consumption to around 22–27 W, offering meaningful energy savings. This highlights the importance of optimizing both model architecture and data input strategies to manage thermal and power budgets effectively on high-capability edge devices.
To improve detection precision, particularly for smaller model variants or INT8-quantized deployments where accuracy tends to drop, several strategies can be proposed. When hardware permits, selecting medium or large model sizes (e.g., YOLOv8m/l or YOLO11m/l) improves mAP50 considerably, especially when paired with temporal input formats. The use of TSG and TEM formats has already proven effective; however, incorporating motion saliency maps or optical flow representations could further enhance temporal sensitivity. Including more than three-frame stacks or training with frame sequences could improve model ability to detect intermittent or weak fanning signals. While current edge deployment remains challenging at 30 fps with full-resolution inputs, a combination of resolution scaling, hardware-specific optimizations, and temporal encoding refinement presents a viable path toward achieving accurate and real-time fanning detection in the field.
An observed fanning detection precision of around 85% indicates strong but not perfect model performance, which may be affected by several factors. One key issue is visual ambiguity, as fanning behavior can closely resemble other actions such as guarding, walking, or brief wing adjustments, particularly when there is partial occlusion or motion blur. This challenge is amplified in crowded scenes where bees overlap or obstruct each other, making it difficult for the model to identify distinctive visual features. Additionally, low-amplitude and irregular wing movements are often hard to detect reliably, as they may blend into background activity or appear inconsistent across frames.
Another factor is behavioral variability, as illustrated in
Figure 3. Some bees fan while in motion (
Figure 3f), while others may pause briefly during fanning (
Figure 3g). These variations interrupt the regular movement patterns that the model typically learns to recognize. Since fanning cannot always be defined by a fixed posture or location, detecting it often requires understanding how motion evolves over time.
Labeling inconsistencies in the training data may also contribute to reduced precision. For example, when fanning is only partially visible, such as when only a blurred wing or lifted abdomen is seen, annotations may differ across similar cases. This inconsistency introduces uncertainty during training and lowers the model’s confidence in detecting borderline examples.
These challenges emphasize the need for strong temporal modeling in detection systems. Improvements may be achieved by adopting more advanced motion-based representations, refining annotation guidelines, or incorporating additional input types such as optical flow or audio signals. These enhancements can help the model better separate fanning behavior from visually similar actions in difficult conditions.
Future work should also incorporate cross-validation strategies (e.g., k-fold validation or leave-one-hive-out testing) to provide a more robust assessment of model generalization across varying hive environments and seasonal conditions.
6. Conclusions
This study presents a comprehensive evaluation of state-of-the-art single-shot object detection models for identifying thermoregulatory fanning behavior in honeybees at the hive entrance. By leveraging a newly collected and publicly available dataset, we demonstrated that incorporating temporal information through input encodings such as Temporally Stacked Grayscale (TSG) and Temporally Encoded Motion (TEM) improve detection precision by 5–10% across multiple YOLO architectures. The experiments reveal that medium and large variants of YOLOv8 and YOLO11, when combined with TSG or TEM input formats, achieve high detection accuracy (mAP50 up to 85%) with inference times suitable for real-time processing on high-performance hardware like the RTX 4080 GPU. On edge devices such as the Jetson AGX Orin, only lightweight models (e.g., YOLOv8n/s, YOLO11n) meet the 30 fps requirement for real-time deployment at full input resolution; however, they suffer from a notable drop in precision, especially under INT8 quantization.
To bridge this accuracy–efficiency trade-off for embedded applications, we recommend further optimizations, including reducing model input resolution, lowering camera frame rates, or implementing frame skipping strategies. Additionally, future work should explore richer temporal representations, such as optical flow or saliency-guided motion encoding, as well as refined labeling strategies to address annotation inconsistencies that may impact model confidence. The findings indicate that deep learning-based visual monitoring of fanning behavior is feasible and promising for real-time hive health assessment on suitable hardware using motion-aware model designs. This scalable, non-invasive approach supports precision beekeeping and ecological research.


