1. Introduction
Acrocomia aculeata (macauba), a palm native to tropical and subtropical regions of Latin America, has great potential for bioeconomy. It is widely distributed across various regions of Brazil, where it is known by different names such as bocaiúva, macaíba, coco-baboso, and coco-de-espinho. In addition to the traditional use of its fruits, the utilization of macauba includes production chains related to the production of vegetable oils, biofuels, cosmetics, and health-promoting foods [
1,
2].
The sustainable cultivation of macauba not only contributes to economic development, but also offers significant environmental benefits, such as reducing pressure on native forests and vegetation areas, regeneration of degraded lands, recovery of soils, and protection of associated fauna and flora. However, efficient processing of macauba faces challenges related to variations in the maturation stages of the fruits, as immature fruits have lower oil content and inappropriate chemical composition for processing, which compromises the yield and quality of the product [
3]. This mixture of fruits at different maturation stages complicates the standardization and control of oil quality, resulting in less-homogeneous products with lower commercial value [
2].
To assess the maturity of the macauba fruit, one should note the transition of the exocarp from green to an orange-yellow hue, the slight softening detectable by gentle palpation, and the ease with which the fruit detaches from its infructescence. Mature fruits also present increased mass, a more loosely aggregated mesocarp fiber network, and a distinctly developed endocarp upon fracture. Accordingly, this research concentrates on the automatic identification of the fruit’s maturation stage via computer vision analysis, aiming to achieve this classification with an acceptable degree of accuracy.
Moreover, the availability of both dataset and network weights enables seamless integration into diverse precision-agriculture platforms. In industrial processing, automated sorting systems can leverage our pretrained model to achieve high-throughput separation of ripe macauba fruits with minimal human intervention. Equally, lightweight implementations can be deployed on unmanned aerial vehicles for in-field maturity mapping, or on smartphone applications to empower smallholder farmers with real-time assessments using standard mobile hardware. Collectively, these contributions aim to bridge the gap between cutting-edge research and practical, scalable solutions for macauba fruit management.
To date, there exists a notable paucity of research dedicated to the development of computational models for assessing the maturity of macauba fruits, rendering this investigation unprecedented in its scope and objectives. By coupling an entirely novel analytical framework with the release of a publicly accessible, rigorously annotated dataset, the present study establishes a foundational benchmark in this domain. Consequently, the absence of prior methodologies precludes direct comparative analyses; instead, our work serves as the inaugural reference point for future endeavors in automated macauba maturity detection.
The neural network was trained over a period of approximately one week using a dedicated GPU, although this duration could be substantially reduced by leveraging rented high-performance GPUs or TPUs. It is important to note that the overall training time does not influence the model’s ultimate performance, provided the process reaches completion: the algorithm incorporates an early-stopping criterion that terminates training automatically once the validation error rate ceases to decrease.
Given that the present model is trained on an intra-class dataset—comprising exclusively images of a single fruit species—there is no imperative to augment the existing image collection. Any enlargement of the dataset would yield substantive benefits only if it incorporated specimens from additional Brazilian macro-regions, thereby introducing seasonal and regional variability. Under the current design, the uniformity of the training set ensures consistent feature learning, and further image augmentation would primarily serve to address geographic heterogeneity rather than improve performance on the targeted intraclass task.
The present model was implemented using the most advanced versions of the YOLO architecture, which currently represent the state of the art in real-time object detection. Earlier YOLO iterations have been shown to underperform in terms of detection precision and were, therefore, excluded from this study’s development pipeline. As this research is principally concerned with generating highly effective pretrained weights for seamless integration into diverse application domains, investigating marginal performance differentials with alternative neural network backbones lies beyond the scope of the current project.
Ref. [
4] presents an intelligent image-based decision system for palm oil harvesting. High-resolution photos of fresh fruit bunches are processed (using YOLOv8 on Google Colab) to extract color and texture features, which train both a convolutional neural network (CNN) and a support vector machine (SVM). The CNN achieved an average accuracy of 0.97 (with a top result of 0.89), and both models demonstrated strong precision, recall, and F1 scores. By automating ripeness classification, the system reduces manual inspection, minimizes waste and labor intensity, and offers a scalable solution for smart farming.
In this context, artificial intelligence (AI) techniques based on the recognition of phytobiometric patterns present promising solutions for optimizing macauba processing [
3]. The application of advanced algorithms enables the identification and separation of fruits based on visual characteristics such as color, texture, and size, facilitating the distinction between maturation stages and improving product quality control [
5].
In family farming, this technology has the potential to increase productivity and improve product quality, providing small farmers with the opportunity to expand their businesses and generate more jobs in the rural sector [
6]. The development of these tools may also foster the emergence of startups and strengthen companies specializing in macauba processing, thereby promoting a technological innovation ecosystem for R&D [
7].
Recent advances in precision agriculture have seen the widespread adoption of convolutional neural networks (CNNs) in computer vision, significantly aiding producers by automating many manual tasks. Ref. [
8] explores how deep convolutional neural network-based techniques enable rapid and high-throughput phenotyping of grain crops by performing tasks such as plant organ analysis, stress and pest detection, and crop segmentation, demonstrating the effectiveness of CNNs in processing complex agricultural imagery. In a complementary study, ref. [
9] analyzes recent advances (2020–2023) in using CNNs for the classification and identification of agricultural images throughout the crop growth cycle—from seed screening and vegetative analysis to harvest detection and post-harvest grading—highlighting their critical role in advancing precision agriculture, which aligns with the objectives of the present research. Further reinforcing the transformative impact of deep learning in agriculture, ref. [
10] examines the automated detection of cereal heads by comparing object detection and segmentation techniques, discussing their benefits, limitations, and future research directions. Additionally, ref. [
11] investigates the application of deep CNNs for high-throughput plant phenotyping—including stress evaluation, developmental analysis, and post-harvest quality assessment—while systematically organizing current imaging techniques and outlining prospective research avenues. Collectively, these studies underscore the significant contributions of CNN-based methods to modern agricultural practices and pave the way for further innovations in precision farming.
The use of CNNs has proven highly effective in pest detection systems; for instance, ref. [
12] presented an enhanced Faster R-CNN model integrated with a feature pyramid network and ResNeXt for the rapid and accurate detection of weeds in complex field images, achieving over 95% recognition accuracy to support automated weed removal operations.
Furthermore, considerable advances in apple disease detection have enabled improved treatment strategies, as demonstrated by Qing [
13], who conducted an applied study using EfficientNet-MG—a precise, lightweight, and robust CNN enhanced with multi-stage feature fusion and GELU activation—that achieved 99.11% accuracy with only 8.42 M parameters on the newly constructed AppleLeaf9 dataset for identifying apple leaf diseases in wild environments, thereby supporting efficient disease management in smart agriculture.
Additionally, advancements in computer vision are exemplified by [
14], who developed an intelligent vision-based system employing an automatic convolutional neural network with dedicated feature extraction and classification blocks to identify medicinal plants from leaf images at various resolutions.
The inaugural YOLO model (v1) was introduced by Redmon [
15] casting object detection as a unified regression problem that processes an entire image in a single forward pass, achieving 45 FPS with competitive mAP on PASCAL VOC [
16]. Its successor, YOLOv2 (YOLO9000) by Redmon and Farhadi in 2016, incorporated batch normalization, high-resolution classifiers, anchor-based predictions, and multi-scale training—boosting accuracy to 76.8 mAP at 67 FPS on VOC 2007 and enabling detection across 9000 classes [
16]. YOLOv3, presented by Redmon and Farhadi in 2018, replaced the Darknet-19 backbone with Darknet-53, adopted multi-scale feature maps, and introduced logistic regression for objectness score, resulting in 57.9
mAP50 at 28.2 ms per image [
16]. YOLOv4, released by Bochkovskiy, Wang, and Liao in 2020, combined CSPDarknet53, mosaic augmentation, self-adversarial training, and CIoU loss to achieve 43.5 AP (65.7 AP50) on MS COCO 65 FPS [
16].
In 2020, Ultralytics released YOLOv5—available via GitHub (2.28.0 version), which transitioned the framework to PyTorch (1.7.1 version), introduced CSP backbones, a path aggregation network neck, and extensive export formats for deployment (Nano to XL) [
17]. YOLOv6 followed in 2022 with industrial optimization and streamlined inference pipelines [
17], while YOLOv7 later that year set new speed–accuracy records with trainable “bag-of-freebies” modules [
17]. January 2023 saw YOLOv8 by Ultralytics introduce an anchor-free design, hybrid FPN + PAN neck, and support for detection, segmentation, and pose estimation across five model scales [
16]. Beyond these core releases, a host of community-driven YOLO variants emerged under the v9–v12 banner. YOLOv9 is primarily documented through technical comparison pages rather than formal publication [
17]; YOLOv10 (May 2024) advanced efficiency-driven stem and head designs with larger kernels and NMS-free training strategies [
18]. September 2024’s YOLOv11 demonstrated enhanced backbones and multi-task capabilities, outperforming predecessors in vehicle and small-object detection [
19]. Most recently, YOLOv12 introduced attention-centric modules—7 × 7 separable convolutions with FlashAttention and optimized R-ELAN backbones—to match CNN speeds while surpassing prior mAP benchmarks across COCO and real-time DETR variants [
20,
21].
Moreover, the application of architectures such as YOLO, one of the most robust current architectures, is on the rise. This algorithm has demonstrated significant versatility in applications ranging from defect detection in transmission line insulators [
22] (YOLOv5) to enhanced underwater-object detection models [
23] (YOLOv8). The application of YOLO is not limited to agriculture but also extends to military domains, such as ship detection. For example, ref. [
24] enhances ship detection by integrating a feature-specific module into an improved YOLOv5 algorithm, thereby reducing false alarms and increasing detection accuracy in high-resolution maritime images. Similarly, ref. [
25] follows a comparable line of research with a more recent version. Their study presents CSD-YOLO, an enhanced ship detection algorithm based on YOLOv8 that incorporates a context-guided block module, slim neck, and deformable large kernel attention to overcome occlusion and environmental challenges. Similar work in agriculture has also been successful with this type of model, such as the detection of apple inflorescences in the field as well as the detection and counting of tomato and strawberry growth [
26,
27,
28].
YOLOv11 and YOLOv12 architecture was selected due to its ease of implementation and code optimization in Python (3.13 version), as well as its excellent performance in recent years and the continual growth of its developer community. Its 2024 release introduced optimizations that positioned it as a state-of-the-art neural network, competing for the best performance metrics available. Moreover, an evolution of this family (YOLO) would offer advantages such as enhanced inference speed, improved detection precision through refined bounding boxes and advanced training techniques, a lighter architecture incorporating new feature extraction modules, superior identification of small and densely clustered objects, and increased robustness and adaptability in varied lighting conditions and complex backgrounds. Ref. [
29], when using the YOLOv4 model for yield estimation in an orange orchard, observed an mAP of 0.908, indicating a simple, practical, and effective method for detecting and estimating orange fruit yield in an orchard. Similarly, the results of [
30], who evaluated the detection efficiency of apples at harvest in the field, corroborated the findings of this study, where their network showed an mAP of 0.9713.
While YOLOv12 has recently been released, YOLOv11 continues to be celebrated for its substantial advancements in performance and robustness over its predecessors. Key architectural improvements enable faster inference times and reduced computational overhead, facilitating real-time applications across diverse scenarios. Additionally, the integration of advanced regularization and optimization algorithms further enhances the model’s generalization capability, mitigating errors in environments characterized by varying illumination, backgrounds, and overlapping objects. Furthermore, it offers a more flexible hyperparameter tuning interface, allowing customization for specific computer vision tasks. Collectively, these innovations yield notable gains in object detection accuracy and broaden the model’s applicability to a wider range of research and industrial contexts. These enhancements ensure that YOLOv11and YOLOv12 are robust and widely adopted versions for real-time applications, even as YOLOv12 represents the newest entry in the YOLO series.
YOLOv11 and YOLOv12’s ability to detect small objects is largely attributed to its multi-scale detection architecture and the use of convolutional layers that preserve high-level features across different resolutions. Specifically, the combination of feature pyramids and bounding boxes anchored at various sizes enhances the model’s sensitivity to subtle details, ensuring greater precision even in high-noise or cluttered scenes. Additionally, the integration of advanced non-maximum suppression (NMS) techniques mitigates redundant detections, thereby enabling the reliable identification of diminutive objects across a wide range of computer vision applications.
This study is pioneering in proposing the use of trained neural networks for the recognition of phytobiometric patterns of macauba with the creation of open image databases of fruits at different maturation stages. These databases can foster collaboration between universities and companies, both national and international, and open a new research field focused on this under-explored native species.
To develop the algorithm, it is essential to clearly define maturation criteria, such as color, texture, and size, and to record images of fruits from different angles to capture natural variations. Providing an open database has the potential to encourage academic and technological advancements, thereby expanding the knowledge and applications of macaques in the bioeconomic context. In post-harvest processes, the adoption of AI systems contributes to the optimization of processing, allowing greater accuracy in separating fruit batches according to their maturation stages. This reduces the costs associated with product normalization and results in oils of higher quality and commercial value. The study will serve as an information base for comparisons with other neural networks of other architectures and programming languages that use the same performance parameters addressed in this work.
Thus, the goal is to develop an artificial intelligence-based system with deep convolutional neural networks, aimed at recognizing phytobiometric patterns, to identify the maturation stage of macauba fruits through images, thereby improving the quality and competitiveness of the product resulting from the processing of macauba fruits using various methods. This study presents the development of the first public Immature Macauba dataset (
https://doi.org/10.5281/zenodo.14807997, (accessed 5 February 2025)). Additionally, it compares training procedures involving images with and without backgrounds, providing an assessment of which model proves more efficient according to the criteria established. The project’s source code is available upon request via email and employs YOLOv11 and YOLOv12, released in 2024. The neural network weights may be utilized for training VIC02, which is currently under development. Finally, the study offers a clear and concise methodology that ensures the replicability of the model.
2. Materials and Methods
The experiment was conducted in the municipality of Lavras, at the Limeira farm, near the BR 265 highway (21°15′6.24″ S, 44°55′27″W, 846 m altitude) in the southern part of Minas Gerais on 25 September 2024.
A. aculeata (
jacq.)
Lodd. ex Mart. were harvested (
Figure 1). The plants were approximately 7–8 m tall and located in a cattle pasture area. The palm trees from which the bunches were extracted grew spontaneously on private property and were made available for scientific research with prior authorization. The collection was performed with the help of a steel ladder, using appropriate PPE for working at height. Before cutting, tarps were placed at the base of the palm tree to catch the fruits and prevent loose fruits from falling into the pasture, which was approximately 10–20 cm tall.
The bunches were placed in plastic bags before being cut using a pruning saw to cushion the fall and minimize mechanical damage to the fruits. Random samples consisting of 50 fruits from selected bunches were chosen. For the information bank, fruit biometrics were measured using a digital caliper, which measured the diameter of all samples taken from the bunch and had an average lateral diameter of 4.8 cm. Visual analysis of the epicarp color of the fruit, combined with an understanding of the fruiting seasonality of the palms in the region, allowed the gathering of fruit samples before the physiological maturity stage (slightly greenish color), followed by maturation stages (external texture, in which it is in Stage III (III), where growth slows down and all the structures of the fruit are completely differentiated) 6 and 7 of the visual texture pattern [
31] (
Figure 2). In this figure, we see the stages of the fruit’s external textures (1–10), listing their time spans in weeks on the horizontal axis (2–62). In addition, we can analyze the expected enhanced oil productivity of the fruit.
After harvest, fruits were removed from the bunches and randomly selected from a batch of 50. They were then washed with running water to remove dirt and debris, and temporarily stored in a metal bucket with a nylon mesh screen with openings of approximately 0.6 mm. The fruits were left for 48 h in a ventilated, shaded area to avoid accelerating the maturation process and to maintain their visual appearance until the beginning of photography.
We employed a uniform sample of 50 macauba fruits, each systematically rotated through 32 discrete orientations under varying illumination conditions to maximize the visual expressivity of the dataset. By capturing each fruit at multiple angles and light positions, we ensured that our model was exposed to a wide range of appearance variations—shadows, highlights, and texture nuances—thereby enhancing its robustness to real-world imaging scenarios. It is further important to note that all fruits originated from the same inflorescence, harvested within a single seasonal window; this common provenance minimizes intraclass variability in local surface texture and color, allowing us to ascribe observed performance differences primarily to the effects of pose and lighting rather than underlying phenotypic heterogeneity.
The VIC01 database was constructed using images captured with a Canon EOS Rebel T100 camera equipped with a 50 mm lens (Made in Taichung in Taiwan). The collected fruits constituted components of the first VIC01 database. Photographs were taken in different environments and lighting conditions to capture images that more comprehensively and accurately reflected the appearance of the macauba fruits. For this purpose, a tripod with a fixed position was used to ensure that the camera remained in the same position for image capture. The distance between the camera and the fruit ranged from 30 to 50 cm, and this distance was determined based on the perspectives of different applications of the algorithm.
A white base and background were used to isolate the fruit characteristics more effectively, allowing an enhanced focus on texture, color, and shape. The camera resolution was set to 3456 × 3456 pixels, and each image was processed individually. The selected file format was the PNG. A total of 1600 photographs of immature fruits (green tone) were taken to compose the VIC01 database. These photographs were taken at six different positions for each fruit, rotating them 90° three times around their axes and photographing the two flattened poles of the fruit.
We propose the establishment of a structured image database comprising 1200 training images, 300 validation images, and 100 test images in order to underpin robust machine-learning model development and evaluation. Empirical evidence across computer-vision domains indicates that a training corpus of this magnitude provides sufficient sample diversity to ensure feature-learning stability and convergence, while a 300-image validation set enables rigorous hyperparameter optimization and early-stopping mechanisms without overfitting. The reserved 100-image test partition affords an unbiased assessment of model generalization and performance metrics with acceptable confidence intervals. By adopting this tri-partition schema, our project will adhere to best practices in dataset design—balancing statistical power, computational feasibility, and reproducibility—thereby delivering a reliable benchmark for future research endeavors [
27,
29,
30].
Regarding ambient lighting, the experiment organized image capture into three distinct scenarios: one in an indoor setting without artificial lighting, another in an indoor setting with artificial lighting, and a third in an outdoor setting with natural light. This methodological approach enables the neural network’s weights to recognize various lighting conditions, thereby enhancing its applicability in both rural environments and industrial facilities.
Five hundred photographs were taken without local artificial lighting and 500 with local artificial lighting. In addition, 500 initial photographs of unwashed fruits were taken, and 500 photographs were taken after washing with running water to remove dust, dirt, and debris from the surface. Images were captured with and without background for analysis. Preprocessing was not applied to remove noise or imperfections from the images, and no artificial lighting adjustments were made.
The database was structured and stored on Google Drive, allowing centralized and secure access to the files. The images were cataloged in folders organized according to specific categories, and each file was named according to a standard naming convention that identifies its key characteristics. In addition, a shared txt document details the metadata of each image, facilitating the search and cross-referencing of the relevant information. This structure and cataloging of data provide greater robustness to the methodology, ensuring efficiency in the analysis process and ease of replication of the project in different scenarios. Once the database was built, 1200 images were designated for training, 300 for validation, and 100 for random inference testing. All photographs were randomly reordered during the database creation.
The initial number of epochs was chosen based on preliminary training experiments, which suggested that, on average, training with this dataset size and the specified image resolution would converge in no more than 200 epochs.
The native back-end environment used in this project was Linux Ubuntu 22.04 LTS, providing optimizations for native bash scripting, C, and Python (3.10.12). With the adoption of YOLOv8, Darknet was replaced with the PyTorch framework. The openCV library was used for image visualization and manipulation, which is recognized for its extensive portfolio of functions, including the visualization and conversion of color channels. This study also used LabelImg, an image annotation tool widely employed in the field of computer vision, and Segment Anything Model 2 (SAM 2), developed by Meta, for the semantic segmentation of macauba fruits. For validation, a precision–recall curve was generated using formulas to calculate precision and recall (
1) and (
2).
where TP is the true-positive rate, FP is the false-positive rate, and FN is the false-negative rate. The data were processed and compared in detail, considering the methodological approach and tools used in the study from the theoretical foundation to neural network management. With respect to the normalization methodology (image standardization) for the VIC01 Database, the following procedures were carried out:
Collection and Screening: Images were collected and reviewed, discarding any corrupted files or those lacking a clear depiction of the fruit.
The camera features an original aspect ratio of 3:2, with resolutions ranging from a minimum of 720 × 480 to a maximum of 5184 × 3456 pixels. Additionally, the aspect ratio can be adjusted to a square format (1:1), resulting in a resolution of 3456 × 3456 pixels, which has been adopted as the standard for the photographs.
Resolution Standardization: A fixed resolution of 3456 × 3456 pixels was established to maintain consistency across all images.
Quality Verification: Subsequently, each file was inspected to identify any distortions or inconsistencies.
Storage: Finally, the normalized images were saved in PNG format, accompanied by metadata and processing information. These files are made available in an online repository at [
https://doi.org/10.5281/zenodo.14807997].
The YOLOv11 version was chosen for this study due to its significant advancements over previous versions. Compared to its predecessors, YOLOv11 features an enhanced architecture that optimizes feature extraction, providing greater accuracy in object detection even in complex environments. Moreover, the optimization of training and inference processes results in superior speed and remarkable robustness—essential attributes for real-time applications. These improvements, combined with its scalability and ease of integration with other systems, fully justify its adoption to more effectively meet the project’s demands. Therefore, given the numerous advantages of YOLOv11, there was no need to conduct tests with earlier versions, whose shortcomings in performance and efficiency were clearly demonstrated on the official developer’s website
https://ultralytics.com (accessed on 30 January 2025).
YOLOv11 delivers substantial enhancements over previous versions by incorporating advanced feature-fusion strategies and an optimized anchor design, as detailed in the Ultralytics release notes. Its deeper residual backbone, coupled with dynamic multi-scale fusion modules, significantly improves small-object detection and overall precision, while the refined anchor clustering algorithm reduces manual tuning and enhances cross-dataset generalization [
32]. These combined improvements result in faster convergence and higher mAP scores compared to YOLOv10 and earlier iterations, as demonstrated in the official Ultralytics benchmarks. Building on these gains, YOLOv12 introduces attention-centric innovations and an adaptive backbone architecture to further elevate real-time detection performance. The integration of 7 × 7 separable convolutions with FlashAttention enables the model to focus computational resources on salient image regions without sacrificing throughput, and the R-ELAN backbone’s adaptive depth scaling offers a flexible trade-off between accuracy and efficiency. According to the Ultralytics YOLO documentation, these advancements allow YOLOv12 to surpass YOLOv11 in both COCO mean average precision and inference speed, setting a new standard for state-of-the-art object detectors [
33].
In our study, we employ several standard evaluation metrics to quantify detection performance. Intersection over Union (IoU) measures the overlap between predicted and ground-truth bounding boxes as the ratio of their intersection to their union, serving as the foundational criterion for true-positive assignments. Mean Average Precision at 0.50 IoU (mAP50) computes the area under the precision–recall curve when detections with IoU 0.50 are considered correct, while mAP95 averages precision across multiple thresholds from IoU = 0.50 to 0.95 in increments of 0.05, thereby providing a more stringent assessment of localization accuracy. The F1 Score, defined as the harmonic mean of precision and recall, balances the trade-off between false positives and false negatives in a single scalar. Finally, the confusion matrix tabulates true positives, false positives, true negatives, and false negatives across all classes, offering a granular view of model errors and enabling targeted analysis of misclassification patterns.
3. Results
The application of image classifiers and detectors based on the YOLOv11 algorithm to identify macauba fruit in background-free image models represents a significant advancement in computer vision. It was possible to identify and classify macauba fruits in images where the background was removed, simplifying visual analysis and reducing interference from distracting elements. The results obtained with this implementation for the detection and classification of macauba fruits in background-free images demonstrated a considerable increase in precision. Models trained using this approach can identify fruit more quickly and provide real-time data.
Figure 3 shows the development applied to batches of 16 images for training on background-free images (batches 751 and 752), which were used as inputs in the convolutional layers of the algorithm.
Figure 4 shows the development applied to batches of 16 images for the classification and prediction of background-free images. The dependencies of ultralytics (8.3.31) on Python (3.10.12), Torch (2.5.1), and CU121 (CUDA:0 for NVIDIA A100 SMX4 40 GB, 40.514 MB) were used for classification results. The batches obtained resulted from the execution of the task (detect) in (train) mode using the yolo11x.pt model over 200 epochs.
Table 1 and
Table 2 present the results obtained after the validation of the training, which were obtained for the class Immature Macauba (“Macuba Imatura”), and highlight the performance of the developed model. With 300 images and 300 instances analyzed, the model achieved precision (precision) and recall (recall) both equal to 1.0.
Table 1 summarizes the YOLO11x model’s configuration for inference on background-free images. After layer fusion, the network comprises 464 optimized layers and approximately 56.8 million parameters, with all gradient computations disabled, confirming its deployment-ready state. The measured computational cost of 194.4 GFLOPs per image is marginally lower than that of the non-fused variant, thereby facilitating efficient execution on resource-constrained platforms.
Table 2 reports the post-validation detection performance for the “Immature Macauba” class over 300 images and 300 instances. Both precision and recall attain a value of 1.00, indicating flawless identification with no false positives or false negatives. An
mAP50 of 0.995 reflects near-perfect spatial accuracy at an IoU threshold of 0.50, while an
mAP50–95 of 0.968—averaged across IoU values from 0.50 to 0.95—demonstrates the model’s high robustness under increasingly stringent overlap criteria. Where
C is the class,
Im is the number of images,
In is the number of instances,
P is Precision,
R is Recall, and
mAP is the mean average precision for 50% and 95% confidence levels.
This performance indicates that the model made no errors in identifying instances of this class and detected all occurrences without generating false positives or negatives. Additionally, the mAP50 and mAP50–95 values reached 0.995 and 0.968, respectively, reflecting high consistency in detection at different intersection over union (IoU) thresholds. Intersection over union (IoU) quantifies the spatial overlap between a predicted bounding box and its corresponding ground-truth annotation by dividing the area of their intersection by the area of their union. In practice, the model computes the IoU for each detected object to assess localization accuracy: An IoU of 1.0 indicates perfect alignment, whereas lower values reveal partial or poor overlap. During evaluation, a detection is considered correct only if its IoU exceeds a predefined threshold (e.g., 0.50 for mAP50), thereby penalizing both misaligned predictions and spurious detections. By reporting the mAP at multiple IoU thresholds (from 0.50 to 0.95), the performance metrics capture the model’s ability to maintain precise object localization under increasingly stringent overlap criteria, ensuring that high scores correspond to both accurate classification and exceptionally precise bounding-box placement.
These metrics suggest that the model is not only highly accurate under ideal conditions (
mAP50) but also maintains superior performance even when the evaluation criteria are stricter (
mAP50–95). These results demonstrate the effectiveness of the model and its ability to identify instances accurately. Unlike background-free images, background images (with background) contain various elements that can interfere with detection accuracy, requiring the model to be sufficiently robust to distinguish macauba fruits in different contexts and background scenarios.
Figure 5 shows the development applied to batches of 16 images for training on the background images (batches 14,251 and 14,252) used as inputs in the convolutional layers of the algorithm.
Figure 6 shows the development applied to batches of 16 images for the classification and prediction of on-background images.
3.1. Post-Training Process Results Analysis (On Background)
The discrepancy between the two summaries arises not from the training process but from how the model is configured for inference. In the standard summary, each component—Conv2D layers, BatchNorm layers, activation functions, and other blocks—is listed separately, yielding 631 total layers, approximately 56.876 million trainable parameters (with gradients enabled), and an estimated 195.5 GFLOPs. In contrast, the “fused” summary merges these sequential operations into single, optimized units, reducing the layer count to 464. The BatchNorm statistics are folded into the convolutional weights, which slightly lowers the parameter count to 56.829 million and disables gradients by placing the model in inference mode. Moreover, this fusion marginally decreases the computational cost to about 194.4 GFLOPs. In other words, it is the same trained YOLO11x model, but optimized for reduced latency and greater execution efficiency in deployment. The discrepancy between the two YOLOv12x summaries arises not from any change in the training process but from how the model is structured for inference. In the standard summary, each element—Conv2D layers, BatchNorm layers, activation functions, and other components—is listed separately, yielding 488 total layers, approximately 59.120 million trainable parameters (with gradients enabled), and an estimated 199.8 GFLOPs. In contrast, the “fused” summary merges these sequential operations into single, optimized units, reducing the layer count to 283. Folding the BatchNorm statistics into the convolutional weights slightly decreases the parameter count to 59.044 million and disables all gradients by placing the model in inference mode. Moreover, this fusion marginally lowers the computational cost to about 198.5 GFLOPs. In other words, it is the same trained YOLOv12x model, reorganized to achieve lower latency and greater execution efficiency in deployment
Table 3.
3.2. Post-Validation Process Results Analysis
Table 4 summarizes the post-validation performance of YOLO11x and YOLO12x on the “Immature Macauba” class. Both models achieved perfect recall (
) over 300 validation instances, indicating that no true positives were missed. YOLO11x attained perfect precision (
), whereas YOLO12x exhibited a marginal reduction (
), reflecting a small number of false positives. At an intersection over union (IoU) threshold of 0.50, both models reached an identical
of 0.995, demonstrating equivalent detection accuracy under this criterion. However, when averaging the precision over a range of IoU thresholds from 0.50 to 0.95, YOLO11x maintained a higher
(0.973) compared with YOLO12x (0.929). This discrepancy indicates that YOLO12x, despite matching YOLO11x in coarse-grained detection performance (IoU = 0.50), yields less precise bounding-box localization under more stringent overlap requirements. Consequently, YOLO11x not only delivers flawless classification of the target class but also exhibits greater consistency in spatial accuracy across varying IoU thresholds, whereas YOLO12x incurs a slight degradation in both precision and localization robustness.
3.3. Post-Validation Process Results Analysis
During the preprocessing stage, the plotting command generates an image with bounding boxes and class labels superimposed, saving it for the visual verification of annotations. The parameter optimizer = auto instructs the system to automatically select the most appropriate optimization algorithm and tune initial hyperparameters, overriding any manually specified values for lr0 and momentum.
In the context of training computer-vision models, momentum refers to an optimization technique that accelerates gradient descent by accumulating a decaying moving average of past gradients—effectively allowing the optimizer to build “inertia” in parameter updates, smooth oscillations, and traverse shallow regions of the loss landscape more quickly. The initial learning rate (lr0) denotes the step-size hyperparameter at the start of training, controlling how far the model parameters move in the direction of the negative gradient; selecting an appropriate initial learning rate is critical, as values that are too large can cause divergence while values that are too small may lead to prohibitively slow convergence.
If it were applied, the value
lr0 = 0.01 would denote the initial learning rate, determining the magnitude of weight updates at each iteration. However, owing to the activation of
optimizer = auto, this value is disregarded. Similarly,
momentum = 0.937—which, in SGD-type optimizers, functions as inertia to smooth parameter updates by incorporating information from preceding gradients—is also ignored under the automatic configuration. Subsequently, the system selects the
AdamW optimizer with
lr=0.002 (a conservative initial learning rate characteristic of
AdamW) and
momentum = 0.9, corresponding to the exponential decay coefficient for the first moment estimate. To implement differentiated regularization, the model parameters are partitioned into three groups: the first, 205 weight tensors with
decay = 0.0, typically associated with layers that should not undergo weight decay; the second, 214 weight tensors with
decay = 0.0005, which receive L2 penalization to mitigate overfitting; and the third, 211 bias tensors with
decay = 0.0, since bias terms are generally exempt from regularization. Finally, by specifying
Image sizes 640 train, 640 val, the configuration ensures that all training and validation images are resized to 640 × 640 pixels, thereby maintaining consistency in the input dimensions for the model. These results are shown in
Table 5.
Table 6 reports the mean per-image processing time broken down into preprocessing, inference, loss computation, and postprocessing stages. Both YOLO11x and YOLO12x require 0.1 ms for preprocessing, indicating that image resizing, normalization (image standardization), and format conversion are identical. Inference on YOLO11x takes 3.9 ms, whereas YOLO12x requires 6.7 ms, reflecting its increased architectural complexity. Loss computation time is effectively zero for both models, since measurements were taken in inference mode without backpropagation. Postprocessing requires 1.8 ms for YOLO11x and 1.2 ms for YOLO12x, likely owing to a reduced number of raw detection proposals or fused layer optimizations. Consequently, the total mean processing time per image is approximately 5.8 ms for YOLO11x and 8.0 ms for YOLO12x. These findings indicate that although YOLO12x may deliver enhanced detection accuracy, it incurs higher overall latency, which is partially mitigated by more efficient postprocessing.
4. Discussion
The application of semantic segmentation techniques for the identification and analysis of macauba fruit is highly effective. In this context, segmentation enabled the precise distinction of fruits in images of different resolutions, both low (500 × 500) and high quality (3456 × 3456), even under adverse lighting and background conditions. The process showed high fidelity in delimiting fruit boundaries and minimizing overlap and fragmentation errors in segmented regions. The generated visualizations presented enhanced clarity and detail, facilitating quantitative and qualitative analyses of the morphological characteristics of macauba fruits. Based on the results obtained, the final model can be implemented in systems for counting, distribution, and size estimation of fruits.
Figure 7 and
Figure 8 show the results. The comparison between the two models using distinct datasets with resolutions of 500 × 500 pixels without backgrounds and 3456 × 3456 pixels with backgrounds revealed significant differences in the detection performance. Both the models achieved high levels of precision and recall when identifying the target class. However, the model trained with high-resolution images and backgrounds exhibited a slight advantage in terms of
mAP50–95 metrics.
Figure 9 and
Figure 10 show the condensed results of the predictions.
4.1. Performance Metrics During Training
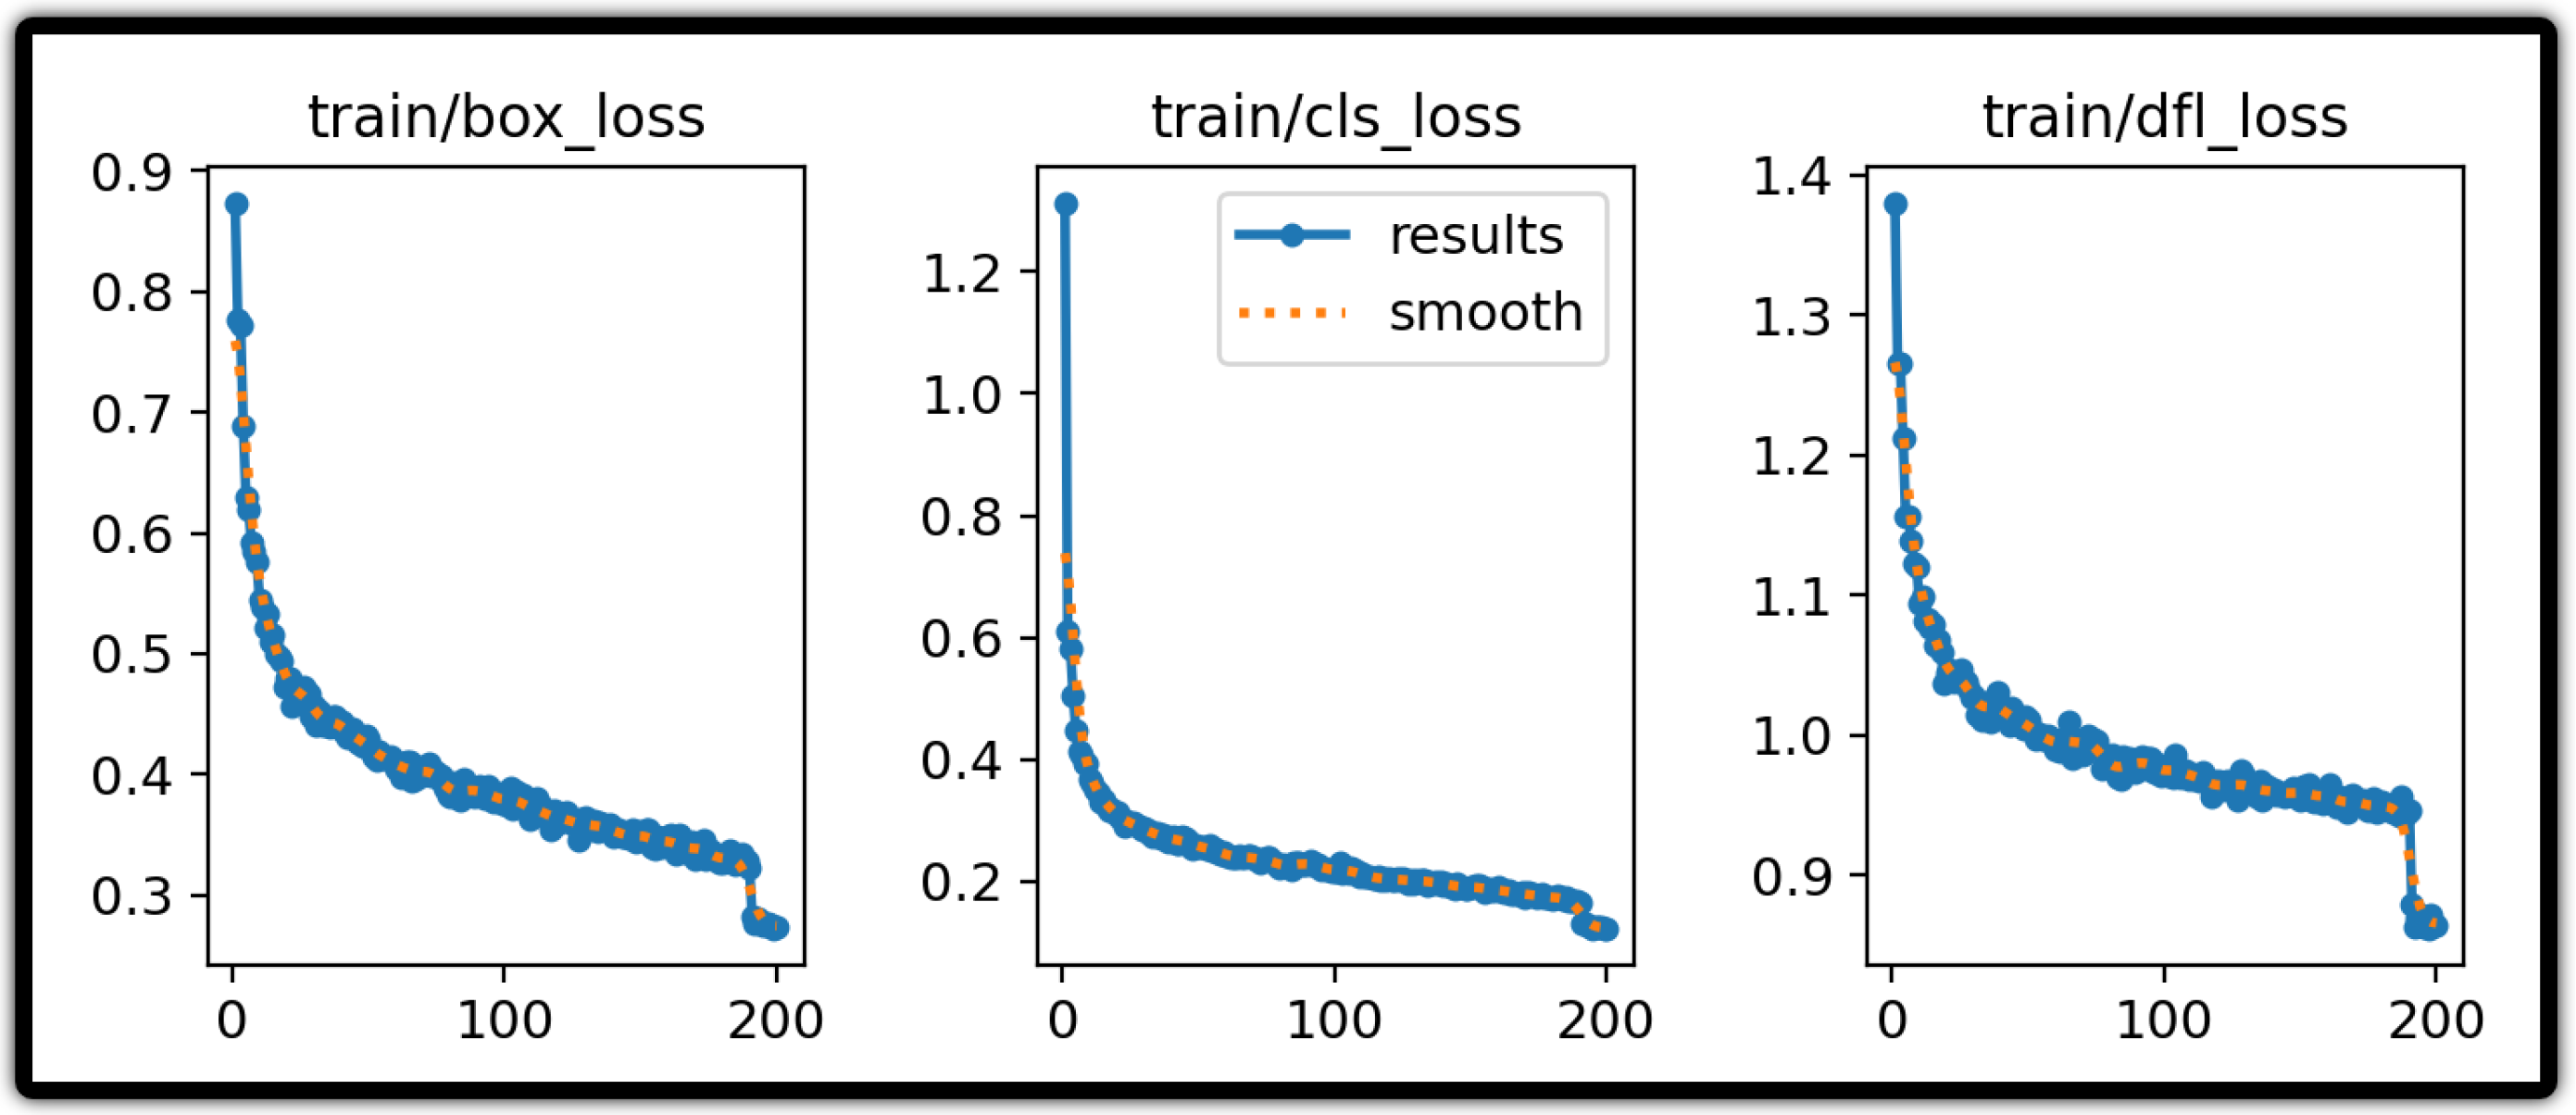
The performance analysis of the model revealed a consistent decrease in training losses, reflecting qualitative improvements in localization and classification capabilities. The gradual reduction in the train/box_loss metric indicates that, throughout optimization, the model improved its ability to predict object boundaries accurately, demonstrating the effectiveness of the regularization strategies and parameter tuning. Similarly, the decline in train/cls_loss demonstrates enhanced discrimination of the “Immature Macauba” class, indicating that the model learned to distinguish intraclass variations such as changes in lighting, viewing angle, and background and, thus, generalized its predictions with greater confidence. Finally, the smoothing of the train/dfl_loss signals a refinement in modeling bounding-box coordinates, reinforcing the model’s capacity to fine-tune predictions to the fruits’ actual dimensions. Together, these trends suggest that the model has reached a robust training stage ready for deployment in localization and classification tasks, and that analogous behaviors are observed in the validation losses val/box_loss, val/cls_loss, and val/dfl_loss.
The two sets of training loss curves reveal a clear contrast in convergence behavior between YOLO11x and YOLO12x. In the YOLO11x charts, the box-regression loss falls steadily from about 0.87 at epoch 1 to roughly 0.27 by epoch 200, the classification loss declines from approximately 1.30 to 0.12, and the distribution-focal loss (DFL) drops from about 1.38 to 0.86. By contrast, YOLO12x—trained for only 106 epochs—sees its box loss decrease from around 0.94 to 0.38, its classification loss from 1.29 to 0.21, and its DFL from 1.49 to 1.00. Although both models exhibit a rapid initial loss reduction followed by a slower, smoothing tail, YOLO11x achieves substantially lower final loss values across all three components, indicating a more thorough optimization of bounding-box regression and class predictions. In contrast, YOLO12x converges to higher residual losses, suggesting that its deeper architecture may require additional epochs or further tuning to match the convergence depth of YOLO11x (
Figure 11 and
Figure 12).
4.2. Confusion Matrix Analysis
In the non-normalized confusion matrix for YOLO-v11x, all 300 “Immature Macauba” samples are correctly classified as such, with no false positives or false negatives and no background predictions—only the diagonal cell contains a count of 300, and every off-diagonal cell is zero. By contrast, the YOLO-v12x non-normalized confusion matrix also shows 300 true positives for “Immature Macauba”, but it commits 23 false positives by mislabeling background samples as the target class and records zero true negatives for the background. In other words, while both models achieve perfect recall on the macauba class, YOLO-v12x sacrifices specificity—evidenced by its 23 incorrect background classifications—whereas YOLO-v11x maintains 100% precision by entirely rejecting non-object regions (
Figure 13).
In the normalized confusion matrix for YOLO-v11x, every “Immature Macauba” instance is correctly classified—the only nonzero cell lies at the intersection of true positives and predicted positives, yielding a fully saturated diagonal with no false positives or false negatives. By contrast, the YOLO-v12x confusion matrix also shows perfect detection of the “Immature Macauba” class (normalized value of 1.00 on the diagonal) but reveals a critical failure in background discrimination: All background samples are systematically labeled as “Immature Macauba”, as evidenced by the 1.00 entry in the background false-positive cell, and there is no cell corresponding to correct background predictions. In other words, although both models achieve 100% accuracy on the target class, YOLO-v11x reliably rejects non-object regions, whereas YOLO-v12x completely fails to distinguish background, compromising its robustness in contexts where background clutter is present (
Figure 14).
4.3. PR Curve Analysis
In both precision–recall plots, the behavior is essentially identical: Precision remains at its maximum value (1.00) over nearly the entire recall range, collapsing abruptly only when recall reaches 1.00. In each figure, the curve for the “Immature Macauba” class and the aggregated curve for all classes overlap almost perfectly, reflecting an
mAP0.5 of 0.995. Consequently, there are no substantive differences between the two plots: Both demonstrate that the model sustains perfect precision until the extreme limit of recall, indicating an ideal balance between precision and sensitivity across all thresholds and suggesting indistinguishable performance between the two versions analyzed. However, it is important to highlight that, despite the exceptional performance observed, continuous validation of the model on different datasets and operational conditions is necessary to ensure its generalization and applicability in real-world scenarios. The consistency of these results in various environments strengthens the reliability of the model and its suitability for practical applications that require high precision and reliability for object detection. The dynamics of the PR graph are shown in
Figure 15.
4.4. F1 Score Analysis
The F1 score, defined as the harmonic mean of precision and recall, provides a balanced assessment of a model’s performance by considering both false positives and false negatives. Analysis of this curve offers insights into how the model balances these two error types across various thresholds. When the F1 score is unbalanced, it indicates a disparity between precision and recall. In this case, however, the graph presented in
Figure 16 demonstrates a strong equilibrium between precision and recall, thereby supporting the proposed model’s validity. In the first plot, the aggregated F1-score curve reaches its maximum value of 1.00 only when the confidence threshold approaches approximately 0.918, remaining nearly constant between 0.99 and 1.00 from the start of the interval until that point, and then plummeting abruptly to zero at higher thresholds. The curve for the “Immature Macauba” class follows this same pattern, exhibiting only minimal variations around the optimal threshold. In contrast, the second plot shows that the aggregated F1 score attains 1.00 at about 0.798 and remains stable across a broad plateau, with F1 exceeding 0.95 over a threshold range of roughly 0.10 to 0.80. Moreover, the initial ascent of this curve is more gradual, indicating greater model tolerance to low confidence thresholds, whereas in the first plot, the performance is essentially at its maximum even at minimal confidence. In both cases, the “Immature Macauba” curves mirror the aggregated behavior, albeit with slight oscillations. These findings suggest that the second model not only achieves the optimal balance between precision and recall at a lower confidence threshold but also demonstrates a significantly more robust and flexible performance, allowing the use of reduced thresholds without a substantial loss in detection quality. A threshold of 80% was adopted during the algorithm’s inference phase, effectively preventing confusion between macauba fruits and other species unless the neural network weights are trained on additional plants. In real-world applications, false positives (FP) tend to be more frequent when the detection threshold is set below 80%, particularly in diverse datasets.
Several factors may explain why YOLO 12 performed slightly below YOLO 11 on our dataset. First, the new attention blocks in YOLO 12 often demand careful tuning of learning rates and regularization—settings we left at their defaults—which may not have been optimal. Second, YOLO 12’s deeper backbone and separable convolutions increase model complexity, which can lead to modest overfitting when training data are limited. Third, changes in anchor sizes and loss weighting between versions can shift the balance between precision and recall, causing a few fewer correct detections at our chosen confidence threshold. Finally, YOLO 12’s default augmentation and training schedule differ from YOLO 11’s more mature defaults, suggesting that additional adjustment of its training pipeline could bring its performance fully in line with or even above that of YOLO 11.
The current sample size of our experiment, while sufficient for initial model training and evaluation, imposes constraints on the generalizability of our findings. Increasing the number of images—particularly by diversifying the training, validation, and test splits—would enhance the statistical power of our analyses and reduce the margin of error in performance estimates. Future work will, therefore, focus on expanding the dataset to capture a wider spectrum of intra-class variability, ensuring that our neural network models remain robust under more demanding real-world conditions. A further limitation arises from our reliance on a single macauba palm species and a confined geographic area for image collection. This narrow sampling frame may inadvertently bias the model towards local phenotypic traits and environmental factors, limiting its applicability to other subspecies or cultivation zones. To address this, we plan to extend our data collection to additional biogeographic regions and related palm species, thereby constructing a truly representative dataset that supports cross-regional transferability and broader agronomic utility. Finally, we recognize potential biases introduced by our controlled imaging protocol—specifically, the use of standardized artificial lighting and the exclusion of visually damaged or occluded fruits. Such conditions streamline annotation but do not fully reflect the variability encountered in natural field settings, where illumination may fluctuate and fruit quality can vary widely. Subsequent studies will incorporate heterogeneous lighting scenarios, background clutter, and a spectrum of fruit conditions (including blemished or partially occluded specimens) to mitigate these biases and to ensure that the trained models generalize effectively to operational harvesting and quality-assessment contexts.
The neural network weights produced by our YOLO model could be readily adapted for deployment on edge devices—such as modern smartphones—by exporting to mobile-optimized formats (e.g., TensorFlow Lite or ONNX) and utilizing on-board hardware accelerators (DSPs, NPUs) to enable near real-time inference within user applications. Likewise, these same weights could be integrated into industrial sorting lines for macauba fruit by embedding the model within vision controllers paired with high-speed cameras; fruits would be classified by maturation stage, and corresponding actuators could then direct each fruit into the appropriate processing stream. This flexible deployment framework would support both decentralized, in-field assessments via handheld devices and centralized, automated separation in production facilities.
The project represents a novel contribution to the field, as the application of artificial intelligence to macauba phenotyping remains in its infancy. To the best of our knowledge, no prior work has developed a dedicated deep learning model for automated maturation-stage classification in this species. Consequently, our YOLO-based framework will introduce an innovative tool for both researchers and industry practitioners, establishing a methodological benchmark and opening new avenues for precision harvesting, quality control, and agronomic research in macauba cultivation.
The YOLOv12x model exhibited a notable deficiency in background discrimination, erroneously classifying 23 background images as macauba fruits—a failure mode not observed with YOLOv11 under identical conditions. This phenomenon may stem from several interrelated factors. First, the attention-centric modules introduced in YOLOv12x, while effective at highlighting salient object regions, may inadvertently amplify spurious background features when not sufficiently regularized, leading to false positives. Second, modifications to anchor box scales and aspect ratios between versions could have misaligned the detector’s default priors with the true size distribution of fruits versus background elements, reducing its ability to reject non-fruit regions. Third, the training pipeline for YOLOv12x employs more aggressive data augmentation, which, without commensurate inclusion of negative samples, can cause overgeneralization and lower the effective decision threshold for object presence. Finally, the deeper R-ELAN backbone of YOLOv12x, though improving representational capacity, may require additional fine-tuning on background classes to achieve the same level of specificity as YOLOv11’s more conservative architecture. Addressing these issues will likely involve augmenting the training set with diverse background examples, recalibrating the attention regularization strength, and adjusting anchor and loss-weighting hyperparameters to restore robust background rejection.


 ,
, 


