Article

Automatic Vibration Balancing System for Combine Harvester Threshing Drums Using Signal Conditioning and Optimization Algorithms

1
School of Agricultural Engineering, Jiangsu University, Zhenjiang 212013, China
2
Key Laboratory of Modern Agricultural Equipment and Technology, Ministry of Education, Jiangsu University, Zhenjiang 212013, China
*
Author to whom correspondence should be addressed.
Agriculture 2025, 15(14), 1564; https://doi.org/10.3390/agriculture15141564
Submission received: 6 June 2025 / Revised: 18 July 2025 / Accepted: 19 July 2025 / Published: 21 July 2025
(This article belongs to the Section Agricultural Technology)

Abstract

The threshing drum, a core component in combine harvesters, experiences significant unbalanced vibrations during high-speed rotation, leading to severe mechanical wear, increased energy consumption, elevated noise levels, potential safety hazards, and higher maintenance costs. A primary challenge is that excessive interference signals often obscure the fundamental frequency characteristics of the vibration, hampering balancing effectiveness. This study introduces a signal conditioning model to suppress such interference and accurately extract the unbalanced quantities from the raw signal. Leveraging this extracted vibration force signal, an automatic optimization method for the balancing counterweights was developed, solving calculation issues inherent in traditional approaches. This formed the basis for an automatic balancing control strategy and an integrated system designed for online monitoring and real-time control. The system continuously adjusts the rotation angles, θ1 and θ2, of the balancing weight disks based on live signal characteristics, effectively reducing the drum’s imbalance under both internal and external excitation states. This enables a closed loop of online vibration testing, signal processing, and real-time balance control. Experimental trials demonstrated a significant 63.9% reduction in vibration amplitude, from 55.41 m/s2 to 20.00 m/s2. This research provides a vital theoretical reference for addressing structural instability in agricultural equipment.

1. Introduction

The combine harvester is one of the most complex and technologically advanced types of agricultural machinery, consisting mainly of components such as the header, feeder house, threshing device, and vibrating screen [1,2,3,4]. However, due to the complex field operations involved, crops exert impacts and loads on the structural components, affecting their performance [5,6,7,8]. Among these components, the threshing drum experiences unbalanced vibration issues, especially when rotating under conditions of stem entanglement and load, caused by deviations in the threshing drum’s center of mass. This results in an increased vibration response, significantly affecting operator comfort [8,9,10,11]. Unbalanced vibration is a primary cause of malfunction in the threshing drum, with mass imbalance-induced faults leading to decreased threshing drum performance, higher failure rates, and shortened service life of the combine harvester [11,12,13,14,15]. In recent years, as combine harvesters have evolved towards larger sizes, higher speeds, greater efficiency, and advanced intelligence, there is an urgent need to study the force signals associated with unbalanced vibration in threshing drums and to identify suitable balancing methods [16,17,18].
Achieving effective balancing of the threshing drum necessitates accurate measurement of unbalanced vibration, highlighting the critical role of the testing system design [19,20]. This system’s core function involves measuring and processing unbalanced signals, specifically filtering out unwanted components such as DC, harmonics, and noise, to extract the relevant unbalanced information and calculate the required compensation magnitude and phase [21,22,23]. Consequently, the testing system’s performance directly impacts the quality of the balancing. Older methods relying on mechanical amplitude indicators were limited by rotor conditions, resulting in low measurement accuracy and difficult operation [24,25]. The advent of DSP technology marked a shift towards software filters for vibration signal processing, a development further enhanced by the integration of virtual instrument technology, which can lower system development costs. Current common techniques in this area include fast Fourier transform (FFT) [26,27], cross-correlation [28,29], and waveform phase detection [30,31].
For the detection and analysis of unbalance signals in rotating machinery, a variety of advanced signal processing methods have been developed. Among these, wavelet analysis-based theories are particularly prominent. Applications include its combination with correlation analysis for precise fault feature extraction [32,33], the use of harmonic wavelets for rotor vibration measurement [34,35], the acquisition of amplitude information at specific frequencies via wavelet packet transformation [36], and its integration with the discrete Fourier transform (DFT) for unbalance analysis in dynamic balancing machines [37,38,39]. Furthermore, by leveraging the phase-locking and narrowband analysis characteristics of harmonic wavelets, a wavelet adaptive filtering approach has been proposed to detect signal amplitude and phase in high-frequency, high-noise environments [40]. In the realm of the Fourier transform and its derivatives, researchers have introduced a self-coherent spectrum technique based on FFT for high-sensitivity, high-resolution extraction of sinusoidal components [41], and have successfully employed single-point Fourier transform to identify minor speed variations in dual-rotor systems [42]. To address specific challenges, various auxiliary techniques and methods have also been developed. For instance, least squares fitting has been combined with a dual-plane online dynamic balancing technique to isolate unbalanced vibration components [43]. High-sensitivity speed sensors have been engineered to enhance low-speed balancing accuracy [44], and unbalance identification methods have been successfully extended to bearing systems under nonlinear vibration conditions [45,46]. For the detection of weak signals in complex backgrounds, novel solutions have been formulated and validated through simulation [47,48,49], while correlation filtering and waveform phase detection have been thoroughly investigated in vibration signal analysis [50,51]. However, despite the extensive research and application of these unbalance signal testing methods across various types of equipment, studies specifically targeting the rotational unbalance signals of combine harvester threshing drums are insufficient
This paper presents a comprehensive solution to the unbalanced vibration of a combine harvester’s threshing drum, establishing an end-to-end framework from signal analysis to system implementation. The foundation is a signal conditioning model integrated into a meticulously designed vibration testing system. This system utilizes MATLAB R2023a for precise filtering, effectively removing interference from the collected data. Subsequently, it applies autocorrelation and cross-correlation theories to extract the essential vibration information at the machine’s operating frequency. The centerpiece of the control methodology is a novel dual-sided iterative optimization counterweight strategy, for which a complete automatic balancing method and process flow were developed. This entire architecture was realized in an integrated testing and control system, complete with a visual interface that enables real-time online data acquisition and fully automatic balancing. Experimental validation has successfully confirmed the effectiveness and feasibility of this automated system, demonstrating its capacity to improve the operational performance and extend the service life of combine harvesters, thereby providing a robust, practical engineering solution.

2. Materials and Methods

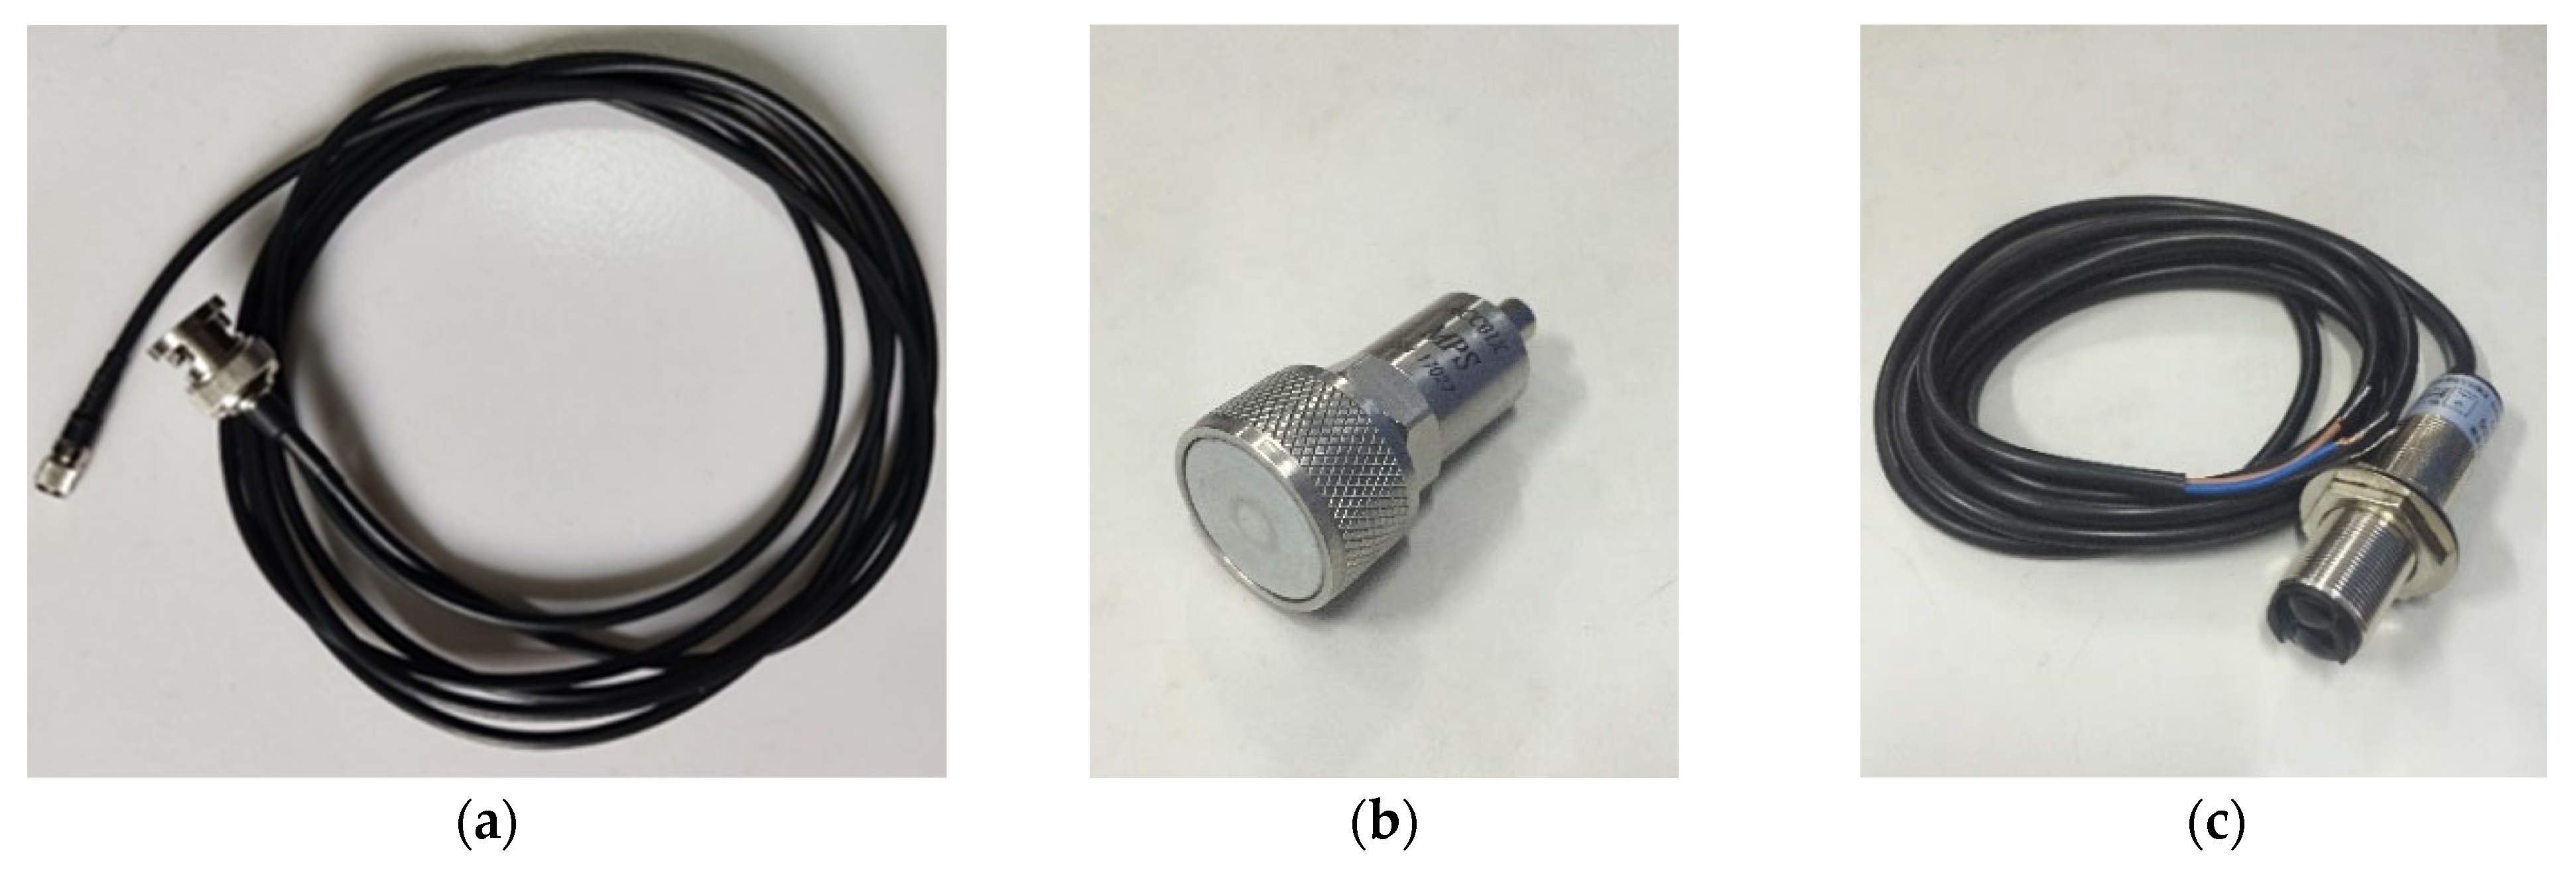
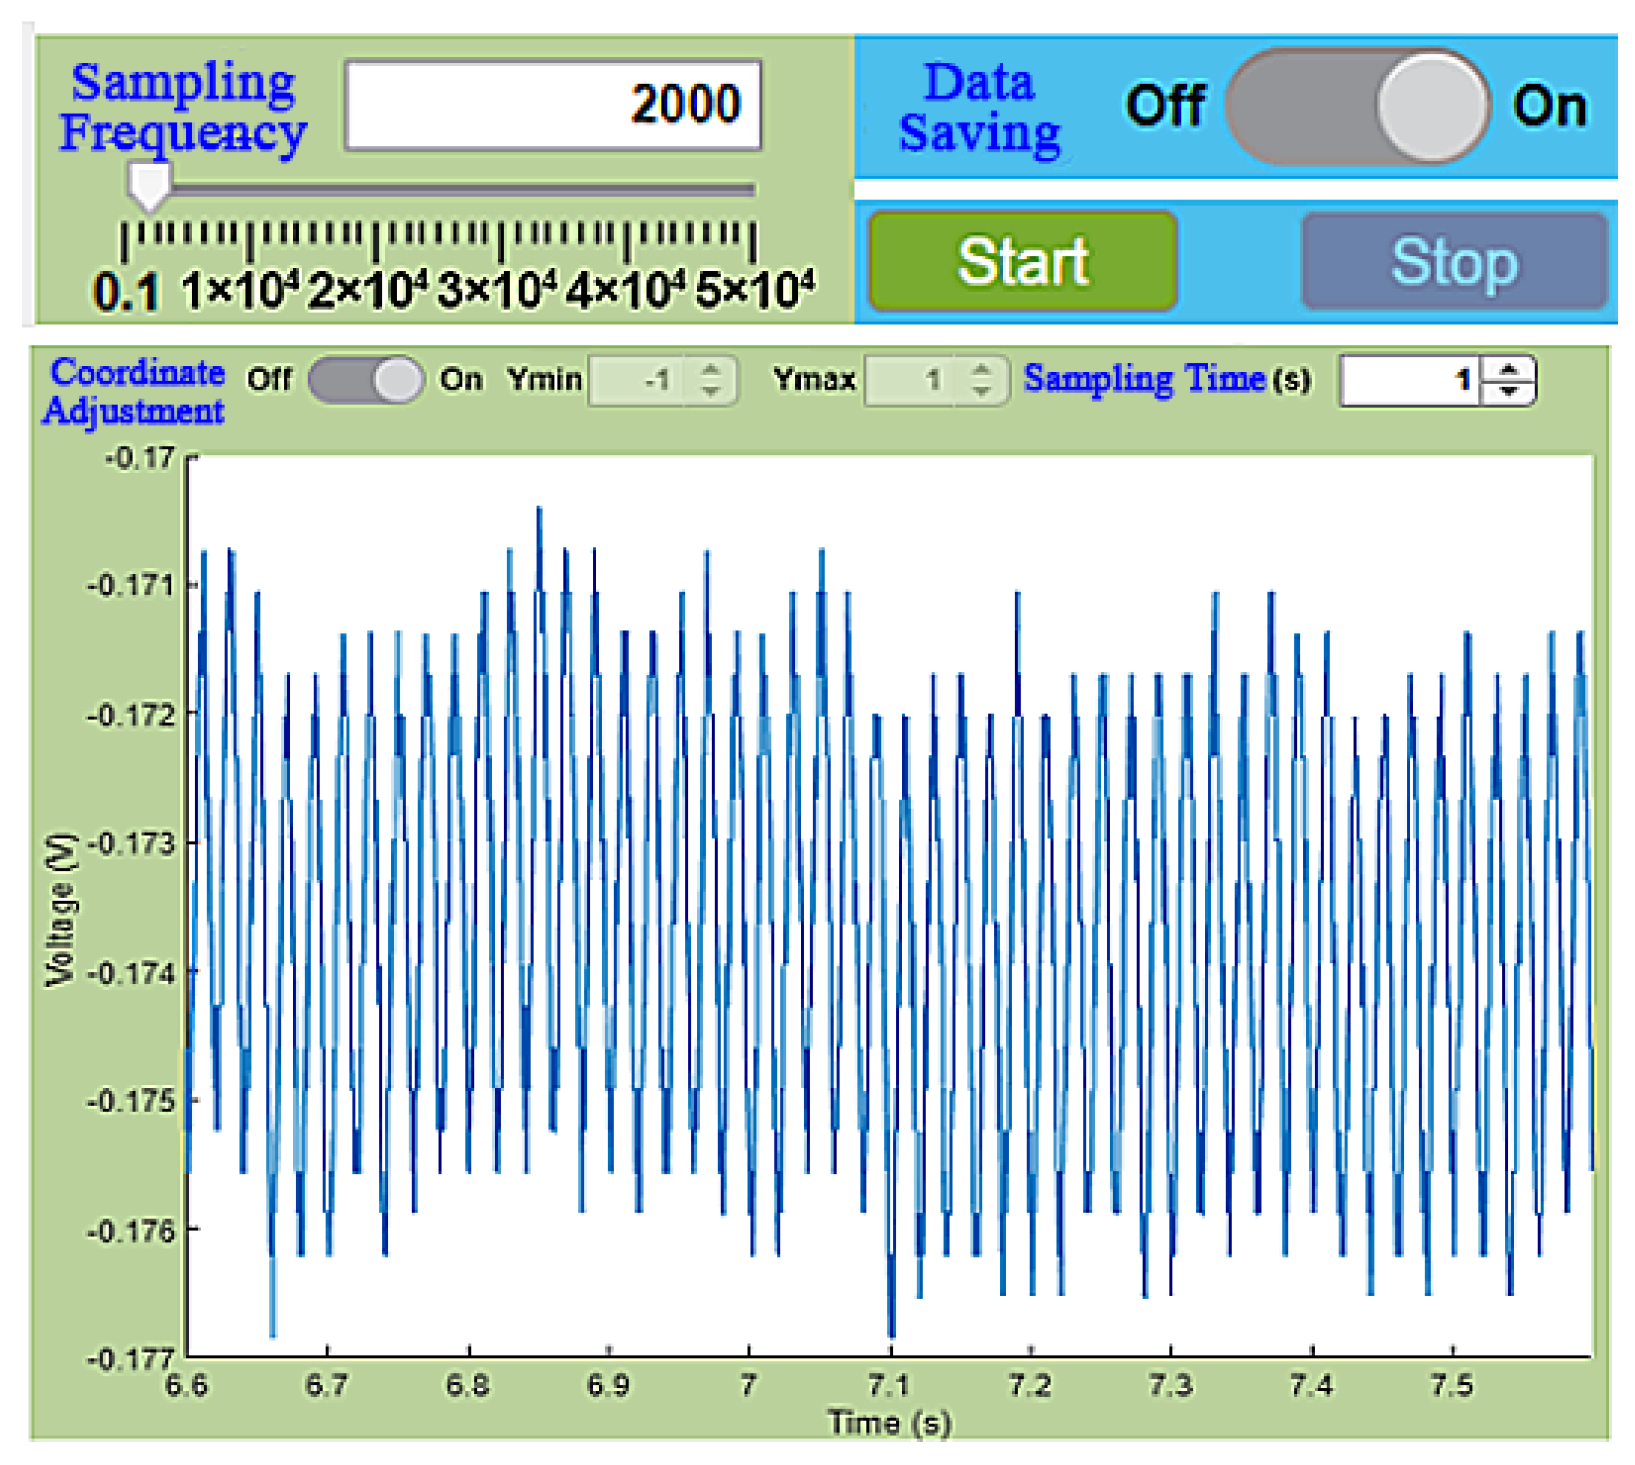
2.1. Signal Acquisition of Unbalanced Vibration in the Threshing Drum

Under the rotation, stalk winding, and load, the threshing drum of combine harvesters will produce the unbalanced vibration caused by the deviation of the center of mass, which will lead to an increase in the vibration response of the threshing drum. The time and amplitude of the vibration simulation signal of the threshing drum are theoretically continuous, but during the actual acquisition process, it is impossible to capture this continuous signal accurately. Therefore, the signal needs to be discretized into a numerical sequence, a process known as sampling. During the sampling process, after setting the sampling time interval T, instantaneous values are extracted from the original signal at every T interval, and a series of these instantaneous values, combined with time values, form an array sample of the discrete signal.
To ensure that the signal is not distorted during the sampling process, the sampling frequency needs to be set in accordance with the following theorem: the sampling frequency f must be greater than twice the highest frequency in the measured signal. If the sampling frequency is set too low, the signal will be distorted, resulting in frequency aliasing, and the sampled signal will not accurately reflect the characteristic information of the original signal. Conversely, if the sampling frequency is set too high, the data volume will be large, increasing the performance requirements of the acquisition equipment and lengthening the processing time. Therefore, choosing an appropriate sampling frequency is key to obtaining signal characteristics. In practical applications, the sampling frequency is generally set to 2.56 to 4 times the highest frequency of the original signal. To preserve the characteristic information of the original signal as much as possible, the sampling frequency in engineering applications is at least 5 to 10 times the highest frequency of the original signal.
After the original signal is sampled, it becomes a discrete signal. Although it is discrete in time, its amplitude is still continuous, and it cannot yet be processed as a digital signal by a computer. Therefore, the discrete signal must also undergo quantization to become a digital signal, i.e., a numerical sequence with limited values. If sampling refers to discrete time, then quantization refers to a discrete range of values. Essentially, this means using a set of finite-length digital codes to approximate the amplitude of the discrete signal, converting the analog quantity into a digital quantity. A continuous signal that has undergone sampling and quantization completes the analog-to-digital (A/D) conversion process.
In general, the quantized value is not exactly equal to the actual amplitude value, meaning there is a certain error. This difference between the quantized result and the actual analog quantity being quantified is called the quantization error e. Only when the value of the analog quantity is an integer multiple of the quantization unit will the quantization error be zero. The smallest unit that quantization can resolve is the resolution, which means that the quantization unit depends not only on the amplitude range but also on the number of bits in the A/D converter. The calculation formula is:
q = v 2 n
In the formula, q represents the quantization unit; v represents the full-scale voltage; n represents the number of bits of the A/D converter.
It is generally considered that the quantization error e is a random variable, typically falling within the range −q < e < 0 or −q/2 < e < q/2. Of course, if a sufficient number of code levels are selected during encoding, the quantization error can be minimized. However, due to limitations in the expansion of code levels during actual quantization, this error inevitably exists.
A data acquisition card performs the analog-to-digital (A/D) conversion of the vibration signals measured at the roller shaft end, providing digital input for the dynamic balancing calculations. For this purpose, we selected the National Instruments (NI) USB6002 DAQ device, chosen for its compatibility with the MATLAB development environment. The device is shown in Figure 1.
The main analog input channels of the acquisition card include AI0 through AI7, with a total of 8 channels, and the input voltage range is from −10 V to 10 V. The output channels also include 8 channels, capable of outputting DC voltage and pulse signals. Therefore, this acquisition card can not only be used as the data acquisition card for vibration measurement in the system but also as the controller for the balancing device, outputting the corresponding control signals. The key technical specifications of the acquisition card, including transmission speed, sampling rate, and resolution, are shown in Table 1.
An accelerometer (as shown in Figure 2) was employed for vibration signal acquisition. This selection was based on an evaluation of sensor characteristics against the experimental requirements. Velocity sensors were deemed unsuitable, as their effective operational range is typically above 600 r/min, making them ineffective for the low-speed rotational conditions of this study. Furthermore, the non-contact installation required by displacement sensors was impractical on the existing test bench. The accelerometer, therefore, offered the optimal measurement solution, providing reliable low-frequency performance and feasible integration.
As shown in Figure 2a, the system uses the MPS-ACC01X ICP accelerometer. This sensor comes with a built-in voltage amplifier, eliminating the need for an external amplification circuit. It is equipped with a magnetic base (as shown in Figure 2b) for easy installation and use. The technical specifications related to the sensor’s accuracy, range, sensitivity, installation method, etc., are listed in Table 2.

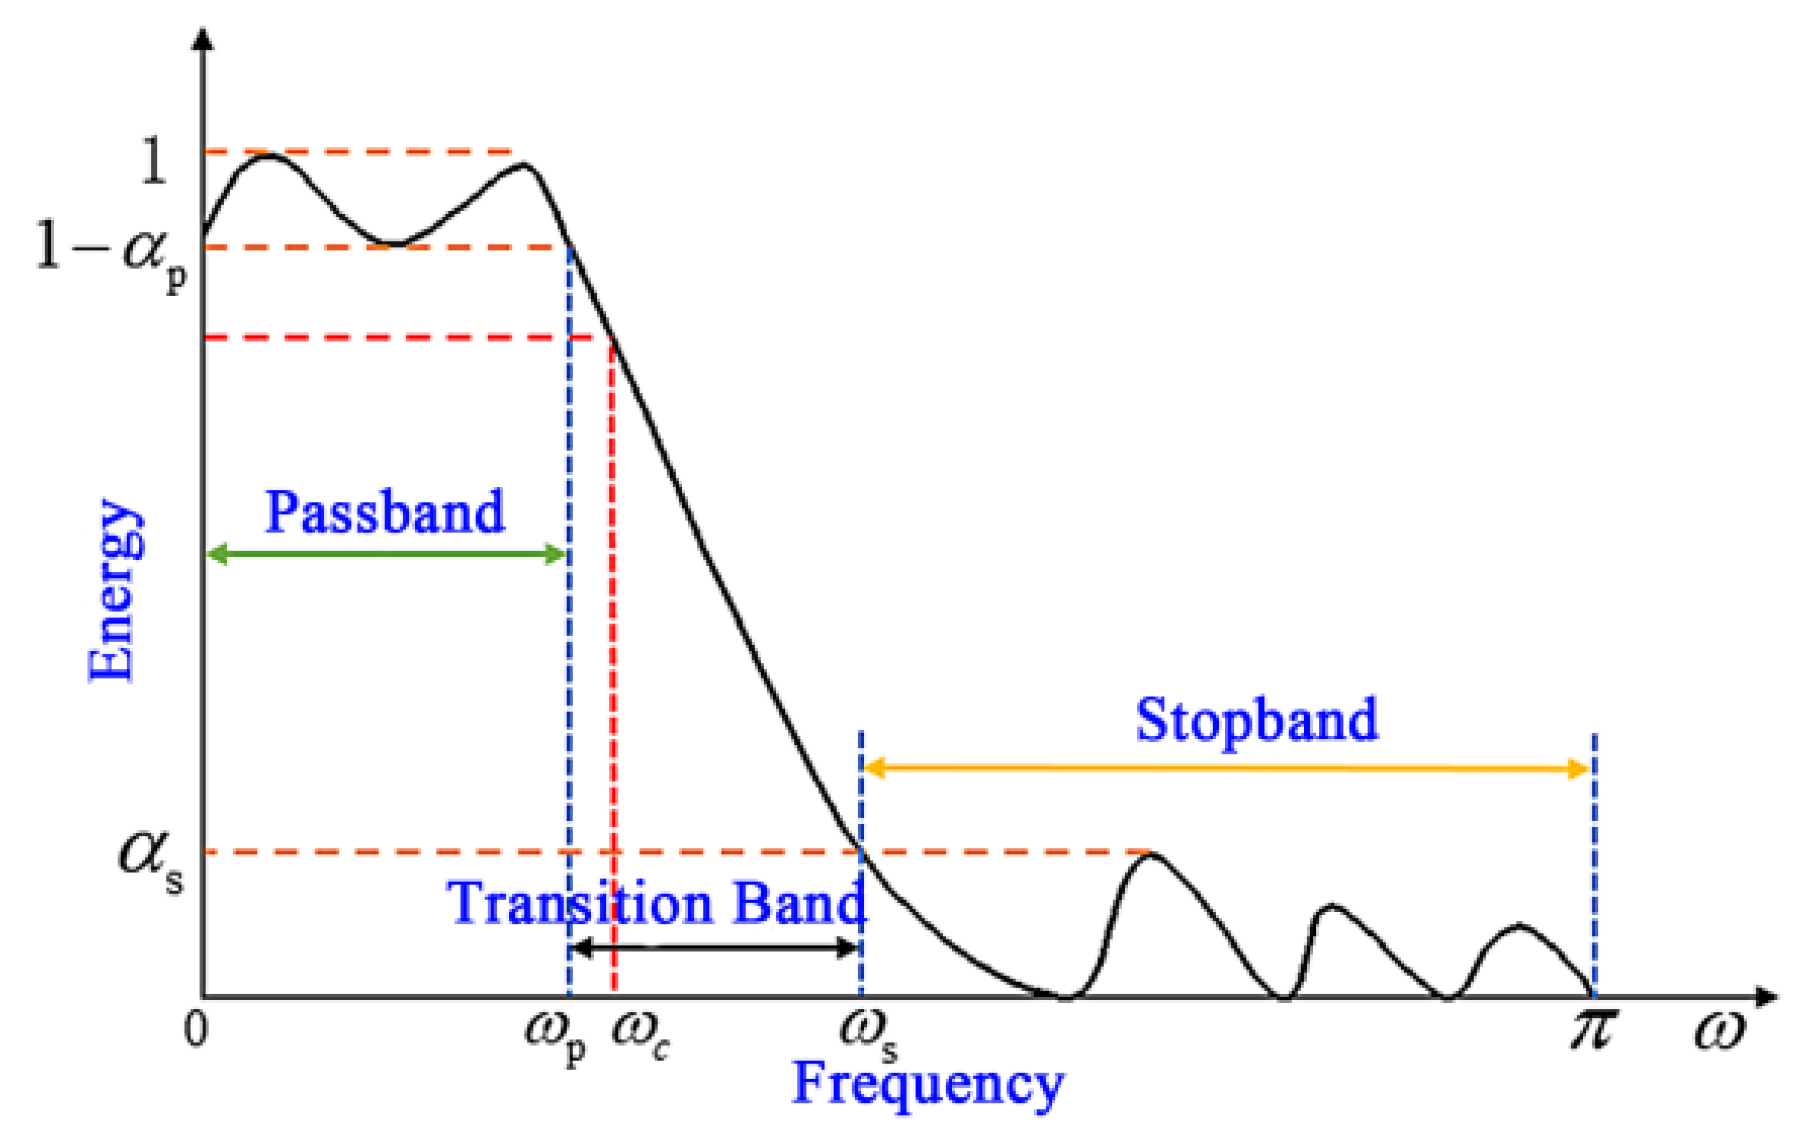
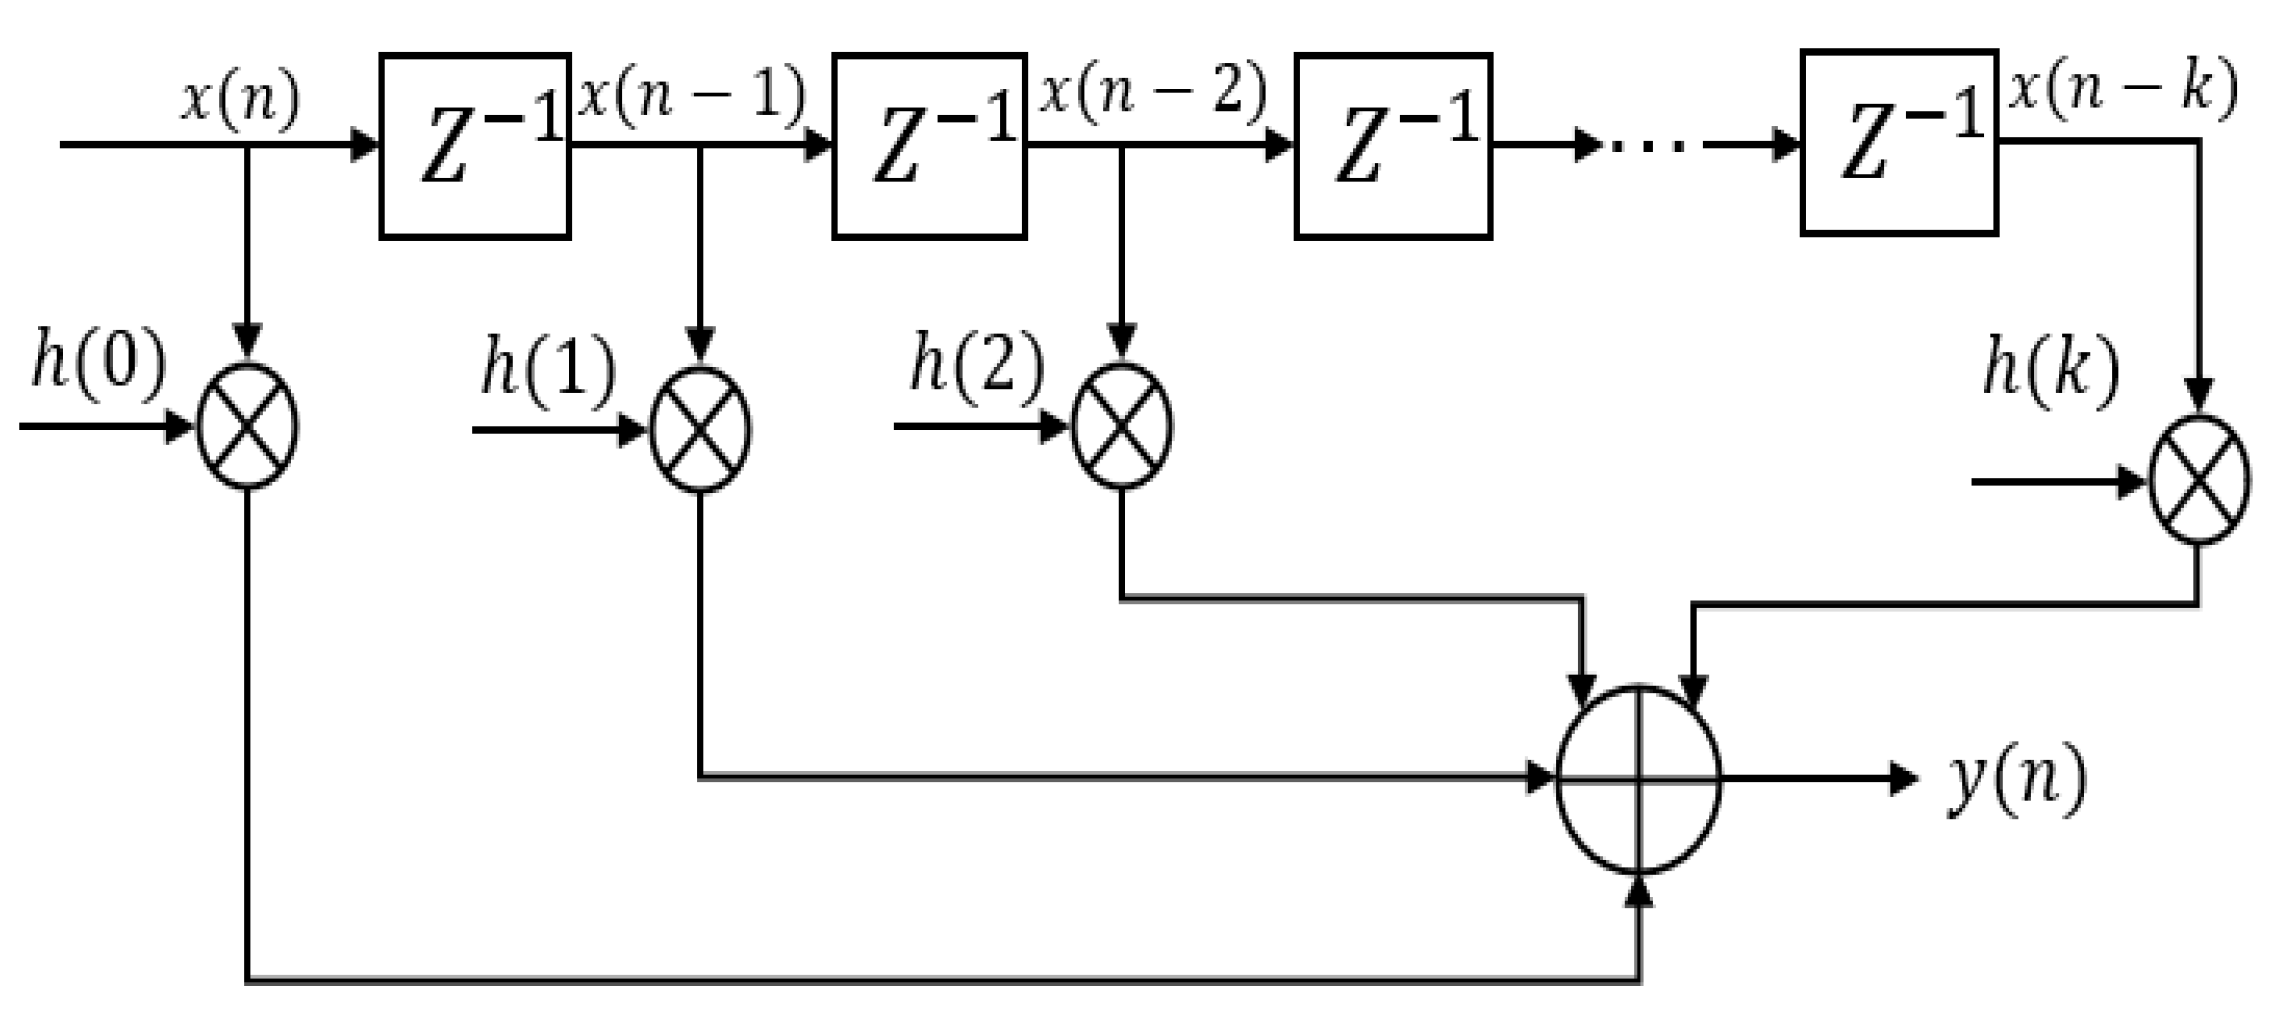
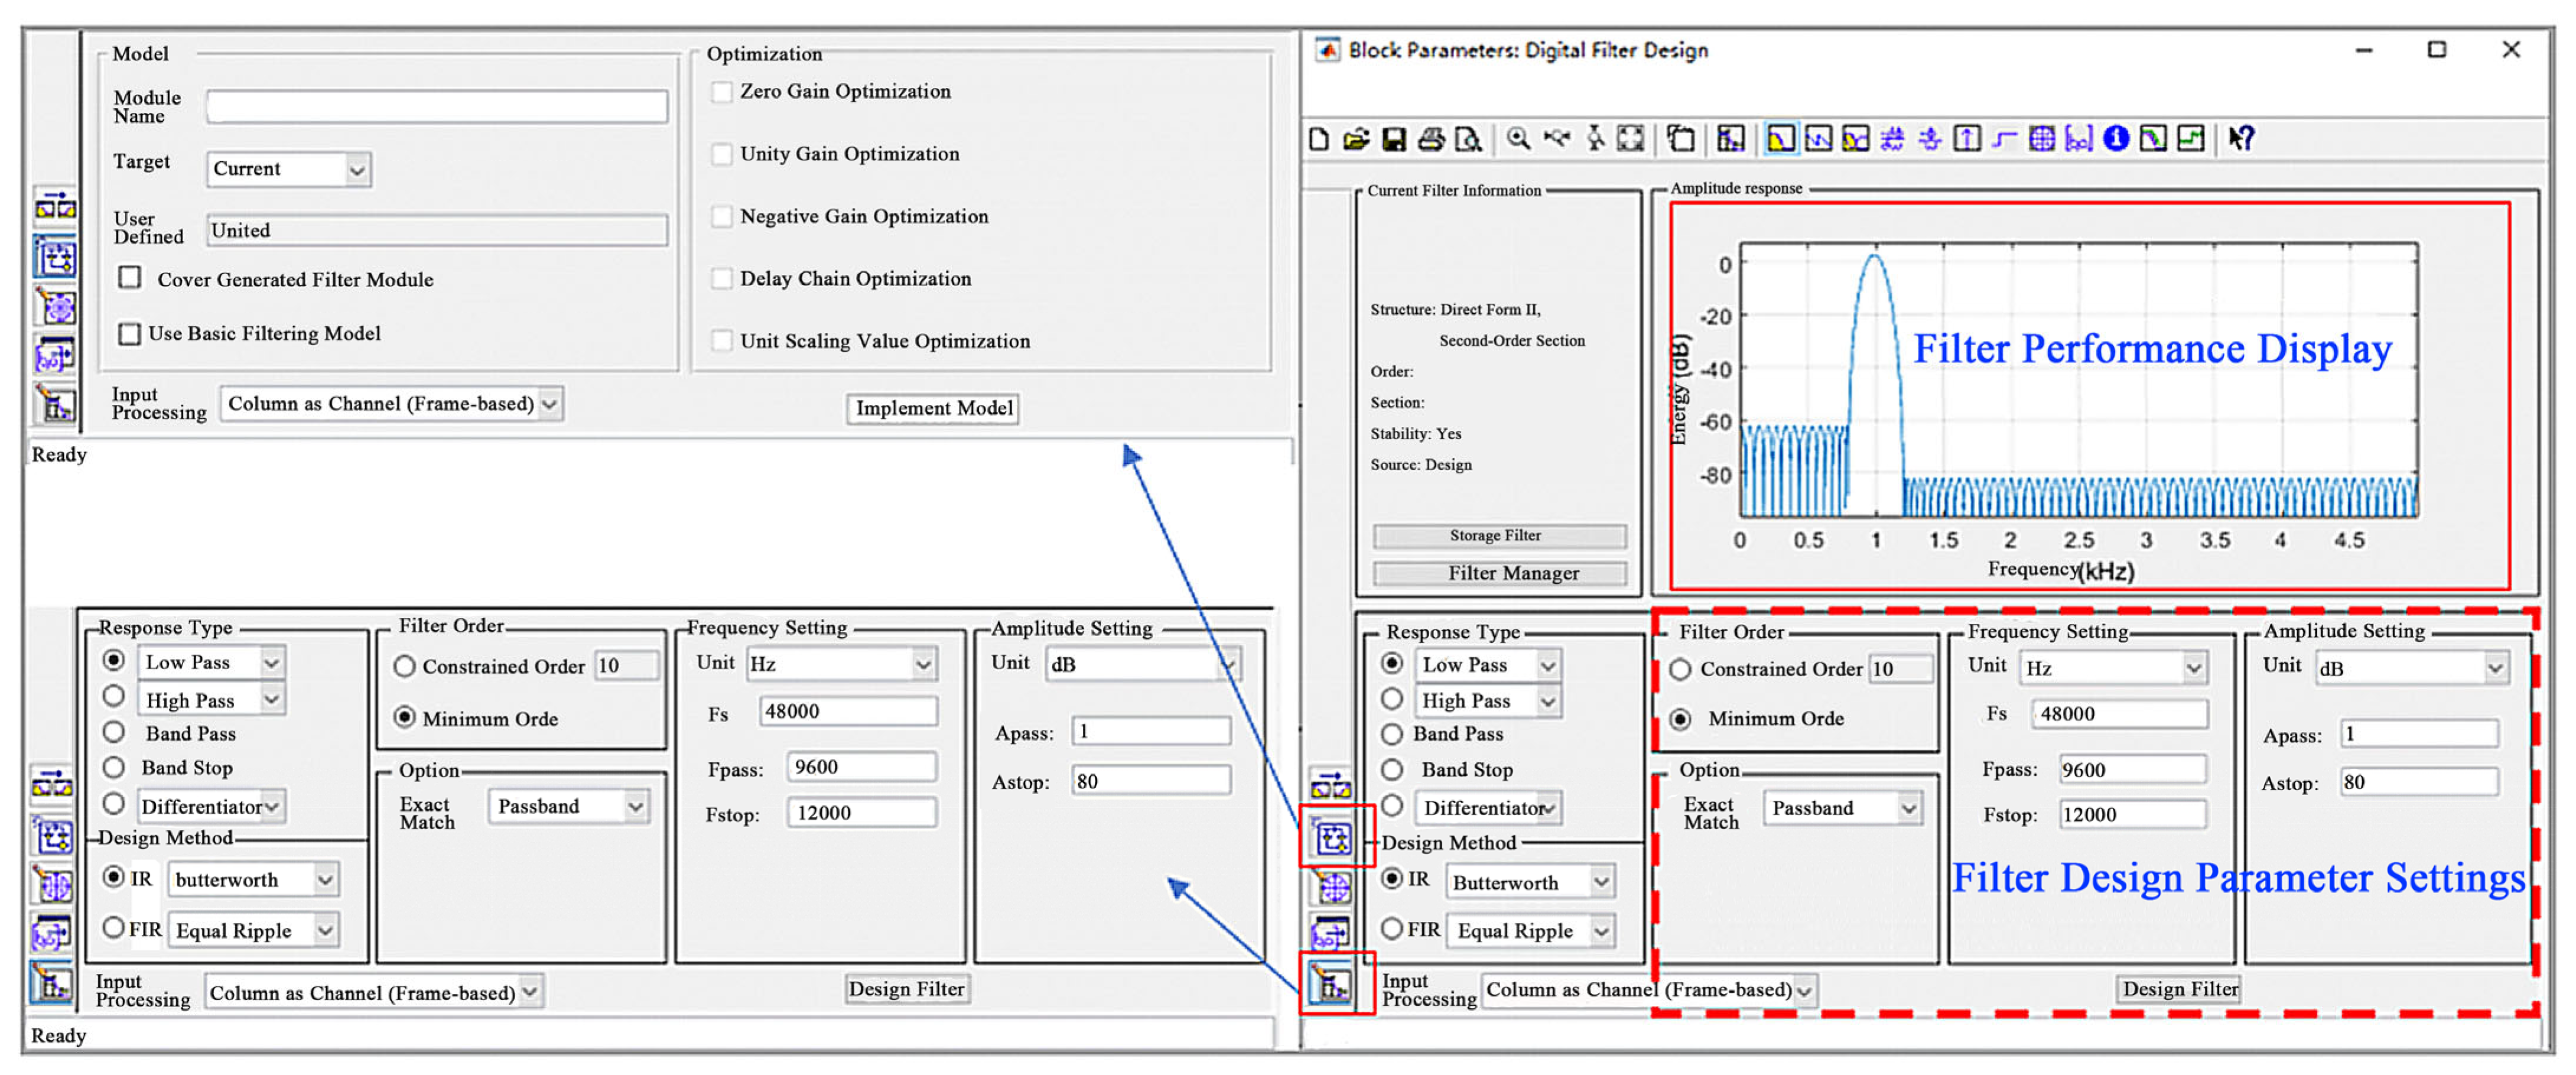
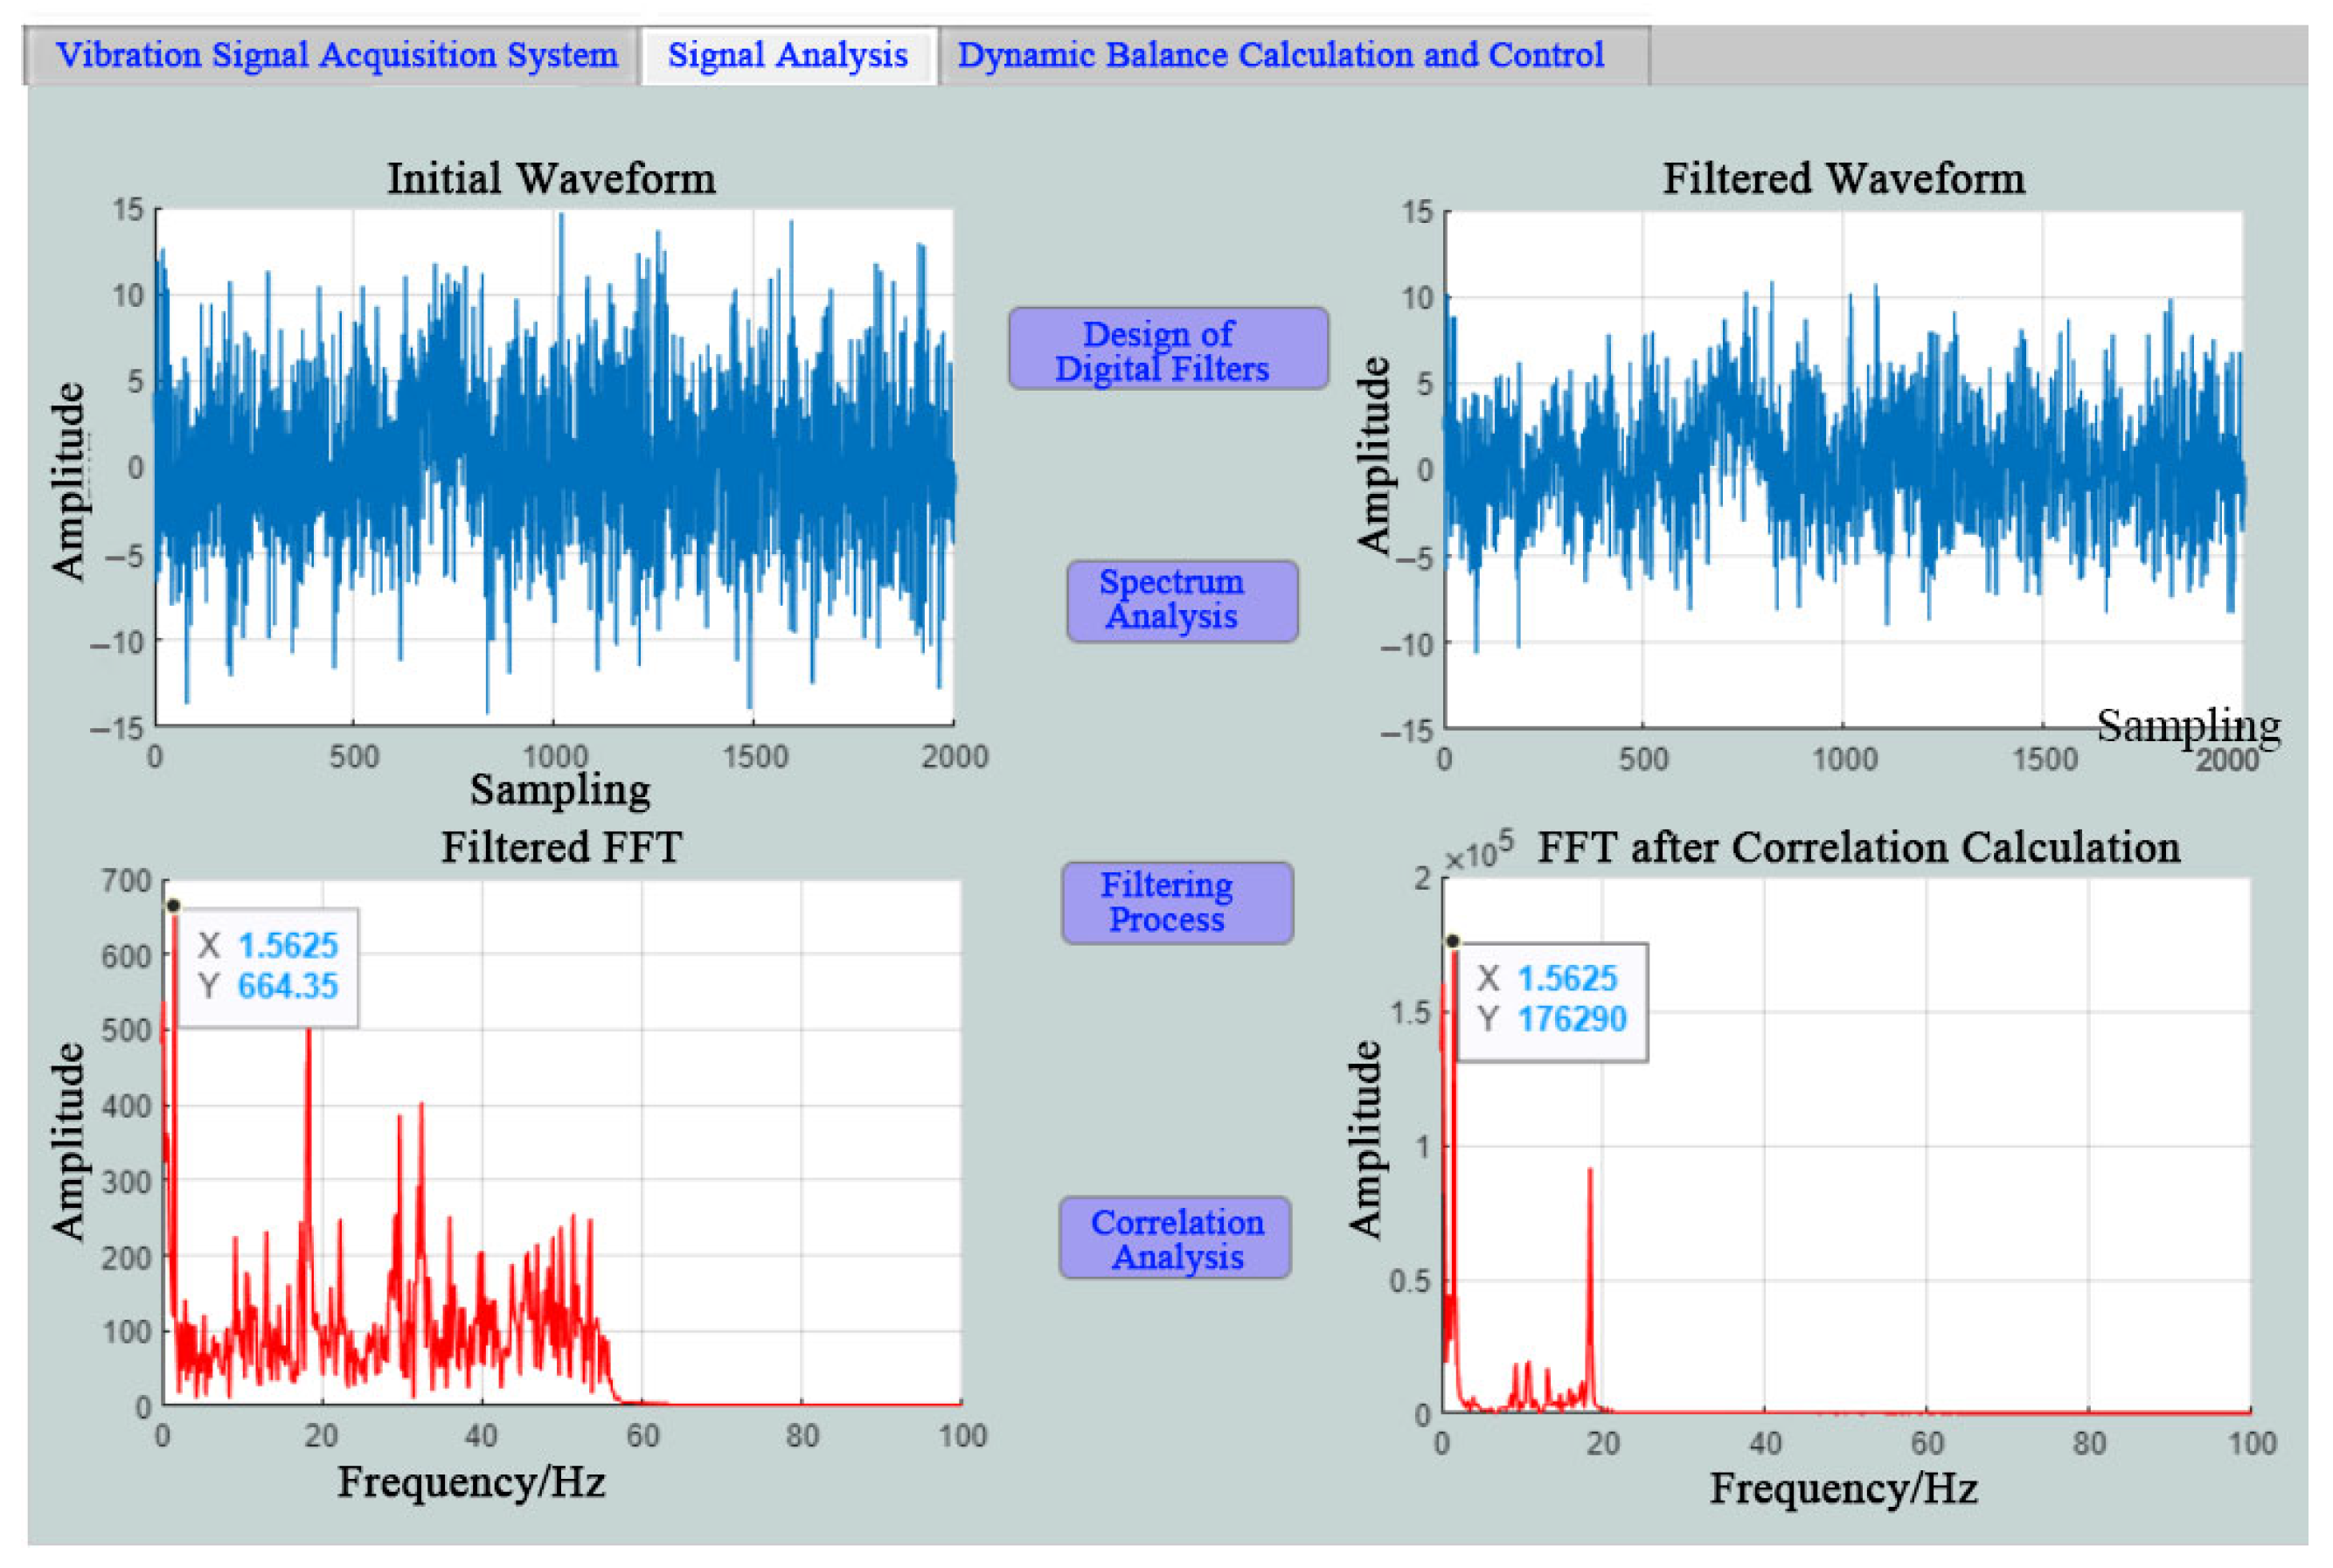
2.2. Signal Conditioning of Unbalanced Vibration in the Threshing Drum

In the dynamic balance test of the threshing drum, the vibration signal collected by the sensor should ideally be a sine wave. However, the raw signal contains not only the fundamental frequency component but also various harmonics, subharmonics, and random noise. When the threshing drum operates, entanglement with rice stalks not only intensifies its fundamental frequency vibrations but also generates other interference signals.
These signals can significantly disrupt subsequent dynamic balance calculations. If there are excessive interference signals during balancing, the fundamental frequency characteristics of the collected signal may become less distinct or even obscured, thereby affecting the balancing result. Therefore, during the analysis and processing of digital signals, filtering is essential to retain useful signals while suppressing and attenuating interference.
This paper mainly adopts digital filters. Like analog filters, digital filters are frequency-selective devices; they attenuate noise and interference signals to block their transmission, while minimizing attenuation of the target signal to ensure its smooth passage. Compared with analog filters, digital filters have higher stability, precision, and flexibility. Digital filtering can be expressed by a system function:
H z = k = 0 M b k z k 1 k = 0 M a k z k = Y z X z
From the system function mentioned above, a constant-coefficient linear difference equation can be derived to describe the relationship between the input and output of the filter:
y n = k = 0 M b k y n m + k = 0 M a k x n m
From the above formula, it can be seen that the primary function of a digital filter is to convert the input sequence x(n) into the output sequence y(n) through computation. The structure of the filter depends on the type of operations used. Based on the time characteristics of their unit impulse responses, digital filters can be classified into infinite impulse response (IIR) and finite impulse response (FIR) filters. Compared to FIR filters, IIR filters generally offer a simpler solution with selectable frequencies. Additionally, based on functionality, digital filters can be categorized into five types: high-pass, low-pass, band-pass, band-stop, and all-pass. Since the effective vibration signals of the threshing drum are mostly concentrated in the low-frequency range, the design primarily focuses on low-pass filters, as shown in Figure 3 and Figure 4.
The collected vibration signals from the threshing drum are primarily concentrated in the low-frequency range, so the design of a Butterworth low-pass filter can meet the requirements. The key parameters of a digital filter mainly include the passband cutoff frequency ωp, cutoff frequency ωc, and stopband cutoff frequency ωs. Specifically, the passband frequency range is 0 ≤ ωωp, and the stopband frequency range is ωsωπ; additionally, the maximum attenuation within the passband is αp, the minimum attenuation in the stopband is αs, attenuation is generally expressed in decibels (dB), and αp and αs can be represented as:
α p = 20 × lg H ω = 0 H ω = ω p dB
α s = 20 × lg H ω = 0 H ω = ω s dB
The squared amplitude transfer function H(ω) of a Butterworth low-pass filter can be expressed as:
H ω = 1 1 + ω / ω C 2 N
where ωc is the cutoff frequency and N is the filter order. When ω = 0, H(ω) = 1; when ω = ωc, | H ( ω ) | = 1 / 2 ; and when ω > ωc, the amplitude drops rapidly. The larger the value of N, the faster the amplitude decreases, and the narrower the transition band becomes.
Based on the above fundamental theory, the main design steps for low-pass filtering include:
First, calculate the filter order based on the given design specifications. Compute the maximum attenuation αp in the passband:
α p = 20 × lg H ( ω p ) 2
From Equations (5) and (6), this study derives:
1 + ω p / ω c 2 N = 10 α p / 10 1 + ω s / ω c 2 N = 10 α s / 10
From this,
ω p / ω s N = ( 10 α p / 10 1 ) / ( 10 α s / 10 1 )
Ultimately, this study derives:
N = lg ( 10 α p / 10 1 ) / ( 10 α s / 10 1 ) lg ( ω p / ω s )
The filter order is the smallest integer solution obtained from the above equation. Based on the calculated order N, the normalized poles Pk can be derived, thus determining the normalized transfer function. The primary design is implemented using the MATLAB and Simulink programming environments. MATLAB includes a powerful DSP (digital signal processing) toolbox, which facilitates the design of filters with given parameters. As shown in Figure 5, clicking the Digital Filter Design module in the DSP toolbox opens the filter design visualization interface. The filter design interface is mainly divided into three sections: function selection, parameter settings, and design result display.
In the filter design parameter setting module (Figure 6), an infinite impulse response (IIR) low-pass digital filter was selected, configured for minimum order. This choice of minimum order is essential to maintain low delay, which is critical for online automatic balancing of the threshing drum. As shown in the parameter settings in Figure 7, the sampling frequency was set to 2 kHz. Given that the operational vibration response frequency of the threshing drum primarily consists of the working frequency and its harmonics, the passband cutoff frequency was set to 45 Hz and the stopband cutoff frequency to 100 Hz. The design specified a maximum attenuation of 1 dB in the passband and a minimum attenuation of 80 dB in the stopband.
Figure 8 shows the amplitude–frequency and phase–frequency characteristic curves of the designed filter, resulting from the parameter settings (Figure 7) and the selected minimum order (Figure 6). These curves illustrate the inherent trade-off in filter design; theoretically, a smaller filter order leads to a faster response time, although filtering effectiveness may be reduced. Conversely, higher-order filters offer more significant filtering but introduce increased delay. Achieving online automatic balancing of the threshing drum requires maintaining a low processing delay. Therefore, the minimum order was chosen during the design to effectively balance filtering performance with minimizing delay.
After the filter design is complete, the calculated model can be imported into Simulink through the model export module (as shown in Figure 9), enabling the visual representation of the filter structure. The model obtained after importing the designed filter into Simulink is shown in Figure 10.

2.3. Method for Extracting Features of Unbalanced Vibration Signals

The vibration signal measured by sensors is typically a harmonic signal, with its waveform characteristic being a composite of various frequency components. The primary harmonics of the threshing drum during operation, in addition to the fundamental frequency, also include multiple N-order harmonics such as the 2nd harmonic, 3rd harmonic, etc. Therefore, when continuously sampling the threshing drum vibration signal over the time period [0, T], the complete expression of the signal can be represented as:
x t = b 0 + A sin ( 2 π f t + β ) + i = 1 n b i sin ( 2 π v i t + β i ) + S t ,   t 0 , T 0 ,   O t h e r s
where b0 represents the DC component of the vibration signal; A represents the amplitude of the fundamental harmonic; f represents the digital frequency corresponding to the power frequency at the selected sampling frequency; β represents the phase of the fundamental frequency component; bi represents the amplitude of each harmonic component; vi represents the digital frequency corresponding to other frequencies at the selected sampling frequency; βi represents the phase of each harmonic component; and S(t) represents random noise.
From the above signal expression, it can be intuitively observed that the measured signal of the threshing drum contains not only the power frequency component but also other harmonic components. The degree of correlation between two signals can be calculated using the cross-correlation function, which allows the target signal to be extracted from a complex signal. Therefore, for the calculation and extraction of the imbalance, the correlation function method can be used. The cross-correlation function between the measured signal of the threshing drum and the reference signal can be expressed as:
R x y τ = + x t y t τ d t = + x t + τ y t d t
Let the sine signal with the same frequency as the threshing drum’s working frequency and a phase of 0, and the standard cosine signal be expressed as:
g t = sin ω t ,   n 0 , T 0 ,   O t h e r s
h t = cos ω t ,   n 0 , T 0 ,   O t h e r s
By performing the correlation calculations between the measured signal x(t) and the two sine and cosine signals from Equations (13) and (14), the amplitude and phase of the fundamental frequency component in the vibration signal can be calculated as follows:
A = 2 R x z 2 0 + R x v 2 0 N β = arctan R x z 0 R x v 0 ,   β 0 , 2 π
Similarly, the phase of the power frequency component in the reference signal can be obtained as:
α = arctan R y z 0 R y v 0 ,   α 0 , 2 π
The final calculated amplitude and phase of the imbalance in the threshing drum are:
A = 2 R x g 2 0 + R x h 2 0 T φ = α β = arctan R y g 0 R y h 0 arctan R x g 0 R x h 0 ,   φ 0 , 2 π
The amplitude and phase results obtained using the correlation calculation method are highly accurate, unaffected by other noise, and the computation is fast. Additionally, during the calculation, it also serves to filter the signal. The working process is illustrated in Figure 11.
The vibration signal of the threshing drum obtained through correlation calculations is a harmonic signal containing multiple harmonic components, each with different frequencies, amplitudes, and phases. By arranging all the harmonic component frequencies in ascending order, this paper can plot the frequency spectrum with frequency on the horizontal axis and amplitude on the vertical axis, corresponding each component’s frequency to its amplitude. The essence of the Fourier transform is to decompose the time-domain signal into an infinite sum of continuous harmonics, which is also the theoretical basis for frequency spectrum analysis. However, the discrete Fourier transform (DFT) has high computational demands and is time-consuming, leading to limited widespread use. It was not until the development of a fast algorithm for DFT, known as the fast Fourier transform (FFT), that frequency spectrum analysis became widely applicable on computers.
For a discrete signal x(n), the definition of its discrete Fourier transform (DFT) is given by the formula:
X ( k ) = n = 0 N - 1 x ( n ) W N k n
In the equation, N represents the number of sampling points: W N = e j 2 π N
The essence of the fast Fourier transform (FFT) is that it fully utilizes the symmetry and periodicity of the WN factors involved.
W N ( n k + N 2 ) = W N n k
W N N + n k = W N n k
Leveraging two key properties of the fast Fourier transform (FFT) allows for the avoidance of repeated WN calculations during the process, which significantly reduces the overall computational load. A detailed theoretical derivation of the FFT, being relatively complex, falls beyond the scope of this discussion and is detailed in relevant literature. The primary objective of the automatic balancing system for the threshing drum is the elimination of imbalance vibration generated during operation. This imbalance primarily manifests as an increased vibration amplitude at the working frequency. Consequently, the calculation of the drum’s imbalance fundamentally requires the determination of the amplitude and phase differences of this power frequency component between the measured vibration signal and a reference signal.
To verify the feasibility and effectiveness of the proposed signal acquisition and processing methods, a simulation study is conducted. The simulation begins with the generation of a representative vibration signal designed to mimic actual working conditions by including both a fundamental frequency signal and extraneous interference. Within the Simulink environment, a sine block generates a sine wave of specified frequency and amplitude, while a chirp signal block introduces interference, as shown in Figure 12. An adder then combines these components to create the final composite waveform. Subsequently, this signal is processed using functions from MATLAB’s signal processing toolbox, which encompass the previously described low-pass digital filtering, FFT, and autocorrelation modules, as shown in Figure 13 and Figure 14.

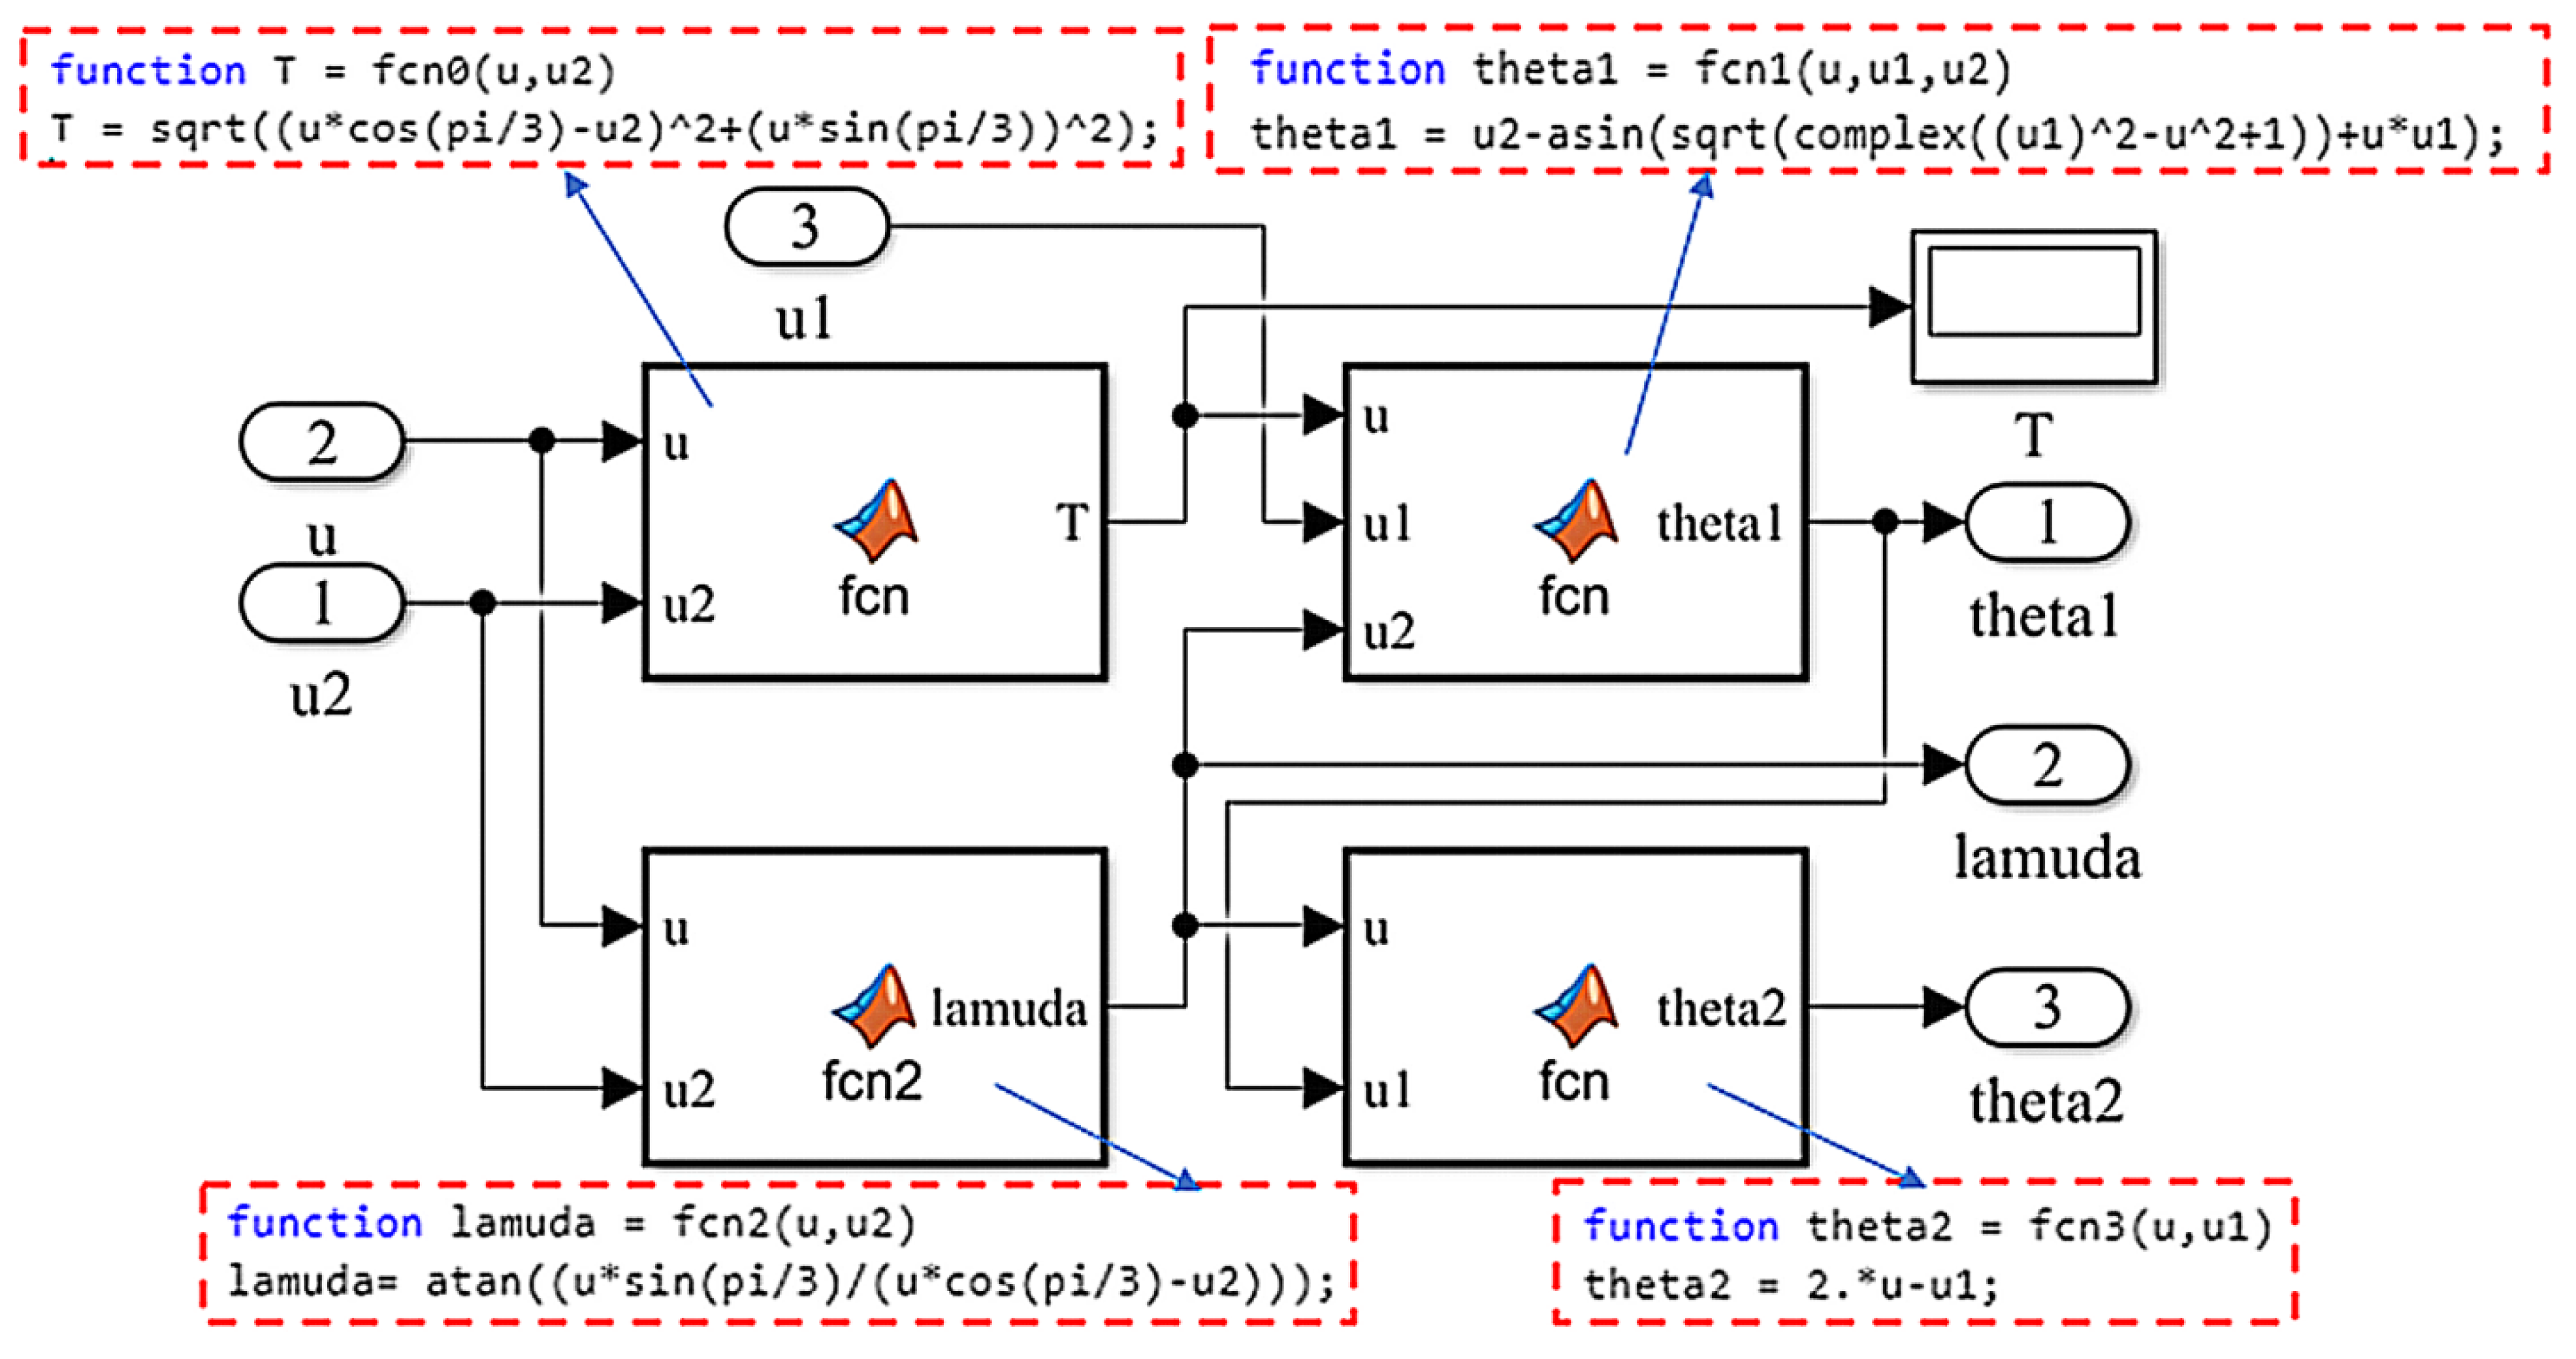
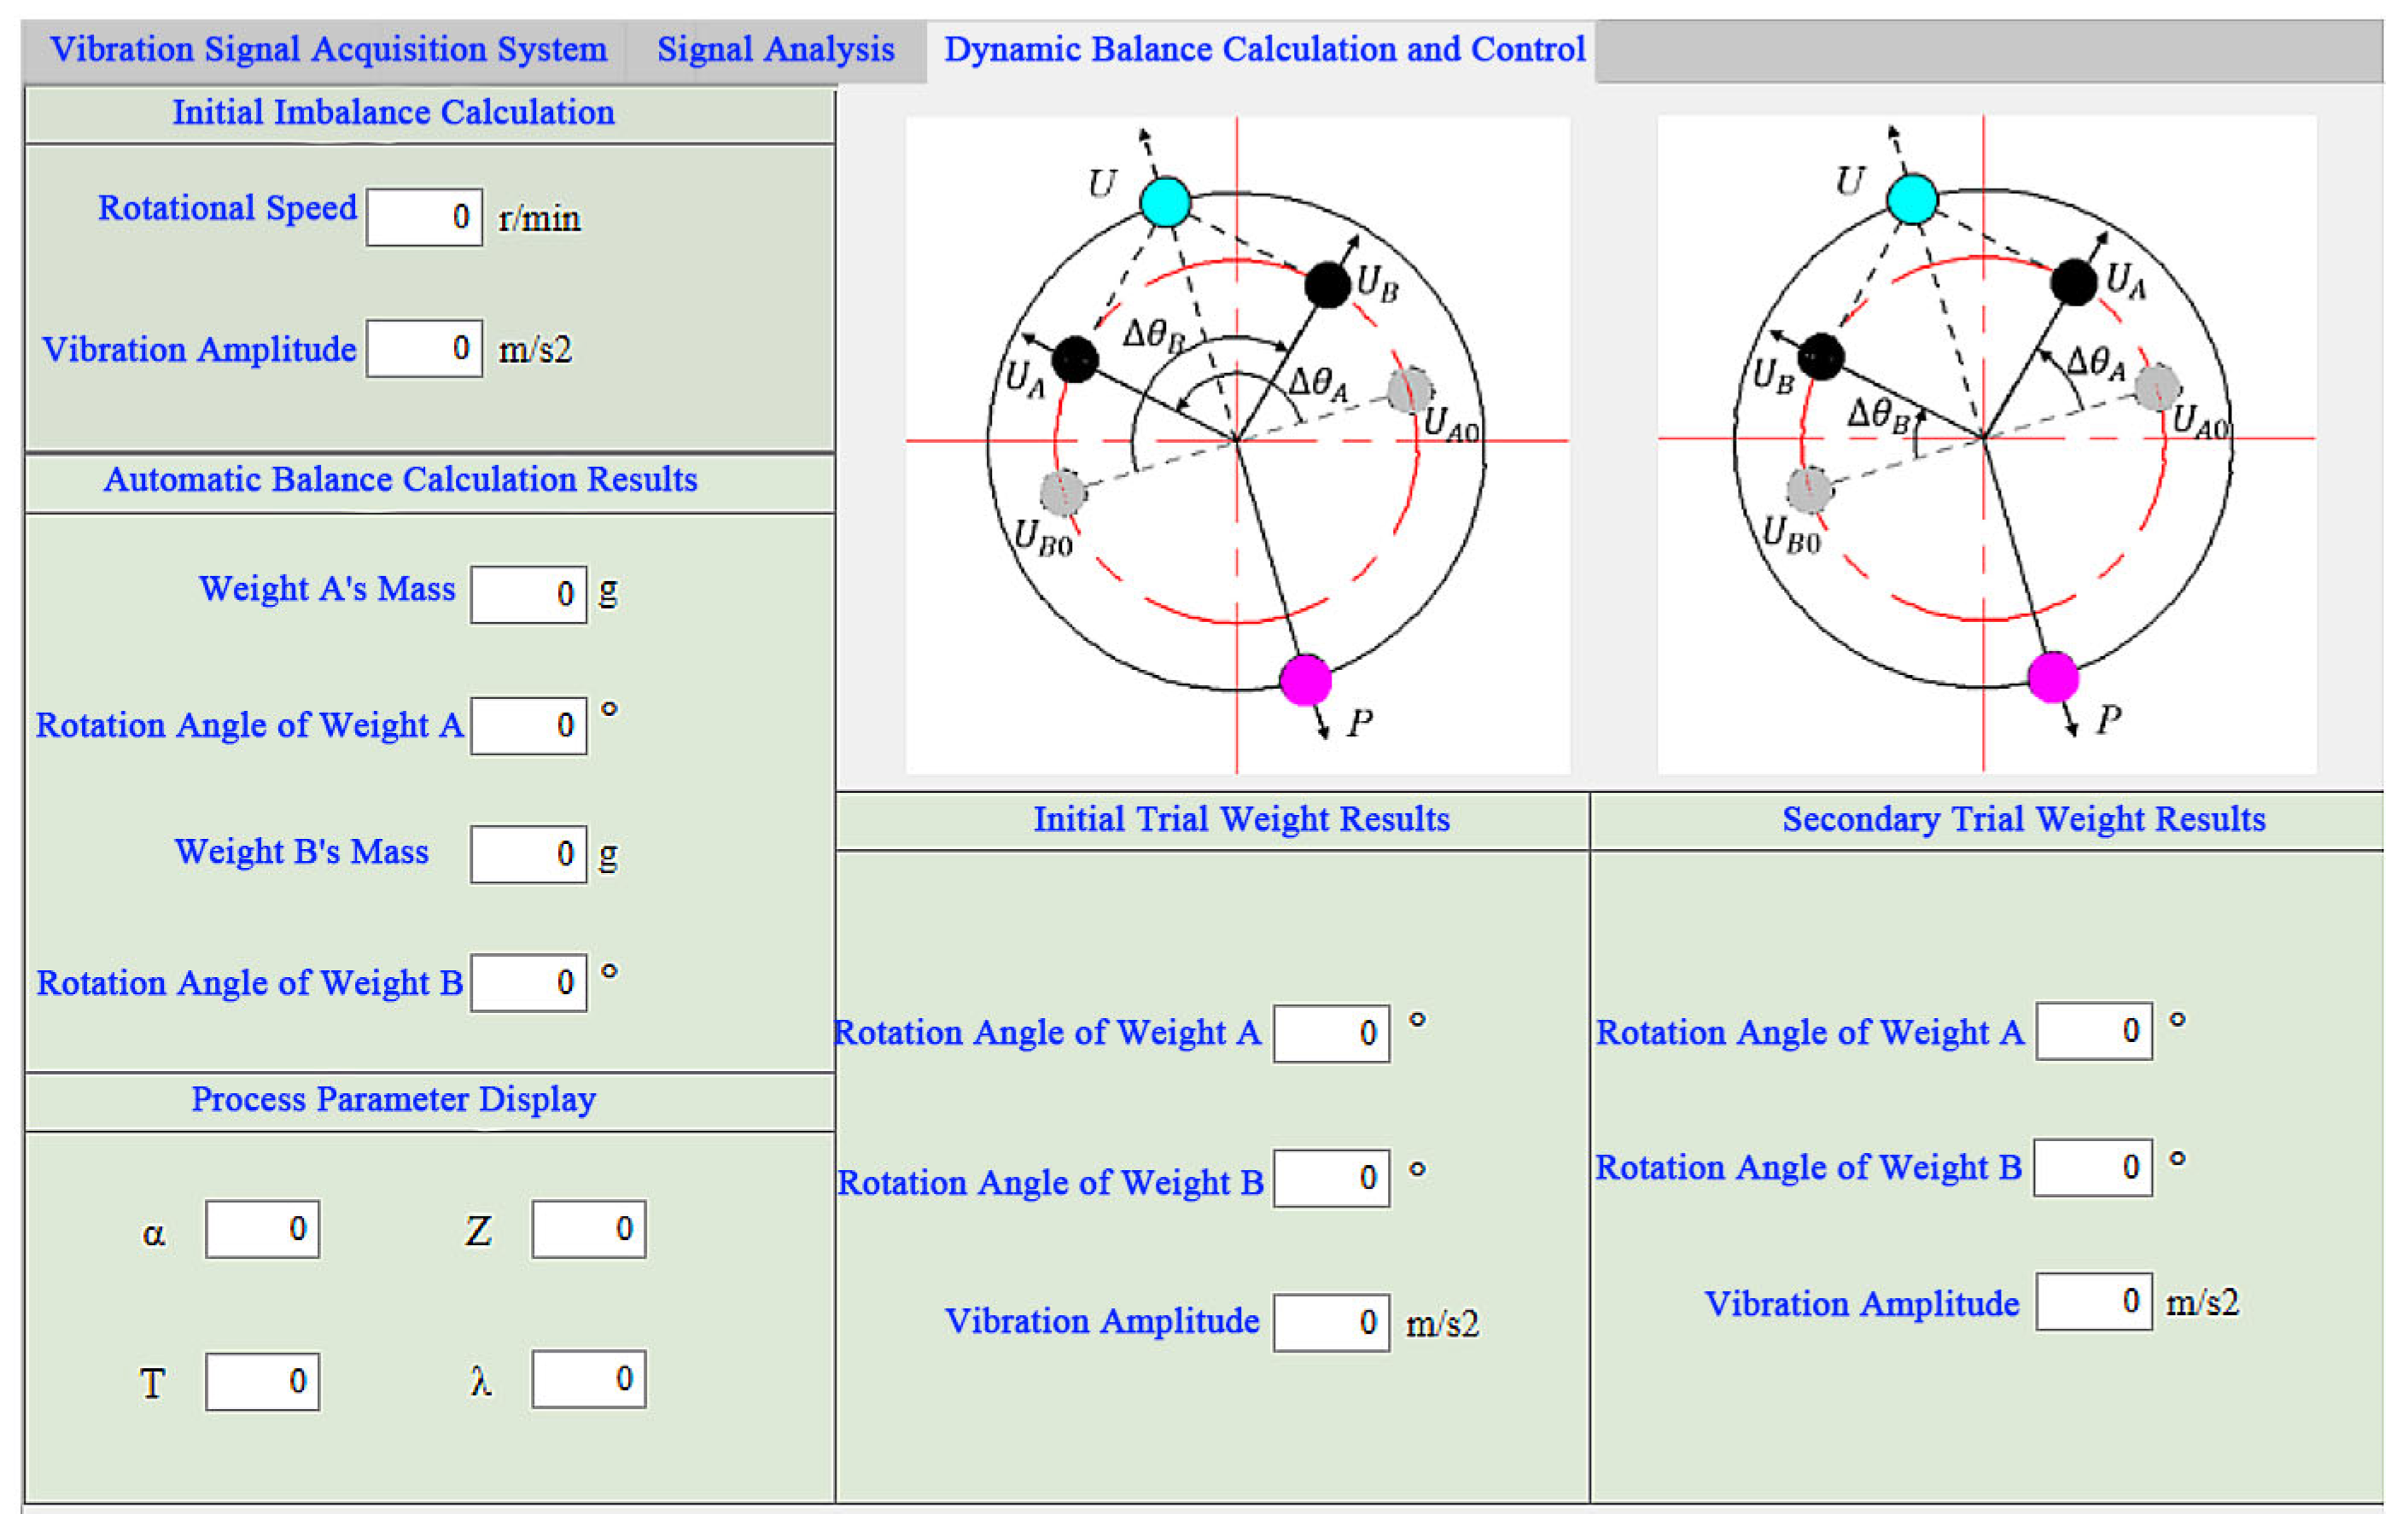
2.4. Dual-Sided Iterative Optimization Counterweight Strategy

The automatic balancing device generates a current from the controller, which flows into the electromagnet to create a driving magnetic field, thereby driving the rotation of the counterweight disc. It is necessary to determine the optimal rotation method for the automatic balancing device. As shown in Figure 15, the complete optimization process for the balance control angle, which is the focus of this study, is illustrated. Based on the vibration amplitudes measured three times, a rotating optimization counterweight strategy is applied. The main output parameters of the control strategy are the rotation angles of the two counterweight discs.
Based on the rotating optimization counterweight strategy for automatic balancing, the calculation process is implemented using Simulink’s graphical language. The complete calculation flow is programmed as shown in Figure 16. The main inputs for this calculation module are the three vibration measurements taken during the balancing process, denoted as x1, x2, and x3. Through the calculation process, the final outputs θ1 and θ2 are the rotation angles of the two counterweight discs.
Assuming the initial imbalance of the threshing drum is U0, with the influence coefficient at the measurement point denoted as α1, and the balanced amount by the balancing device is U (both U and U0 can be expressed in terms of eccentricity), with the influence coefficient at the measurement point for the balanced amount denoted as α2, and the balancing mass is m, the signal measured by the sensor is x. According to the principle of the influence coefficient method, the following equation can be obtained:
x = α 1 U 0 + α 2 U
Let the initial angles of the two counterweight discs be θ1 and θ2, then:
U = 2 m r cos θ 1 θ 2 2 e i θ 1 + θ 2 2
Let x0 = α1U0, the initial vibration value be:
x 1 = x 0 + 2 m r α 2 cos θ 1 θ 2 2 e i θ 1 + θ 2 2
When the two balancing discs rotate by an angle θ simultaneously, the measured vibration x2 value can be expressed as:
x 2 = x 0 + 2 m r α 2 cos θ 1 + θ θ 2 + θ 2 e i θ 1 + θ 2 + 2 θ 2 = x 0 + 2 m r α 2 cos θ 1 θ 2 + 0 2 e i θ 1 + θ 2 + 2 θ 2 = x 0 + 2 m r α 2 cos θ 1 θ 2 2 e i θ 1 + θ 2 2 e i θ
Let α = 2 m r α 2 cos θ 1 θ 2 2 , Thus, from Equations (23) and (24), This paper can derive:
x 1 = x 0 + α
x 2 = x 0 + α e i θ
Subtracting Equation (25) from Equation (26) yields:
α = x 2 x 1 e i θ 1
Substituting Equation (27) into Equation (25) yields:
x 0 = e i θ x 1 x 2 e i θ 1
When the left counterweight disc rotates by −θ+π and the right counterweight disc rotates by −θ, it is equivalent to the left counterweight disc rotating by π while the right counterweight disc returns to its original position. The measured vibration value can then be expressed as:
x 3 = x 0 + 2 m r α 2 cos ( θ 1 θ + π ) ( θ 2 θ ) 2 e i θ 1 + θ 2 + π 2 = x 0 + 2 m r α 2 cos ( θ 1 θ 2 ) + π 2 e i θ 1 + θ 2 + π 2 = x 0 + 2 m r α 2 e i θ 1 + θ 2 2 cos ( θ 1 θ 2 ) 2 cos π 2 sin ( θ 1 θ 2 ) 2 sin π 2 e i π 2 = x 0 + 2 m r α 2 cos θ 1 θ 2 2 tan θ 1 θ 2 2 e i π 2 = x 0 + α tan θ 1 θ 2 2 e i π 2
Subtracting Equation (25) from the above expression yields:
z = tan θ 1 θ 2 2 = 1 + x 3 x 1 α e i π 2
Through the above steps, three values are obtained from three measurements and multiple calculations, denoted as α, z, and x0. Let the final angles that the two counterweight discs need to rotate be ∆θ1 and ∆θ2, respectively. The expected final balance result is that the measured vibration amplitude is zero. Based on the calculation process from Equation (23), this paper can derive:
0 = x 0 + 2 m r α 2 cos ( θ 1 + Δ θ 1 ) θ 2 + Δ θ 2 2 e i θ 1 + θ 2 + Δ θ 1 * + Δ θ 2 * 2
This study derives:
0 = x 0 + α cos Δ θ 1 * Δ θ 2 * 2 tan θ 1 θ 2 2 sin Δ θ 1 * Δ θ 2 * 2 e i Δ θ 1 * + Δ θ 2 * 2
T = cos Δ θ 1 * Δ θ 2 * 2 tan θ 1 θ 2 2 sin Δ θ 1 * Δ θ 2 * 2 λ = Δ θ 1 * + Δ θ 2 * 2
Thus, this paper can derive the following identity:
x 0 α = T · e i λ
Thus, T represents the modulus of the complex number, and λ represents the phase angle.
The calculation process will generate three process parameters: α, T, and Z. The calculation process for α is shown in Figure 17, and this parameter is mainly derived from the first and second vibration measurements. The calculation process for the Z value is illustrated in Figure 18, with the primary input values being the first and third vibration measurements, along with the α value.
From Equations (27) and (28), this study derives:
x 0 α = e i θ x 1 x 2 x 1 x 2 = x 1 cos θ x 2 x 1 x 2 + x 1 sin θ x 1 x 2 i
Simplifying the above expression into the complex form on the right side of Equation (34) yields:
T = x 1 c o s θ x 2 2 + x 1 s i n θ 2 x 1 x 2 2 λ = tan 1 x 1 s i n θ x 1 c o s θ x 2
In the above expression, θ, x1, and x2 are all known, allowing us to solve for the values of T and λ. Further simplifying Equation (33) yields:
T = cos λ Δ θ 2 * z sin λ Δ θ 2 * Δ θ 1 * = 2 λ Δ θ 2 *
From the above expression, this paper can derive:
sin λ Δ θ 2 * = T z ± z 2 T 2 + 1 z 2 + 1 Δ θ 1 * = 2 λ Δ θ 2 *
Ultimately, this study derives:
Δ θ 2 * = λ sin 1 T z ± z 2 T 2 + 1 z 2 + 1 Δ θ 1 * = 2 λ Δ θ 2 *
Thus, the counterweight discs will rotate by angles θ1* and θ2*, completing the balancing process. The three parameters, including the vibration measurement values x1, x2, and the Z value, serve as inputs. Through the calculation process illustrated in Figure 19, the final output will be the calculated input values for the angles.
This section details the proposed dual-sided iterative optimization counterweight strategy, the core method developed for automatically calculating the required adjustments to balance the threshing drum. This strategy relies on obtaining multiple vibration measurements under specific conditions. Through a defined sequence of calculations involving parameters derived from these measurements, the method systematically determines the optimal rotation angles for the two counterweight discs. This calculation process is fundamental to the automatic balancing system’s ability to precisely adjust the counterweights and mitigate unbalanced vibrations.

2.5. Integrated System for Self-Balancing Testing and Control of the Threshing Drum

Next, this paper will study the implementation of online automatic balancing for the threshing drum, which requires integrating the three aforementioned modules to form a cohesive operational unit. Therefore, this section will focus on the integrated control of the automatic balancing threshing system.
The signal processing algorithms and control strategies mentioned above are implemented using MATLAB programming. To ensure system uniformity, this paper also utilizes MATLAB App Designer for the GUI design of the control system. The app’s interactive interface mainly consists of three modules: vibration measurement, signal processing, and dynamic balancing calculation. The signal measurement and real-time display interface are shown in Figure 20. This interface can be divided into three parts: parameter settings, control modules, and signal display sections. The parameters that need to be set include the selection of acquisition devices, trigger channels, measurement methods, ranges, and sampling frequencies. There are three control buttons: the Start and Stop buttons, as well as a Save File button, which primarily serve to control the operation of the software system. The data display section’s main function is to achieve real-time signal visualization.
By selecting the signal analysis module in the top menu bar, users can access the signal processing interface, as shown in Figure 20. This interface primarily displays the processing results of the measured signals, including digital filtering, correlation analysis, corresponding spectrum calculations, and a button for filter design. In the signal analysis interface, users can clearly see whether the filtered signal meets the calculation requirements. Clicking the Digital Filter Design button will connect to the Digital Filter Design module for filter design. Using the Simset and Sim functions, the Simulink model can be run within the app. Therefore, by adding the relevant callback functions to the Filter Processing button, the filtering program can be executed in the background, displaying both the original and filtered signals in the coordinate area. Similarly, clicking the Spectrum Analysis button will perform FFT analysis on the filtered signal and display the image in real-time.
The third module, the dynamic balancing calculation module, serves as the core module, and its display interface is shown in Figure 21. It can be seen that this interface displays various parameters related to the automatic balancing calculations. Firstly, it shows the initial vibration amplitude and rotational speed information, as well as four key parameters generated during the calculation process, including Z, T, and λ. Finally, the results of the automatic balancing calculations are displayed in the second column on the left side, which includes the mass and rotation angles of counterweight A and counterweight B. The masses of the two counterweights, as previously calculated, are constants, each being 448.5 g. The rotation angle is the main computed and output result. After obtaining the rotation angle, based on the design of the balancing device mentioned earlier, it is known that one rotation step is 9°. According to the results, it can be determined how many steps each counterweight needs to rotate, which is then fed back to the acquisition card. The acquisition card outputs the corresponding values through the output port in Figure 22.

3. Results and Discussion

3.1. Testing for Feature Extraction of Unbalanced Vibration Signals

Through the construction of the above modules and corresponding simulation process, the results are shown in Figure 23, Figure 24 and Figure 25. First, as shown in Figure 23, the simulated imbalance signal of the threshing drum is measured. From the FFT diagram in Figure 23, it can be observed that the main frequency vibration occurs at 10 Hz. In addition to this, the signal contains extraneous components such as the 2nd harmonic, 6th harmonic, and some random vibration signals.
As shown in Figure 24, the designed low-pass filter effectively removes the extraneous signals. From both the time-domain waveform and the frequency spectrum, vibrations at frequencies of 60 Hz and above are filtered out with significant attenuation. This demonstrates the clear effectiveness of the low-pass filter designed through the visual filter design tool. However, the subsequent vibration amplitude is primarily obtained by extracting the main frequency vibration amplitude from the FFT transformation. From Figure 24, it can be observed that there are still some extraneous components in the low-frequency range. Therefore, correlation calculations are performed on the filtered signal to achieve further filtering, resulting in more accurate outcomes. The simulation results after correlation calculations are shown in Figure 25. From the FFT results in the figure, it can be seen that the extraneous components in the low-frequency range have been filtered out after correlation calculations.
Through the above simulation calculations, it can be seen that using the relevant toolboxes in MATLAB and Simulink allows for precise processing of the test signals. The research methods and designed modules provide a foundation for achieving more accurate computational precision in subsequent dynamic balancing calculations.

3.2. Dynamic Balance Testing and Online Automatic Balancing Trials of the Threshing Drum

After analyzing the design steps and functionality of the integrated system, this paper will now provide a detailed introduction to the complete system’s usage process. This paper will also connect the developed app with the online automatic balancing test platform mentioned earlier to conduct an experimental study on the online automatic balancing of the threshing cylinder. First, the usage process of the developed integrated system is shown in Figure 26.
To validate the vibration testing, counterweight strategy, and the effectiveness of the front-end system interface in the automatic balancing system, a threshing drum automatic balancing test system was set up, as shown in Figure 27. The entire test system consists of three parts. The first part is the test bench. With a threshing drum equipped with an automatic balancing device, the maximum adjustable speed of the threshing drum can reach 100 r/min. The second part is the vibration testing module, which includes a signal acquisition card and corresponding vibration acceleration sensors. The sensors are attached to the threshing drum’s bearing seat using magnetic mounts. The third part is the software display module, where the acquisition card is connected to a laptop. The designed software interface is used to observe real-time signal acquisition and processing, as well as the automatic balancing calculation results.
After clicking the Start button, the software automatically enters the vibration acquisition module, allowing the user to select the acquisition device. The system automatically recognizes the parameters of the acquisition card, and users can also adjust the measurement parameters themselves. As shown in Figure 28, the app identifies the acquisition card as Dev1 [USB6002]. After selecting this device, the corresponding parameters, including measurement channel, test quantity, range, and measurement method, are displayed. Once the parameters for the acquisition device are selected, as shown in Figure 29, the user can set the sampling frequency using a slider or by directly entering the value. The data saving switch can be turned on, and by clicking the Start button, the acquisition system will begin running. The real-time signals collected by the system are displayed in the coordinate area of the figure.
The acquired signals are saved as .mat files in the target folder, making them available for other modules. By clicking to enter the signal processing module, as shown in Figure 30, the user can access the filter designer module after selecting the digital filter design to set the filter parameters. Upon clicking the filtering process, the results of the background filtering program can be observed. In Figure 30, it is evident that the signal components in the filtered waveform are significantly reduced compared to the initial waveform, with some interference signals being eliminated. By clicking the Spectrum Analysis button, the user can view the spectrum of the filtered signal. The rotational speed of the experimental platform in this test is 100 r/min, with a working frequency of approximately 1.6 Hz. From the figure, it can be seen that the primary frequency in the obtained spectrum is 1.5625 Hz, which is consistent with the actual frequency. The related calculations can be regarded as further filtering processes. By clicking the Related Calculation button, the calculated spectrum is displayed in the coordinate area at the bottom right of the figure. It is apparent that some redundant frequency components have been filtered out, allowing for a clearer observation of the maximum vibration amplitude at the working frequency of 1.6525 Hz. This amplitude will serve as the basis for subsequent calculations.
The dynamic balancing calculation module mainly relies on the vibration response values obtained after signal processing. Figure 31 shows the results calculated during the experiment. By clicking on the results display, the user can obtain the parameter values from the calculation process. Table 3 below presents the parameter values involved in this calculation. Experimental trials demonstrate a 63.9% reduction in vibration amplitude (from 55.41 m/s2 to 20.00 m/s2).
Historically, vibration has been a persistent challenge, leading to mechanical wear and structural failure. By automating the balancing process, manufacturers can deliver a combine harvester that is not only more durable but also more efficient and intelligent. A stable threshing drum allows for more consistent operational speeds, even with uneven crop flow. This enables manufacturers to design harvesters with higher throughput.
The system aligns perfectly with the industry trend towards autonomous and intelligent machinery. Major manufacturers are heavily investing in automation that reduces the burden on the operator and enhances precision. This system, with its sensors and control algorithms, is a prime example of “smart” technology that can be integrated into the central control unit of the combine in the future, providing real-time diagnostics and performance feedback.

4. Conclusions

(1)
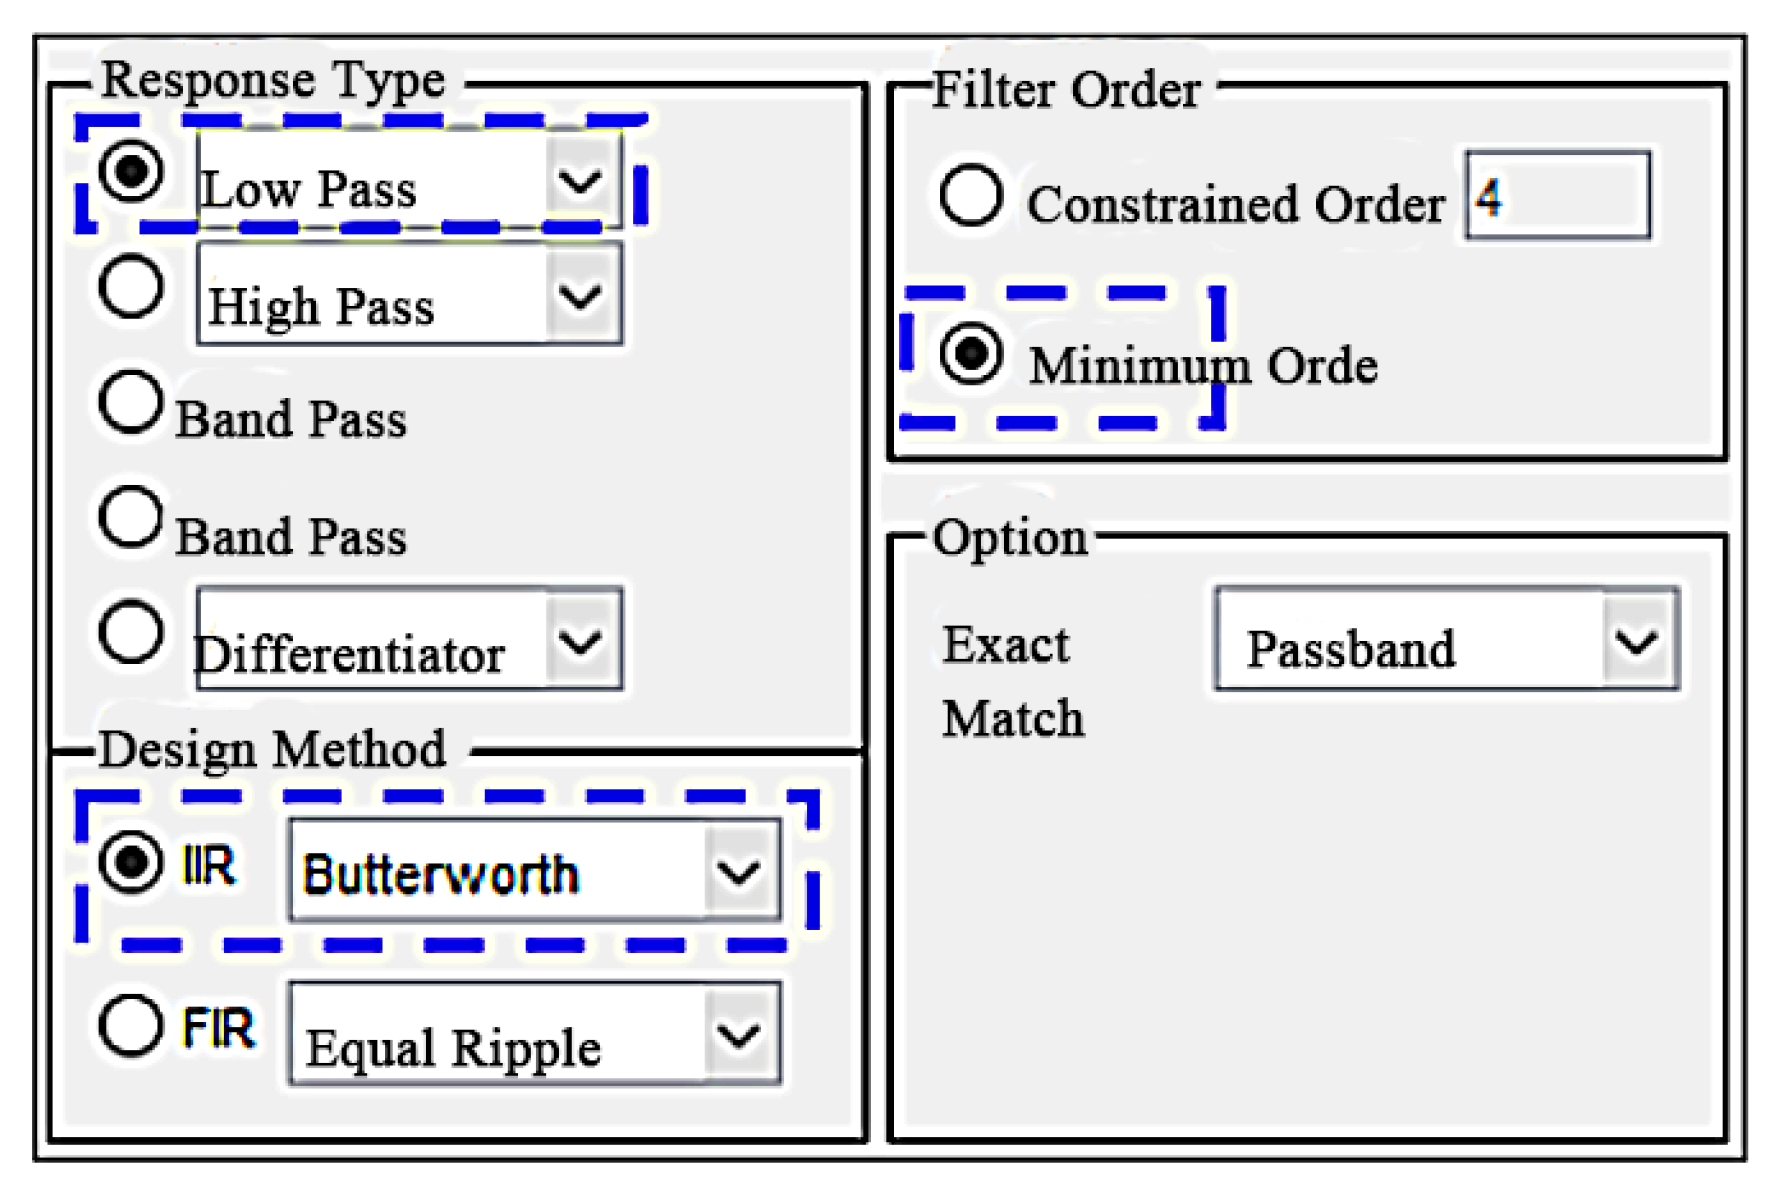
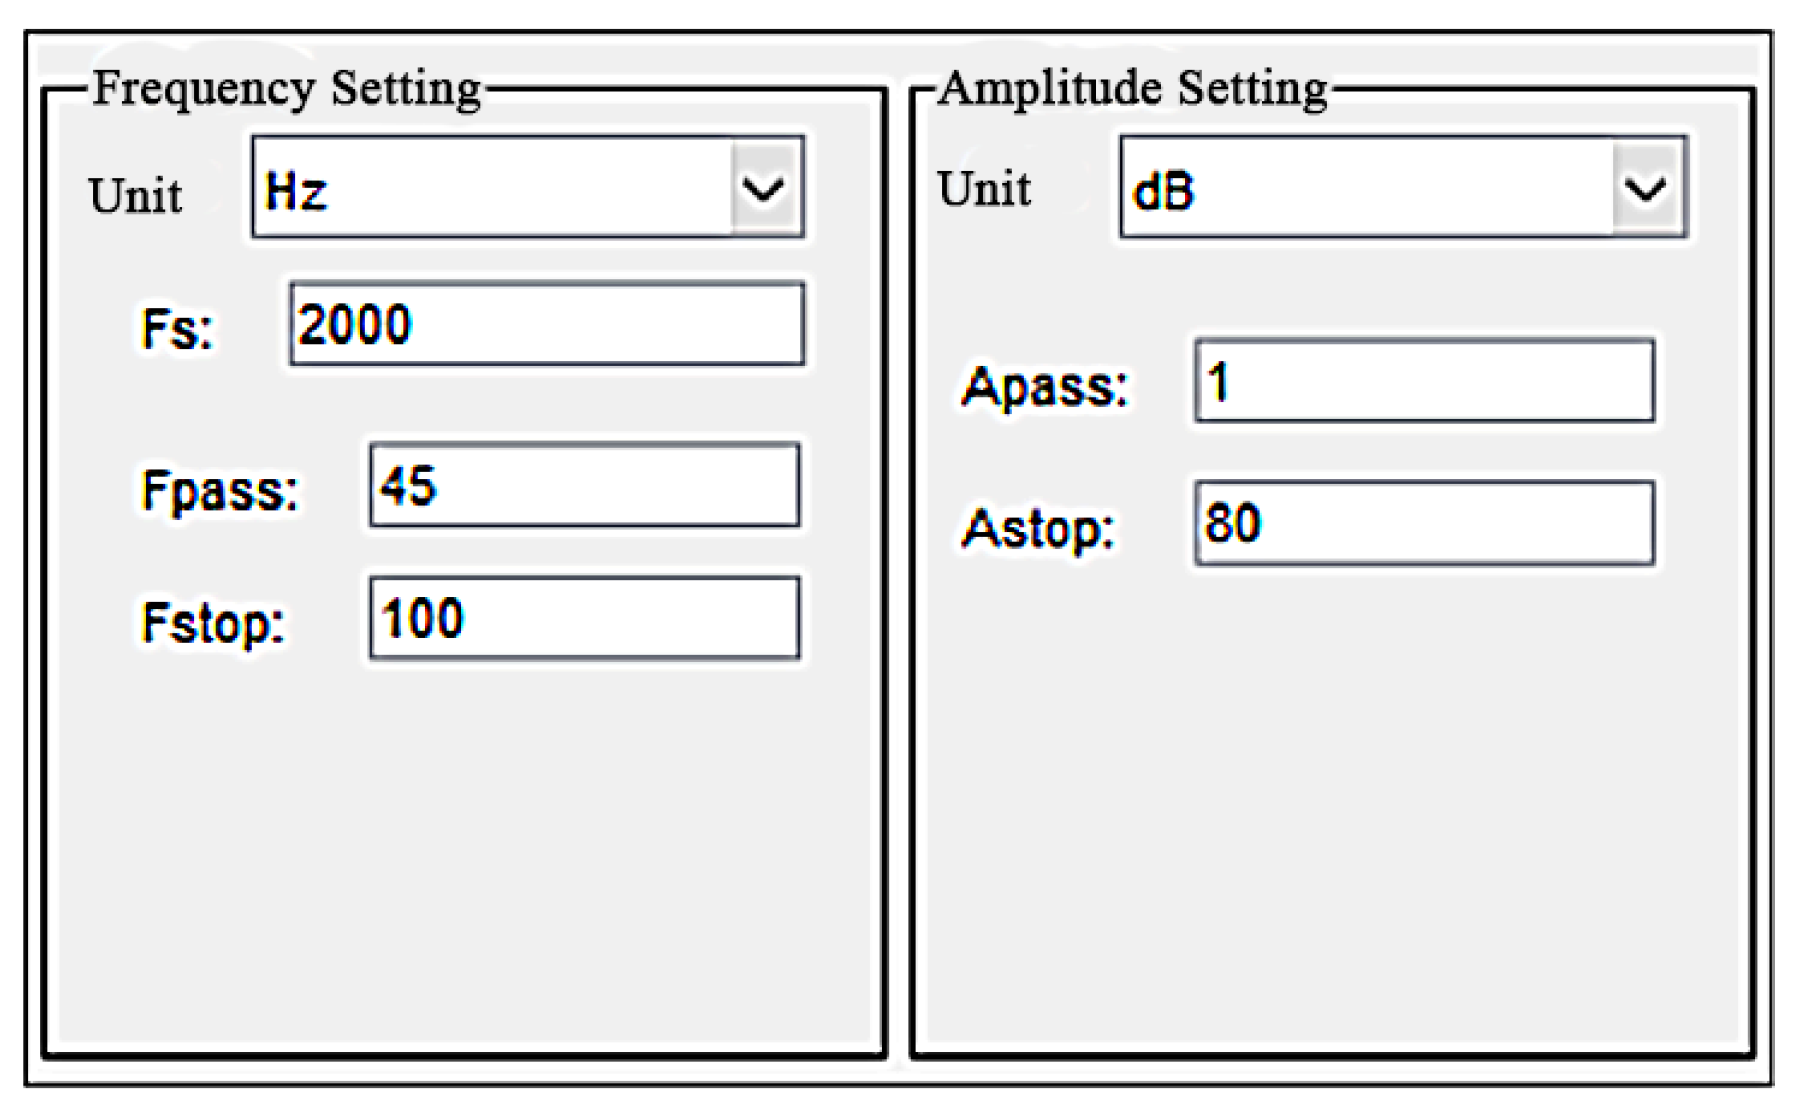
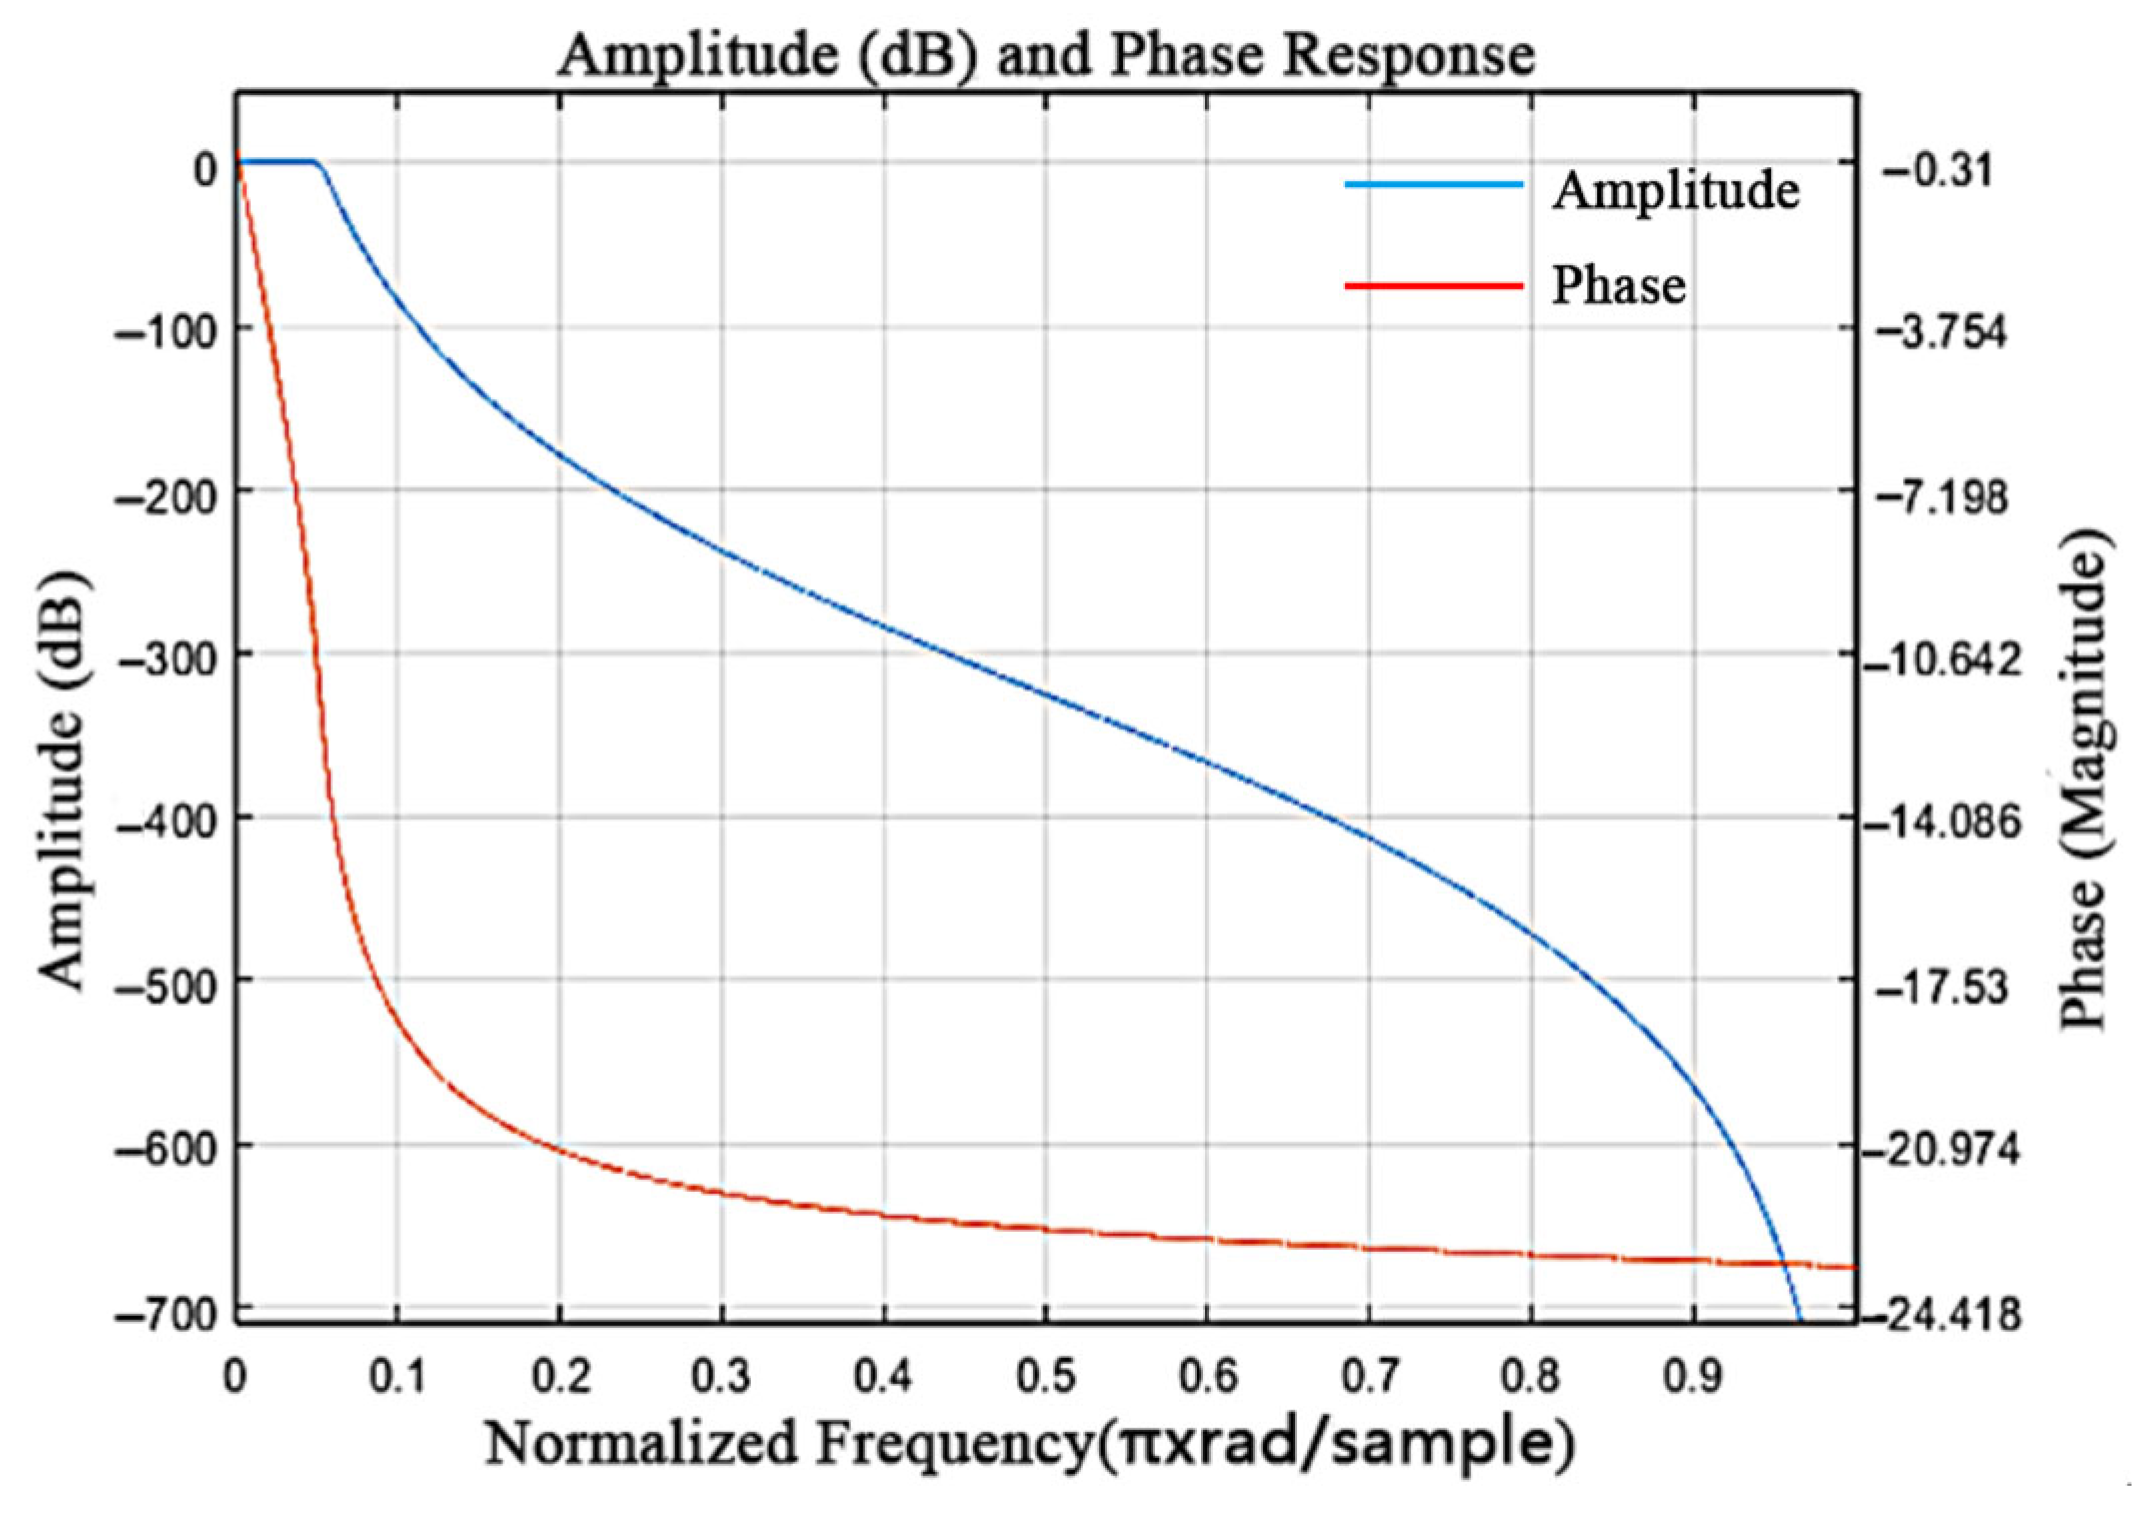
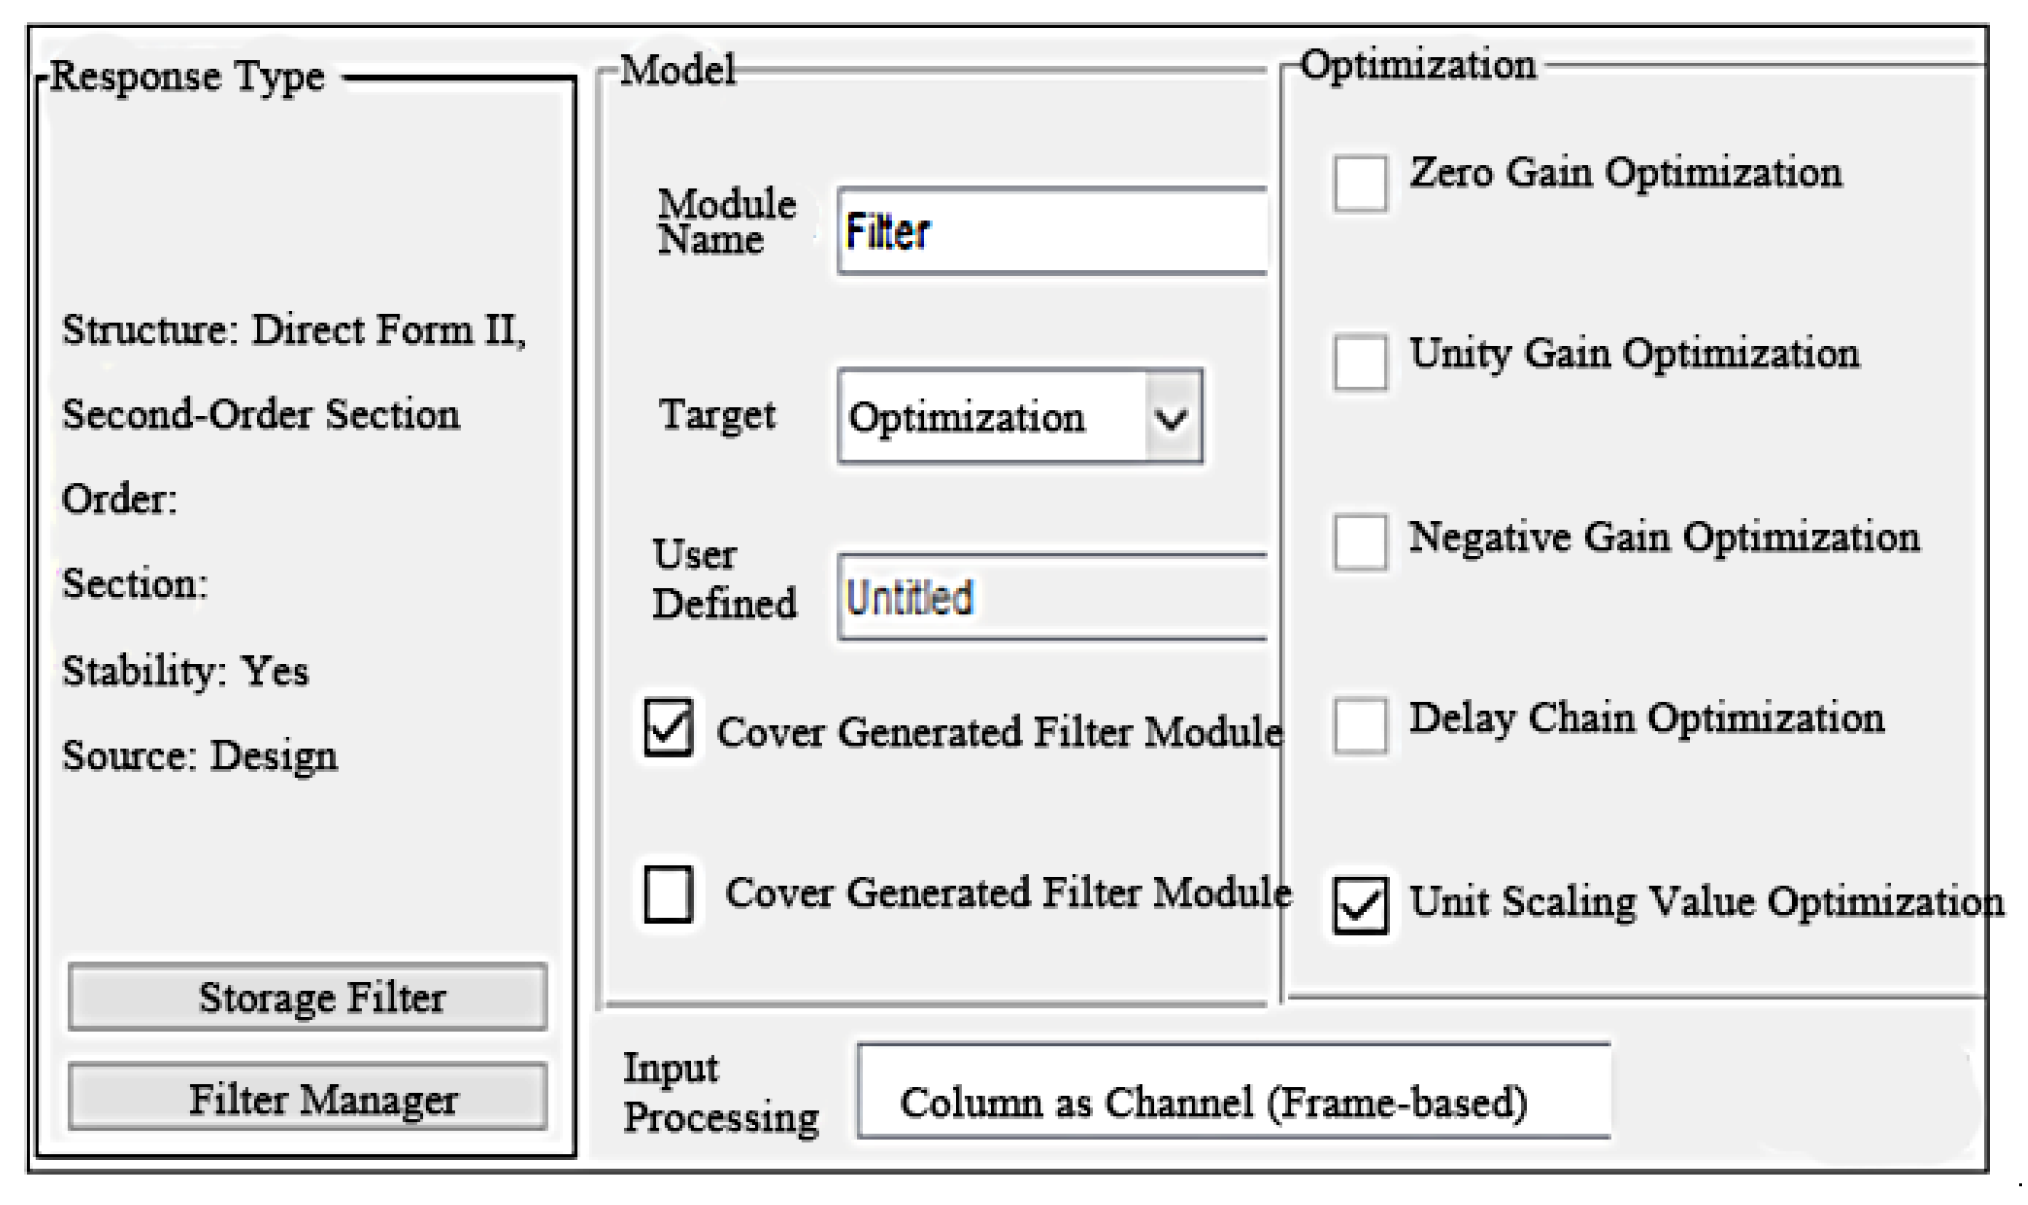
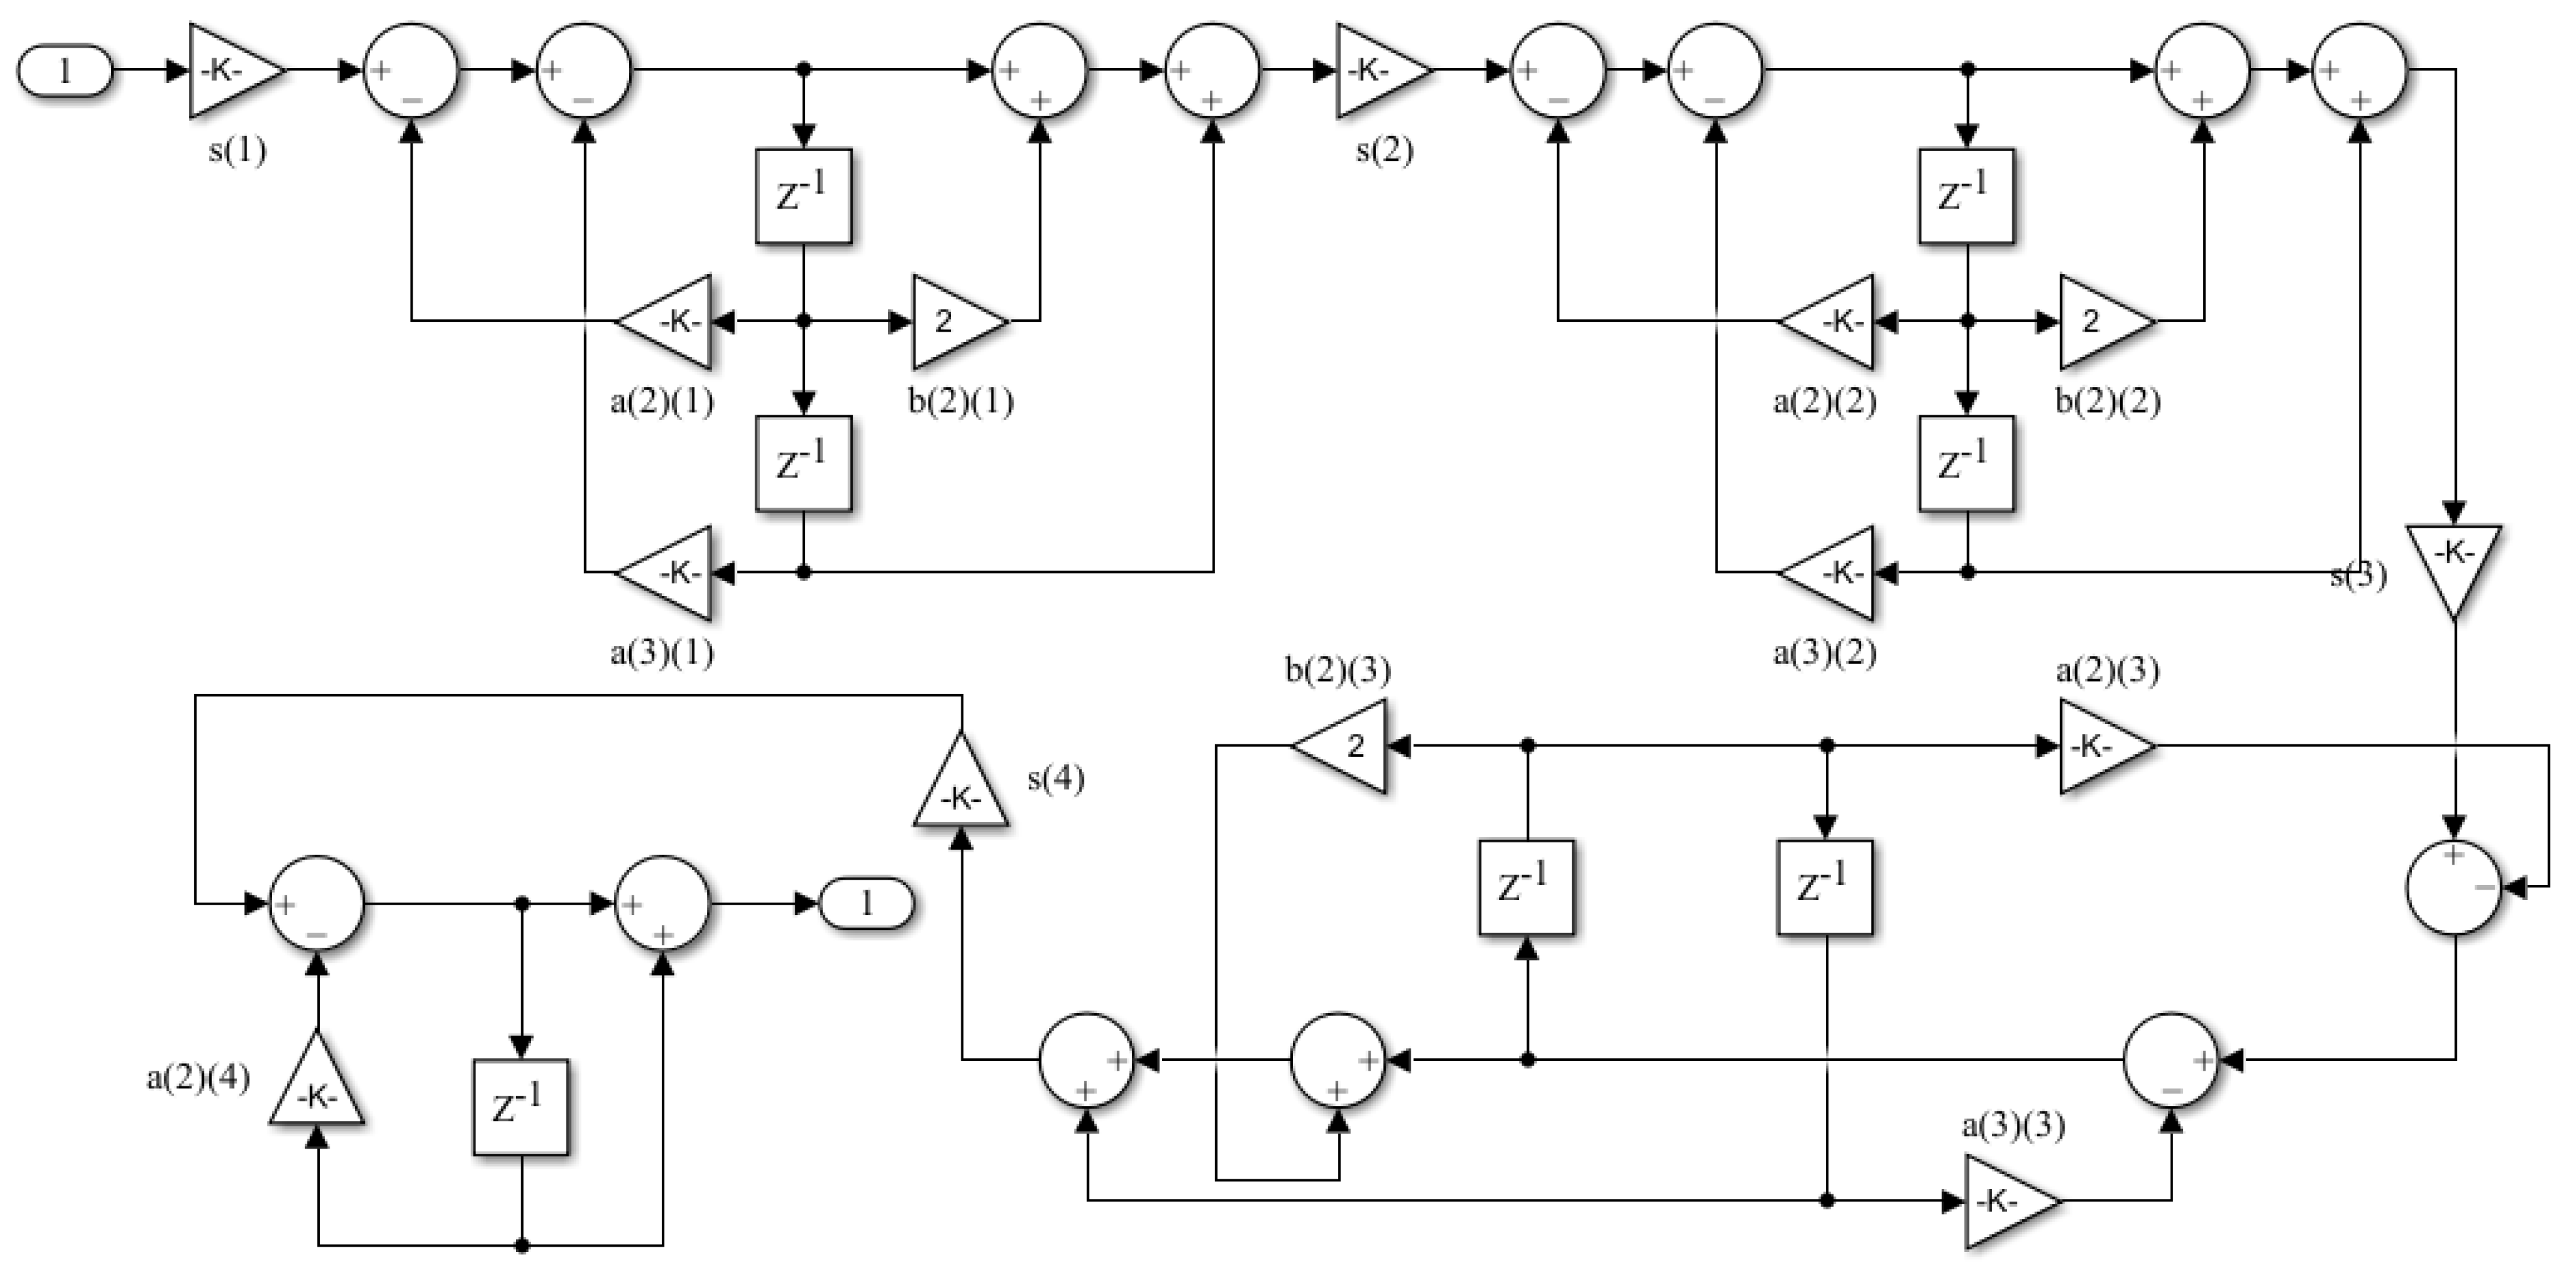
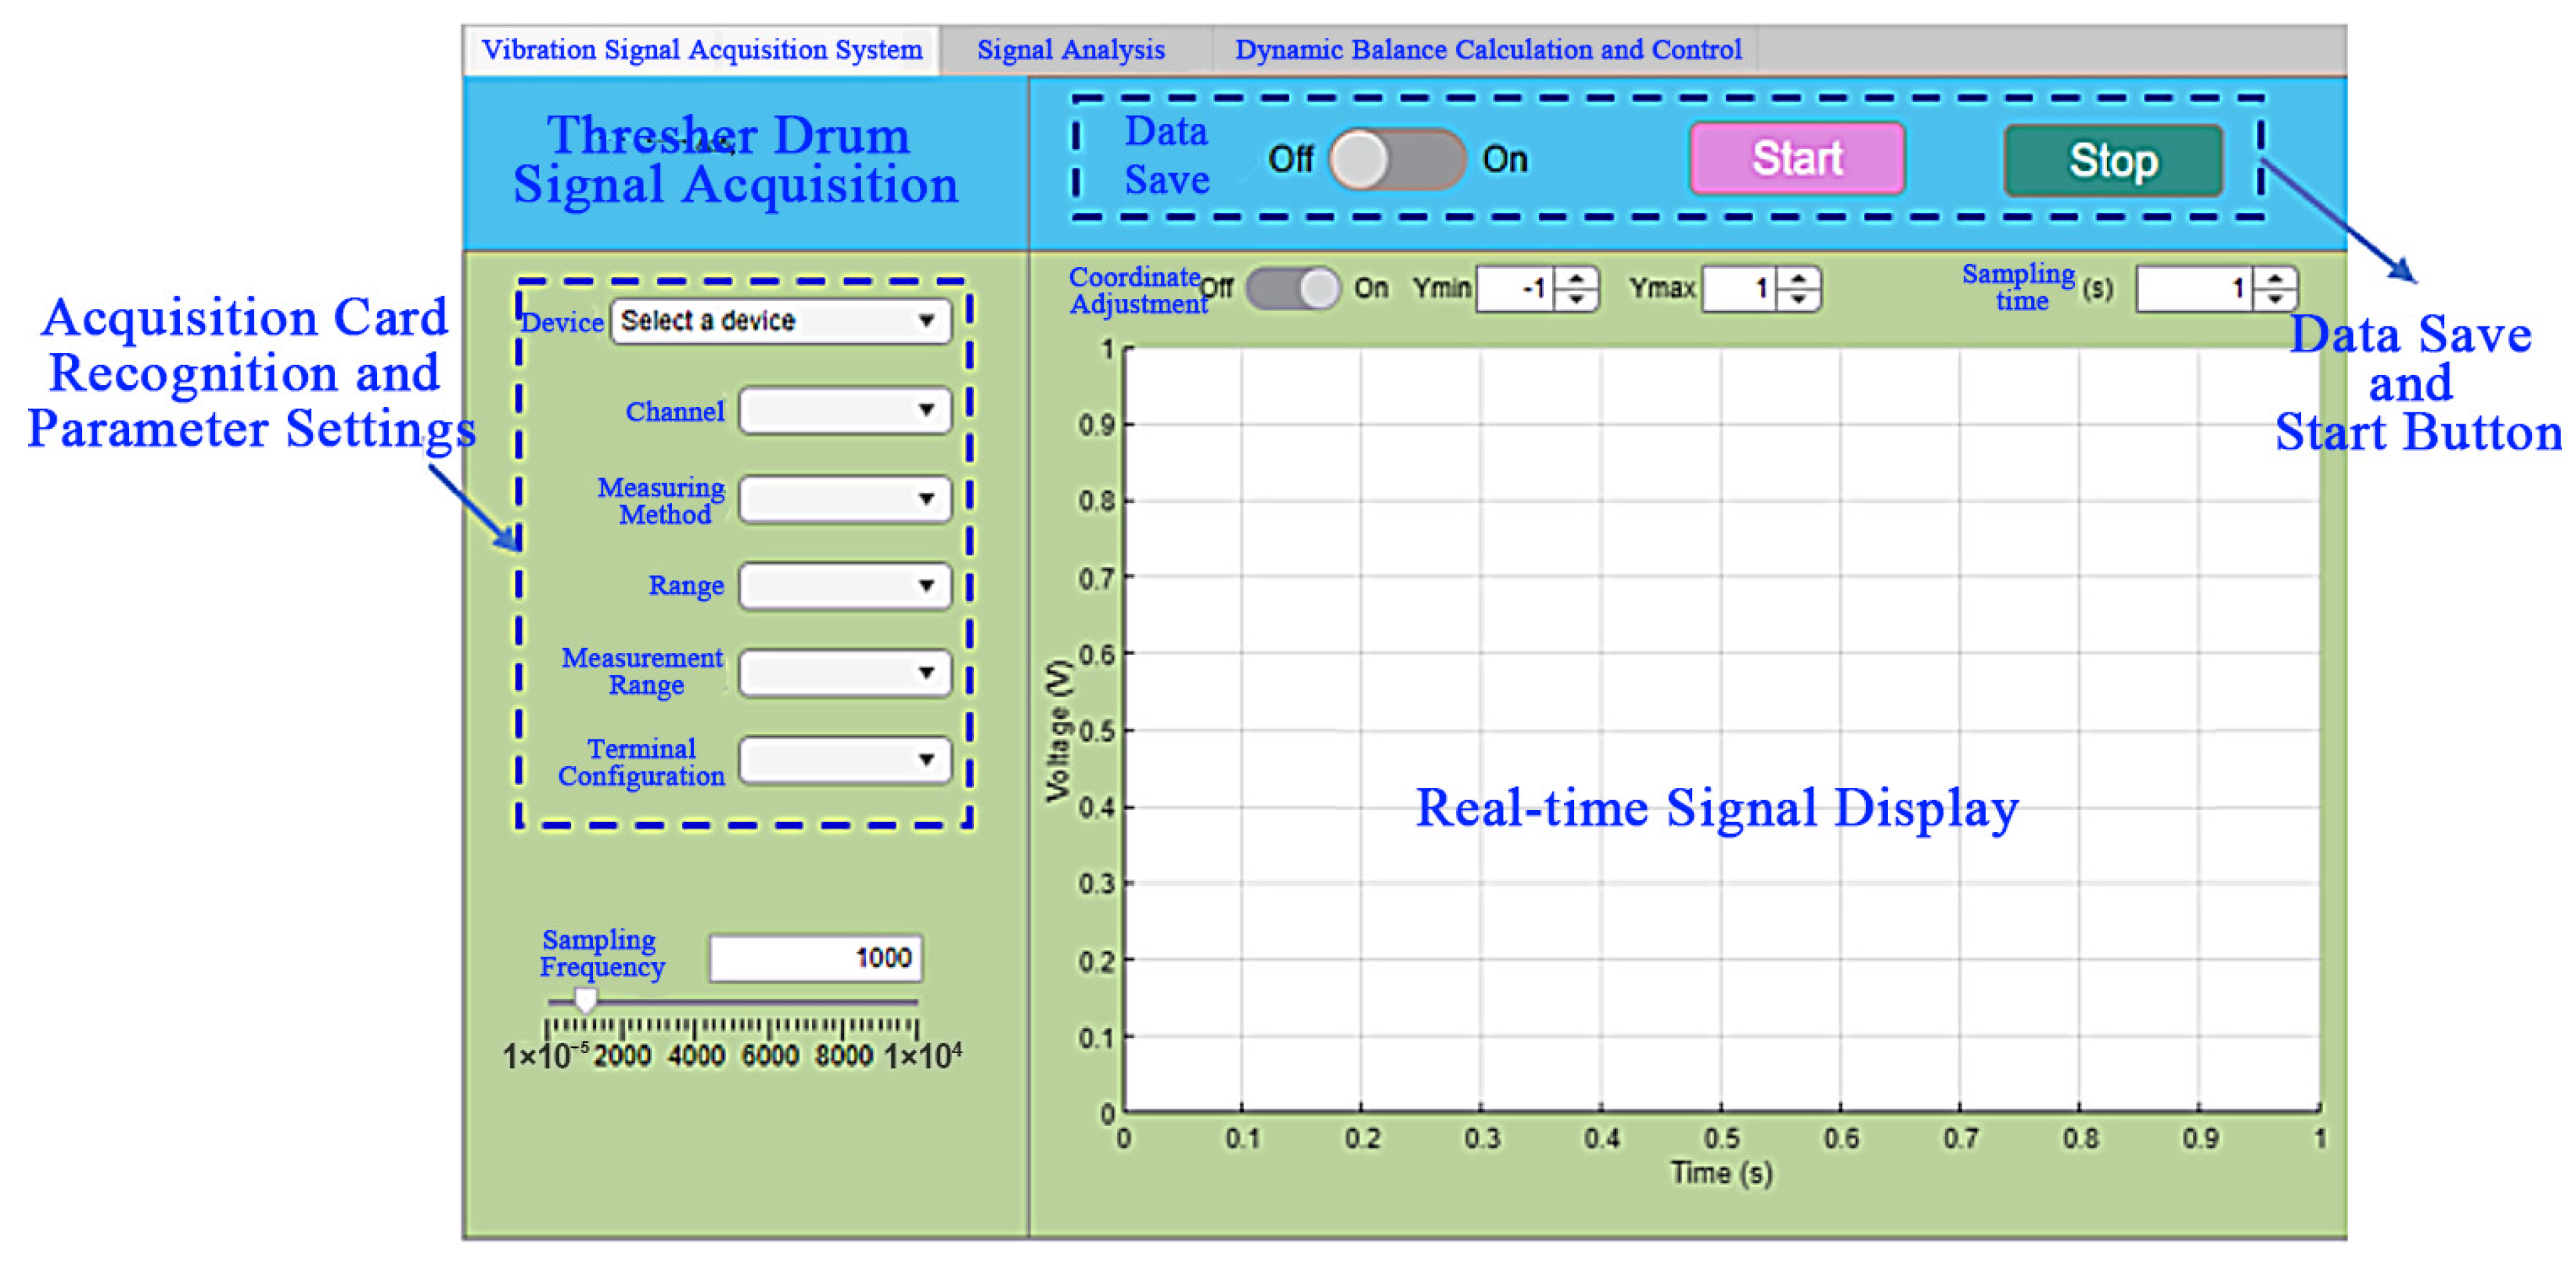
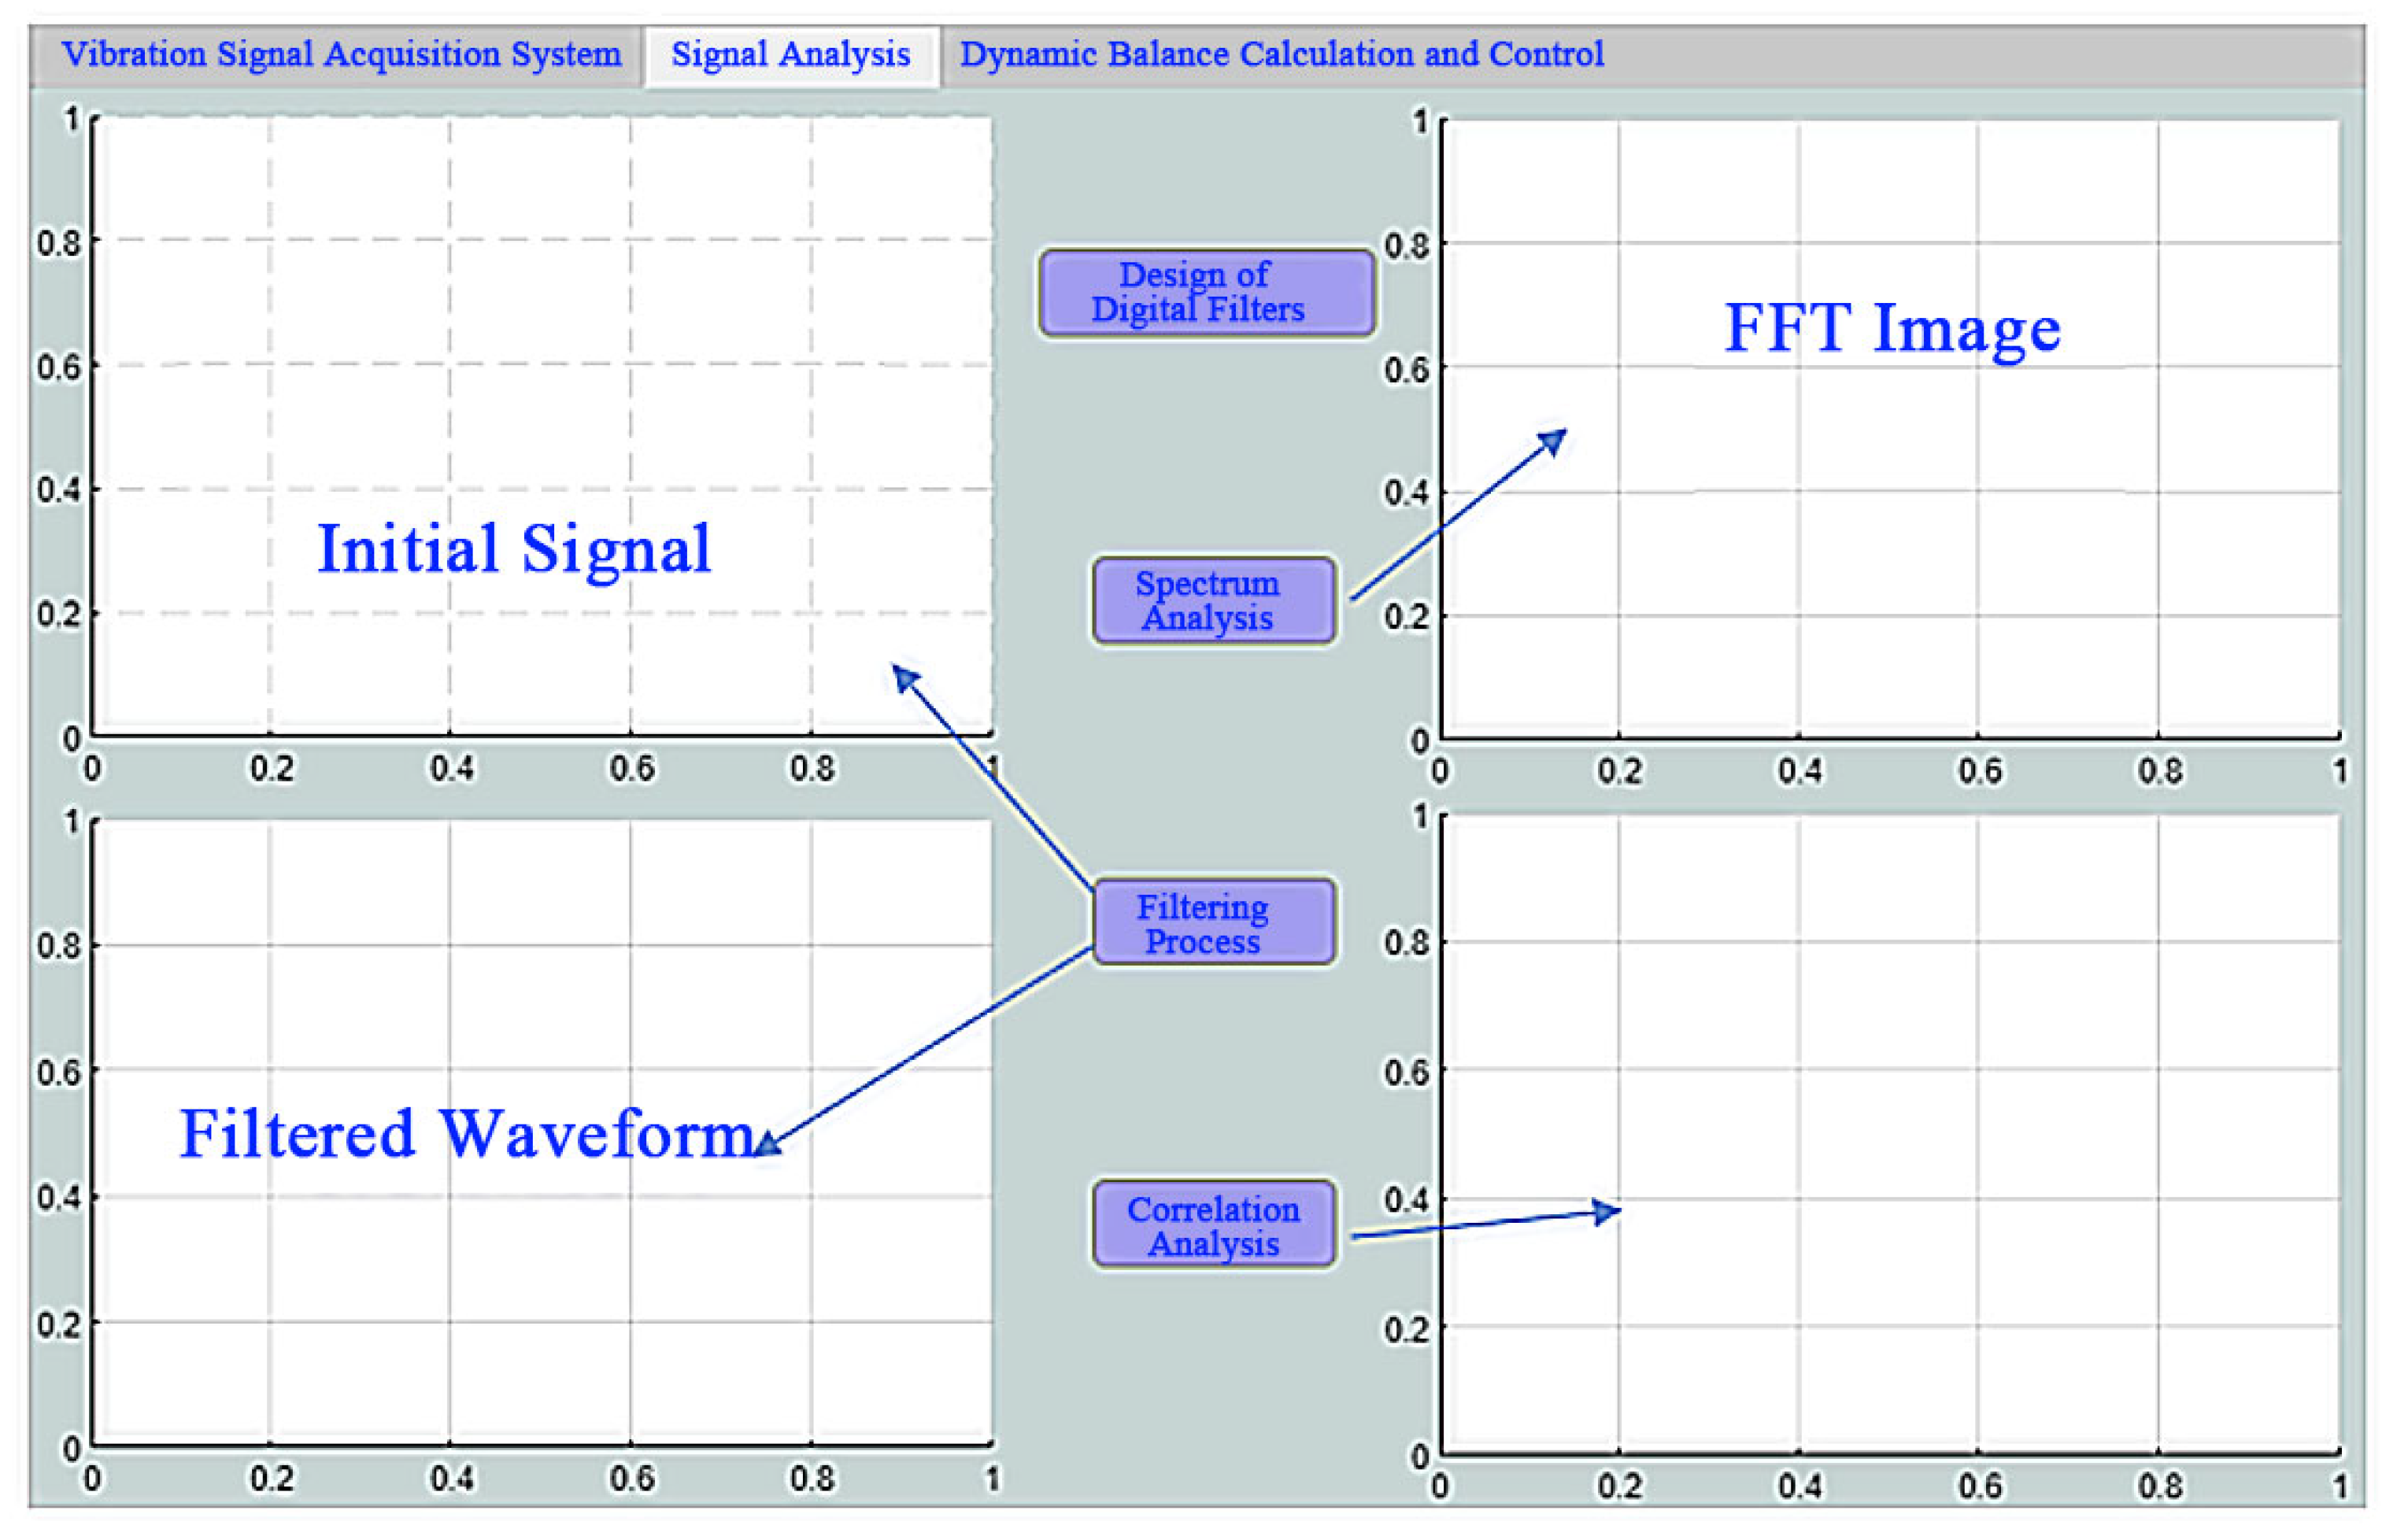
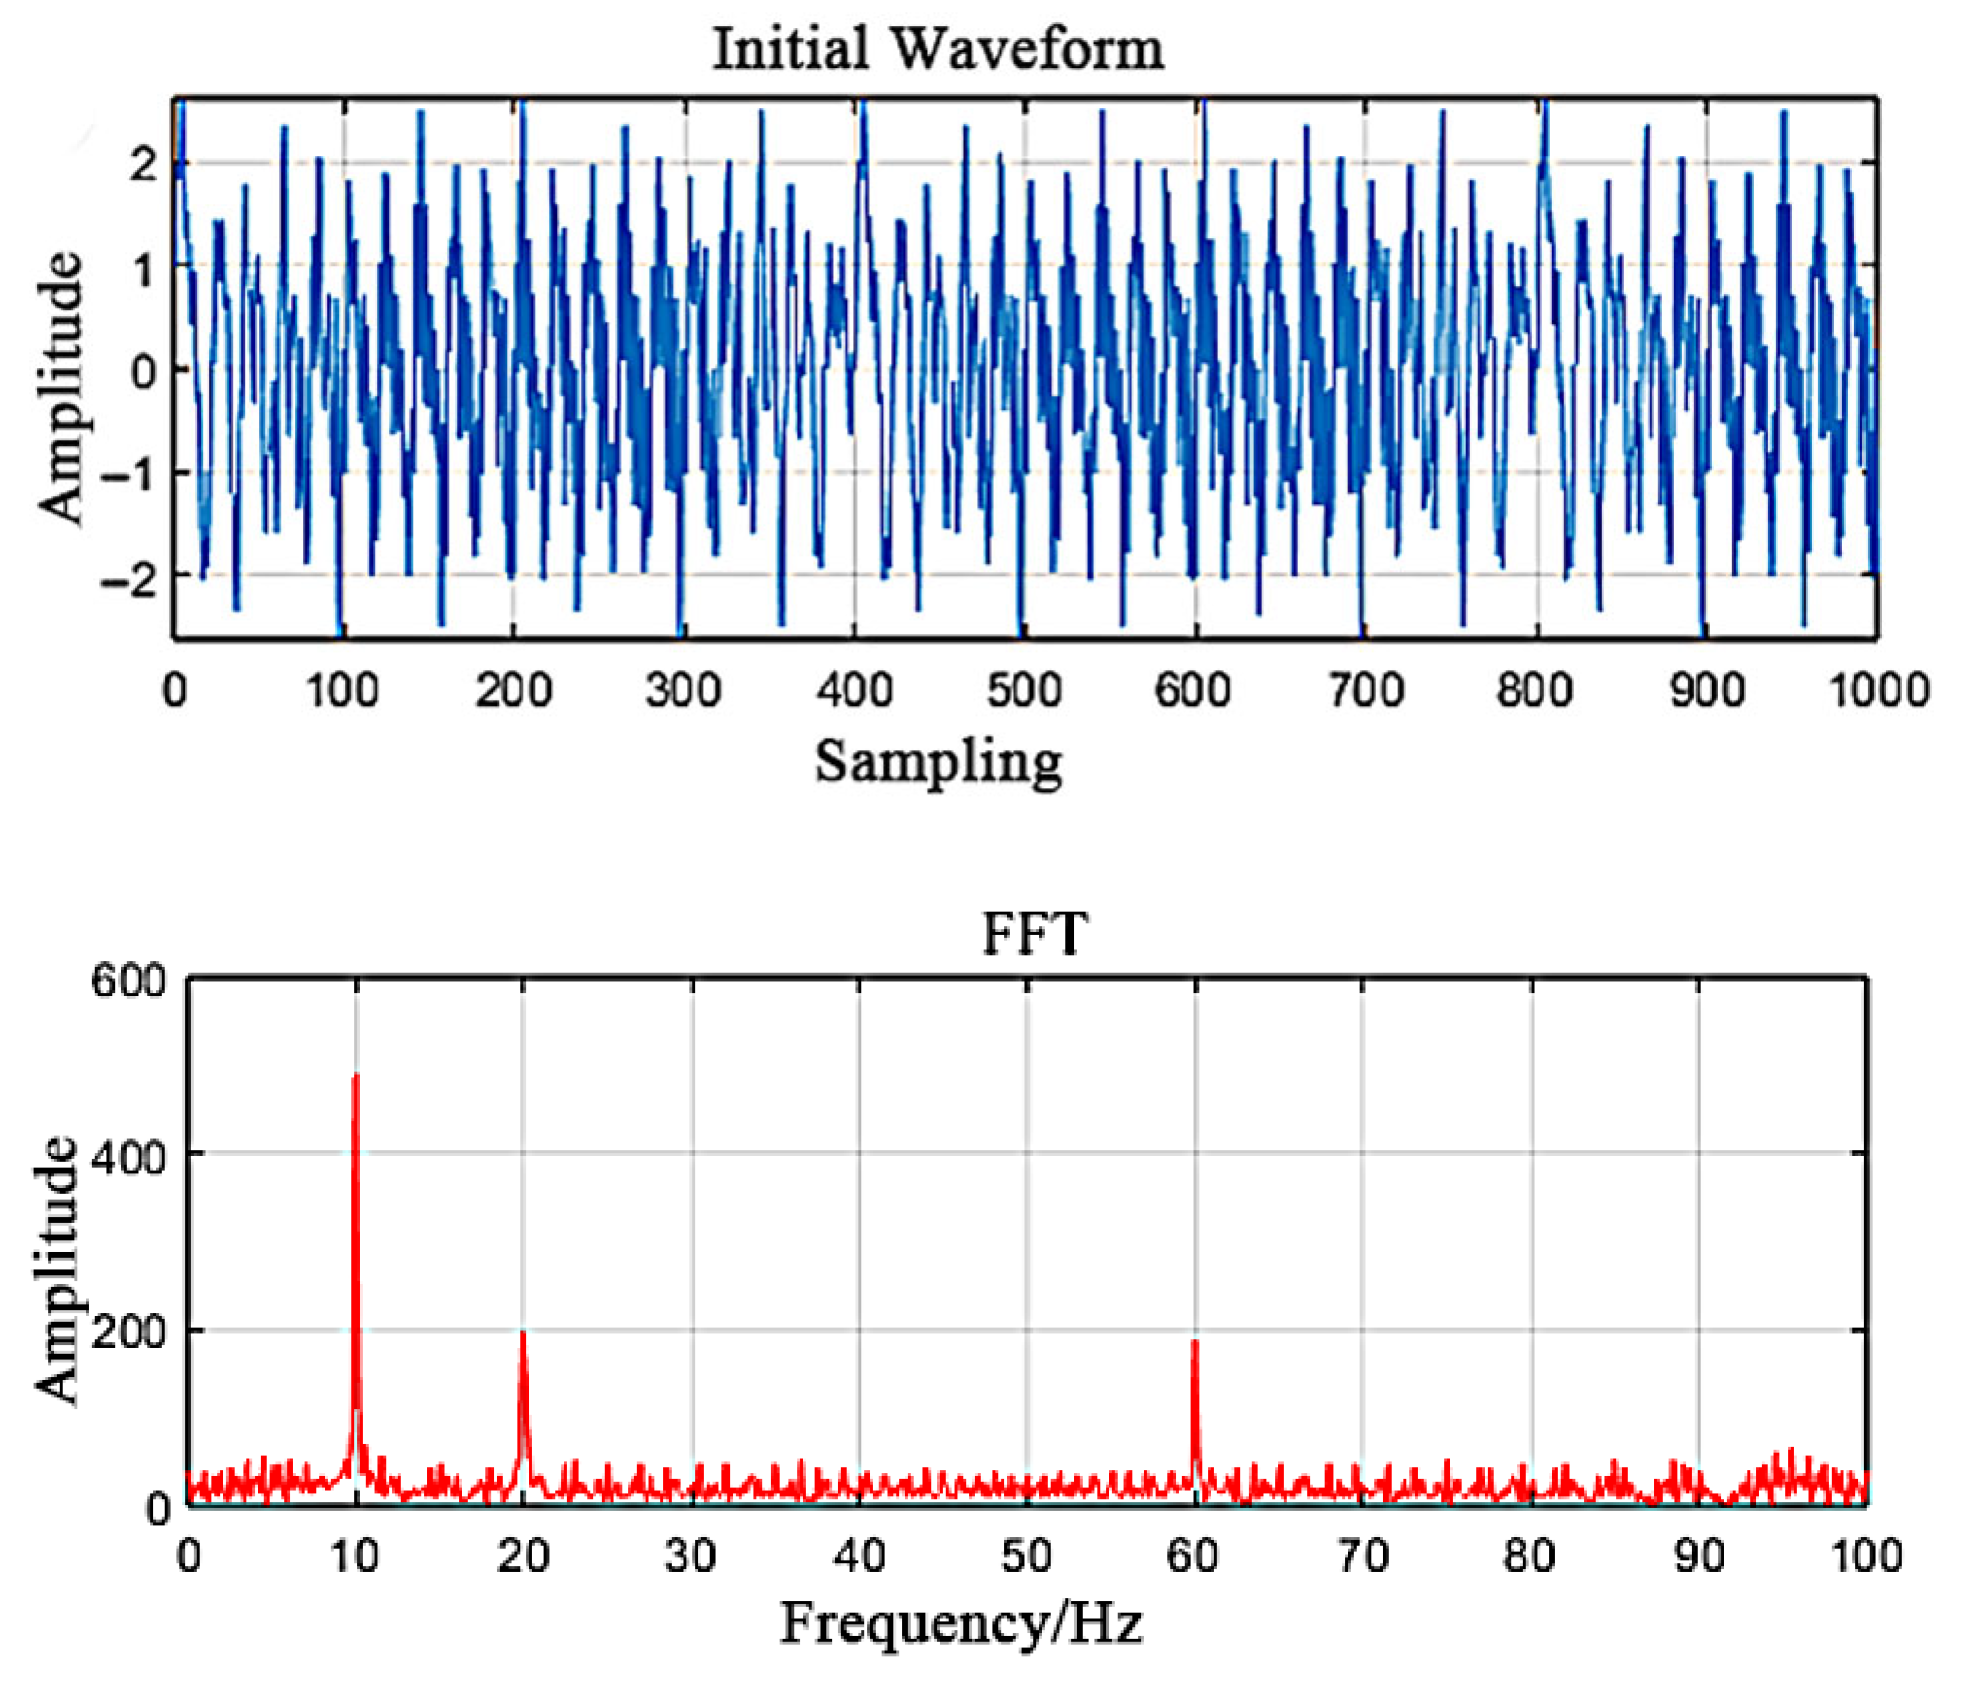
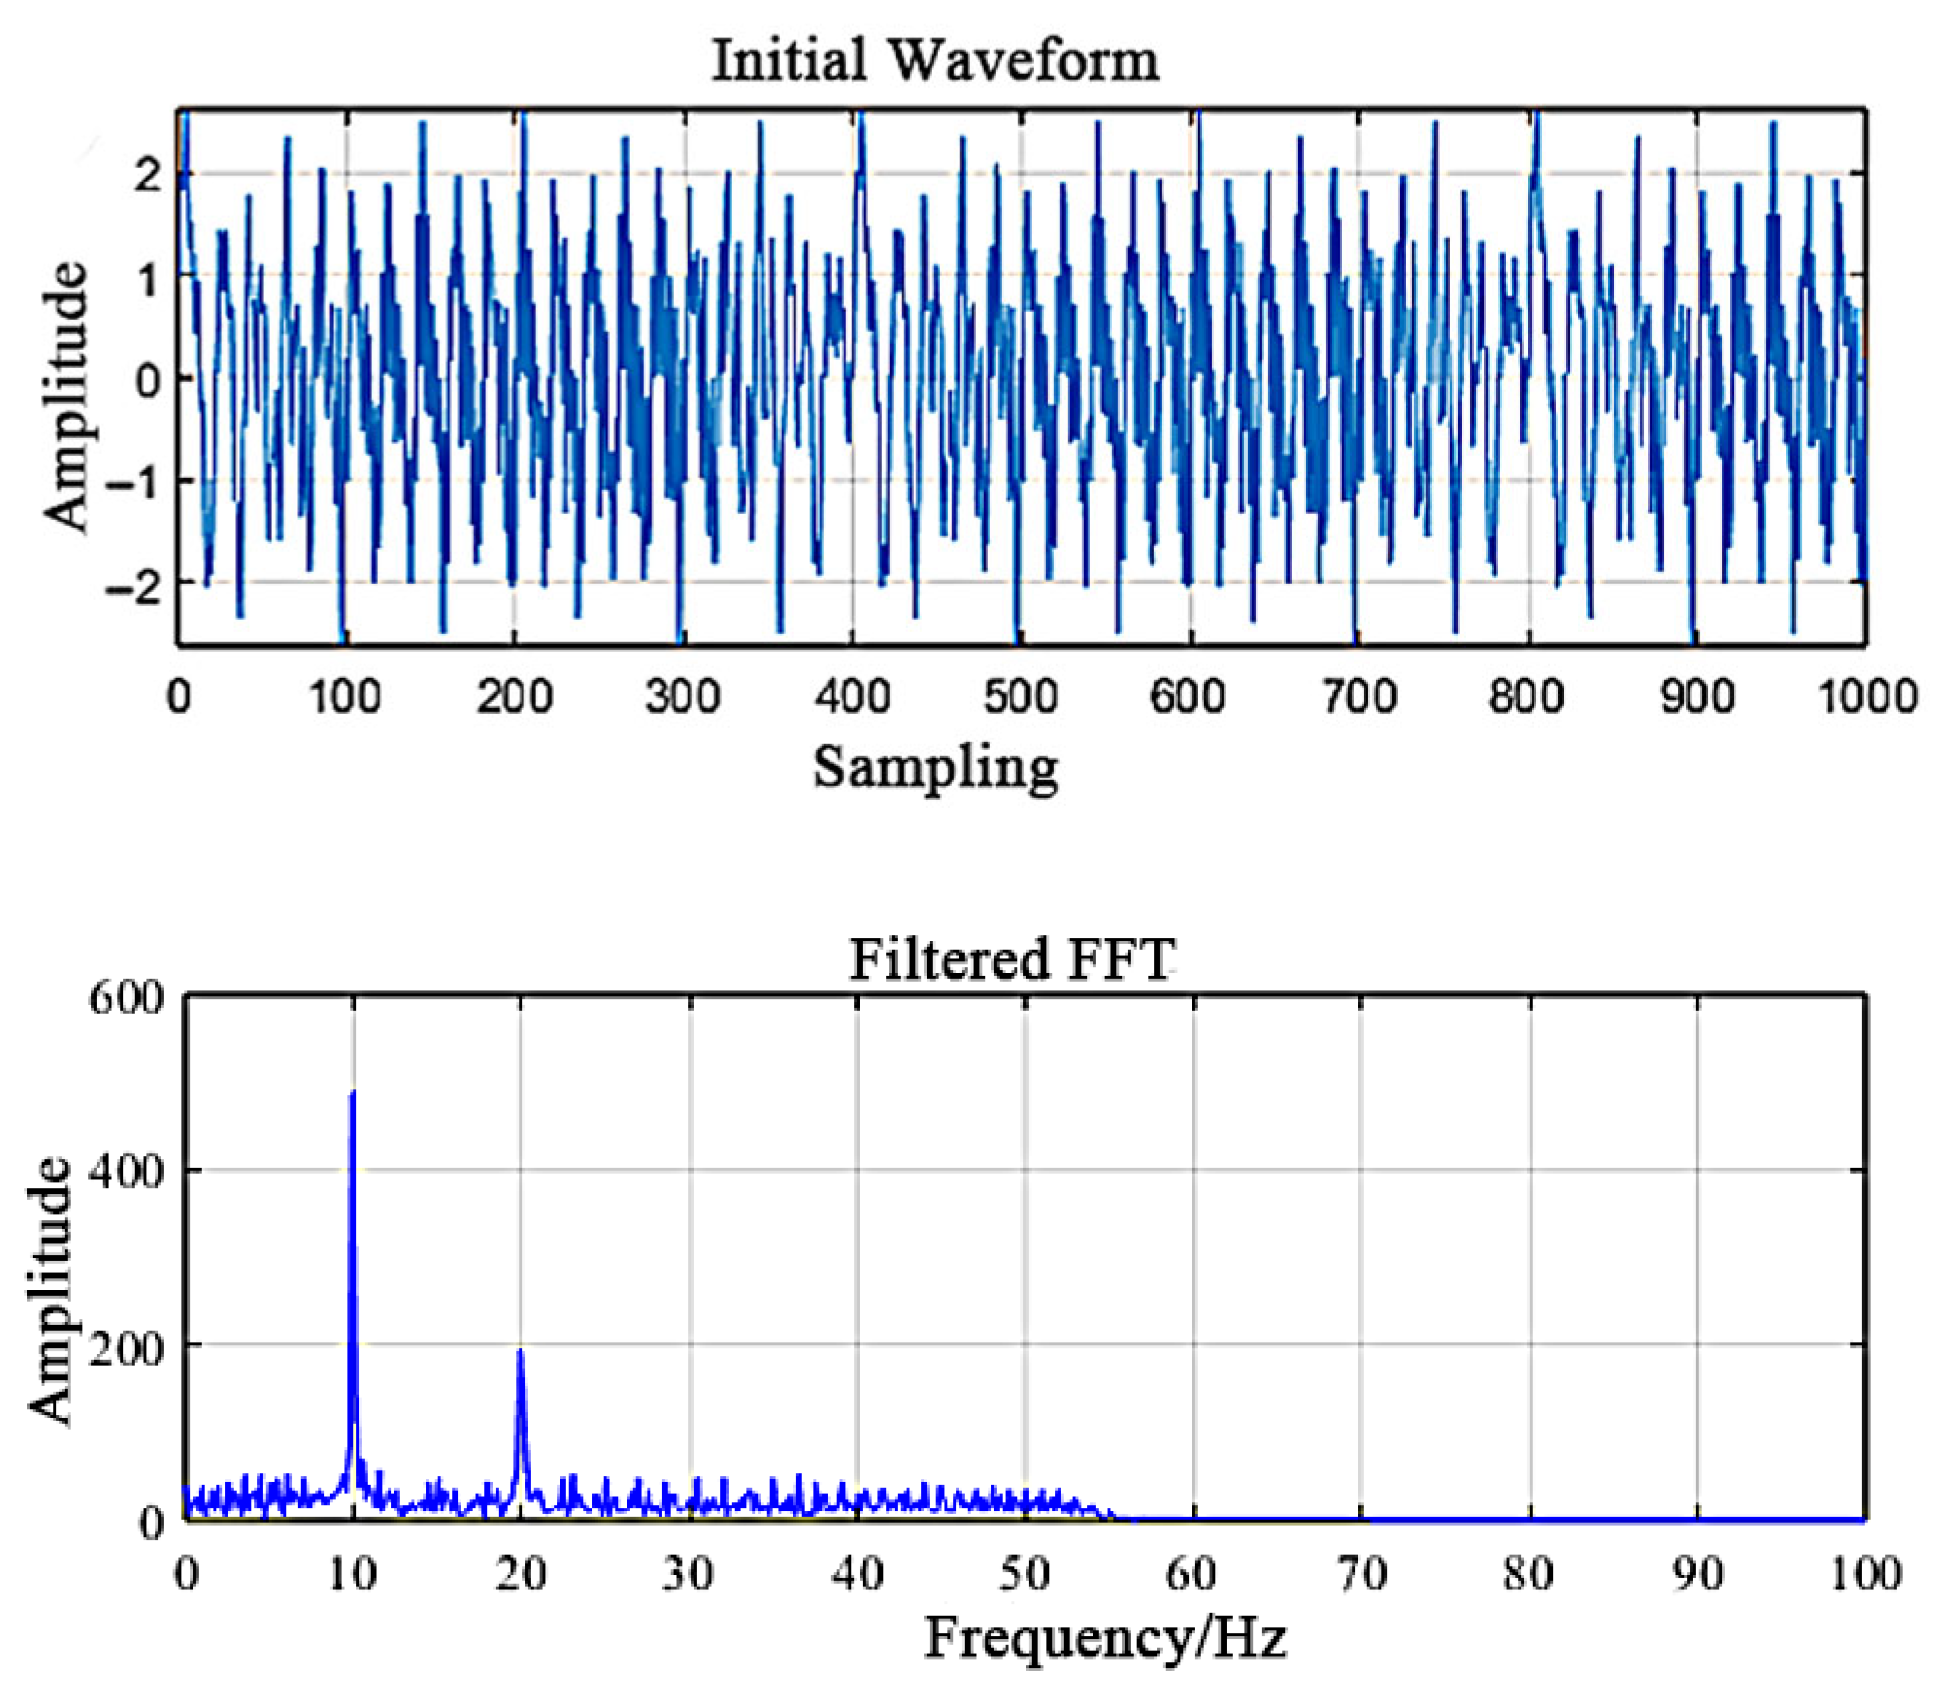
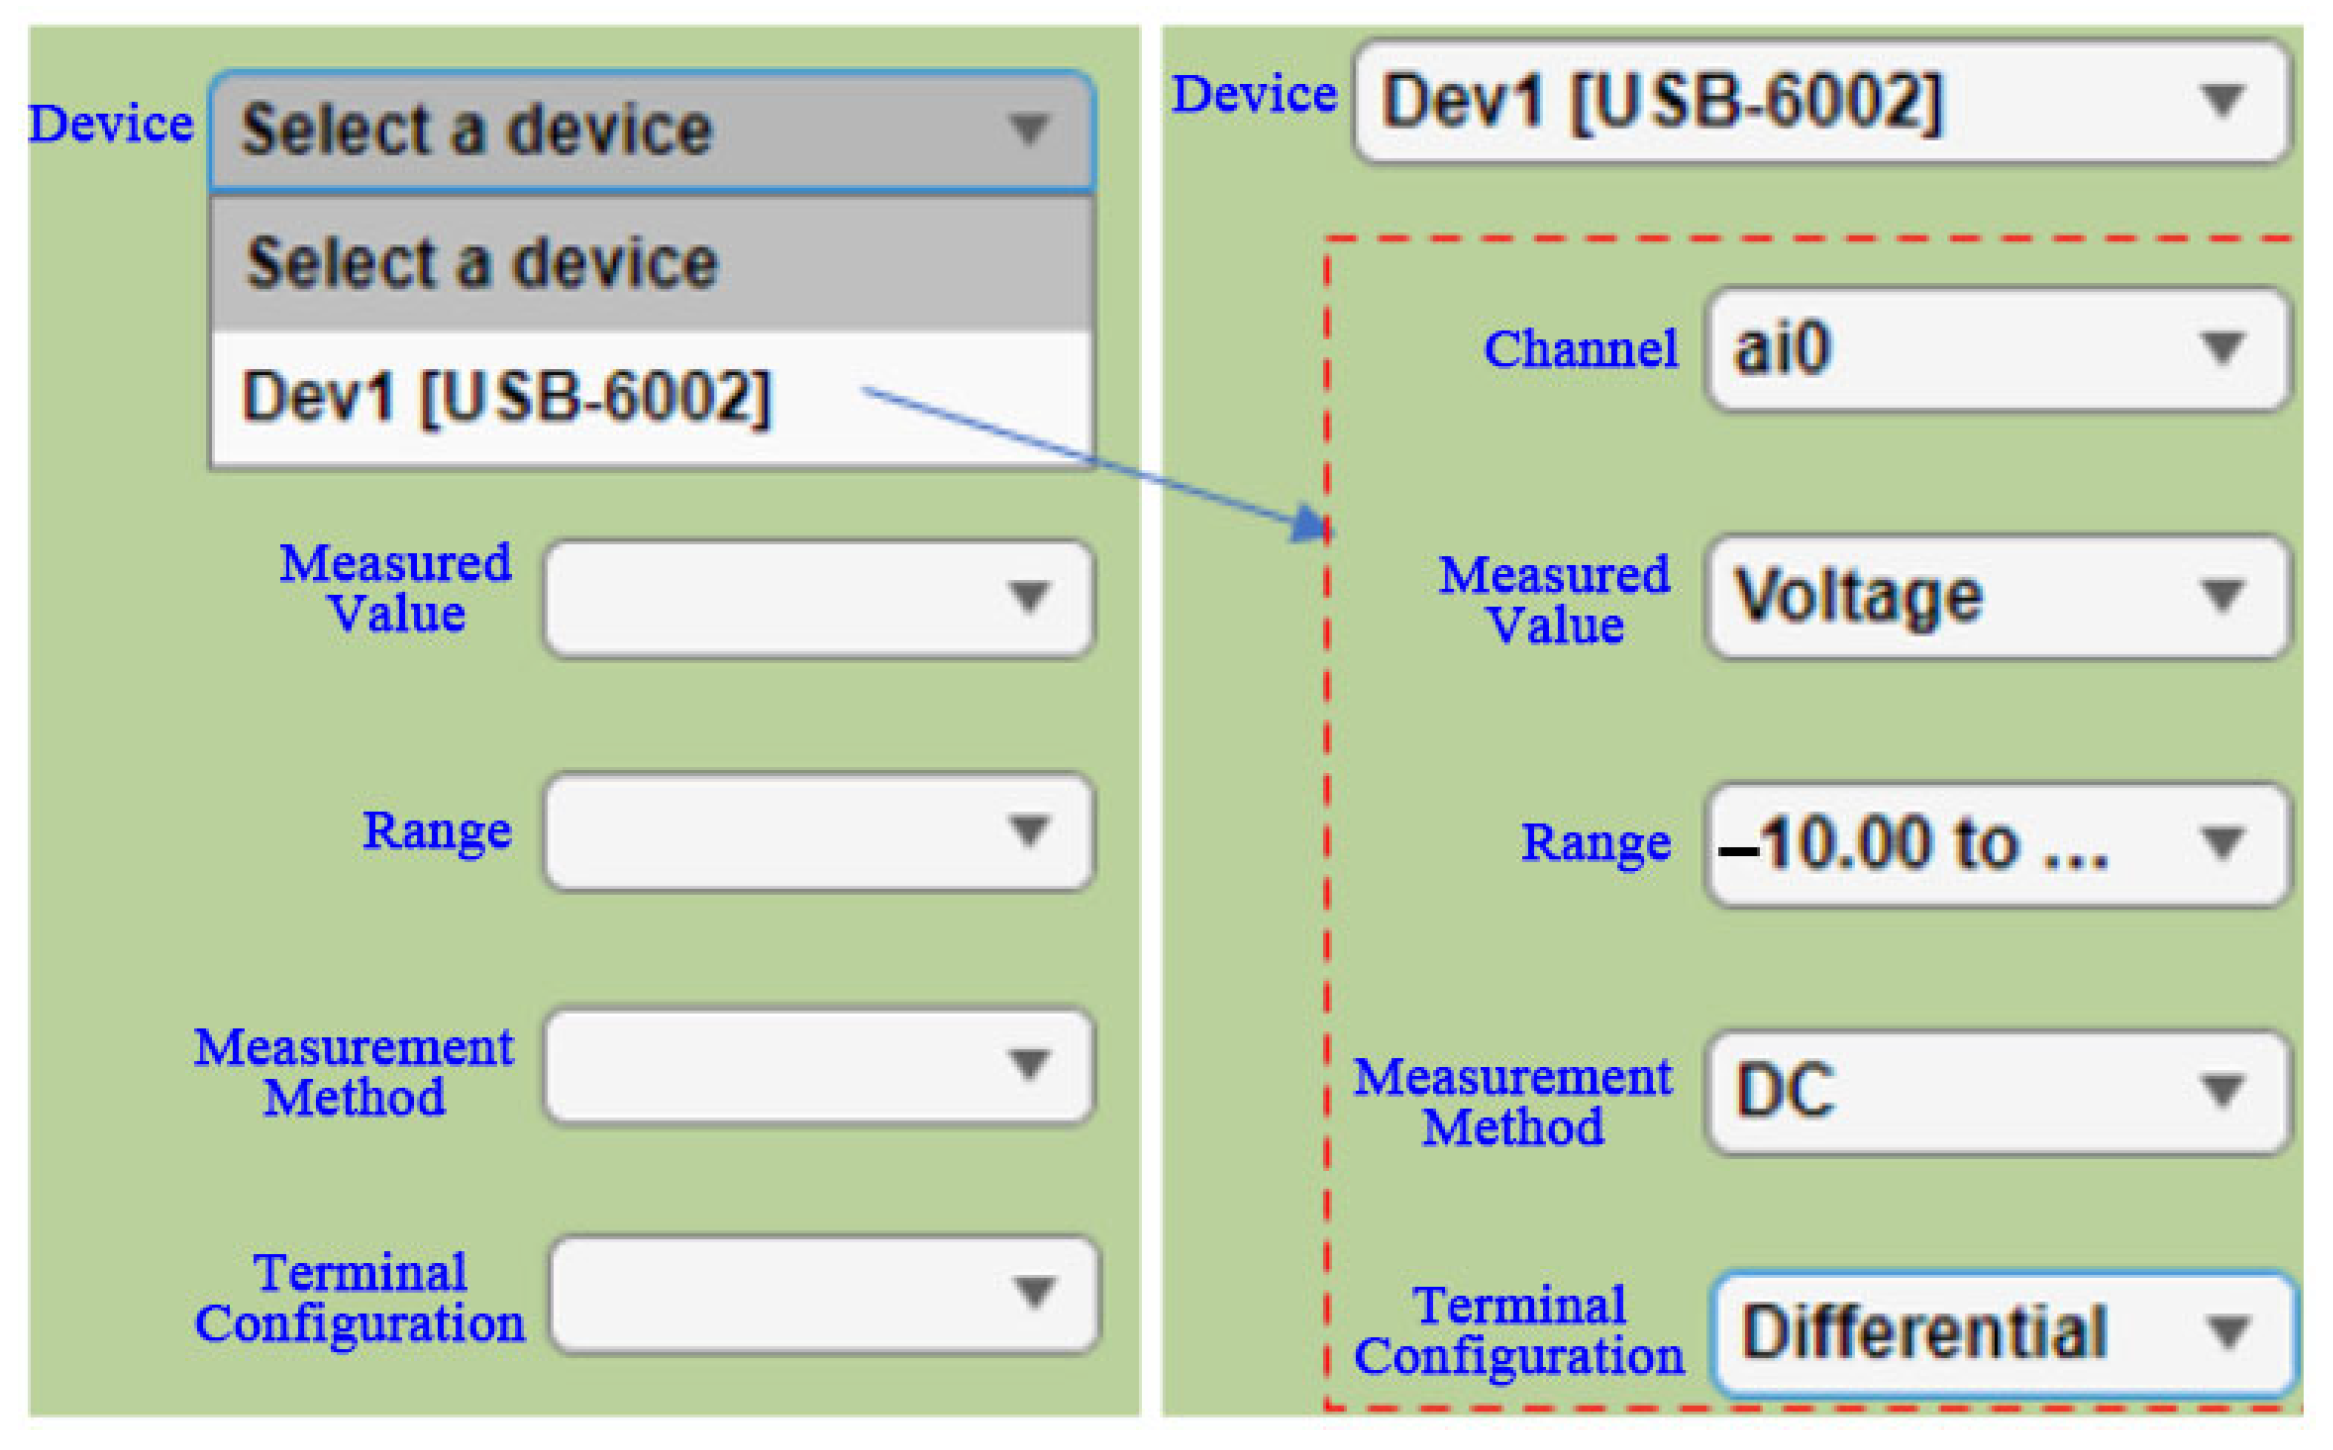
The dynamic balance testing module has been designed and implemented to serve as the foundational component of an automatic balancing system for combine harvester threshing drums. The module’s design enables the real-time acquisition of unbalanced vibration signals and dictates the appropriate hardware configuration. Because excessive interference signals in operation often obscure fundamental frequency characteristics, a specialized signal conditioning process was developed. This process integrates a meticulously designed low-pass filter, supported by detailed parameter calculations and modeling, with correlation calculations and FFT transformations. This comprehensive signal processing chain achieves effective interference suppression and accurate extraction of the true signal amplitude at the operating frequency, thereby establishing a robust and precise basis for subsequent dynamic balancing calculations.
(2)
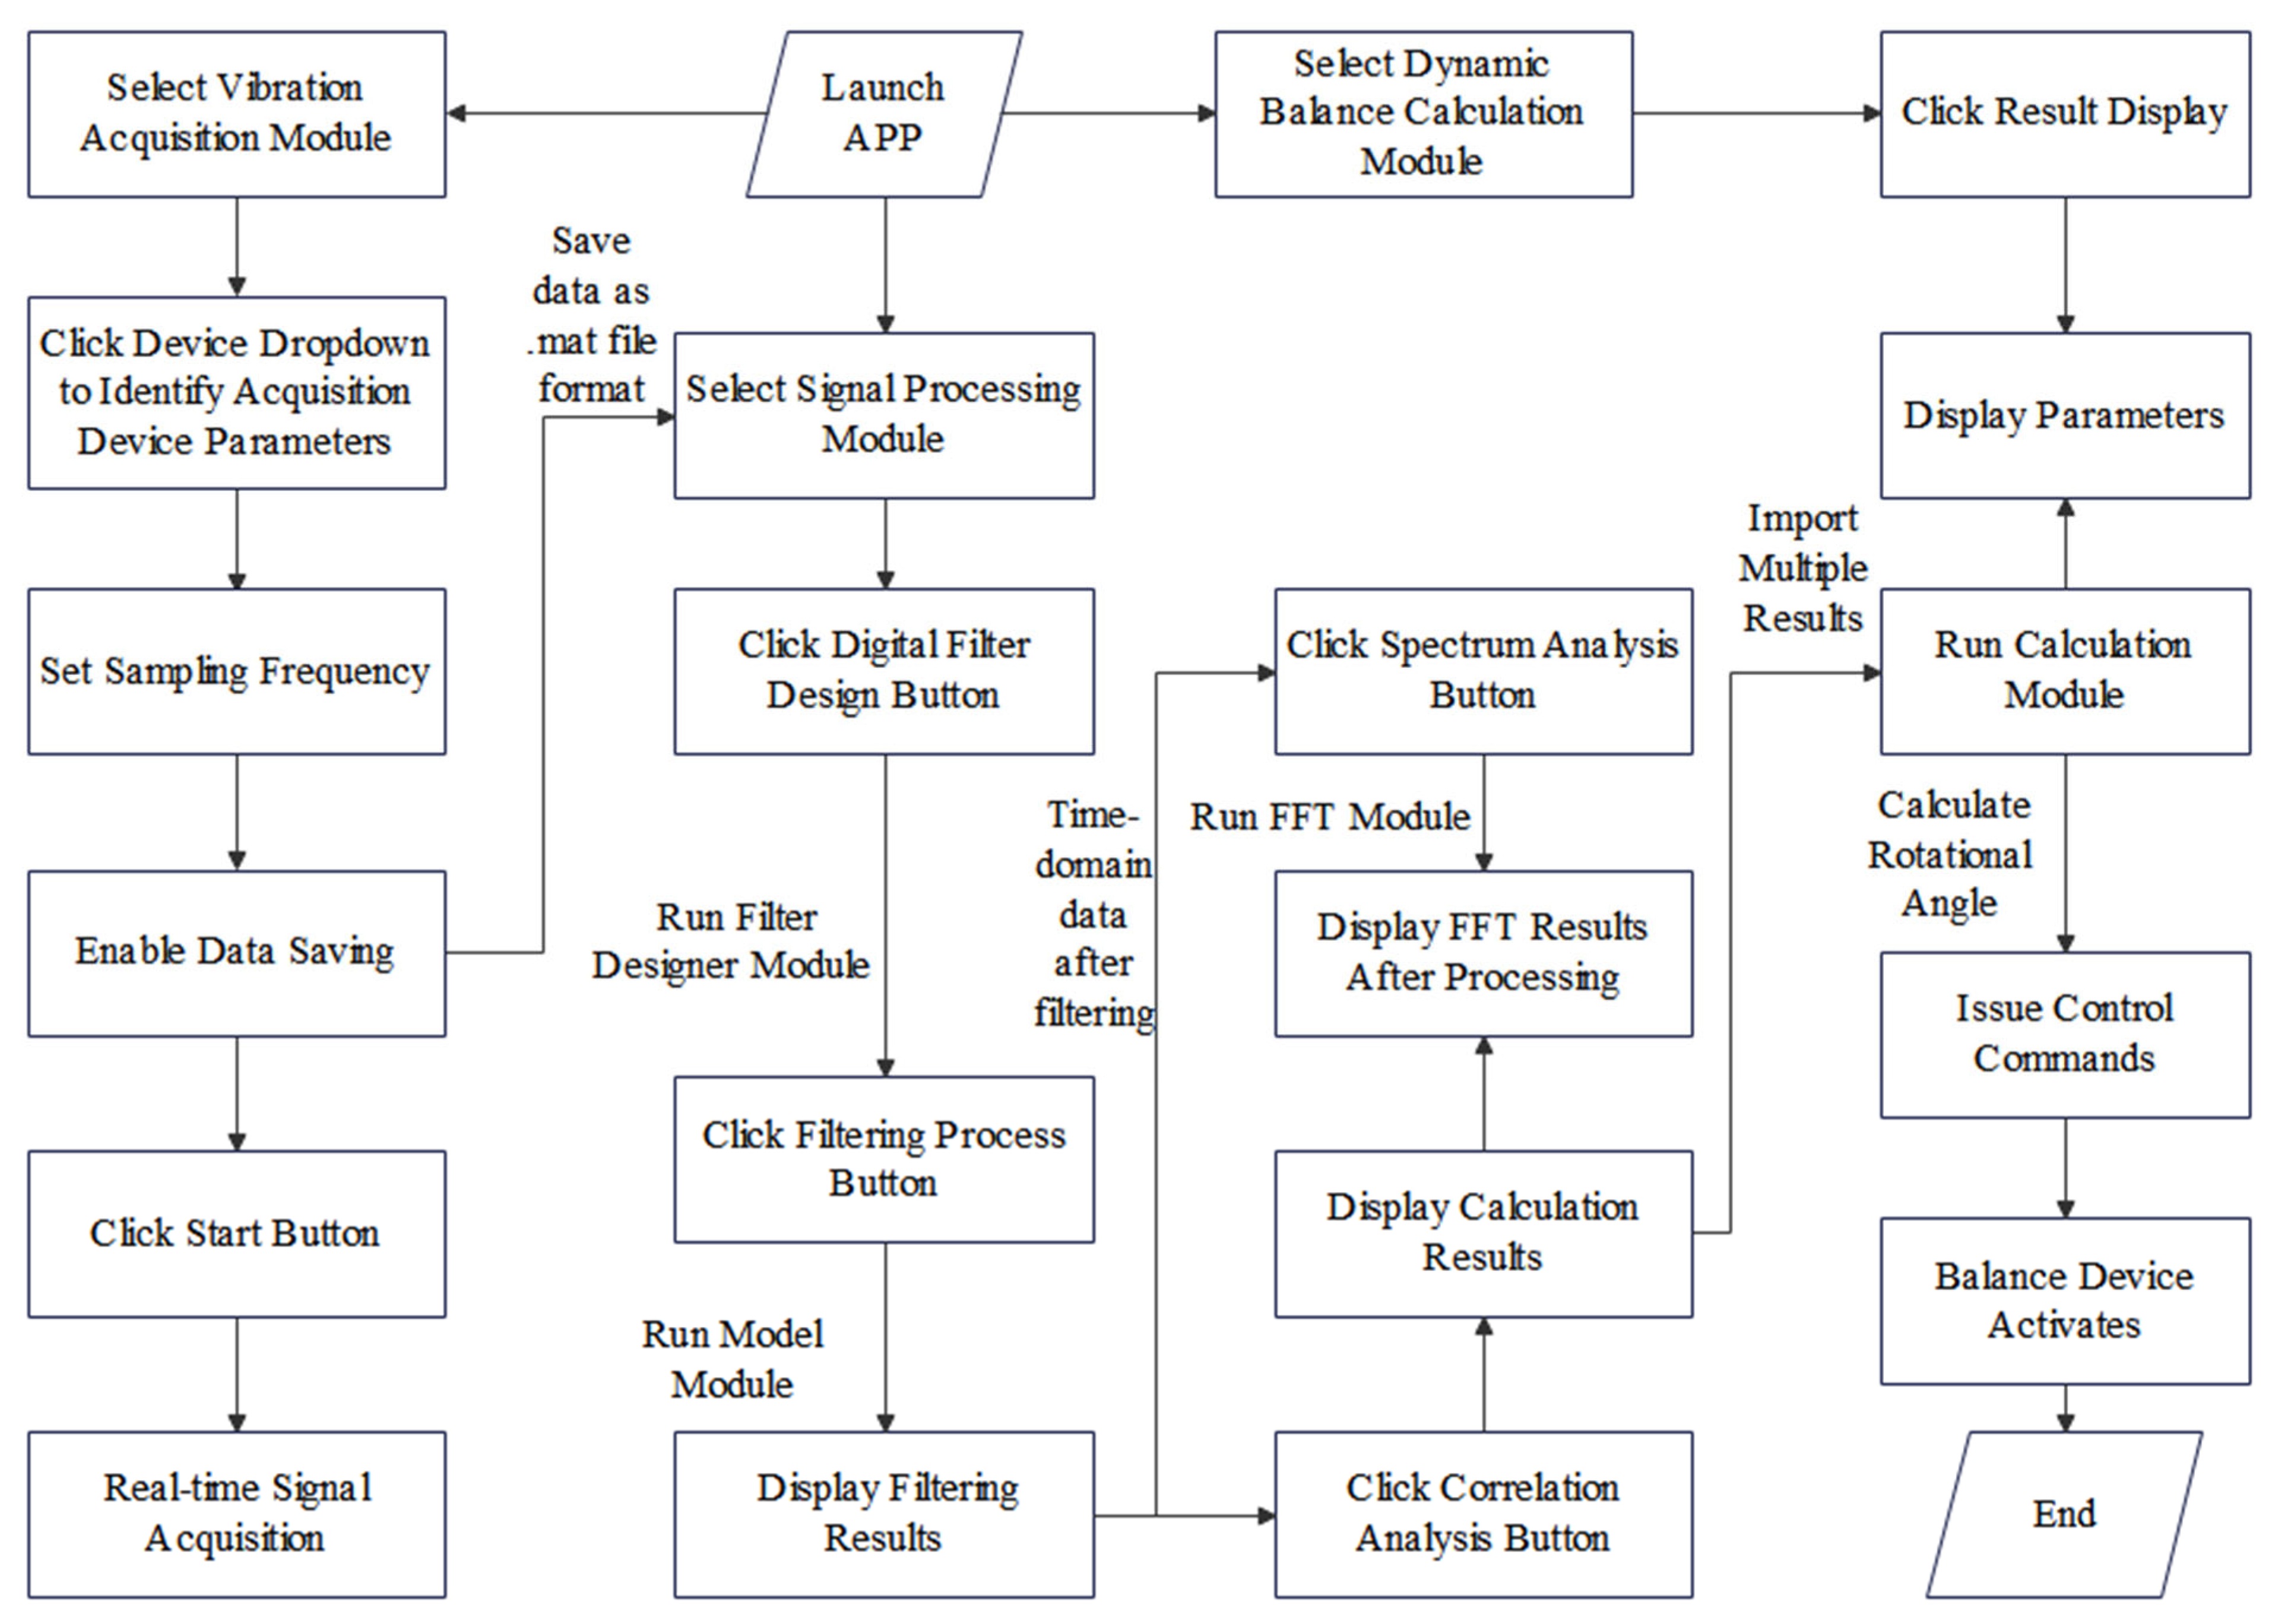
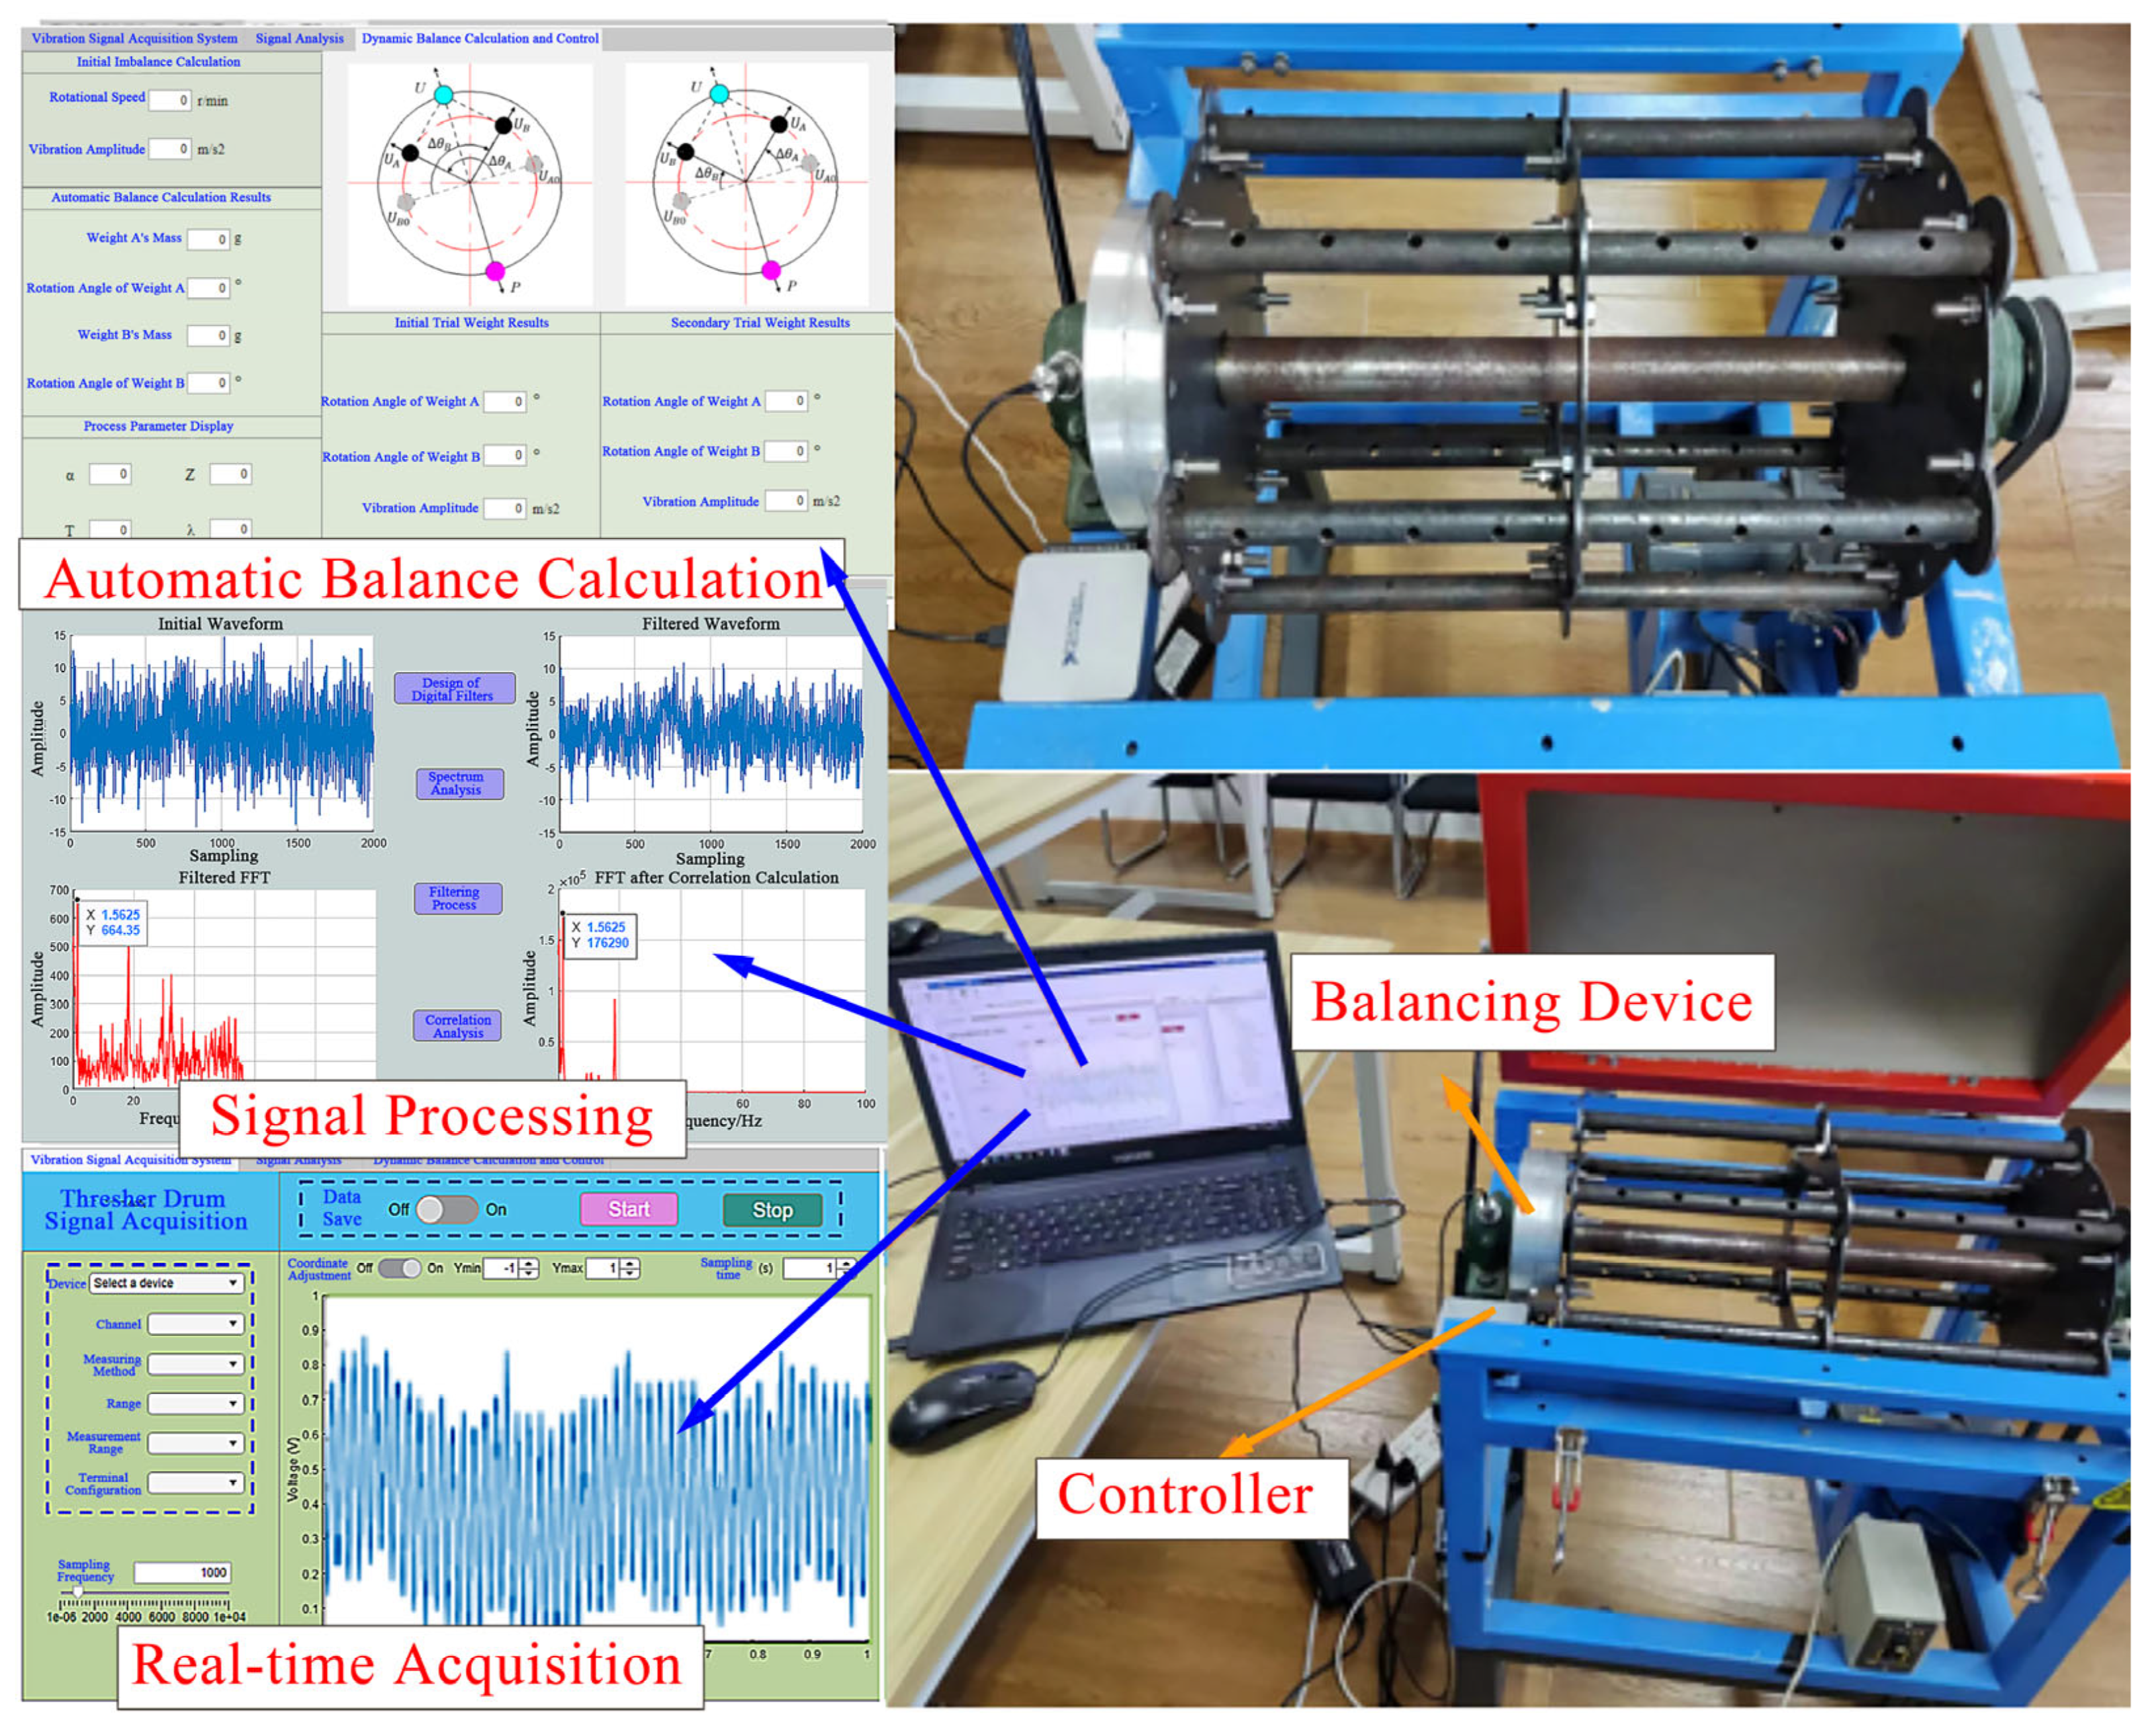
The design of a complete automatic dynamic balancing system for the threshing drum, along with its experimental validation, is systematically detailed. An online dynamic balance testing platform was constructed to facilitate real-time operation and balancing. Central to this platform is a novel automatic balance control method, which features a dual-sided iterative optimization counterweight strategy specifically developed for this application. The seamless integration of vibration testing, signal processing, and automatic balance control functionalities within a user-friendly visual interface enables the continuous online acquisition of unbalanced data and automated balancing. Experimental results demonstrate that the proposed balance control strategy accurately calculates the required rotation angles of the counterweight disks from online vibration measurements, confirming the system’s integrated capability for online testing, signal processing, and balance calculation.
(3)
The online dynamic balance testing and automatic balancing capabilities of the integrated system were validated through direct experimental trials on the threshing drum. Under test conditions of 100 r/min (the 1.5625 Hz operating frequency), the automatic balancing system achieved precise measurement of the unbalanced vibration. Its dynamic balance calculations then accurately determined the required counterweight disk angles for balancing to be 6.938° and −6.414°. These experimental findings provide compelling evidence for the effectiveness and feasibility of the designed system in achieving accurate online testing, sophisticated signal processing, and reliable balance calculations. The results offer valuable theoretical support and significant practical potential for addressing the critical issue of imbalance in combine harvesters—a problem frequently aggravated by material impacts and stem wrapping—ultimately enhancing machinery performance and longevity.

Author Contributions

Conceptualization, Z.T. and X.G.; methodology, Z.T. and X.G.; validation, X.G., B.W. and H.Z. (Honglei Zhang); formal analysis, X.G. and Z.T.; data curation, X.G. and H.Z. (Hao Zhang); investigation, X.G. and Z.T.; writing—original draft preparation, X.G. and B.W.; writing—review and editing, H.Z. (Honglei Zhang) and H.Z. (Hao Zhang); supervision, B.W. All authors have read and agreed to the published version of the manuscript.

Funding

This research work was supported by the National Natural Science Foundation of China (52175235), Natural Science Foundation of Jiangsu Province (BK20221368), Jiangsu Province Postgraduate Research and Innovation Project (KYCX23_3665), Key Laboratory of Modern Agricultural Equipment and Technology (Jiangsu University), and Ministry of Education (MAET202326).

Institutional Review Board Statement

Not applicable.

Data Availability Statement

The data used to support the findings of this study were available from the corresponding author upon request.

Acknowledgments

The authors gratefully acknowledge the editors and reviewers for their constructive comments on our manuscript.

Conflicts of Interest

The authors declare that they have no known competing financial interests or personal relationships that could have appeared to influence the work reported in this paper.

References

  1. Shi, R.; Dai, F.; Zhao, W.; Yang, F.; Zhang, F.; Zhao, Y.; Qu, H.; Wang, T.; Guo, J. Design and experiments of self-propelled quinoa combine harvester. J. Jilin University. Eng. Technol. Ed. 2023, 53, 2686–2694. [Google Scholar]
  2. Li, Y.; Xu, L.; Lv, L.; Shi, Y.; Yu, X. Study on Modeling Method of a Multi-Parameter Control System for Threshing and Cleaning Devices in the Grain Combine Harvester. Agriculture 2022, 12, 1483. [Google Scholar] [CrossRef]
  3. Li, Y.; Xu, L.Z.; Li, Y.M.; Lv, L.Y.; Shi, M.L. Modeling and control methods of a multi-parameter system for threshing and cleaning in grain combine harvesters. Comput. Electron. Agric. 2024, 225, 15. [Google Scholar] [CrossRef]
  4. Fu, J.; Wang, C.; Cai, F.; Niu, W. Comparative Study on Frequency Domain Fatigue Analysis Methods for Half Axle of Combine Harvester. J. Mech. Strength 2022, 44, 203–214. [Google Scholar]
  5. Liu, W.J.; Chen, X.G.; Zeng, S. Design and Parameter Optimization of a Rigid-Flexible Coupled Rod Tooth Threshing Device for Ratoon Rice Based on MBD-DEM. Agriculture 2024, 14, 2083. [Google Scholar] [CrossRef]
  6. Ma, Z.; Wu, Z.P.; Li, Y.F.; Song, Z.Q.; Yu, J.; Li, Y.M.; Xu, L.Z. Study of the grain particle-conveying performance of a bionic non-smooth-structure screw conveyor. Biosyst. Eng. 2024, 238, 94–104. [Google Scholar] [CrossRef]
  7. Xu, L.Z.; Chai, X.Y.; Gao, Z.P.; Li, Y.M.; Wang, Y.D. Experimental study on driver seat vibration characteristics of crawler-type combine harvester. Int. J. Agric. Biol. Eng. 2019, 12, 90–97. [Google Scholar] [CrossRef]
  8. Yu, Z.; Li, Y.; Du, X.; Liu, Y. Threshing cylinder unbalance detection using a signal extraction method based on parameter-adaptive variational mode decomposition. Biosyst. Eng. 2024, 244, 26–41. [Google Scholar] [CrossRef]
  9. Liu, Y.; Li, Y.; Chen, L.; Zhang, T.; Liang, Z.; Huang, M.; Su, Z. Study on Performance of Concentric Threshing Device with Multi-Threshing Gaps for Rice Combines. Agriculture 2021, 11, 1000. [Google Scholar] [CrossRef]
  10. Su, Z.; Li, Y.; Dong, Y.; Tang, Z.; Liang, Z. Simulation of rice threshing performance with concentric and non-concentric threshing gaps. Biosyst. Eng. 2020, 197, 270–284. [Google Scholar] [CrossRef]
  11. Wang, F.; Liu, Y.; Li, Y.; Ji, K. Research and Experiment on Variable-Diameter Threshing Drum with Movable Radial Plates for Combine Harvester. Agriculture 2023, 13, 1487. [Google Scholar] [CrossRef]
  12. Liu, Y.; Li, Y.; Ji, K.; Yu, Z.; Ma, Z.; Xu, L.; Niu, C. Development of a hydraulic variable-diameter threshing drum control system for combine harvester part I: Adaptive monitoring method. Biosyst. Eng. 2025, 250, 174–182. [Google Scholar] [CrossRef]
  13. Shi, R.; Chang, L.; Zhao, W.; Dai, F.; Liang, Z. Simulation of Flax Threshing Process by Different Forms of Threshing Drums in Combined Harvesting. Agronomy 2025, 15, 36. [Google Scholar] [CrossRef]
  14. Wang, Z.P.; Zuo, Y.Y.; Sun, L.M. The Impact of Sound Pressure Level, Loudness, Roughness, Sharpness, Articulation Index, Hand Vibration, and Seat Vibration on Subjective Comfort Perception of Tractor Drivers. Symmetry 2023, 15, 16. [Google Scholar] [CrossRef]
  15. Wang, X.Z.; Cao, Y.H.; Fang, W.Q.; Sheng, H.R. Vibration Test and Analysis of Crawler Pepper Harvester under Multiple Working Conditions. Sustainability 2023, 15, 16. [Google Scholar] [CrossRef]
  16. Wang, L.; Wang, G.Q.; Zhai, X.J.; Tang, Z.; Wang, B.Z.; Li, P.C. Response Characteristics of Harvester Bolts and the Establishment of the Strongest Response Structure’s Kinetic Model. Agriculture 2024, 14, 1174. [Google Scholar] [CrossRef]
  17. Gu, X.Y.; Zhang, B.; Tang, Z.; Zhang, H.; Wang, H.Y. Structural Optimization of Combine Harvester Plate-Shell Undergoing Multi-Source Excitation. Appl. Sci. 2022, 12, 20. [Google Scholar] [CrossRef]
  18. Yu, Z.W.; Li, Y.M.; Xu, L.Z.; Du, X.X.; Ji, K.Z. Unbalanced variation after assembly and double-speed influence coefficient method in the threshing drum. Int. J. Agric. Biol. Eng. 2023, 16, 1–10. [Google Scholar] [CrossRef]
  19. Tang, Z.; Zhang, H.; Wang, X.Z.; Gu, X.Y.; Zhang, B.; Liu, S.F. Rice threshing state prediction of threshing cylinder undergoing unbalanced harmonic response. Comput. Electron. Agric. 2023, 204, 11. [Google Scholar] [CrossRef]
  20. Li, H.B.; Chen, L.W.; Zhang, Z.Y. A Study on the Utilization Rate and Influencing Factors of Small Agricultural Machinery: Evidence from 10 Hilly and Mountainous Provinces in China. Agriculture 2023, 13, 25. [Google Scholar] [CrossRef]
  21. Bian, X.Y.; Shi, Z.G.; Sun, Z.; Shi, L.; Yan, X.S.; Mo, N. Automatic Balancing for AMB-Rotor System Using Adaptive Period Iteration Control with a Novel Rotating Speed Estimator. IEEE Sens. J. 2023, 23, 17173–17186. [Google Scholar] [CrossRef]
  22. Han, W.J.; Cai, Y.W.; Han, W.T.; Yin, Z.Y.; Ren, Y.; Wang, W.J.; Yu, C.M. A Method for Suppressing Mass Imbalance Vibration of Magnetically Suspended Rotor-Based on Multifrequency Adaptive Estimation. IEEE Sens. J. 2022, 22, 23793–23805. [Google Scholar] [CrossRef]
  23. Pang, J.; Li, Y.; Ji, J.; Xu, L. Vibration excitation identification and control of the cutter of a combine harvester using triaxial accelerometers and partial coherence sorting. Biosyst. Eng. 2019, 185, 25–34. [Google Scholar] [CrossRef]
  24. Faheem, M.; Liu, J.; Chang, G.; Abbas, I.; Xie, B.; Shan, Z.; Yang, K. Experimental Research on Grape Cluster Vibration Signals during Transportation and Placing for Harvest and Post-Harvest Handling. Agriculture 2021, 11, 902. [Google Scholar] [CrossRef]
  25. Cole, M.O.T.; Keogh, P.S.; Burrows, C.R. Control of multifrequency rotor vibration components. Proc. Inst. Mech. Eng. Part C-J. Mech. Eng. Sci. 2002, 216, 165–177. [Google Scholar] [CrossRef]
  26. Dai, D.; Chen, D.; Wang, S.; Li, S.; Mao, X.; Zhang, B.; Wang, Z.; Ma, Z. Compilation and Extrapolation of Load Spectrum of Tractor Ground Vibration Load Based on CEEMDAN-POT Model. Agriculture 2023, 13, 125. [Google Scholar] [CrossRef]
  27. Patil, S.S.; Gaikwad, J.A. Vibration Analysis of Electrical Rotating Machines using FFT A method of predictive maintenance. In Proceedings of the 4th International Conference on Computing, Communications and Networking Technologies (ICCCNT), Tiruchengode, India, 4–6 July 2013. [Google Scholar]
  28. Gao, Y.; Yang, Y.; Fu, S.; Feng, K.; Han, X.; Hu, Y.; Zhu, Q.; Wei, X. Analysis of Vibration Characteristics of Tractor–Rotary Cultivator Combination Based on Time Domain and Frequency Domain. Agriculture 2024, 14, 1139. [Google Scholar] [CrossRef]
  29. Klausen, A.; Robbersmyr, K.G. Cross-correlation of whitened vibration signals for low-speed bearing diagnostics. Mech. Syst. Signal Process. 2019, 118, 226–244. [Google Scholar] [CrossRef]
  30. Gan, M.; Wang, C.; Zhu, C.A. Fault feature enhancement for rotating machinery based on quality factor analysis and manifold learning. J. Intell. Manuf. 2018, 29, 463–480. [Google Scholar] [CrossRef]
  31. Stander, C.J.; Heyns, P.S. Transmission path phase compensation for gear monitoring under fluctuating load conditions. Mech. Syst. Signal Process. 2006, 20, 1511–1522. [Google Scholar] [CrossRef]
  32. Ma, Z.; Zhang, Z.; Zhang, Z.; Song, Z.; Liu, Y.; Li, Y.; Xu, L. Durable Testing and Analysis of a Cleaning Sieve Based on Vibration and Strain Signals. Agriculture 2023, 13, 2232. [Google Scholar] [CrossRef]
  33. Xin, Y.; Li, S.M.; Zhang, Z.Z. Adaptive Reinforced Empirical Morlet Wavelet Transform and Its Application in Fault Diagnosis of Rotating Machinery. IEEE Access 2019, 7, 65150–65162. [Google Scholar] [CrossRef]
  34. Qin, Q.; Zhu, F.; Yang, F.; Yin, L. Fault Feature Extraction of Rolling Bearings Based on Full Vector Improved Continuous Harmonic Wavelet Packet. Mech. Sci. Technol. Aerosp. Eng. 2023, 42, 2040–2046. [Google Scholar]
  35. Carassale, L. Analysis of the Synchronous Response of Rotor Components by Wavelet Transform and Wavelet Probing. J. Eng. Gas Turbines Power 2024, 146, 041017. [Google Scholar] [CrossRef]
  36. Gao, Y.; Hu, Y.; Yang, Y.; Feng, K.; Han, X.; Li, P.; Zhu, Y.; Song, Q. Optimization of Operating Parameters for Straw Returning Machine Based on Vibration Characteristic Analysis. Agronomy 2024, 14, 2388. [Google Scholar] [CrossRef]
  37. Khatua, P.; Ray, K.C. An Efficient DCT-II Based Harmonic Wavelet Transform for Time-Frequency Analysis. J. Signal Process. Syst. Signal Image Video Technol. 2022, 94, 1381–1394. [Google Scholar] [CrossRef]
  38. Ji, K.; Li, Y.; Liu, Y.; Yu, Z.; Cheng, J. Vibration Signal Extraction and Analysis of Combine Harvester Based on Low-Pass Filter-Eemd Combination. Eng. Agric. 2025, 44, e20240006. [Google Scholar] [CrossRef]
  39. Hang, X.C.; Lu, Z.R.; Yao, Q.W.; Jiang, D. A novel unbalanced signal extraction method based on quadratic SSA-VMD for micro-motor rotor. J. Mech. Sci. Technol. 2024, 38, 3327–3338. [Google Scholar] [CrossRef]
  40. Keji, Y. Application of an Adaptive Filtering Method Based on Harmonic Wavelet for High Precision Dynamic Balancing Measurement. Chin. J. Sci. Instrum. 2005, 26, 1013–1015. [Google Scholar]
  41. Danthez, J.M.; Giroussens, C.; Aquilina, R. The Autocoherent Spectrum: A Useful Spectral Estimator For Vibration Analysis Of Rotating Machinery Accurate Estimation and Cancellation of Pure Tones. Mech. Syst. Signal Process. 1998, 12, 753–768. [Google Scholar] [CrossRef]
  42. Zeng, S.; Wang, X.X. Unbalance Identification and Field Balancing of Dual Rotors System with Slightly Different Rotating Speeds. J. Sound Vib. 1999, 220, 343–351. [Google Scholar] [CrossRef]
  43. Zhang, S.H.; Cai, Y.J. A new double-face online dynamic balance device and its control system for high speed machine tool spindle. J. Vib. Control 2016, 22, 1037–1048. [Google Scholar] [CrossRef]
  44. Srivastava, S.; Sahu, S.N.; Sekar, A.; Sundaram, N.S.; Kumar, S.S.; Hariharan, V.K. Low frequency high sensitive velocity pickup transducer for vertical dynamic balancing machine (VDBM). Ferroelectrics 2017, 519, 194–199. [Google Scholar] [CrossRef]
  45. Wang, T.Z.; Ding, Q. Modal balancing for ball bearing-rotor system using nonlinear normal modes. J. Sound Vib. 2023, 547, 20. [Google Scholar] [CrossRef]
  46. Li, Y.; Cui, Y.C.; Deng, S.R. Research on Sudden Unbalance Response of Rigid-Elastic-Oil Coupled Ball Bearings. Lubricants 2024, 12, 22. [Google Scholar] [CrossRef]
  47. Wu, D.H.; Wu, X. Research on the Influence of Noise to Weak Signal Detection Based on Duffing Equation. In Proceedings of the International Conference on Mechatronic Systems and Automation Systems (MSAS 2011), Xi’an, China, 23–24 July 2011. [Google Scholar]
  48. Pancóatl-Bortolotti, P.; Costa, A.H.; Enríquez-Caldera, R.A.; Guerrero-Castellanos, J.F.; Tello-Bello, M. Time-frequency high-resolution for weak signal detection using chaotic intermittence. Digit. Signal Process. 2023, 141, 11. [Google Scholar] [CrossRef]
  49. Su, L.; Yang, J. Weak Pulse Signal Detection Based on the Broad Learning Method under the Chaotic Background. J. Commun. Technol. Electron. 2022, 67, 430–442. [Google Scholar] [CrossRef]
  50. Wang, X.; Hong, T.; Fang, W.; Chen, X. Optimized Design for Vibration Reduction in a Residual Film Recovery Machine Frame Based on Modal Analysis. Agriculture 2024, 14, 543. [Google Scholar] [CrossRef]
  51. Jian, Y.; Qing, Y.; Jia, W. A New Vibration Phase Solution Method and Its Application in Dynamic Balance Analysis. Noise Vib. Control 2022, 42, 241–246. [Google Scholar]
Figure 1. USB6002 DAQ device and pin annotations.
Agriculture 15 01564 g001
Figure 2. Sensor selection. (a) Accelerometer cable. (b) Magnetic base. (c) Speed sensor.
Agriculture 15 01564 g002
Figure 3. Amplitude response of a low-pass filter.
Agriculture 15 01564 g003
Figure 4. Functional block diagram of the kth-order low-pass filter.
Agriculture 15 01564 g004
Figure 5. MATLAB filter design module.
Agriculture 15 01564 g005
Figure 6. Filter type selection.
Agriculture 15 01564 g006
Figure 7. Parameter setting.
Agriculture 15 01564 g007
Figure 8. Filter response curve.
Agriculture 15 01564 g008
Figure 9. Filter export.
Agriculture 15 01564 g009
Figure 10. Simulink model of the filter.
Agriculture 15 01564 g010
Figure 11. Schematic diagram of the correlation analysis principle.
Agriculture 15 01564 g011
Figure 12. Signal generation.
Agriculture 15 01564 g012
Figure 13. Low-pass filtering.
Agriculture 15 01564 g013
Figure 14. FFT solution.
Agriculture 15 01564 g014
Figure 15. Optimization counterweight strategy flowchart.
Agriculture 15 01564 g015
Figure 16. Simulink model of the automatic balancing calculation process.
Agriculture 15 01564 g016
Figure 17. Calculation of influence coefficient α.
Agriculture 15 01564 g017
Figure 18. Calculation process of Z value.
Agriculture 15 01564 g018
Figure 19. Balancing rotation angle calculation module.
Agriculture 15 01564 g019
Figure 20. Signal acquisition interface.
Agriculture 15 01564 g020
Figure 21. Signal analysis interface.
Agriculture 15 01564 g021
Figure 22. Dynamic balancing calculation interface.
Agriculture 15 01564 g022
Figure 23. Simulated waveform and FFT diagram.
Agriculture 15 01564 g023
Figure 24. Filtered waveform and FFT diagram.
Agriculture 15 01564 g024
Figure 25. Results after correlation calculations.
Agriculture 15 01564 g025
Figure 26. Workflow of the front-end APP for the automatic balancing system.
Agriculture 15 01564 g026
Figure 27. Automatic balancing test system for threshing drum.
Agriculture 15 01564 g027
Figure 28. Selection of acquisition device.
Agriculture 15 01564 g028
Figure 29. Operation of acquisition system.
Agriculture 15 01564 g029
Figure 30. Signal processing results.
Agriculture 15 01564 g030
Figure 31. Automatic balancing calculation results.
Agriculture 15 01564 g031
Table 1. Technical specifications of the data acquisition card.
ParameterValueParameterValue
ModelUSB-6002Maximum transfer speed480 Mb/s
Resolution24-bitVoltage input channel4-channel
Data bus interfaceUSBIEPE input channel4-channel
Maximum sampling rate128 KInput range±10 V
Table 2. Technical specifications of vibration sensors.
NumberParameterValue
1ModelMPS-ACC01X ICP
2Voltage sensitivity (mV/g)1008
3Transverse sensitivity (%)≤3
4Frequency range (Hz)0.1~8000
5Acceleration range (g)±5
6Amplitude nonlinearity (%)1
Table 3. Results of the targeted self-healing test.
Counterweight disc IParametersValueCounterweight disc IIParametersValue
Mass/g448.5Mass/g448.5
Angle/°6.938Angle/°−6.411
Initial Test WeightParametersValueSecondary Test WeightParametersValue
The rotation angle of counterweight disc I/°60The rotation angle of counterweight disc I/°−60
The rotation angle of counterweight disc II/°60The rotation angle of counterweight disc II/°120
Vibration amplitude/m/s255.41Vibration amplitude/m/s220
Process parametersαZTλ
5.406745.83−1.237
Disclaimer/Publisher’s Note: The statements, opinions and data contained in all publications are solely those of the individual author(s) and contributor(s) and not of MDPI and/or the editor(s). MDPI and/or the editor(s) disclaim responsibility for any injury to people or property resulting from any ideas, methods, instructions or products referred to in the content.

