Article

Optimizing the Design of Soil-Mixing Blade Structure Parameters Based on the Discrete Element Method

College of Agricultural Equipment Engineering, Henan University of Science and Technology, Luoyang 471003, China
*
Author to whom correspondence should be addressed.
Agriculture 2025, 15(14), 1558; https://doi.org/10.3390/agriculture15141558
Submission received: 26 June 2025 / Revised: 15 July 2025 / Accepted: 18 July 2025 / Published: 21 July 2025
(This article belongs to the Section Agricultural Technology)

Abstract

A multi-parameter optimization-based design method for soil-mixing blades was proposed to address the issue of excessive straw residue in the seeding layer after maize straw incorporation. A discrete element model simulating the interaction between the soil-mixing blades, soil, and corn straw was established. The key structural parameters included the bending line angle (α), bending angle (β), side angle (δ), tangential edge height (h), and bending radius (r); the straw burial rate (Y1) and straw percentage in the seeding layer (Y2) were selected as evaluation indicators. Single-factor experiments determined the significance level (p < 0.05) and the parameter range. A Box–Behnken response surface design, combined with analysis of variance (ANOVA), was employed to elucidate the influence patterns of the structural parameters and their interactions regarding straw burial performance. Multi-objective optimization yielded an optimal parameter combination: α = 55°, β = 100.01°, δ = 130°, h = 40.05 mm, and r = 28.67 mm. The simulation results demonstrated that this configuration achieved a Y1 of 96.04% and reduced Y2 to 35.25%. Field validation tests recorded Y1 and Y2 values of 96.54% and 34.13%, respectively. This study quantitatively elucidated the relationship between soil-mixing blade parameters and straw spatial distribution, providing a theoretical foundation for optimizing straw incorporation equipment.

1. Introduction

Corn straw return is a key technical measure for sustainable agricultural development. Through the return of organic matter, it can improve soil structure, increase soil fertility, increase crop yield, and reduce environmental pollution [1,2,3,4]. Previous studies have demonstrated that, after corn straw is returned to the field, if the straw percentage in the seeding layer is too high (generally > 40%), it increases the void rate of the seedbed, affects seed germination and root growth, and reduces the germination rate of the next crop [5,6].
In recent years, researchers have conducted systematic investigations into the spatial distribution characteristics of crop residues following straw incorporation. Liu et al. [7] conducted soil bin experiments to investigate the effects of tillage speed and straw length on straw incorporation efficiency. They established a soil–straw displacement prediction model by optimizing tillage speed and straw length parameter combinations. Akbolt et al. [8] examined the distribution characteristics of chopped wheat straw under different rotary speed ratios. Their results demonstrated a significant correlation between straw length and incorporation depth: longer straw segments predominantly accumulated in the 0–50 mm seeding layer, while shorter segments were more effectively buried in the 50–150 mm subsoil layer. Yang et al. [9] developed an adjustable straw incorporation machine that adopts the dynamic principle of “low-speed near-throw straw-high-speed far-throw soil” through the synergistic effect of eccentric telescopic finger rod groups and rotary blades, achieving the ideal distribution effect of “straw down, soil covered” in the sowing layer. Wang et al. [10] designed an equal-slip-angle logarithmic-curve burying-finger mechanism based on the slip cutting theory, which forms a secondary pressing and dispersing operation system with the rotary blade, reducing the proportion of straw mass in the sowing layer. Liang et al. [11] developed an opposing double-helix straw burying and covering device that minimizes the straw percentage in the seeding layer by 2.36% through multi-parameter optimization. These studies have provided important theoretical foundations for improving straw incorporation quality. However, the existing research still exhibits deficiencies in elucidating the influence mechanisms of tool structural parameters on straw percentage in the seeding layer.
Research indicates that conventional rotary blades exhibit significant limitations in achieving soil fragmentation and straw burial: during high-speed rotational operation, straw back-throwing occurs, leading to repeated straw accumulation in the seedbed zone, severely compromising seed placement quality and crop germination rates. To address this issue, this study designed a novel soil-mixing blade aimed at optimizing the spatial distribution of crushed corn straw within the soil. While retaining the fundamental tillage functions of rotary blades, this tool effectively suppresses straw back-throwing through an improved structural design.
The discrete element method (DEM) offers unique advantages in simulating the contact and deformation of granular materials and has been widely applied in numerical simulation studies of agricultural machinery operations. This method provides high computational efficiency and ensures good simulation reliability when simulating the interaction between soil, contact components, and straw interaction [12,13]. This study established an interaction model between the soil-mixing blade, soil, and corn straw based on the DEM, enabling the visualization of soil fragmentation and straw movement dynamics during the mixing blade operation.
Through the systematic analysis of key operational parameters, including the motion trajectory of the soil-mixing blade, the conditions for reducing straw percentage in the seeding layer, and the mechanisms for suppressing straw back-throwing, this study established a mathematical model of the blade’s working process and identified the critical structural parameters affecting operational performance. Single-factor experiments determined reasonable parameter ranges, while the Box–Behnken design was employed to construct response surface models correlating structural parameters with operational performance. Multi-objective optimization was then conducted to derive the optimal parameter combination. Furthermore, a comparative analysis of velocity field distributions and vertical displacement characteristics of straw movement between the soil-mixing blade and rotary blade elucidated the dynamic mechanisms by which the soil-mixing blade suppresses straw back-throwing and enhances deep burial. The findings provide theoretical and technical support for developing straw incorporation machinery.

2. Materials and Methods

2.1. Design of the Soil-Mixing Blade

The soil-mixing blade is a new type of tillage tool that was optimized based on a rotary blade. High-speed rotation generated shearing, impacting, and throwing effects on the soil–corn straw mixture, achieving both soil fragmentation and deep straw incorporation. Surface straw is effectively buried below the sowing layer at a 160 mm tillage depth, creating a favorable seedbed environment for subsequent crops. The overall working diagram of the soil-mixing blade is shown in Figure 1a, and its operational schematic is illustrated in Figure 1b.

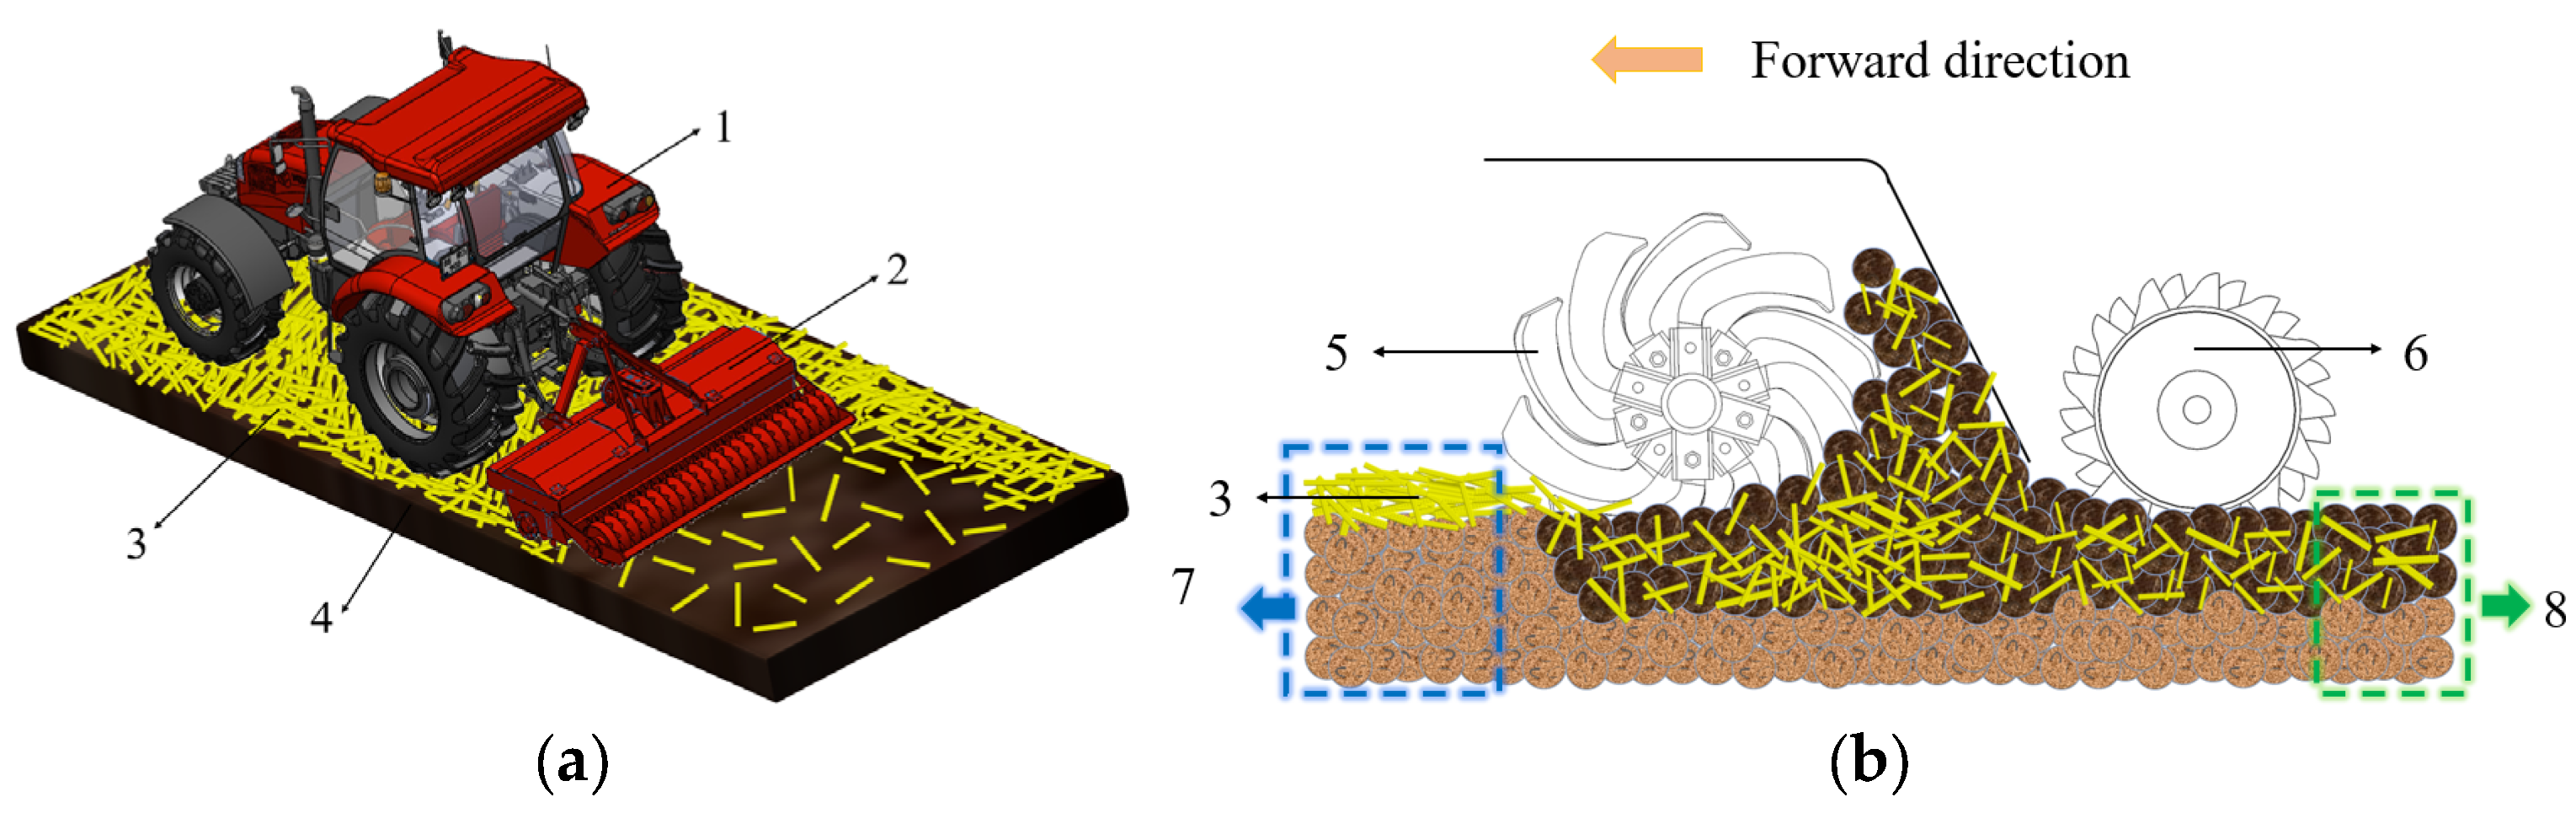
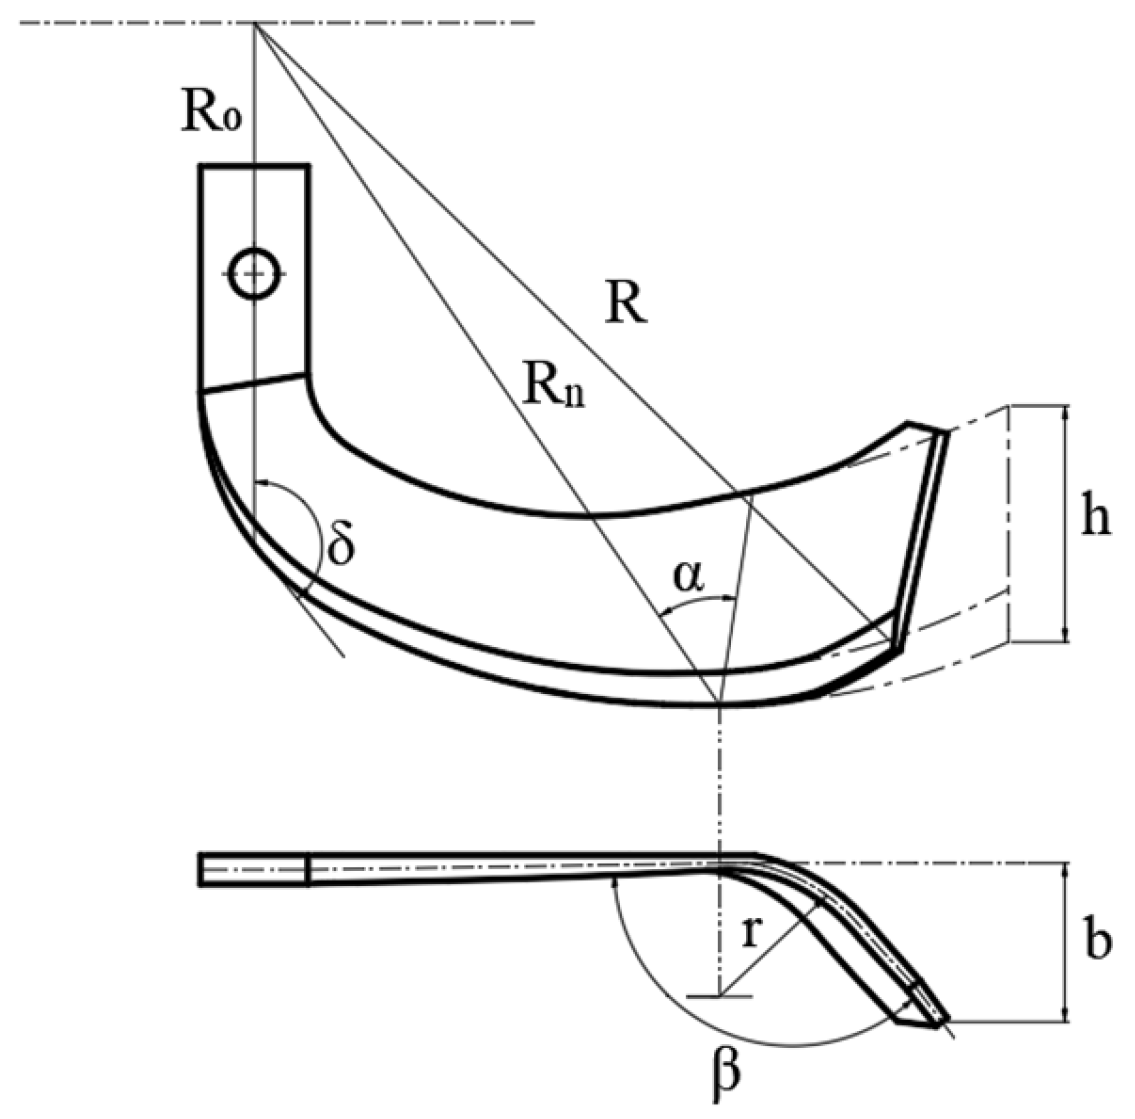
2.1.1. Soil-Mixing Blade Structure

Although rotary blades can achieve soil fragmentation and straw incorporation through high-speed rotation, a significant straw back-throwing phenomenon occurs during their operation, leading to repeated straw accumulation in the seedbed area. This adversely affects seed placement quality and reduces crop germination rates. To address the straw back-throwing issue, a novel mixing blade was designed. While retaining the basic tillage functions of rotary blades, this blade focuses on improving the following three operational performance aspects: (1) increasing the tillage depth; (2) reducing the straw percentage in the seeding layer and optimizing the spatial distribution of straw within the tillage layer; and (3) minimizing straw back-throwing and enhancing straw burial effectiveness.
The soil-mixing blade structure is shown in Figure 2; it primarily consists of three parts: the tangential surface, the transition surface, and the side-cutting surface. The side-cutting edge adopted an Archimedean spiral. In this design, the curve slide-cutting angle gradually increases with the rotation radius. Compared with the sine-exponential spiral curve and the logarithmic spiral, the Archimedean spiral provides the maximum average slide-cutting angle, lifts more soil particles, increases tillage depth, reduces friction resistance, and prevents the blade from getting tangled in grass. Additionally, the tangential edge and transition edge adopt a circular arc curve design, and the constant curvature characteristics are beneficial to maintaining a stable cutting angle.
The basic geometric parameters of the soil-mixing blade include the bending angle β, side angle δ, bending line angle α, tangential edge height h, bending radius r, rotation radius R, working width b, initial radius of the side-cutting edge R0, and terminal radius Rn. For straw return operations, the influence mechanism of the following key structural parameters on the performance of the soil-mixing blade is focused on the following:
(1)
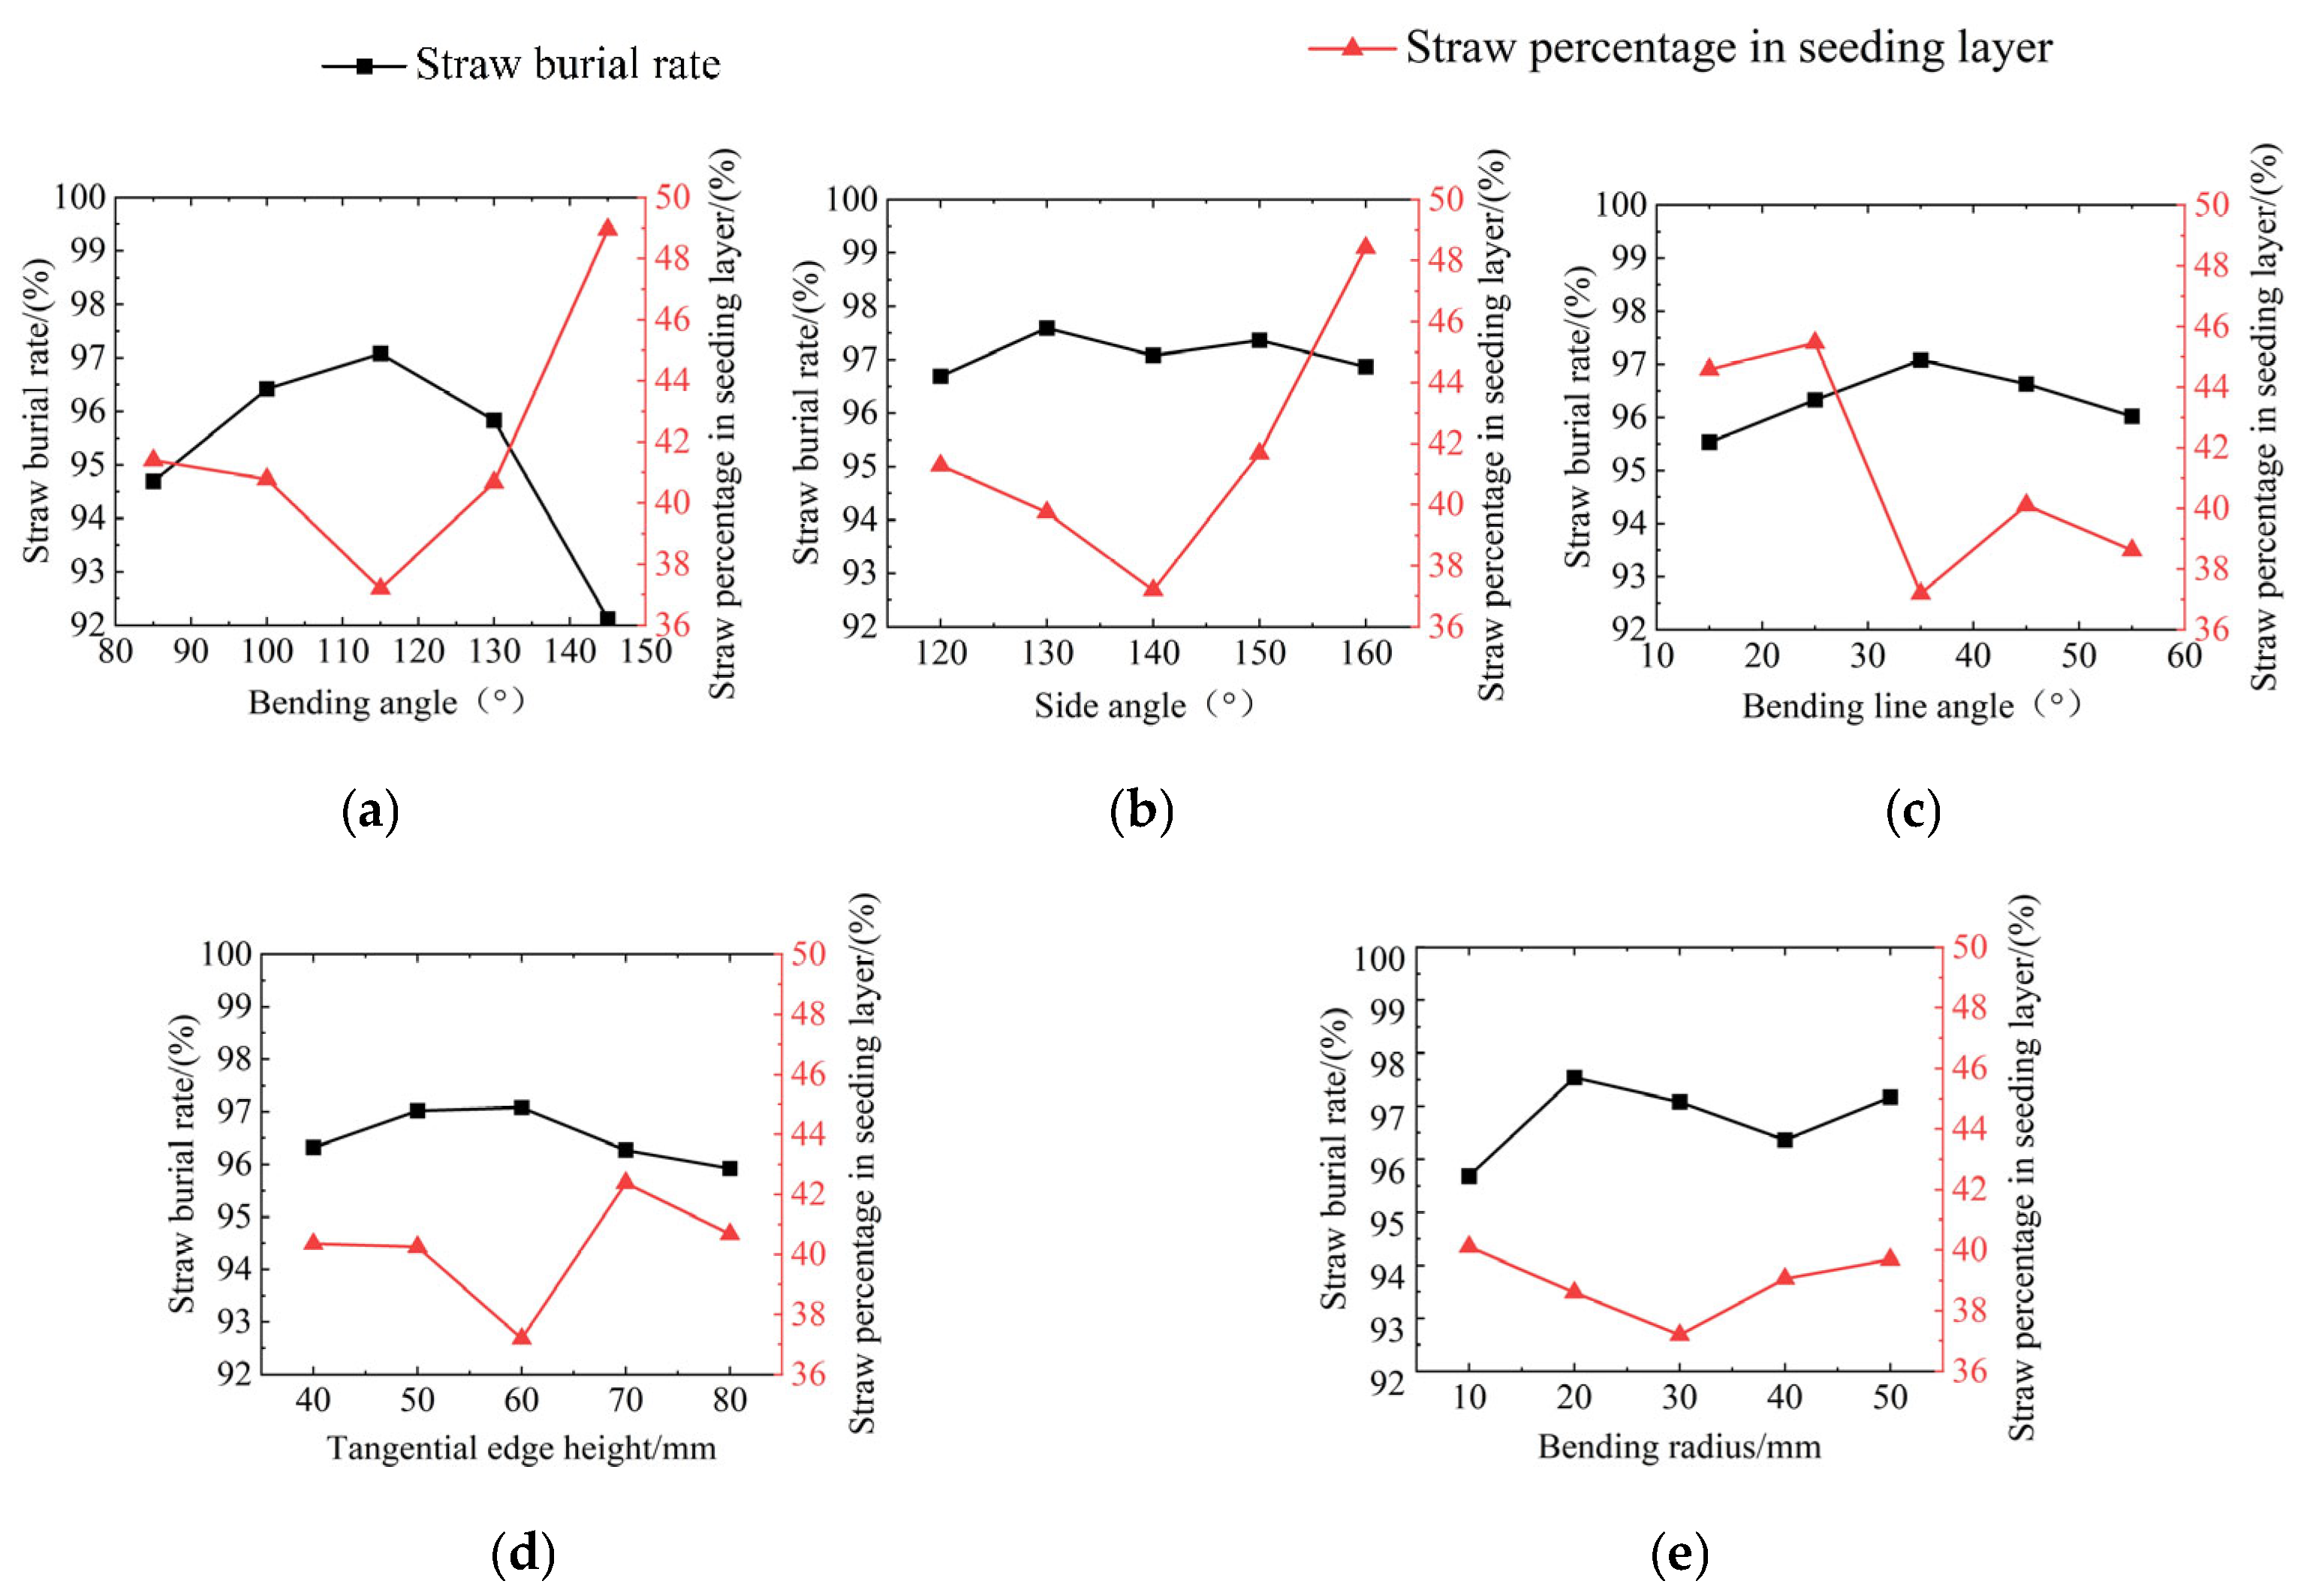
The bending angle β, defined as the spatial angle between the tangential plane and the side-cutting plane of the soil-mixing blade, critically influences operational performance. Excessive values for β cause the blade tip to engage soil or root residues first, increasing mechanical stress and reducing service life. However, for insufficient β values, the bent section initially interacts with soil and corn stalks before they slide toward the side-cutting edge. This promotes clogging, elevates cutting resistance, and reduces straw incorporation efficiency [14,15].
(2)
The side angle δ is the angle between the side-cutting surface and the central line of the handle and affects the pressure exerted by the soil-mixing blade on the corn straw. When δ decreases appropriately, the pressure increases, promoting the rapid sliding of corn straw to the end of the side-cutting edge, which can reduce the carryback of straw.
(3)
The bending line angle α affects the relative acceleration between soil particles and the blade surface. A smaller α angle can enhance the soil acceleration effect but will increase the soil penetration resistance [16].
(4)
If the tangential edge height h is too small, the quality of soil throwing and crushing is poor. However, when it is too large, the cultivation resistance will increase and the bending part will be more prone to breakage [17].
(5)
A bending radius r that is too small will reduce the strength at the bending point of the soil-mixing blade, making it prone to sticking in soil and shortening its service life. However, a bending radius that is too large will increase the unevenness of the soil at the bottom of the trench [18].

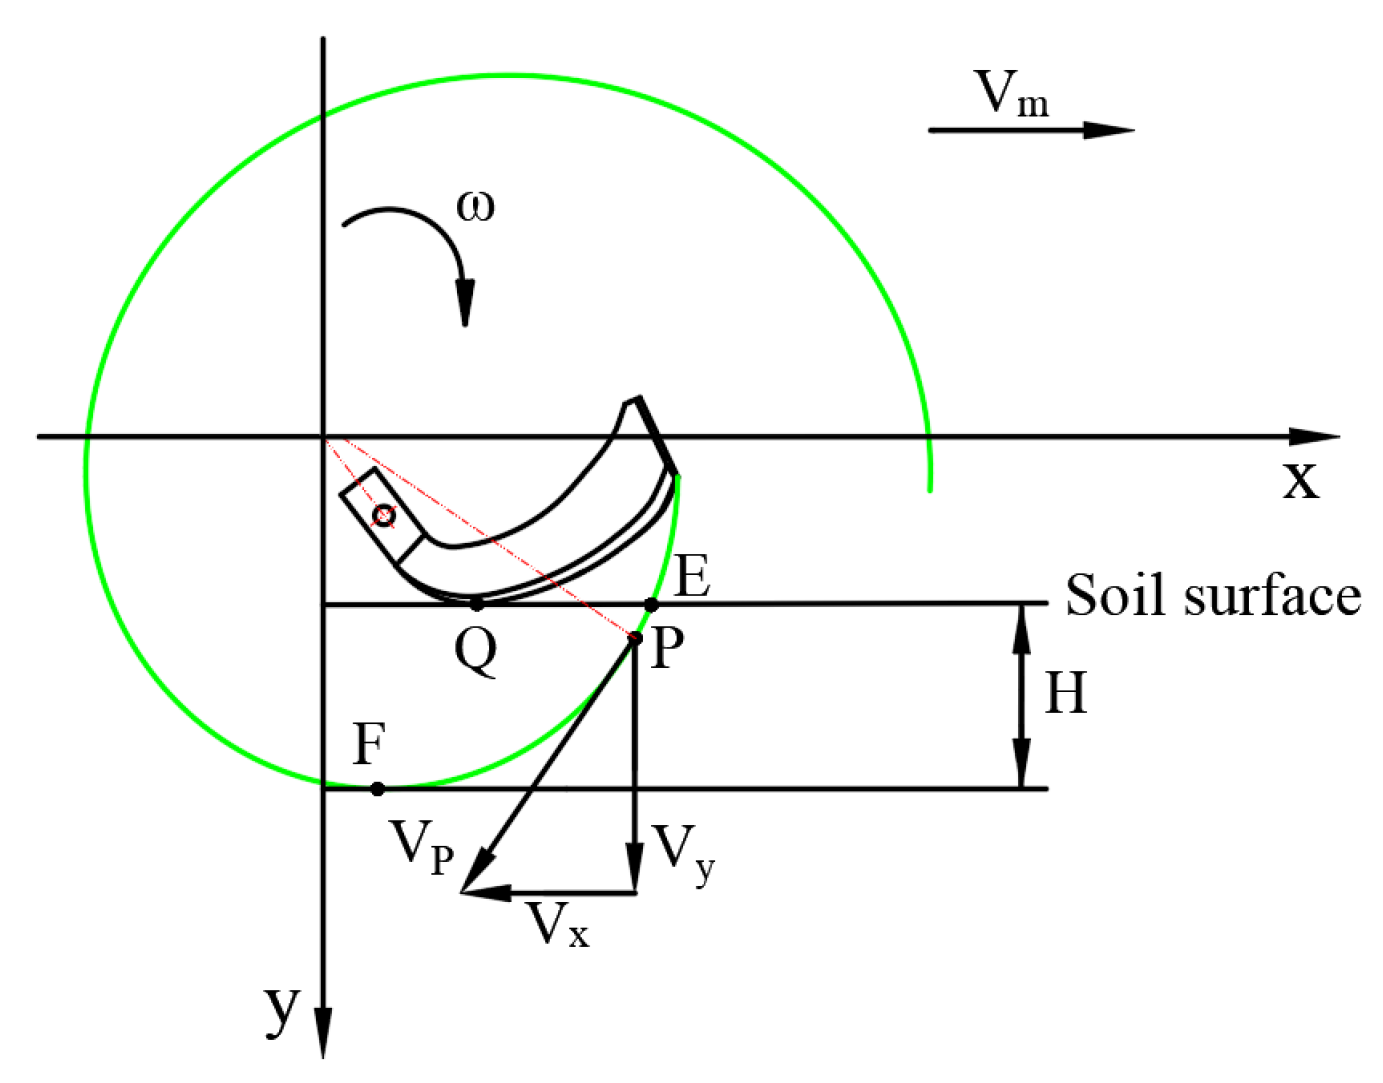
2.1.2. Motion Theory Analysis

During the operation of the machine, the blade rotates around its axis at a high speed and a constant angular velocity ω to cut and break the soil; simultaneously, it moves forward along the operation direction with the soil-mixing machine. Under the combined effect of rotation and forward movement, the soil is continuously processed for tasks such as soil fragmentation and burial. The absolute motion trajectory of the soil-mixing blade is a mathematical trochoid synthesized by rotational and linear motion. Figure 3 shows the absolute motion trajectory of the soil-mixing blade endpoint. Let P be an arbitrary point above, so the motion Equation of point P is
x = R cos ( ω t ) + V m t y = R sin ( ω t )
where R is the soil-mixing blade endpoint rotation radius (m), ω is the blade shaft rotation speed (rad/s), Vm is the machine tool forward speed (m/s), and t is the operation time(s).
By differentiating the above equation, we obtain P’s horizontal and vertical components of velocities Vx and Vy:
V x = d x d t = V m R ω sin ( ω t ) V y = d y d t = R ω cos ( ω t )
At this point, the absolute velocity Vq of point P is
V q = V x 2 + V y 2 = V m 2 + R 2 ω 2 2 V m R ω sin ( ω t )
The ratio of the tangential speed at the soil-mixing blade’s endpoint to the forward speed of the implement is defined as the rotary tillage speed ratio λ, expressed by Equation (4):
λ = ω R V m
Using the forward rotation operation method, the soil-mixing blade first rototills the uncultivated area soil using rotary tillage and then throws the soil backward to bury the corn straw. Taking the machine’s forward direction as positive, the velocity Vx of the horizontal component of the soil-mixing blade tip’s cutting edge is greater than zero, i.e., Vx > 0 in the initial stage, and only when the soil-mixing blade rotates to a specific angle, Vx < 0, can the soil be thrown backward. As shown in Figure 3, the analysis indicates that λ > 1 can meet the operation conditions of the soil-mixing blade. Substituting Equation (4) into Equation (2) gives
V x = V m R ω sin ( ω t ) = V m ( 1 λ sin ( ω t ) ) < 0

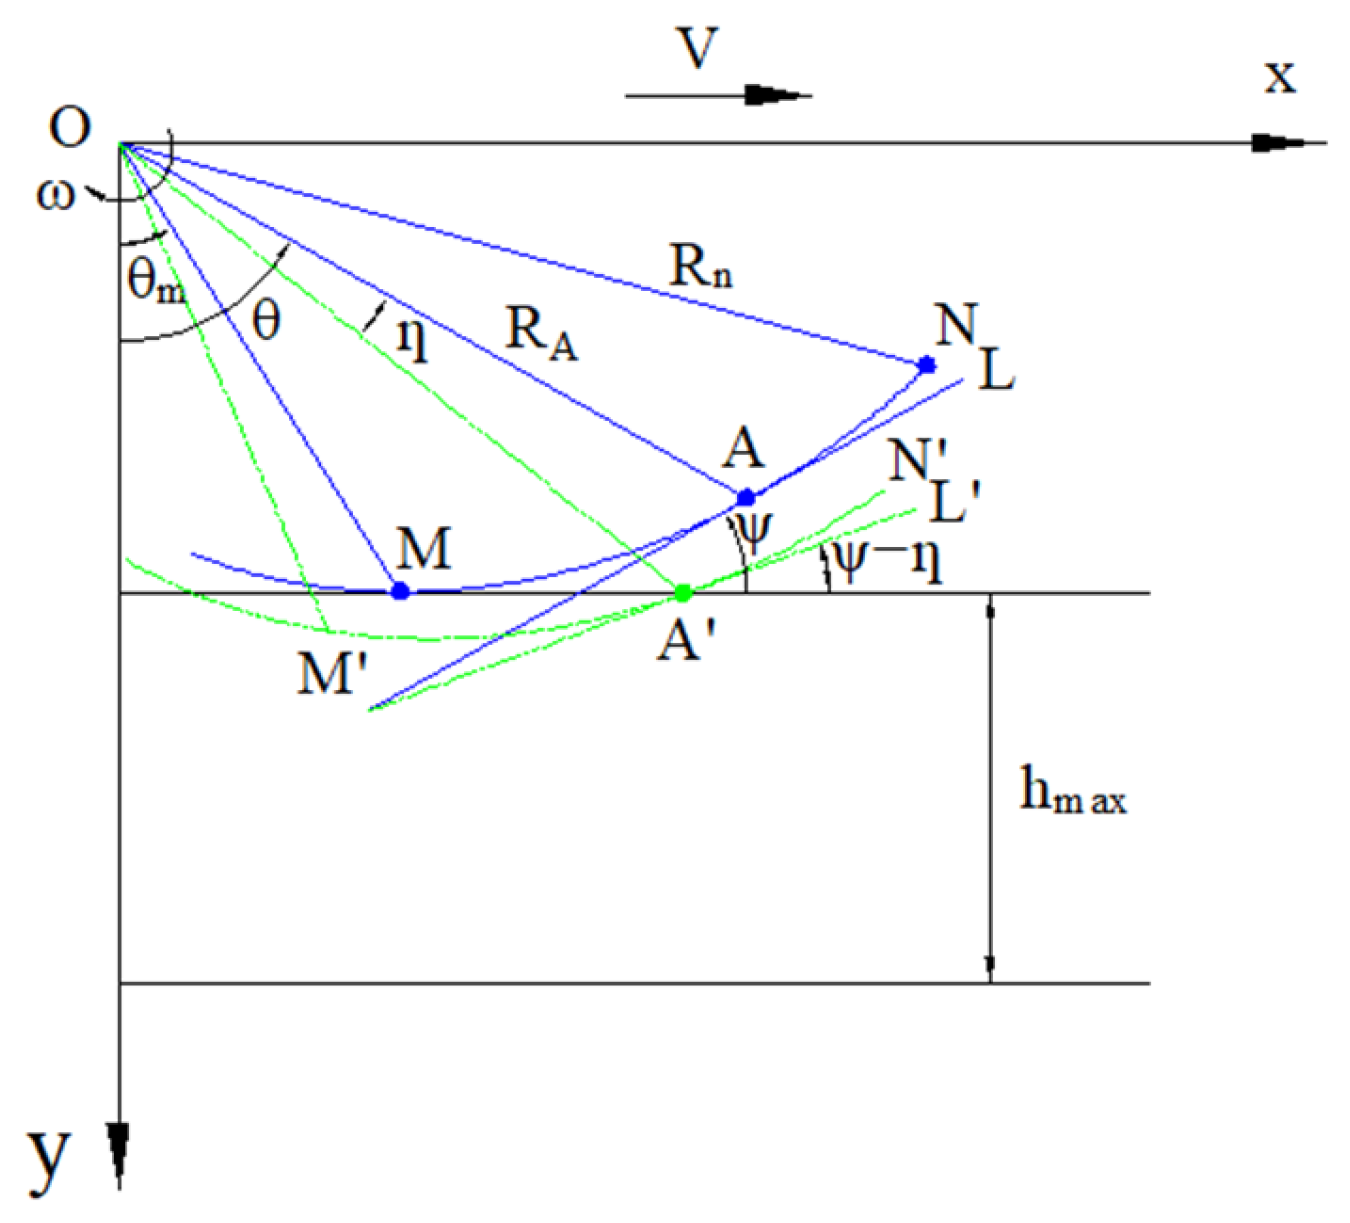
2.1.3. Soil-Mixing Blade Tillage Depth

Point Q is the entry point of the soil-mixing blade, point E is the entry point of the soil-mixing blade endpoint, and point F is the maximum soil layer depth that the endpoint of the soil-mixing blade can reach. If the vertical distance between point E and point F is the working depth H of the soil-mixing blade, then
y = R sin ( ω t ) = R H
Substituting Equation (6) into Equation (5), the absolute horizontal velocity component can be obtained as follows:
V x = V m ( R H ) ω
Through the above analysis, it can be concluded that, to ensure that the soil-mixing blade can normally throw soil backward, it is necessary to make Vx < 0; thus, it is derived that
H < R V m ω = R ( 1 1 λ )
According to kinematic analysis, when the operating parameters of the soil-mixing blade are set to a forward speed of 0.83 m/s, a rotational speed of 280 r/min (corresponding to ω being 29.32 rad/s), and a rotation radius of 220~260 mm and the value range of λ is 7.76~9.18, then the theoretical tillage depth range can be calculated using Equation (8):
H < 220 × (1 − 1/7.76)~260 × (1 − 1/9.18) ≈ 191.69 mm~231.71 mm
The result meets the test requirements for the 160 mm design tillage depth.

2.1.4. Conditions for the Soil-Mixing Blade to Minimize Straw Percentage in the Seeding Layer

To effectively reduce maize straw percentage in the seeding layer, the mixing blade must satisfy the following operational requirement: the side-cutting edge should positively engage and reliably transport straw residues downward during tillage. This design adopts the Archimedean spiral as the curve of the side-cutting edge, with the Equation for this being R(θ) = R0 + Kθ. As shown in Figure 4, v is the machine’s forward direction, point M is the entry point of the side-cutting edge, point N is the termination point of the side-cutting edge, and angle θm is the initial cutting angle of the soil-mixing blade. Point A is any point on the segment MN of the side-cutting edge curve with polar coordinates (θ, R(θ)). Line L is the tangent at point A, and the angle ψ formed between this tangent and the ground is a key parameter affecting straw transport performance.
Based on the parametric equation of the Archimedean spiral, the Cartesian coordinates of the side-cutting edge of the soil-mixing blade are x(θ) = (R0 + Kθ)sinθ and y(θ) = (R0 + Kθ)cosθ, where the cosine of the angle ψ between the blade edge tangent and the ground is
tan ψ = y ' ( θ ) x ' ( θ ) = K cos θ R 0 sin θ K θ sin θ K sin θ + R 0 cos θ + K θ cos θ
where R0 is the initial radius of the side-cutting edge (m), θ is the polar angle, and K is the increase in polar radius when the polar angle increases by 1 rad.
When θ exceeds the critical value θn, y’(θ) is negative, and at this time ψ = arctan R 0 sin θ + K θ sin θ K cos θ K sin θ + R 0 cos θ + K θ cos θ .
During operation, when the soil-mixing blade rotates η degrees, point A on the edge curve will move to position A’ and begin to cut into the soil. At this time, the tangent L rotates to the position L’ and its horizontal angle changes from the original ψ to ψη. According to the geometric relationship, the rotation angle η can be determined using Equation (10):
cos ( θ η ) = R n h max R A
where hmax is the maximum tillage depth of the side-cutting edge (m), RA is the point A radius of rotation, and Rn is the terminal radius of the side-cutting edge (m).
Deriving from Equation (10), η = θ arccos R n h max R A . According to tribology principles, let the friction angles between the corn straw, soil-mixing blade, and ground be fa and fb, respectively. When Equation (11) is satisfied, the blade edge can reliably grip the corn straw on the ground, ensuring the straw is effectively moved downward. This geometric relationship provides a theoretical basis for designing the soil-mixing blade side-cutting edge. The straw processing effect can be optimized by reasonably controlling the edge curve parameters.
( ψ η ) min > ( f a , f b ) max

2.1.5. Conditions for the Soil-Mixing Blade to Minimize Straw Back-Throwing

To minimize straw back-throwing, the soil-mixing blade must facilitate rapid sliding and deposition of corn straw along its side-cutting edge during the transition from maximum tillage depth to complete soil exit, ensuring straw retention within the soil. The forces on the corn straw when the soil-mixing blade interacts with it are shown in Figure 5. Force analysis of corn straw. To ensure that corn straws gradually slide toward the terminal point of the side-cutting edge under the compression of the soil-mixing blade, Equation (12) is obtained. After rearranging, Equation (13) is derived.
f 1 + f 2 cos ε F sin ε
F μ 1 m g ( 1 μ 1 μ 2 ) sin ε ( μ 1 + μ 2 ) c o s ε
where f1 is the friction between the corn straw and soil (N), f2 is the friction between the soil-mixing blade and corn straw (N), mg is gravity of the corn straw (N), F is pressure of the soil-mixing blade on the corn straw (N), Fn is the support force of soil on the corn straw (N), δ is the side angle (°), ε is the angle between the soil-mixing blade’s tangent and the soil (°), μ1 is the sliding friction coefficient between corn straw and soil particles, and μ2 is the sliding friction coefficient between the soil-mixing blade and corn straw.
As shown in Figure 5. Force analysis of corn straw, the angle ε between the soil-mixing blade’s cutting edge and the soil surface increases significantly as the side angle δ decreases. Equation (13) indicates that increasing the angle (ε) between the soil-mixing blade’s tangent and the soil surface reduces the required pressure (F) for corn straw sliding along the side-cutting edge. This promotes rapid straw movement toward the edge terminus, effectively shortening its retention time on the blade and minimizing straw back-throwing.

2.1.6. Soil-Mixing Blade Arrangement

This study adopts a double-helix arrangement method. Based on the simulated soil-bin test bench’s operational width limitation (400 mm), five soil-mixing blades are precisely arranged on each helix (Figure 6). The phase angle between adjacent blades on the same helix is 72°, and the left and right soil-mixing blades installed in the same radial plane have an angle of 180°, with an axial spacing b’ = b + 15 mm. This compact arrangement design ensures test accuracy while meeting the operational requirements of narrow soil troughs and effectively prevents grass entanglement, ensuring operational stability [19].

2.2. Soil–Soil-Mixing Blade–Corn Straw Interaction Discrete Element Model Establishment

2.2.1. Soil-Mixing Blade Roller Model

The 3D model of the soil-mixing blade roller was established using the SolidWorks 2023 software (Dassault Systèmes S.A., Suresnes, France). Non-soil-engaging components such as the frame were simplified to simplify the overall structure and reduce the computational load. The model was then saved in the STL format and imported into the EDEM 2024 software(Altair Engineering Inc., Troy, MI, USA) for further analysis.
The soil-mixing blade is made of 65Mn steel with a hardness of HRC 50. This material exhibits excellent wear and fatigue resistance, significantly enhancing the service life of the blade under complex operating conditions such as straw incorporation.

2.2.2. Soil and Corn Straw Model

In discrete element simulation, smaller particle model sizes lead to slower simulation speeds and increased computation times; therefore, the soil particle size used is generally much larger than the actual size. The soil particles simulated in this paper are 6 mm radius spheres [20,21].
Corn straw has a high aspect ratio and exhibits anisotropic changes in moisture content over time, making it difficult to simulate in discrete element simulations. Moreover, corn straw undergoes complex states during tillage and land preparation, involving crushing, breaking, bending, and scattering, making it hard to fully replicate corn straw’s motion states during simulation and accurately determine the spatial positions of individual pieces of straw. During actual operations, corn straw on the surface is disturbed and mixed into the soil under the action of the soil-mixing blade, and there are few cases of cutting and fragmentation. Based on this operational characteristic, rigid models can be used to simplify the simulation of crushed corn straw particles. A flat strip-shaped structure with a length of 50 mm, a width of 7.2 mm, and a thickness of 3 mm, formed by the interlaced arrangement of 71 spherical particles with a diameter of 3 mm, was used to simulate corn straw, as shown in Figure 7 [22,23].

2.2.3. Soil Contact Model

The selection of an appropriate interparticle contact model is the primary prerequisite for successful EDEM simulations, as it fundamentally represents the elastoplastic analysis of granular solids under quasi-static conditions. In the EDEM 2024 software, the commonly used contact models include the Linear Spring, Hysteretic Spring, Hertz–Mindlin (no slip), Hertz–Mindlin with JKR, Hertz–Mindlin with bonding, and Edinburgh Elasto-Plastic Adhesion models.
The Hertz–Mindlin with bonding model is based on the Hertz–Mindlin (no-slip) model but with “adhesive” between the particles, allowing them to bond together. This model provides a more reliable interparticle bonding and fragmentation simulation than other models [24,25]. Therefore, this study adopts this contact model to construct a cornfield simulation model to characterize the dynamic bonding and fragmentation behavior of soil aggregates during cultivation.

2.2.4. Overall Model

The discrete element simulation calibration method was employed to determine the coefficient of static friction of soil–soil (0.6), the coefficient of static friction of soil–65Mn steel (0.69), and the coefficient rolling friction coefficient of soil–soil (0.14) through repose angle tests. The remaining material physical property parameters and relevant contact parameters were obtained based on existing research findings and related studies [26,27,28,29,30]. The simulation model parameters are shown in Table 1. Basic parameters of the simulation model, and Table 2. Contact parameters of the simulation model.
The simulation model was constructed based on the above particle and material parameters. According to the soil-mixing blade roller dimensions and operating distance, a 3000 mm × 400 mm × 250 mm soil trough model was established. The corn straw generation area was 3000 mm × 300 mm, and the generation quality was 1.2 kg/m2 (actual field measurement results). The mixed soil blade roller tillage depth was adjusted to 160 mm, the forward speed of the equipment was set to 0.83 m/s, the soil-mixing blade roller rotation speed was set to 280 r/min, the Rayleigh time step was set to 14%, the grid size was set to 3 times the minimum particle radius, the total simulation time was set to 4.5 s, and the storage interval was set to 0.05 s. The simulation process is shown in Figure 8. The corn straw burial process is shown in Figure 9.

2.3. Data Collection and Processing

2.3.1. Straw Burial Rate

Using the EDEM 2024 post-processing module’s Grid Bin Group function, 5 measurement areas were randomly set on the soil surface, each with dimensions of 300 mm × 300 mm × 1000 mm. The number of surface straw particles Mp (where the centroid of the straw particle is within the selected box, determining that the particle is selected) was counted. After the machinery operation process had concluded, the number of remaining surface straw particles Mh was counted. The calculation formula for the straw burial rate Y1 is as follows:
Y 1 = M p M h M p × 100 %
where Y1 is the straw burial rate (%), Mp is the pre-planting quantity of corn straw, and Mh is the post-planting quantity of corn straw.

2.3.2. Straw Percentage in the Seeding Layer

After the machine operation process had concluded, 5 positions (taking the average of these five positions as the result) in the soil trough were randomly selected, with two layers of soil used as computational areas in each position. The upper computational area (the sowing layer, i.e., the 0–50 mm soil layer) had dimensions of 500 mm × 500 mm × 50 mm, while the lower computational area measured 500 mm × 500 mm × 150 mm. The upper computational area was level with the ground surface. The number of individual corn straws in each region was counted; a straw particle was selected if its centroid fell within the selected frame. The straw percentage in the seeding layer (0–50 mm soil layer) was calculated using Equation (15).
Y 2 = M s M s + M t × 100 %
where Y2 is the straw percentage in the seeding layer (%), Ms is the quantity of underground 0–50 mm sowing layer corn straw, and Mt is the quantity of underground 50–150 mm soil layer corn straw.

3. Results and Discussion

To systematically evaluate the working performance of the soil-mixing blade and elucidate its operational mechanisms, an in-depth study was conducted from three dimensions: parameter optimization, kinematic analysis, and field validation. The research methodology encompassed three key phases: first, determining optimal structural parameters through single-factor experiments and response surface methodology; second, analyzing straw movement dynamics using discrete element simulation; and finally, validating the optimization results through field trials. This integrated “parameter optimization–mechanism analysis–experimental validation” framework establishes both theoretical foundations and practical methodologies for the design of straw incorporation equipment, providing a systematic solution for improving straw burial effectiveness in conservation tillage systems.

3.1. Single-Factor Experiment

A single-factor experimental method was adopted to investigate the influence law of the bending angle β, side angle δ, bending line angle α, tangential edge height h, and bending radius r on the straw burial rate (Y1) and straw concentration ratio in the seeding layer (Y2). Based on kinematic analysis and field experiments, the optimization range for key parameters of the soil-mixing blade were determined: bending angle β = 85°~145°, side angle δ = 120°~160°, bending line angle α = 15°~55°, tangential edge height h = 40~80 mm, and bending radius r = 10~50 mm. The level ranges for each factor are shown in Table 3. During the experiment, the forward speed and rotation speed were kept constant. When examining a single factor, the other parameters were set to intermediate values (β = 115°, δ = 140°, α = 35°, h = 60 mm, r = 30 mm). Each experiment was repeated three times, and the average value was taken as the result.
The Origin 2024 software (OriginLab Corporation, Northampton, MA, USA) was used to plot β, δ, α, h, r, and Y1 and Y2 relationship curves, as shown in Figure 10. Figure 10a shows that as β increases, the straw burial rate decreases. In contrast, the straw percentage in the seeding layer first decreases and then increases, indicating that a large bending angle would increase the retention of straw on the surface of the soil. Figure 10b shows that the straw burial rate fluctuates as the side angle δ increases; the optimal straw burial effect is within the range of 130°~150°. The straw percentage in the seeding layer first decreases and then increases as the angle of δ increases. An angle of around 140° can effectively reduce the straw percentage in the seeding layer. Figure 10c shows that a 35°~55° bending line angle range can meet the dual requirements of a high straw burial rate and a low straw percentage in the seeding layer and so is a relatively ideal working parameter range. Figure 10d shows that the straw burial rate first increases and then decrease; it reaches a peak of 97.08% at 60 mm. The straw percentage in the seeding layer exhibits a pattern of an initial significant decline and then a recovery, reaching its minimum value of 37.19% at a 60 mm height. Figure 10e shows that as the bending radius r increases, the straw burial rate follows a “rapid rise followed by slow decline” pattern. In contrast, the straw percentage in the seeding layer shows a trend of initial decline followed by recovery, achieving a peak value of 37.19% at 30 mm.

3.2. Box–Behnken Experiment
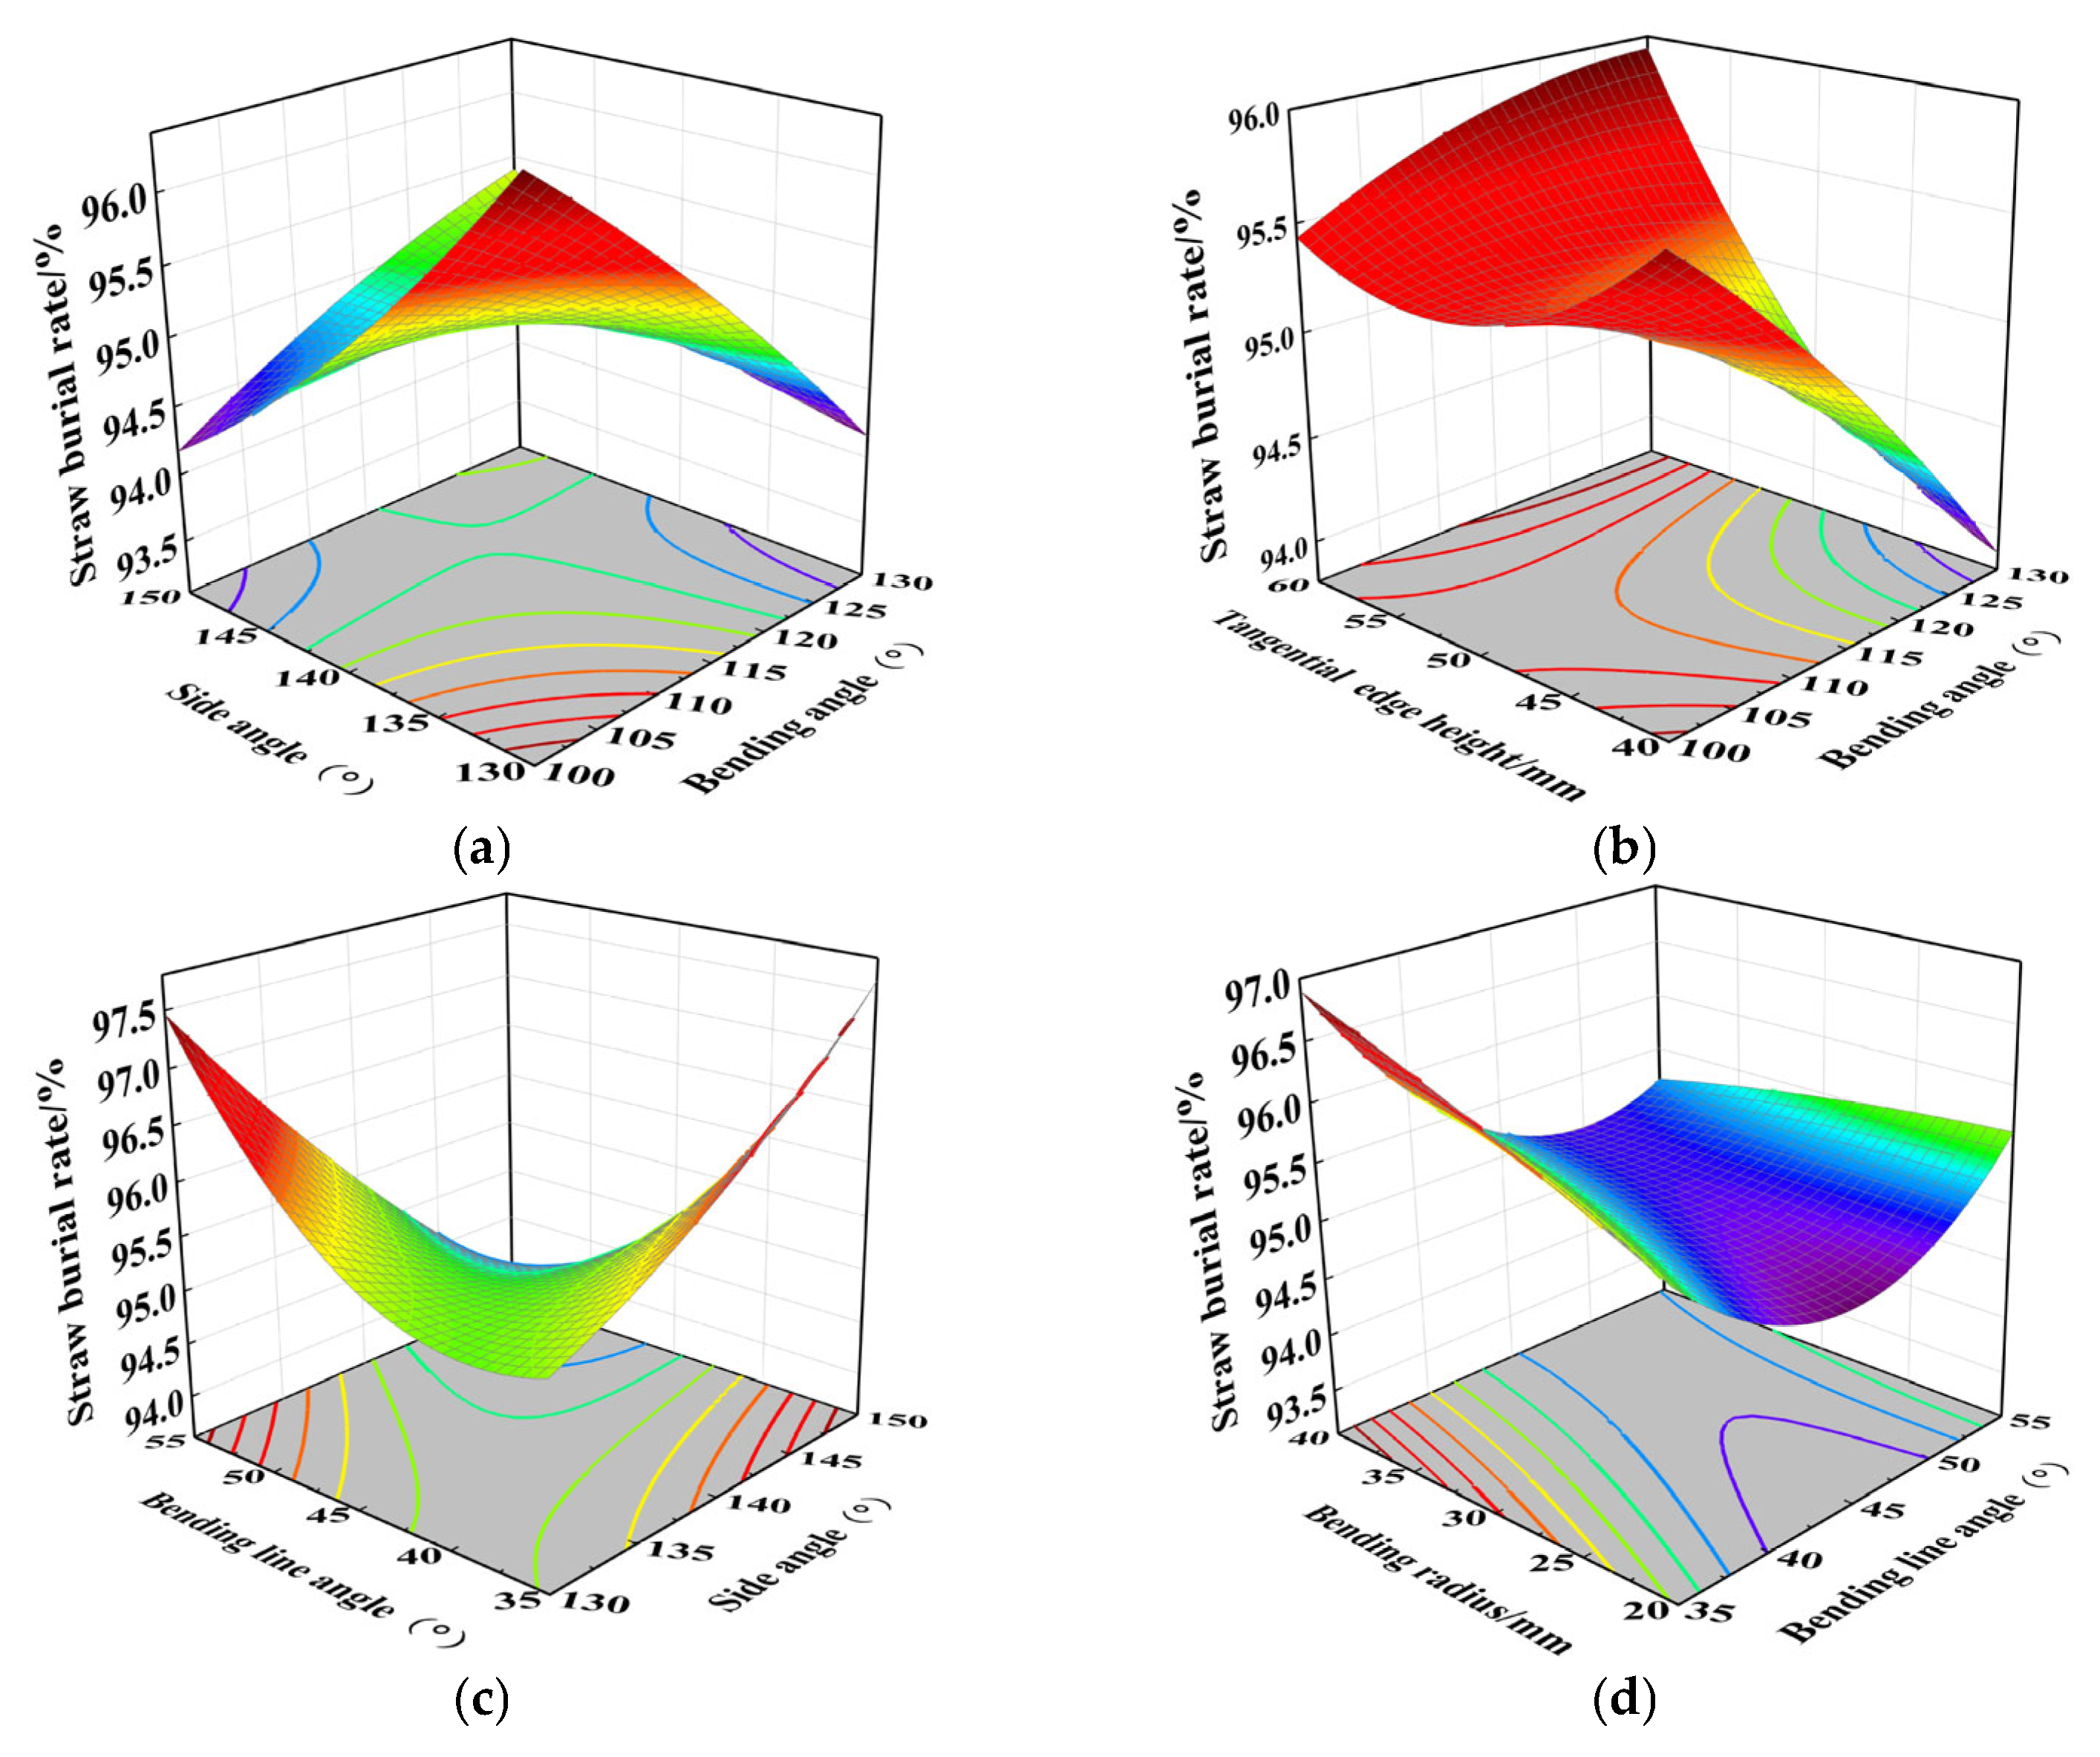
Based on the results of the single-factor experiments, reasonable ranges for each factor were selected and the Box–Behnken response surface method was used to design a five-factor three-level experiment; the level codes for each factor are shown in Table 4.
Table 5 shows a complete set of 46 test plans and results. Each test was repeated three times to reduce error, and the arithmetic mean was used as the final test value.
(1)
Straw burial rate regression model and response surface methodology analysis
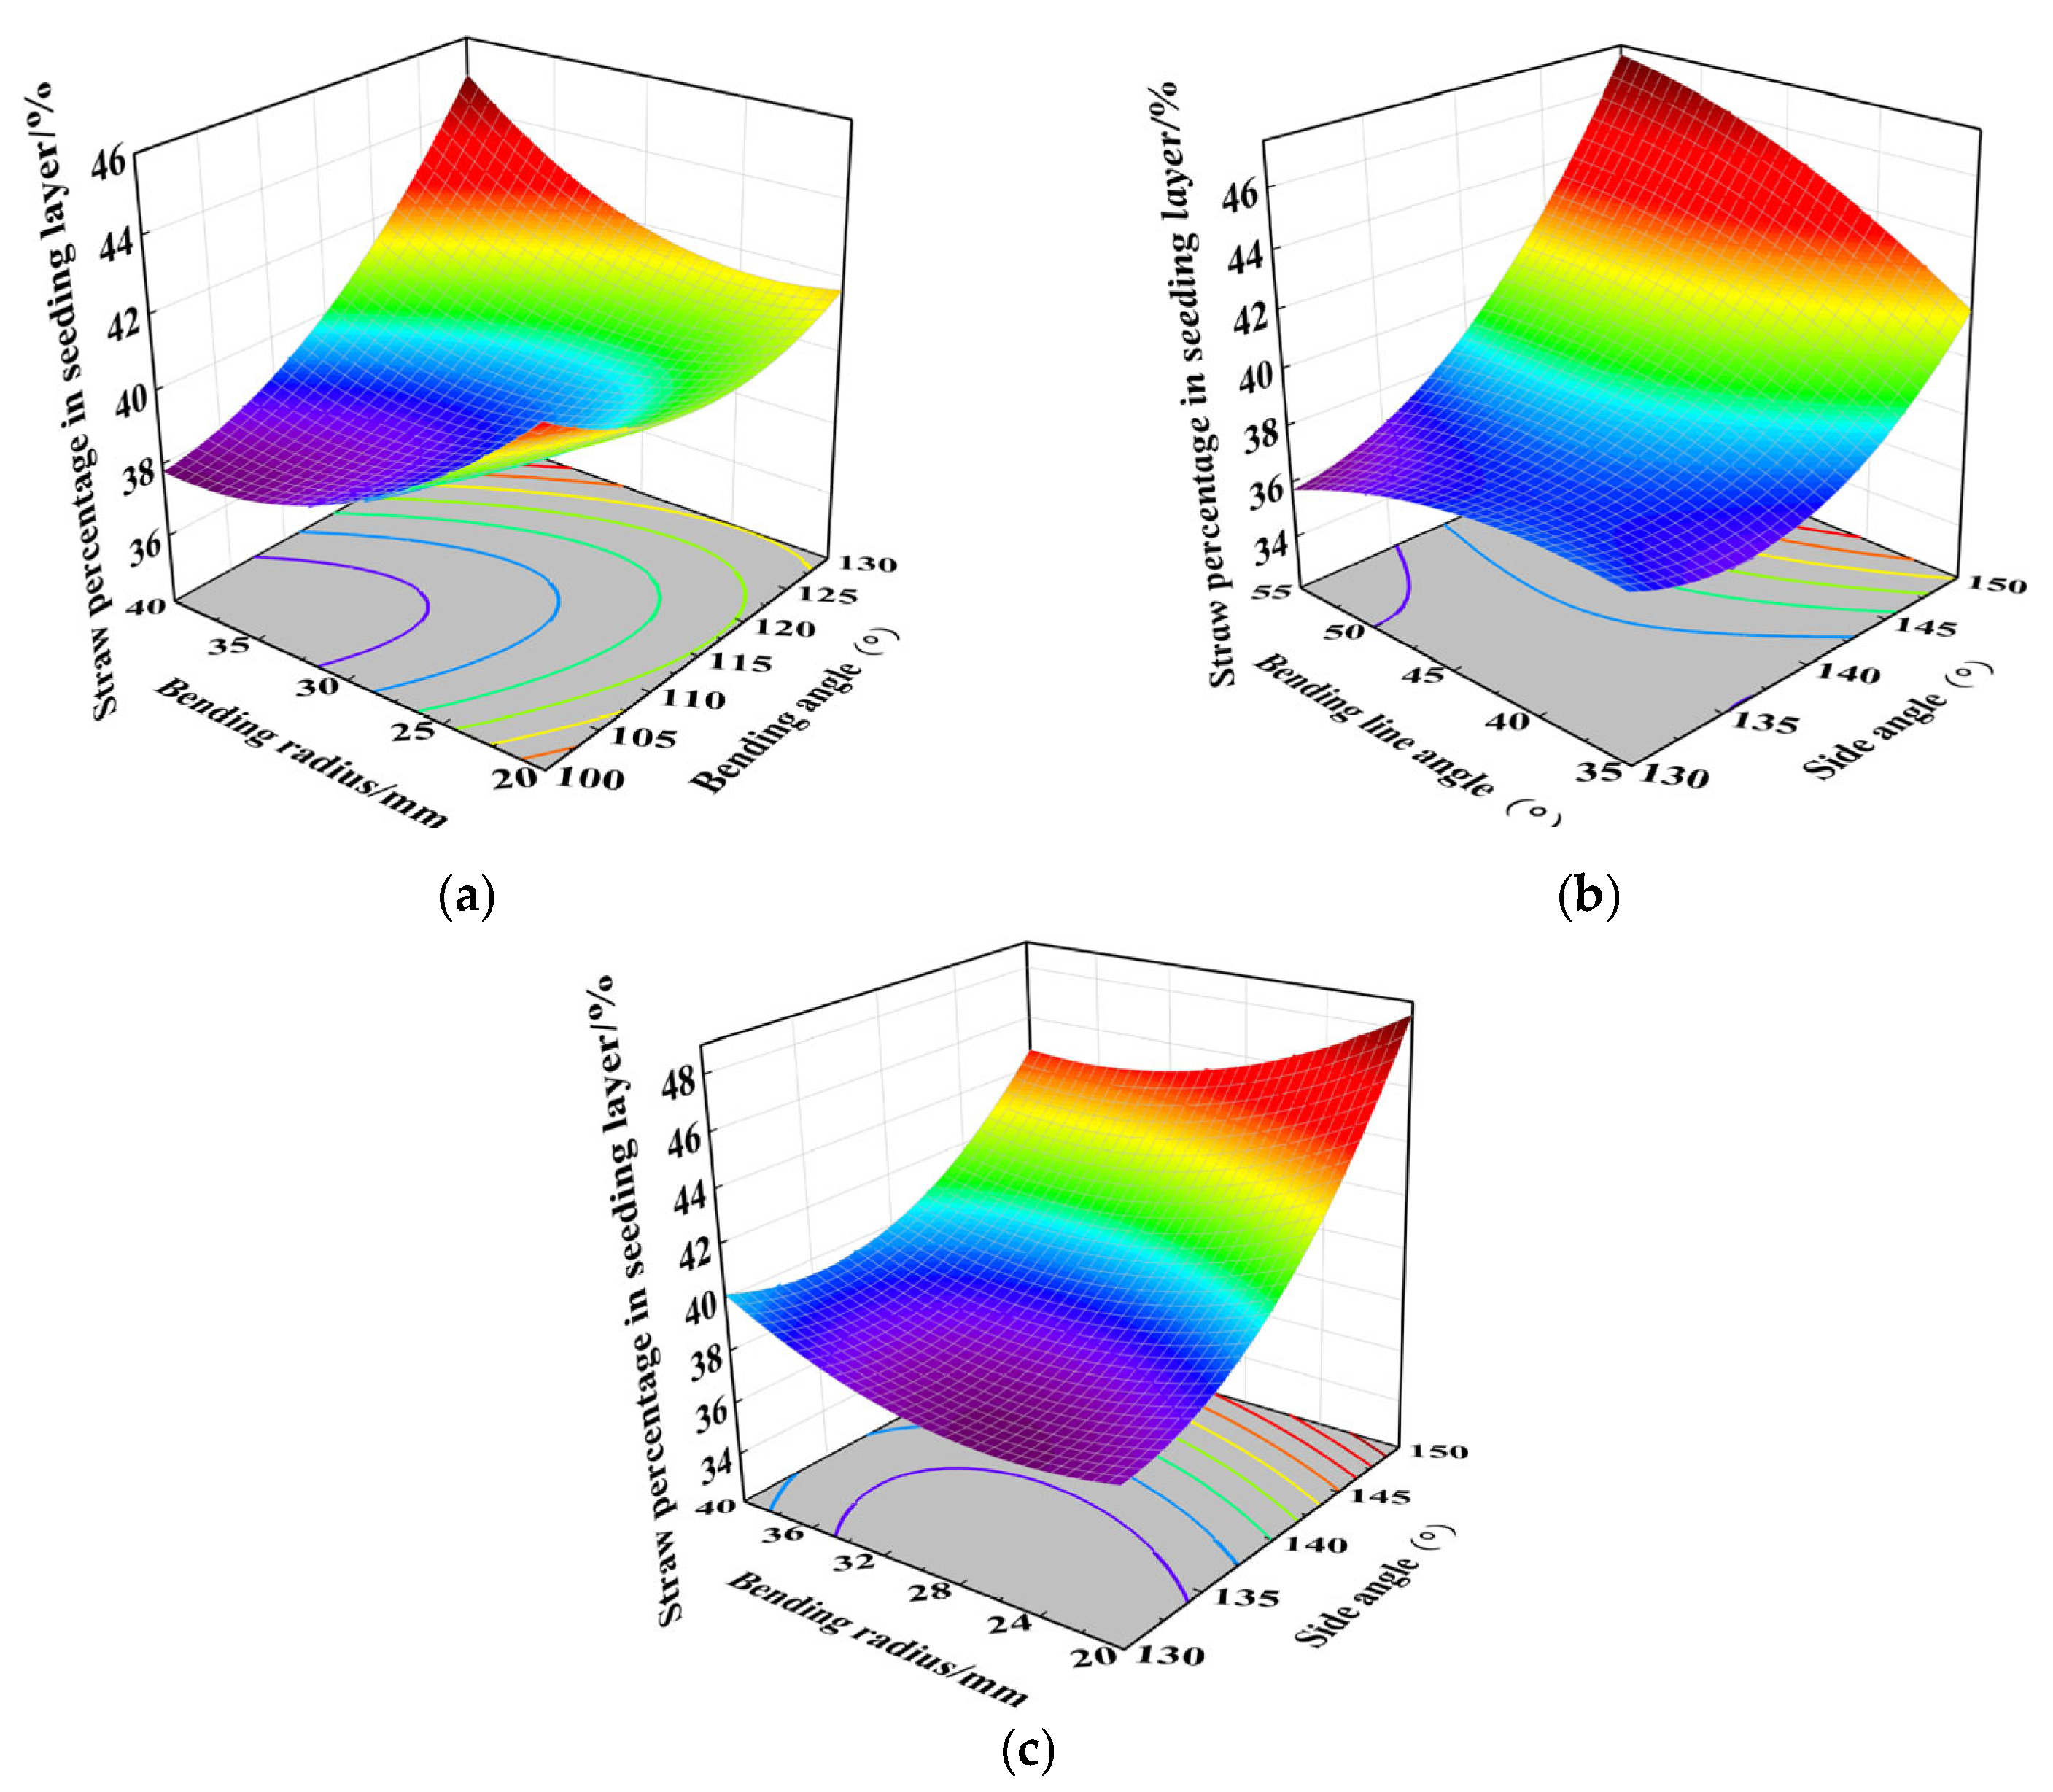
Using the Design-Expert 13 software (Stat-Ease, Minneapolis, MN, USA), variance analysis was performed on the experimental data for the straw burial rate (Table 6), and the regression model was highly significant (p < 0.01). Moreover, the lack-of-fit test was not significant (p = 0.0701 > 0.05), indicating that the mathematical model fitted the experimental data well. Taking the straw burial rate Y1 as the response indicator, a quadratic polynomial regression equation was established through factor level encoding. This is shown in Equation (16).
Y 1 = 95.04 0.3556 A 0.3475 B 0.415 C + 0.4194 D + 0.23 E + 0.9675 A B 0.1275 A C + 0.61 A D + 0.1775 A E 1.45 B C + 0.1075 B D + 0.34 B E 0.235 C D 0.4325 C E + 0.33 D E 0.1185 A 2 + 0.2106 B 2 + 0.839 C 2 + 0.3465 D 2 0.0544 E 2
ANOVA indicated significant differences in the effects of various factors on the straw burial rate (Y1). Among them, the bending angle A, side angle B, bending line angle C, and tangential edge height D had highly significant effects on the straw burial rate (p < 0.01). In contrast, the bending radius E had only a marginally significant effect (0.01 < p < 0.05). Based on the calculated p values, the influence of each factor on the straw burial rate is ranked as C = D > A > B > E.
Regarding interactions, the interaction term between bending angle and side angle AB, the interaction term between bending angle and tangential edge height AD, and the interaction term between side angle and bending line angle BC, as well as the quadratic term of bending line angle C2, all have a highly significant effect (p < 0.01). The interaction term between bending line angle and bending radius CE and the quadratic term of tangential edge height D2 are significant (0.01 < p < 0.05), while the effects of the interaction term between the bending angle and bending line angle AC, the interaction term between the side angle and bending radius BE, and the interaction term between the tangential edge height and bending radius DE show a marginally significant effect (0.05 < p < 0.1). The remaining interaction and quadratic terms do not significantly affect the straw burial rate Y1.
To further analyze the influence patterns of key interactions, this study selects the extremely significant interaction terms AB, AD, and BC and the significant interaction term CE for response surface analysis (Figure 11). During this analysis, other factors are fixed at zero to independently and accurately reflect each interaction’s influence mechanisms.
Figure 11a shows that the straw burial rate negatively correlates with the bending angle when the side angle is kept constant. This is because, when the bending angle increases, the blade tip contacts the straw first, causing the straw to be pushed aside, which is not conducive to the straw being moved vertically downward; the optimal bending angle range is 100° to 120°. When the bending angle is kept constant, as the side angle increases, the soil-mixing blade side angle increases, causing the pressure exerted on the corn straw to decrease, resulting in an insufficient sliding force along the side-cutting edge of the straw. Specifically, this manifests as a decrease in straw sliding speed and the straw being pulled back to the surface before detaching from the side-cutting edge, which reduces the straw burial rate. The optimal range for the side angle is 130°~140°. Figure 11b shows that the straw burial rate negatively correlates with the bending angle. When the bending angle is fixed, the straw burial rate decreases and then increases as the tangential edge height increases; the optimal range of the tangential edge height is 50~60 mm. Figure 11c shows that the straw burial rate significantly increases as the side and bending line angles increase. This indicates that increasing both the bending line angle and the side angle is beneficial for increasing the straw burial rate. Figure 11d shows that, when the bending radius is constant, the straw burial rate first decreases and then increases as the bending line angle increases; the optimal range of the bending line angle is 45°~55°. When the bending line angle is fixed, the straw burial rate positively correlates with the bending radius. The optimal bending radius ranges from 25 to 40 mm.
Zhang et al. [17] also investigated the effects of tool structural parameters on the straw burial rate by establishing a rice straw–soil rotary-tillage-blade simulation model. However, their study only examined the influence of parameters such as rotation radius, tangential edge height, bending angle, and bending line angle, while neglecting critical parameters including the side angle and bending radius. Moreover, their analysis lacked the in-depth exploration of the interactions between these factors.
(2)
Seeding layer straw percentage regression model and response surface methodology analysis
Based on simulation test data, regression fitting was conducted for the straw percentage in the seeding layer Y2, and the analysis of variance is shown in Table 7. The quadratic polynomial regression model for the straw percentage in the seeding layer Y2 is shown in Equation (17), and the equation for the encoded factor scan predicts the response at the given level of each factor.
Y 2 = 38.96 + 1.54 A + 3.83 B + 0.8881 C 0.8175 D 0.3894 E + 0.9825 A B + 0.345 A C 1.43 A D + 2.06 A E + 1.9 B C + 0.0825 B D 1.54 B E + 0.88 C D 0.1575 C E 0.7475 D E + 1.41 A 2 + 2.45 B 2 0.8565 C 2 + 0.441 D 2 + 1.4 E 2
As shown in Table 7, the regression model for p < 0.0001 is highly significant; the lack-of-fit term p value is 0.3472 > 0.05 and is not significant. The bending angle A and side angle B have an extremely important effect on the straw percentage in the seeding layer (p < 0.01); the bending line angle C and the tangential edge height D have a substantial effect on the straw percentage in the seeding layer (0.01 < p < 0.05); the bending radius E has no significant impact on the straw percentage in the seeding layer effect. The significance ranking of the impact of various factors on the straw ratio in the sowing layer Y2 is B > A > C > D > E.
In terms of interaction effects, the interaction term between the bending angle and the bending radius AE, the quadratic term of the bending angle A2, and the quadratic term of the side angle B2 have a highly significant effect on the straw percentage in the seeding layer Y2 (p < 0.01). The interaction term of the side angle and the bending line angle BC, the interaction term of the side angle and the bending radius BE, and the quadratic term of the bending radius E2 have a significant effect on the straw ratio in the sowing layer Y2 (0.01 < p < 0.05). The interaction between the bending angle and tangential edge height AD, as well as the quadratic term of the bending line angle C2, have a marginally significant impact on the straw percentage in the seeding layer Y2 (0.05 < p < 0.1). Other interactions and quadratic terms do not significantly affect the straw percentage in the sowing layer Y2.
To study the influence of the interaction between various factors on the response values, significant and highly significant interaction terms (AE, BC, and BE) with respect to the straw percentage in the seeding layer Y2 were selected and analyzed; the other experimental factors were set to zero. Their response surface analysis is shown in Figure 1.
The influence of the bending angle and bending radius on the straw percentage in the sowing layer when the side angle is 140°, the bending line angle is 35°, and the tangential edge height is 50 mm is depicted in Figure 12a. When the bending radius is constant, as the bending angle increases, the straw percentage in the seeding layer decreases and then increases; the optimal bending angle range is 100°~120°. When the bending angle remains constant, the straw percentage in the seeding layer shows a significant negative correlation with the bending radius; the optimal bending radius range is 30–40 mm.
Figure 12b. shows the influence of the side angle and bending line angle on the straw percentage in the seeding layer when the bending angle is 115°, the tangential edge height is 50 mm, and the bending radius is 30 mm. When the bending line angle is constant, the straw percentage in the seeding layer positively correlates with the side angle. Mechanistic analysis reveals that increasing the side angle reduces the required pressure for corn straw sliding along the side-cutting edge, thereby accelerating straw movement to the edge terminus. This process effectively decreases the residence time on the soil-mixing blade and mitigates straw back-throwing. Thus, it effectively shortens the retention time of the corn straw on the soil-mixing blade and significantly reduces the straw return rate. The optimal side angle range is 130°~140°. When the side angle is kept constant, as the bending line angle increases, the straw percentage in the seeding layer first increases and then decreases; however, the rate and magnitude of change are relatively small. When comparing the two factors, the bending line angle has a greater effect on the straw percentage in the seeding layer than the side angle.
Figure 12c. shows the effects of side angle and bending radius on the straw percentage in the seeding layer when the bending angle is 115°, the bending line angle is 35°, and the tangential edge height is 50 mm. When the bending radius is kept constant, the straw percentage in the seeding layer is positively correlated with the side angle; the optimal range for the side angle is 130°–140°. When the side angle is kept constant, the straw percentage in the seeding layer increases slowly as the bending radius increases; the optimal range for the bending radius is 20–30 mm.
He et al. [30] and Zhou et al. [31] have also conducted relevant studies on reducing the straw content in the seeding layer. However, their research perspectives differ significantly from this study. Specifically, He’s team primarily focused on the effects of operational parameters (such as implement forward speed and rotary tillage speed) on straw distribution in the seeding layer, while Zhou’s team emphasized on comparing the working performance of different types of implements.
Based on the model analysis results, Design-Expert 13’s optimization function was used to optimize the parameters. To improve straw return quality, the straw burial rate should be optimal while minimizing the straw percentage in the seeding layer. For this purpose, a dual-objective function optimization model for straw burial rate Y1 and the straw percentage in the seeding layer Y2 was established:
max Y 1 min Y 2 100 ° A 130 ° 130 ° B 150 ° 35 ° C 55 ° 40   mm D 60   mm 20   mm E 40   mm
Through solving Equation (18), the optimal parameter combination was obtained, i.e., a bending line angle α of 55°, a bending angle β of 100.01°, a side angle δ of 130°, a tangential edge height h of 40.05 mm, and a bending radius r of 28.67 mm. The corresponding predicted values are a straw burial rate of 99.81% and a straw percentage in the seeding layer of 35.31%.
To facilitate practical manufacturing, the optimized parameters were rounded, with the optimal combination determined as follows: bending line angle α = 55°, bending angle β = 100°, side angle δ = 130°, tangential edge height h = 40 mm, and bending radius r = 29 mm. Simulation results demonstrated that this parameter combination achieved a straw burial rate of 96.04% (relative error: 3.78%) and a straw percentage in the seeding layer of 35.25% (relative error: 0.17%). The discrepancies between the simulated and predicted values were all below 4%, confirming the reliability of the optimization.
Comparative analysis demonstrates that the optimized soil-mixing blade exhibits significant performance improvements compared to the conventional rotary blade. In terms of straw burial rate, the soil-mixing blade (96.04%) achieves a 1.26 percent increase over the rotary blade (94.78%). Regarding the straw percentage in the seeding layer, the soil-mixing blade (35.25%) reduces the proportion by 11.02 percent compared to the rotary blade (46.27%), effectively minimizing straw accumulation in the seeding layer.

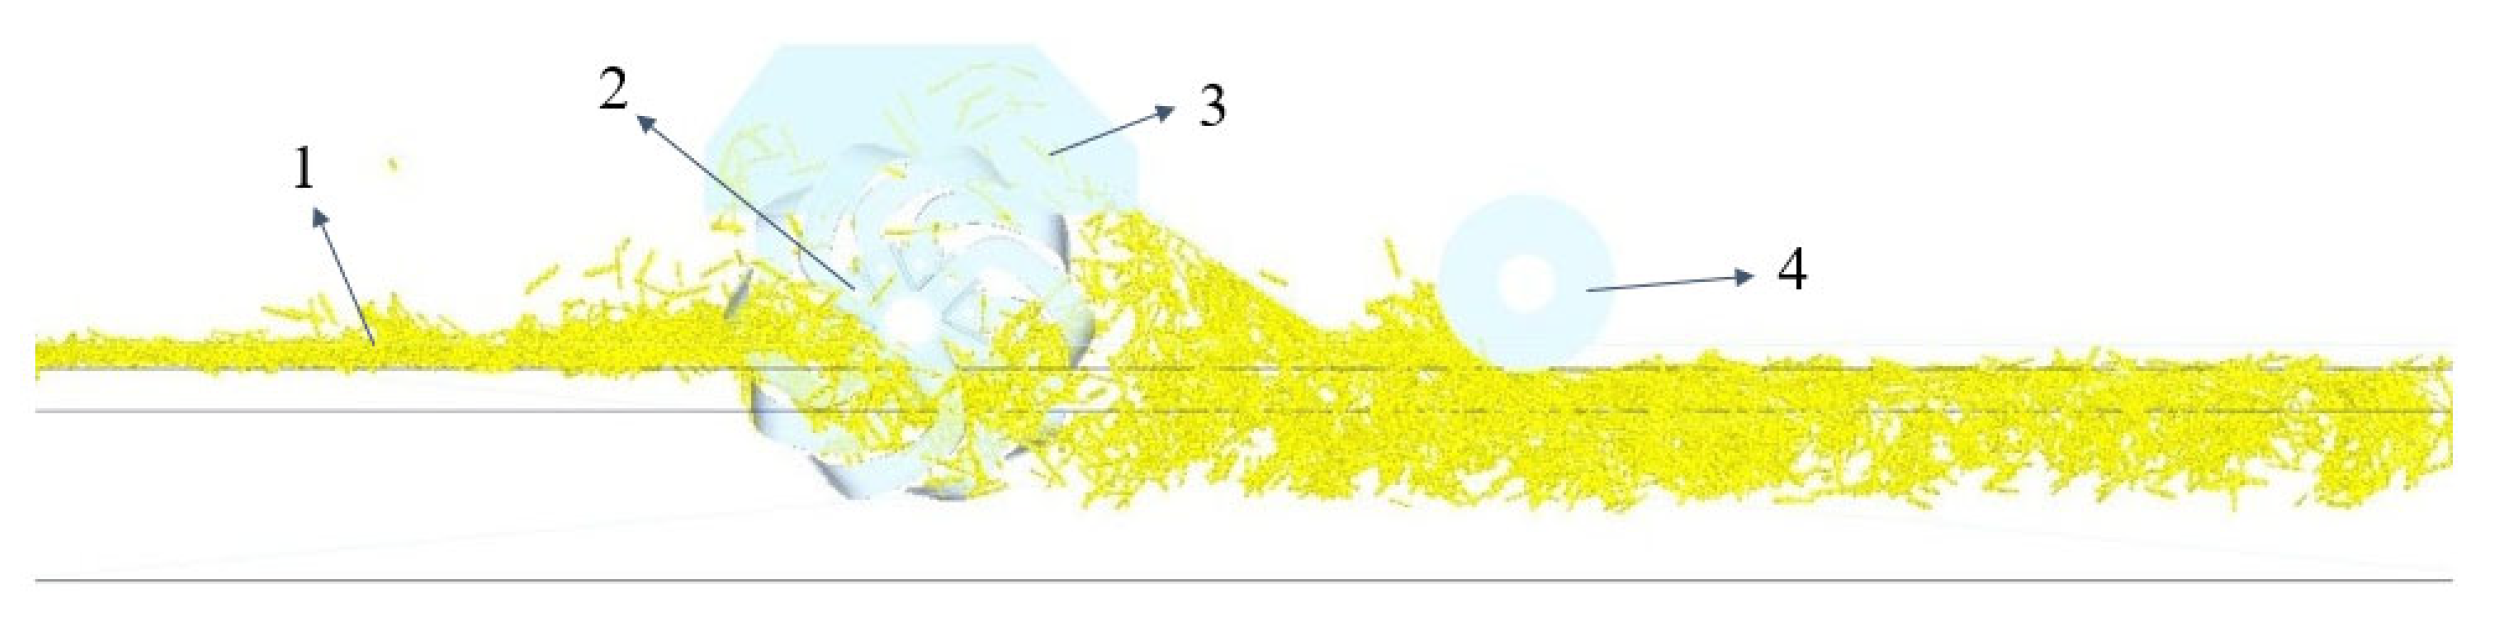
3.3. Spatial Motion Analysis of Corn Straw

To elucidate the mechanism by which the mixing blade influences straw movement and to further reveal the differential characteristics between the mixing and rotary blades in terms of their effects on the spatial distribution of corn straw, this study analyzed the process of straw motion from two dimensions: velocity and vertical displacement.

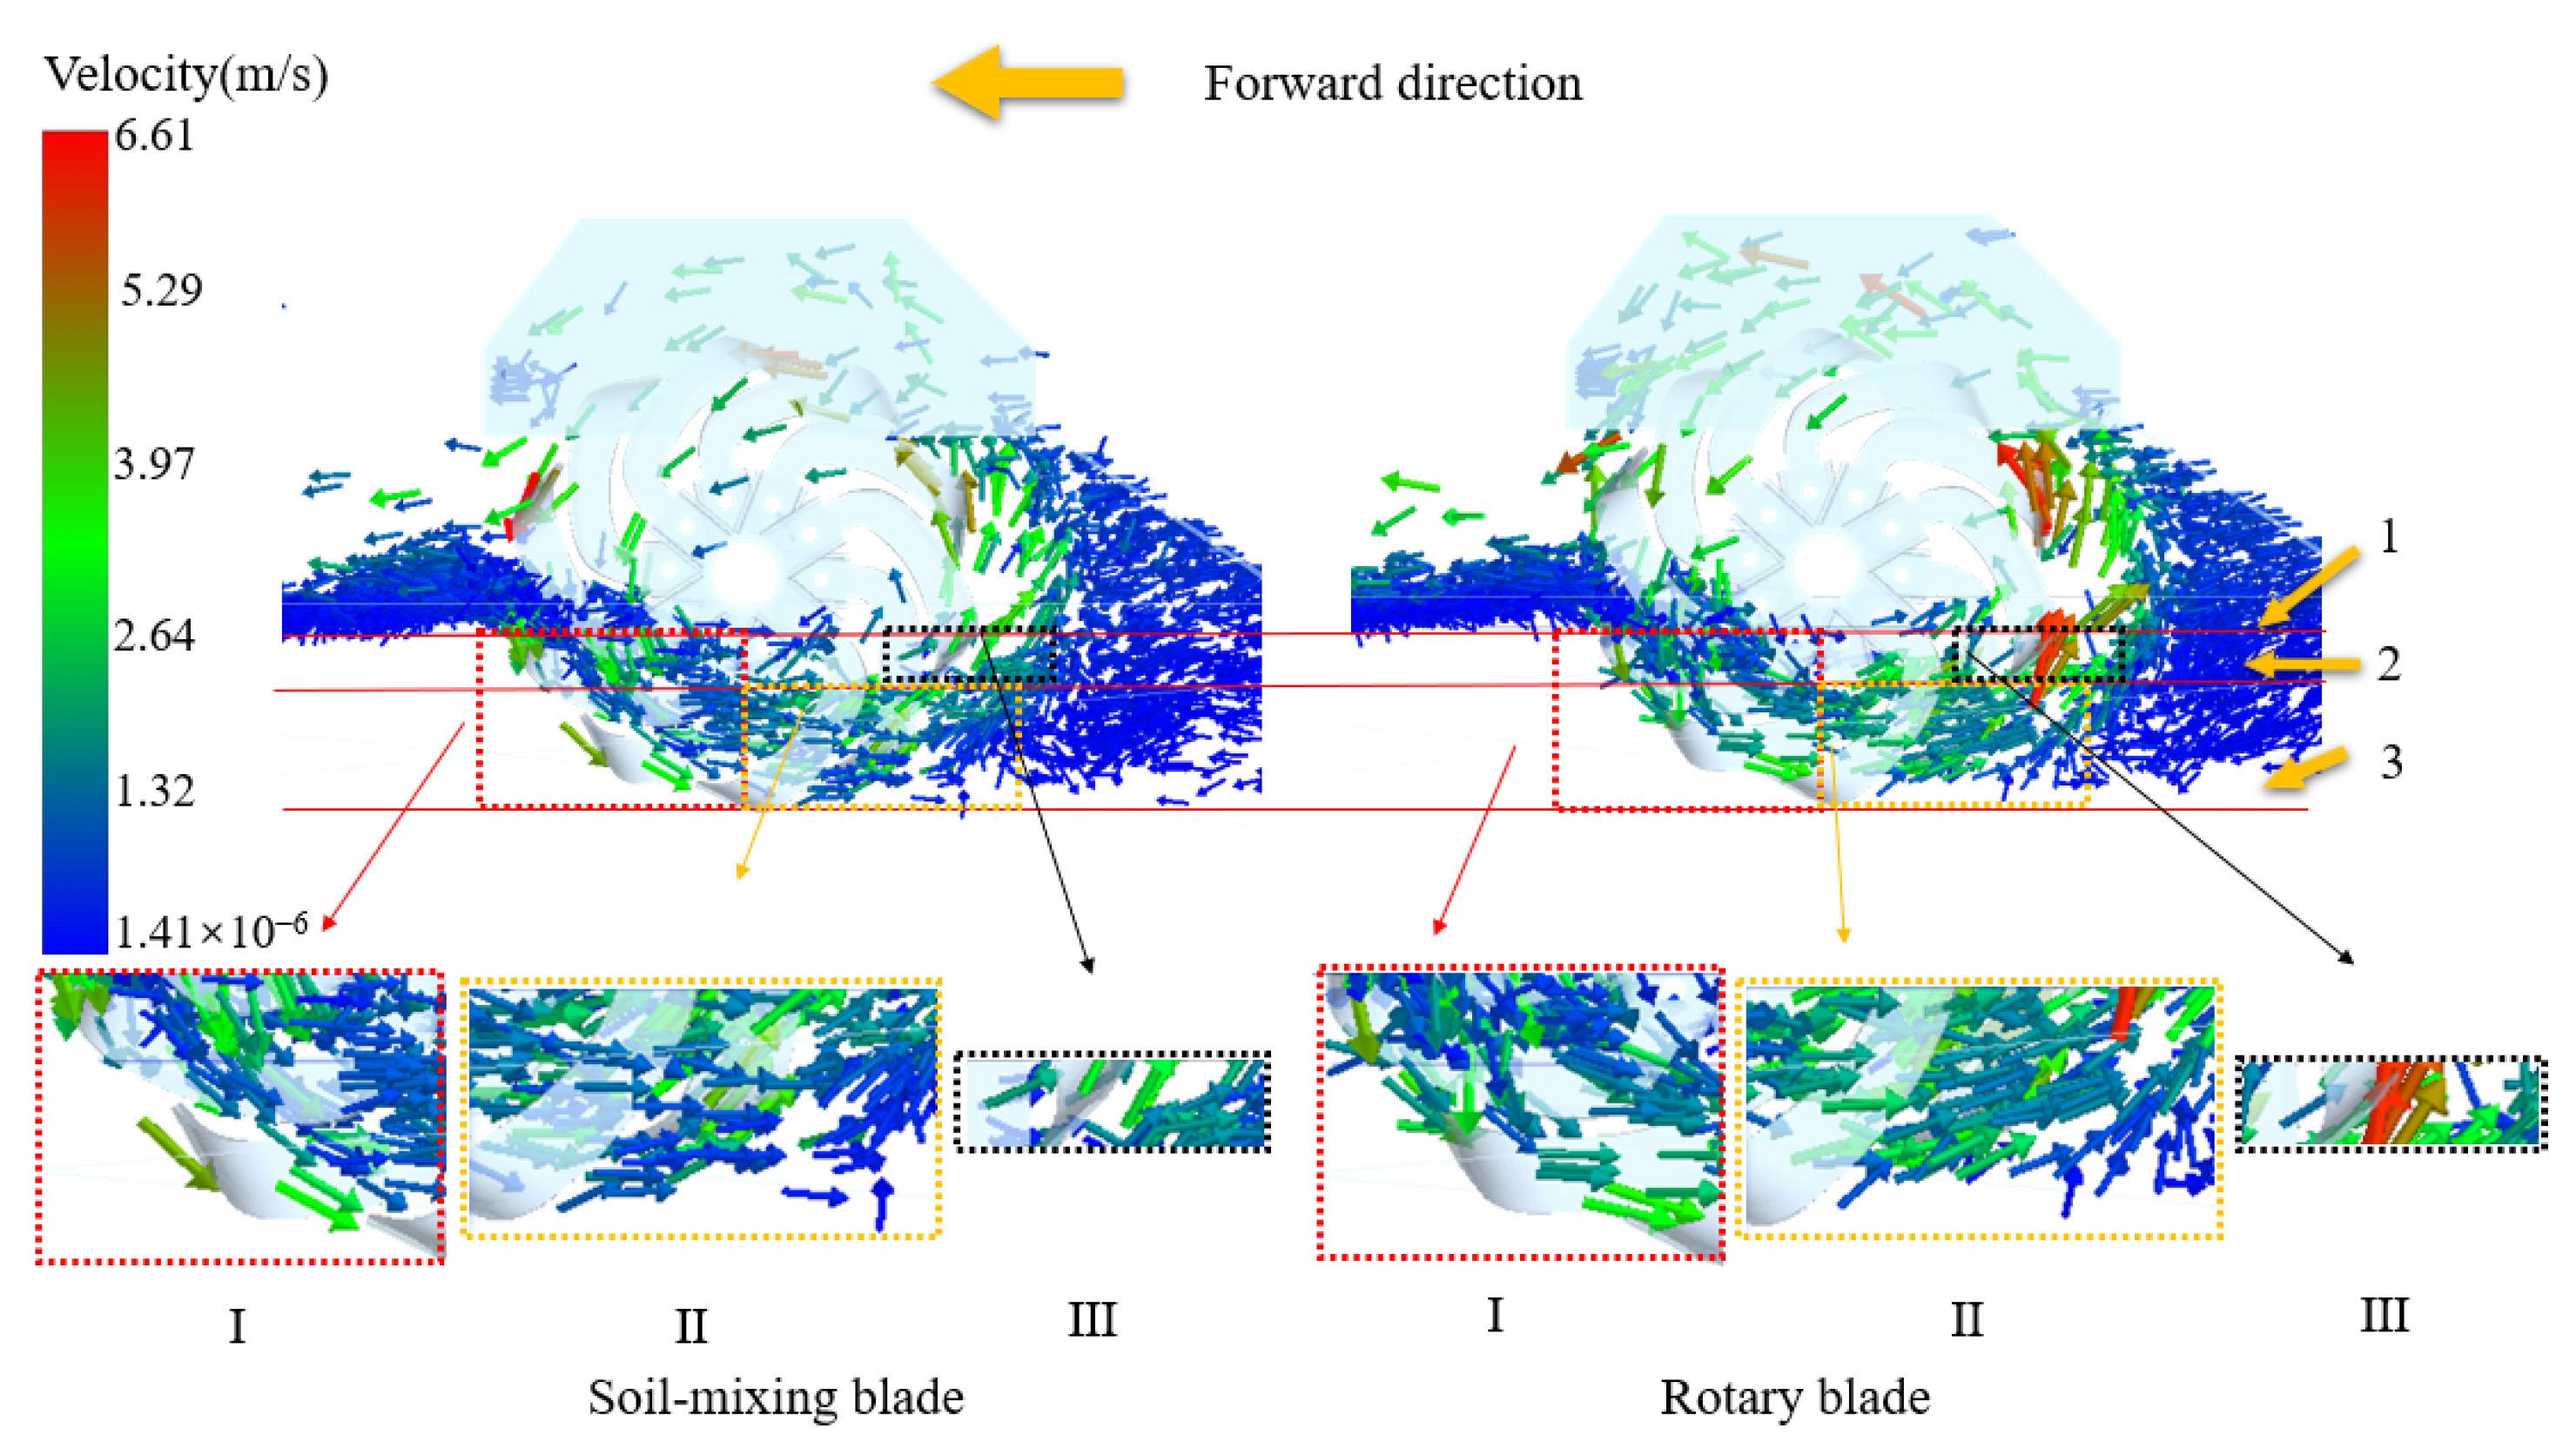
3.3.1. Dynamic Analysis of Velocity Variation During the Corn Straw Burial Process

Based on the discrete element simulation results (Figure 13), a comparative analysis of the movement characteristics of corn straw during the operation of both the soil-mixing and rotary blades was conducted. The direction of machine movement was set as horizontal to the left. The velocity cloud map used a color gradient to represent the velocity levels: blue (0–1.5 m/s), green (1.5 m/s–5 m/s), and red (5 m/s–6.61 m/s). The analysis results show that there are significant differences in the influence of the two types of blades on the movement characteristics of corn straw:
I.
During the stage of the cutter entering the soil to the maximum tillage depth, in the soil-mixing blade’s working area, approximately 82.6% of the corn straw particle movements are consistent with the rotational direction of the cutter as the soil-mixing blade moves deeper into the soil. However, during rotary blade operation, the movement of the corn straw exhibits a multi-directional distribution.
II.
During the soil penetration phase from the maximum tillage depth to the seeding layer, the straw’s velocity within the soil-mixing blade operation zone remained predominantly below 1 m/s, with velocity vectors maintaining <15° inclination relative to the horizontal plane. This kinematic behavior facilitated the stable retention of corn straw below the 50 mm soil depth. In contrast, a clear recirculation zone forms behind the rotary blade, where the average speed of the corn straw is greater than 1.5 m/s. The velocity vector forms an angle of 40° ± 6° with the horizontal plane, causing 31.7% of the straw particles to be carried back to the 0–50 mm sowing layer.
III.
From the sowing layer to the stage of detachment from the soil, the mixing blade maintained low straw velocities of <1.5 m/s for most of the corn straw particles, with only 5.3% exhibiting slight back-throwing (velocity vectors >30° to the horizontal plane). In contrast, the rotary blade generated a high-velocity straw flow, reaching peak velocities of 6.61 m/s and with near-vertical upward trajectories (with an angle > 80° to the horizontal plane), resulting in severe straw back-throwing.
Overall, during the soil-mixing blade’s operation from penetration into the soil to maximum tillage depth and then to detachment from the soil, the blade controls the trajectory of straw movement, significantly inhibiting the backward movement of straw, allowing more straw to remain in the deeper soil layer, and improving the distribution of corn straw in the tillage layer.

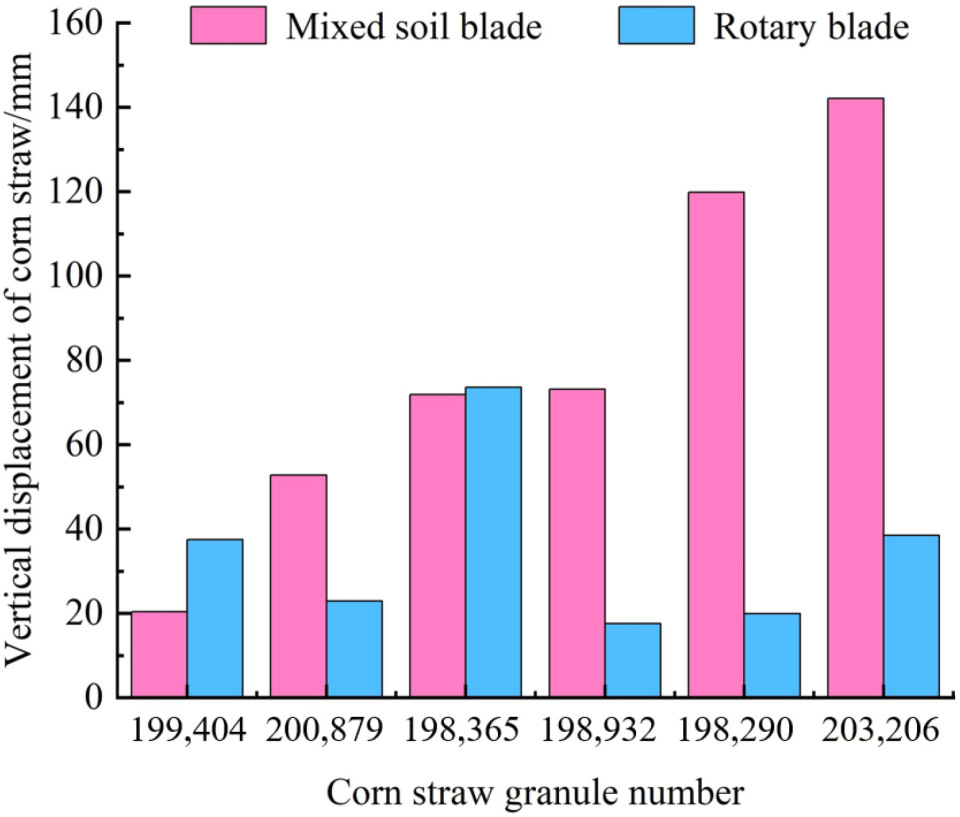
3.3.2. Comparative Analysis of the Vertical Motion Displacement of Corn Straw

Using the EDEM 2024 post-processing module’s Manual Selection function, six groups of corn straw particles were randomly selected for tracking and analysis of their motion trajectories during 0.43 s of tillage under the two tillage conditions, i.e., using the soil-mixing blade or rotary blade. Based on particle coordinate data, the vertical displacement difference between the final and initial positions were calculated as a quantitative indicator of straw burial depth (Figure 14). The results show that, under the soil-mixing blade operation, straw group 199,404 shows the minimum displacement (20.4 mm), while the other five groups of straw all show displacement of over 50 mm, with an overall average displacement of 78.36 mm. Under rotary blade operation, straw group 198,365 exhibits the maximum vertical displacement (73.62 mm), while the other five groups of straw all show displacement of less than 40 mm, with an overall average displacement of 35 mm. Statistical analysis indicates that the two types of tillage tools significantly differ in straw distribution. After soil-mixing blade operation, 83.3% of the straw displacement exceeds 50 mm, i.e., penetrating the deep soil below 50 mm. In contrast, after rotary blade operation, 83.3% of the straw displacement is less than 40 mm, with the straw being mainly distributed in the 0–50 mm seed layer soil. Collectively, these results indicate that the soil-mixing blade is more effective for the deep straw burial.
The motion analysis of corn straw indicates that the mixing blade improves the vertical distribution of straw in the tillage layer by reducing its back-throwing rate. The underlying reason for this is that the side angle of the mixing blade (130°) is significantly smaller than that of the rotary blade (141°). This can create a more favorable seedbed environment for subsequent sowing operations. Furthermore, these findings provide theoretical support for the optimized design of straw incorporation equipment.
The straw movement analysis demonstrates that the soil-mixing blade improves vertical straw distribution in the tillage layer by reducing back-throwing. This effect arises because the soil-mixing blade’s side angle (130°) is smaller than that of the rotary blade (141°). As a result, the pressure (F) required for corn straw to slide along the side-cutting edge of the soil-mixing blade is reduced, enabling faster movement to the terminal position of the side edge. This effectively shortens the retention time of straw on the soil-mixing blade, mitigating straw back-throwing.

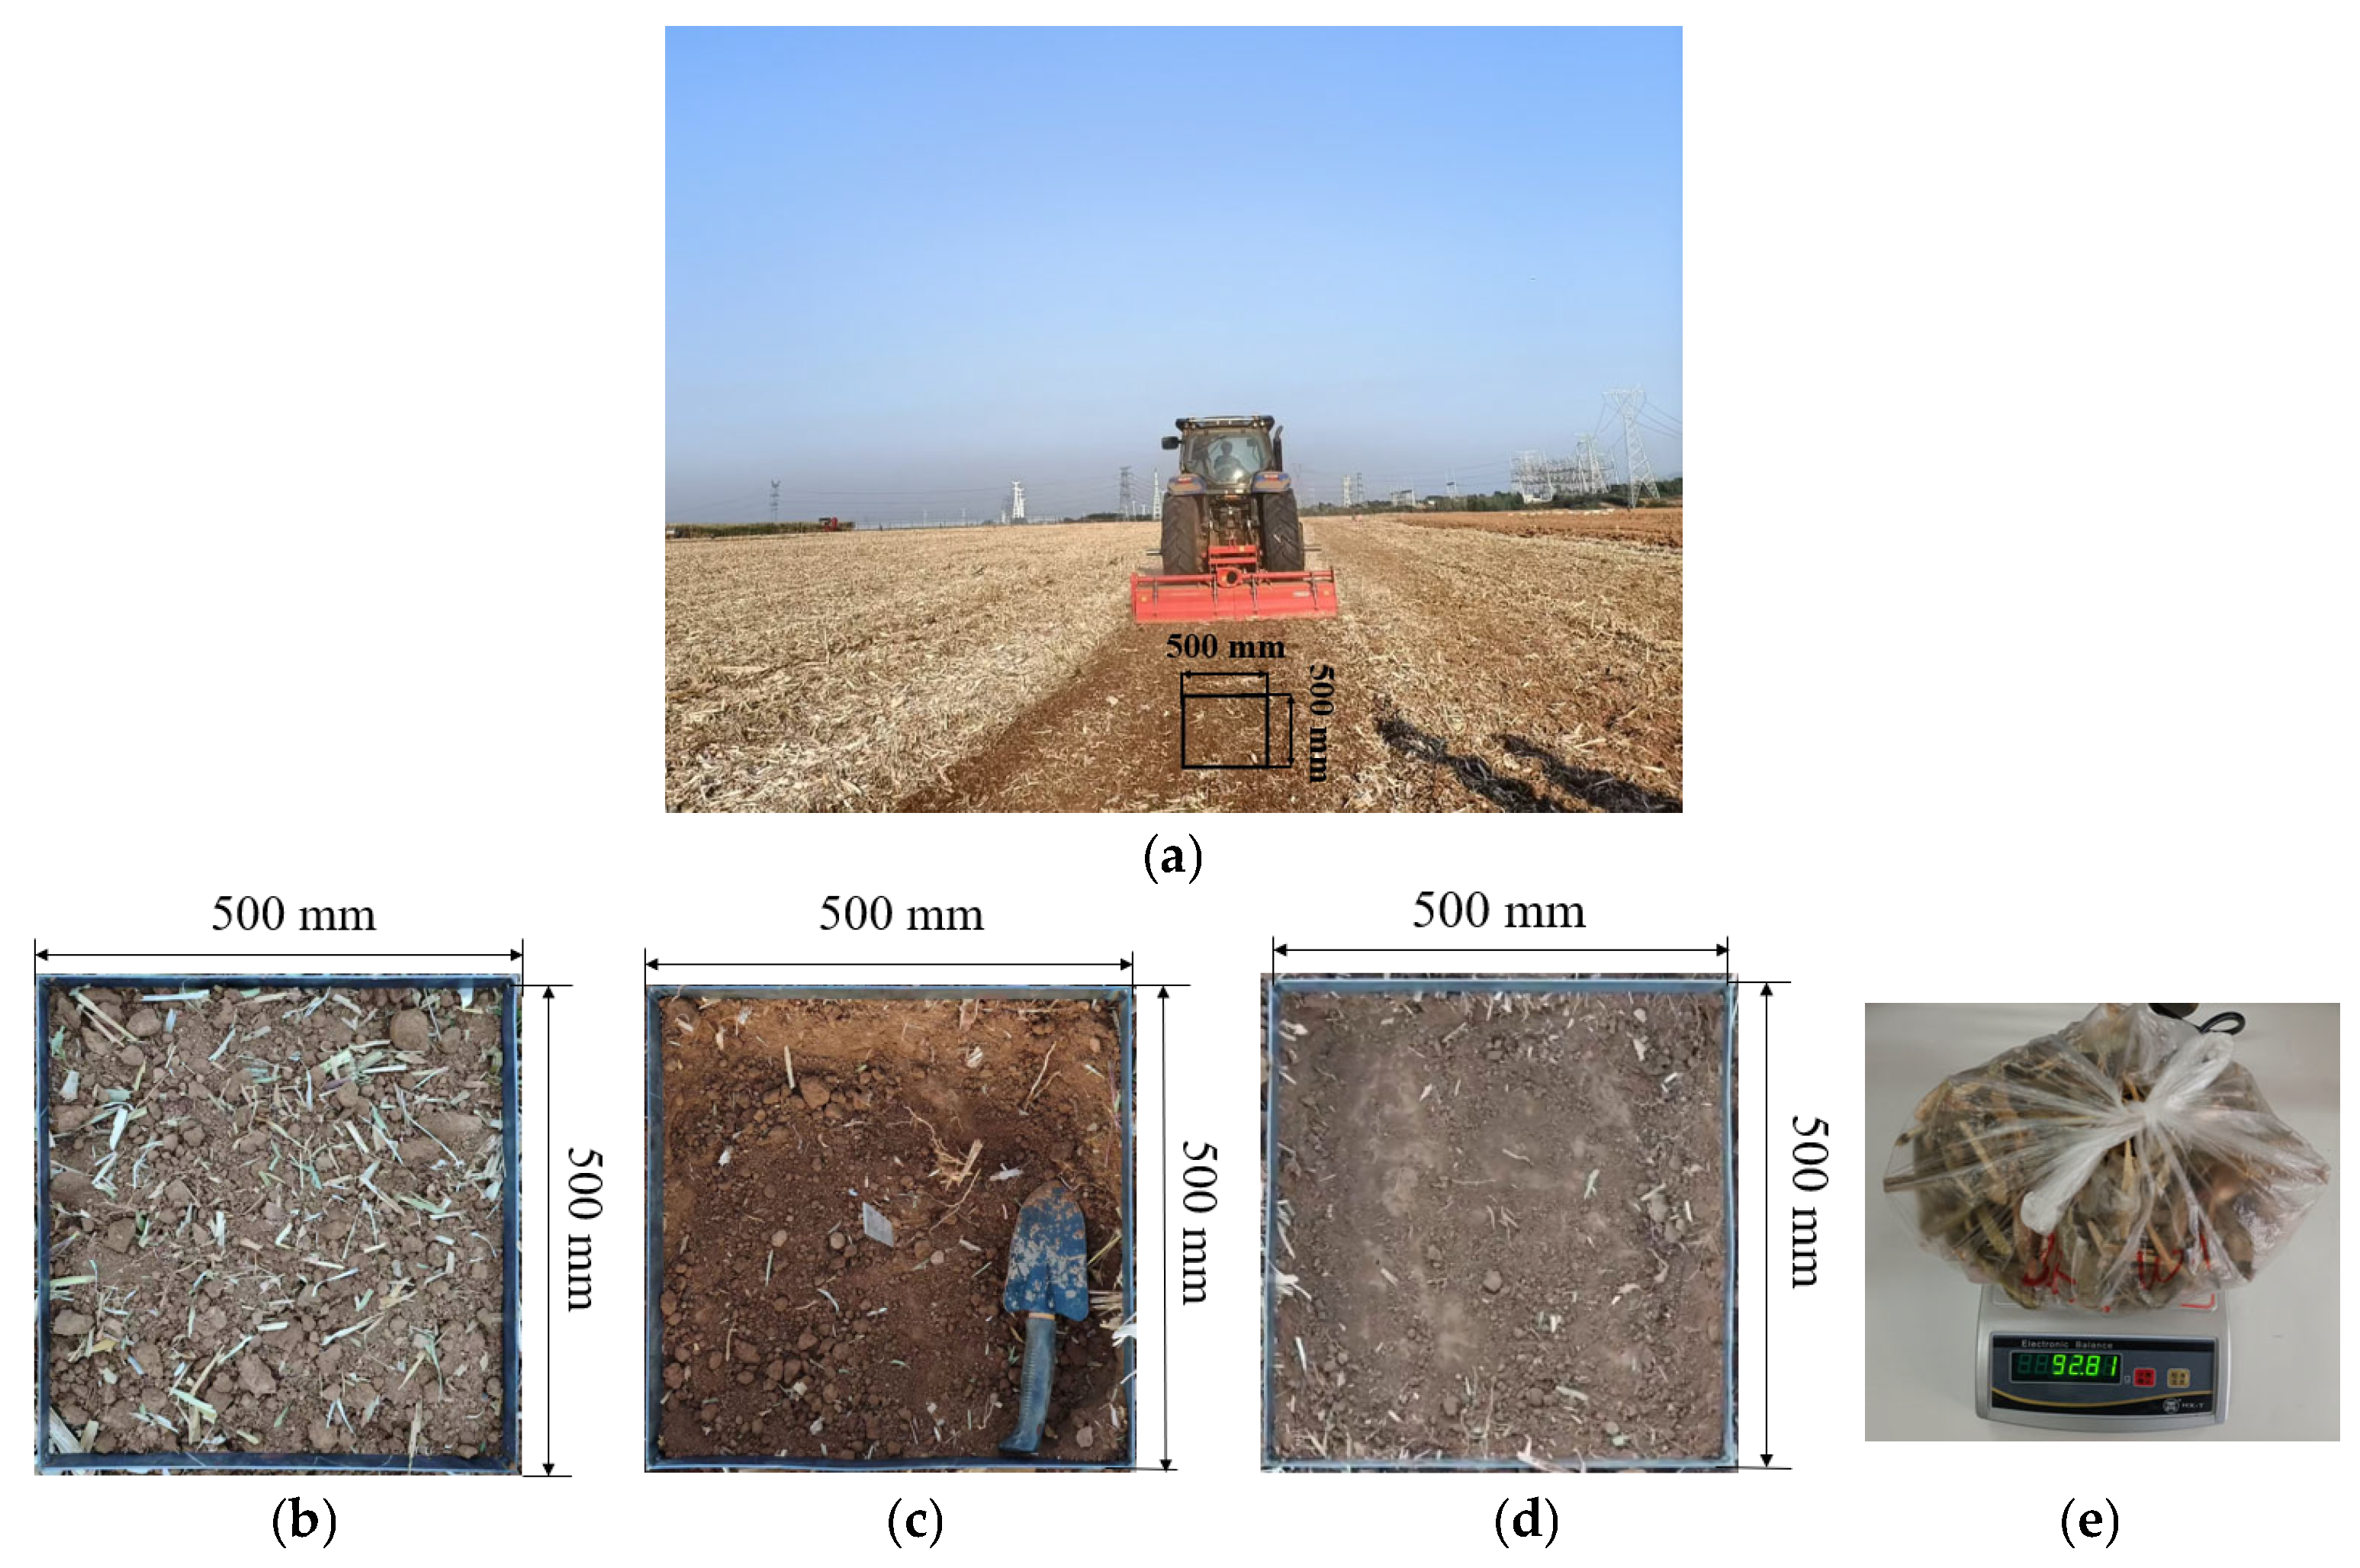
3.4. Field Experiment

Field experiments were conducted at the Henan University of Science and Technology experimental field (112.45° E, 34.62° N) in Luoyang, Henan Province, China, to evaluate the operational performance of the soil-mixing blade system (Figure 15). The experimental site is a typical corn–wheat rotation zone, with a corn straw density of 1.2 kg/m2. The soil was classified as yellow cinnamon soil. The penetration resistance in the tillage layer measured 1187.44 kPa when using an IN-JSD-1 digital soil penetrometer. Soil samples were collected using a cutting ring (100 cm3), and the fresh weight of the soil samples was measured before oven-drying at 105 °C for 24 h until a constant weight was achieved. The soil moisture content was determined to be 17.3%, with a bulk density of 1.00 g/cm3. For stratified straw mass measurement, five sampling quadrats (500 mm × 500 mm × 200 mm) were selected using the five-point sampling method. The test results showed that the straw burial rate reached 96.54%, with straw accounting for 34.13% in the seeding layer. The errors between the simulation and field tests were 0.52% and 3.28%, respectively. According to agricultural engineering validation standards, a relative error of less than 10% between the simulation and field results indicates model reliability. Thus, the experimental results meet the requirements [32].

4. Conclusions

This study designed a mixing blade for corn straw incorporation. The working performance of the blade was theoretically analyzed and experimentally validated through structural design, numerical simulation, model analysis, and field tests. The results demonstrate that the designed mixing blade meets the performance target requirements, with specific conclusions regarding this as follows:
(1)
The mechanical structure of the soil-mixing blade was designed based on the characteristic parameters of its cutting-edge curve. Through the theoretical analysis of key operational factors—including the tillage depth, the conditions for the soil-mixing blade to minimize straw percentage in the seeding layer, and the conditions for the soil-mixing blade to minimize straw back-throwing—a mathematical model of the mixing blade’s working process was established.
(2)
A discrete element model of the soil-mixing blade–soil–corn straw interaction was developed, employing the Hertz–Mindlin with bonding contact model to simulate soil fragmentation dynamics. The corn straw morphology was represented by spherical particle assemblies, enabling the dynamic simulation of soil breakage and straw migration and burial during the operation of the soil-mixing blade. This provided an effective tool for analyzing blade performance.
(3)
Using the straw burial rate and straw percentage in the seeding layer as evaluation metrics, the Box–Behnken design yielded the soil-mixing blade’s optimal parameter combination, which was a bending line angle α of 55°, a bending angle β of 100.01°, a side angle δ of 130°, a tangential edge height h of 40.05 mm, and bending radius r of 28.67 mm. Simulation results predicted a straw burial rate of 96.04% and a straw percentage in the seeding layer of 35.25%, while field tests recorded a straw burial rate of 96.54% and a straw percentage in the seeding layer of 34.13%.
(4)
The velocity distribution of straw movement across different soil layers was analyzed during the operation of both the soil-mixing and rotary blades. By tracking motion trajectories, the vertical displacement of straw within the soil layer was quantified. From a kinematic perspective, this study elucidated the mechanism by which the soil-mixing blade reduces straw back-throwing and enhances straw transfer to deeper soil layers. These findings validate the experimental results and provide theoretical support for optimizing the operational performance of soil-mixing blades.
This study focuses on analyzing the mechanism by which the soil-mixing blade distributed corn straw within soil vertical profiles. Subsequent research will investigate the blade’s uniformity mechanism across different soil layers and examine how operational parameters affect distribution uniformity. After finalizing the blade structure, further studies will explore blade coatings, along with their friction and wear performance characteristics.

Author Contributions

Conceptualization, H.D. and H.L.; methodology, H.D.; software, Q.W.; validation, H.D., Q.W., and M.W.; formal analysis, Q.W.; investigation, Q.W. and M.W.; resources, X.J.; data curation, Q.W.; writing—original draft preparation, Q.W.; writing—review and editing, H.D.; visualization, H.D. and H.H.; supervision, C.Z. and F.D.; project administration, C.Z.; funding acquisition, X.J. All authors have read and agreed to the published version of the manuscript.

Funding

This research was funded by the Major Science and Technology Special Project of Henan Province, grant number 231100110200; the Science and Technology Research and Development Program Project of Henan Province, grant number 252102111182; and the National Natural Science Foundation of China, grant number 52405263.

Institutional Review Board Statement

Not applicable.

Data Availability Statement

The data presented in this study are available upon request from the corresponding author. The data are not publicly available as they are part of ongoing research and sharing them prematurely could compromise the results or findings.

Conflicts of Interest

The authors declare no conflicts of interest.

Abbreviations

The following abbreviations are used in this manuscript:
DEMDiscrete Element Method
RGBRed Green Blue
HRCRockwell Hardness C Scale
ANOVAAnalysis of Variance

References

  1. Guo, S.H. How does Straw Burning Affect Urban Air Quality in China? Am. J. Agric. Econ. 2021, 103, 1122–1140. [Google Scholar] [CrossRef]
  2. He, L.Y.; Duanmu, L.J.; Guo, L.; Qin, Y.; Shi, B.W.; Liang, L.; Chen, W.W. Determining an Optimal Combination of Meteorological Factors to Reduce the Intensity of Atmospheric Pollution During Prescribed Straw Burning. Agriculture 2025, 15, 279. [Google Scholar] [CrossRef]
  3. Li, Y.; Abalos, D.; Arthur, E.; Feng, H.; Siddique, K.H.M.; Chen, J. Different Straw Return Methods Have Divergent Effects on Winter Wheat Yield, Yield Stability, and Soil Structural Properties. Soil Tillage Res. 2024, 238, 105992. [Google Scholar] [CrossRef]
  4. Jiang, L.M.; Ning, A.R.; Liu, M.; Zhu, Y.H.; Huang, J.W.; Guo, Y.G.; Feng, W.Z.; Fu, D.P.; Wang, H.B.; Wang, J.L. Effects of Tillage Practices on Soil Properties and Maize Yield in Different Types of Soda Saline–Alkali Soils. Agriculture 2025, 15, 542. [Google Scholar] [CrossRef]
  5. Cui, H.; Luo, Y.; Chen, J.; Jin, M.; Li, Y.; Wang, Z.L. Straw Return Strategies to Improve Soil Properties and Crop Productivity in a Winter Wheat-summer Maize Cropping System. Eur. J. Agron. 2022, 133, 126436. [Google Scholar] [CrossRef]
  6. Li, S.; Li, X.S.; Zhu, W.L.; Chen, J.; Tian, X.H.; Shi, J.G. Does the Straw Return Strategy Influence Soil Carbon Sequestration and Labile Fractions? Agron. J. 2019, 111, 897–906. [Google Scholar] [CrossRef]
  7. Liu, J.; Chen, Y.; Kushwaha, R.L. Effect of Tillage Speed and Straw Length on Soil and Straw Movement by a Sweep. Soil Tillage Res. 2010, 109, 9–17. [Google Scholar] [CrossRef]
  8. Akbolat, D.; Ekinci, K. Rotary Tiller Velocity Effects on the Distribution of Wheat (Triticum aestivum) Residue in The Soil Profile. N. Z. J. Crop Hortic. Sci. 2008, 36, 247–252. [Google Scholar] [CrossRef]
  9. Yang, Q.L.; Chen, G.B.; Xie, L.J.; Wang, Q.J.; He, J.; Li, H.W. Design and Experiment of Telescopic-Finger Corn Stalk Rotary Burying Machine. Trans. Chin. Soc. Agric. Mach. 2020, 51, 35–43. [Google Scholar]
  10. Wang, H.S. Design and Experiment of Rotary Blade-Finger Combination Straw Returning Machine. Master’s Thesis, Northeast Agricultural University, Harbin, China, 2023. [Google Scholar] [CrossRef]
  11. Liang, F.; Deng, W.H.; Luo, L.Q.; Wang, J.K.; Zhan, S.P. Design and Optimization of Counter-rotating Double-spiral Straw Burial Device for Rapeseed Straw Returning. Trans. Chin. Soc. Agric. Eng. 2023, 39, 10–17. [Google Scholar] [CrossRef]
  12. Wang, X.Z.; Gao, P.Y.; Yue, B.; Shen, H.; Fu, Z.L.; Zheng, Z.Q.; Zhu, R.X.; Huang, Y.X. Optimisation of Installation Parameters of Subsoiler’ Wing Using the Discrete Element Method. Comput. Electron. Agric. 2019, 162, 523–530. [Google Scholar] [CrossRef]
  13. Zeng, Z.W.; Ma, X.; Chen, Y.; Qi, L. Modelling Residue Incorporation of Selected Chisel Ploughing Tools Using The Discrete Element Method (DEM). Soil Tillage Res. 2020, 197, 14. [Google Scholar] [CrossRef]
  14. Zhao, Z.; Hou, J.; Guo, P.; Xia, C.; Yan, H.P.; Wang, D. Analysis of Soil–Straw Movement Behavior in Saline–Alkali Soil Under Dual-Axis Rotary Tillage Based on EDEM. Agriculture 2025, 15, 337. [Google Scholar] [CrossRef]
  15. Zhang, X.Y.; Zhang, L.X.; Hu, X.; Wang, H.; Shi, X.B.; Ma, X. Simulation of Soil Cutting and Power Consumption Optimization of a Typical Rotary Tillage Soil Blade. Appl. Sci. 2022, 12, 8177. [Google Scholar] [CrossRef]
  16. Li, S.T.; Chen, X.B.; Chen, W.; Zhu, S.P.; Li, Y.W.; Yang, L.; Xie, S.Y.; Yang, M.J. Soil-cutting Simulation and Parameter Optimization of Handheld Tiller’s Rotary Blade by Smoothed Particle Hydrodynamics Modelling and Taguchi Method. J. Clean. Prod. 2018, 179, 55–62. [Google Scholar] [CrossRef]
  17. Zhang, J.; Xia, M.; Chen, W.; Yuan, D.; Wu, C.Y.; Zhu, J.P. Simulation Analysis and Experiments for Blade-Soil-Straw Interaction Under Deep Ploughing Based on the Discrete Element Method. Agriculture 2023, 13, 136. [Google Scholar] [CrossRef]
  18. Du, J.; Heng, Y.F.; Zheng, K.; Luo, C.M.; Zhu, Y.H.; Zhang, J.; Xia, J.F. Investigation of The Burial and Mixing Performance of a Rotary Tiller Using Discrete Element Method. Soil Tillage Res. 2022, 220, 105349. [Google Scholar] [CrossRef]
  19. Zhao, Z.; Wang, D.W.; Shang, S.Q.; Guo, P.; Gao, Z.H.; Xia, C.; Yan, H.P.; Hou, J.L. Design and Test of a Dual-axis Layered Rotary Tillage Stubble Exterminator in Saline-alkali Land Based on Discrete Elements. Int. J. Agric. Biol. Eng. 2024, 17, 163–175. [Google Scholar] [CrossRef]
  20. Asaf, Z.; Rubinstein, D.; Shmulevich, I. Determination of Discrete Element Model Parameters Required for Soil Tillage. Soil Tillage Res. 2007, 92, 227–242. [Google Scholar] [CrossRef]
  21. Ono, I.; Nakashima, H.; Shimizu, H.; Miyasaka, J.; Ohdoi, K. Investigation of Elemental Shape for 3D DEM Modeling of Interaction Between Soil and a Narrow Cutting Tool. J. Terramech. 2013, 50, 265–276. [Google Scholar] [CrossRef]
  22. Guo, Q.; Xia, H.H. A Review of the Discrete Element Method/Modelling in Agricultural Engineering. J. Agric. Eng. 2023, 54, 1534. [Google Scholar] [CrossRef]
  23. Zeng, Z.W.; Chen, Y. Simulation of Straw Movement by Discrete Element Modelling of Straw-Sweep-Soil Interaction. Biosyst. Eng. 2019, 180, 25–35. [Google Scholar] [CrossRef]
  24. Zhao, Z.H.; Wu, M.L.; Jiang, X.H. A Review of Contact Models’ Properties for Discrete Element Simulation in Agricultural Engineering. Agriculture 2024, 14, 238. [Google Scholar] [CrossRef]
  25. Ucgul, M.; Fielke, J.M.; Saunders, C. Three-dimensional Discrete Element Modelling (DEM) of Tillage: Accounting for Soil Cohesion and Adhesion. Biosyst. Eng. 2015, 129, 298–306. [Google Scholar] [CrossRef]
  26. Zhao, S.H.; Gao, L.L.; Yuan, Y.W.; Hou, L.T.; Zhang, X.; Yang, Y.Q. Movement Patterns of Corn Straw in Subsoiling Operations Based on Discrete Element Method. Trans. Chin. Soc. Agric. Eng. 2021, 37, 53–62. [Google Scholar] [CrossRef]
  27. Zhao, S.H.; Liu, H.P.; Yang, L.L.; Gao, L.L.; Yang, Y.Q. Design and Discrete Element Simulation of Interactive Layered Subsoiler for Rice Straw Returning. Trans. Chin. Soc. Agric. Mach. 2021, 52, 75–87. [Google Scholar] [CrossRef]
  28. Qi, L. Design and Experimental Study of Corn Stalk Furrow-Strip Mixing and Burying Machine. Master’s Thesis, Shenyang Agricultural University, Liaoning Province of China, Shenyang, China, 2019. [Google Scholar] [CrossRef]
  29. Liu, P.; He, J.; Zhang, Z.Q.; Zhang, Z.G.; Lin, H. Analysis and Experiment of Crushed Straw Motion Characteristics in Straw Returning Machine Based on CFD-DEM Coupling Method. Trans. Chin. Soc. Agric. Mach. 2020, 51, 244–253. [Google Scholar] [CrossRef]
  30. He, R.Y.; Duan, Q.F.; Chen, X.X. Discrete Element Analysis of Straw Spatial Distribution Quality in Rotary Tillage Straw Returning. Trans. Chin. Soc. Agric. Mach. 2022, 53, 44–53. [Google Scholar] [CrossRef]
  31. Zhou, H.; Zhang, C.; Zhang, W.; Yang, Q.; Li, D.; Liu, Z.; Xia, J. Evaluation of Straw Spatial Distribution After Straw Incorporation into Soil for Different Tillage Tools. Soil Tillage Res. 2020, 196, 104440. [Google Scholar] [CrossRef]
  32. Razavizadeh, N.; Zare, D.; Nassiri, S.M.; Karim, A.; Eslami, M.; Nematollahi, M.A. Experimental Study and Numerical Simulation of Resistance to Airflow in a Storage Bin of Rough Rice with Three Inlet Duct Configurations. Biosyst. Eng. 2023, 225, 118–131. [Google Scholar] [CrossRef]
Figure 1. Soil-mixing blade working process. (a) Overall working diagram. (b) Operational schematic diagram: (1) tractor; (2) soil-mixing equipment; (3) corn straw; (4) soil; (5) soil-mixing blade; (6) spiked roller; (7) untilled soil; (8) tilled soil.
Agriculture 15 01558 g001
Figure 2. Soil-mixing blade structure.
Agriculture 15 01558 g002
Figure 3. The endpoint trajectory of a soil-mixing blade.
Agriculture 15 01558 g003
Figure 4. Variation in the angle between the soil-mixing blade edge and the ground surface.
Agriculture 15 01558 g004
Figure 5. Force analysis of corn straw.
Agriculture 15 01558 g005
Figure 6. Expanded view of the double-helix arrangement of the soil-mixing blade.
Agriculture 15 01558 g006
Figure 7. Corn straw model.
Agriculture 15 01558 g007
Figure 8. Simulation process: (1) corn straw; (2) mudguard; (3) suppressing roller; (4) soil.
Agriculture 15 01558 g008
Figure 9. Straw burial process: (1) corn straw; (2) soil-mixing blade roller; (3) mudguard; (4) suppressing roller.
Agriculture 15 01558 g009
Figure 10. Effect of single factors on straw burial rate and straw percentage in the seeding layer. (a) Effect of bending angle on straw burial rate and straw percentage in seeding layer. (b) Effect of side angle on straw burial rate and straw percentage in seeding layer. (c) Effect of bending line angle on straw burial rate and straw percentage in seeding layer. (d) Effect of tangential edge height on straw burial rate and straw percentage in seeding layer. (e) Effect of bending radius on straw burial rate and straw percentage in seeding layer.
Agriculture 15 01558 g010
Figure 11. Response surface analysis of the effects of various experimental factors on straw burial rate. (a) The response surface analysis of straw burial rate with respect to the bending angle and side angle (AB). (b) The response surface analysis of straw burial rate with respect to the bending angle and tangential edge height (AD). (c) The response surface analysis of straw burial rate with respect to the side angle and the bending line angle (BC). (d) The response surface analysis of straw burial rate with respect to the bending line angle and the bending radius (CE). The blue, green, yellow, and red areas sequentially represent increasing straw burial rates.
Agriculture 15 01558 g011
Figure 12. Response surface analysis of the effects of various experimental factors on the straw percentage in the seeding layer. (a) Response surface analysis of straw percentage in the seeding layer with respect to the bending angle and bending radius (AE). (b) Response surface analysis of straw percentage in the seeding layer with respect to the side angle and bending line angle (BC). (c) Response surface analysis of straw percentage in the seeding layer with respect to the side angle and the bending radius (BE). The blue, green, yellow, and red areas sequentially represent increasing percentages of straw in the seeding layer.
Agriculture 15 01558 g012
Figure 13. Comparison of corn straw velocity charts: (1) soil surface; (2) sowing layer; (3) maximum tillage depth; (I) During the stage of the cutter entering the soil to the maximum tillage depth; (II) During the soil penetration phase from the maximum tillage depth to the seeding layer; (III) From the sowing layer to the stage of detachment from the soil.
Agriculture 15 01558 g013
Figure 14. Comparison of the vertical displacement of corn straw.
Agriculture 15 01558 g014
Figure 15. Field experiment using the soil-mixing blade: (a) soil block sampling; (b) surface; (c) 0–50 mm soil layer; (d) 50–150 mm soil layer; (e) straw weighing.
Agriculture 15 01558 g015
Table 1. Basic parameters of the simulation model.
SymbolSimulation ParametersValue
SoilPoisson’s ratio0.39 [27]
Density (kg·m−3)1450 [27]
Shear modulus (Pa)1 × 10⁶ [27]
Particle diameter (mm)12 [27]
Corn strawPoisson’s ratio0.4 [28]
Density (kg·m−3)241 [28]
Shear modulus (Pa)1.37 × 10⁸ [29]
Straw length (mm)50
65MnPoisson’s ratio0.3 [26]
Density (kg·m−3)7865 [26]
Shear modulus (Pa)7.9 × 10¹⁰ [30]
Table 2. Contact parameters of the simulation model.
Simulation ParametersValue
Coefficient of restitution of soil–soil0.6
Coefficient of static friction of soil–soil0.57 [27]
Coefficient of rolling friction of soil–soil0.14
Coefficient of restitution of soil–corn straw0.5 [30]
Coefficient of static friction of soil–corn straw0.5 [30]
Coefficient of rolling friction of soil–corn straw0.05 [30]
Coefficient of restitution of soil–65Mn0.729 [27]
Coefficient of static friction of soil–65Mn0.69
Coefficient of rolling friction of soil–65Mn0.107 [27]
Coefficient of restitution of corn straw–corn straw0.182 [29]
Coefficient of static friction of corn straw–corn straw0.237 [29]
Coefficient of rolling friction of corn straw–corn straw0.0782 [29]
Coefficient of restitution of corn straw–65Mn0.729 [29]
Coefficient of static friction of corn straw–65Mn0.342 [29]
Coefficient of rolling friction of corn straw–65Mn0.01 [27]
Normal stiffness of bond (N·m−3)3.4 × 10⁸ [26]
Shear stiffness of bond (N·m−3)1.5 × 10⁸ [26]
Critical normal stress (Pa)2 × 10⁵ [26]
Critical shear stress (Pa)6.8 × 10⁴ [26]
Bond radius (mm)6.79 [27]
Table 3. Range of parameter levels for each factor.
Codeβ (°)δ (°)α (°)h (mm)r (mm)
185120154010
2100130255020
3115140356030
4130150457040
5145160558050
Table 4. Box–Behnken experimental factor coding.
CodeFactor
Bending
Angle
A (°)
Side Angle B (°)Bending Line Angle
C (°)
Tangential Edge Height D (mm)Bending Radius
E (mm)
−1100130354020
0115140455030
+1130150556040
Table 5. Box–Behnken test plan and results.
No.FactorStraw Burial Rate
Y1 (%)
Straw Percentage in the Seeding Layer
Y2 (%)
ABCDE
1−1−100096.9937.74
21−100094.3738.37
3−1100094.0143.74
41100095.2648.3
500−1−1096.1340.27
6001−1096.0138.17
700−11096.8937.12
80011095.8338.54
90−100−195.4439.4
100100−194.4947.91
110−100194.9641.09
120100195.3743.45
13−10−10096.0436.05
1410−10095.5339.04
15−1010095.3839.57
161010094.3643.94
17000−1−194.7540.54
180001−194.8739.87
19000−1194.6942.77
200001196.1339.11
210−1−10095.837.36
2201−10097.8841.34
230−110097.5636.76
240110093.8648.36
25−100−1096.2540.28
26100−1094.1744.48
27−1001095.7740.07
281001096.1338.53
2900−10−195.8639.35
300010−196.0439.69
3100−10196.9938.59
320010195.4438.3
33−1000−195.0242.77
341000−194.1343.37
35−1000195.4437.26
361000195.2646.1
370−10−1095.1837.38
38010−1094.3146.66
390−101096.5137.31
400101096.0746.92
410000095.3440.2
420000094.837.35
430000095.2137.52
440000095.139.85
450000094.9339.92
460000094.8638.92
Table 6. Variance analysis of straw burial rate.
Source of VarianceMean SquareDegrees of FreedomSum of SquaresF Valuep Value
Model34.34201.7211.64<0.0001 ***
A2.0212.0213.720.0011 ***
B1.9311.9313.10.0013 ***
C2.7612.7618.690.0002 ***
D2.8112.8119.080.0002 ***
E0.846410.84645.740.0244 **
AB3.7413.7425.39<0.0001 ***
AC0.06510.0650.44100.5172 *
AD1.4911.4910.090.0039 ***
AE0.12610.1260.85460.3641
BC8.3518.3556.64<0.0001 ***
BD0.046210.04620.31350.5805
BE0.462410.46243.140.0888 *
CD0.220910.22091.50.2324
CE0.748210.74825.070.0333 **
DE0.435610.45362.950.098 *
A20.122610.12260.83160.3705
B20.387210.38722.630.1177
C26.1416.1441.66<0.0001 ***
D21.0511.057.10.0133 **
E20.025810.02580.1750.6793
Residual3.69250.1475
Lack of fit3.46200.17313.850.0701
Pure error0.224650.0449
Total38.0345
Note: * indicates marginally significant differences (0.05 < p < 0.1), ** indicates significant differences (0.01 < p < 0.05), and *** indicates highly significant differences (p < 0.01).
Table 7. Variance analysis of the straw percentage in the seeding layer.
Source of VarianceMean SquareDegrees of FreedomSum of SquaresF Valuep Value
Model4512022.5510.68<0.0001 ***
A37.98137.9817.980.0003 ***
B234.631234.63111.11<0.0001 ***
C12.62112.625.980.0219 **
D10.69110.695.060.0335 **
E2.4312.431.150.294
AB3.8613.861.830.1884
AC0.476110.47610.22550.639
AD8.2418.243.90.0594 *
AE16.97116.978.040.0089 ***
BC14.52114.526.870.0147 **
BD0.027210.02720.01290.9105
BE9.4619.464.480.0445 **
CD3.113.11.470.2372
CE0.099210.09920.0470.8301
DE2.2412.241.060.3134
A217.27117.278.180.0084 ***
B252.25152.2524.74<0.0001 ***
C26.416.43.030.094 *
D21.711.70.80390.3785
E217.19117.198.140.0086 **
Residual52.79252.11
Lack of fit44.87202.241.420.3472
Pure error7.9251.58
Total503.7945
Note: * indicates marginally significant differences (0.05 < p < 0.1), ** indicates significant differences (0.01 < p < 0.05), and *** indicates highly significant differences (p < 0.01).
Disclaimer/Publisher’s Note: The statements, opinions and data contained in all publications are solely those of the individual author(s) and contributor(s) and not of MDPI and/or the editor(s). MDPI and/or the editor(s) disclaim responsibility for any injury to people or property resulting from any ideas, methods, instructions or products referred to in the content.

