
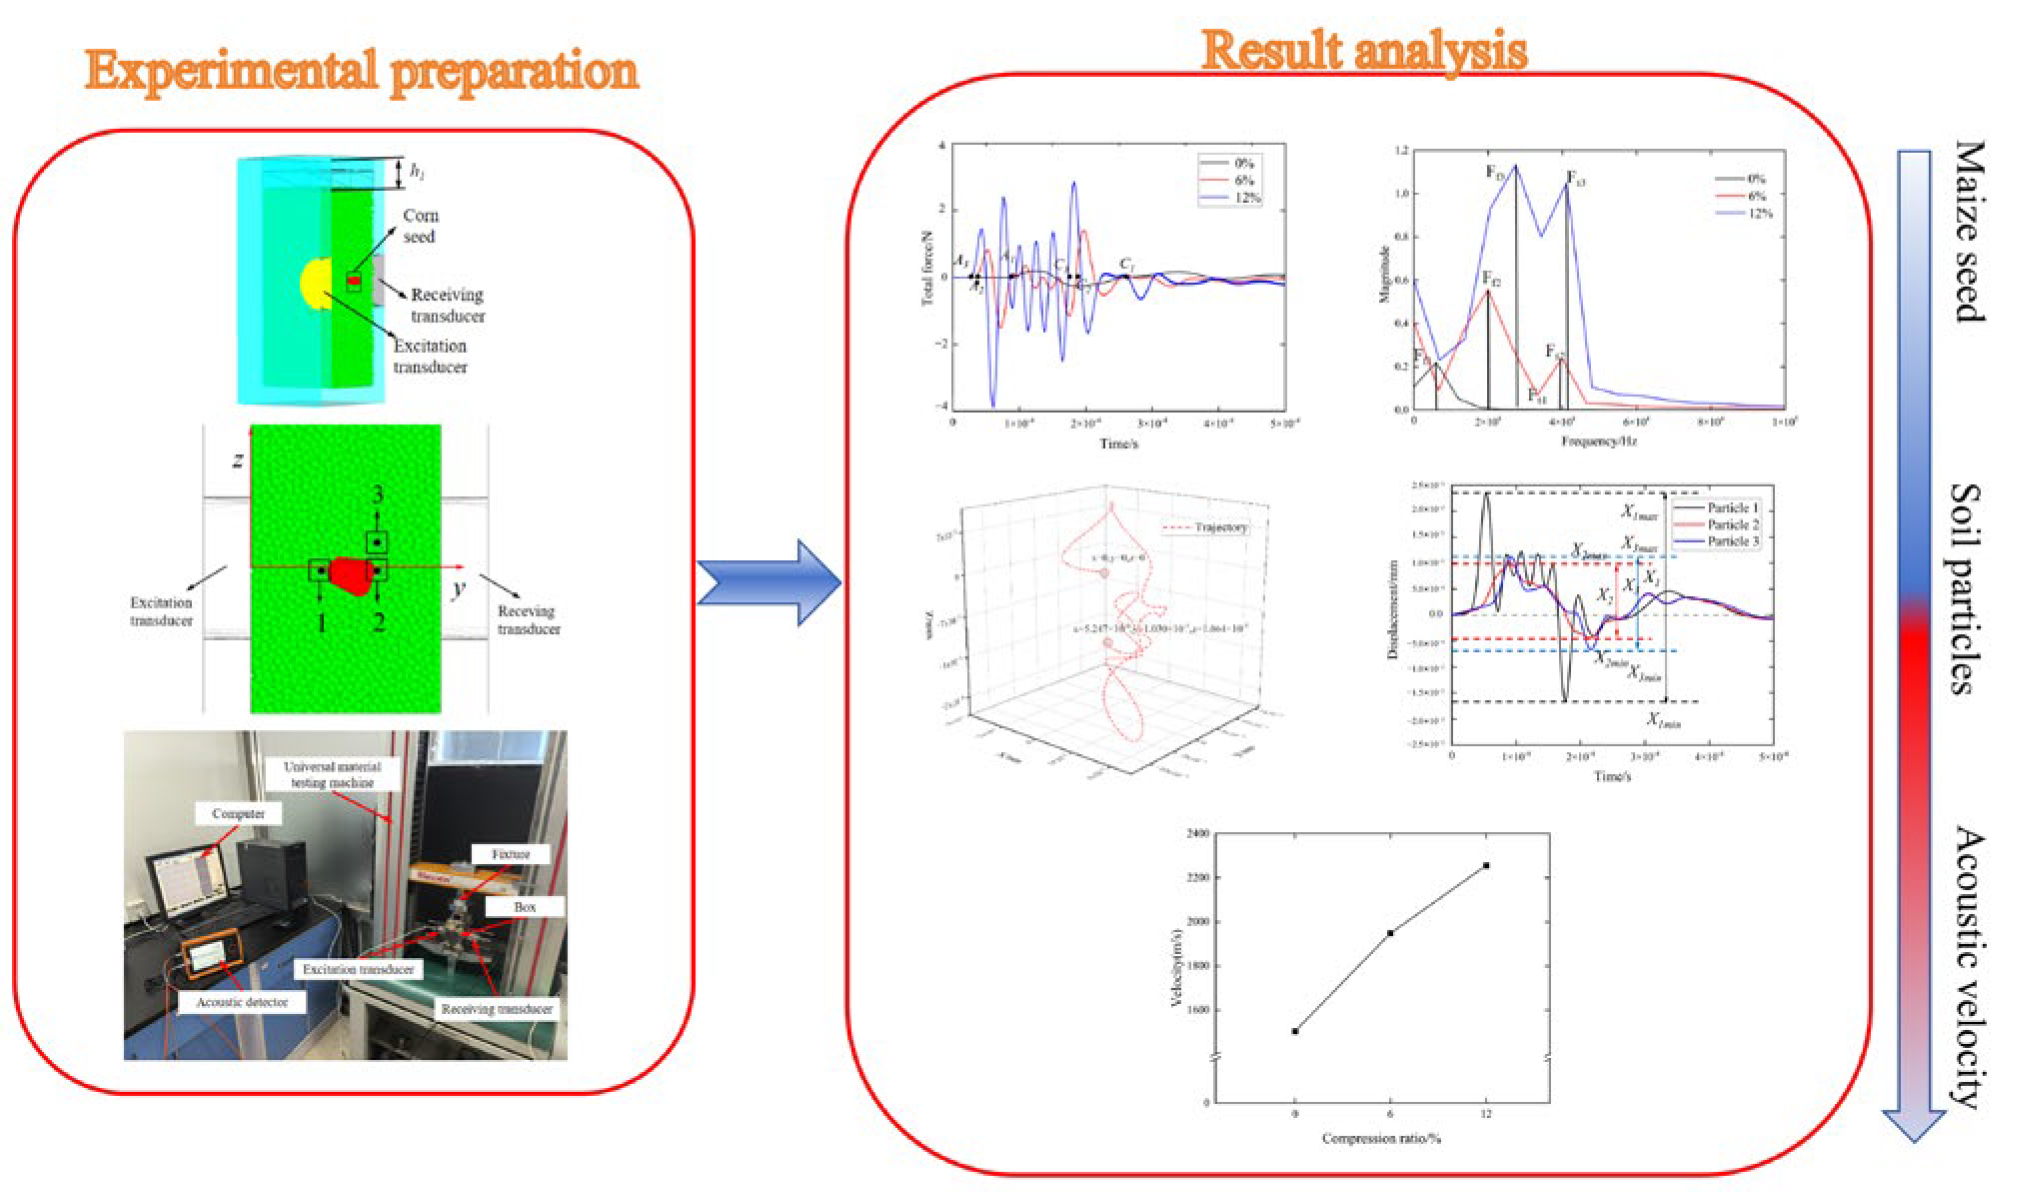
Acoustic Wave Propagation Characteristics of Maize Seed and Surrounding Region with the Double Media of Seed–Soil


 ,
, 
 , and
, and
Abstract
1. Introduction
- (1)
- The acoustic wave propagation characteristics of the maize seed under ultrasonic excitation;
- (2)
- The acoustic wave propagation characteristics of the surrounding region of the maize seed under ultrasonic excitation. This research provides references for ultrasonic detection technology for seed position information after sowing.
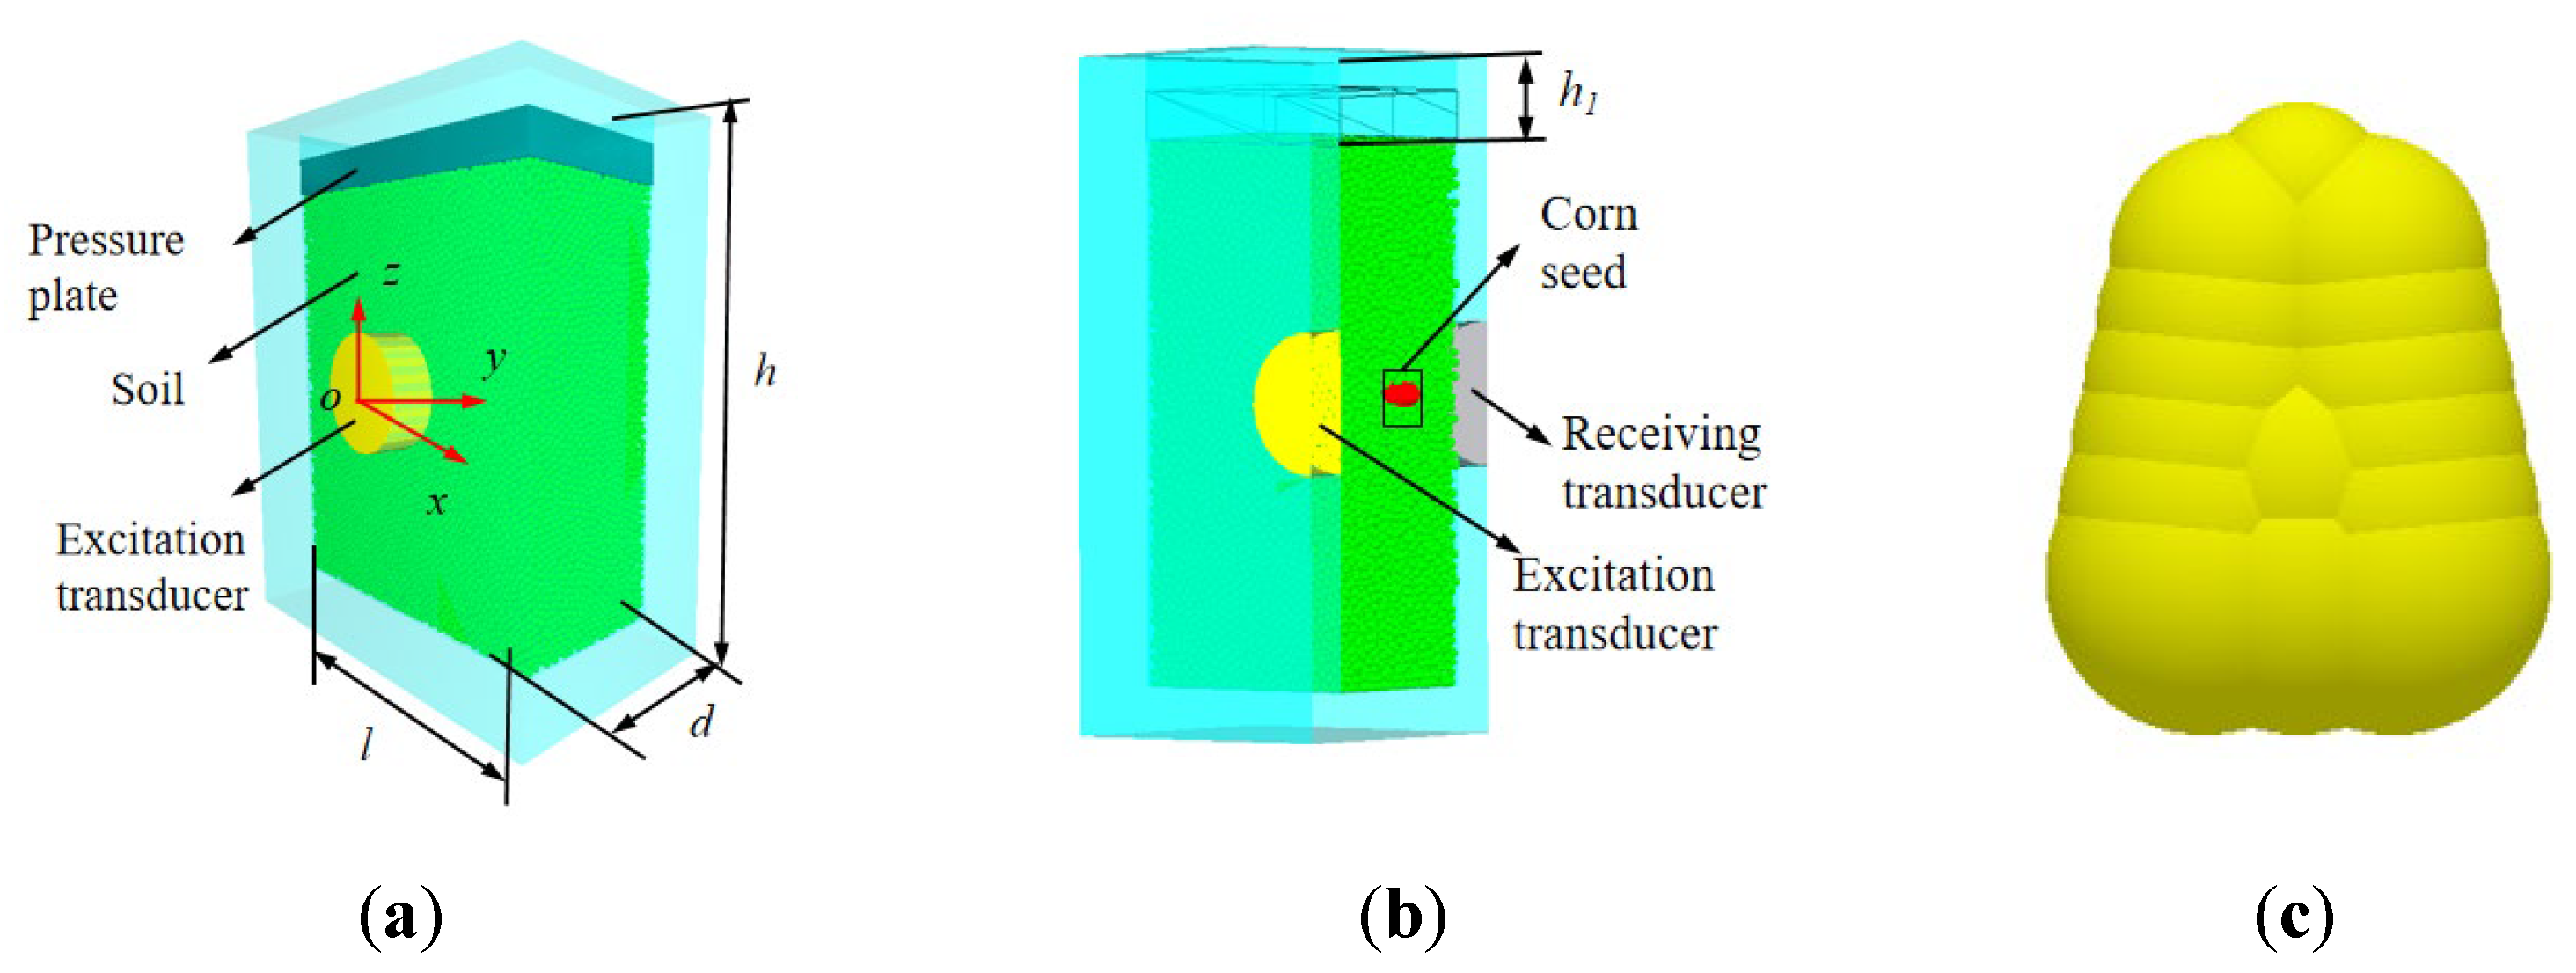
2. Materials and Methods
2.1. DEM Calculation Method
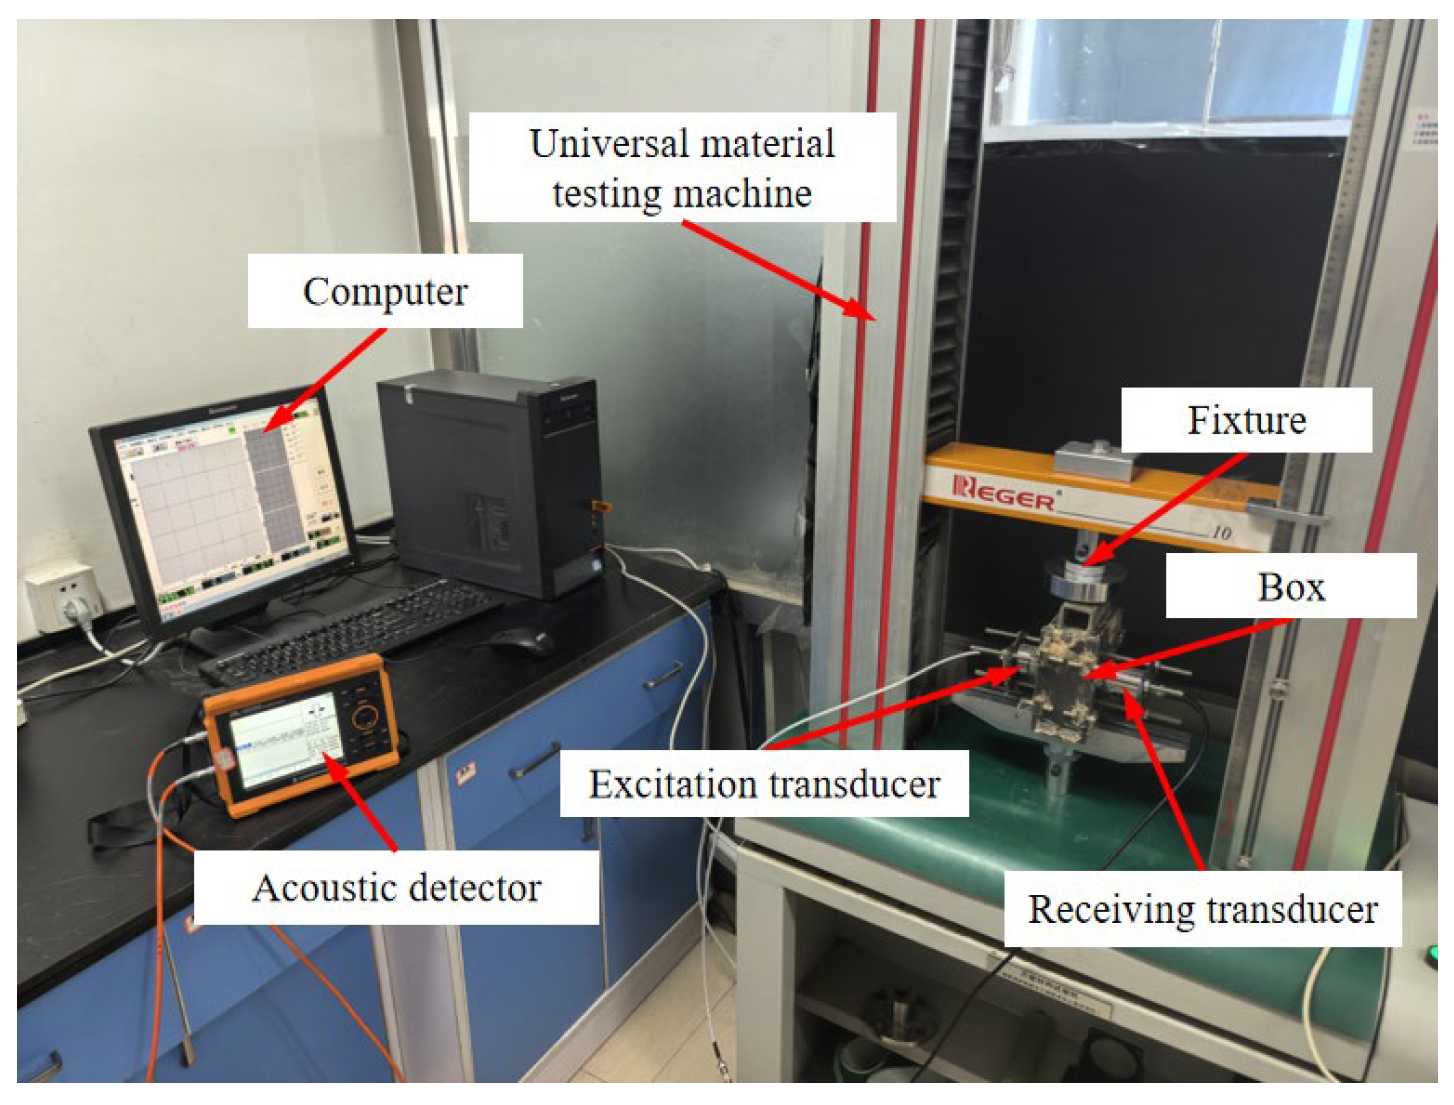
2.2. Test Design and Index Measurement
- (1)
- Composite compression ratio α.
- (2)
- The excitation frequency f and excitation amplitude A1 of the ultrasonic transducer
2.3. Data Measurement and Processing
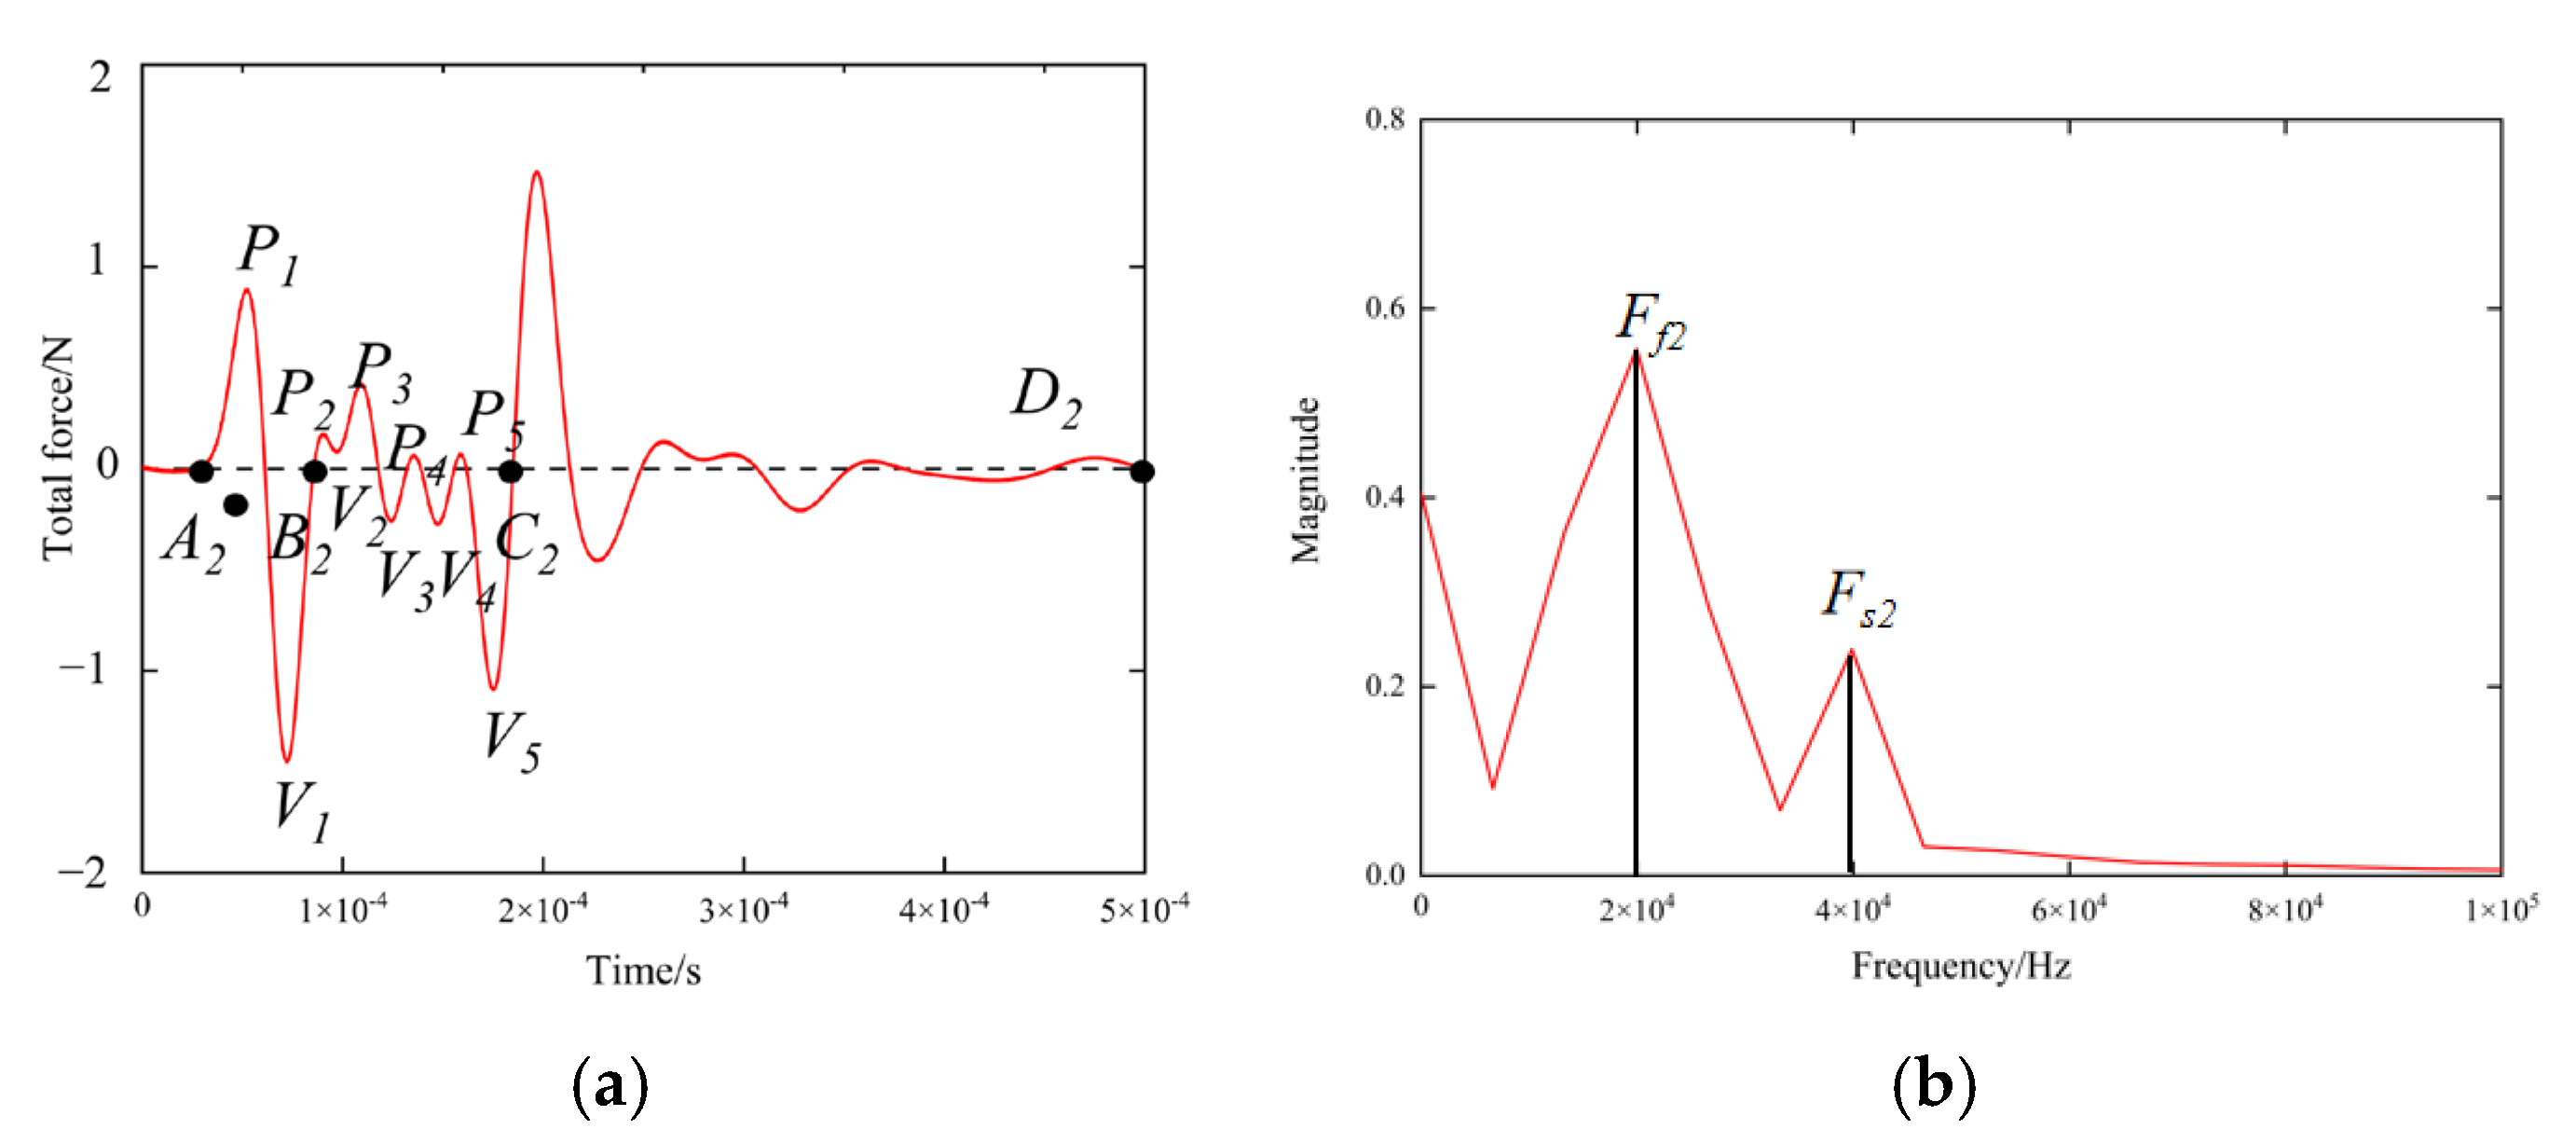
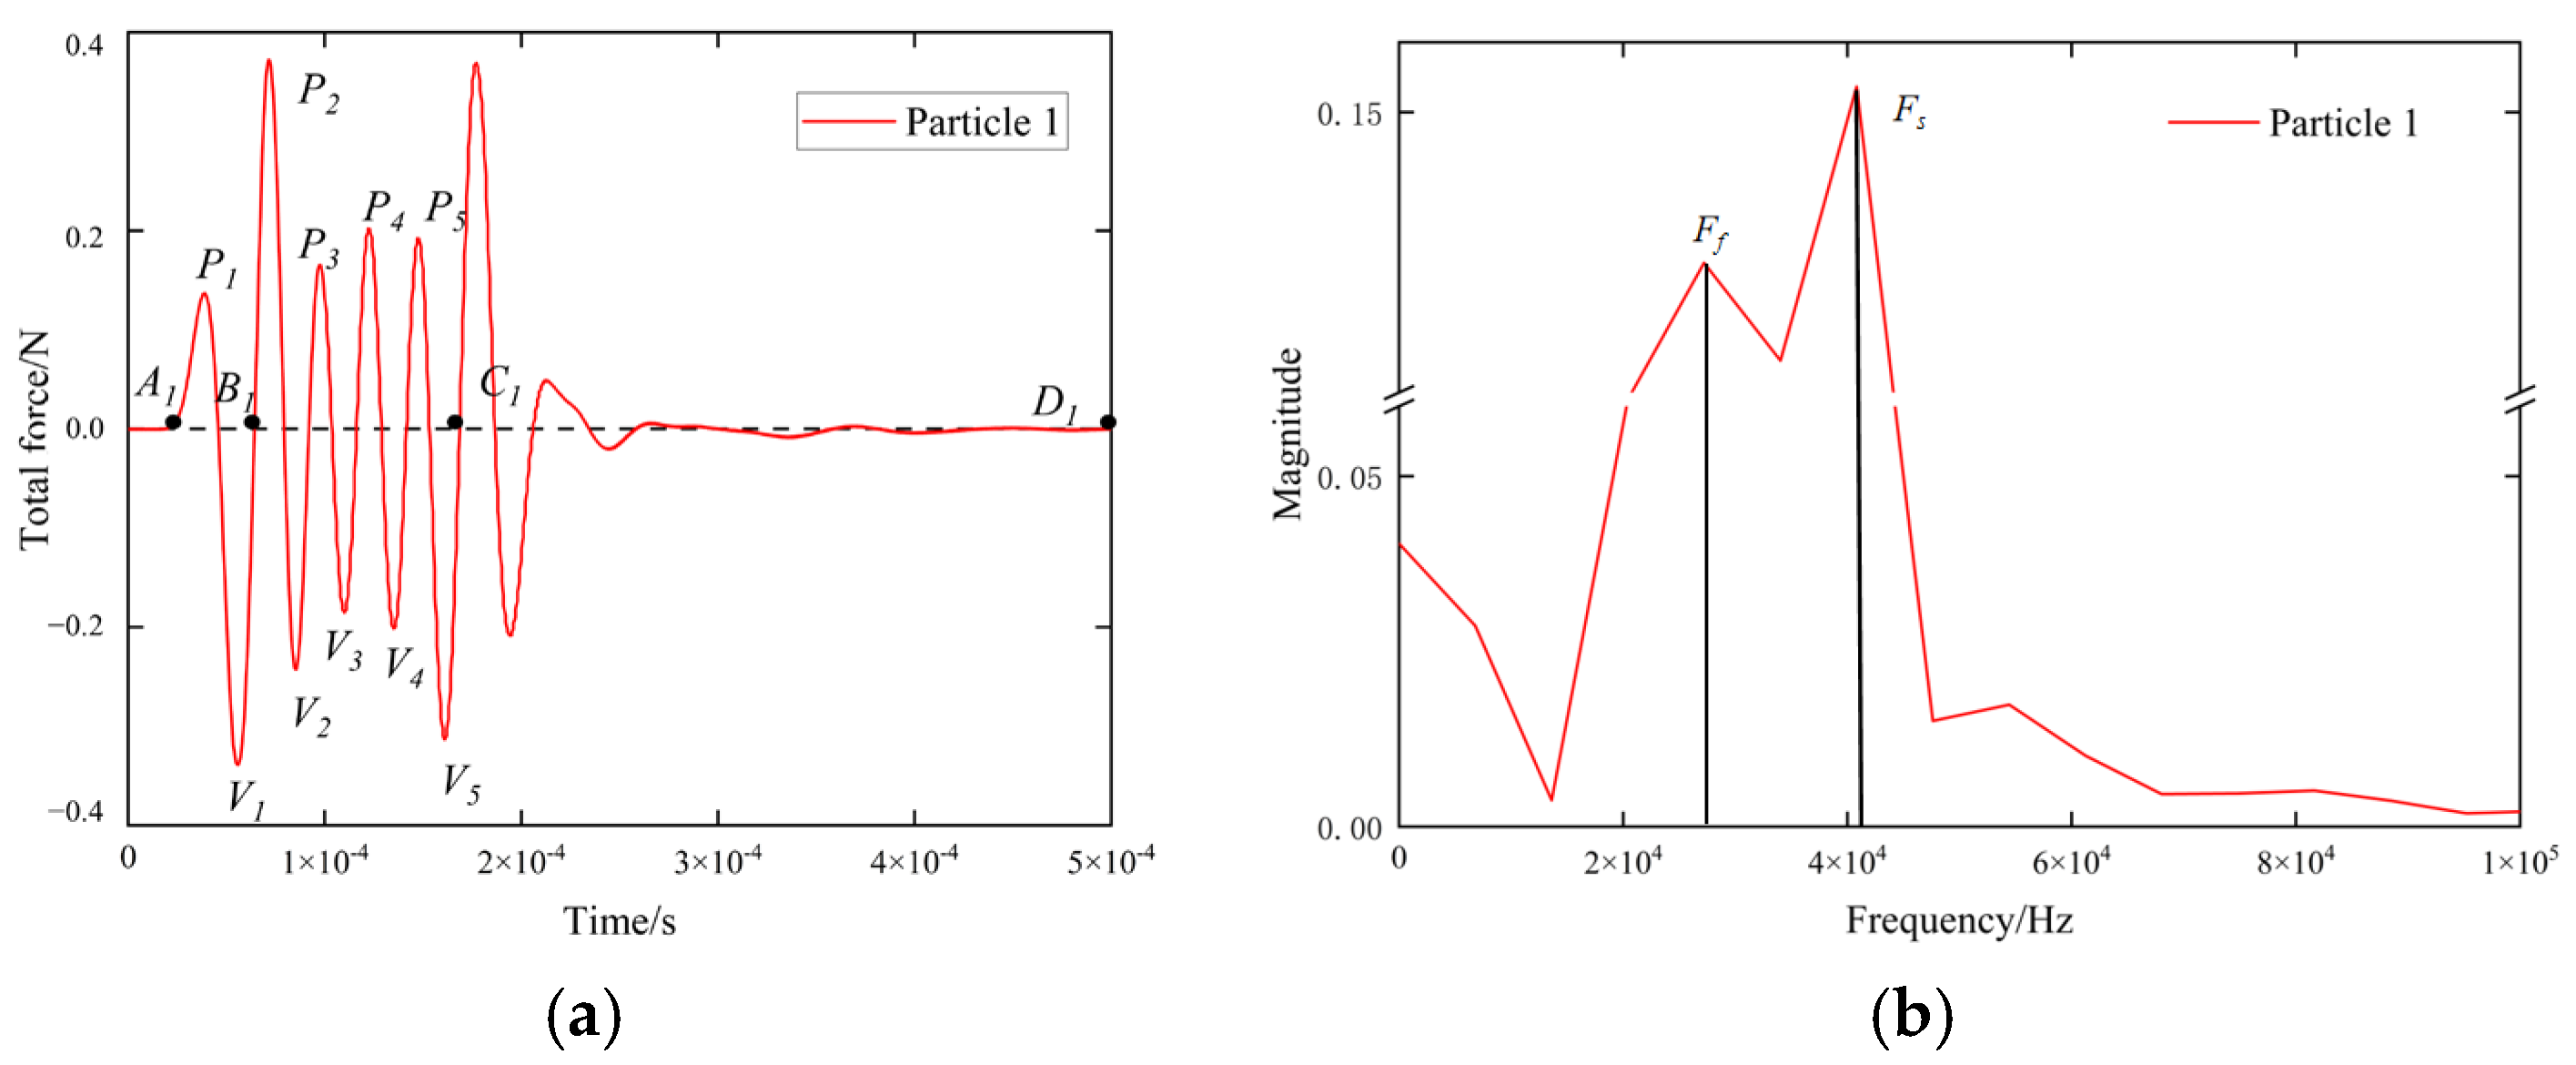
2.3.1. Time Domain and Frequency Domain Signal of the Maize Seed Force
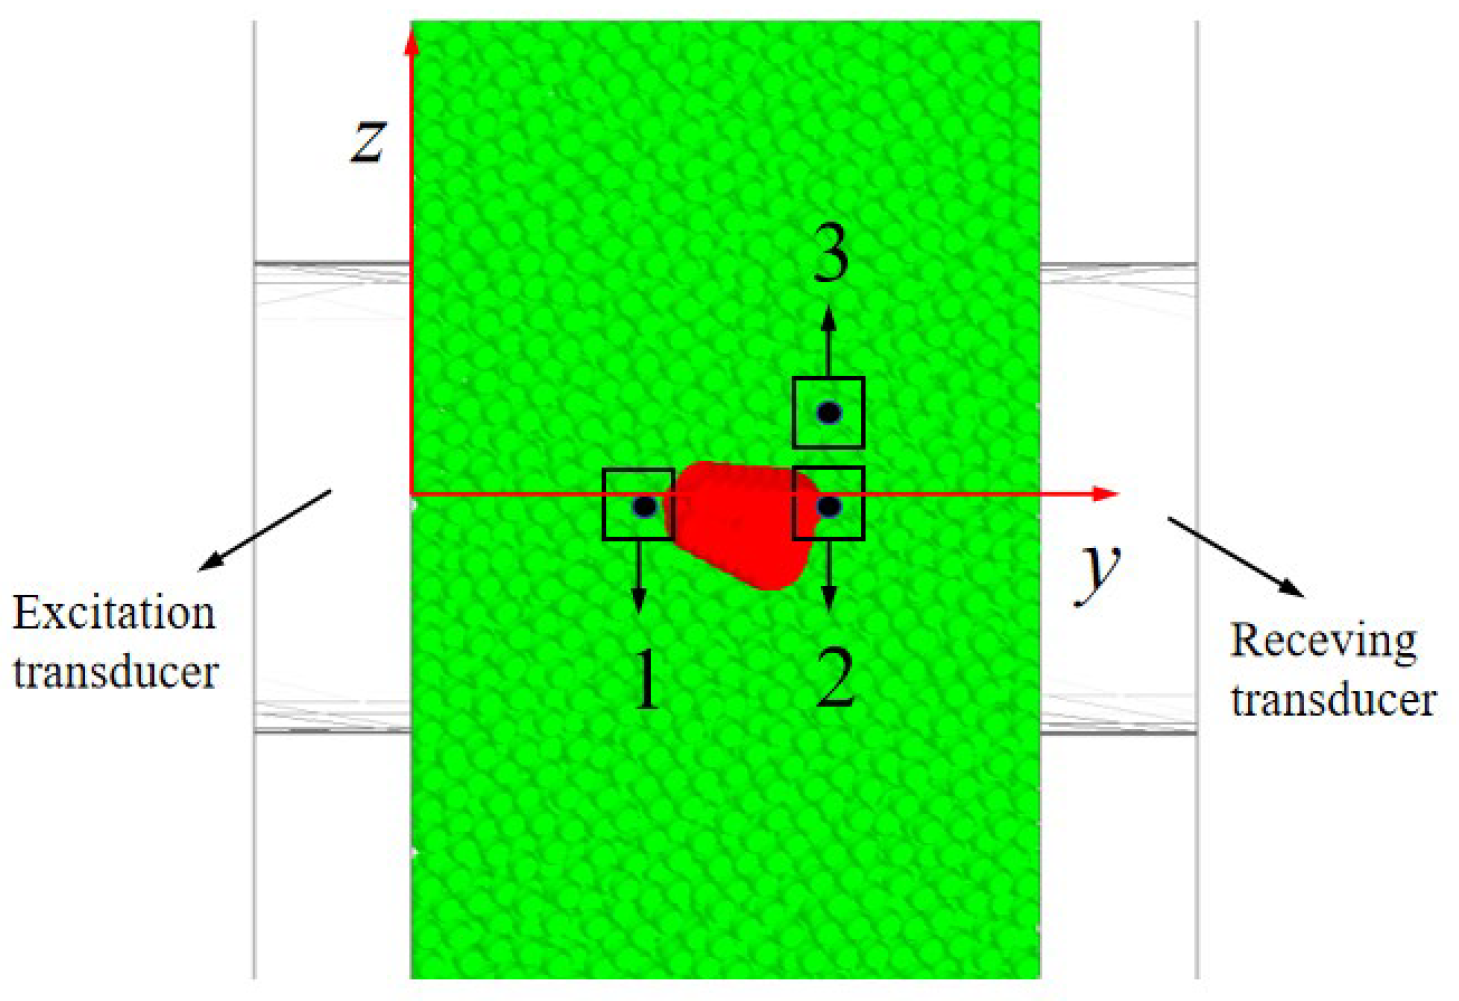
2.3.2. Time Domain and Frequency Domain Signals of Forces Acting on Soil Particles in Surrounding Area of the Maize Seed
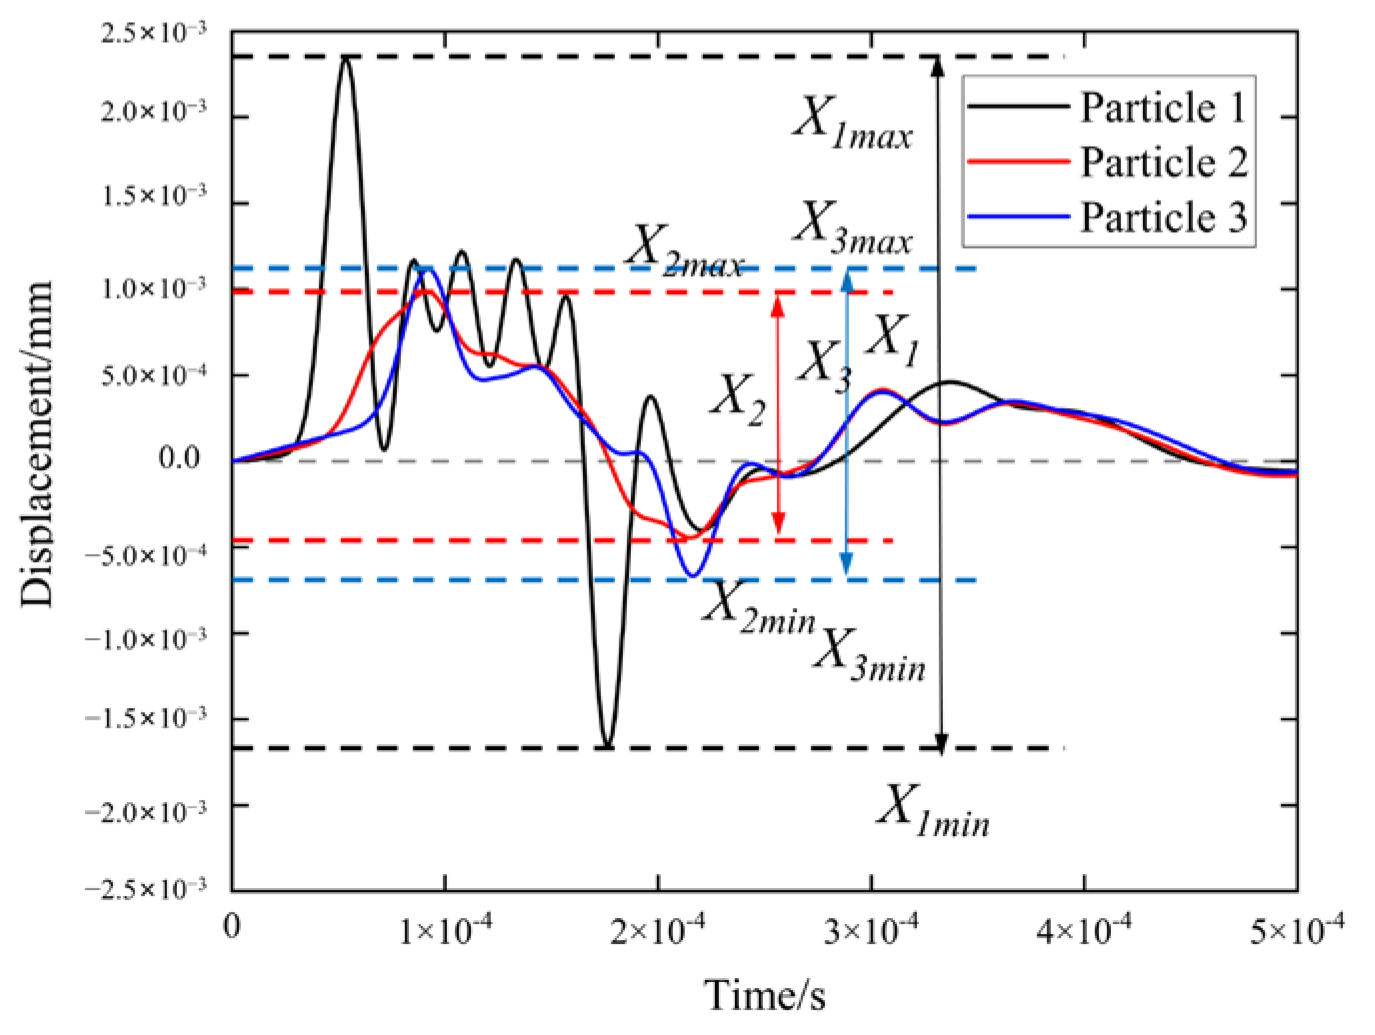
2.3.3. Displacement of the Maize Seed and Soil Particles in Its Surrounding Area
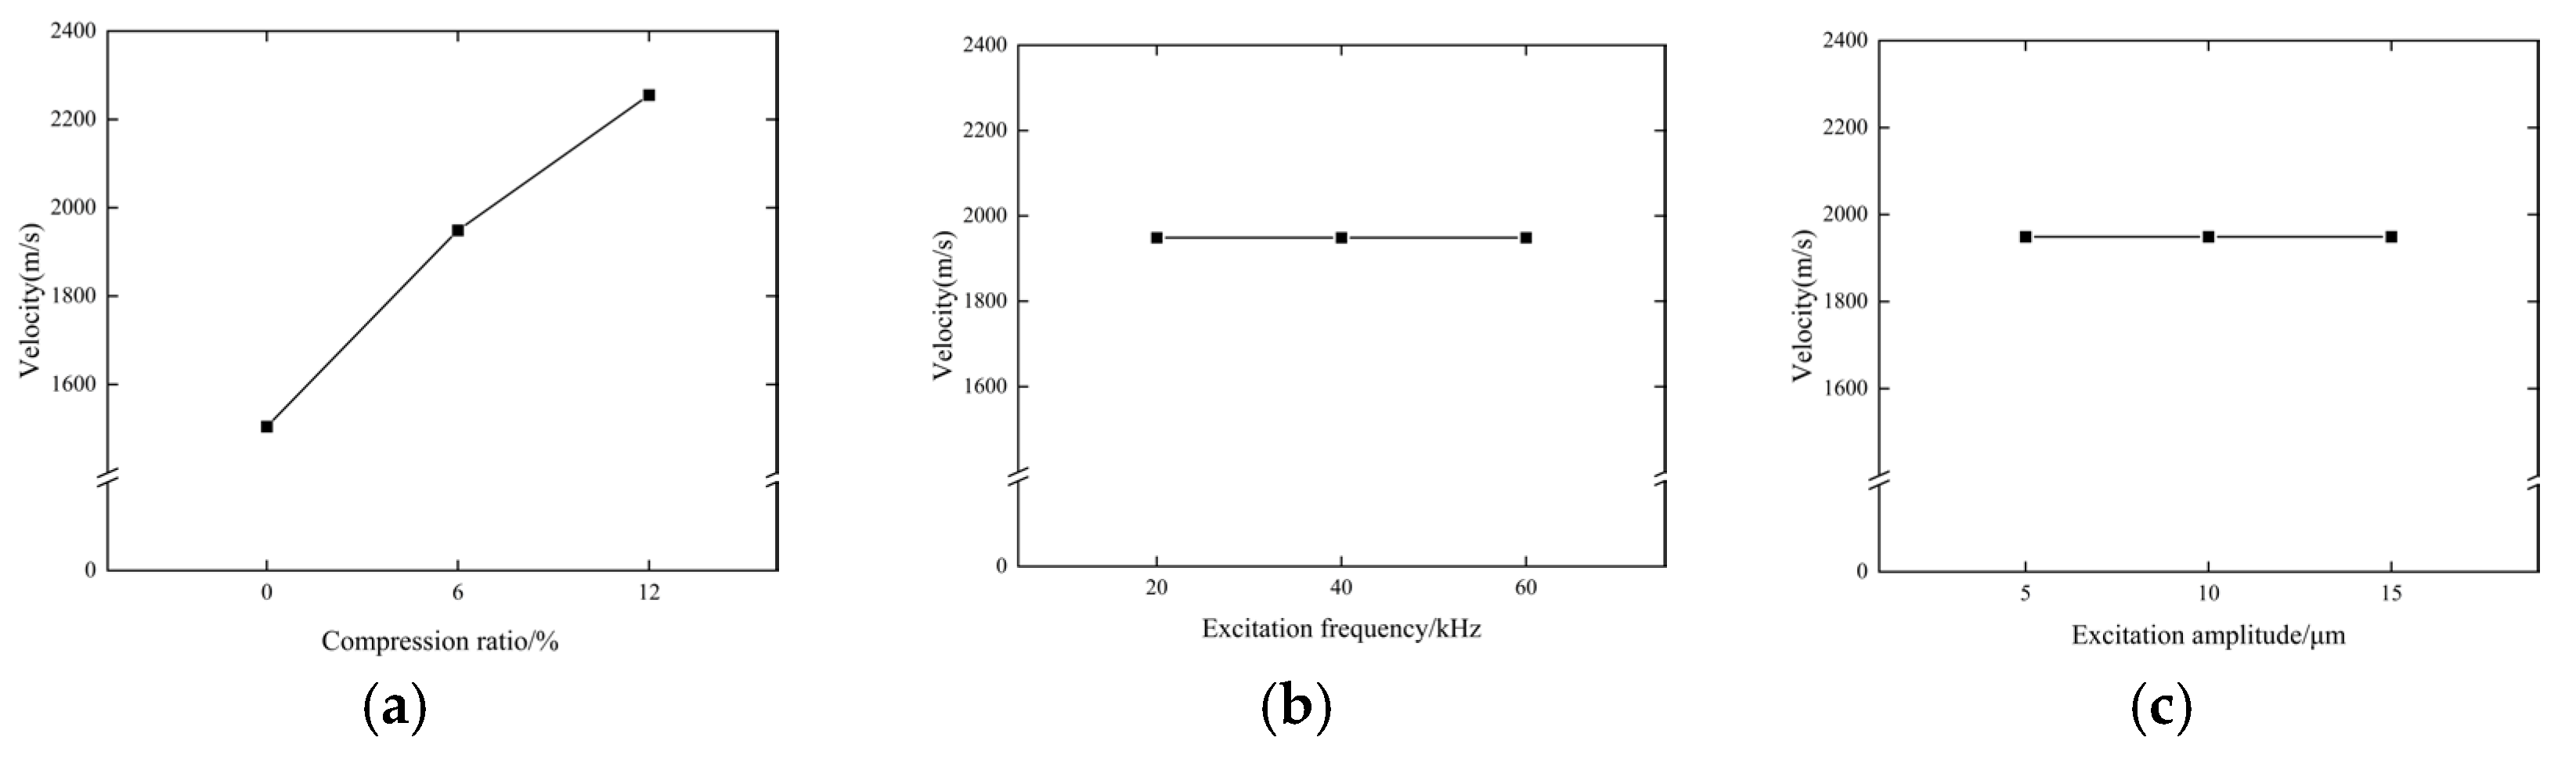
2.3.4. Propagation Velocity of Acoustic Wave in Maize Seed c
3. Results and Discussion
3.1. Validation of the Reliability of the EDEM Simulation Model
3.2. Time Domain and Frequency Domain Signal of the Maize Seed Force
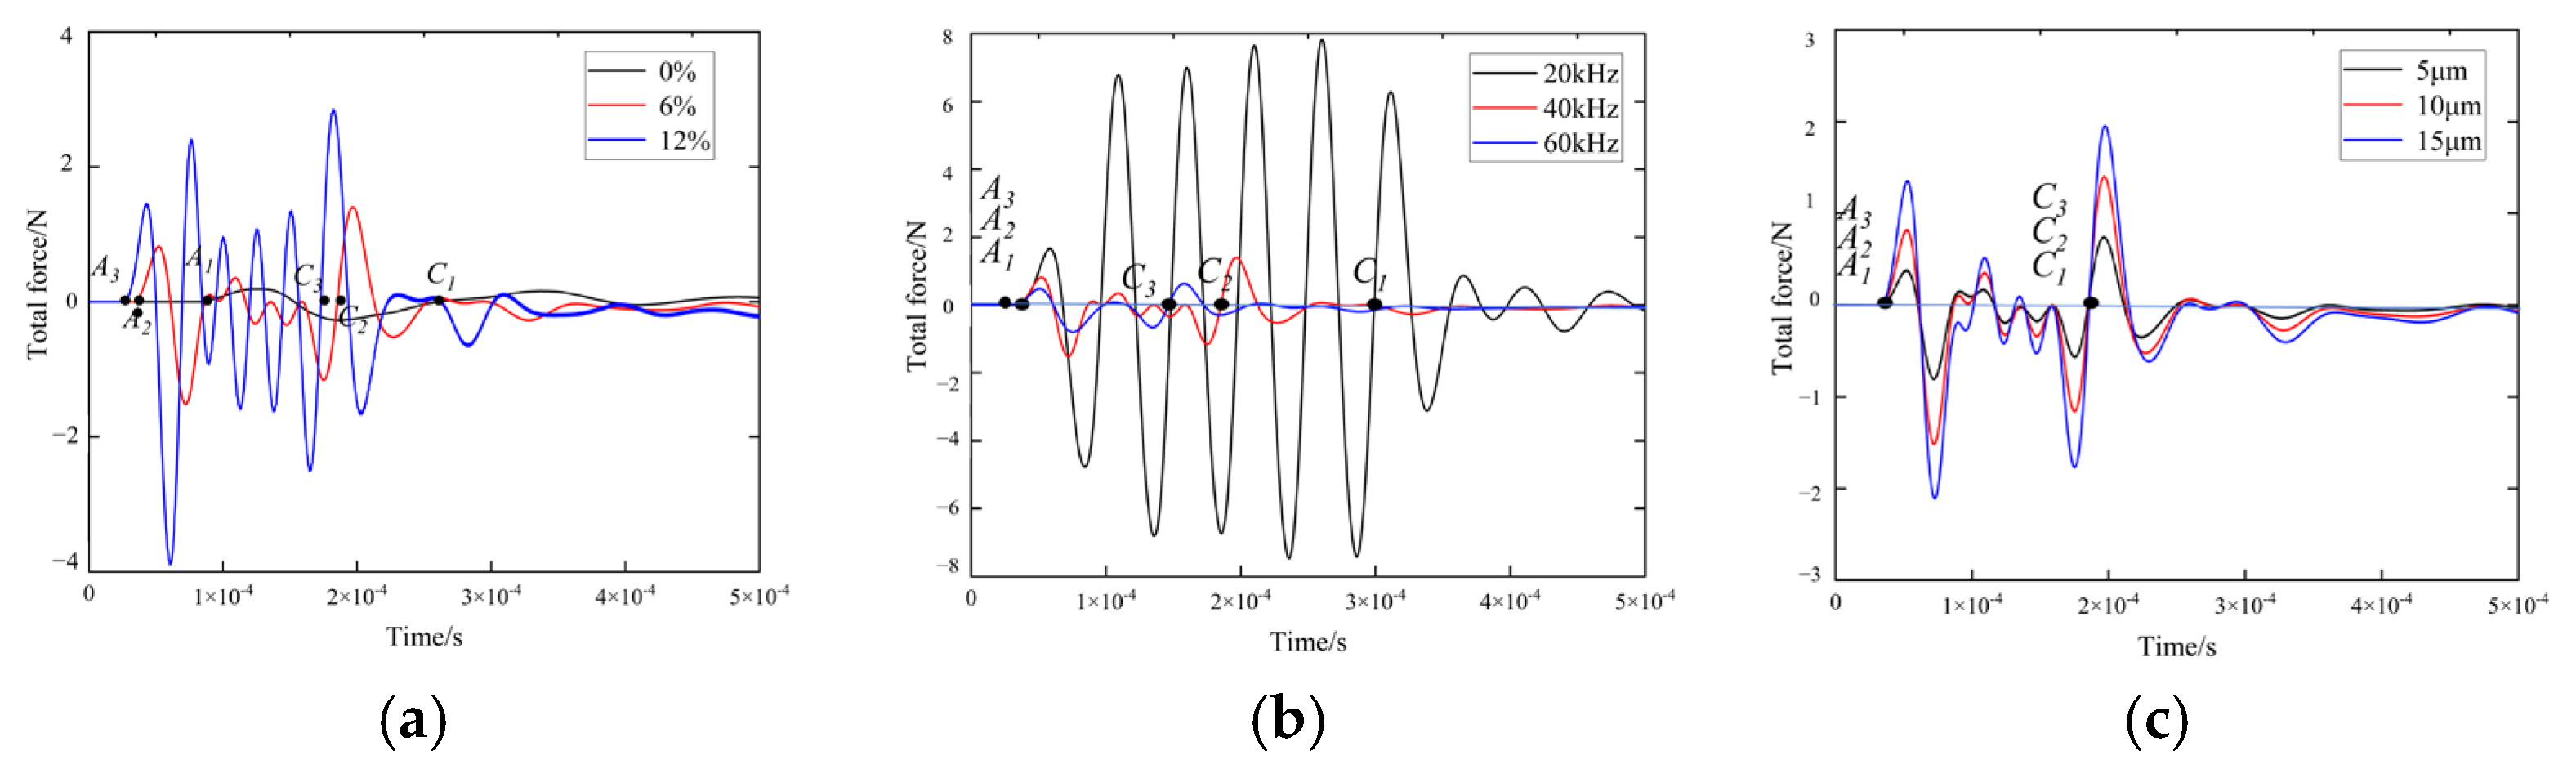
3.2.1. Time Domain Signal of the Maize Seed Force
- (1)
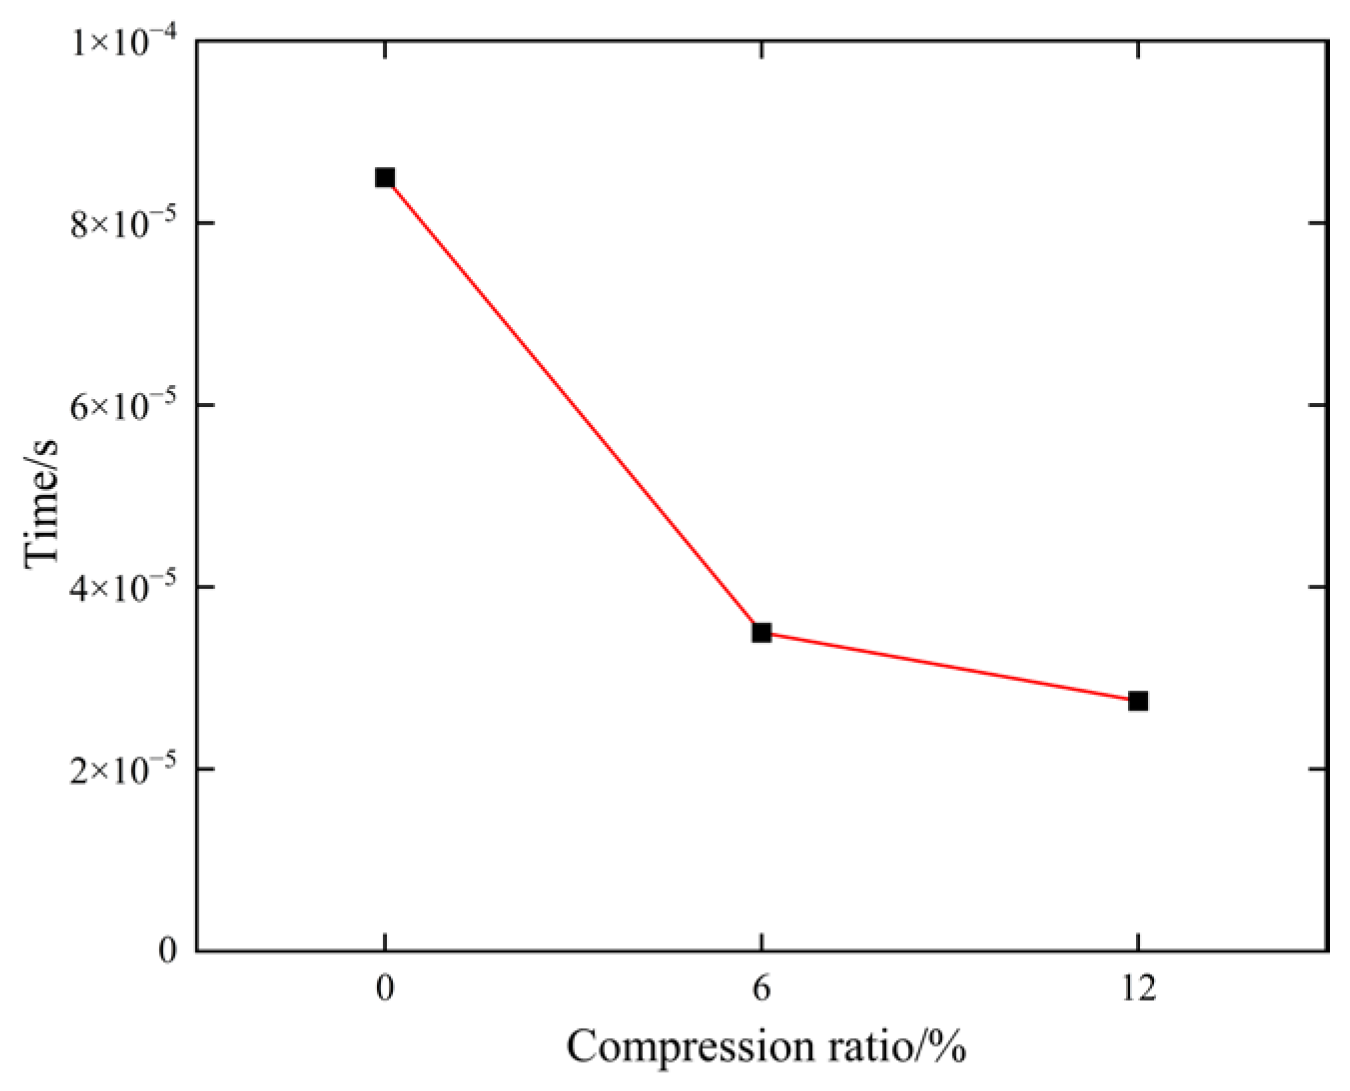
- Compression ratio (α)
- (2)
- Excitation frequency (f)
- (3)
- Excitation amplitude (A1)
3.2.2. Frequency Domain Signal of the Maize Seed Force
- (1)
- Compression ratio (α)
- (2)
- Excitation frequency (f)
- (3)
- Excitation amplitude (A1)
3.3. Time Domain and Frequency Domain Signals of Forces Acting on Soil Particles in Surrounding Area of the Maize Seed
3.4. Displacement of the Maize Seed and Soil Particles in Its Surrounding Area
3.4.1. Displacement of the Maize Seed
3.4.2. Displacement of Soil Particles in the Surrounding Area of the Maize Seed
3.5. Propagation Velocity of Acoustic Wave in the Maize Seed
4. Conclusions
Author Contributions
Funding
Institutional Review Board Statement
Data Availability Statement
Conflicts of Interest
References
- Sun, B.; Zhang, C.; Liu, S.; Xu, Z.; Zhao, Z. Ultrasonic Non-Destructive Testing on Fast-Charging Lithium-Ion Battery’s Capacity Fading. J. Electrochem. Soc. 2024, 171, 030517. [Google Scholar] [CrossRef]
- Yuan, Z.; Gao, X.; Yang, K.; Peng, J.; Luo, L. Performance Enhancement of Ultrasonic Weld Defect Detection Network Based on Generative Data. J. Nondestruct. Eval. 2024, 43, 102. [Google Scholar] [CrossRef]
- Hayashi, T.; Nakao, S. Defect imaging for plate-like structures using diffuse acoustic wave generated by modulated laser. AIP Conf. Proc. 2019, 2102, 050003. [Google Scholar] [CrossRef]
- Lin, W.S.; Wu, J.Z. Non-Destructive Testing of Wood Defects Based on Ultrasonic Technology. Appl. Mech. Mater. 2013, 2668, 1124–1128. [Google Scholar] [CrossRef]
- Sukmana, D.D.; Ihara, I. Surface Roughness Characterization through the Use of Diffuse Component of Scattered Air-Coupled Ultrasound. Jpn. J. Appl. Phys. 2006, 45, 4534–4540. [Google Scholar] [CrossRef]
- Dragonetti, R.; Romano, R.A.; Giulio, E.D. Numerical Evaluation of Ultrasonic Detection of Solid Occlusions in CSP Molten Salt Piping. Appl. Sci. 2025, 15, 1373. [Google Scholar] [CrossRef]
- Kenta, M.; Takumi, I.; Ren, K.; Kazuhisa, O. Proposal of detecting method for small delamination in heat seal of flexible packages using aerial ultrasonic wave. Proc. Dyn. Des. Conf. 2017, 2017, 524. [Google Scholar] [CrossRef]
- Rosli, E.; Husaini, Y. Design and Development of Smart Medicine Box. IOP Conf. Ser. Mater. Sci. Eng. 2018, 341, 012004. [Google Scholar] [CrossRef]
- Andújar, D.; Weis, M.; Gerhards, R. An Ultrasonic System for Weed Detection in Cereal Crops. Sensors 2012, 12, 17343–17357. [Google Scholar] [CrossRef]
- Marek, D.; Krzysztof, P.; Krzysztof, K. The Need for Machines for the Nondestructive Quality Assessment of Potatoes with the Use of Artificial Intelligence Methods and Imaging Techniques. Sensors 2023, 23, 1787. [Google Scholar] [CrossRef]
- Yildiz, F.; Özdemir, A.T.; Uluışık, S. Evaluation Performance of Ultrasonic Testing on Fruit Quality Determination. J. Food Qual. 2019, 2019, 6810865. [Google Scholar] [CrossRef]
- Austin, S.; Chetan, B.; Hasib, M.; Daniel, F.; Brian, M.; Ajay, S. Design of a Reconfigurable Crop Scouting Vehicle for Row Crop Navigation: A Proof-of-Concept Study. Sensors 2022, 22, 6203. [Google Scholar]
- Nik Abdull Halim, N.M.H.; Che Dom, N.; Mat Seleei, N.M.A.S.; Mohd Jamili, A.F.; Precha, N. Radiation effects on dengue vectors: A systematic review. DYSONA-Appl. Sci. 2025, 6, 160–171. [Google Scholar] [CrossRef]
- Adamo, F.; Andria, G.; Attivissimo, F.; Giaquinto, N. An Acoustic Method for Soil Moisture Measurement. IEEE Trans. Instrum. Meas. 2004, 53, 891–898. [Google Scholar] [CrossRef]
- Gorthi, S.; Chakraborty, S.; Li, B.; Weindorf, D.C. A field-portable acoustic sensing device to measure soil moisture. Comput. Electron. Agric. 2020, 174, 105517. [Google Scholar] [CrossRef]
- Sharma, R.K.; Gupta, A.K. Continuous wave acoustic method for determination of moisture content in agricultural soil. Comput. Electron. Agric. 2010, 73, 105–111. [Google Scholar] [CrossRef]
- Bradley, S.; Ghimire, C. Design of an Ultrasound Sensing System for Estimation of the Porosity of Agricultural Soils. Sensors 2024, 24, 2266. [Google Scholar] [CrossRef]
- Salem, H.S. Poisson’s ratio and the porosity of surface soils and shallow sediments, determined from seismic compressional and shear wave velocities. Géotechnique 2000, 50, 461–463. [Google Scholar] [CrossRef]
- Lu, Z.; Hickey, C.J.; Sabatier, J.M. Effects of Compaction on the Acoustic Velocity in Soils. Soil Sci. Soc. Am. J. 2004, 68, 7–16. [Google Scholar] [CrossRef]
- Xianjian, Z.; Bingrui, C.; Huan, S.; Zhimin, M.; Shuangyuan, C. The stability analysis of weak structural planes based on multi-frequency ultrasonic imaging characteristics during rock and soil physical model tests. Environ. Earth Sci. 2021, 80, 775. [Google Scholar] [CrossRef]
- Schomakers, J.; Mentler, A.; Degischer, N.; Blum, W.E.H.; Mayer, H. Measurement of soil aggregate stability using low intesity ultrasonic vibration. Span. J. Soil Sci. 2011, 1, 8–19. [Google Scholar]
- Rawlins, B.G.; Wragg, J.; Lark, R.M. Application of a novel method for soil aggregate stability measurement by laser granulometry with sonication. Eur. J. Soil Sci. 2013, 64, 92–103. [Google Scholar] [CrossRef]
- Tang, H.; Xu, C.; Wang, Z.; Wang, Q.; Wang, J. Optimized Design, Monitoring System Development and Experiment for a Long-Belt Finger-Clip Precision Corn Seed Metering Device. Front. Plant Sci. 2022, 13, 814747. [Google Scholar] [CrossRef] [PubMed]
- Zhai, C.; Lu, C.; Li, H.; He, J.; Wang, Q.; Chang, F.; Bi, J.; Wu, Z. A precise maize seeding parameter monitoring system at the end of seed tube: Improving monitoring accuracy using near-infrared diffusion emission-diffuse reflectance (NIRDE-DR). Comput. Electron. Agric. 2024, 227, 109626. [Google Scholar] [CrossRef]
- Zhang, J.; Hou, Y.; Ji, W.; Zheng, P.; Yan, S.; Hou, S.; Cai, C. Evaluation of a Real-Time Monitoring and Management System of Soybean Precision Seed Metering Devices. Agronomy 2023, 13, 541. [Google Scholar] [CrossRef]
- Cui, J.; Zheng, H.; Zeng, Z.; Yang, Y.; Ma, R.; Tian, Y.; Tan, J.; Feng, X.; Qi, L. Real-time missing seedling counting in paddy fields based on lightweight network and tracking-by-detection algorithm. Comput. Electron. Agric. 2023, 212, 108045. [Google Scholar] [CrossRef]
- Zhang, C.; Xie, X.; Zheng, Z.; Wu, X.; Wang, W.; Chen, L. A Plant Unit Relates to Missing Seeding Detection and Reseeding for Maize Precision Seeding. Agriculture 2022, 12, 1634. [Google Scholar] [CrossRef]
- Lu, C.; Li, H.; He, J.; Wang, Q.; Wang, C.; Liu, J. A Preliminary Study of Seeding Absence Detection Method for Drills on the Soil Surface of Cropland Based on Ultrasonic Wave without Soil Disturbance. J. Sens. 2019, 2019, 7434197. [Google Scholar] [CrossRef]
- Huang, S.; Lu, C.; Li, H.; He, J.; Wang, Q.; Yuan, P.; Gao, Z.; Wang, Y. Transmission rules of ultrasonic at the contact interface between soil medium in farmland and ultrasonic excitation transducer. Comput. Electron. Agric. 2021, 190, 106477. [Google Scholar] [CrossRef]
- Zhou, H.; Chen, Y.; Sadek, M.A. Modelling of soil–seed contact using the Discrete Element Method (DEM). Biosyst. Eng. 2014, 121, 56–66. [Google Scholar] [CrossRef]
- Li, M.; Xu, S.; Yang, Y.; Guo, L.; Tong, J. A 3D simulation model of corn stubble cutting using finite element method. Soil Tillage Res. 2017, 166, 43–51. [Google Scholar] [CrossRef]
- Lei, X.; Wu, W.; Deng, X.; Li, T.; Liu, H.; Guo, J.; Li, J.; Zhu, P.; Yang, K. Determination of Material and Interaction Properties of Granular Fertilizer Particles Using DEM Simulation and Bench Testing. Agriculture 2023, 13, 1704. [Google Scholar] [CrossRef]
- Huang, S.; Lu, C.; Li, H.; He, J.; Wang, Q.; Cao, X.; Gao, Z.; Wang, Z.; Lin, H. Research on acoustic wave attenuation from the perspective of soil particle movement using the discrete element method. Comput. Electron. Agric. 2023, 207, 107747. [Google Scholar] [CrossRef]
- Cay, A.; Kocabiyik, H.; May, S. Development of an electro-mechanic control system for seed-metering unit of single seed corn planters Part II: Field performance. Comput. Electron. Agric. 2018, 145, 11–17. [Google Scholar] [CrossRef]
- Wang, Z.; Lu, C.; Li, H.; Wang, C.; Wang, L.; Yang, H. Propagation Laws of Ultrasonic Continuous Signals at the Transmitting Transducer–Soil Interface. Agriculture 2024, 14, 1470. [Google Scholar] [CrossRef]
- Huang, S.; Lu, C.; Li, H.; He, J.; Wang, Q.; Yuan, P.; Xu, J.; Jiang, S.; He, D. Calibration of Acoustic-Soil Discrete Element Model and Analysis of Influencing Factors on Accuracy. Remote Sens. 2023, 15, 943. [Google Scholar] [CrossRef]
- Ucgul, M.; Saunders, C.; Fielke, J.M. Discrete element modelling of tillage forces and soil movement of a one-third scale mouldboard plough. Biosyst. Eng. 2017, 155, 44–54. [Google Scholar] [CrossRef]
- Ucgul, M.; Fielke, J.M.; Saunders, C. 3D DEM tillage simulation: Validation of a hysteretic spring (plastic) contact model for a sweep tool operating in a cohesionless soil. Soil Tillage Res. 2014, 144, 220–227. [Google Scholar] [CrossRef]
- Derbane, S.; Mansouri, M.; Messast, S. Micromechanical Modeling for Analysis of Shear Wave Propagation in Granular Material. Rom. J. Transp. Infrastruct. 2024, 13, 1–19. [Google Scholar] [CrossRef]
- Zhao, K.; Wang, Q.; Chen, Q.; Zhuang, H.; Chen, G. Simplified effective stress simulation of shear wave propagation in saturated granular soils. Géotech. Lett. 2020, 11, 1–22. [Google Scholar] [CrossRef]
- Xiao, D.G.; Zhang, Z.; Zhu, Y.L.; Zhang, J.Q.; Xu, C.G.; Ma, X. The Frequency Dependence of Ultrasonic Attenuation in Water. In Proceedings of the 2016 IEEE Far East NDT New Technology & Application Forum, Nanchang, China, 22–24 June 2016; pp. 113–116. [Google Scholar]
- Crescenti, R.A.; Bamber, J.C.; Partridge, M.; Bush, N.L.; Webb, S. Characterization of the ultrasonic attenuation coefficient and its frequency dependence in a polymer gel dosimeter. Phys. Med. Biol. 2007, 52, 6747–6759. [Google Scholar] [CrossRef]
- Huang, S.; Lu, C.; Li, H.; He, J.; Wang, Q.; Gao, Z.; Yuan, P.; Li, Y. The attenuation mechanism and regular of the acoustic wave on propagation path in farmland soil. Comput. Electron. Agric. 2022, 199, 107138. [Google Scholar] [CrossRef]
- Naas, M.; Sebaa, N.; Fellah, Z.; Fellah, M.; Lauriks, W.; Depollier, C. Excess ultrasonic attenuation due to inhomogeneities in porous media. J. Acoust. Soc. Am. 2008, 123, 3639. [Google Scholar] [CrossRef]
- Jinhyuk, K.; Jungwoo, L. Acoustic and Thermal Characterization of Therapeutic Ultrasonic Langevin Transducers under Continuous- and Pulsed Wave Excitations. Sensors 2022, 22, 9006. [Google Scholar] [CrossRef]
- Zaccherini, R.; Palermo, A.; Marzani, A.; Colombi, A.; Dertimanis, V.K.; Chatzi, E.N. Geometric and material attenuation of surface acoustic modes in granular media. Geophys. J. Int. 2022, 230, 288–297. [Google Scholar] [CrossRef]
- Brandão, R.J.; Calheiros, C.J.P.; Machado, M.V.C.; Lima, R.M.; Duarte, C.R.; Barrozo, M.A.S. A systematic evaluation of DEM input parameters measurement and calibration. Powder Technol. 2024, 448, 120157. [Google Scholar] [CrossRef]
- Martin, R.; István, V.; Thomas, B.; Michael, S.; Susanne, K.; Guqi, Y.; Edgar, S.; Clemens, G. Determining longitudinal and transverse elastic wave attenuation from zero-group-velocity Lamb waves in a pair of plates. J. Acoust. Soc. Am. 2023, 153, 2090. [Google Scholar]


| Project | Poisson’s Ratio | Shear Modulus (Pa) |
|---|---|---|
| Soil particle | 0.3 | 1 × 10⁹ |
| Maize seed | 0.4 | 1.37 × 10⁸ |
| Steel | 0.25 | 7.9 × 10¹⁰ |
| pzt | 0.32 | 7.5 × 10¹⁰ |
| Project | Coefficient of Restitution | Coefficient of Static Friction |
|---|---|---|
| soil–soil | 0.6 | 0.5 |
| soil–stee | 0.5 | 0.5 |
| soil–pzt | 0.5 | 0.4 |
| soil–maize seed | 0.16 | 0.1 |
| Levels | Compression Ratio α/% | Excitation Frequency f/kHz |
|---|---|---|
| 1 | 0 | 20 |
| 2 | 6 | 40 |
| 3 | 12 | 60 |
| Project | Simulation Results | Experimental Results | Error (%) |
|---|---|---|---|
| Acoustic velocity in maize seed (m/s) | 1948.91 | 1802.43 | 8.13 |
Disclaimer/Publisher’s Note: The statements, opinions and data contained in all publications are solely those of the individual author(s) and contributor(s) and not of MDPI and/or the editor(s). MDPI and/or the editor(s) disclaim responsibility for any injury to people or property resulting from any ideas, methods, instructions or products referred to in the content. |
© 2025 by the authors. Licensee MDPI, Basel, Switzerland. This article is an open access article distributed under the terms and conditions of the Creative Commons Attribution (CC BY) license (https://creativecommons.org/licenses/by/4.0/).
Share and Cite
Li, Y.; Lu, C.; Li, H.; He, J.; Wang, Z.; Zhai, C. Acoustic Wave Propagation Characteristics of Maize Seed and Surrounding Region with the Double Media of Seed–Soil. Agriculture 2025, 15, 1540. https://doi.org/10.3390/agriculture15141540
Li Y, Lu C, Li H, He J, Wang Z, Zhai C. Acoustic Wave Propagation Characteristics of Maize Seed and Surrounding Region with the Double Media of Seed–Soil. Agriculture. 2025; 15(14):1540. https://doi.org/10.3390/agriculture15141540
Chicago/Turabian StyleLi, Yadong, Caiyun Lu, Hongwen Li, Jin He, Zhinan Wang, and Chengkun Zhai. 2025. "Acoustic Wave Propagation Characteristics of Maize Seed and Surrounding Region with the Double Media of Seed–Soil" Agriculture 15, no. 14: 1540. https://doi.org/10.3390/agriculture15141540
APA StyleLi, Y., Lu, C., Li, H., He, J., Wang, Z., & Zhai, C. (2025). Acoustic Wave Propagation Characteristics of Maize Seed and Surrounding Region with the Double Media of Seed–Soil. Agriculture, 15(14), 1540. https://doi.org/10.3390/agriculture15141540