Article

Is the Cultivation of Dictyophora indusiata with Grass-Based Substrates an Efficacious and Sustainable Approach for Enhancing the Understory Soil Environment?

1
National Engineering Research Center of Juncao Technology, Fujian Agriculture and Forestry University, Fuzhou 350002, China
2
College of Life Science, Fujian Agriculture and Forestry University, Fuzhou 350002, China
3
College of Life Science, Longyan University, Longyan 364012, China
4
Fruit Research Institute, Fujian Academy of Agricultural Sciences, Fuzhou 350013, China
*
Authors to whom correspondence should be addressed.
Agriculture 2025, 15(14), 1533; https://doi.org/10.3390/agriculture15141533
Submission received: 29 April 2025 / Revised: 10 July 2025 / Accepted: 10 July 2025 / Published: 16 July 2025
(This article belongs to the Special Issue Effects of Different Managements on Soil Quality and Crop Production)

Abstract

The integration of forestry and agriculture has promoted edible fungi cultivation in forest understory spaces. However, the impact of spent mushroom substrates on forest soils remains unclear. This study explored the use of seafood mushroom spent substrates (SMS) and grass substrates to cultivate Dictyophora indusiata. After cultivation, soil pH stabilized, organic carbon increased by 34.02–62.24%, total nitrogen rose 1.1–1.9-fold, while soil catalase activity increased by 43.78–100.41% and laccase activity surged 3.3–11.2-fold. The 49% Cenchrus fungigraminus and 49% SMS treatment yielded the highest 4-coumaric acid levels in the soil, while all treatments reduced maslinic and pantothenic acid content. SMS as padding material with C. fungigraminus enhanced soil bacterial diversity in the first and following years. Environmental factors and organic acids influenced the recruitment of genus of Latescibacterota, Acidothermus, Rokubacteriales, Candidatus solibacter, and Bacillus, altering organic acid composition. In conclusion, cultivating D. indusiata understory enhanced environmental characteristics, microbial dynamics, and organic acid profiles in forests’ soil in short time.

1. Introduction

Dictyophora indusiata (bamboo mushroom), a rare edible mushroom predominantly cultivated in Asia (such as in China, Thailand, and India), [1] is known as the “queen of mushrooms” owing to its unique “white skirt” morphology, health-promoting constituents, including triterpenoids, polysaccharides, and flavonoids, and distinctive flavor [2,3]. Conventional field cultivation of this mushroom faces land scarcity-related challenges in China, where limited arable land resources constrain sustainable production. With global forest coverage extending to 4.06 billion hectares (31% of land area), agroforestry systems incorporating D. indusiata cultivation provide dual benefits in both agriculture and ecology [4,5]. The microclimatic conditions in bamboo forest understories, characterized by higher humidity and oxygen levels, fulfill the stringent fruiting requirements of this species. This cultivation model not only allows sustainable mushroom production but also improves forest ecological restoration while mitigating competition for land from traditional farming practices.
The primary resources used in D. indusiata cultivation are bamboo shavings and sawdust, but reliance on these nonrenewable substrates hinders industry sustainability. Since 1986, when Fujian Agriculture and Forestry University reported breakthroughs in herb-based mushroom cultivation, alternative substrates have emerged to reconcile the conflicts in wood demand between fungal production and forest conservation [6,7,8]. This innovation has bridged the gap between wood-rotting and herbaceous-rotting fungi, thereby facilitating the sustainable development of China’s edible mushroom industry. Cenchrus fungigraminus (of the Poaceae family), a C4 plant with high biomass yield (approximately 300 t ha−1 y−1), nitrogen-fixing endophytes, [9,10] and superior photosynthetic efficiency, presents particular promise [11]. Spent mushroom substrate is the residual medium after fruiting body harvest and is composed of cottonseed hulls, corn cobs, herbaceous plant powder, sawdust, etc. It contains cellulose, hemicellulose, mycelial residue protein, amino acids, minerals, and fungal secondary metabolites. The amount of spent mushroom substrate produced annually exceeds 42 million tons in China [12]. A previous study indicated that both C. fungigraminus and spent mushroom substrate are promising materials for mushroom cultivation because of their wide range of sources and cost efficiency [7,13]. Despite these advantages, the application of neither C. fungigraminus nor spent substrate has been systematically investigated in D. indusiata cultivation, representing a critical gap in the knowledge of sustainable mushroom production systems.
Soil organic acids (SOAs), particularly low-molecular-weight variants (<200 Da) containing carboxyl groups, are ubiquitous in terrestrial ecosystems, with concentrations typically ranging from 1 to 100 mmol/kg [14]. These hydroxycarboxylic acids enhance nutrient bioavailability through H+ release and chelating metals, thereby facilitating plant uptake of essential elements and heavy metals [15,16]. Their composition and concentrations vary dynamically with soil properties and microbial activity, as microorganisms synthesize key acids (citric, oxalic, and acetic) that drive carbon cycling [17]. While microbial communities regulate SOA equilibrium through synthesis–decomposition processes, limited studies have investigated how D. indusiata cultivation in forest soils alters organic acid profiles or impacts soil quality parameters, despite the well-documented rhizosphere interactions of D. indusiata.
Field trials were conducted in the bamboo forest ecosystems of Shunchang County, Fujian Province, utilizing C. fungigraminus and seafood mushroom (Hypsizygus marmoreus) spent substrate (SMS) to develop a novel agroforestry model for D. indusiata production. This sustainable approach transitions traditional monoculture systems towards diversified ecological agriculture, with the dual objectives of enhancing rural economic viability and optimizing soil management practices. The investigation specifically addressed the following critical questions: (1) Does D. indusiata cultivation increase soil fertility parameters? (2) What are the impacts of cultivation practices on soil bacterial diversity and abundance indices? (3) Are there potential inhibitory effects of soil organic acid accumulation on bacterial community structure? (4) Can soil resilience be enhanced post-cultivation through natural recovery processes? These findings established an empirical foundation for implementing ecological cultivation protocols in forest-based D. indusiata production systems.

2. Materials and Methods

2.1. Experimental Site and Design Methodology

The experiments on D. indusiata cultivation were conducted in a bamboo forest at the Juncao Science and Technology Backyard in Shunchang County, Fujian Province, China (N 26°43′9″, E 117°42′12″, elevation 240 m). The D. indusiata strain (D89, GenBank No. AF324167.2) was provided by the National Engineering Research Center of Juncao Technology. Fujian Shunchang Xinjundu Company (Nanping, China) developed the D. indusiata cultivation strains and provided fresh C. fungigraminus powder (46% moisture content) and SMS (61% moisture content). The fermentation protocol for using SMS as an edible mushroom cultivation bedding material is described in Li et al. [11]. The D. indusiata cultivation treatments were categorized in the bamboo forest into two distinct groups. The first group, designated the SMS bedding group, was treated with a mixture containing 49% C. fungigraminus, 49% sawdust, 1% urea, and 1% calcium bicarbonate (S-CS) and a mixture containing 49% C. fungigraminus, 49% SMS, 1% urea, and 1% calcium bicarbonate (S-CH). The second group, referred to as the non-SMS bedding group, was treated with a combination of 49% C. fungigraminus, 49% sawdust, 1% urea, and 1% calcium bicarbonate (CS) and a blend of 49% C. fungigraminus, 49% SMS, 1% urea, and 1% calcium bicarbonate (CH). Undisturbed forest soil (OS) served as the control [18]. Each treatment included a 4.4 m × 16 m demonstration area with three replicates. D. indusiata cultivation began in February 2023, with soil samples collected from a depth of 0–20 cm until September 2023. Additional sampling for natural conditions was performed in September 2024. A five-point sampling method was used, combining samples from three orientations at each point into a single composite sample. The soil samples were transported to the laboratory on dry ice. The samples were stored at −80 °C for high-throughput sequencing analysis and at −20 °C for physicochemical analysis within 48 h. The experiments were conducted from 2022 to 2024.

2.2. Cultivation of D. indusiata with Forest Ecosystems

The standardized protocol for D. indusiata cultivation in forest ecosystems comprises five sequential phases: (1) culture material preparation; (2) land preparation; (3) substrate application; (4) inoculation; and (5) soil covering. The fermentation of both substrates was conducted from December 2022 to February 2023 following the established material ratios [18]. During the 45-day fermentation period, the substrates were turned every 7–15 days (with the peak temperature reaching 60–70 °C) to ensure homogeneous maturation. After fermentation, forest soil beds were prepared by shovel, and the mature substrate was distributed uniformly. Egg-sized D. indusiata spawn segments were systematically positioned at approximately 30 cm intervals and covered with fermentation substrate, followed by a 3 cm soil overlay. The environmental parameters were maintained at 85–100% relative humidity throughout mycelial development [18]. Fruiting body harvesting operations were conducted from May to September 2023.

2.3. Analysis of Soil Fertility and Enzyme Activity During D. indusiata Cultivation

The total nitrogen (TN) in the soil was completely converted to ammonium nitrogen through redox reactions facilitated by sodium thiosulfate, concentrated sulfuric acid, and perchloric acid. The resulting ammonia from the alkalized digested solution was distilled and absorbed by boric acid, followed by titration with a standardized hydrochloric acid solution. According to Kjeldahl digestion method, the sample is mixed with concentrated sulfuric acid and catalysts (potassium sulfate and copper sulfate) to convert organic nitrogen into ammonium salts (NH4+). Adding NaOH converts NH4+ into ammonia gas (NH3), which is absorbed by excess boric acid (H3BO3) to form ammonium borate (NH4BO3). The solution is then titrated with standard HCl, and the total nitrogen content is calculated based on the volume of HCl used [19,20]. Soil nitrate nitrogen (NO3-N) was quantified using the dual-wavelength colorimetric method. Under acidic conditions, NO3 reacts with salicylic acid to form nitrosalicylic acid, which is yellow under alkaline conditions (pH > 12). The intensity of this color is directly proportional to the concentration of NO3-N. Ammonium nitrogen (NH4+-N) was measured using the indophenol blue colorimetric method according to Muhammad et al. [21] and Niepsch et al. [22]. The reaction between NH4+-N in the soil and chlorite and phenol in a strongly alkaline medium results in the formation of indophenol blue, which has a characteristic absorption peak at 630 nm. The absorbance was directly proportional to the NH4+-N concentration. The soil organic matter (SOM) content was measured via the potassium dichromate volumetric method. The organic carbon in the soil was oxidized by an excess of potassium dichromate-sulfuric acid solution under heating. In this technique, chromium (VI) is reduced to chromium (III), and its concentration is proportional to that of organic carbon. The absorbance was measured at 585 nm to calculate the organic carbon-based chromium(III) concentration [23]. Soil catalase (SCAT) activity was determined from the amount of KMnO4 required to oxidize H2O2, as determined by measuring the absorbance at 240 nm [24]. Soil laccase (SL), a copper-containing polyphenol oxidase, degrades environmental pollutants and lignocellulose [25,26]. SL catalyzes the decomposition of the substrate 2,2′-azinobis-(3-ethylbenzthiazoline-6-sulphonate) (ABTS), leading to the generation of ABTS radicals. The absorbance coefficient at 420 nm for ABTS radicals is much greater than that of the substrate ABTS. Consequently, the rate of increase in ABTS radicals is related to laccase activity.

2.4. Soil DNA Extraction and 16S rRNA Amplicon Profiling

Nine treatments (OS, S-CS23, S-CH23, CS23, CH23, S-CS24, S-CH24, CS24, and CH24) were selected for 16S rRNA amplicon sequencing, with five replicates per treatment. Genomic DNA (gDNA) was extracted from 500 mg of soil using the OMEGA Soil DNA Kit (Omega Bio-Tek, Norcross, GA, USA) following the manufacturer’s protocols. The gDNA concentration and purity were measured using a NanoDrop 2000 spectrophotometer (Thermo Fisher Scientific, Waltham, MA, USA), and its integrity was assessed via agarose gel electrophoresis. The qualified gDNA was stored at −20 °C until analysis.
The hypervariable V3-V4 region of the bacterial 16S rRNA gene was amplified via the primers 338F (5′-ACTCCTACGGGAGGCAGCA-3′) and 806R (5′-GGACTACHVGGGTWTCTAAT-3′). Sample-specific 7 bp barcodes were added to the primers for multiplex sequencing. The PCR mixture contained 5 μL of 5 × buffer, 0.25 μL of Fastpfu DNA Polymerase (5 U/μL), 2 μL of dNTPs (2.5 mmol/L), 1 μL of each primer (10 μmol/L), 1 μL of DNA template, and 14.75 μL of ddH2O. The thermal cycling conditions were as follows: initial denaturation at 98 °C for 5 min, followed by 25 cycles of denaturation at 98 °C for 30 s, annealing at 53 °C for 30 s, extension at 72 °C for 45 s, and a final extension at 72 °C for 5 min. PCR amplicons were purified using Vazyme VAHTSTM DNA Clean Beads (Vazyme, Nanjing, China) and quantified using the Quant-iT PicoGreen dsDNA Assay Kit (Invitrogen, Carlsbad, CA, USA). Purified amplicons were pooled in equimolar concentrations and sequenced on the Illumina NovaSeq platform (Illumina, San Diego, CA, USA) with a NovaSeq 6000 SP Reagent Kit (500 cycles) at Shanghai Personal Biotechnology Co., Ltd. (Shanghai, China). For bioinformatics analysis, QIIME2 2019.4 was used with modifications from official tutorials (https://docs.qiime2.org/2019.4/tutorials/ accessed on 10 October 2024) [27]. The raw sequences were demultiplexed, and the primers were trimmed via Cutadapt [28]. The sequences were quality filtered, denoised, merged, and subjected to chimera removal using DADA2 [29]. Nonsingleton amplicon sequence variants (ASVs) were aligned with MAFFT and used to construct a phylogenetic tree with Fasttree2 [30,31]. Taxonomy was assigned to ASVs using the classify-sklearn naive Bayes taxonomy classifier in the feature-classifier plugin [32,33]. The raw data were derived from the Illumina platform and deposited in the National Center for Biotechnology Information (NCBI) database (https://www.ncbi.nlm.nih.gov/ accessed on 21 February 2025) with accession number PRJNA1225914.

2.5. Targeted Metabolomic Analysis of Soil Organic Acids

Five experimental treatments (OS, S-CS24, S-CH24, CS24, and CH24) were analyzed for soil organic acid levels via targeted metabolomics. Methanol (MeOH) and Milli-Q water were obtained from Merck (Darmstadt, Germany) and Millipore (Bradford, MA, USA), respectively. Analytical standards and formic acid were procured from Sigma–Aldrich (St. Louis, MO, USA). Stock solutions (1 mg/mL in MeOH) were stored at −20 °C, with working solutions freshly diluted in MeOH before analysis. Freeze-dried samples (0.05 g) were extracted with 500 μL of precooled (−20 °C) 70% methanol/water (v/v) through three sequential 5 min vortex cycles (2500× g) with 5 min intervals. After incubation (−20 °C, 30 min), the extracts were centrifuged (12,000× g, 10 min, 4 °C). Aliquots (400 μL) of the supernatant were subjected to secondary centrifugation (12,000× g, 5 min, 4 °C) prior to analysis. Finally, 100 μL of the supernatant was used for liquid chromatography–mass spectrometry (LC–MS) analysis. Sample extracts were analyzed using a liquid chromatography–electrospray ionization–tandem mass spectrometry (LC–ESI–MS/MS) system (UPLC, ExionL CAD, https://sciex.com.cn/ accessed on 7 November 2024; MS, QTRAP® 6500+ System, https://sciex.com/ accessed on 7 November 2024). The analytical conditions were as follows: an ACQUITY HSS T3 HPLC column (2.1 mm × 100 mm, 1.8 μm); a solvent system consisting of water with 0.05% formic acid (solvent A) and acetonitrile with 0.05% formic acid (solvent B); a gradient starting with B set to 5% (0–8 min), increased linearly to reach 95% B (8–9.5 min), and finally returned to 5% B (9.6–12 min); a flow rate of 0.35 mL/min; a temperature of 40 °C; and an injection volume of 2 μL. ESI–MS/MS analysis was performed using an AB 6500+ QTRAP® LC–MS/MS system with an ESI Turbo Ion–Spray interface. The system was operated in positive and negative ion modes and controlled by Analyst 1.6 software (AB Sciex). The ESI source parameters were as follows: ion source temperature, 550 °C; ion spray voltage (IS), 5500 V (positive) and −4500 V (negative); curtain gas (CUR), 35.0 psi; and declustering potential (DP) and collision energy (CE) optimized further for each multiple-reaction monitoring (MRM) transition. Specific MRM transitions were monitored on the basis of the organic acid eluted during each period [34,35,36].

2.6. Data Analysis

One-way analysis of variance (ANOVA) was performed with the mean of each experimental dataset, and Duncan’s multiple range test was employed to determine significant differences at 95% confidence intervals (p < 0.05) by SPSS Statistics 26 (International Business Machines Corporation, New York, NY, USA) and Microsoft Office Excel 2010 (Microsoft, Washington, DC, USA). Sequence data analyses were primarily conducted via the QIIME2 (v2019.4) and R packages (v4.1.1). ASV-level alpha diversity indices, including the Chao1 richness estimator, Faith’s pd, Good’s coverage, Pielou’s evenness, and Shannon diversity indices, were computed from the ASV table. Ranked abundance curves at the ASV level were generated to compare both richness and evenness among samples. Beta diversity analysis was performed via nonmetric multidimensional scaling (NMDS) with Bray–Curtis metrics [37,38,39]. Additionally, principal component analysis (PCA) was executed on the basis of genus-level compositional profiles [40]. The significance of microbiota structural differentiation among treatments was determined on the basis of phylum- and genus-level compositional profiles. A Venn diagram was generated to illustrate the shared and unique ASVs among samples or groups on the basis of ASV occurrence irrespective of relative abundance via the R package (https://en.wikipedia.org/wiki/Venn_diagram accessed on 17 October 2024) [41]. The taxon abundances at the ASV level were statistically compared among samples or treatments using MetagenomeSeq, and the results were visualized as Manhattan plots [42]. Random forest analysis was applied to discriminate samples from different groups in QIIME2 with default settings [43]. Key species ASVs were classified into four roles on the basis of their Zi and Pi values: peripherals, connectors, module hubs, and network hubs. The Zi and Pi scores were calculated for each node using the modular partitioning results from the co-occurrence network. Node roles were then determined on the base of these scores [44]. The network was visualized via the R packages igraph and ggraph. Microbial functions were predicted using Phylogenetic Investigation of Communities by Reconstruction of Unobserved States (PICRUSt2) via the Kyoto Encyclopedia of Genes and Genomes (KEGG) (https://www.kegg.jp/ accessed on 17 October 2024) database.
The targeted metabolomic analysis included unsupervised principal component analysis (PCA) using R’s built-in functions (www.r-project.org accessed on 28 November 2024). The data were scaled to unit variance before PCA. Significantly modulated metabolites were identified on the base of a VIP ≥ 1 and absolute log2-fold change (FC) ≥ 1.0. VIP values, score plots, and permutation plots were extracted from partial least squares discriminant analysis (PLS-DA) results via the R package (MetaboAnalystR). The data were log2-transformed and mean-centered before PLS-DA to preclude overfitting, and a permutation test with 200 interactions was conducted for validation. The identified metabolites were annotated via the KEGG Compound database (http://www.kegg.jp/kegg/compound/ accessed on 30 November 2024), and the annotated metabolites were subsequently mapped to the KEGG Pathway database (http://www.kegg.jp/kegg/pathway.html accessed on 30 November 2024). Linear regression analysis between key differentially abundant metabolites and differentially abundant species was conducted by the Personal GenesCloud Platform (https://www.genescloud.cn/home accessed on 30 November 2024).

3. Results

3.1. Assessment of Soil Fertility and Enzyme Activity Variations During the Cultivation of D. indusiata

Table 1 indicated that the TN and SOC decreased during the first year following the cultivation of D. indusiata under various treatments. However, in S-CH24, TN, and SOC increased by 1.9- and 1.6-fold, respectively (p < 0.05). After one year of natural recovery post cultivation, the NO3-N and NH4+-N levels significantly increased (18.0- and 1.5-fold, respectively) in S-CS24. Notably, employing a substrate composed of SMS combined with C. fungigraminus yielded optimal results, followed by S-CS24 and CH24. Although D. indusiata cultivation had no significant effect on soil enzyme activity in the first year, it significantly increased SCAT (43.78% to 100.41%) and SL (3.3- to 11.2-fold) activities after one year of near-natural bamboo forest recovery.

3.2. Analysis of the 16S RNA Diversity of Soil Bacteria for D. indusiata Cultivation

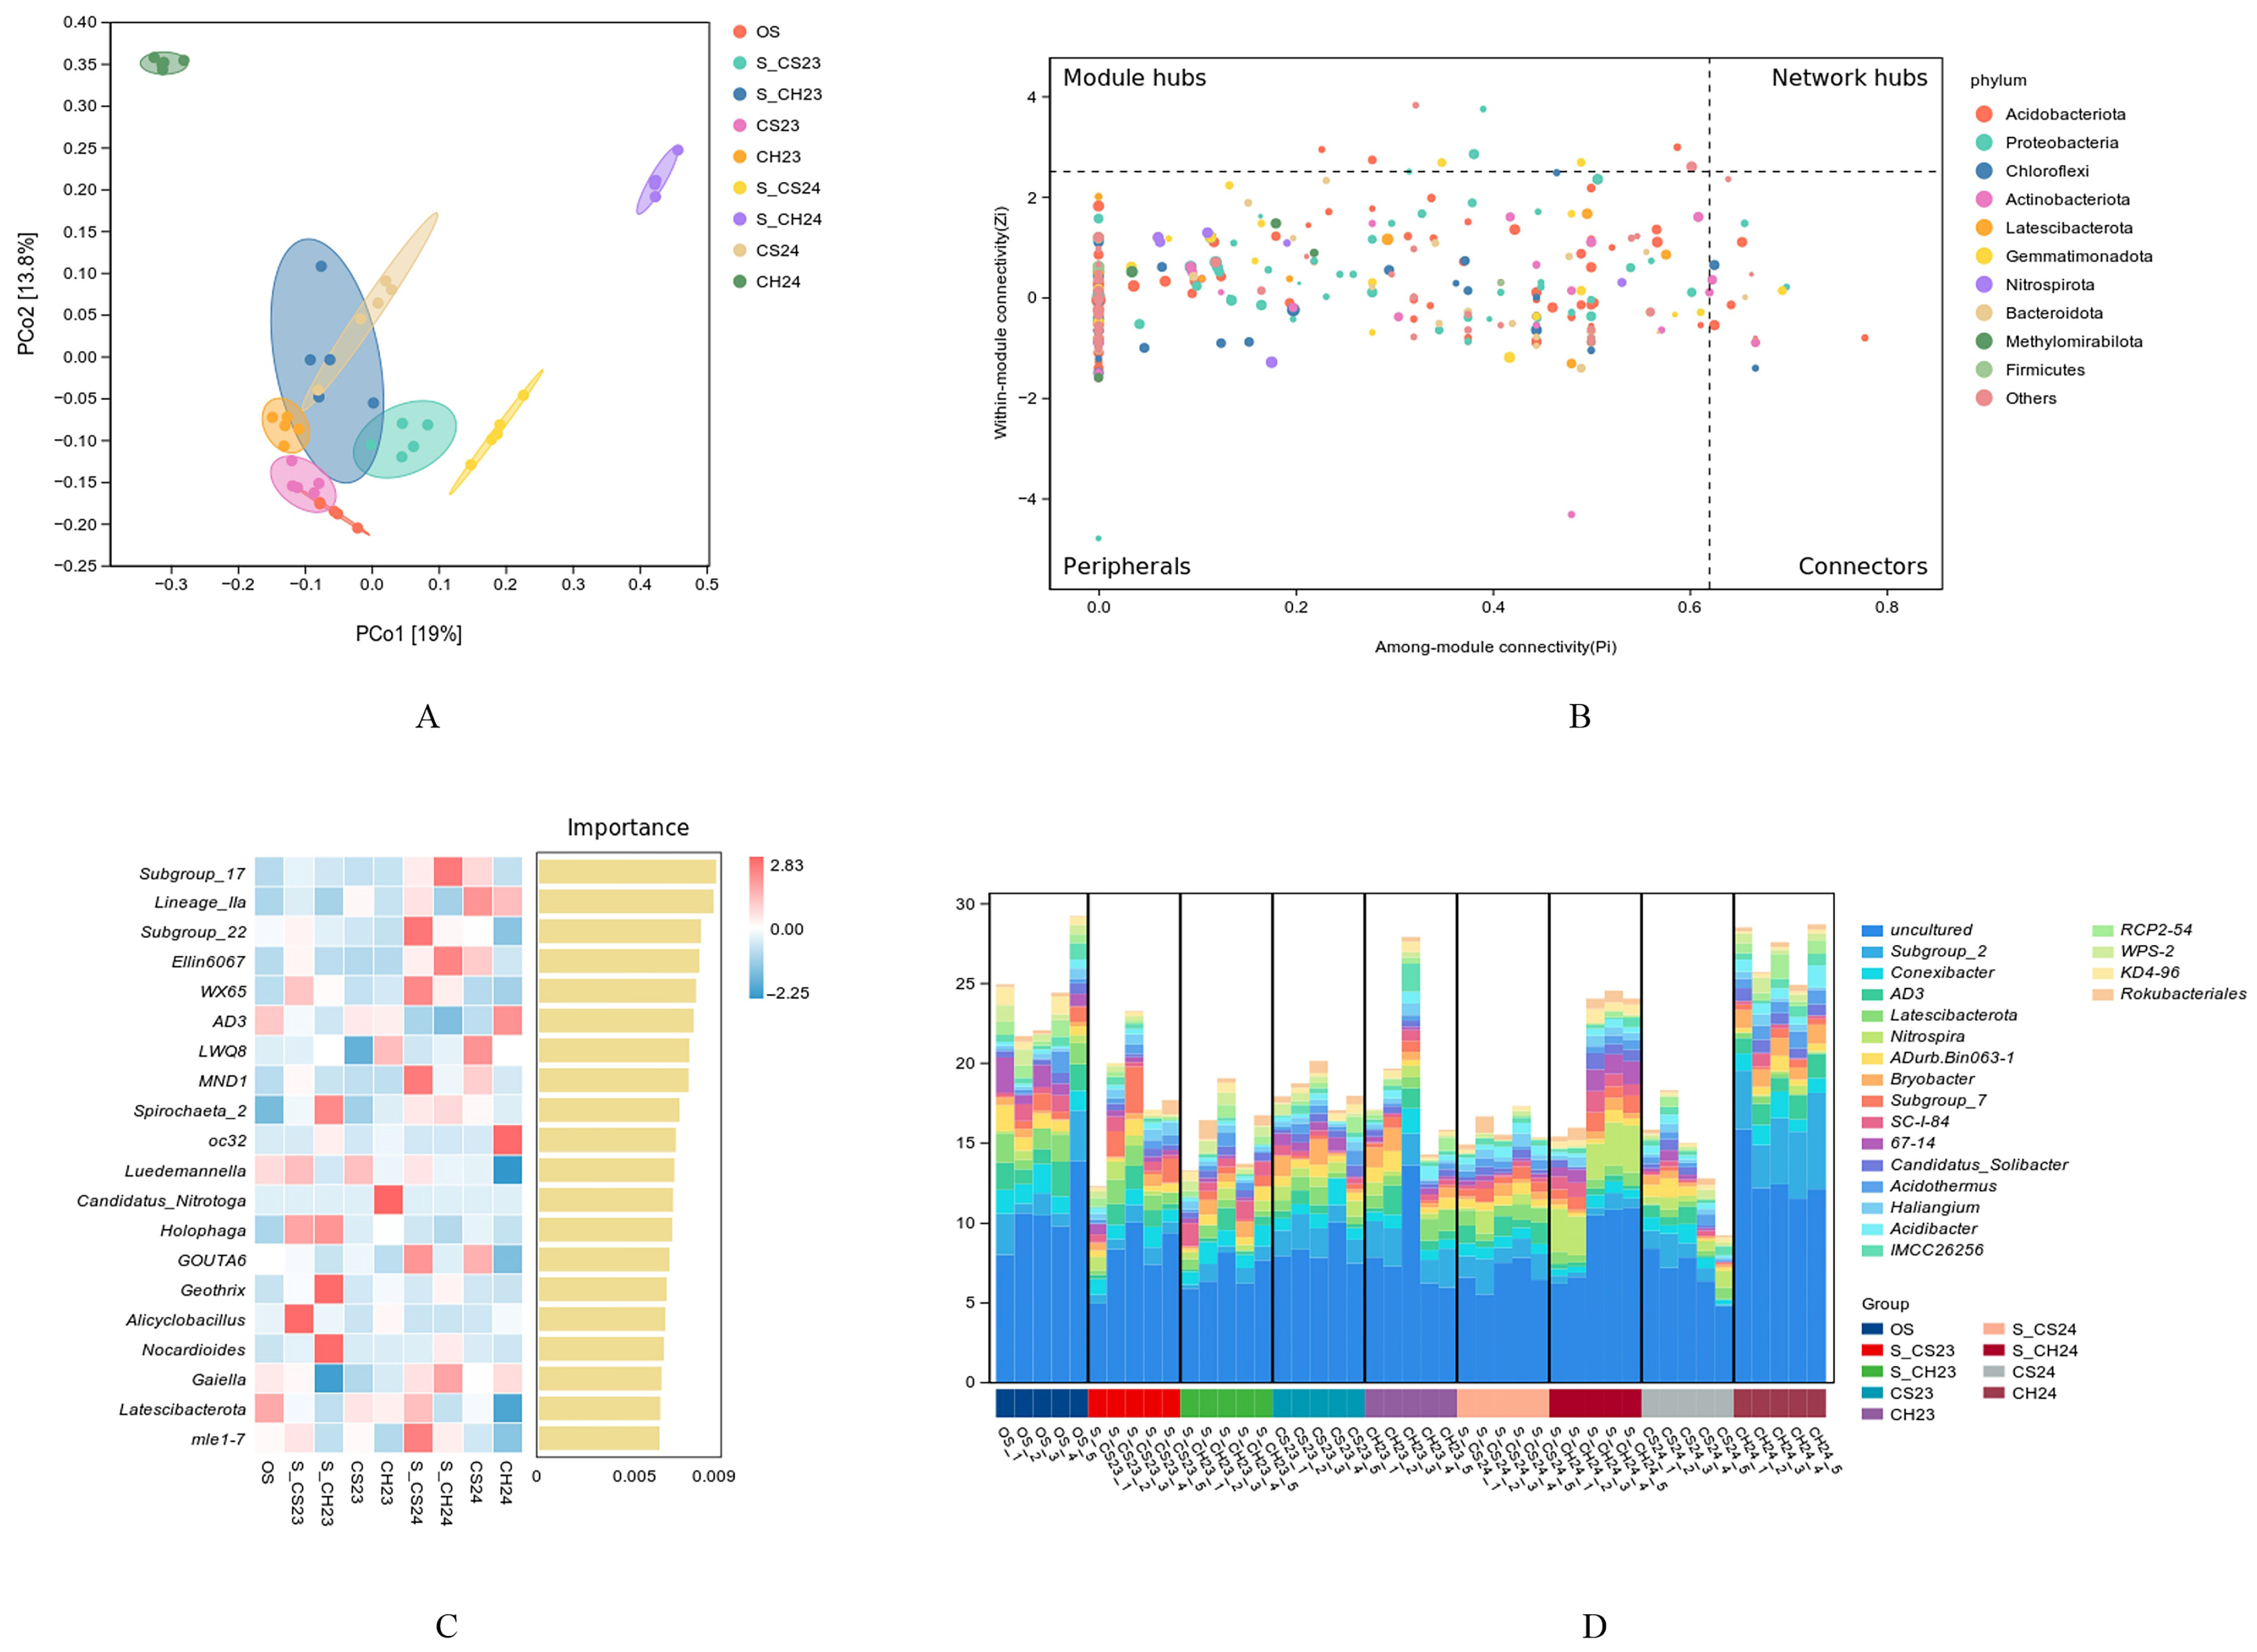
3.2.1. Changes in the Characteristics of Soil Bacterial Diversity

Eight experimental treatments (S-CS23, S-CH23, CS23, CH23, S-CS24, S-CH24, CS24, and CH24) and one control group (OS) yielded a total of 25 soil samples, generating 2,936,734 ASVs with an average sequence length of 418 bp. After clustering the ASVs at 100% similarity, 2,529,449 noise-filtered ASVs were obtained. Following assembly, the total number of ASVs was reduced to 2,048,821, and after removing singletons, the final number of ASVs was 1,987,409. All the normalized data were taxonomically annotated to 1 domain, 32 phyla, 89 classes, 182 orders, 249 families, 315 genera, and 67 species (Table S1). Determination of the overall average microbial composition on the base of the abundance of the top 100 ASVs revealed that the most abundant phyla across all the samples included Acidobacteria, Proteobacteria, Chloroflexi, Actinobacteria, Gammaproteobacteria, Latescibacterota, Nitrospiria, Alphaproteobacteria, and Methylomirabilia (Figure 1A). For alpha diversity analysis, the Chao1 and Faith indices were used to estimate species richness, whereas the Shannon index was used to measure species diversity. According to Table 2, the bacterial community coverage index exceeded 98% across all the treatments, indicating a high level of coverage. This sequencing depth was sufficient to meet the requirements for further analysis. A significant difference in soil microbial diversity was observed among the various treatments. Compared with those in the OS treatment, the species diversity and richness of the bacterial communities in the soil after D. indusiata cultivation significantly increased. Both metrics peaked following natural recovery in the second year, suggesting that cultivating D. indusiata in the forest can increase soil microbial diversity. The rarefaction curve analysis also demonstrated that, at the same sequencing depth, S-CH24 presented the highest diversity (Figure S1A–D). On the basis of the Bray–Curtis algorithm, principal coordinate analysis (PCoA) revealed significant differences (p < 0.05) in the structure of the bacterial communities among some of the different treatments. The first and second principal coordinates (PCo1 and PCo2) accounted for 32.8% of the variation in the bacterial community structure (Figure 2A). Notably, the bacterial communities of S-CH24 and S-CS24 were spatially distinct from those of the other groups in the two-dimensional plot, with their distribution positions being relatively dispersed and showing clear structural differences. The high reproducibility among samples within the same treatment and the differences in community composition among dispersed samples indicated that the bacterial composition at the ASV level was similar across the sampling points.

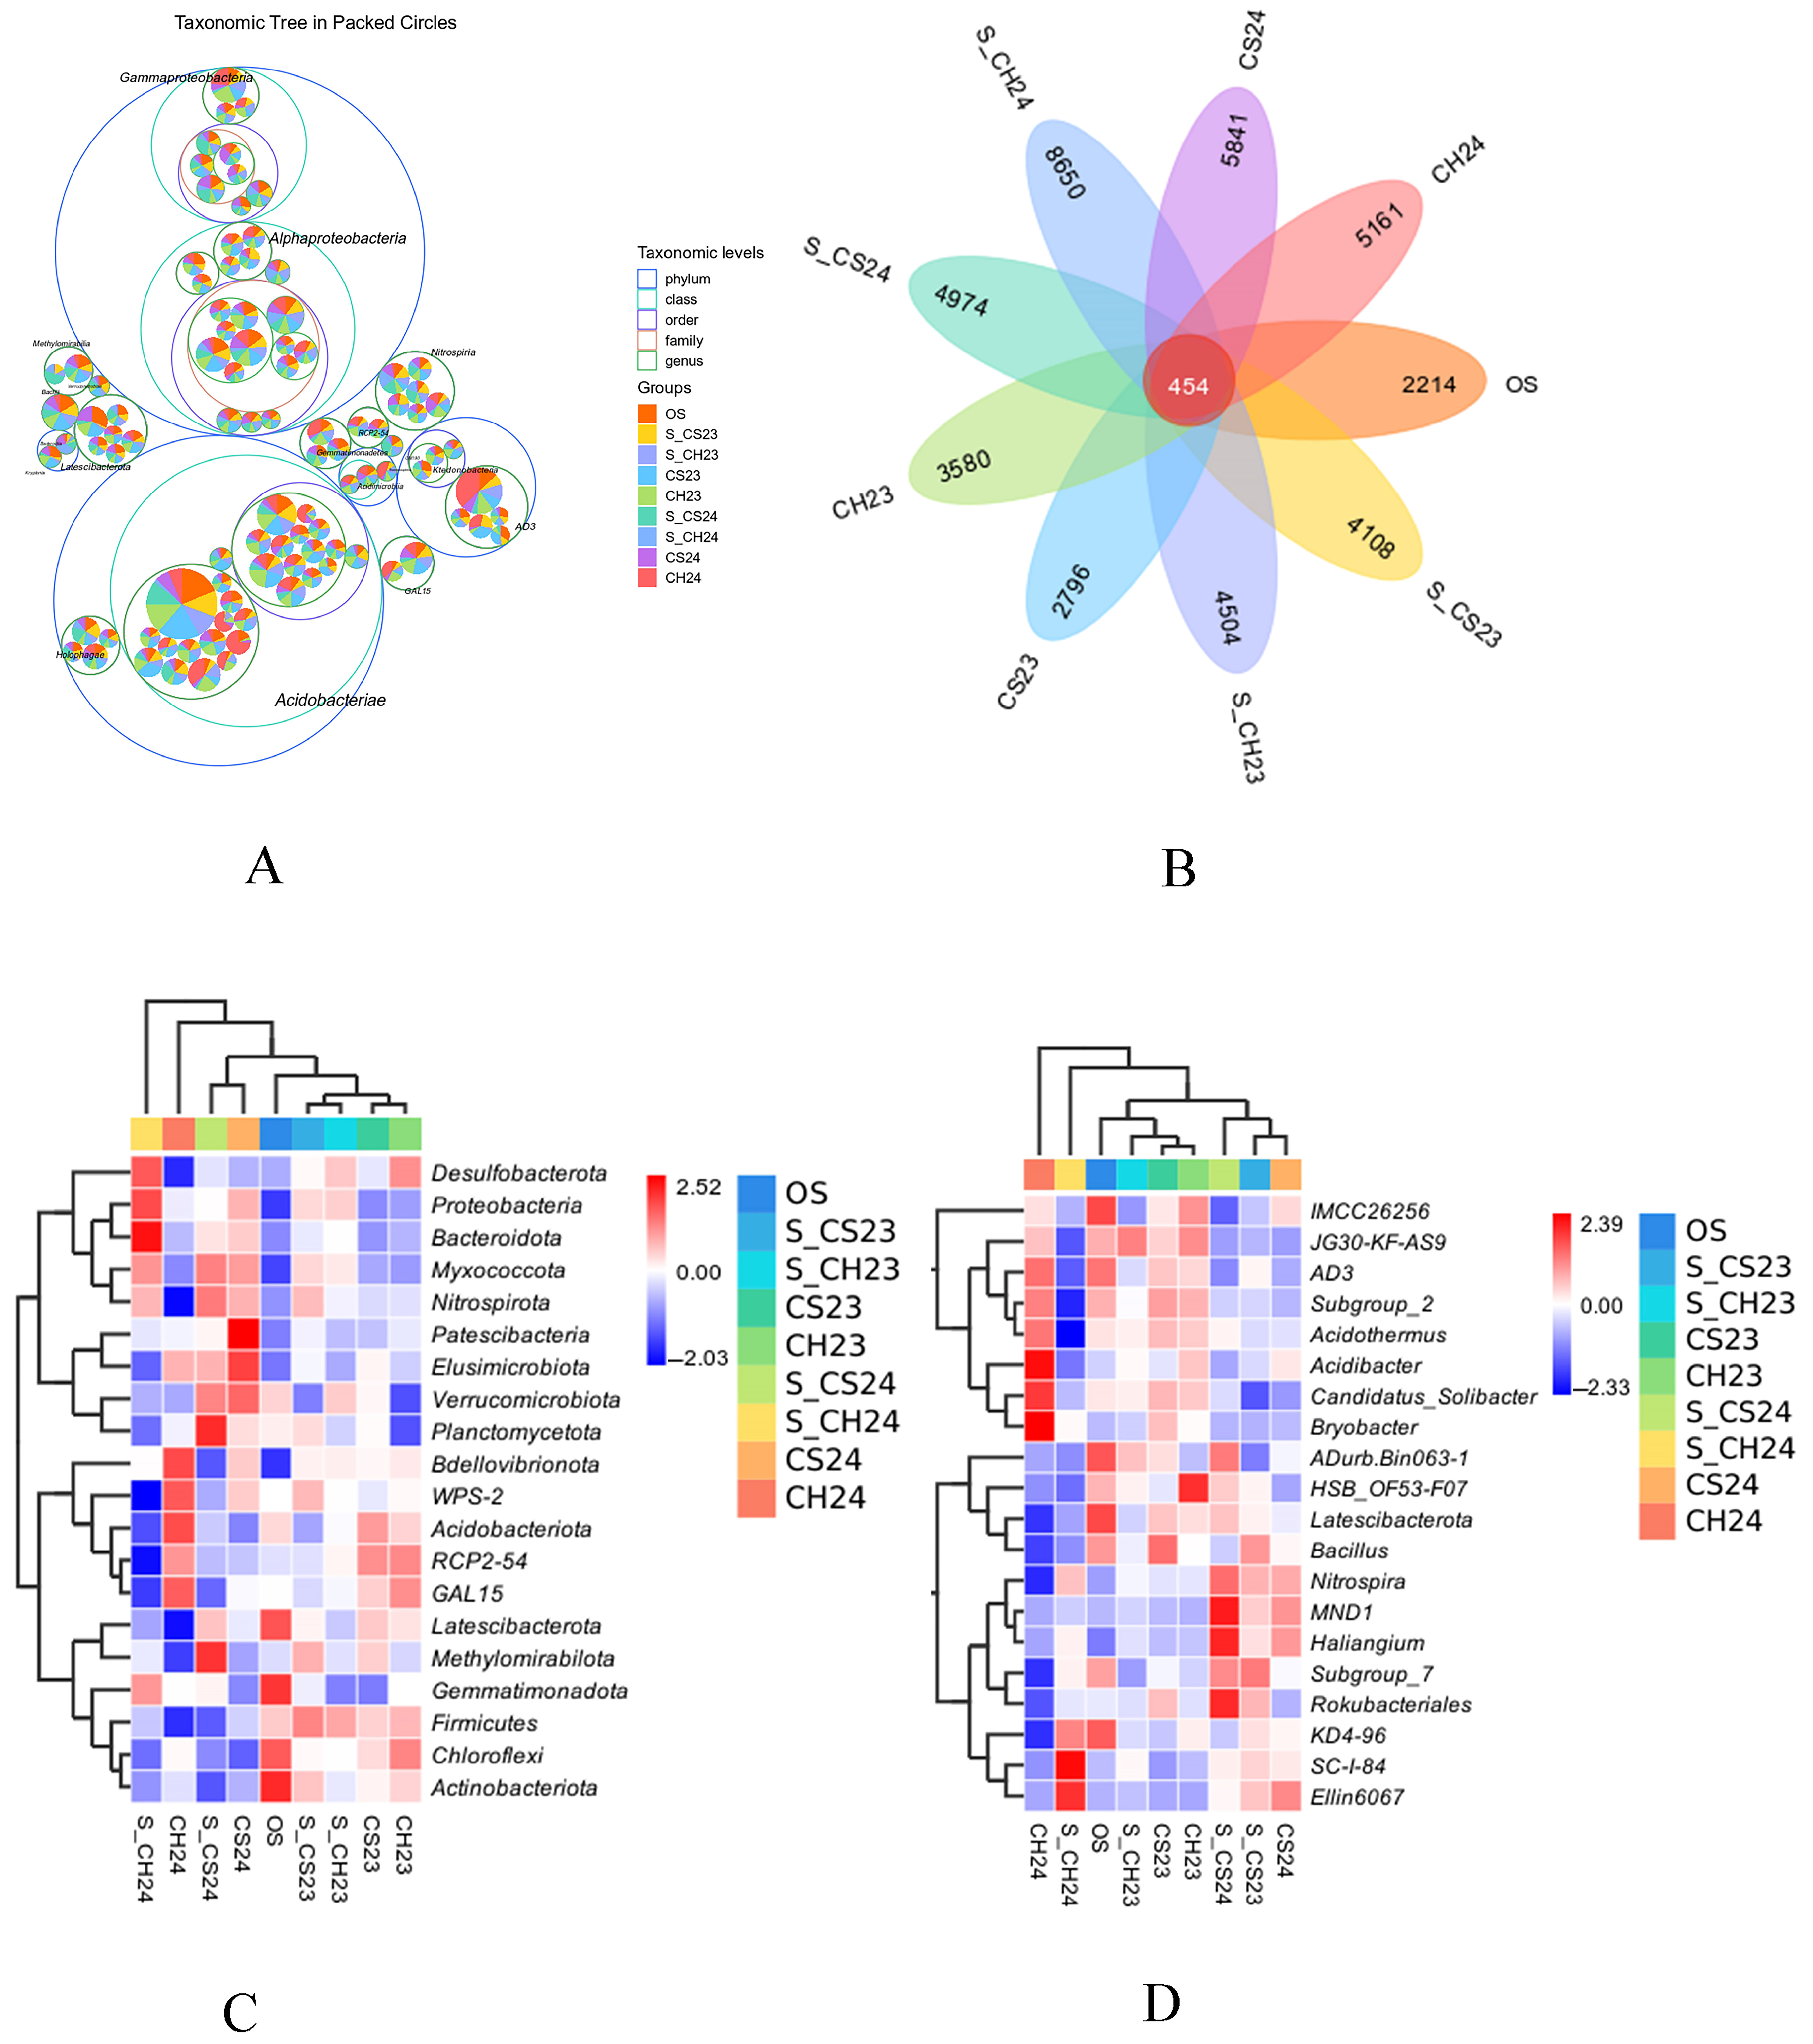
3.2.2. Analysis of the Composition and Structure of the Soil Bacterial Communities

A total of 454 ASVs were identified as being shared across all the treatments (Figure 1B). A heatmap illustrating the composition of the top 20 species present in all the samples is presented in Figure 1C,D. Following the progressive natural recovery of D. indusiata cultivation soil under shaded conditions, the 2023 bacterial communities demonstrated phylogenetic convergence with the original soil (OS) community, showing similarity at both the phylum and genus taxonomic levels (Figure S2E). At the phylum level, the dominant taxa included Acidobacteriota (average relative abundance 22.94–29.32%), Proteobacteria (19.71–25.44%), Chloroflexi (9.11–12.26%), Actinobacteriota (8.69–11.23%), Verrucomicrobiota (2.93–4.02%), Gemmatimonadota (2.75–4.79%), Myxococcota (2.31–3.93%), and Latescibacterota (2.12–4.36%) (Figure S2A). At the genus level, the key taxa identified were Burkholderia, Rokubacteriales, Bradyrhizobium, Nitrospira, Haliangium, Gemmatimonas, and Bacillus (Figure S2B). By 2024, bacterial communities across S-CS24 and SC24 exhibited phylogenetic convergence with the original soil (OS), maintaining similarity at both the phylum and genus taxonomic levels (Figure S2E). At the phylum level, the dominant taxa included Acidobacteriota (20.39–32.21%), Proteobacteria (19.71–29.13%), Actinobacteria (7.39–11.23%), Chloroflexi (6.59–12.26%), Gemmatimonadota (2.82–4.79%), and Planctomycetota (1.90–3.49%) (Figure S2C). At the genus level, the key taxa identified were genus of Latescibacterota, Candidatus solibacter, Bryobacter, Subgroup, Acidothermus, and Bradyrhizobium (Figure S2D). According to the results of the random forest analysis, after more than a year of natural restoration, the soil used for cultivating D. indusiata in the forest significantly changed. Notably, Candidatus nitrotoga, Alicyclobacillus, and genus of Latescibacterota became key indicator genera at the species level (Figure 2C).

3.2.3. Molecular Ecological Network Structure of the Soil Bacterial Communities

Through modularity analysis of co-occurrence networks, topological roles were quantified using within-module (Zi) and among-module (Pi) connectivity indices for all nodes across treatment groups. These parameters enable the classification of ASVs into four functional guilds, namely, peripherals (module-restricted specialists), connectors (intermodule generalists), module hubs (intramodule generalists), and network hubs (panmodule supergeneralists), following the established ecological network theory [44]. Phylum-level Zi–Pi profiling identified Acidobacteria, Proteobacteria, and Gemmatimonadota as architectural keystone taxa (Figure 2B), whereas genus-level analysis revealed functional pivots, including genus of Latescibacterota, Nitrospira, Candidatus solibacter, and Acidibacter (Figure S3A).

3.2.4. Functional and Metabolic Characteristics of Soil Bacterial Communities

Functional profiling of 16S rRNA sequencing data across nine treatments revealed 502 differentially abundant metabolic pathways (Kruskal–Wallis test, FDR < 0.05), which were enriched predominantly in five functional categories, such as biosynthesis, degradation/utilization/assimilation, generation of precursor metabolites and energy, macromolecule modification, and specialized metabolic clusters. Targeted analysis of EC number-normalized pathway abundances revealed substantial microbial community restructuring in S-CH23, S-CS23, and S-CH24, particularly within propionic acid I synthesis (Figure 2D) and 4-coumaric acid metabolism. The signature differentially abundant taxa included genus of Latescibacterota, Candidatus solibacter, Acidibacter, Bradyrhizobium, and Rokubacteriales (Figure S3B,C). However, in the D. indusiata cultivation treatments in 2023 (CS23 and CH23), the species changes were not significantly different from those observed in the OS.

3.3. Targeted Metabolic Analysis of Organic Acids in D. indusiata Cultivation Soil

3.3.1. Sample Quality Control by LC–ESI–MS/MS

LC–ESI–MS/MS enabled comprehensive profiling of 65 organic acid metabolites across five experimental treatments: OS, CS24, CH24, S-CS24, and S-CH24 (Table S2). System stability was verified through total ion current chromatogram (TIC) alignment of quality control (QC) samples (n = 5), which revealed retention time shifts <0.3% across analytical batches (Figure S4A). The raw mass spectrometry data were processed using MultiQuant 3.0.3 software (AB Sciex, Framingham, MA, USA) to integrate and correct the chromatographic peaks of organic acids detected in different samples on the basis of the retention time and peak shape of the reference standards. This ensured accurate qualitative and quantitative analysis. Pearson correlation analysis of the QC samples revealed that |r| > 0.99, indicating a high degree of correlation between the samples. The closer |r| is to 1, the greater the correlation, reflecting better stability in the detection process and higher data quality (Figure S4B). The coefficient of variation (CV), defined as the ratio of the standard deviation to the mean of the original data, reflects the degree of data dispersion. Using the empirical cumulative distribution function (ECDF), the frequency of CV values was analyzed for substances with values below a reference threshold. In this study, more than 80% of the QC samples had CV values less than 0.2, indicating that these results confirmed analytical robustness for subsequent multivariate analysis (Figure S4C).

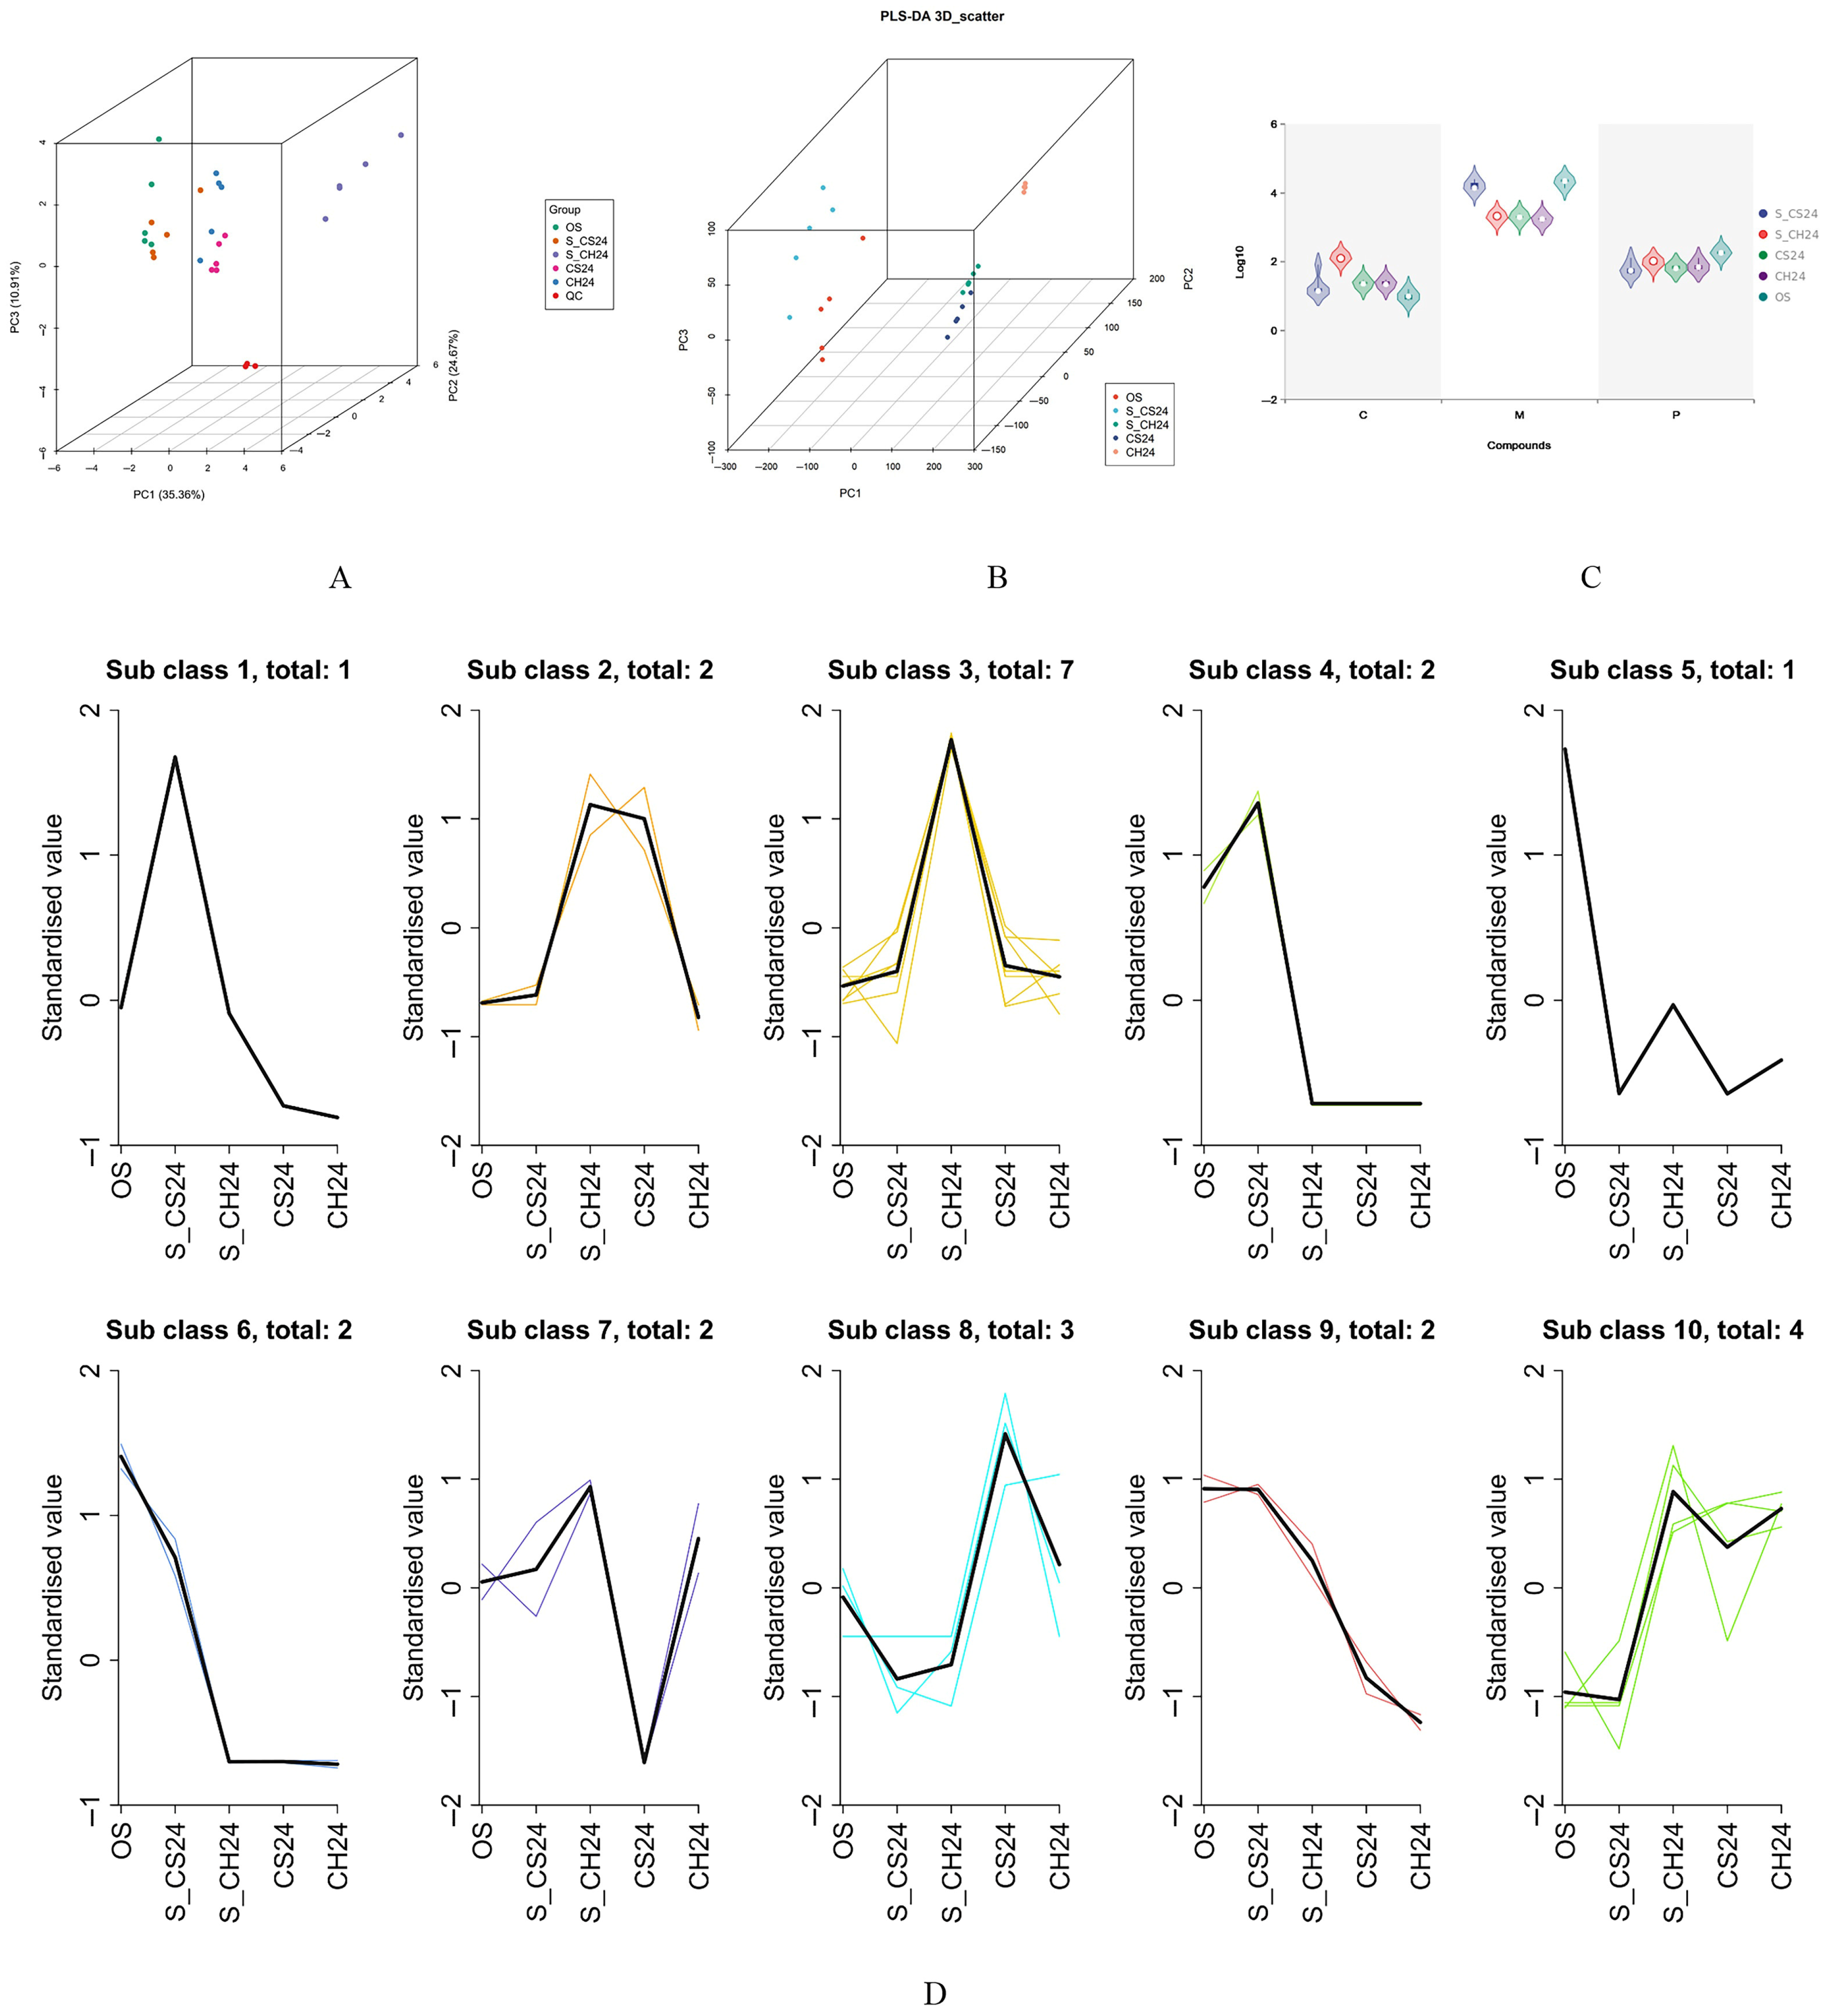
3.3.2. Multivariate Statistical Analysis

PCA, an unsupervised multivariate technique, was performed to elucidate the metabolic profiles of OS, S-CS24, S-CH24, CS24, and CH24 (Figure 3A). The first three principal components (PC1 35.36%, PC2 24.67%, and PC3 10.91%) cumulatively accounted for 70.94% of the total variance. Following one year of natural restoration, S-CS24 presented the closest metabolic profile to OS, S-CH24 presented the closest metabolic proximity to OS in the PCA score plot, and S-CH24 presented maximal separation from OS, indicating significant metabolic divergence between S-CH24 and OS. To enhance intergroup discrimination, PLS-DA was subsequently employed as a supervised multivariate approach. The model incorporated categorical class labels as response variables to maximize covariance between predictor metabolites and group separation. Through the orthogonal rotation of latent variables, this method effectively segregated intergroup observations while identifying metabolite signatures that contributed most significantly to group differentiation (VIP > 1.5). The PLS-DA score plot revealed distinct clustering patterns: S-CH24 and CS24 formed a cohesive cluster within the metabolic space (R2Y = 0.955, Q2 = 0.897), whereas S-CS24 and OS showed substantial overlap (Figure 3B). The strong concordance between the PCA and PLS-DA results provides mutual validation of the metabolic trajectory variations observed during natural restoration processes.

3.3.3. Analysis of Differentially Abundant Metabolites

Comparative metabolomic profiling revealed 26 significantly altered metabolites with a fold change (FC) ≥ 2 or ≤0.5 across the experimental treatments (OS, CH24, CS24, S-CH24, and S-CS24). These metabolites included levulinic acid, 4-coumaric acid, maslinic acid, lactic acid, pantothenic acid, and benzoic acid (Table S3). Comparative metabolomic analysis revealed distinct changes in organic acid levels across the experimental groups. In the CH24 vs. OS comparison, significant reductions were observed in 3-hydroxyisovaleric acid (log2FC = −2.01), benzoic acid (log2FC = −1.06), maslinic acid (log2FC = −3.64), and pantothenic acid (log2FC = −1.23) levels, with 4-coumaric acid (log2FC = 1.19) being the sole compound showing increased abundance. The CS24 vs. OS comparison exhibited contrasting patterns: 3-hydroxyisovaleric acid (log2FC = 1.07), 4-coumaric acid (log2FC = 1.19), lactic acid (log2FC = 3.07), and L-pyroglutamic acid (log2FC = 1.38) levels were significantly elevated, whereas the 3-hydroxyisovaleric acid (log2FC = −1.64), maslinic acid (log2FC = −3.38), and pantothenic acid (log2FC = −1.45) levels were markedly decreased. SMS bedding amended with C. fungigraminus and SMS (S-CH24) induced substantial increases in the soil concentrations of 4-coumaric acid (log2FC = 3.68), p-hydroxybenzoic acid (log2FC = 1.07), lactic acid (log2FC = 2.75), shikimic acid (log2FC = 1.86), and taurine (log2FC = 1.64), concurrent with reduced maslinic acid (log2FC = −3.39) levels. In the S-CS24 system, SMS bedding combined with C. fungigraminus and sawdust significantly decreased (R)-2-hydroxybutyric acid (log2FC = −2.68), pantothenic acid (log2FC = −1.45), salicylic acid (log2FC = −1.52), and shikimic acid (log2FC = −3.12) levels, whereas 4-coumaric acid (log2FC = 1.42), benzoic acid (log2FC = 1.13), and ferulic acid (log2FC = 1.42) levels increased Table S4). The differentially abundant metabolites presented distinct response patterns across treatments. Following standardization and mean centering of relative metabolite abundances, K-means cluster analysis partitioned all differentially abundant metabolites into 10 distinct expression profiles (Figure 3D, Table S3). This investigation revealed significant treatment-specific effects of formulation additives and bedding materials on the soil metabolite composition during D. indusiata cultivation under forest restoration. Compared to original cultivation soil, natural restoration significantly reduced soil concentrations of maslinic acid, pantothenic acid, salicylic acid, and shikimic acid. Similarly, the non-bedding treatment resulted in decreased levels of 3-hydroxyisovaleric acid, pantothenic acid, and maslinic acid relative to those in the baseline soil conditions (Figure 3C). Notably, both treatments consistently depleted maslinic acid and pantothenic acid, demonstrating their sensitivity to disturbances during D. indusiata cultivation in forest ecosystems.

3.4. Metabolite and Microbial Enrichment Analysis

Multivariate analysis incorporating the Mantel test and correlation matrices revealed significant associations between soil biogeochemical parameters (TN, SOC, AMN, and NIN), differentially abundant metabolites, and microbial taxa involved in 4-coumaric acid metabolism and propionic acid I production through lactic acid fermentation. Network analysis demonstrated strong microbiome–metabolome interactions, with environmental factors driving significant enrichment of Acidothermus and SC-I-84 in postrestoration soils (Figure 4A). Metabolite profiling revealed that differentially abundant compounds increased the relative abundance of genus of Latescibacterota, Rokubacteriales, and Bacillus. Strong phylogenetic co-occurrence patterns emerged between the genus of Latescibacterota and both Rokubacteriales and Bacillus. Intriguingly, 4-coumaric acid accumulation dose-dependently suppressed key taxa, genus of Latescibacterota (y = −27.27x + 78.11), Candidatus solibacter (y = −3.59x + 24.76), Acidibacter (y = −8.29x + 41.02), and Bacillus (y = −6.8x + 23.12), across the 4-coumaric acid metabolic pathway (p < 0.05, Figure 4B–E).

3.5. KEGG Enrichment Analysis of Soil Bacterial Diversity and Differentially Abundant Metabolites

A comparative analysis of bacterial community composition and KEGG pathway enrichment was conducted across five experimental treatments (OS, CH24, CS24, S-CH24, and S-CS24). The investigation revealed two conserved metabolic pathways shared by all four treatment groups (CH24, CS24, S-CH24, and S-CS24) compared to the OS baseline. Notably, three treatments (CH24, CS24, and S-CH24) exhibited significant pathway divergence from the OS control through coordinated regulation of multiple metabolic networks, including cellular signaling processes (pathways in cancer (ko05200) and two-component systems (ko02020)), carbon assimilation mechanisms (carbon fixation pathways (ko00720) and carbon fixation by the Calvin cycle (ko00710)), energy metabolism modulation (pyruvate metabolism (ko00620), glyoxylate and dicarboxylate metabolism (ko00630), the citrate cycle (TCA cycle) (ko00020), and methane metabolism (ko00680)) (Tables S5–S9).

4. Discussion

The basidiomycete D. indusiata represents a model species for edible mushroom cultivation utilizing fermentation-based substrates coupled with soil covering. Critical cultivation parameters, including the fruiting body development rate, biomass yield, and product quality, significantly depend on edaphic characteristics, including soil physicochemical properties (particularly heavy metal content), microecological equilibrium, and enzymatic activity profiles (Figure 5) [45,46,47,48]. Recent investigations have revealed that both environmental gradients and anthropogenic interventions profoundly modulate fungal growth dynamics through multifaceted impacts on soil microbiome composition, enzyme activity, and pedological parameter evolution [49,50,51].

4.1. Enhancing Soil Quality Through Edible Mushroom Cultivation in the Forest Understory

Recent mycological studies have revealed significant bioremediation potential in fungal cultivation systems; Jiang et al. demonstrated that FQ1 strain inoculation increased fungal biomass production by 26.68–43.58%, concomitant with increased cadmium (Cd) accumulation, ranging from 14.29% to 97.67% [52] Li et al. reported that D. indusiata cultivation led to a 58.13% reduction in human-targeted dioxin toxicity indices [53]. Kaur et al. established that Pleurotus ostreatus cultivation systems effectively mitigated industrial toxicity while simultaneously increasing lignocellulosic product yields and quality parameters in paper manufacturing processes [54]. These findings suggested that edible mushrooms have substantial biostimulatory effects on agricultural ecosystems during their developmental phases. Specifically, cultivating D. indusiata using fermented substrate elevated the levels of soil soluble organic carbon level, microbial biomass carbon, increased basal respiration, and enhanced enzymatic activities of β-glucosidase, L-asparaginase, and alkali phosphatase. Additionally, the incorporation of compost significantly improved water retention and microbial activity, thereby enhancing the suitability of bauxite residue sand as a growth medium [55]. Initially, D. indusiata cultivation under the forest canopy in the SMS padding group did not significantly improve the soil quality during the first year. However, after one year of natural recovery, substantial increases were observed in soil TN, SOC, SCAT, and SL, while soil pH stabilized. Adding SMS and grass-based substrates to saline-alkaline soil reduced the pH by 12.33% and increased SOC content by 46.55%. What is more important is that reeds have been demonstrated as effective substrates for mushroom cultivation, with subsequent SMS application further enhancing saline-alkaline soil properties [10]. The cultivation substrate retains substantial fungal biomass following D. indusiata growth, serving as a key mechanism for soil organic carbon sequestration. These herbaceous substrates act as energy substrates for soil microbiota, transforming these residues into more stabilized carbon forms while significantly mitigating greenhouse gas (CH4 and N2O) emissions [56]. Therefore, cultivating edible mushroom using C. fungigraminus fermented materials under the forest canopy can increase soil carbon storage, organic matter content, enzyme activity and microbial activity, while reducing the soil salinity and improving soil quality.

4.2. The Impact of Edible Mushroom Cultivation in Forest Understory Conditions on Soil Organic Acids

Low-molecular-weight organic acids (LMWOAs), key drives of soil acidity, contribute to soil acidification while influencing rhizosphere biochemistry and plant metabolic processes. Soil pH dynamics serve as a critical indicator for assessing the impact of soil pH on its physicochemical properties. LMWOAs are regulated by interdependent environmental factors, including the soil pH, temperature, moisture, microbial metabolism, and organic matter composition [57]. Applying fermented microbial consortia derived from Pleurotus eryngii spent substrate to Rehmannia glutinosa cultivation systems resulted in 75.3% degradation of phenolic acids (e.g., hydroxybenzoic acid, vanillic acid, eugenol, vanillin, and ferulic acid), with significant reductions in particularly observed in hydroxybenzoic acid and vanillin levels [58]. Soil microecological analysis revealed that exogenous organic acid amendments synergistically enhanced microbial biomass and enzyme activities while optimizing bacterial α-diversity and β-diversity patterns when coapplied with fungal amendments. Notably, citric acid supplementation increased the Cd phytoextraction efficiency by 59.19% compared to individual fungal treatments. These results highlighted the dual role of organic acids in improving soil microecology and facilitating heavy metal extraction, offering a novel bioremediation strategy for Cd-contaminated soils [59]. After 12 months of natural attenuation, forest soils amended with C. fungigraminus, sawdust, and SMS presented a significant increase in the 4-coumaric acid concentration, which peaked in the bedding material containing C. fungigraminus and SMS. In contrast, the maslinic acid and pantothenic acid levels decreased consistently across all treatments. 4-coumaric acid mechanistically inhibited plant developmental processes through allopathic regulation of germination energetics and meristematic cell elongation [60,61]. The observed accumulation of 4-coumaric acid likely represents an adaptive phytoprotective response to allelopathic stress mediated by phenylpropanoid signaling pathways [62]. According to our findings, 4-coumaric acid exhibited strong antibacterial properties and functioned as an allelochemical, promoting growth at low concentrations and inhibiting growth at high concentrations [18]. Therefore, long-term monitoring of organic acids like 4-coumaric acid in understory soil is crucial for assessing the impact of D. indusiata cultivation on soil quality.

4.3. Impact of Edible Mushroom Cultivation in Forest Understory Conditions on Soil Microorganisms

Metagenomic analysis of mushrooms cultivated on different substrates revealed that resistance genes were significantly enriched on mushroom surfaces when grown on corn-based compost, compared to those grown on grass (rice/wheat) substrates, which coincides with microbial migration [63]. Canonical correspondence analysis revealed that the soil nutritional conditions and physical changes induced by Floccularia luteovirens shaped the microbial communities within its cultivation zones [64]. Therefore, selecting high-quality, safe, stable cultivation materials is crucial for the sustainable development of forest-based mushroom cultivation. For C. fungigraminus, which is widely cultivated in both southern and northern China, yields of up to 90 tons per hectare can be achieved without pesticide use [6,7]. The low-input cultivation methodology makes it an ideal choice for sustainable mushroom production. Consequently, sourcing high-quality and pathogen-free cultivation materials is essential for establishing environmentally sustainable value chains in forest-based mushroom cultivation.
Microbial fertilizer alleviates soil acidification, increases available potassium and organic matter levels, and enhances nitrate reductase activity in tobacco rhizosphere soil. Abundances of Acidobacterota, genus of Latescibacterota, Mortierellomycota, Basidiomycota, and Rozellomycota are significantly correlated with environmental factors [65]. Compared with OS, after D. indusiata was cultivated in the forest, Candidatus solibacter, Alicyclobacillus, and genus of Latescibacterota became key indicator genera. Straw incorporation increased the contribution of dispersal limitation to bacterial and fungal community assembly. Latescibacterota and Mortierellomycota were more abundant in straw-amended soils because of their ability to decompose straw residues [66]. Compared with chemical fertilizers, manure fertilizers reduced the Cd concentration in rice by 33.14% and 15.88%. This reduction was achieved by increasing the SOM content, pH, and the abundance of microbial phyla such as genus of Latescibacterota and Gemmatimonadota, which decreased Cd availability in the soil. Low-rate manure application, especially in combination with chemical fertilizers, is recommended to ensure safe rice production by mitigating Cd uptake [67]. At both arsenic (As)- and antimony (Sb)-contaminated sites, the families Nitrosomonadaceae, Pedosphaeraceae, Halieaceae, and Latescibacterota presented positive correlations with As and Sb concentrations, indicating their potential resistance to As and Sb toxicity. This study elucidated key microbial populations in As- and Sb-contaminated rice terraces, providing valuable information for remediation efforts [68]. Beech forest soils with high phosphorus contents present significantly greater microbial activity, particularly for Candidatus solibacter, a dominant species [69]. Bacteria of genera such as Acidothermus, Acidibacter, Bryobacter, Candidatus solibacter, and Acidimicrobiales promote the biosynthesis and accumulation of 1,8-cineole, cypressene, limonene, and α-terpineol; in contrast, Nitrospira and Alphaproteobacteria species may inhibit these processes [53]. Latescibacterota species are closely related to heavy metal fixation and absorption. An increase in the genus of Latescibacterota abundance after mushroom cultivation may reduce soil heavy metal contents. Yuan et al. demonstrated that rice straw incorporation and high-rate manure fertilizers lowered brown rice Cd by reducing available Cd (Avail-Cd) and acid-soluble Cd (Acisingle-Cd), alongside forming low-crystalline iron plaque (IP-Feh/Cd) [67]. Manure boosted SOM, pH, and Latescibacterota abundance, reducing Cd bioavailability, while elevating soil CEC and Fe2+ to stimulate root iron plaque and inhibit Cd2+ uptake.

4.4. Insights from Developing an Understory Economy for Agricultural Adjustment

The cultivation of Oudemansiella tanzanica has demonstrated potential for agricultural waste use and sustainable mushroom production. Using sisal waste and paddy straw with chicken manure results in higher biological efficiency than conventional substrates, reducing the cultivation cycle to just 24 days. The spent substrate can be used for bioremediation and soil improvement, supporting circular agricultural [70]. This gramineous biomass-based cultivation system not only relies on traditional wood-based models but also drives the diversification of agroecosystems through efficient land use and the integration of ecological economic objectives, thereby generating rural employment opportunities. However, the observed accumulation of cadmium and zinc in fruiting bodies, despite uncontaminated soil conditions, underscores a critical biosafety challenge. Forest stand composition, particularly in beech- and spruce-dominated ecosystems, appears to modulate heavy metal transfer dynamics [71]. These findings emphasize the need for systematic contamination monitoring across various forest typologies, even in ostensibly pristine environments. Future research should prioritize the elucidation of species-specific metal translocation mechanisms and the development of mitigation strategies to ensure food safety.

5. Conclusions

Fujian Province has 8.07 million hectares of forest area, with a coverage rate of 65.12%, the highest in China. This extensive forest resource supports a flourishing understory economy marked by industrial diversification, reduced agricultural risk, and substantial rural employment opportunities, thereby enhancing both ecological and socioeconomic benefits. The innovative agroforestry model integrates C. fungigraminus and a spent mushroom substrate for D. indusiata cultivation under canopy conditions. Post-cultivation monitoring revealed that 12 months of natural recovery, soil pH stabilized while levels of total nitrogen, organic matter, and enzyme activity significantly increased. Notably, the concentration of the 4-coumaric acid, pantothenic acid, and sorbic acid increased markedly. Furthermore, this model significantly enhanced bacterial diversity in the second year and recruited key genera such as Candidatus nitrotoga, Alicyclobacillus, and genus of Latescibacterota. Importantly, environmental factors and differentially abundant organic acids were found to promote Acidothermus, genus of Latescibacterota, Rokubacteriales, and Bacillus growth in the short term. However, the potential for heavy metal bioaccumulation, particularly cadmium translocation factors, in fruiting bodies of understory crops warrants systematic investigation. Future research should incorporate longitudinal monitoring and predictive modeling to ensure compliance, which is critical for the large-scale implementation of sustainable agroforestry systems in mushroom cultivation.

Supplementary Materials

The following supporting information can be downloaded at: https://www.mdpi.com/article/10.3390/agriculture15141533/s1, Figure S1: Sparse curves based on different evaluation criteria of the Chao1 (A), Faith (B), Good coverage (C), and Shannon (D) indices. The SMS bedding group comprised a mixture of 49% C. fungigraminus, 49% sawdust, 1% urea and 1% calcium bicarbonate (S-CS) and a mixture of 49% C. fungigraminus, 49% SMS, 1% urea and 1% calcium bicarbonate (S-CH). The non-SMS bedding group included a combination of 49% C. fungigraminus, 49% sawdust, 1% urea and 1% calcium bicarbonate (CS) and a blend of 49% C. fungigraminus, 49% SMS, 1% urea and 1% calcium bicarbonate (CH). Undisturbed forest soil (OS) served as the control.; Figure S2: Heatmaps of the composition of the top 20 species at the phylum (A) and genus (B) levels under different treatments and in the control group in 2023. The colour gradient from red to blue indicates higher to lower abundances. Heatmaps of the composition of the top 20 species at the phylum (C) and genus (D) levels in the different treatment and control groups in 2024. The colour gradient from red to blue indicates higher to lower abundances. (E) NMDS was performed for rank ordering of sample dissimilarities to project high-dimensional data into a low-dimensional space while preserving relative distance relationships rather than absolute metric distances. This ordination method relies solely on rank-based comparisons, rendering it robust to nonlinear distance scaling effects and particularly effective for structurally complex datasets where conventional metric assumptions may fail. The reliability of NMDS configurations is quantified by the stress value (range: 0–1), with lower values (<0.2) indicating satisfactory ordination accuracy according to Kruskal’s criterion. The SMS bedding group comprised a mixture of 49% C. fungigraminus, 49% sawdust, 1% urea and 1% calcium bicarbonate (S-CS) and a mixture of 49% C. fungigraminus and 49% SMS, 1% urea and 1% calcium bicarbonate (S-CH). The non-SMS bedding group included a combination of 49% C. fungigraminus, 49% sawdust, 1% urea and 1% calcium bicarbonate (CS) and a blend of 49% C. fungigraminus, 49% SMS, 1% urea and 1% calcium bicarbonate (CH). Undisturbed forest soil (OS) served as the control; Figure S3: (A) Species association network ZIPI plots at the genus level across all treatments. Peripheral species represent specialists in microbial networks, whereas module hubs and connectors primarily correspond to species resembling generalists. Network hubs denote “supergeneralists” within microbial networks. The Zi value quantifies within-module connectivity, whereas the Pi value reflects among-module connectivity. (B) Genus-level differences in 4-coumaric acid metabolism among the different treatments. (C) Genus-level differences in propionic acid I production via lactic acid fermentation among the different treatments. The SMS bedding group comprised a mixture of 49% C. fungigraminus, 49% sawdust, 1% urea and 1% calcium bicarbonate (S-CS) and a mixture of 49% C. fungigraminus, 49% SMS, 1% urea and 1% calcium bicarbonate (S-CH). The non-SMS bedding group included a combination of 49% C. fungigraminus, 49% sawdust, 1% urea and 1% calcium bicarbonate (CS) and a blend of 49% C. fungigraminus, 49% SMS, 1% urea and 1% calcium bicarbonate (CH). Undisturbed forest soil (OS) served as the control; Figure S4: (A) TIC of the same quality control sample used for mass spectrometry analysis. The high overlap of total ion flow curves, along with consistent retention times and peak intensities, indicates excellent signal stability and reliable data when the same sample is analysed at different times. (B) Pearson correlation analysis between samples. The diagonal squares represent the QC sample names; the lower left triangles show scatter plots of the metabolite content for each QC sample pair, with each point representing a metabolite; the upper right triangles display the corresponding Pearson correlation coefficients. (C) CV distributions of samples from four treatment groups (CS24, CH24, S-CS24, and S-CH24) and the control group (OS) in 2024. The x-axis represents the CV values, and the y-axis represents the proportion of substances with CV values below the corresponding threshold. Different colours denote different sample groups, including QC samples. The vertical reference lines have CV values of 0.2 and 0.3, and the horizontal reference line indicates 80% of the total number of substances. The SMS bedding group comprised a mixture of 49% C. fungigraminus, 49% sawdust, 1% urea and 1% calcium bicarbonate (S-CS) and a mixture of 49% C. fungigraminus and 49% SMS, 1% urea and 1% calcium bicarbonate (S-CH). The non-SMS bedding group included a combination of 49% C. fungigraminus, 49% sawdust, 1% urea and 1% calcium bicarbonate (CS) and a blend of 49% C. fungigraminus, 49% SMS, 1% urea and 1% calcium bicarbonate (CH). Undisturbed forest soil (OS) served as the control. Table S1: Taxonomic treatment of all samples; Table S2: The 65 organic acid metabolites detected across the OS, CS24, CH24, S-CS24, and S-CH24 experimental treatments; Table S3: The 26 significantly altered metabolites across the experimental treatments (OS, CH24, CS24, S-CH24, and S-CS24); Table S4: Comparative metabolomic profiling revealed 26 significantly altered metabolites across the OS, CH24, CS24, S-CH24, and S-CS24 experimental treatments; Table S5: A comparative analysis of bacterial community composition and KEGG pathway en-richment was conducted across five experimental treatments CH24 and OS; Table S6: A comparative analysis of bacterial community composition and KEGG pathway en-richment was conducted across five experimental treatments CS24 and OS; Table S7: A comparative analysis of bacterial community composition and KEGG pathway en-richment was conducted across five experimental treatments S-CH24 and OS; Table S8: A comparative analysis of bacterial community composition and KEGG pathway en-richment was conducted across five experimental treatments S-CS24 and OS; Table S9: Significant pathway differences were observed across the CH24, CS24, S-CH24, S-CS24, and OS experimental treatments.

Author Contributions

J.L., Z.L. and D.L. conceived the experimental design and acquired research grants. J.L. and X.L. performed the data analysis, conducted formal statistical evaluations, structured the manuscript framework, and generated graphical representations. J.L., F.J., X.D., Q.L., Y.Z., Y.L., D.F. and Y.Y. executed field sampling and laboratory investigations. B.L., X.H. and P.L. critically revised the manuscript and secured supplementary funding. All authors have read and agreed to the published version of the manuscript.

Funding

National Key Research and Development Program of China “Research and Application Demonstration of Key Technologies for Juncao Medicinal and Edible Mushrooms and Orchids Cultivation” (2023YFD1000502); Fujian Provincial Forestry Technology Extension Program “Integrated Demonstration of Juncao Silviculture and Forest Understory Agroforestry Applications” (2025-317).

Institutional Review Board Statement

Not applicable.

Data Availability Statement

Data is contained within the article or Supplementary Material and the original contributions presented in this study are included in the article/Supplementary Material. Further inquiries can be directed to the corresponding author(s).

Acknowledgments

We acknowledge Guirong Lin, a senior agronomist from Fujian Shunchang Xinjundu Co., Ltd., for his expert consultation on D. indusiata cultivation protocols. Special recognition is extended to Panpan Ling, Ling Man, Yao Zhang, Yinghao Sun, and Qing Liu for their dedicated fieldwork coordination and standardized soil sample processing. This study benefited substantially from the infrastructural support provided by the Shunchang Juncao Science and Technology Backyard and collaborative partnerships with Xingyuan Village, Zhengfang County, which facilitated onsite technical operations and student accommodation.

Conflicts of Interest

The authors declare no conflict of interest.

References

  1. Zhao, Y.; Huang, L.; Wu, D.; Li, J.; Lei, J.; Fu, M.; Zhang, Q.; Qin, W. Catabolism of Dictyophora indusiata polysaccharide and its impacts on gut microbial composition during in vitro digestion and microbial fermentation. Foods 2023, 12, 1909. [Google Scholar] [CrossRef]
  2. Zhang, Y.; Xun, H.; Gao, Q.; Qi, F.; Sun, J.; Tang, F. Chemical constituents of the mushroom Dictyophora indusiata and their anti-inflammatory activities. Molecules 2023, 28, 2760. [Google Scholar] [CrossRef] [PubMed]
  3. Kanwal, S.; Aliya, S.; Xin, Y. Anti-obesity effect of Dictyophora indusiata mushroom polysaccharide (DIP) in high fat diet-induced obesity via regulating inflammatory cascades and intestinal microbiome. Front. Endocrinol. 2020, 19, 558874. [Google Scholar] [CrossRef] [PubMed]
  4. Romanello, M.; Walawender, M.; Hsu, S.C.; Moskeland, A.; Palmeiro-Silva, Y.; Scamman, D.; Ali, Z.; Ameli, N.; Angelova, D.; Ayeb-Karlsson, S.; et al. The 2024 report of the Lancet Countdown on health and climate change: Facing record-breaking threats from delayed action. Lancet 2024, 404, 1847–1896. [Google Scholar] [CrossRef] [PubMed]
  5. Winkel, G.; Sotirov, M.; Moseley, C. Forest environmental frontiers around the globe: Old patterns and new trends in forest governance. Ambio 2021, 50, 2129–2137. [Google Scholar] [CrossRef]
  6. Zheng, H.; Wang, B.; Hua, X.; Gao, R.; Wang, Y.; Zhang, Z.; Zhang, Y.; Mei, J.; Huang, Y.; Huang, Y.; et al. A near-complete genome assembly of the allotetrapolyploid Cenchrus fungigraminus (JUJUNCAO) provides insights into its evolution and C4 photosynthesis. Plant Commun. 2023, 4, 100633. [Google Scholar] [CrossRef]
  7. Li, J.; Zhang, L.; Yu, S.; Luo, Z.; Su, D.; Zheng, D.; Zhou, H.; Zhu, J.; Lin, X.; Luo, H.; et al. Long-Term Benefits of Cenchrus fungigraminus Residual Roots Improved the Quality and Microbial Diversity of Rhizosphere Sandy Soil through Cellulose Degradation in the Ulan Buh Desert, Northwest China. Plants 2024, 13, 708. [Google Scholar] [CrossRef]
  8. Song, S.; Zhou, H.; Luo, Y.; Yu, S.; Su, D.; Zheng, D.; Zhang, Z.; Luo, Z.; Liu, B.; Lin, Z.; et al. Effects of waterlogging at different duration on growth and physiological characteristics of Cenchrus fungigraminus. Environ. Exp. Bot. 2025, 231, 106096. [Google Scholar] [CrossRef]
  9. Lin, B.; Liu, J.; Zhang, X.; Weng, C.; Lin, X. The Flora Compositions of Nitrogen-Fixing Bacteria and the Differential Expression of nifH Gene in Pennisetum giganteum z.x.lin Roots. BioMed Res. Int. 2021, 23, 5568845. [Google Scholar] [CrossRef]
  10. Li, J.; Zhou, B.; Li, T.; Lin, H.; Lin, Z.; Lu, G.; Liu, Y.; Lin, B.; Lin, D. Isolation of rhizobacteria from the Cenchrus fungigraminus rhizosphere and characterization of their nitrogen-fixing performance and potential role in plant growth promotion. Plant Soil 2023, 489, 405–421. [Google Scholar] [CrossRef]
  11. Li, J.; Lei, Y.; Qin, Z.; Liu, J.; Rensing, C.; Lin, Z.; Lin, D. Effects of seafood mushroom spent substrate solid-state fermentation combined with PGPR as a microbial fertilizer on the soil environment and growth promotion of Cenchrus fungigraminus. J. Soil Sci. Plant Nutr. 2024, 24, 1261–1277. [Google Scholar] [CrossRef]
  12. Paredes, C.; Medina, E.; Moral, R.; Pérez-Murcia, M.; Moreno-Caselles, J.; Angeles Bustamante, M.; Cecilia, J. Characterization of the different organic matter fractions of spent mushroom substrate. Commun. Soil Sci. Plant Anal. 2009, 40, 150–161. [Google Scholar] [CrossRef]
  13. Ma, X.; Yan, S.; Wang, M. Spent mushroom substrate: A review on present and future of green applications. J. Environ. Manag. 2025, 373, 123970. [Google Scholar] [CrossRef] [PubMed]
  14. Ström, L.; Owen, A.; Godbold, D.; Jones, D. Organic acid behaviour in a calcareous soil: Sorption reactions and biodegradation rates. Soil Boil. Biochem. 2001, 23, 2021–2036. [Google Scholar] [CrossRef]
  15. Jones, D. Organic acids in the rhizosphere—A critical review. Plant Soil 1998, 205, 25–44. [Google Scholar] [CrossRef]
  16. Jones, B.; Haynes, R.; Phillips, I. Effect of amendment of bauxite processing sand with organic materials on its chemical, physical and microbial properties. J. Environ. Manag. 2010, 91, 2281–2288. [Google Scholar] [CrossRef]
  17. Alonso, S.; Rendueles, M.; Díaz, M. Microbial production of specialty organic acids from renewable and waste materials. Crit. Rev. Biotechnol. 2015, 35, 497–513. [Google Scholar] [CrossRef]
  18. Lei, Y.; Jiang, F.; Di, X.; Lin, D.; Ling, P.; Zhang, Y.; Sun, Y.; Lin, Z.; Li, J. Cultivating Dictyophora indusiata with Cenchrus fungigraminus and seafood mushroom spent substrate enhanced soil nutrient accumulation and microbial community stabilisation. Environ. Technol. Innov. 2025, 38, 104200. [Google Scholar] [CrossRef]
  19. Lu, R.K. Analytical Methods of Soil and Agricultural Chemistry; China Agricultural Science and Technology Press: Beijing, China, 2000. [Google Scholar]
  20. Arunrat, N.; Sereenonchai, S.; Hatano, R. Effects of fire on soil organic carbon, soil total nitrogen, and soil properties under rotational shifting cultivation in northern Thailand. J. Environ. Manag. 2022, 302, 113978. [Google Scholar] [CrossRef]
  21. Muhammad, I.; Lv, J.; Yang, L.; Ahmad, S.; Farooq, S.; Zeeshan, M.; Zhou, X. Low irrigation water minimizes the nitrate nitrogen losses without compromising the soil fertility, enzymatic activities and maize growth. BMC Plant Biol. 2022, 22, 159. [Google Scholar] [CrossRef]
  22. Niepsch, D.; Clarke, L.; Tzoulas, K.; Cavan, G. Distinguishing atmospheric nitrogen compounds (nitrate and ammonium) in lichen biomonitoring studies. Environ. Sci.-Proc. Imp. 2021, 23, 2021–2036. [Google Scholar] [CrossRef] [PubMed]
  23. Yu, S.; Lv, J.; Jiang, L.; Geng, P.; Cao, D.; Wang, Y. Changes of soil dissolved organic matter and its relationship with microbial community along the Hailuogou Glacier Forefield chronosequence. Environ. Sci. Technol. 2023, 57, 4027–4038. [Google Scholar] [CrossRef] [PubMed]
  24. Xiang, F.; Sheng, J.; Li, G.; Ma, J.; Wang, X.; Jiang, C.; Zhang, Z. Black soldier fly larvae vermicompost alters soil biochemistry and bacterial community composition. Appl. Microbiol. Biotechnol. 2022, 106, 4315–4328. [Google Scholar] [CrossRef] [PubMed]
  25. Zheng, X.; Chen, F.; Zhu, Y.; Zhang, X.; Li, Z.; Ji, J.; Wang, G.; Guan, C. Laccase as a useful assistant for maize to accelerate the phenanthrene degradation in soil. Environ. Sci. Pollut. Res. Int. 2024, 31, 4848–4863. [Google Scholar] [CrossRef]
  26. Vipotnik, Z.; Michelin, M.; Tavares, T. Development of a packed bed reactor for the removal of aromatic hydrocarbons from soil using laccase/mediator feeding system. Microbiol. Res. 2021, 245, 126687. [Google Scholar] [CrossRef]
  27. Bolyen, E.; Rideout, J.R.; Dillon, M.R.; Bokulich, N.A.; Abnet, C.C.; Al-Ghalith, G.A.; Alexander, H.; Alm, E.J.; Arumugam, M.; Asnicar, F.; et al. Reproducible, interactive, scalable and extensible microbiome data science using QIIME 2. Nat. Biotechnol. 2019, 37, 852–857. [Google Scholar] [CrossRef]
  28. Martin, M. Cutadapt removes adapter sequences from high-throughput sequencing reads. EMBnet J. 2011, 17, 10. [Google Scholar] [CrossRef]
  29. Callahan, B.; Mcmurdie, P.; Rosen, M.; Han, A.; Johnson, A.; Holmes, S. Dada2: High-resolution sample inference from illumina amplicon data. Nat. Methods 2016, 13, 581–583. [Google Scholar] [CrossRef]
  30. Katoh, K.; Misawa, K.; Kuma, K.; Miyata, T. MAFFT: A novel method for rapid multiple sequence alignment based on fast Fourier transform. Nucleic Acids Res. 2002, 30, 3059–3066. [Google Scholar] [CrossRef]
  31. Price, M.; Dehal, P.; Arkin, A. FastTree: Computing large minimum evolution trees with profiles instead of a distance matrix. Mol. Biol. Evol. 2009, 26, 1641–1650. [Google Scholar] [CrossRef]
  32. Bokulich, N.; Kaehler, B.; Ram, R.; Matthew, D.; Evan, B.; Rob, K.; Huttley, G.; Caporaso, J. Optimizing taxonomic classification of marker-gene amplicon sequences with qiime 2’s q2-feature-classifier plugin. Microbiome 2018, 6, 90. [Google Scholar] [CrossRef] [PubMed]
  33. Kõljalg, U.; Nilsson, R.; Abarenkov, K.; Tedersoo, L.; Taylor, A.; Bahram, M.; Bates, S.; Bruns, T.; Bengtsson-Palme, J.; Callaghan, T.; et al. Towards a unified paradigm for sequence-based identification of fungi. Mol. Ecol. 2013, 22, 5271–5277. [Google Scholar] [CrossRef] [PubMed]
  34. Gong, X.; Li, L.; Qin, L.; Huang, Y.; Ye, Y.; Wang, M.; Wang, Y.; Xu, Y.; Luo, F.; Mei, H. Targeted metabolomics reveals impact of application on accumulation of amino acids, flavonoids and phytohormones in tea shoots under soil nutrition deficiency stress. Forests 2022, 13, 1629. [Google Scholar] [CrossRef]
  35. Hou, M.; Gao, D.; Chen, W.; Jiang, W.; Yu, D.; Li, X. UHPLC-QTOF-MS-Based Targeted Metabolomics Provides Novel Insights into the Accumulative Mechanism of Soil Types on the Bioactive Components of Salvia miltiorrhiza. Molecules 2024, 29, 4016. [Google Scholar] [CrossRef]
  36. Song, J.; Yan, Y.; Wang, X.; Li, X.; Chen, Y.; Lu, L.; Li, W. Characterization of fatty acids, amino acids and organic acids in three colored quinoas based on untargeted and targeted metabolomics. LWT 2021, 140, 110690. [Google Scholar] [CrossRef]
  37. Bray, J.; Curtis, J. An ordination of the upland forest communities of Southern Wisconsin. Ecol. Monogr. 1957, 27, 325–349. [Google Scholar] [CrossRef]
  38. Legendre, P.; Legendre, L. Numerical Ecology, 2nd ed.; Elsevier: Amsterdam, The Netherlands, 1998. [Google Scholar]
  39. Kruskal, J. Multidimensional scaling by optimizing goodness of fit to a nonmetric hypothesis. Psychometrika 1964, 29, 1–27. [Google Scholar] [CrossRef]
  40. Ramette, A. Multivariate analyses in microbial ecology. FEMS Microbiol. Ecol. 2007, 62, 142–160. [Google Scholar] [CrossRef]
  41. Zaura, E.; Keijser, B.; Huse, S.; Crielaard, W. Defining the healthy “core microbiome” of oral microbial communities. BMC Microbiol. 2009, 9, 259. [Google Scholar] [CrossRef]
  42. Zgadzaj, R.; Garridooter, R.; Jensen, D.; Koprivova, A.; Schulzelefert, P.; Radutoiu, S. Root nodule symbiosis in Lotus japonicus drives the establishment of distinctive rhizosphere, root, and nodule bacterial communities. Proc. Natl. Acad. Sci. USA 2016, 113, E7996–E8005. [Google Scholar] [CrossRef]
  43. Liaw, A.; Wiener, M. Classification and Regression by randomForest. R News 2002, 2, 23. [Google Scholar]
  44. Deng, Y.; Jiang, Y.; Yang, Y.; He, Z.; Luo, F.; Zhou, J. Molecular ecological network analyses. BMC Bioinform. 2012, 13, 113. [Google Scholar] [CrossRef] [PubMed]
  45. Strumińska-Parulska, D.; Olszewski, G.; Moniakowska, A.; Zhang, J.; Falandysz, J. Bolete mushroom Boletus bainiugan from Yunnan as a reflection of the geographical distribution of 210Po, 210Pb and uranium (234U, 235U, 238U) radionuclides, their intake rates and effective exposure doses. Chemosphere 2020, 253, 126585. [Google Scholar] [CrossRef] [PubMed]
  46. Hanć, A.; Fernandes, A.R.; Falandysz, J.; Zhang, J. Mercury and selenium in developing and mature fruiting bodies of Amanita muscaria. Environ. Sci. Pollut. Res. Int. 2021, 28, 60145–60153. [Google Scholar] [CrossRef] [PubMed]
  47. Ohnuki, T.; Sakamoto, F.; Kozai, N.; Nanba, K.; Neda, H.; Sasaki, Y.; Niizato, T.; Watanabe, N.; Kozaki, T. Role of filamentous fungi in migration of radioactive cesium in the Fukushima forest soil environment. Environ. Sci.-Proc. Imp. 2019, 21, 1164–1173. [Google Scholar] [CrossRef]
  48. Krasińska, G.; Falandysz, J. Mercury in Orange Birch Bolete Leccinum versipelle and soil substratum: Bioconcentration by mushroom and probable dietary intake by consumers. Environ. Sci. Pollut. Res. Int. 2016, 23, 860–869. [Google Scholar] [CrossRef]
  49. Balakrishnan, K.; Krishnaa, D.; Balakrishnan, G.; Manickam, M.; Abdulkader, A.; Dharumadurai, D. Association of bacterial communities with Psychedelic mushroom and soil as revealed in 16S rRNA gene sequencing. Appl. Biochem. Biotechnol. 2024, 196, 2566–2590. [Google Scholar] [CrossRef]
  50. Sui, X.; Li, M.; Frey, B.; Wang, M.; Weng, X.; Wang, X.; Chen, F.; Li, X.; Du, Z.; Yang, L.; et al. Climax forest has a higher soil bacterial diversity but lower soil nutrient contents than degraded forests in temperate northern China. Ecol. Evol. 2022, 12, e9535. [Google Scholar] [CrossRef]
  51. Pang, W.; Zhang, P.; Zhang, Y.; Zhang, X.; Huang, Y.; Zhang, T.; Liu, B. The ectomycorrhizal fungi and soil bacterial communities of the five typical tree species in the Junzifeng National Nature Reserve, Southeast China. Plants 2023, 12, 3853. [Google Scholar] [CrossRef]
  52. Jiang, J.; Liu, H.; Li, Q.; Gao, N.; Yao, Y.; Xu, H. Combined remediation of Cd-phenanthrene co-contaminated soil by Pleurotus cornucopiae and Bacillus thuringiensis FQ1 and the antioxidant responses in Pleurotus cornucopiae. Ecotoxicol. Environ. Saf. 2015, 120, 386–393. [Google Scholar] [CrossRef]
  53. Li, L.; Yang, X.; Tong, B.; Wang, D.; Tian, X.; Liu, J.; Chen, J.; Xiao, X.; Wang, S. Rhizobacterial compositions and their relationships with soil properties and medicinal bioactive ingredients in Cinnamomum migao. Front. Microbiol. 2023, 14, 1078886. [Google Scholar] [CrossRef]
  54. Kaur, M.; Sharma, S.; Kaur, I.; Sodhi, H.; Choudhary, R.; Ercisli, S.; Fidan, H.; Dasci, E.; Ullah, R.; Bari, A. Purification, kinetic characterization of thermostable multicopper oxidase from the oyster mushroom and its versatility for greener agro-pulp bio bleaching in the paper industry. Cell Mol. Biol. 2024, 70, 1–9. [Google Scholar] [CrossRef] [PubMed]
  55. Jones, D.; Dennis, P.; Owen, A.; Van Hees, P. Organic acids behavior in soils-misconceptions and knowledge gaps. Plant Soil 2003, 248, 31–41. [Google Scholar] [CrossRef]
  56. Luo, Z.K. Big soil benefits from buried straw. Nat. Geosci. 2025, 18, 570–571. [Google Scholar] [CrossRef]
  57. Peña, A. A comprehensive review of recent research concerning the role of low molecular weight organic acids on the fate of organic pollutants in soil. J. Hazard. Mater. 2022, 434, 128875. [Google Scholar] [CrossRef]
  58. Ru, R.; Li, X.; Hunag, X.; Gao, F.; Wang, J.; Li, B.; Zhang, Z. Effect of substrate of edible mushroom on continuously cropping obstacle of Rehmannia glutinosa. China J. Chin. Mater. Med. 2014, 39, 3036–3041. [Google Scholar]
  59. Ma, H.; Li, X.; Hou, S.; Peng, D.; Wang, Y.; Xu, F.; Xu, H. The activation and extraction systems using organic acids and Lentinus edodes to remediate cadmium contaminated soil. Environ. Pollut. 2019, 255 Pt 2, 113252. [Google Scholar] [CrossRef]
  60. Ng, P.; Ferrarese, M.; Huber, D.; Ravagnani, A.; Ferrarese-Filho, O. Canola (Brassica napus L.) seed germination influenced by cinnamic and benzoic acids and derivatives: Effects on peroxidase. Seed Sci. Technol. 2003, 31, 39–46. [Google Scholar] [CrossRef]
  61. Politycka, B.; Mielcarz, B. Involvement of ethylene in growth inhibition of cucumber roots by ferulic and p-coumaric acids. Allelopathy J. 2007, 19, 451–460. [Google Scholar]
  62. Soares, A.; de Lourdes Lucio Ferrarese, M.; de Cássia Siqueira-Soares, R.; Marchiosi, R.; Finger-Teixeira, A.; Ferrarese-Filho, O. The allelochemical L-DOPA increases melanin production and reduces reactive oxygen species in soybean roots. J. Chem. Ecol. 2011, 37, 891–898. [Google Scholar] [CrossRef]
  63. Gao, Y.; Liu, J.; Fang, Y.; Xu, X.; Wang, F.; Tang, Y.; Yin, D.; Cookson, A.; Zhu, W.; Mao, S.; et al. Straw-based compost cultivation disproportionally contributes to the environmental persistence of antibiotic resistance from raw cattle manure to organic vegetables. Microbiol. Res. 2024, 278, 127540. [Google Scholar] [CrossRef]
  64. Xing, R.; Yan, H.; Gao, Q.; Zhang, F.; Wang, J.; Chen, S. Microbial communities inhabiting the fairy ring of Floccularia luteovirens and isolation of potential mycorrhiza helper bacteria. J. Basic Microbiol. 2018, 58, 554–563. [Google Scholar] [CrossRef] [PubMed]
  65. Yu, X.; Zhang, Y.; Shen, M.; Dong, S.; Zhang, F.; Gao, Q.; He, P.; Shen, G.; Yang, J.; Wang, Z.; et al. Soil conditioner affects tobacco rhizosphere soil microecology. Microb. Ecol. 2023, 86, 460–473. [Google Scholar] [CrossRef]
  66. Xu, Z.; Sun, R.; He, T.; Sun, Y.; Wu, M.; Xue, Y.; Meng, F.; Wang, J. Disentangling the impact of straw incorporation on soil microbial communities: Enhanced network complexity and ecological stochasticity. Sci. Total Environ. 2023, 863, 160918. [Google Scholar] [CrossRef]
  67. Yuan, S.; Chen, P.; Zhou, W.; Liu, H.; Cheng, K.; Xiao, X.; Tang, H.; Yi, Z. Response characteristics of soil Cd availability to microbes in paddy soil with long-term fertilization and its impact on Cd uptake in rice. Sci. Total Environ. 2024, 957, 177680. [Google Scholar] [CrossRef]
  68. Su, P.; Gao, P.; Sun, W.; Gao, W.; Xu, F.; Wang, Q.; Xiao, E.; Soleimani, M.; Sun, X. Keystone taxa and functional analysis in arsenic and antimony co-contaminated rice terraces. Environ. Sci. Pollut. Res. Int. 2022, 29, 61236–61246. [Google Scholar] [CrossRef]
  69. Bergkemper, F.; Schöler, A.; Engel, M.; Lang, F.; Krüger, J.; Schloter, M.; Schulz, S. Phosphorus depletion in forest soils shapes bacterial communities towards phosphorus recycling systems. Environ. Microbiol. 2016, 18, 1988–2000. [Google Scholar] [CrossRef]
  70. Magingo, F.; Oriyo, N.; Kivaisi, A.; Danell, E. Cultivation of Oudemansiella tanzanica nom. prov. on agricultural solid wastes in Tanzania. Mycologia 2004, 96, 197–204. [Google Scholar] [CrossRef]
  71. Pecina, V.; Valtera, M.; Drápela, K.; Novotný, R.; Vahalík, P.; Komendová, R.; Brtnický, M.; Juřička, D. Influence of beech and spruce on potentially toxic elements-related health risk of edible mushrooms growing on unpolluted forest soils. Sci. Rep. 2022, 12, 5407. [Google Scholar] [CrossRef]
Figure 1. Circle plots of bacterial composition at the levels of family, order, class, and genus in all the treatments (A); Venn diagram of the distribution of bacterial ASVs in all the treatments (B); heatmaps of the composition of the top 20 species at the phylum level (C) and genus level (D) in all the treatments. The closer the color is to red, the greater the abundance; the it is to blue, the lower the abundance. The SMS padding group comprised a mixture of 49% C. fungigraminus, 49% sawdust, 1% urea, and 1% calcium bicarbonate (S-CS) and a mixture of 49% C. fungigraminus, 49% SMS, 1% urea, and 1% calcium bicarbonate (S-CH). The non-SMS padding group included a combination of 49% C. fungigraminus, 49% sawdust, 1% urea, and 1% calcium bicarbonate (CS) and a blend of 49% C. fungigraminus, 49% SMS, 1% urea, and 1% calcium bicarbonate (CH). Undisturbed forest soil (OS) served as the control.
Agriculture 15 01533 g001
Figure 2. PCoA plot of all the treatments (A); (B) Zi–Pi plot of the species association networks at the phylum level among the different treatments. Peripheral species represent specialists in microbial networks, whereas module hubs and connectors correspond primarily to species resembling generalists. Network hubs denote “supergeneralists” within microbial networks. The Zi value quantifies within-module connectivity, whereas the Pi value reflects among-module connectivity. (C) Random forest analysis of differential marker species across all the treatments. The x-axis represents the importance score of the species for the classifier model, and the y-axis lists ASVs with their taxonomic names at the genus level. The heatmap illustrates the abundance distribution of these species across treatments. Species are ranked from top to bottom by decreasing importance to the model, indicating that those at the top are key markers of intergroup differences. The figure shows the absolute abundances of the top 20 species on the basis of importance ranking, with the first column listing the taxonomic names of the ASVs and the subsequent columns showing the abundances in each sample group. (D) Abundance plot of the top 20 bacteria involved in the TCA cycle. The SMS padding group comprised a mixture of 49% C. fungigraminus, 49% sawdust, 1% urea, and 1% calcium bicarbonate (S-CS) and a mixture of 49% C. fungigraminus, 49% SMS, 1% urea, and 1% calcium bicarbonate (S-CH). The non-SMS padding group included a combination of 49% C. fungigraminus, 49% sawdust, 1% urea, and 1% calcium bicarbonate (CS) and a blend of 49% C. fungigraminus, 49% SMS, 1% urea, and 1% calcium bicarbonate (CH). Undisturbed forest soil (OS) served as the control.
Agriculture 15 01533 g002
Figure 3. (A) Three-dimensional PCA score plot of mass spectrometry data for the four treatment groups (CS24, CH24, S-CS24, and S-CH24) and the control group (OS) in 2024. PC1, PC2, and PC3 represent the first, second, and third principal components, respectively, with percentages indicating the contribution rate of each component to the dataset. (B) Three-dimensional PLS–DA score plot of mass spectrometry data for the four treatment groups (CS24, CH24, S-CS24, and S-CH24) and the control group (OS) in 2024. (C) Analysis of the 4-coumaric acid (C), maslinic acid (M), and pantothenic acid (P) levels in the four treatment groups (CS24, CH24, S-CS24, and S-CH24) and the control group (OS) in 2024. (D) K-means clustering plot of differentially abundant metabolites for the four treatment groups (CS24, CH24, S-CS24, and S-CH24) and the control group (OS) in 2024. The x-axis represents sample names; the y-axis represents standardized relative metabolite content; ‘Subclass’ denotes categories of metabolites with similar change trends; and ‘total’ indicates the number of metabolites in each category. Subclass 1 includes benzoic acid and lactic acid; Subclass 2 includes gallic acid and lactic acid; Subclass 3 includes 4-aminobutyric acid, 4-coumaric acid, ferulic acid, maleic acid, pyroglutamic acid, shikimic acid, and taurine; Subclass 4 includes cinnamic acid and levulinic acid; Subclass 6 includes L-malic acid and maslinic acid; Subclass 7 includes 2-hydroxy-2-methylbutyric acid and succinic acid; Subclass 8 includes 3-D-hydroxybutyric acid, citraconic acid and salicylic acid; Subclass 9 includes 2-hydroxyisovaleric acid and 3-hydroxyisovaleric acid; and Subclass 10 includes 4-hydroxybenzoic acid, azelaic acid, sebacic acid and suberic acid. The SMS padding group comprised a mixture of 49% C. fungigraminus, 49% sawdust, 1% urea, and 1% calcium bicarbonate (S-CS) and a mixture of 49% C. fungigraminus, 49% SMS, 1% urea, and 1% calcium bicarbonate (S-CH). The non-SMS padding group included a combination of 49% C. fungigraminus, 49% sawdust, 1% urea, and 1% calcium bicarbonate (CS) and a blend of 49% C. fungigraminus, 49% SMS, 1% urea, and 1% calcium bicarbonate (CH). Undisturbed forest soil (OS) served as the control.
Agriculture 15 01533 g003
Figure 4. (A) Network heatmap of the 4-coumaric acid metabolic pathway illustrating the relationships among differentially abundant species, soil factors, and metabolites. The microbial matrix in the figure includes differential metabolic and environmental data, represented by the nodes Environment and Metabolism. The thickness of the lines connecting these nodes to the differentially abundant species indicates the strength of their correlations; thicker lines signify stronger correlations, whereas thinner lines indicate weaker correlations. The color of the connecting lines represents the significance level: red lines denote p < 0.01, indicating statistically significant correlations between the nodes and the corresponding environmental factors. In the heat map, the correlation values are visually represented by both the color intensity and the size of the grid cells. Greater absolute correlation values are indicated by darker colors and larger grid cells, whereas lighter colors and smaller grid cells correspond to lower absolute correlation values. The color gradient reflects the direction of the correlation: blue shades indicate stronger positive correlations, while red shades indicate stronger negative correlations. Additionally, “*” within the grid cells denote the level of statistical significance, with a higher number of asterisks representing greater significance. (BE) In the 4-coumaric acid metabolic pathway, the correlations between the abundances of genus of Latescibacterota (B), Candidatus solibacter (C), Acidibacter (D), and Bacillus (E) in the soil and the 4-coumaric acid content are shown. Each point represents a single sample. The solid line indicates the linear regression of bacterial abundance against the 4-coumaric acid content. The pink shaded area represents the 95% confidence interval. The SMS bedding group comprised a mixture of 49% C. fungigraminus, 49% sawdust, 1% urea, and 1% calcium bicarbonate (S-CS) and a mixture of 49% C. fungigraminus, 49% SMS, 1% urea, and 1% calcium bicarbonate (S-CH). The non-SMS bedding group included a combination of 49% C. fungigraminus, 49% sawdust, 1% urea, and 1% calcium bicarbonate (CS) and a blend of 49% C. fungigraminus, 49% SMS, 1% urea, and 1% calcium bicarbonate (CH). Undisturbed forest soil (OS) served as the control.
Agriculture 15 01533 g004
Figure 5. Cultivation of D. indusiata with grass-based substrates maintains soil stability and enhances soil fertility and the diversity and abundance of soil bacteria in the understory environment.
Agriculture 15 01533 g005
Table 1. Changes in soil properties and enzyme activity during the cultivation of D. indusiata under different treatments.
YearTreatmentpHTN
(mg/kg)
NH4+-N
(μg/g)
NO3-N
(μg/g)
SOM
(mg/g)
SOC
(mg/g)
SCAT
(μmol/d/g)
SL
(U/g)
2023OS4.28997.76 ± 41.84 c1.47 ± 0.42 d11.17 ± 4.79 cd20.77 ± 1.14 cd12.05 ± 0.66 cd26.93 ± 5.95 d0.16 ± 0.10 de
S-CS233.80880.65 ± 22.97 e0.70 ± 0.15 d19.68 ± 3.95 a17.93 ± 0.50 ef10.40 ± 0.29 ef24.53 ± 2.42 d0.13 ± 0.03 e
S-CH234.21859.22 ± 50.07 e1.61 ± 0.48 d18.24 ± 1.25 a17.92 ± 1.32 ef10.40 ± 0.77 ef27.96 ± 6.51 d0.32 ± 0.23 d
CS234.07854.33 ± 27.32 e1.41 ± 0.47 d10.89 ± 1.29 cde17.71 ± 0.78 ef10.27 ± 0.45 ef26.07 ± 3.01 d0.20 ± 0.10 de
CH234.34919.54 ± 48.72 e1.81 ± 0.36 d13.62 ± 1.49 bc19.12 ± 1.10 de11.09 ± 0.64 de31.15 ± 6.24 d0.21 ± 0.21 de
2024S-CS244.361075.66 ± 23.08 b27.00 ± 1.79 a16.41 ± 0.63 ab27.84 ± 2.39 b16.15 ± 1.39 b45.26 ± 1.60 bc0.53 ± 0.04 c
S-CH245.061917.52 ± 107.07 a19.64 ± 2.01 b10.28 ± 0.92 cde33.71 ± 2.18 a19.55 ± 1.26 a38.72 ± 2.49 a1.80 ± 0.10 a
CS245.54924.52 ± 36.90 de15.64 ± 0.44 c7.56 ± 0.87 e16.48 ± 0.76 f9.56 ± 0.44 f53.97 ± 9.29 a0.79 ± 0.08 b
CH245.00988.14 ± 33.52 cd14.96 ± 1.22 c8.54 ± 2.66 de21.78 ± 1.92 c12.63 ± 1.11 c49.89 ± 5.79 ab0.84 ± 0.09 b
Notes: The SMS bedding group comprised a mixture of 49% C. fungigraminus, 49% sawdust, 1% urea, and 1% calcium bicarbonate (S-CS) and a mixture of 49% C. fungigraminus, 49% SMS, 1% urea, and 1% calcium bicarbonate (S-CH). The non-SMS bedding group included a combination of 49% C. fungigraminus, 49% sawdust, 1% urea, and 1% calcium bicarbonate (CS) and a blend of 49% C. fungigraminus, 49% SMS, 1% urea, and 1% calcium bicarbonate (CH). Undisturbed forest soil (OS) served as the control. In each column different letters indicate significant differences at p < 0.05.
Table 2. Alpha diversity indices of the soil bacteria in all the treatments from 2023 to 2024.
YearTreatmentRichnessCoverageEvennessDiversity
Chao1Faith_pdGoods_CoveragePielou_eShannon
2023OS2157.55 ± 59.35 e172.70 ± 26.64 c0.99 ± 0.00 a0.90 ± 0.00 c9.96 ± 0.03 f
S-CS232909.35 ± 184.34 c213.33 ± 54.89 bc0.99 ± 0.00 ab0.92 ± 0.00 b10.55 ± 0.09 cd
S-CH232838.99 ± 54.34 c239.70 ± 40.99 bc0.99 ± 0.00 ab0.92 ± 0.01 b10.47 ± 0.08 d
CS232460.40 ± 262.42 de234.93 ± 37.98 bc0.99 ± 0.00 ab0.90 ± 0.01 c10.09 ± 0.22 ef
CH232739.72 ± 308.66 cd227.44 ± 48.98 bc0.99 ± 0.00 b0.90 ± 0.00 c10.28 ± 0.15 e
2024S-CS243432.09 ± 199.63 b274.99 ± 75.86 b0.99 ± 0.00 c0.92 ± 0.00 b10.69 ± 10.13 bc
S-CH244088.98 ± 312.64 a345.01 ± 51.11 a0.98 ± 0.00 d0.93 ± 0.00 a11.08 ± 0.11 a
CS243396.84 ± 419.78 b232.49 ± 21.62 bc0.99 ± 0.00 c0.92 ± 0.01 b10.76 ± 0.27 b
CH242989.73 ± 137.91 c251.11 ± 52.43 b0.99 ± 0.00 c0.89 ± 0.01 d10.23 ± 0.01 e
Notes: The SMS padding group comprised a mixture of 49% C. fungigraminus, 49% sawdust, 1% urea, and 1% calcium bicarbonate (S-CS) and a mixture of 49% C. fungigraminus, 49% SMS, 1% urea, and 1% calcium bicarbonate (S-CH). The non-SMS padding group included a combination of 49% C. fungigraminus, 49% sawdust, 1% urea, and 1% calcium bicarbonate (CS) and a blend of 49% C. fungigraminus, 49% SMS, 1% urea, and 1% calcium bicarbonate (CH). Undisturbed forest soil (OS) served as the control. In each column different letters indicate significant differences at p < 0.05.
Disclaimer/Publisher’s Note: The statements, opinions and data contained in all publications are solely those of the individual author(s) and contributor(s) and not of MDPI and/or the editor(s). MDPI and/or the editor(s) disclaim responsibility for any injury to people or property resulting from any ideas, methods, instructions or products referred to in the content.

