Article

Path Mechanism and Field Practice Effect of Green Agricultural Production on the Soil Organic Carbon Dynamics and Greenhouse Gas Emission Intensity in Farmland Ecosystems

1
School of Water Resources and Hydropower Engineering, North China Electric Power University, Beijing 102206, China
2
Nanjing Institute of Geography and Limnology, Chinese Academy of Sciences, Nanjing 210008, China
3
Institute of One Health Science, School of Civil & Environmental Engineering and Geography Science, State Key Laboratory for Quality and Safety of Agro-Products, Ningbo University, Ningbo 315211, China
*
Author to whom correspondence should be addressed.
Agriculture 2025, 15(14), 1499; https://doi.org/10.3390/agriculture15141499
Submission received: 14 May 2025 / Revised: 3 July 2025 / Accepted: 9 July 2025 / Published: 12 July 2025

Abstract

Exploring the mechanisms by which green agricultural production reduces emissions and enhances carbon sequestration in soil can provide a scientific basis for greenhouse gas reduction and sustainable development in farmland. This study uses a combination of meta-analysis and field experiments to evaluate the impact of different agricultural management practices and climatic conditions on soil organic carbon (SOC) and the emissions of CO2 and CH4, as well as the role of microorganisms. The results indicate the following: (1) Meta-analysis reveals that the long-term application of organic fertilizers in green agriculture increases SOC at a rate four times higher than that of chemical fertilizers. No-till and straw return practices significantly reduce CO2 emissions from alkaline soils by 30.7% (p < 0.05). Warm and humid climates in low-altitude regions are more conducive to soil carbon sequestration. (2) Structural equation modeling of plant–microbe–soil carbon interactions shows that plant species diversity (PSD) indirectly affects microbial biomass by influencing organic matter indicators, mineral properties, and physicochemical characteristics, thereby regulating soil carbon sequestration and greenhouse gas emissions. (3) Field experiments conducted in the typical green farming research area of Chenzhuang reveal that soils managed under natural farming absorb CH4 at a rate three times higher than those under conventional farming, and the stoichiometric ratios of soil enzymes in the former are close to 1. The peak SOC (19.90 g/kg) in the surface soil of Chenzhuang is found near fields cultivated with natural farming measures. This study provides theoretical support and practical guidance for the sustainable development of green agriculture.

1. Introduction

In recent years, with the intensification of the greenhouse effect and the advancement of global climate change research, carbon neutrality has become a new focal point of global attention. Soil is recognized as the second-largest organic carbon pool after oceans [1]. Farmland soil acts as both a major carbon source and a significant carbon sink. Fully understanding and utilizing the carbon sequestration potential of soil to enhance carbon retention is an effective way to improve soil quality, mitigate global warming, and achieve carbon neutrality sooner [2,3]. However, farmland soil is highly susceptible to human activities. Agronomic measures such as frequent tillage, excessive fertilization, and over-cultivation, while increasing crop yields, also exacerbate soil degradation, resulting in the loss of 25% to 75% of soil organic carbon (SOC) in global arable land [4]. The Intergovernmental Panel on Climate Change (IPCC) estimates that through eco-friendly agricultural production practices, the soil carbon pool could increase by 0.6 to 1.3 Pg of carbon annually over 50 years, potentially accumulating an additional 30 to 65 Pg [5]. This is equivalent to 3–7 years of global carbon emissions and could offset 35% of the historical carbon debt of 85 Pg, resulting from the conversion of natural ecosystems to agriculture [6]. Therefore, formulating reasonable agricultural management practices is essential for sequestering SOC and reducing greenhouse gas emissions. Improving crop productivity while enhancing environmental protection is a crucial support for promoting global agricultural sustainability.
Different agricultural management practices, including fertilization strategies, tillage systems, and changes in land use types, have significantly different effects on the changes in SOC and greenhouse gas emissions in farmland [7,8,9]. Most studies suggest that by continuously inputting exogenous organic matter through green agronomic measures such as applying organic fertilizers and returning straw to the field, the content of SOC can be increased on the premise of achieving agricultural production increase [8,10]. In a 35-year-long field experiment conducted in Heilongjiang Province, Hao Xiaoyu, found that applying double the amount of organic fertilizer increased soil organic carbon content by 11.6%, with an organic carbon storage surplus of 1.9 t/ha [11]. An analysis of the impact of long-term conservation tillage on SOC storage in dry farming in China showed a significant increase of 16% to 55% in SOC storage compared to the initial stage of the experiment, with a significant positive correlation between the soil carbon sequestration rate and the duration of conservation tillage implementation [7]. Some scholars, in their research exploring the influence of cropping systems on soil carbon sinks in China, found that the SOC in rice field was 24.9% higher than that in dryland farming [12], although some studies indicate that CO2 absorption in dry farming is 10.3% higher than in paddy field [13]. Although farmland cultivated with green agricultural production practices generally shows good potential for carbon sequestration and emission reduction, an increasing number of studies have identified an upper limit to soil carbon storage capacity [14,15]. When carbon input stabilizes and soil carbon turnover reaches equilibrium, the soil will no longer sequester additional carbon over time [4]. In a 10-year long-term field experiment in the paddy and dryland crops rotation system in the Taihu region, it was found that continuous straw return treatment led to a decrease in light fraction organic carbon (LFOC) at a rate of 0.03 g·kg−1·yr−1, which could affect carbon stabilization efficiency [16]. Different climate conditions and soil properties can also lead to differences in soil organic matter accumulation and carbon emissions in farmland cultivated with green agricultural production practices [17]. A global-scale meta-analysis on the impact of agricultural management practices on soil carbon sequestration potential indicated that soil carbon sequestration capacity under reduced tillage and increased organic fertilizer application was greater in the temperate zone than in the subtropical zone and tropical zone [18]. In the relevant research conducted in China [19], it was found that the increase in SOC due to organic fertilizer application was more pronounced in the subtropical zone compared to the temperate zone. Farmlands with severe soil nutrient limitations (SOM < 15 g·kg−1, pH < 6.6) experience greater increases in SOC and its components [20]. This suggests that the threshold effects of carbon sequestration and emission reduction in green agricultural production may vary with specific geographical locations and are also influenced by other factors such as cultivation conditions and soil characteristics.
Regarding the influence and role of soil characteristics on carbon sources and carbon sinks in farmland, the “Microbial Carbon Pump” (MCP) theory proposed in recent years suggests that plants are the initial source of SOC, micro-organisms decompose plant residues to produce assimilated organic products, both of which are involved in the transformation and formation of the soil carbon pool [21]. Cheng et al. conducted field experiments simulating elevated CO2 conditions in Chinese paddy fields and found that agricultural management practices influence the soil carbon cycle and carbon sequestration effects by affecting the structure and function of soil microbial communities [22]. Liu conducted field experiments and found that the content of microbial biomass carbon (MBC) in the soil under plastic mulch was twice that of the soil without film mulching treatment, while there was a significant negative correlation between SOC and MBC [23]. Conventional tillage, compared to no-till or reduced tillage, causes greater disruption to soil structure and exacerbates microbial consumption of SOC [24]. These studies indicate that green agronomic practices, focusing on no-till, organic fertilization, and straw return, can enhance the soil’s carbon sink function and fertility while ensuring crop yield increases, with microorganisms playing a crucial role [25]. Some scholars have found that plants drive microbial activities through photosynthetic carbon resources and improve microbial carbon use efficiency (CUE), thereby increasing soil organic carbon content by 15% to 20% [26]. However, most current research emphasizes the role of microorganisms as decomposers in soil carbon accumulation and rarely considers the contribution of microbial communities to the formation and stabilization of the soil carbon pool [22,23,27]. Furthermore, most studies focus on the emission reduction and carbon sequestration effects brought about by green agricultural production, with limited in-depth discussion on the plant–soil–microbe interactions in carbon cycling and sequestration mechanisms. Therefore, a comprehensive study of the carbon pump effect and carbon sequestration mechanisms driven by plant–microbe interaction networks in farmland systems is a hot topic at the intersection of global change biology and agricultural soil carbon metrology, warranting further exploration and discussion.
In recent years, green agricultural production has emerged as a critical agricultural management practice. However, the differences in implementation regions, scales, geographical conditions, and climate characteristics pose significant challenges for systematic research and cross-comparison of soil carbon sequestration characteristics and mechanisms. Against this backdrop, the development and application of meta-analysis methods have provided effective and comprehensive analytical approaches and data support for studying the greenhouse gas emission reduction and carbon sequestration effects of farmland soil under the influence of green agricultural production practices [28,29]. For example, Sun and Ren used meta-analysis to evaluate the impact of different agricultural management practices on dissolved organic carbon (DOC) and greenhouse gas emissions [30,31]. Additionally, Liu combined the random forest algorithm with meta-analysis to elucidate the driving effects of soil texture, climate factors, and initial nutrient content on SOC under paddy-upland rotation measures [32]. These studies provide a foundation and direction for the application of meta-analysis in the study of farmland greenhouse gas emissions. However, these meta-analyses still face some limitations in discerning the impacts of agricultural management practices on soil in terms of geographic scope, temporal and spatial scales, and environmental management effects. In particular, the carbon sequestration and emission reduction effects of green agricultural production are regulated by the interaction of multiple factors, including climate, soil properties, and management practices. Yet, existing studies are often based on short-term field trial data from specific regions (such as a single climate zone or soil type) [33,34,35], limiting the generalizability of their conclusions. Some meta-analyses conducted on larger scales have considered the comprehensive impact of multidimensional factors [36,37], but they often focus on a single indicator (such as SOC or CO2 emissions), lacking a systematic assessment of the synergistic effects of “soil carbon sequestration–greenhouse gas emission reduction”. Therefore, this study will employ meta-analysis to systematically evaluate the impact of green agricultural production practices in China on SOC increments and greenhouse gas emissions (CH4, CO2), aiming to comprehensively analyze the regulatory roles of climate, soil properties, and field management practices.
It is noteworthy that although nationwide meta-analyses can yield general conclusions [38,39], the regional applicability of these results still needs to be verified through field trials due to the regional differences in ecological environments, economic conditions, and agronomic measures. This study selects Chenzhuang in Jurong City, Jiangsu Province, as the field experiment area. This region is located in mountainous terrain and features a subtropical monsoon climate (with an average annual temperature of 15.8 °C and a precipitation concentration index of 0.71 [40]), with an excellent ecological background. It was selected as a pilot base for rural transformation and ecological innovation under the Chinese Academy of Sciences’ STS program in 2014. The local area implements natural farming techniques, with conservation tillage (e.g., no-tillage and straw residue retention) as the primary practices [41,42]. Complementary agronomic management includes indigenous microorganism cultivation and plant-based nutrient extraction [43], which are typical characteristics of green agricultural production [44,45]. This study conducts controlled experiments in Chenzhuang to specifically analyze the impact of green agricultural production practices on soil carbon sequestration and emission reduction capabilities, and to verify the applicability of meta-analysis conclusions.
In summary, this study comprehensively evaluated the impact of green agricultural production on carbon sequestration and emission reduction in farmland soils and the microbial action mechanisms involved through meta-analysis combined with field trials. Based on measured indicators, regional verification of these impacts and action mechanisms was conducted, and regionally verified optimization suggestions were proposed for the practical application of green agricultural production in local areas. The research objectives include (1) integrating the evolution patterns of carbon sources/sinks in China’s farmland soils and analyzing the differences in carbon balance under different climate–soil conditions in green agriculture; (2) elucidating the regulatory mechanisms of soil microorganism–plant interactions on soil carbon sequestration and emission reduction capabilities under green agricultural practices and conventional agricultural practices; (3) quantifying the carbon sequestration and emission reduction effects and ecological carbon benefits of green agricultural management based on measured cases. The research findings can provide a theoretical basis for constructing an eco-friendly farmland management framework and offer technical support for optimizing regional agricultural low-carbon transformation and carbon neutrality pathways.

2. Materials and Methods
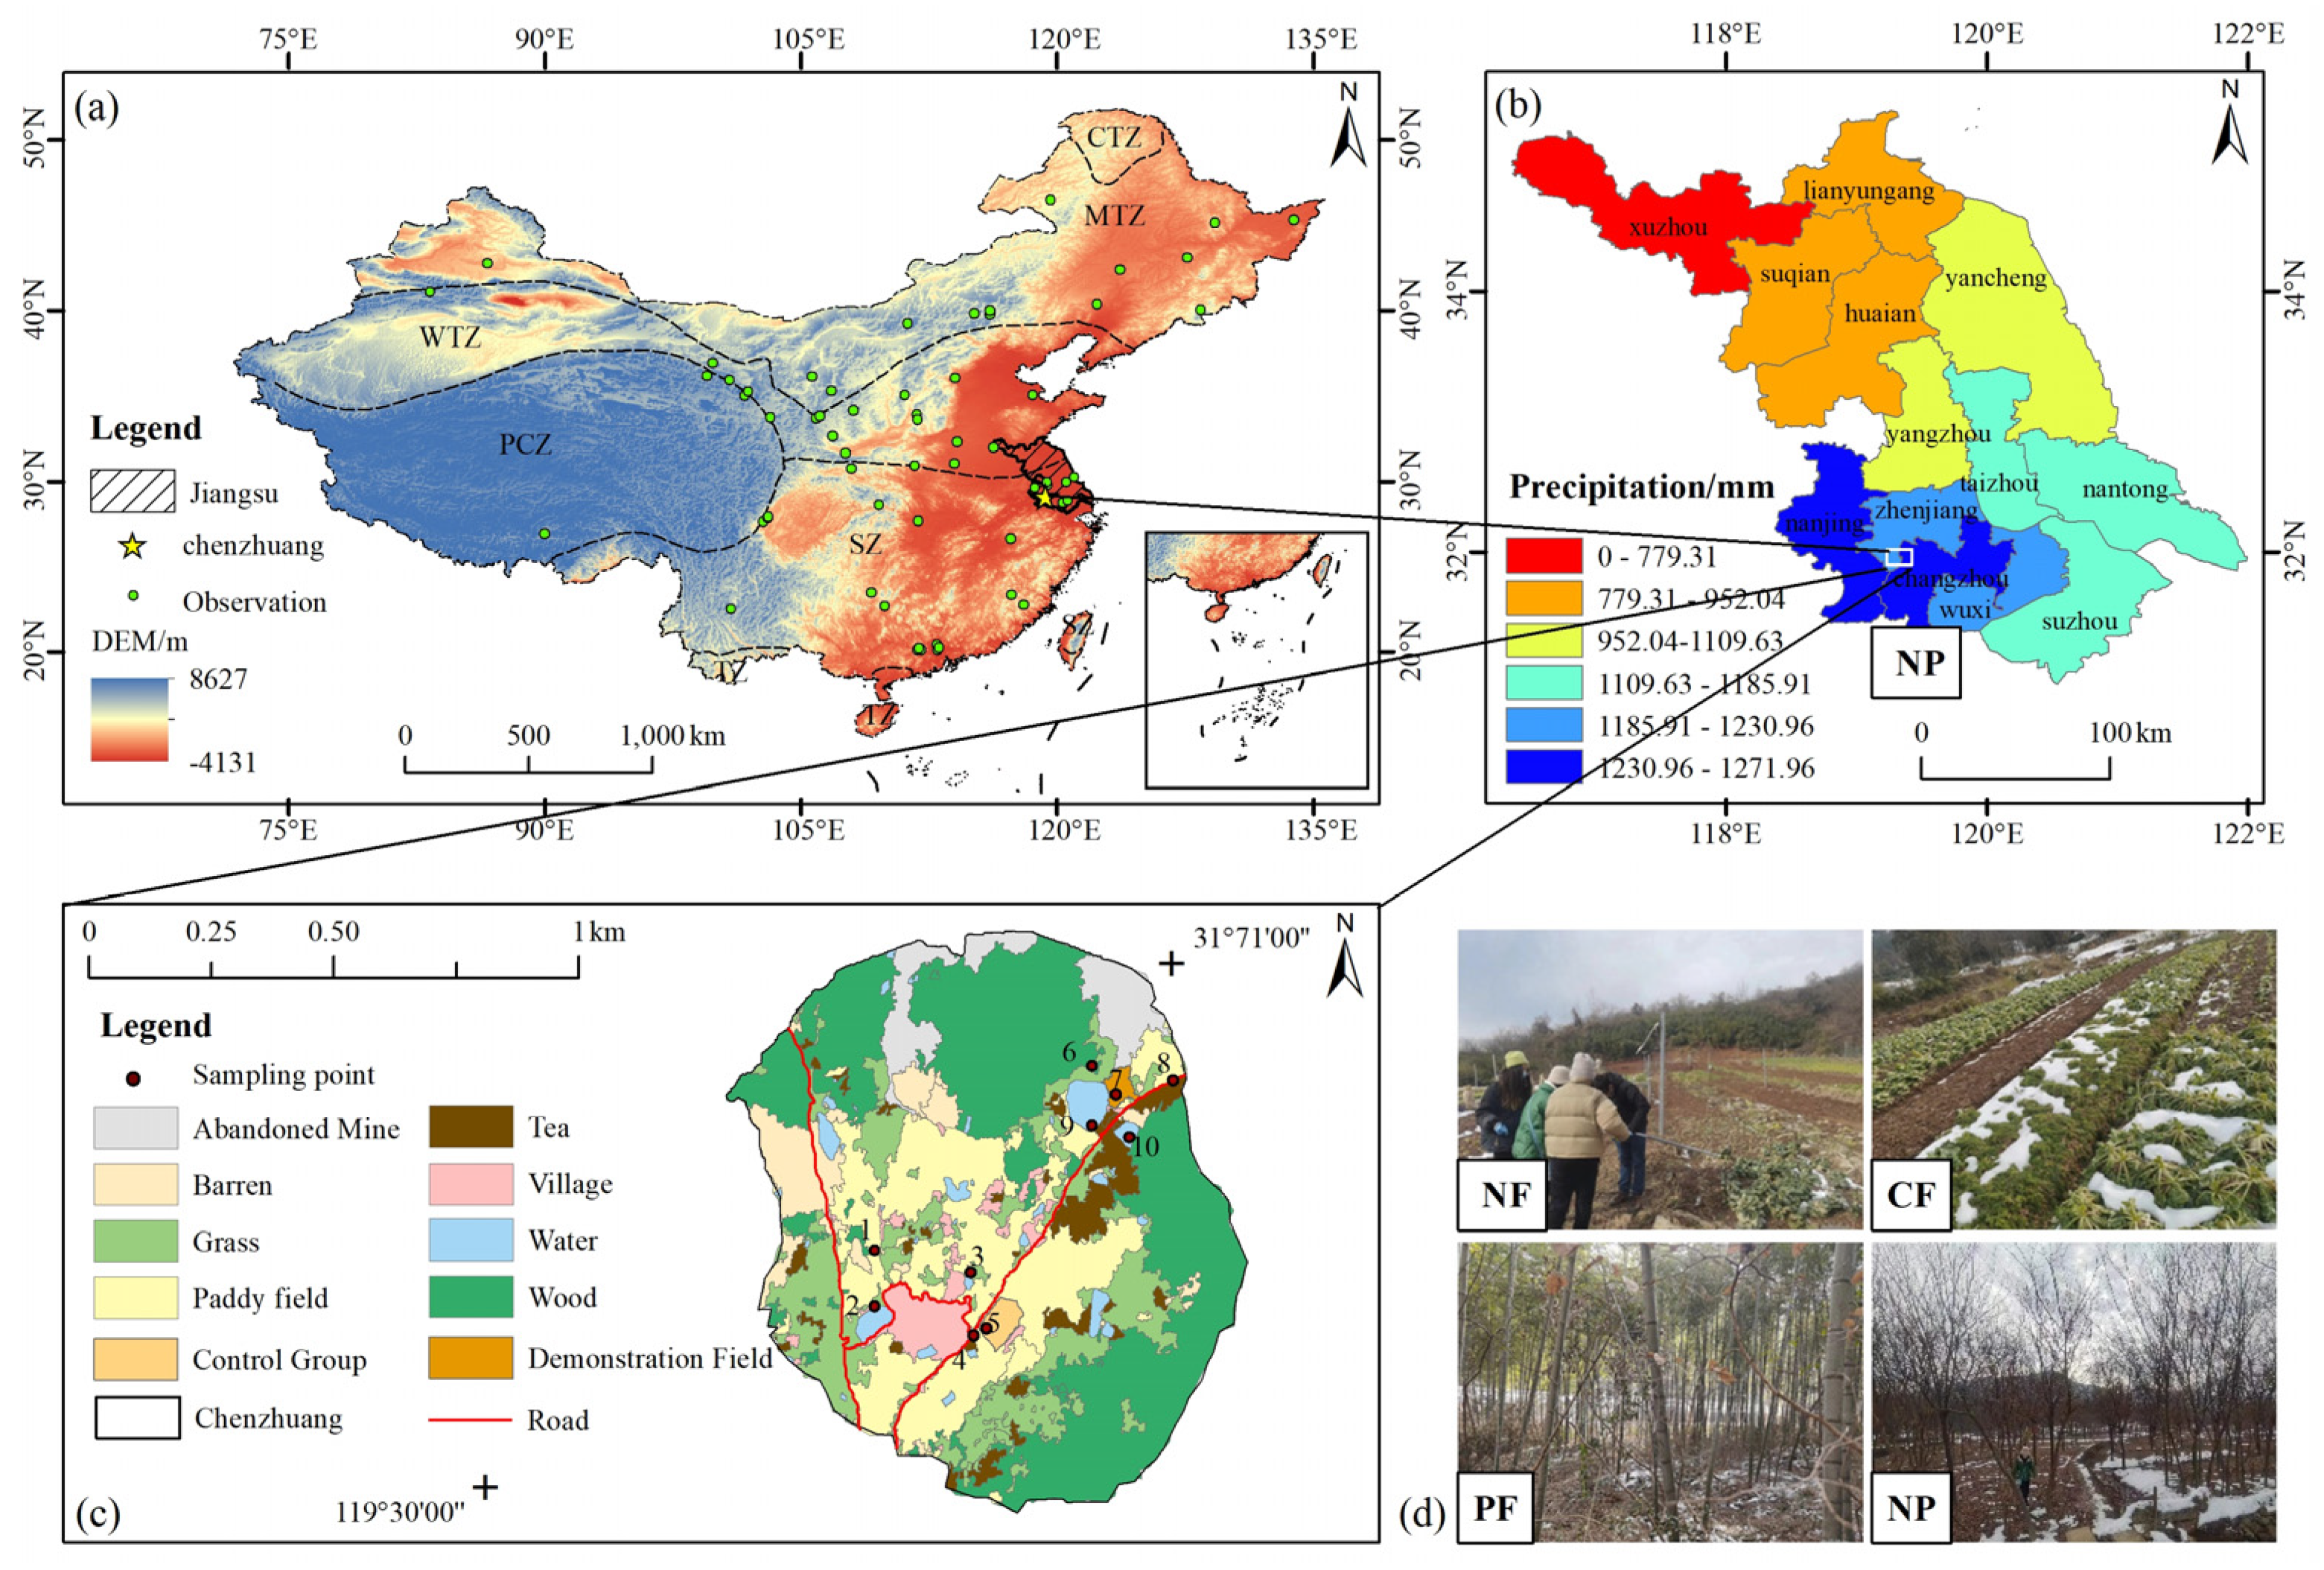
2.1. Study Area

The spatial scope of the meta-analysis in this study covers farmland soils in China. To facilitate the analysis of the regional heterogeneity influence of climate and geographical factors on the variation characteristics of soil carbon sources and sinks, this study classifies the temperature zones of China based on the Ecological Geographical Regions Map of China (2023 edition) [46]. China is divided into six temperature zones (Figure 1a): cold temperate zone (CTZ), mid temperate zone (MTZ), warm temperate zone (WTZ), plateau climate zone (PTZ), subtropical zone (SZ), and tropical zone (TZ).
Chenzhuang in Lita Village, Jurong City, was selected as the research area for field experiments (Figure 1c). Administratively, it belongs to Zhenjiang in southern Jiangsu Province (Figure 1b). Chenzhuang is located at the boundary between the subtropical zone and warm temperate zone (Figure 1a), with an average annual temperature of 15.2 °C and an average annual precipitation of 1185.9 mm (Figure 1b). It is a low mountain and hilly area with developed water systems and abundant ecological resources. The soil type is mainly yellow-brown earth, and the village primarily engages in conventional farming, including rice, vegetables, and economic forest fruits like nursery stock [47]. The excellent natural ecology of the area provides suitable basic conditions for the implementation of green agricultural production. Since 2014, Chenzhuang has adopted natural farming measures for agricultural production. This approach, as a typical green agricultural production practice [45], offers an appropriate research background for verifying meta-analysis conclusions and deeply analyzing the impact mechanisms of green agricultural production on soil carbon sequestration and emission reduction capabilities.

2.2. Meta Analysis

2.2.1. Literature Searching

Relevant literature on SOC and greenhouse gas emissions under long-term implementation of green agronomic practices was searched from 2014 to the present using databases such as CNKI, Google Scholar, and Web of Science. The literature search used “subject” as the search criterion. Keywords included Chinese farmland, ecological agriculture, soil organic carbon (soil organic matter), carbon emissions, greenhouse gases, cropping systems, and farmland management. Based on the basic requirements for meta-analysis and research, the target literature was screened. Inclusion criteria were as follows: (1) The study area must be farmland in China and the experimental period for green agricultural production practices is no less than five years; (2) Changes in agricultural management practices must be clearly defined (including the degree of straw returning to the field, the situation of plastic film mulching, the type of fertilization, tillage methods, planting structure, etc.). This study classified five main agricultural management measures to distinguish and analyze the SOC changes and greenhouse gas emissions of green agricultural production and traditional production planting experimental fields (Table S1); (3) In addition to the content of SOC/greenhouse gas emissions under long-term green agricultural practices (as the experimental group), the initial SOC content/greenhouse gas emissions (as a control group) must also be clearly stated, with more than two replicates for each experimental treatment; (4) SOC measurement must be conducted using the conventional potassium dichromate heating method and elemental analyzer combustion method, and field sampling for greenhouse gas emissions must use the static chamber method. Literature with identical experimental locations and data results was merged, resulting in 142 usable articles (covering 54 experimental sites across 20 provinces, spatial distribution shown in Figure 1a). Data from charts were extracted and transformed using GetData Graph Digitizer (v2.24), yielding 257 valid data pairs, including 122 pairs for SOC, 66 pairs for CH4, and 69 pairs for CO2. The extracted data were standardized: SOC and aggregate organic carbon units were unified to g/kg, and greenhouse gas emission units were unified to g/m2/d. If greenhouse gases were measured by weight standard in the literature, soil bulk density was assumed to be 1.5 g/cm3, converting 1 kg of soil to a soil area of 1/300 m2 at a depth of 20 cm.
The meta-analysis of greenhouse gas emissions in this study mainly includes the overall situation of CH4 and CO2 emissions from farmland soil in China, as well as the differences in greenhouse gas emissions between the two main crop types of paddy fields and dry farming. Based on the selected farmland experiments, this study mainly combines the degree of straw returning to the field and tillage measures into three common agricultural management practices: no-tillage with straw return (NTR), plowing without straw return (PT0), and no-tillage without straw return (NT0). The NTR group was used as the experimental field for green agricultural production, the PT0 group as the experimental field for traditional agricultural production, and NT0 as the experimental field for the parallel control group. For the literature included in the meta-analysis of greenhouse gas emissions from Chinese farmland soil, at least one of these agricultural management practices must be present.

2.2.2. Database Establishment

After literature screening and data extraction, the following indicators were selected to establish the database: location of the experimental site, latitude and longitude, altitude, average annual temperature, average annual precipitation, duration of cultivation, cropping system, fertilization treatment, sampling depth, soil carbon pool indicators before and after the experiment (SOC, with soil organic matter data converted using a coefficient of 0.58 [47]), greenhouse effect-related indicators (CO2 and CH4 emission flux), and other nutrient data. The existing data were grouped according to geographical environment, climatic conditions, soil type, agronomic measures, and crop planting systems to analyze the variations in farmland SOC/greenhouse gas emissions under specific influencing factors. The climate zones reference the temperature zone classification results in Section 2.1; altitude, average annual temperature, average annual precipitation, initial pH, SOC, and other soil nutrient classifications refer to reference [48] and the national soil survey nutrient grading standards. Farmland cropping systems are categorized into paddy fields, paddy-upland rotation (e.g., rice–wheat rotation, rice–corn rotation), and dry farming (e.g., wheat, maize, wheat–legume rotation).
The obtained data were analyzed using Metawin 2.1 to calculate the rate of change in SOC/greenhouse gas emission flux under different treatments. A random effects model was employed to assess the impact of long-term green agronomic practices on SOC/greenhouse gas emissions. The natural logarithm of the response ratio ( l n R ) was selected as the effect size:
l n R = ln X t X i = l n X t l n X i
In the formula, X t represents the SOC content/greenhouse gas emission flux after long-term implementation of green agronomic practices, measured in g·kg−1; X i represents the initial SOC content/greenhouse gas emission flux at the start of the experiment. The effect size weight for each was calculated as follows:
w = N t × N i N t + N i
In the formula, w is the effect size weight, and nt is the number of experimental replicates for each treatment. N t and N i , respectively, represent the number of experiment repetitions of the group after long-term green agronomic treatment and the group at the beginning of the experiment. The bootstrap resampling method was used to perform 4999 iterations to calculate the 95% confidence interval. If the confidence interval includes 0, it indicates no significant effect; if it does not include 0, the effect is significant. If the entire confidence interval is greater than 0, it indicates that long-term implementation of green agronomic practices significantly increases SOC content/greenhouse gas emission flux; if the entire confidence interval is less than 0, it indicates a significant decrease in SOC/greenhouse gas emission flux [48]. The percentage change in SOC content/greenhouse gas emission flux was calculated as follows:
C h a n g e   i n   S O C % = e l n R 1 × 100 %
In the formula, C h a n g e   i n   S O C % refers to the percentage change in soil organic carbon content/greenhouse gas emission flux after long-term cultivation relative to the initial values at the start of the experiment.
In the meta-analysis of greenhouse gas emissions, a random effects model was used to evaluate the impact of NT0 and NTR on farmland soil CH4 and CO2 emissions/uptake, with NT0 and NTR serving as experimental treatments and PT0 (or PTR) as the control. The effect comparisons are denoted as follows: no-tillage without straw return versus plowing without straw return (NT0/PT0), no-tillage with straw return versus plowing without straw return (NTR/PT0), and no-tillage with straw return versus plowing with straw return (NTR/PTR). In these comparisons, the former is the treatment measure and the latter is the control measure. The study examines the effect size of the treatment measures on the respective indicators compared to the control measures.

2.2.3. Microbiological Informatics Analysis

Microbial gene high-throughput sequencing and cloud analysis were conducted by a commercial biotechnology company based in in Jiangsu Province, China. The data obtained were analyzed using the QIIME2 (2019.4) software package [49]. Considering that the field experiment research area—Chenzhuang, Lita Village, Jurong City is located in Jiangsu Province, the selected sites for microbiological informatics analysis were primarily located in Jiangsu Province. The basic steps of data analysis are as follows: firstly, collect the soil microbial information under the planting management of different agricultural production practices. High-quality sequences were clustered at a 97% similarity level to obtain taxonomic units at the phylum and class levels [50]. Subsequently, microbial community α-diversity analysis was performed [51], along with significance testing of inter-group differences [52]. Using R (v3.2.0) language and pheatmap (1.0.12) software package, the abundances of species composition with the top 20 average abundances were plotted. Additionally, the FAPROTAX (1.1) and FUNGuild (1.1a) databases were used to predict bacterial and fungal functions, analyzing and comparing the abundance differences of major functional groups of bacteria and fungi. Online linear discriminant analysis effect size (LEfSe) program was used for linear discriminant analysis (LDA, p < 0.05, LDA > 3.5) to identify different indicator microorganisms in the microbial community [53]. Through cluster analysis, key species and pathways in the composition and function of microbial communities in different samples were determined. Adobe Illustrator CC2018 (Adobe Inc., San Jose, CA, USA) was used for graphic adjustments and pathway diagram creation.

2.2.4. Construction of Structural Equation Model

The structural equation model (SEM) is a method used to analyze the relationships between variables based on their covariance matrix, allowing for the simultaneous analysis of multiple variables [54,55]. Given the highly complex nature of soil carbon flux variations, traditional multiple regression methods often fall short of analytical needs. In this study, the structural equation was selected to construct the theoretical model, and indicators such as organic matter indicators (including total nitrogen (TN), soil organic matter (SOM), and dissolved organic carbon (DOC)), pH, soil moisture, soil mineral properties (including calcium (Ca), silt, and cation exchange capacity (CEC)), microbial biomass, carbon use efficiency (CUE), microbial necromass carbon (MNC), and CO2 were selected as the observed variables of the SEM. Using Amos 7.0 software [56], we conducted SEM fitting analysis to explore the interaction relationship between the “Microbial Carbon Pump (MCP)” and the generation of environmental factors, and to identify the mechanism and interaction relationship of plant–microbe–soil in the emission reduction and carbon sink enhancement effects of farmland soil.

2.3. Field Experiment

2.3.1. Experimental Design

To further validate the conclusions of the meta-analysis and the carbon sequestration mechanisms of the “Microbial Carbon Pump (MCP)”, controlled field experiments were conducted in Chenzhuang from 2022 to 2023. The natural farming planting fields were established as experimental plots (mainly NTR agricultural cultivation measures), with conventional farming fields as the control plots (mainly PT0 agricultural cultivation measures), and NT0 was set up in a paddy field experimental group as a parallel control. Soil, water, and gas samples were collected regularly, using soil enzyme activity and CO2 and CH4 gas fluxes as indicators of soil carbon sink capacity and greenhouse gas emissions. Additionally, considering that changes in land use types are key factors causing spatial distribution differences in soil carbon and shifts in sources and sinks [57], we ensured the objectivity of the experimental results by selecting and conducting parallel sampling and comparative analysis of soil carbon balance in other land types within Chenzhuang. The sampling sites include 5 soil environment points and 5 water environment points (Figure 1c), the specific layout strategy and location information of the sampling points are detailed in Table S2.

2.3.2. Sample Collection and Index Determination

Soil organic carbon density and enzyme activity were determined, respectively, by the potassium dichromate oxidation—external heating method (GB 7857-87) and the microplate fluorescence method of Saiya-Cork [58]. For specific determination methods, please refer to Figure S1.
The stoichiometry of soil extracellular enzymes was studied by calculating the activity ratios of carbon, nitrogen, and phosphorus enzymes [59]. Additionally, enzyme stoichiometry vector analysis was employed to assess the relative limitations on microbial energy and nutrients due to thinning treatments, using vector length (VL) and vector angle (VA) as analytical tools [60]. The calculation formulas are as follows:
E C N = l n H Β G ln H N A G + H L A P
E C P = l n H Β G ln H A P
E N P = ln H N A G + H L A P ln H A P
V L = S Q R T E C N 2 + E C P 2
V A = D e g r e e s A T A N 2 E C P , E C N
In the formula, E C N , E C P , and E N P represent the ratios of soil carbon-acquiring enzymes to nitrogen-acquiring enzymes, carbon-acquiring enzymes to phosphorus-acquiring enzymes, and nitrogen-acquiring enzymes to phosphorus-acquiring enzymes, respectively. H Β G , H N A G , H L A P and H A P denote the enzyme activities of βG, NAG, LAP, and AP, respectively. S Q R T is the square root function, Degrees is the angle conversion function, and A T A N 2 is the arctangent function. A larger V L indicates a more severe carbon limitation. V A is divided by the 45° line; values greater than 45° indicate phosphorus limitation, while values less than 45° indicate nitrogen limitation. The greater the deviation, the stronger the limitation.

2.3.3. Estimation of Soil Carbon Storage

The carbon stock was estimated using the InVEST model [56]. The specific steps are as follows: (1) Based on the literature [61], the model and correction formulas were used to adjust the organic carbon density data, resulting in the carbon density coefficient for Jurong City (Table 1). Soil carbon data were sourced from the World Soil Database and China’s soil attribute data provided by the National Tibetan Plateau Data Center (https://data.tpdc.ac.cn/zh-hans/ (accessed on 10 February 2025)), with a spatial resolution of 1 km and soil depths selected at 0–20 cm and 20–40 cm [62]. When performing weighted calculations with the coefficients, the tea and grassland areas in the Chenzhuang were categorized as grassland, residential areas were considered building land, and abandoned mines and unused land were classified as unused land. (2) The measured data of SOC were screened for data quality control (the quality control process and analysis results are detailed in Figure S2), and the spatial distribution maps of SOC density for 2022 and 2023 in the Chenzhuang area were obtained using the Kriging spatial interpolation method in the geostatistical module of ArcGIS 10.8. The distribution of land types at the sampling points included 1 grassland, 1 cropland, 5 water areas, 1 forest land, 1 unused land, and 1 building land. Due to the difficulty of data collection, the spatial distribution of the observation samples is not completely uniform, but the data cover all land types. Additionally, given the small area of Chenzhuang (4.83 km2), the spatial representativeness of the data can generally meet the research needs. (3) The InVEST model was used to calculate terrestrial carbon stock. According to the carbon stock estimation methods [63,64], the carbon stock for different land types was calculated based on land use area and Table 1. (4) Spatial mapping was conducted using the zonal statistics tool in ArcGIS 10.8.

3. Results

3.1. Carbon Budget Differences Obtained from META

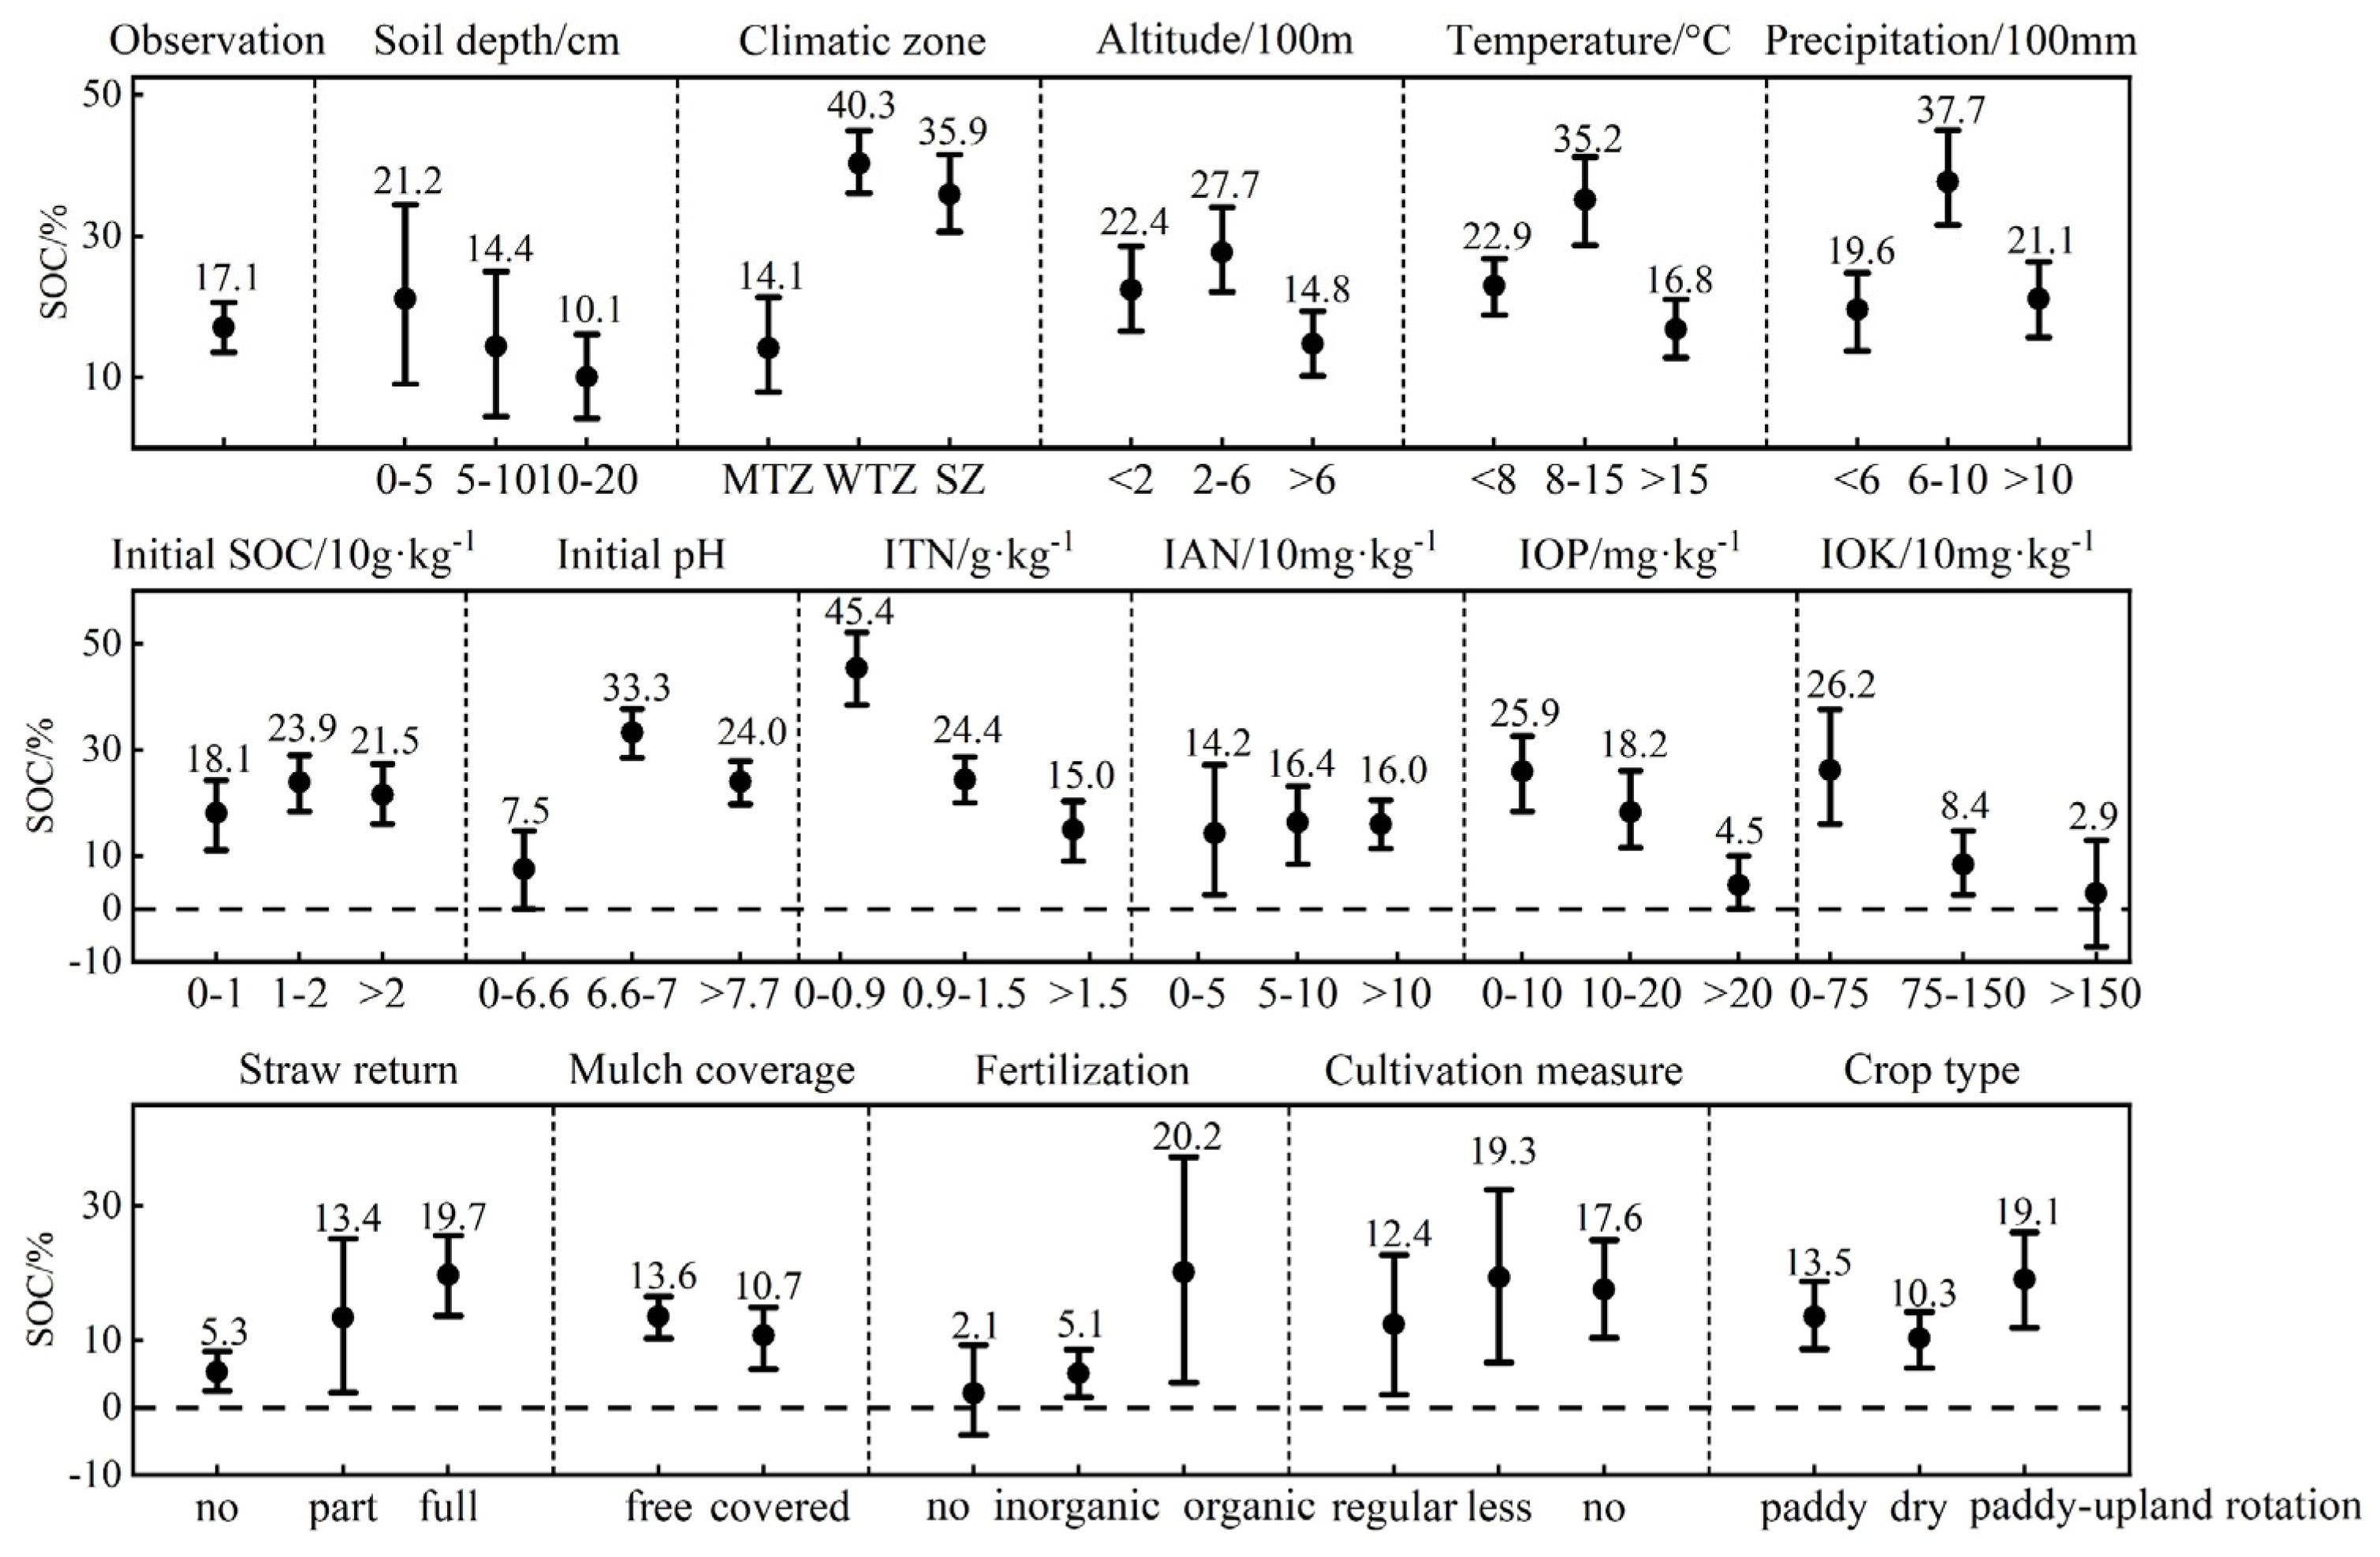
3.1.1. Soil Organic Carbon Content

In recent years, human activities (such as frequent tillage and excessive planting) and external inputs (like organic fertilizers, nutrient solutions, and straw return) have led to fluctuations in farmland SOC [65]. This study utilized meta-analysis to integrate data from farmland location experiments across different regions of China, deeply analyzing the distribution characteristics of SOC under various agricultural management practices in different climatic and soil conditions (Figure 2).
The analysis results indicate that, specifically, the SOC content in farmlands increased by 17.10% compared to the initial stage of the experiments. However, this carbon accumulation effect diminishes with soil depth. SOC in the 0–5 cm soil layer increases the most, reaching 21.2%. The increase in SOC in different temperature zones is manifested as WTZ (40.3%) > SZ (35.9%) > MTZ (14.1%), with the greatest increase observed at elevations of 200–600 m, temperatures of 8–15 °C, and precipitation of 600–1000 mm. Regarding soil physicochemical properties, the SOC increase in acidic soils (pH < 6.6) was lower than in neutral (6.6 < pH < 7.7) and alkaline soils (pH > 7.7), with increases of 7.5%, 35.8%, and 14.0%, respectively. Farmland with poor initial nutrients is more conducive to an increase in SOC. The increase in SOC was the greatest (23.9%) when the initial content was 10–20 g·kg−1. When the ITN was less than 0.9 g·kg−1, the increase in SOC reached 45.4%, which was 21.0% and 30.4% higher, respectively, than when the ITN was between 0.9–1.5·kg−1 and greater than 1.5 g·kg−1. When the IOP and IOK increase, the increase in SOC also shows a downward trend.
Agricultural production mainly causes different impacts on the SOC of farmland through various agronomic measures, including straw return, film mulching, fertilization systems, and farming patterns. The results show that the amount of straw returned to the field is positively correlated with the increase rate of SOC, and the increase rate reaches 19.7% when the full straw is returned to the field. The increase rate of SOC without mulching was 2.9% higher than that with film mulching. The impact of long-term organic fertilizer use on SOC sequestration results is four times that of chemical fertilizers. Among tillage methods, reduced tillage, no-till, and conventional tillage show decreasing effects on SOC, with increase rates of 19.3%, 17.6% and 12.4%, respectively. The practice of paddy-upland rotation shows the best effect on SOC increase (with an increase of 19.1%).
To further distinguish the driving effect of agricultural management measures on soil organic carbon accumulation within different environmental intervals (mainly considering temperature and altitude), this study further grouped the data by altitude intervals (<200 m, 200–600 m, >600 m) and temperature intervals (<8 °C, 8–15 °C, >15 °C), and analyzed the contribution rate of management measures within different environmental groups to increasing SOC (for specific analysis steps, please refer to the Supplementary Materials). It was found that in the low-temperature (<8 °C) and medium-temperature areas (8–15 °C), the impact of straw returning to the field might be the most prominent. In high-temperature areas (>15 °C), the dominant factor is the type of fertilizer applied.
Overall, SOC accumulation is abundant in warm temperate, low-altitude, and relatively humid areas, with this accumulation effect gradually decreasing with deeper plowing. Soils initially poor in nutrients are more conducive to carbon sequestration in farmlands. Additionally, green agronomic practices such as full straw return, reduced plastic mulch, organic fertilization, and conservation tillage favor SOC accumulation.

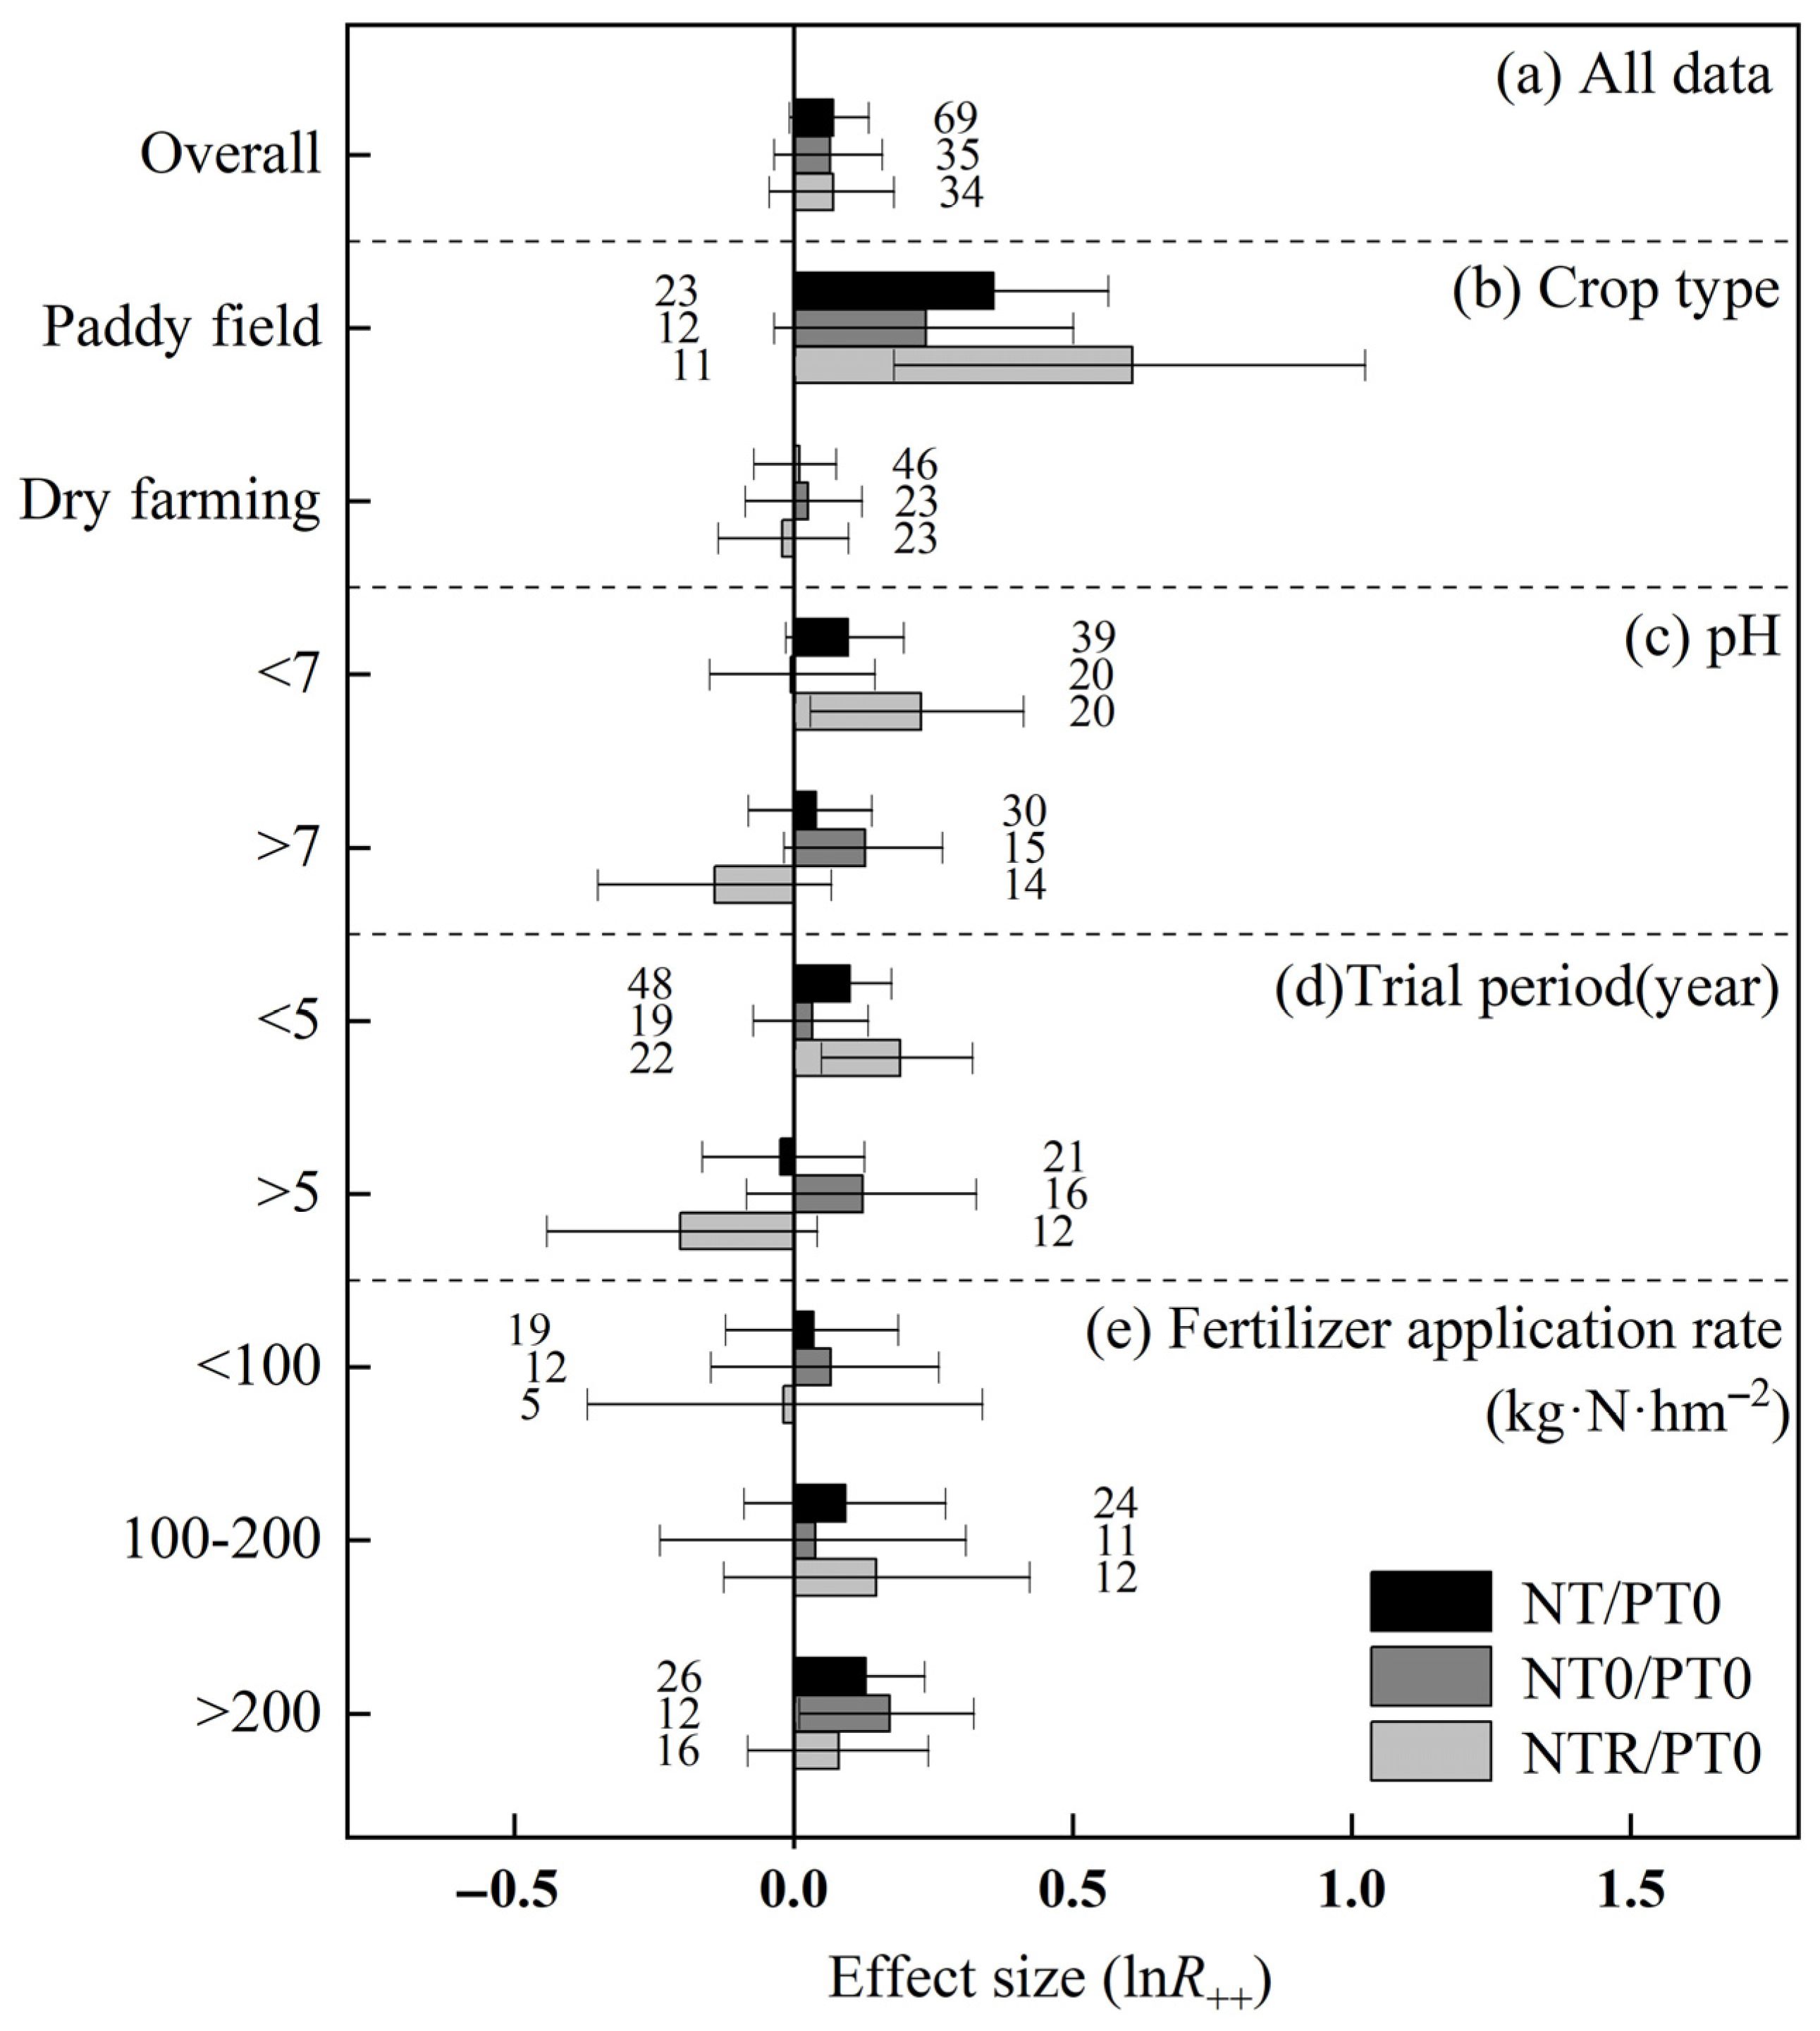
3.1.2. Greenhouse Gas Emissions

A meta-analysis was conducted on the overall emissions of CH4 and CO2 from China’s farmland soils, focusing on the differences in greenhouse gas emissions between the two main crop types: paddy fields and dry farming. In terms of emissions, paddy fields consistently showed positive emissions, while dry farming exhibited negative emissions (Table 2), indicating that paddy fields are sources of CH4 emissions, whereas dry farming acts as a CH4 sink. Among different agricultural management practices, the average CH4 emissions from paddy fields under NT treatment were lower than those under PT0 treatment. Conversely, the average CH4 absorption in dry farming was higher under PT0 than under NT. Both paddy fields and dry farming had average CO2 emissions greater than zero, meaning both are sources of CO2 emissions. The average CO2 emissions were 50 times higher than those of CH4. The order of CO2 emissions was NTR < PT0 < NT0. The use of no-till and straw return practices in paddy fields generates less CO2 emissions.
To further clarify the impact of different agronomic measures on CH4 emissions and absorption, as well as CO2 emissions, PT0 was used as the experimental control. The effects of NTR and NT0 on the CH4 and CO2 emissions/absorption of farmland soil were evaluated, with effect comparison codes designated as follows: NT0/PT0 for no-tillage without straw return versus plowing without straw return, NTR/PT0 for no-tillage with straw return versus plowing without straw return, and NTR/PTR for no-tillage with straw return versus plowing with straw return. In these comparisons, the former represents the treatment measure and the latter the control measure, assessing the effect value of the treatment measure on the respective indicators compared to the control. For paddy fields’ CH4 emissions, there were 46 valid data pairs, with 25 pairs for NT0/PT0 and 21 pairs for NTR/PT0 (Figure 3). The results showed that compared to PT0, the use of NT significantly reduced paddy field CH4 emissions by 17.7 ± 9.2% (p < 0.05). Specifically, NT0 significantly reduced paddy field CH4 emissions by 28.0%, while the reduction effect of NTR on paddy fields’ CH4 emissions was not significant. For dry farming’s CH4 absorption, there were 20 valid data pairs, with 9 pairs for NT0/PT0 and 11 pairs for NTR/PT0. Compared with PT0, the use of NT0 can increase the dryland CH4 absorption by 23.1%.
The influence effect of agronomic measures on CO2 emissions was explored in combination with a subgroup analysis (Figure 4). A total of 69 pairs of CO2 emission data were included in the meta-analysis, among which there were 35 pairs of NT0/PT0 and 34 pairs of NTR/PT0, respectively (Figure 4a). Under different crop types (Figure 4b), paddy fields showed a stronger trend of promoting CO2 emissions compared to dry farming. The CO2 emission effect value lnR++ for paddy fields using NT/PT0 was 0.359 ± 0.206 (p < 0.05), indicating that compared to PT0, NT significantly increased CO2 emissions by 46.2% (p < 0.05), while the application of NTR in dry farming shows a trend of reducing CO2 emissions. In acidic soil, NT0 showed a trend of not significantly reducing CO2 emissions (Figure 4c), while in alkaline soil, NTR significantly reduced CO2 emissions by 30.7% compared with PT0. Subgroups of different test years indicated that long-term adoption of NTR reduces carbon emissions by 41.3% (Figure 4d). The CO2 emission effect of NT/PT0 increases with the increase in nitrogen fertilizer application rate, NT0/PT0 shows a decrease first and then an increase, and NTR/PT0 can reduce CO2 emissions when the nitrogen fertilizer application rate is less than 100 kg·N·hm−2 (Figure 4e).
Overall, the correlation between soil greenhouse gas emission effects and various factors such as climate variables, soil properties and agronomic measures varies under different agricultural management practices (Table 3). For NT0/PT0, there is a significant positive correlation between CH4 emission effect and soil pH (0.3965, p < 0.001), indicating that increasing pH by one unit can increase CH4 emissions by 0.40 units, and an increase in the annual average temperature by 1 °C raises the CO2 emission effect value by 0.11 units. Under the NTR/PT0, the correlation between CH4 absorption and environmental factors is demonstrated as follows: when the temperature rises by 1 °C, precipitation increases by 100 mm, the duration of NTR application extends by one year, fertilizer application increases by 100 kg·N·hm−2, the effect values of CH4 absorption were increased by 0.11, 0.01 and 0.26 units, decrease by 0.07 units, respectively. For the NT/PT0, both CH4 absorption and CO2 emission effects are significantly correlated with temperature and precipitation. Increasing temperature and precipitation can enhance CH4 absorption and CO2 emission capabilities under NT measures. Additionally, reducing fertilizer application can significantly promote CH4 absorption and CO2 reduction.
In summary, paddy fields are major sources of CO2 emissions, while dry farming serves as a weak sink for CH4 absorption. The green agronomic practices of no-tillage without straw returning to the field can significantly reduce the CH4 emissions in paddy fields by 28.0% and increase the CH4 absorption in dry farming by 23.1%. No-tillage with straw returning to the field can significantly reduce CO2 emissions by 30.7% in alkaline soil, and long-term application of this tillage measure (for more than 5 years) can achieve a reduction rate of 41.3%. From the perspective of environmental impact, the soil environment with high temperature and abundant precipitation is conducive to the absorption of CH4, but not conducive to the reduction in CO2 emissions.
The meta-analysis in this section indicates that differences in carbon balance arise from the synergistic effects of multiple factors, including climate factors, soil properties, and agronomic practices: SOC is primarily regulated by climate and soil properties, while CH4 and CO2 emissions respond more significantly to climate factors and agronomic practices. This finding underscores the importance of in-depth analysis of the factors affecting soil properties to elucidate the mechanisms of soil carbon sequestration.

3.2. Soil Microbial Changes Under Different Agricultural Management Practices

The diversity of microbial community composition can serve as an important indicator for exploring soil carbon sink mechanisms under different agricultural management practices [66]. This study collected microbial experimental data from Jiangsu, China over the period 2022–2023 for informatics analysis, discussing changes in soil microbial community structure and its interactions with plant species diversity in the soil environment, revealing the mechanisms of soil carbon sequestration and emission reduction.

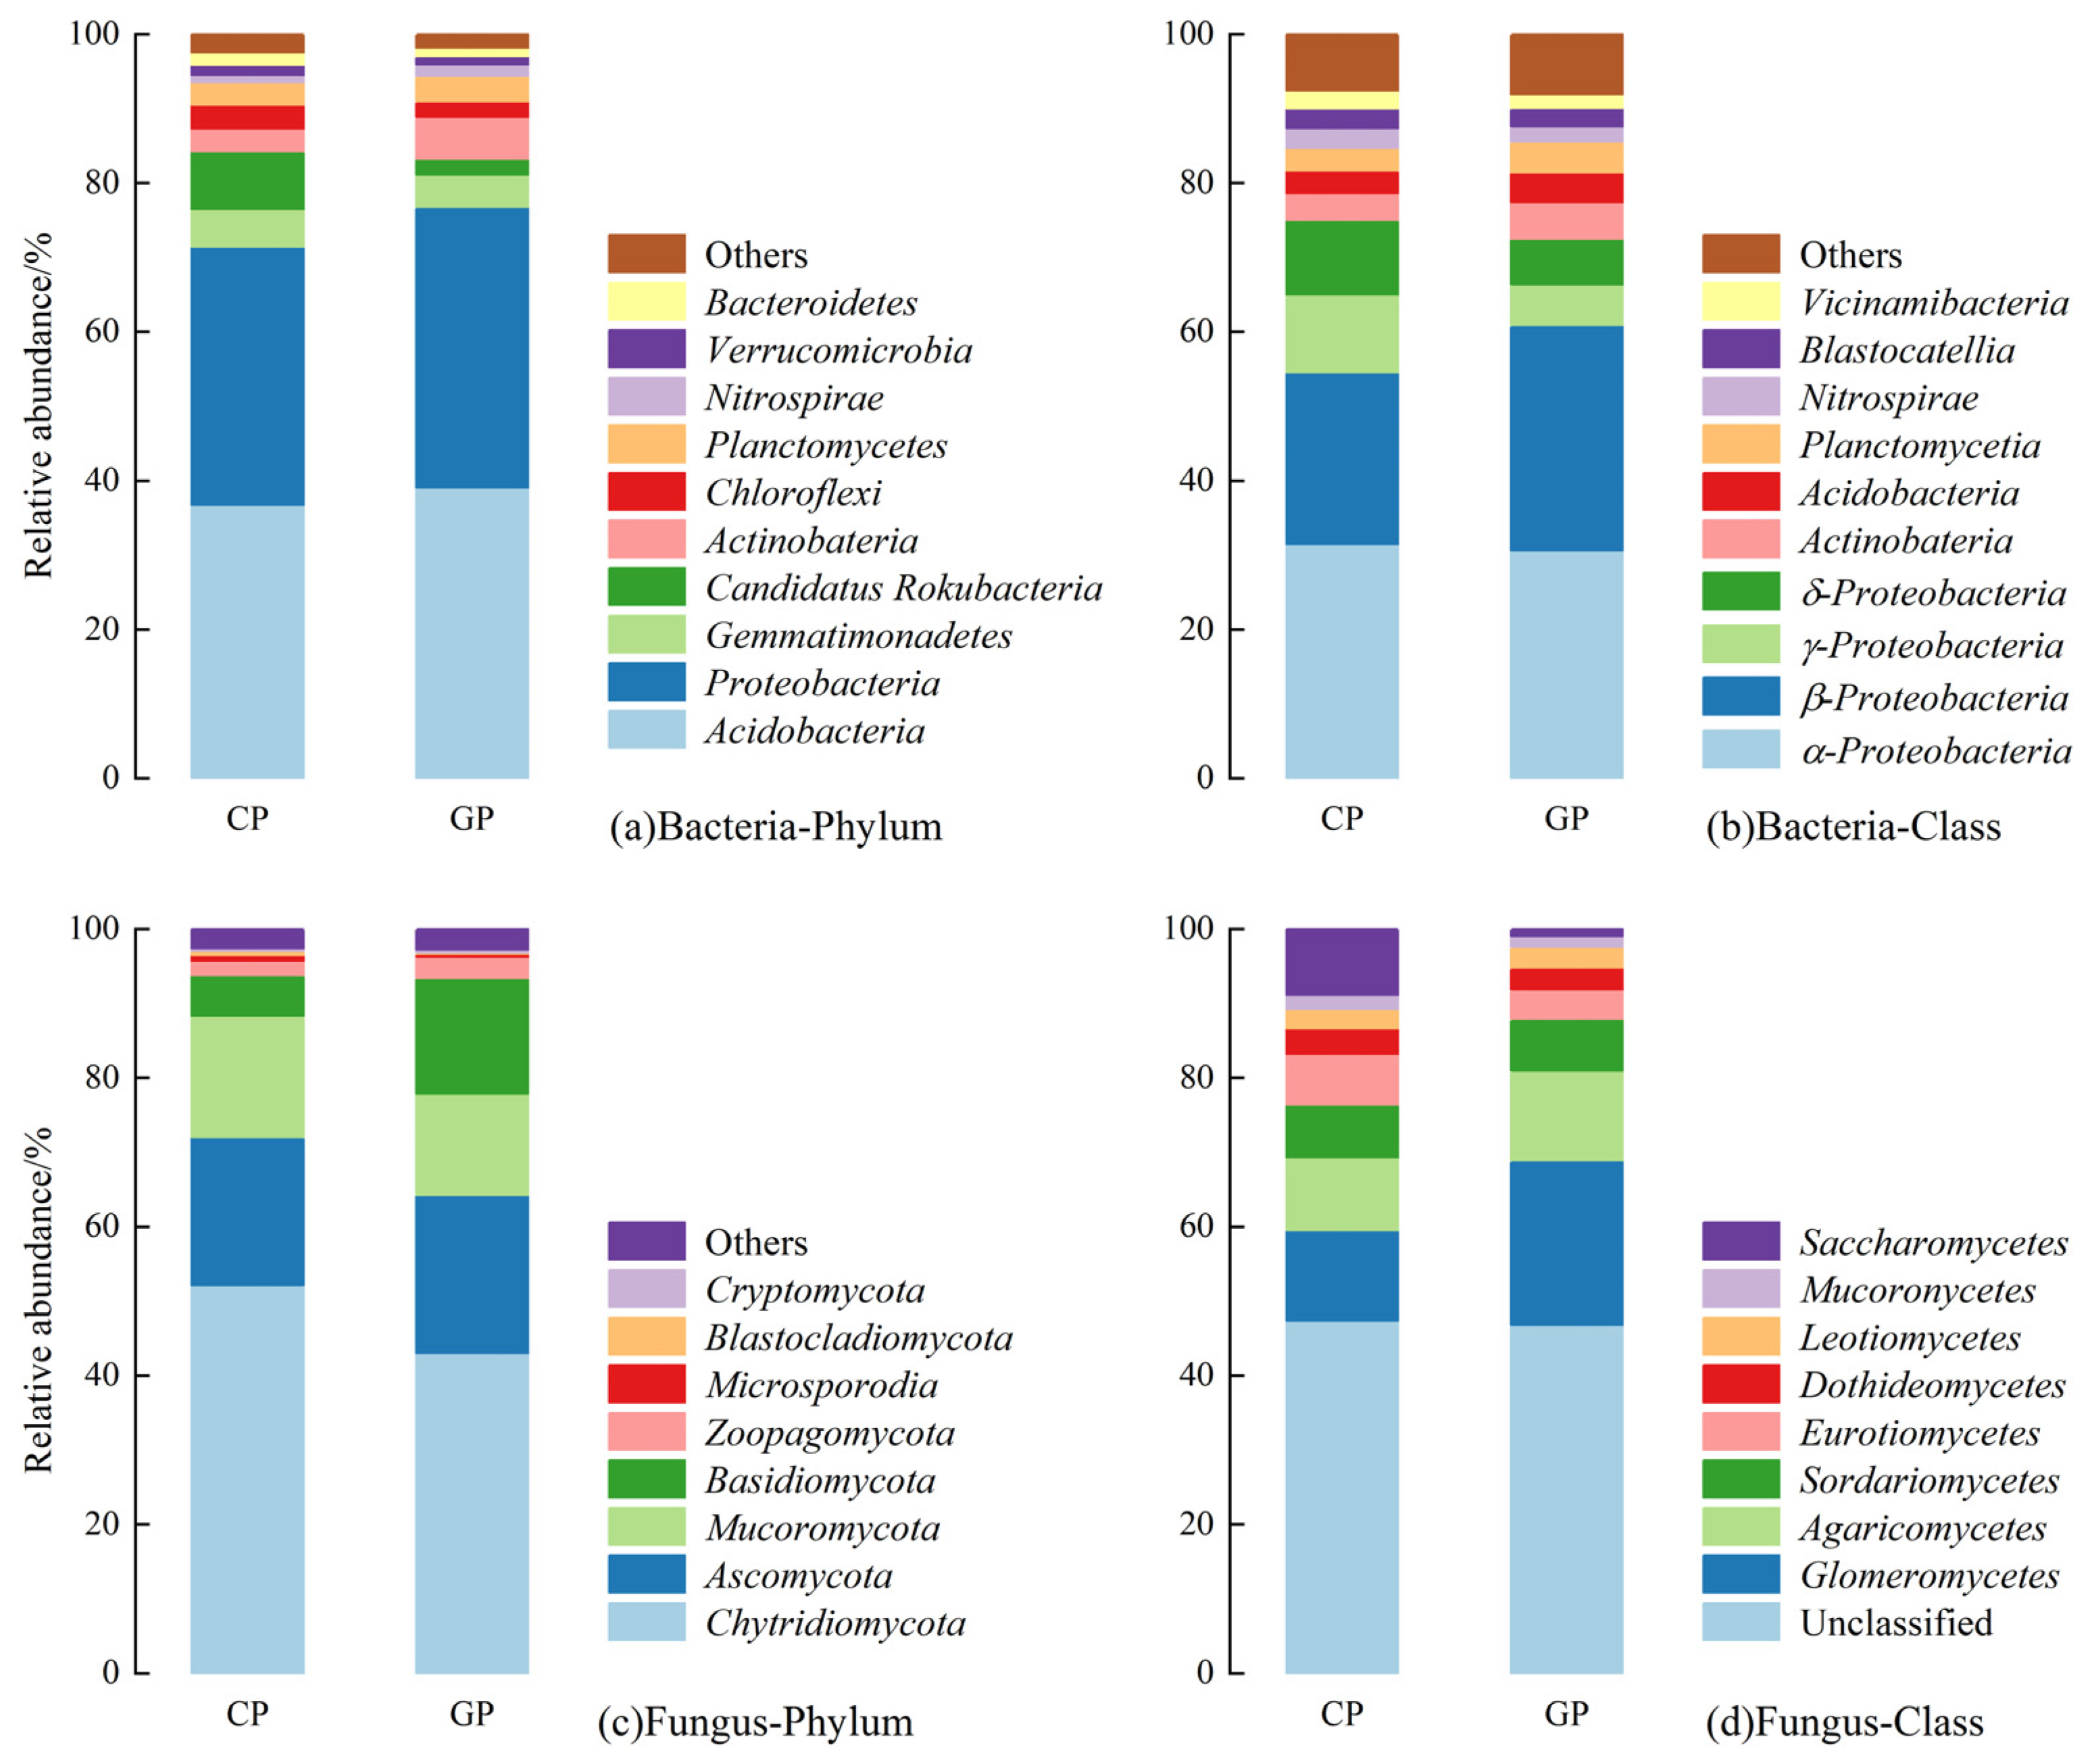
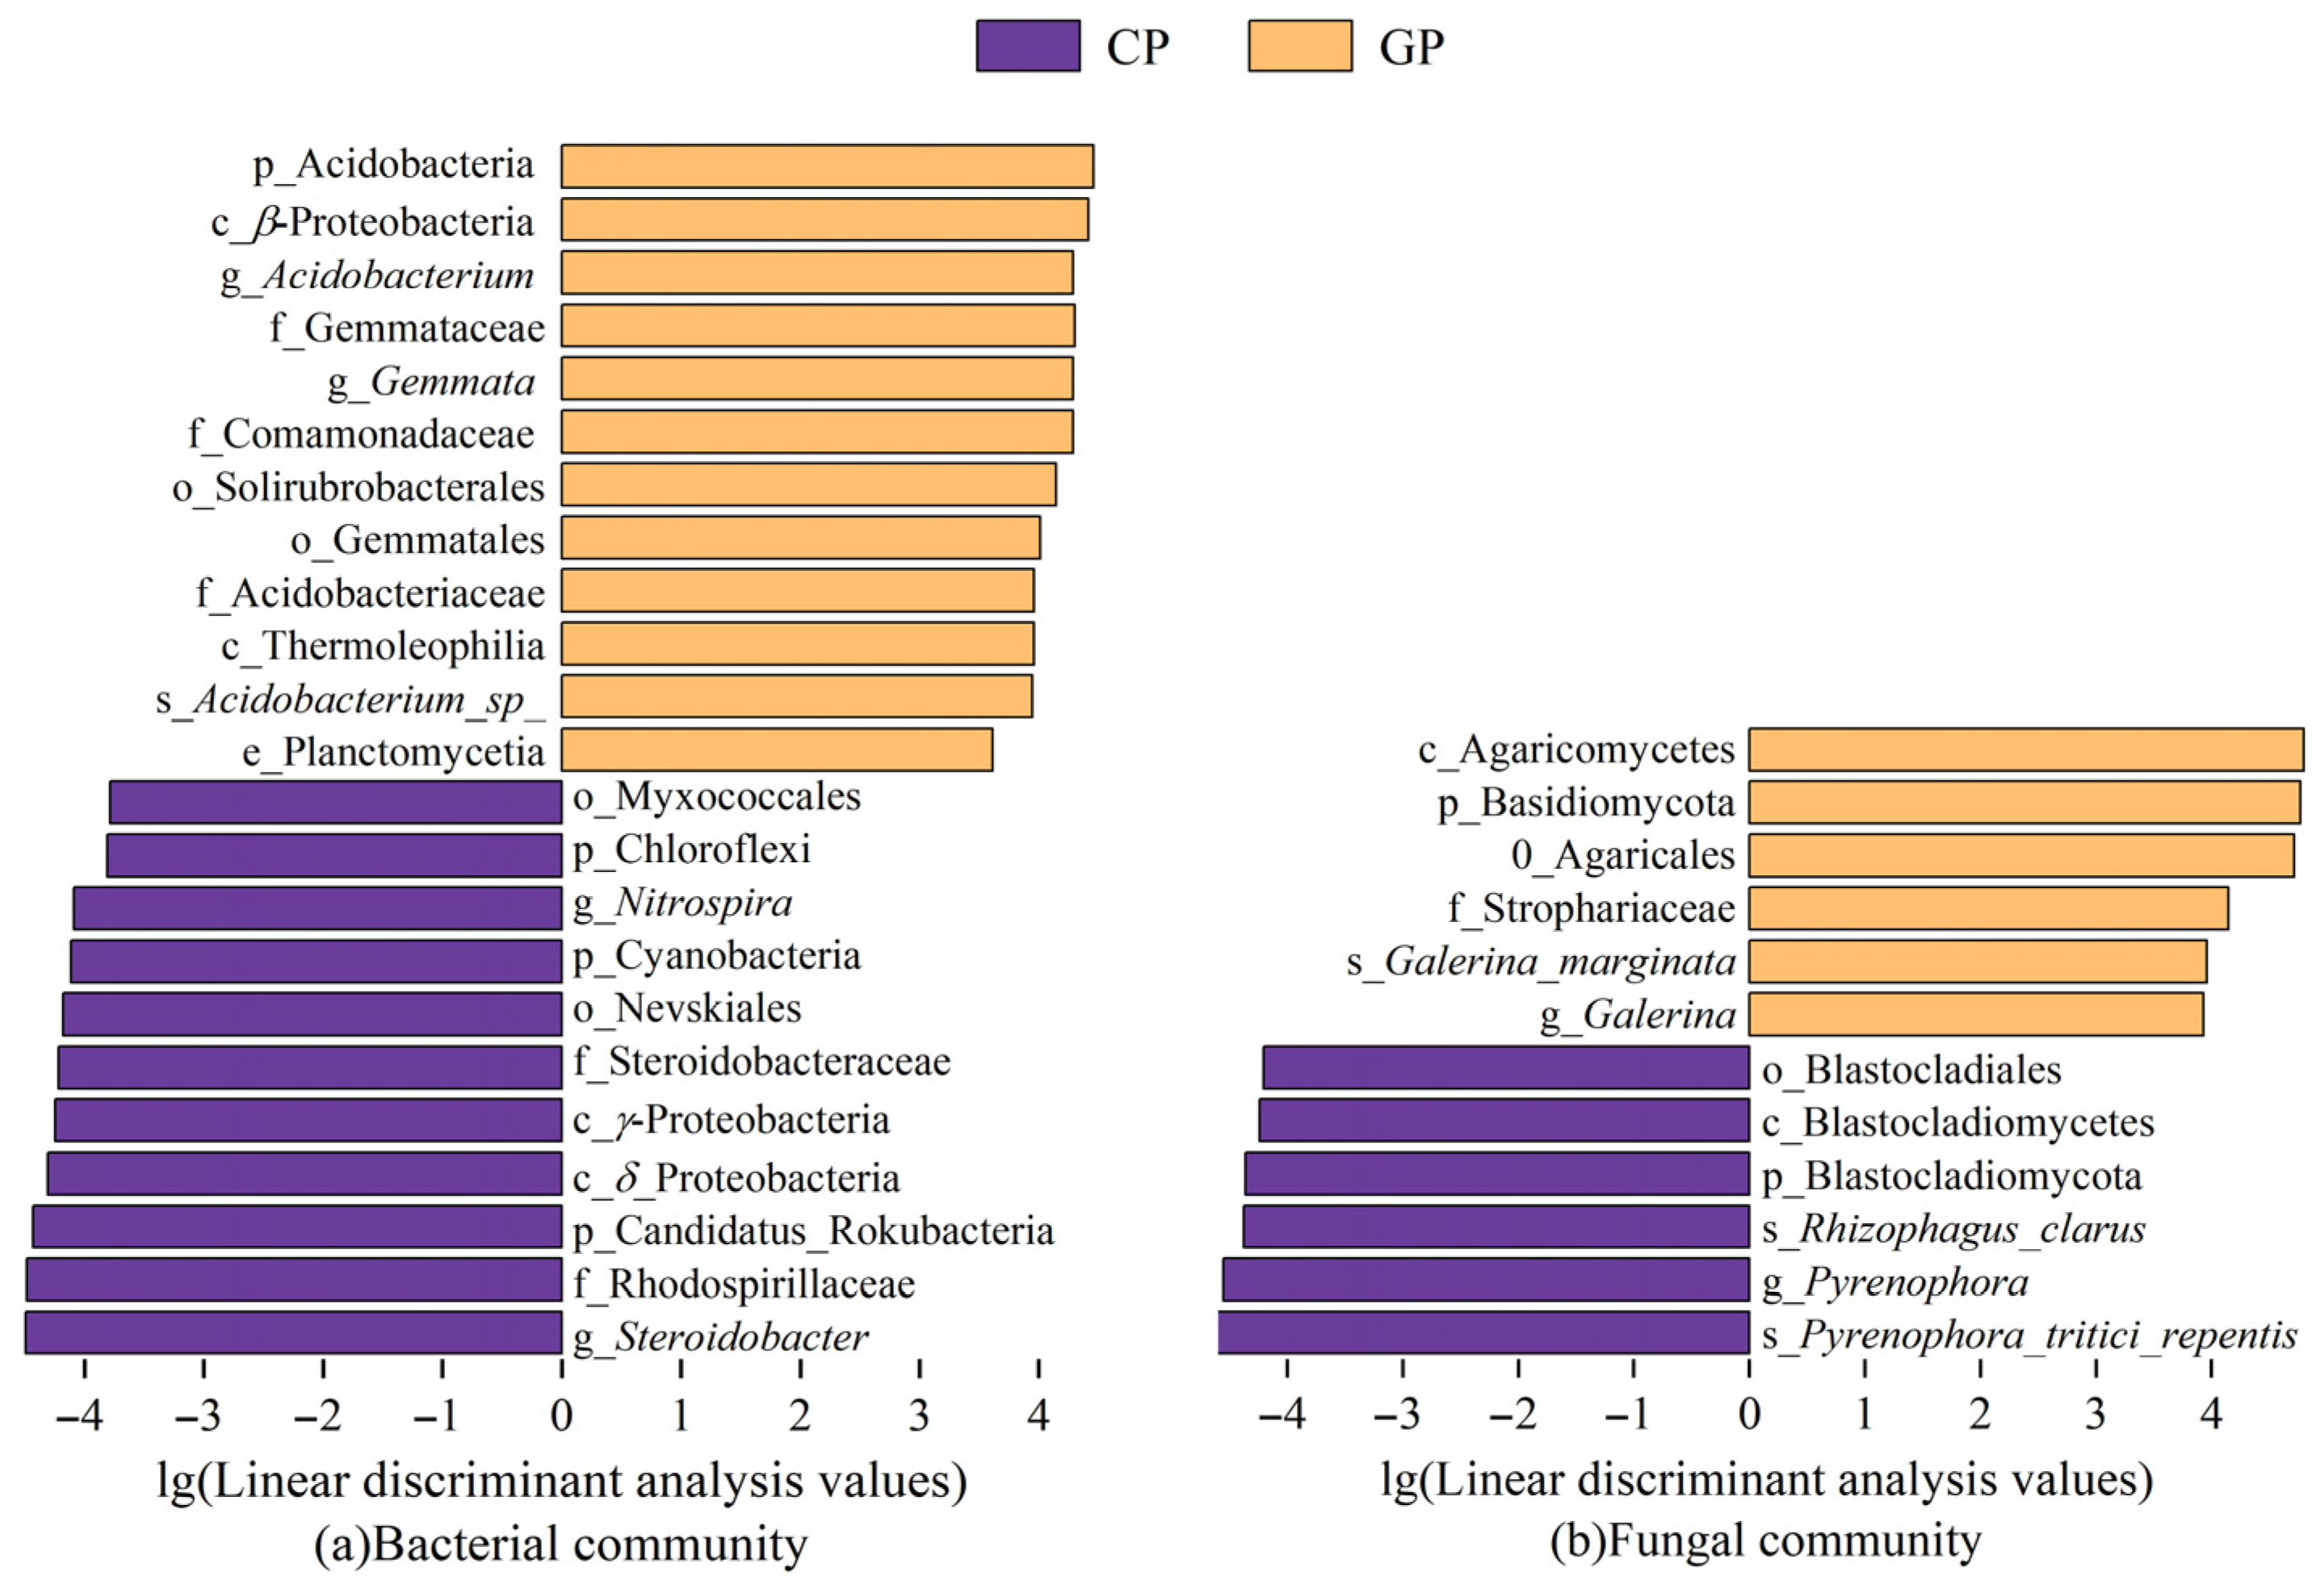
3.2.1. Microbial Community Structure

This study analyzes changes in the structure of soil microbial communities under different agricultural management practices at the phylum and class levels. For ease of comparison, two types of treatment are selected: the conventional farming practices represented by ploughing without straw returning to the field (denoted as CP) and the green farming practices represented by no-tillage with straw returning to the field (GP).
The results indicate that for bacterial communities, both agricultural management practices had Acidobacteria and Proteobacteria as dominant phyla (Figure 5a), and α-Proteobacteria and β-Proteobacteria as dominant classes (Figure 5b). For fungal communities, the dominant phyla were Chytridiomycota and Ascomycota (Figure 5c), and the dominant class was Glomeromycetes (Figure 5d). Although the dominant microbial groups were similar under different agricultural management practices, the relative abundance of soil microorganisms varied. Compared to CP treatment, the relative abundance of β-Proteobacteria and Glomeromycetes under GP treatment increased by 7.21% and 9.96%, respectively (Table 4), and β-proteobacteria could effectively drive the carbon and nitrogen cycles [67,68], Glomeromycetes indirectly promotes soil carbon sequestration by enhancing the efficiency of plant nutrient absorption [69].
Further analysis of the changes in indicator microorganisms within microbial communities under different agricultural management practices is presented in Figure 6. The results show that the indicator microorganisms for CA treatment are primarily Chloroflexi, Cyanobacteria, and Blastocladiomycota. These microorganisms play a significant role in resistance to disturbance and environmental stress [70], suggesting that farmland soil tends to develop microbial communities that are resilient to environmental disruptions during succession. In contrast, the indicator microbial communities for FA treatment mainly include Acidobacteria and Basidiomycota. These groups are more commonly found in high-fertility soils. Acidobacteria effectively utilize carbon sources and plant residues in the soil for degradation [71], making them indicators of carbon and phosphorus cycling hydrolases. Basidiomycota play a crucial role in the carbon and nitrogen cycles [72]. In conclusion, long-term implementation of green agricultural production helps increase the number of eutrophic bacteria and carbon cycling bacteria in the soil microbial community, thereby enhancing the carbon sequestration of farmland soil.

3.2.2. Interaction Among Plant–Microorganism–Soil Carbon

The “Microbial Carbon Pump” (MCP) theory posits that plant-derived organic matter is metabolized and decomposed by microorganisms, which then synthesize a series of organic compounds. This process is key to understanding soil carbon cycling mechanisms [73]. This section constructs a structural equation model of plant–microbe–soil carbon, analyzing the interactions and significant impacts of plant, soil, and microbial metabolic residue carbon processes under the background of the implementation of green agricultural production practices (Figure 7).
The research found that plant species diversity significantly promotes the accumulation of organic matter indicators (R = 0.73) and soil mineral content (R = 0.34) and has a positive impact on the physical and chemical properties of the soil at the same time. Soil organic matter directly acts on microorganisms, promoting the growth of their biomass carbon. The indirect influence between microorganisms and residual carbon mainly occurs through the plant and soil environment, and CUE serves as an intermediate indicator to promote the accumulation of residual carbon. The results show that plants, on the one hand, act on organic matter indicators and mineral properties through diversity indicators, thereby having a significant impact on soil carbon sinks and carbon emissions; on the other hand, they act on the biomass of microorganisms through the physical and chemical properties of the soil, thereby having an insignificant impact on the carbon of microbial residues. Therefore, it is necessary to further discuss the participating roles of different microbial species in the process of soil carbon sequestration.
Microbial strains mainly include fungi and bacteria [74]. Structural equation modeling was used to analyze the relationships between fungal/bacterial properties, plant species diversity, and the soil carbon pool (Figure 8). The similarity of the structural models of the two lies in that there are significant correlations between plant species diversity and soil organic matter (SOM), mineral properties (Ca, CEC), and soil physicochemical properties (SWC, pH), with path coefficients for fungus being 0.55, 0.36, 0.50, and 0.41, and for bacteria being 0.42, 0.30, 0.66, and 0.45, respectively. The difference between the two structural models lies in the following: on the one hand, for the fungal community, SOM and pH promoted the accumulation process of FPLFAs by CUE and MBC, and thereby actively contributed to the accumulation of FNC (p < 0.001, R = 0.35). For the bacterial community, SOM, pH and SWC jointly promoted the accumulation process of BPLFAs, but this promoting effect was relatively weak compared with the fungus, and the correlation with BNC was not significant (p > 0.01, R = 0.35). On the other hand, Ca and CEC indirectly inhibited the accumulation of microbial necromass carbon by promoting CO2 emissions. This mechanism of action was more significant in fungi (PFungus < 0.001, PBacteria < 0.01). The results show that plants mainly affect the MNC and metabolites of fungus through soil media, thereby promoting the formation of the main components of soil organic carbon, and the contribution rate of MNC to the soil carbon pool exceeds 50% [75]. Therefore, in future research related to the microbial action mechanism of soil emission reduction and carbon sink increase, the feedback effect between fungal communities and plants should be the focus.

3.3. Carbon Flux Dynamics in the Field Experimental Area

Combining the meta-analysis results of the carbon budget in China’s farmland soils with the conclusions from analyzing soil carbon sequestration mechanisms involving both microbes and plants, this study selected Chenzhuang as the field experiment area to specifically verify the emission reduction and carbon sequestration effects of green agricultural production practices. In the field experiments, environmental variables (climatic conditions and soil properties) were controlled to remain consistent, and changes in carbon flux were analyzed by monitoring indicators such as soil enzyme activity and greenhouse gas flux.

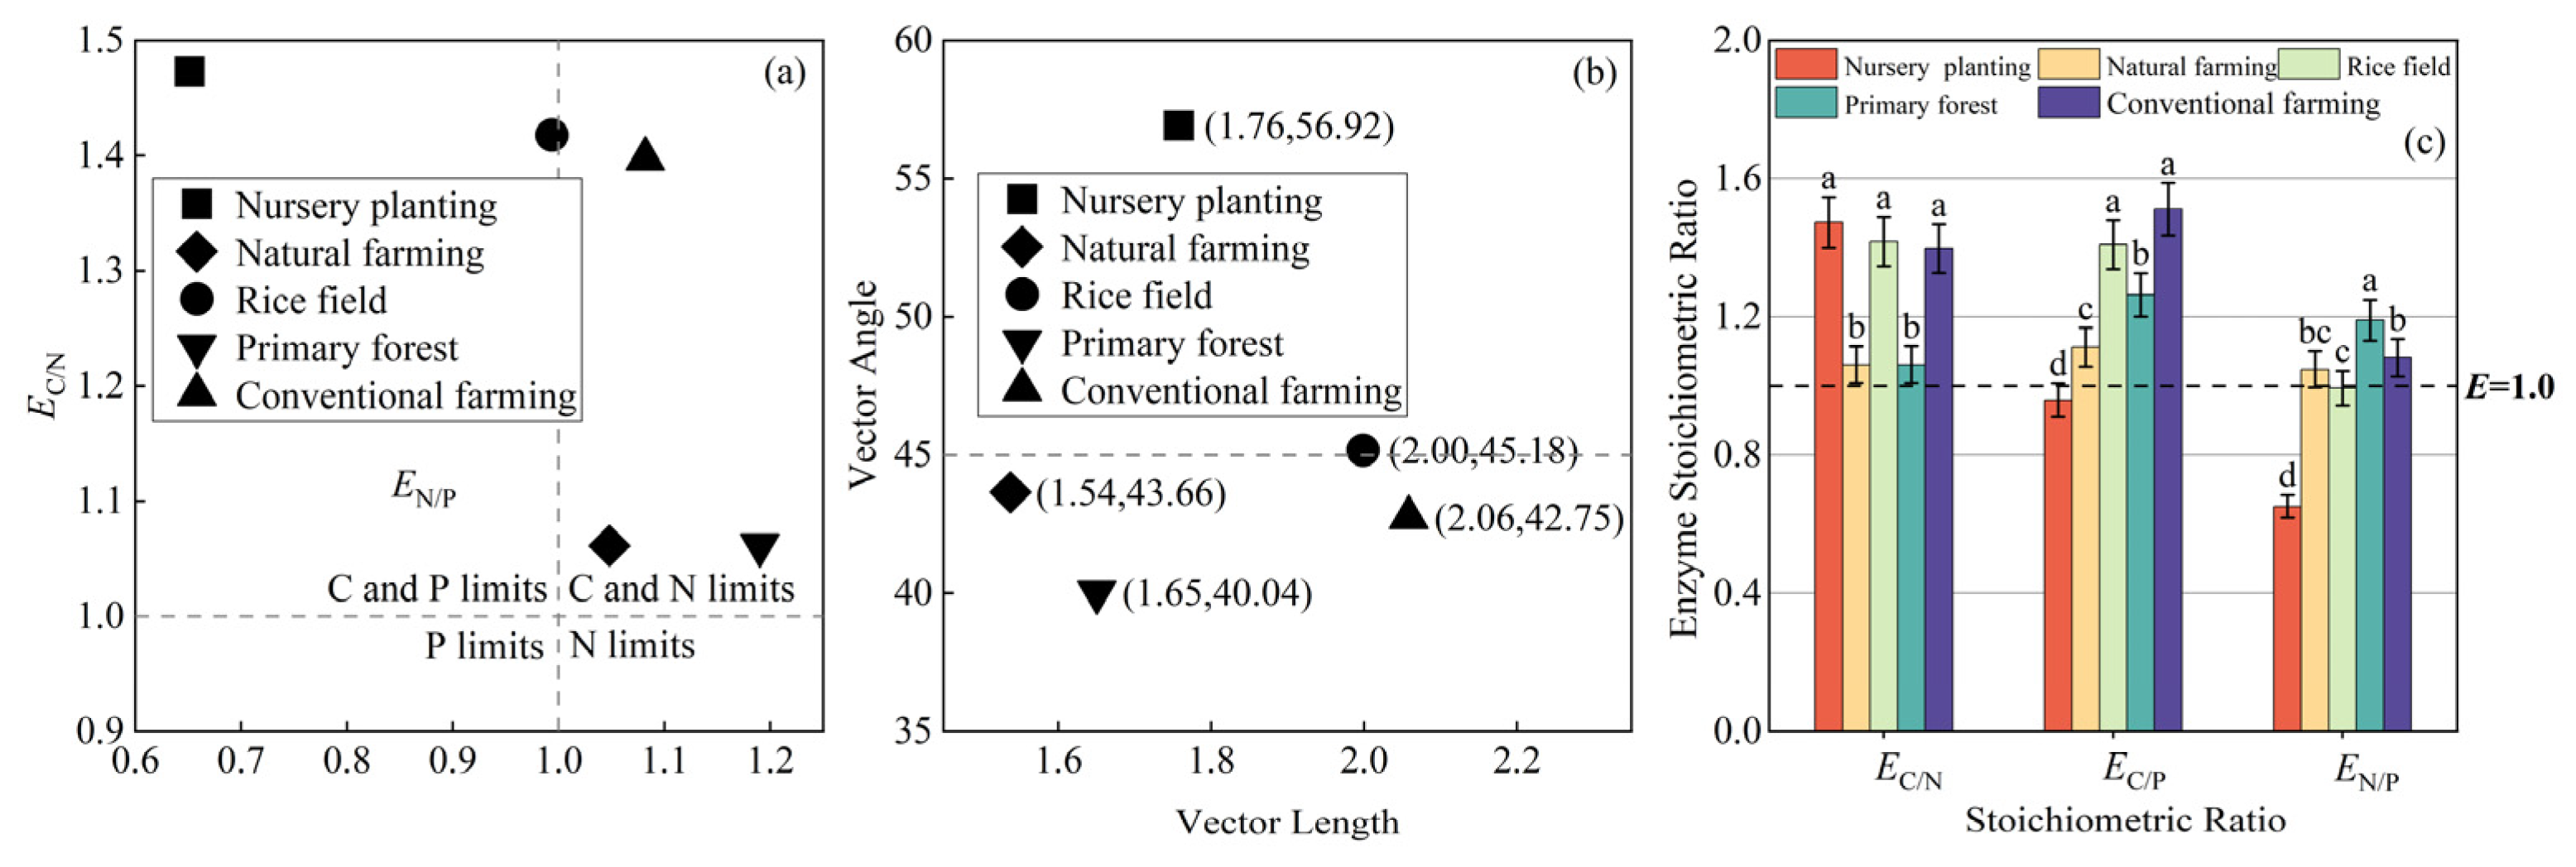
3.3.1. Soil Enzyme Activity

Soil enzymes primarily originate from microbial activity, root exudates, and the decomposition of plant and animal residues. They facilitate the decomposition of organic matter and nutrient mineralization, serving as key factors in determining SOC content and carbon pool stability [76]. According to the results of soil enzyme activity detection obtained from field experiment sampling, the differences in the effects of different agricultural management practices on soil enzyme activity are significant (Figure 9). Fields cultivated with conventional farming measures exhibited the lowest activity for various soil enzymes, while fields cultivated with natural farming measures showed the highest activity for four enzymes: CBH, LAP, BX, and NAG. This indicates that long-term implementation of natural farming practices has significantly enhanced the activities of soil enzymes in farmland, including carbon cycle enzymes (BG, CBH, BX, GAL), phosphorus cycle enzymes (AP), and nitrogen cycle enzymes (LAP, NAG, S). There is an enhanced trend in the decomposition of organic matter and the transformation of nitrogen and phosphorus in the soil, improving soil nutrient content and subsequently promoting the growth of plants and microorganisms.
Vector analysis was used to further explore the relationship between different land cover types and the unstable pools of soil carbon, nitrogen, and phosphorus. For nursery planting and paddy fields, EN/P < 1 and EC/N > 1 (Figure 10a) with a VA > 45° (Figure 10b) indicates that microbial growth and metabolism in these land use types are primarily co-limited by carbon and phosphorus. For natural farming fields, there are conventional farming fields, and primary forest, EN/P > 1 and EC/N > 1 (Figure 10a), with a VA < 45° (Figure 10b), suggesting a colimitation by carbon and nitrogen. Among the five land types, the soil enzyme stoichiometric ratios for natural farming fields are closest to 1 (as shown in Figure 10c, EC/N = 1.06, EN/P = 1.11, EC/P = 1.04). Compared to conventional farming fields, natural farming fields showed a significant 25.24% reduction in VL, with the degree of VA deviation improving from 42.75° to 43.66°. This indicates that targeted organic fertilization, soil improvement, and a series of natural farming measures can significantly alleviate the carbon limitation on soil microorganisms and somewhat reduce nitrogen limitation. This indicates that through a series of natural farming practices, such as targeted organic fertilization and soil improvement, the degree to which the growth and metabolism processes of soil microorganisms are restricted by carbon and nitrogen can be effectively alleviated, enriching the available carbon sources for microorganisms and thereby promoting the retention of soil SOC.

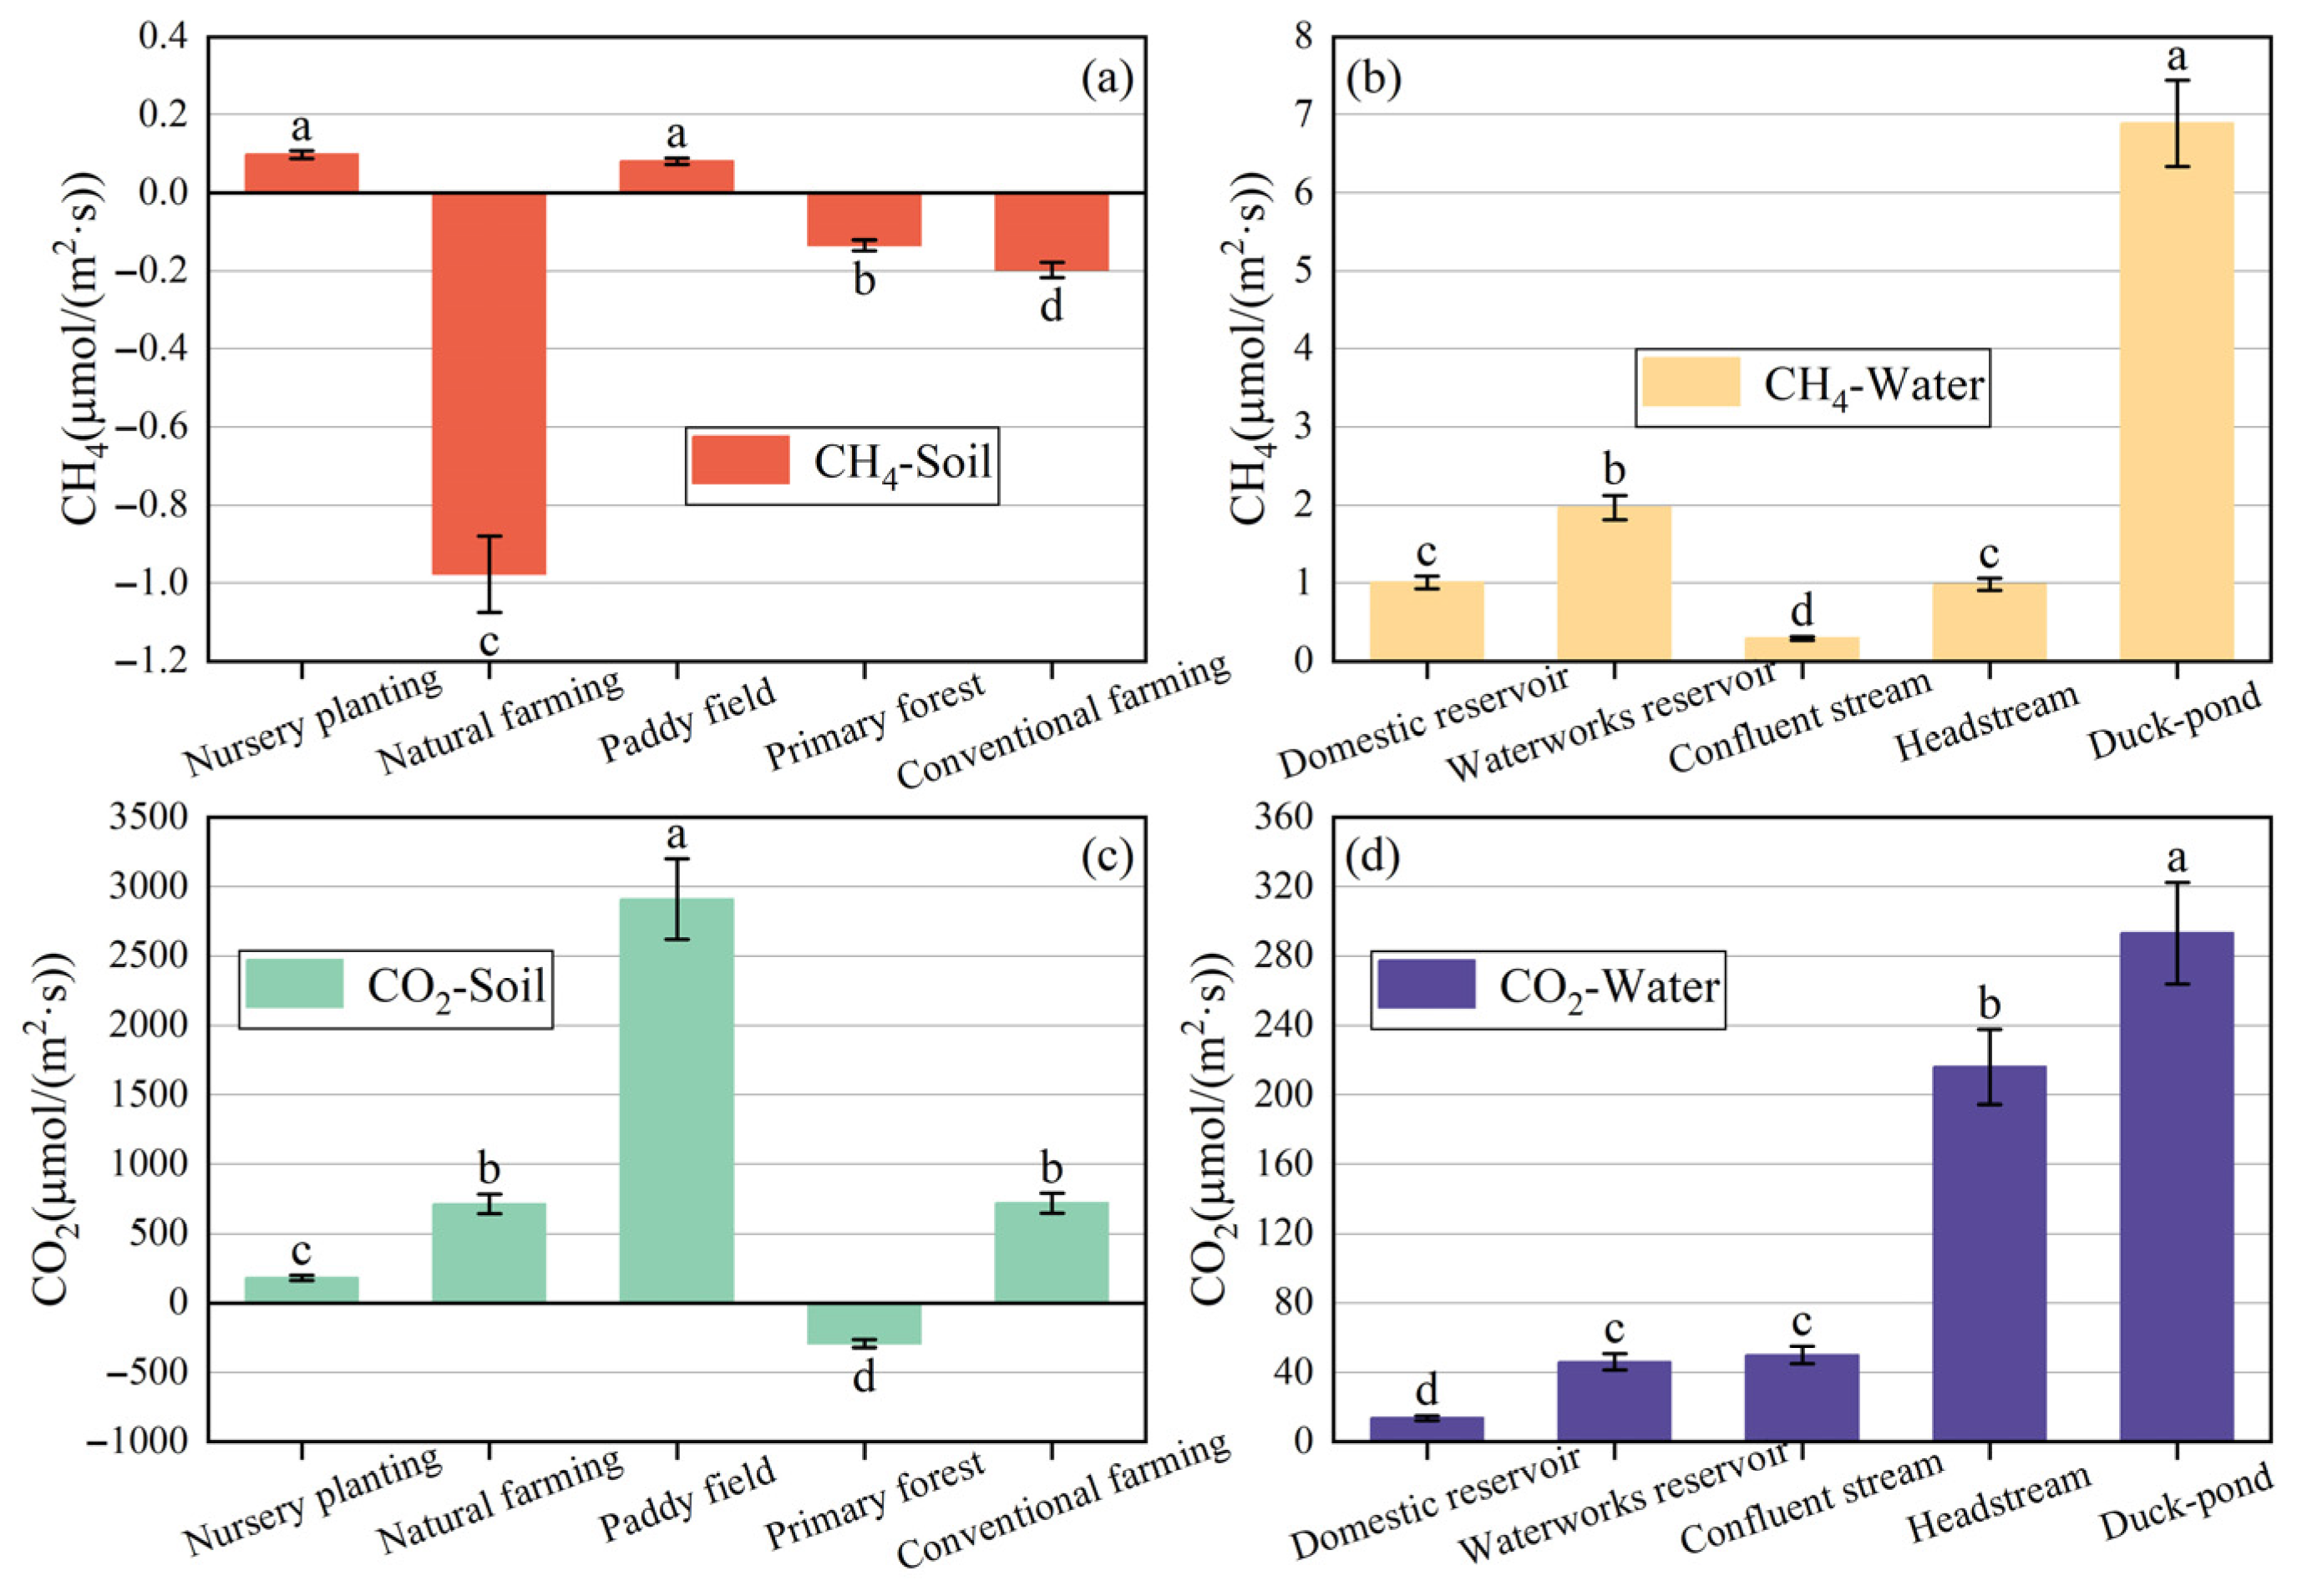
3.3.2. Greenhouse Gas Emission Flux

The order of CH4 flux from largest to smallest across different land types is nursery planting > paddy fields > 0 > primary forest > conventional farming fields > natural farming fields (Figure 11a). The absorption of CH4 in natural farming fields has increased by three times compared with that in conventional farming fields. Nurseries (0.09 μmol/m2·s) and paddy fields (0.08 μmol/m2·s) act as weak sources of CH4. The order of CO2 flux from largest to smallest is paddy fields > conventional farming fields > natural farming fields > nursery planting > 0 > primary forest (Figure 11c), with paddy fields having the highest emission flux (2910.84 μmol/m2·s), which is 4 to 16 times that of the other four soil types. The emission flux of natural farming fields (713.01 μmol/m2·s) is not significantly different from that of conventional farming fields (719.67 μmol/m2·s). The CH4 emissions (Figure 11a) and CO2 emissions (Figure 11c) of the primary forest are both negative, indicating carbon absorption. The different planting types in the field experiment plots generally act as carbon sources for CO2 and carbon sinks for CH4, with paddy fields acting as carbon sources for CH4, which aligns with the meta-statistical results of farmland soil in China (Table 2), and it also verifies the effect of green agricultural production practices on soil emission reduction and carbon sink increase. However, in terms of source-sink strength, different farmland soil types at the test site act as weak sources and strong sinks for CH4 (Figure 11a), indicating that natural farming implementation is, to some extent, conducive to the absorption of CH4 by farmland soil.
The average CH4 emission flux across different water body types, from largest to smallest, is duck pond > waterworks reservoir > domestic reservoir > headstream > confluence stream > 0 (Figure 11b). The CO2 emission flux, from largest to smallest, is duck pond > headstream > confluence stream > waterworks reservoir > domestic reservoir > 0 (Figure 11d). From the geographical location of the sampling points (Figure 1c), water bodies upstream of the village show higher gas emission fluxes, while downstream rivers and nearby residential ponds show lower emission levels. This indicates that the implementation of natural farming practices also contributes to emission reduction benefits in aquatic environments.

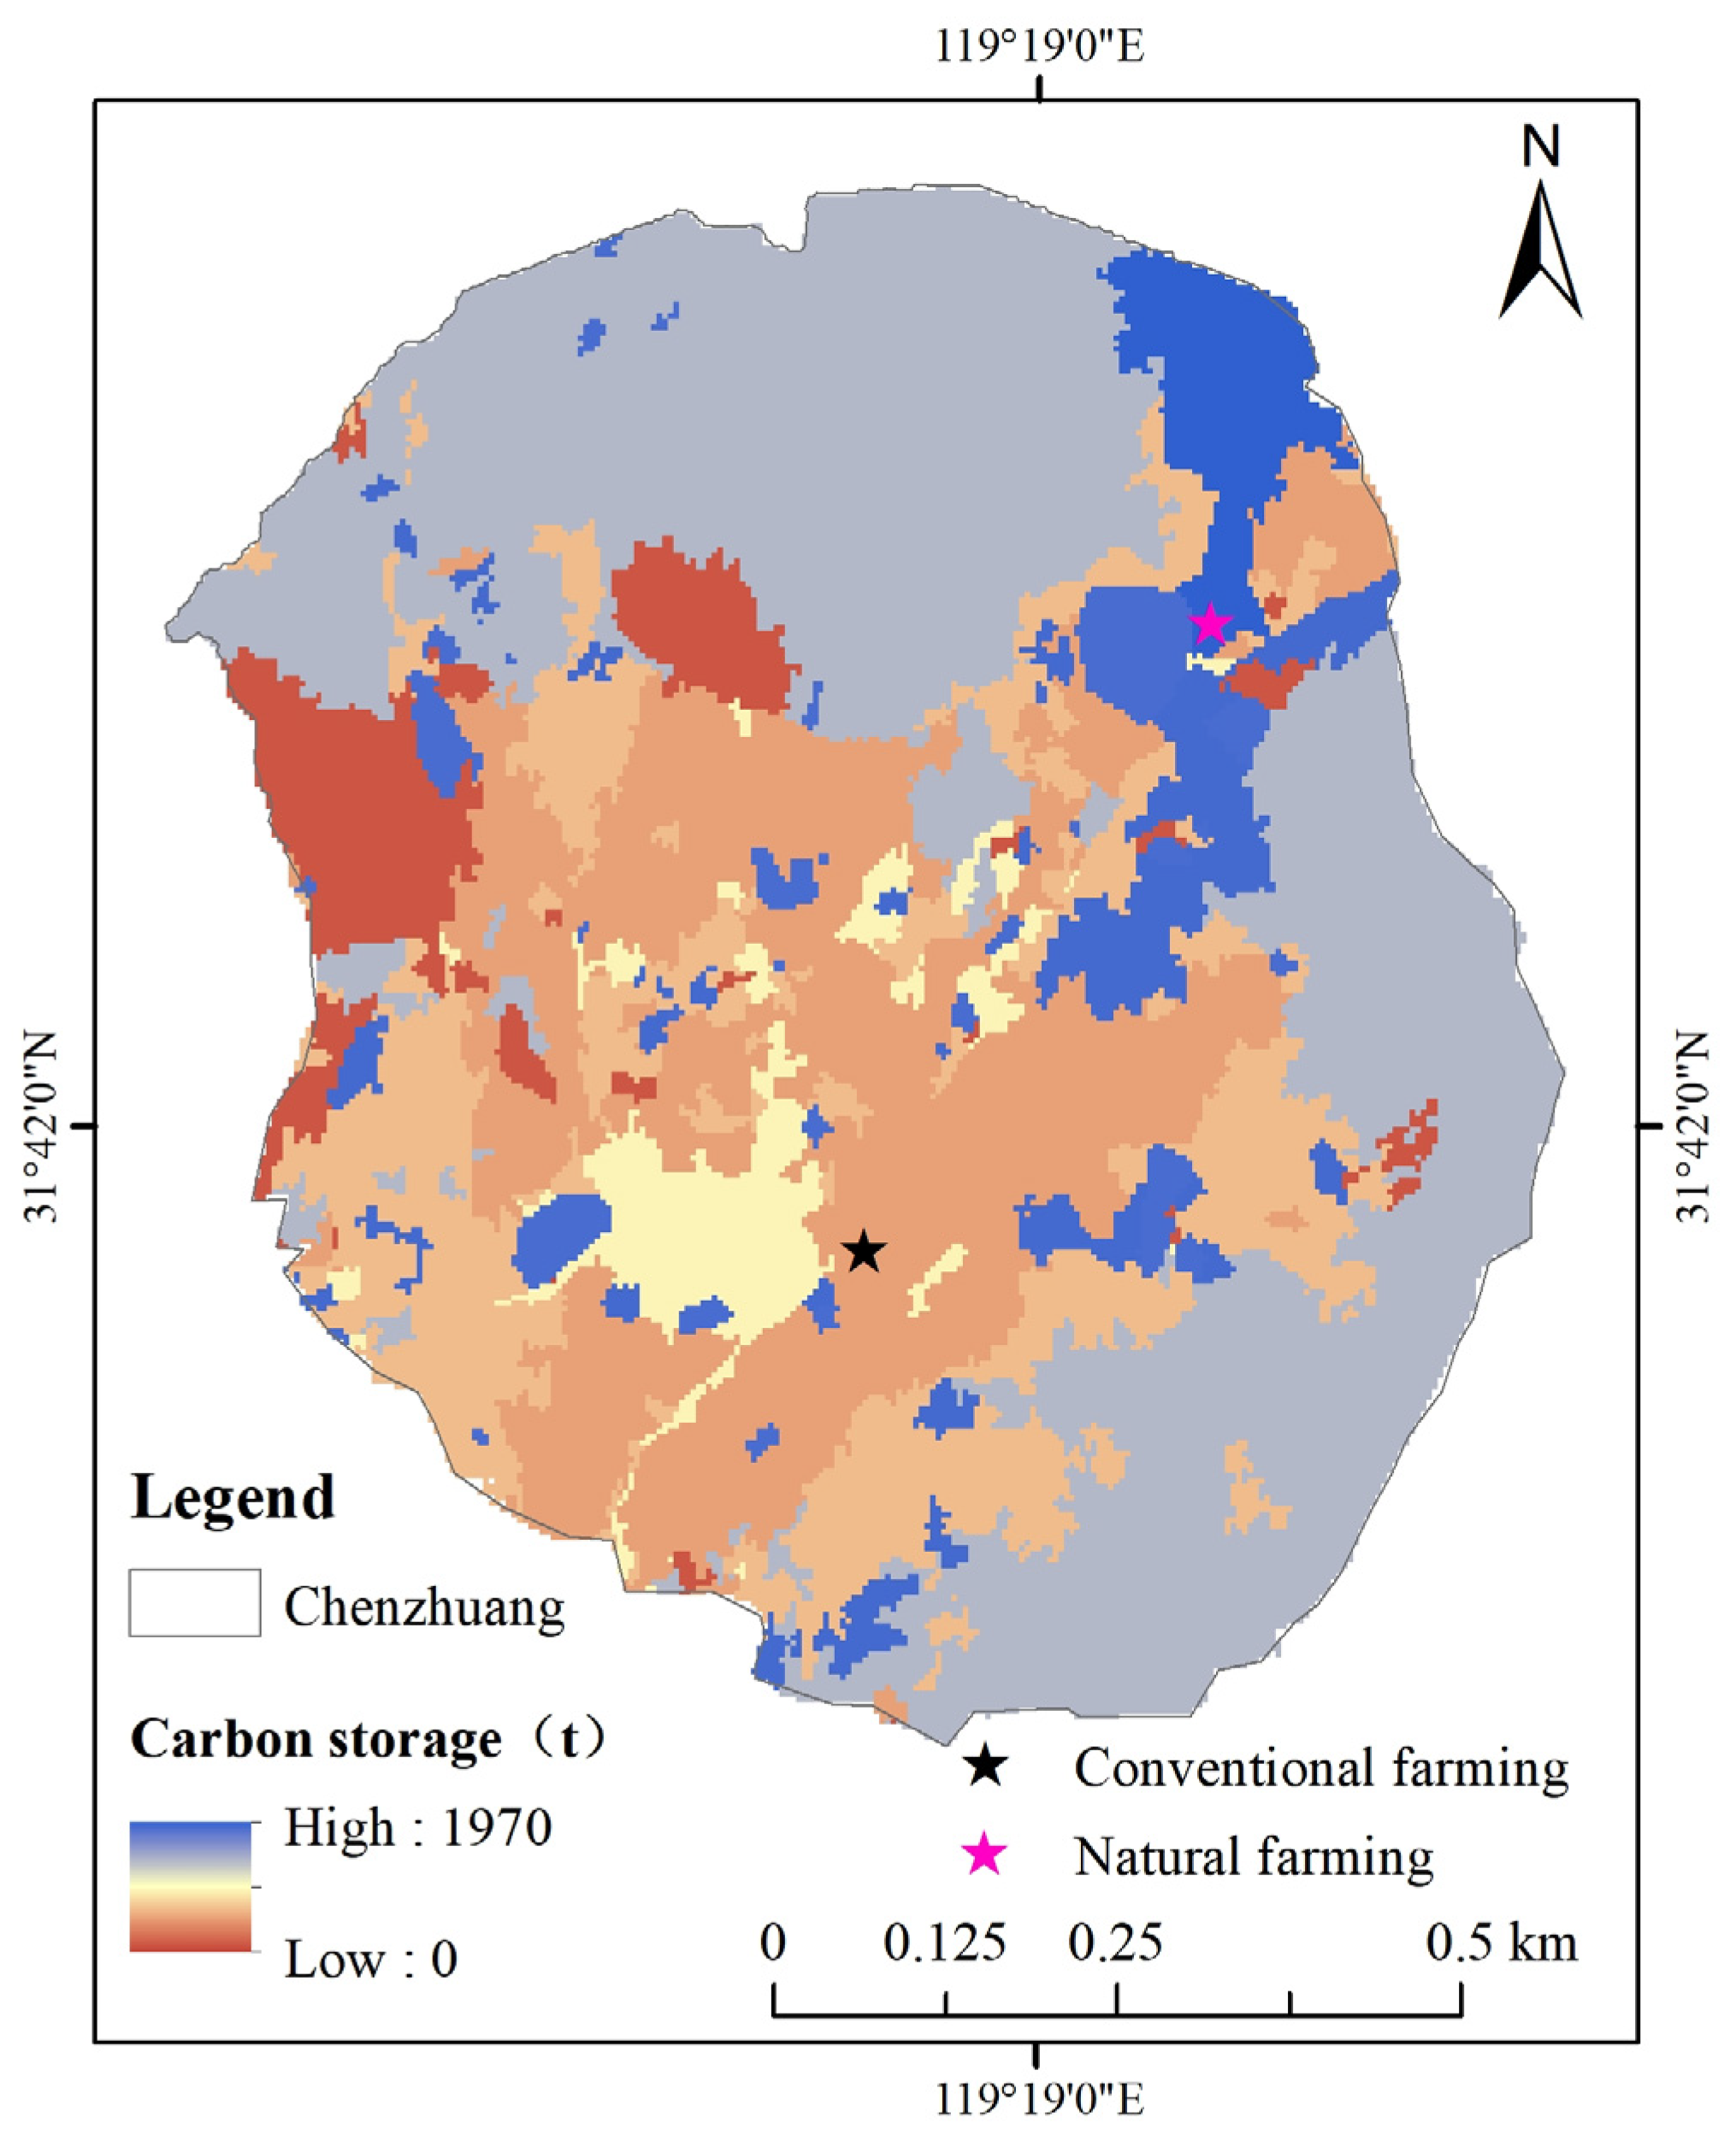
3.3.3. SOC Distribution Patterns

Comprehensively considering the results of the meta-analysis (Figure 2) and the existing research conclusions (Zhang et al., 2024) [77], the increase in SOC of the surface soil was significant. This study mainly analyzed the changes in SOC of the surface soil (0–20 cm) in Chenzhuang. Through calculation, it was found that in 2022, the average SOC density of the surface soil (0–20 cm) in Chenzhuang was 9.77 g/kg (Figure 12a). SOC density exhibited a spatial distribution characterized by “higher in the northwest, lower in the southeast”. In 2023, the average SOC density in Chenzhuang’s surface soil (0–20 cm) was 11.06 g/kg (Figure 12b). Compared to 2022, the peak area showed a shift from west to east, ultimately appearing in the natural farming planting area located in the northeast of Chenzhuang (according to the field measurement data in 2023, the SOC density of the natural farming experimental field reached 19.90 g/kg), with the highest growth rate also occurring nearby (Figure 12c, growth rate reached 60.44%). In comparison, the measured density of SOC in the conventional planting field in 2023 was 13.50 g/kg, once again demonstrating that natural farming methods have a significant promoting effect on the carbon sequestration capacity of farmland soil.
Further zonal statistics quantified the spatial distribution of SOC stock in Chenzhuang’s surface soil (0–20 cm) in 2023 (Figure 13). The natural farming planting area in the northeast of Chenzhuang and the nearby large forest area had the richest SOC stock, reaching 1970 tC. The following were the SOC stocks of crops and grasslands, at 1013 tC and 760 tC, respectively. The SOC stocks of unused land, tea plantations, and mining areas were comparable, at 267 tC, 230 tC, and 191 tC, respectively. The southwestern residential area and water bodies had the lowest SOC stocks, at only 175 tC and 144 tC.

4. Discussion

4.1. Positive Responses of SOC Increment, CH4 Absorption and CO2 Reduction to Green Agricultural Production Practices

SOC increment, CH4 uptake, and CO2 reduction are crucial indicators for evaluating the emission reduction and carbon sequestration effects of agricultural management practices.
On a large scale, our meta-analysis conducted in China indicates that compared to conventional farming practices, green agricultural production practices can increase SOC by 13.6–20.2%, significantly reduce CO2 emissions from paddy fields by 54.8%, and enhance CH4 uptake in dryland farming by 38.5%. Existing research has found that compared with traditional planting models such as single continuous cropping, the paddy-upland rotation and biological control measures under the green agricultural production mode reduce the disturbance to the sustainable productivity of the soil through the periodic management of moisture with alternating dry and wet conditions, increase microbial diversity, and thereby increase the soil health index by 20% [78]. Additionally, crop straw inputs a substantial amount of external carbon into farmland, which increases the C:N and C:P ratios [79,80], thus promoting the accumulation of SOC. This is also evident from meta-analyses on the impact of different agricultural management practices on carbon balance [28,33]. Mulching farmland accelerates microbial metabolism and SOC decomposition [81]. In contrast, the absence of plastic mulch and the use of organic fertilization, through more natural carbon inputs and slower microbial degradation rates, significantly increase microbial biomass and provide physical protection for SOC formed by decomposition, while reducing net carbon emissions from the agricultural system [82].
On a smaller scale, the field experiment conducted in Chenzhuang, Jurong City, also verified the effects of green agricultural production practices on soil emission reduction and carbon sequestration. Regarding SOC stock, the measured results of the field experiments in 2023 show (Section 3.3.3) that the SOC density in natural farming fields was 19.90 g/kg, compared to 13.50 g/kg in conventional farming fields. Relevant research indicates that, since the 1980s, under the extensive promotion of organic farming in the Suzhou-Taihu Lake region (including Jurong City), green farming measures have resulted in an average SOC increase of 3.5 g/kg in cultivated fields compared to conventional farming, with a predicted SOC density increase of 1.2–2.5 g/kg by 2030 [83]. This suggests that, compared to traditional green agricultural production practices, natural farming practices can more effectively alleviate the limitations of C, N, and P on soil microbial growth and metabolism by reducing the use of fertilizers and pesticides, thereby promoting biogeochemical cycles and soil organic carbon sequestration. The field measurement results of this study show that compared with 2022, the growth rate of SOC density in the natural farming area reached 60.44% in 2023. This is the combined effect of extreme climate events [84] and the adjustment of agricultural planting systems in Chenzhuang, Jurong City [85]. This highlights the sensitivity of SOC dynamics to short-term extreme climate events and long-term management reaching a certain threshold. In the future, longer time series and high-frequency monitoring will be needed to verify its stability. In terms of greenhouse gas emissions, the conclusions of the meta-analysis and similar studies [86] indicate that compared with the emissions of CH4, green farming fields act as weak sinks of CH4, while natural farming experimental fields show a strong sink of CH4 in field trials (Figure 11a), suggesting that natural farming practices help farmland soil absorb more CH4, turning them from carbon sources to carbon sinks. Recent applied research on natural farming shows that measures such as biological control can significantly reduce the carbon footprint in agricultural production [87,88].
In conclusion, the farmland environment is complex, and the response relationship between SOC increment, CH4 uptake, CO2 reduction, and agricultural management practices cannot be simply characterized by linear correlation analysis. Farmland soil carbon balance is influenced not only by temperature, moisture, and soil physical and chemical properties but also regulated by multiple factors such as microorganisms and vegetation cover. Future studies should comprehensively consider the feedback mechanisms of various factors to make integrated decisions.

4.2. Green Agricultural Production Promotes Soil Organic Carbon Sinks by Regulating the Structure and Metabolism of MICROORGANISMS

Based on microbial experiment analyses and previous research [69,71,72], we hypothesize that green agricultural production practices impact the formation and accumulation of SOC in two main ways: by regulating soil microbial community structure and by influencing microbial carbon metabolism functions, enriching microbial carbon sources, ensuring nutrient cycling, and ultimately promoting the accumulation of plant source carbon, leading to SOC sequestration.
Regarding microbial community structure, previous studies indicate that green agricultural production practices regulate farmland soil carbon sinks primarily by increasing fungal biomass ratios [66]; the fungal biomass carbon pool in the soil accounts for 86% of the total microbial carbon pool [89]. This study also found varying impacts of green agricultural production practices on the relative abundance of different microbial taxa. Compared to conventional farming, green farming measures increased the relative abundance of Acidobacteria and Planctomycetes in bacterial communities (Figure 4). Liang found that no-till straw mulching significantly increased the relative abundance of Basidiomycota in fungal communities [90], consistent with our findings (Figure 5). This may be because green farming practices increase soil macroaggregates, enhancing soil water content and aeration, leading to higher fungal and anaerobic bacterial abundance and more effective SOC accumulation [91]. Similar microbial response patterns were observed in the structural equation analysis of plant–microbe–soil carbon (Section 3.2.2).
Regarding microbial carbon metabolism functions, the meta-analysis of this study found that long-term natural nutrient fertilizer production and organic fertilization have significantly increased the content of soil available substrates, thus improving the metabolic activity and diversity of the nutrient-rich microbial community in the rhizosphere soil [92]. The results of enzyme activity detection in field experiments once again verified the microbial mechanism by which green agricultural production promotes organic carbon sinks in farmland soil. That is, green farming practices increase the activities of various carbon-cycling hydrolases (Section 3.3.1), aiding the decomposition and transformation of exogenous organic matter by diverse microbial species [93], thereby increasing soil carbon sinks.
Furthermore, field research conducted in Chenzhuang revealed that compared to traditional green agricultural production practices, natural farming practices further enhance soil carbon sequestration through measures such as plant nutrient extraction and reintegration, as well as indigenous microorganism cultivation. Farmers create homemade plant nutrient solutions from wild celery, bayberry, and other forest plants to promote flowering and yield in crops and fruits. These nutrient solutions increase the abundance of genes related to microbial CO2 fixation and organic acid metabolism in the soil [94], thereby boosting SOC content. Additionally, farmers collect fallen leaves and enrich microbial cultures with spores to produce crop fertilizers. The exogenous supplementation of microbial strains and their metabolic products can significantly enhance the dissolution and release of soil mineral phosphorus and potassium fertilizers [95], improving plant resistance [96], thereby enhancing soil fertility and carbon storage. Supported by various measures, natural farming has promoted the carbon cycling of plant–microbe–soil carbon pools, primarily linked by enzyme catalysis, under traditional green agricultural production (Figure 14).

4.3. Innovative Suggestions for Integrating Green Agricultural Production into Local Areas

With the intensification of global climate change, low-carbon agricultural production has become a focal point of attention. Currently, Chinese agriculture faces dual pressures of resource constraints and environmental stress [50]. This study, combining meta-analysis and field experiments, offers detailed innovative suggestions for the practical application of green agricultural production locally.
In rural Chenzhuang, ecological environment improvement was realized against the background of natural farming practice implementation. However, the carbon sequestration benefits of different land use types have not been fully utilized. Forests and grasslands provide economic products such as seedlings for agricultural development [97], but they still account for 42% and 15% of the carbon sequestration reserves of the entire village, respectively (Section 3.3.3), and their ecological potential remains underexplored. On the other hand, the primary forest of Chenzhuang showed a net carbon sink (Figure 11c, with negative CO2 emissions), which was mainly the combined result of the carbon dynamic balance of the ecosystem [98] and human intervention. The input of organic carbon in the original forest land (mainly manifested as litter in Chenzhuang) had exceeded the decomposition output, and the amount of carbon sequestration through photosynthesis was high (as shown in Figure 13). In recent years, Chenzhuang has reduced the damage to soil aggregate structure and avoided the loss of carbon pools through human interference (such as reducing deforestation, fire prevention and pest control, etc.) [99]. We suggest actively exploring the supply of high-quality timber products, developing forest-based recreation and wellness activities, implementing a reasonable grassland grazing system, and continuously leveraging the carbon sink function of forests and grasslands.
Secondly, cropping systems are the primary reason for differences in greenhouse gas emissions from local farmland soils. The CO2 flux in Chenzhuang’s paddy fields reaches 2910.84 μmol/m2·s (Figure 11). Studies show that compared to rice and dryland farming, paddy-upland rotation effectively regulates soil carbon and nitrogen cycles, improving the greenhouse gas balance of agricultural ecosystems by 88% and increasing equivalent yield by up to 38% [100]. Combined with the meta-analysis conclusions from this study, paddy-upland rotation can effectively enhance organic carbon sequestration by 19.1%. It is worth noting that the conclusion of this study is only applicable to similar paddy-upland rotation systems and does not include pure dryland rotation systems. We recommend reasonably planning differentiated cropping systems for green agricultural production locally as an agricultural management strategy to ensure ecological safety. In addition, Chenzhuang has a large area of bamboo and a large number of old forests [101]. The various organs of bamboo have an advantage in carbon content compared to broad-leaved tree species [102], which leads to carbon absorption in the primary forest land of Chenzhuang (Figure 11c). We suggest that the forestry industrial structure be continuously optimized in the future to achieve climate change mitigation.
This study finds that the rising temperatures and frequent extreme precipitation events will lead to more CO2 emissions in agricultural production, but they may also promote more CH4 uptake (Section 3.1.2). Addressing and balancing the carbon source and sink effects caused by climate change is a critical consideration for integrating green agriculture locally. Although China’s complex climate zones provide valuable and diverse results for this study, the climatic distribution characteristics of farmland soil carbon source/sink results need to be carefully extrapolated directly to other geographical regions with different soil types, farming histories, socio-economic backgrounds or specific crop systems. In future research, it is necessary to verify and expand these findings by integrating data from more countries and regions through data assimilation, and further formulate regionally differentiated agricultural management strategies and carbon neutrality paths to enhance climate resilience. For farmland soils under different temperature and altitude conditions, the carbon sink of the soil can generally be enhanced through full straw returning to the field and organic fertilization (Table S4). The differences in the relative importance of different crop types, cultivation measures and initial nutrients to soil carbon accumulation need to be further analyzed in the future by combining methods such as mixed models and hierarchical segmentation.
Our research indicates that the green agricultural production mode is an environmentally friendly agricultural management strategy that is beneficial for increasing carbon sinks and reducing emissions in farmland soil. Previous studies have shown that this is beneficial for improving the stability of crop yields [103,104,105], but at the same time, it will increase the cost of production materials and technology application [106]. The feasibility of integrating green agricultural production locally largely depends on the socioeconomic conditions of farmers. Therefore, our future research will focus on integrating these practices with local farmland use policies, such as balancing human agronomic measures with mechanical operations. Thus, the integration of green agricultural production practices locally should consider various factors, including regional economic policies, environmental factors, and field management, to make comprehensive decisions. In addition, due to the relatively limited time scale of this study, the long-term dynamic change characteristics of organic carbon in farmland soil were not fully captured. Therefore, to assess its evolution trend, it is necessary to establish and maintain long-term positioning monitoring, which should be the key direction of future research.

5. Conclusions

This study combined meta-analysis and field experiments to conduct a comprehensive analysis of the impact effect, mechanism of action and regional application of green agricultural production in agricultural management practice. The key findings include the following:
(1) Compared with soils managed under conventional farming, the green agricultural production practices are conducive to the accumulation of SOC. Agricultural management practices of no-till and straw returning to the field can significantly reduce CO2 emissions in alkaline soil by 30.7% (p < 0.05), and the emission reduction rate of farmland with long-term implementation of green agricultural production (for more than 5 years) can reach 41.3%.
(2) Plant species diversity participates in soil carbon storage and greenhouse gas emission processes by directly influencing organic matter indicators (TN, SOM, DOC), mineral properties (Ca, Silt, CEC), and soil physicochemical properties (pH, SWC), and indirectly affecting microbial biomass (T PLFA, B PLFA, F PLFA, MBC).
(3) Field measurement data in Chenzhuang show that the long-term implementation of natural farming practices has significantly increased the activities of soil enzymes in farmland. There are significant differences in CH4 and CO2 emission fluxes among different land use types (p < 0.05). For CH4, the order from highest to lowest is Nursery planting > Paddy fields > 0 > Primary forest > Conventional farming > Natural farming. For CO2, the order is Paddy fields > Conventional farming > Natural farming > Nursery planting > 0 > Primary forest.
(4) In Chenzhuang, the SOC density of surface soil (0–20 cm) was 9.77 g/kg in 2022 and 11.06 g/kg in 2023. The peak values and highest annual growth rates in 2023 were observed near the natural farming fields, where SOC density reached 19.90 g/kg and the annual growth rate hit 60.44%.

Supplementary Materials

The following supporting information can be downloaded at: https://www.mdpi.com/article/10.3390/agriculture15141499/s1, Table S1. Comparison and classification of field management practices between green agriculture and conventional farming; Table S2. Information on the layout of sampling points for field experiments; Table S3. Abbreviation of soil enzymes and the substrates used for their determination; Table S4. Optimal combinations of different agricultural measures within nine environmental groups; Figure S1. Sampling, processing and index determination procedures; Figure S2. Flowchart of the quality control process for sampling data processing and analysis; Figure S3. Radar chart of factor detection results of agricultural management measures; Glossary.

Author Contributions

Conceptualization, X.L. and Y.W.; Data curation, X.L., Y.W. and W.C.; Formal analysis, X.L., Y.W. and W.C.; Funding acquisition, Y.W. and B.H.; Investigation, X.L. and W.C.; Methodology, X.L. and Y.W.; Project administration, Y.W. and B.H.; Resources, Y.W. and W.C.; Software, X.L. and Y.W.; Supervision, Y.W. and W.C.; Validation, Y.W. and B.H.; Visualization, X.L., Y.W. and B.H.; Writing–original draft, X.L.; Writing—review and editing, X.L. and Y.W. All authors have read and agreed to the published version of the manuscript.

Funding

This research was funded by the National Natural Science Foundation of China (42177065), Scientific Research Foundation for Newly Recruited High-level Talents (432514203, Ningbo University), One Health Interdisciplinary Research Project (432505693, 432509653, Ningbo University), National Key Research and Development Program of China (2024YFC3013400; 2024YFC3013404).

Data Availability Statement

The data presented in this study are available on request from the corresponding author.

Conflicts of Interest

The authors declare no conflicts of interest.

References

  1. Slessarev, E.W.; Mayer, A.; Kelly, C.; Georgiou, K.; Pett-Ridge, J.; Nuccio, E.E. Initial soil organic carbon stocks govern changes in soil carbon: Reality or artifact? Glob. Change Biol. 2023, 29, 1239–1247. [Google Scholar] [CrossRef] [PubMed]
  2. Wu, Z.; Chen, Y.; Yang, Z.; Zhu, Y.; Han, Y. Mapping soil organic carbon in low-relief farmlands based on stratified heterogeneous relationship. Remote Sens. 2022, 14, 3575. [Google Scholar] [CrossRef]
  3. Liu, X.; Li, S.; Wang, S.; Bian, Z.; Zhou, W.; Wang, C. Effects of farmland landscape pattern on spatial distribution of soil organic carbon in Lower Liaohe Plain of northeastern China. Ecol. Indic. 2022, 145, 109652. [Google Scholar] [CrossRef]
  4. Fan, X.; Chen, X.; Chen, T.; Liu, X.; Song, Y.; Tan, S.; Chen, Y.; Yan, P.; Wang, X. Effects of substituting synthetic nitrogen with organic amendments on crop yield, net greenhouse gas emissions and carbon footprint: A global meta-analysis. Field Crops Res. 2023, 301, 109035. [Google Scholar] [CrossRef]
  5. Li, B.; Song, H.; Cao, W.; Wang, Y.; Chen, J.; Guo, J. Responses of soil organic carbon stock to animal manure application: A new global synthesis integrating the impacts of agricultural managements and environmental conditions. Glob. Change Biol. 2021, 27, 5356–5367. [Google Scholar] [CrossRef]
  6. Sinitambirivoutin, M.; Milne, E.; Schiettecatte, L.-S.; Tzamtzis, I.; Dionisio, D.; Henry, M.; Brierley, I.; Salvatore, M.; Bernoux, M. An updated IPCC major soil types map derived from the harmonized world soil database v2. 0. Catena 2024, 244, 108258. [Google Scholar] [CrossRef]
  7. Berhane, M.; Xu, M.; Liang, Z.; Shi, J.; Wei, G.; Tian, X. Effects of long-term straw return on soil organic carbon storage and sequestration rate in North China upland crops: A meta-analysis. Glob. Change Biol. 2020, 26, 2686–2701. [Google Scholar] [CrossRef] [PubMed]
  8. Gogoi, B.; Das, R.; Nath, D.J.; Dutta, S.; Borah, M.; Talukdar, L.; Patgiri, D.K.; Pathak, K.; Valente, D.; Petrosillo, I. Long-term management of rice agroecosystem towards climate change mitigation. Ecol. Indic. 2024, 160, 111876. [Google Scholar] [CrossRef]
  9. Ma, X.; Yuan, H. Ecological footprint and carrying capacity of agricultural water-land-energy nexus in China. Ecol. Indic. 2024, 168, 112786. [Google Scholar] [CrossRef]
  10. Chen, Y.; Du, Z.; Weng, Z.; Sun, K.; Zhang, Y.; Liu, Q.; Yang, Y.; Li, Y.; Wang, Z.; Luo, Y. Formation of soil organic carbon pool is regulated by the structure of dissolved organic matter and microbial carbon pump efficacy: A decadal study comparing different carbon management strategies. Glob. Change Biol. 2023, 29, 5445–5459. [Google Scholar] [CrossRef]
  11. Hao, X.; Ma, X.; Zhou, B.; Li, Y. Effect of different long-term fertilization practices on carbon sequestration in black soil. J. Soil Water Conserv. 2016, 5, 316–321. [Google Scholar]
  12. Jin, B.; Cui, C.; Wen, L.; Shi, R.; Zhao, M. Regional differences and convergence of agricultural carbon efficiency in China: Embodying carbon sink effect. Ecol. Indic. 2024, 169, 112929. [Google Scholar] [CrossRef]
  13. Yin, X.; Peñuelas, J.; Sardans, J.; Xu, X.; Chen, Y.; Fang, Y.; Wu, L.; Singh, B.P.; Tavakkoli, E.; Wang, W. Effects of nitrogen-enriched biochar on rice growth and yield, iron dynamics, and soil carbon storage and emissions: A tool to improve sustainable rice cultivation. Environ. Pollut. 2021, 287, 117565. [Google Scholar] [CrossRef]
  14. Li, H.; Lin, L.; Peng, Y.; Hao, Y.; Li, Z.; Li, J.; Yu, M.; Li, X.; Lu, Y.; Gu, W. Biochar’s dual role in greenhouse gas emissions: Nitrogen fertilization dependency and mitigation potential. Sci. Total Environ. 2024, 917, 170293. [Google Scholar] [CrossRef]
  15. Liu, J.; Fang, L.; Qiu, T.; Chen, J.; Wang, H.; Liu, M.; Yi, J.; Zhang, H.; Wang, C.; Sardans, J. Crop residue return achieves environmental mitigation and enhances grain yield: A global meta-analysis. Agron. Sustain. Dev. 2023, 43, 78. [Google Scholar] [CrossRef]
  16. Dong, L.; Zha, J.; Shen, M.; Wang, H.; Shi, L.; Tao, Y.; Zhou, X.; Lu, C. Effect of long-term straw returning on soil organic carbon fractions composition in rice-wheat rotation ecosystem. J. Agric. Sci. Technol. 2022, 24, 166–175. [Google Scholar]
  17. von Fromm, S.F.; Hoyt, A.M.; Sierra, C.A.; Georgiou, K.; Doetterl, S.; Trumbore, S.E. Controls and relationships of soil organic carbon abundance and persistence vary across pedo-climatic regions. Glob. Change Biol. 2024, 30, e17320. [Google Scholar] [CrossRef]
  18. Lessmann, M.; Ros, G.H.; Young, M.D.; de Vries, W. Global variation in soil carbon sequestration potential through improved cropland management. Glob. Change Biol. 2022, 28, 1162–1177. [Google Scholar] [CrossRef]
  19. Wang, S.; Tian, L.; Zhou, Y. Butterfly diversity and seasonal dynamics in Chenzhuang, Jurong City, Jiangsu Province. J. Jiangsu For. Sci. Technol. 2021, 48, 26–32. [Google Scholar]
  20. Li, G.; Tang, X.; Hou, Q.; Li, T.; Xie, H.; Lu, Z.; Zhang, T.; Liao, Y.; Wen, X. Response of soil organic carbon fractions to legume incorporation into cropping system and the factors affecting it: A global meta-analysis. Agric. Ecosyst. Environ. 2023, 342, 108231. [Google Scholar] [CrossRef]
  21. Zhu, X.; Jackson, R.D.; DeLucia, E.H.; Tiedje, J.M.; Liang, C. The soil microbial carbon pump: From conceptual insights to empirical assessments. Glob. Change Biol. 2020, 26, 6032–6039. [Google Scholar] [CrossRef] [PubMed]
  22. Cheng, G.; Zhu, M.; Zhang, X.; Guo, Y.; Yang, Y.; Yun, C.; Wu, Y.; Wang, Q.; Wang, W.; Wang, H. Northeastern China shelterbelt-farmland glomalin differences depend on geo-climates, soil depth, and microbial interaction: Carbon sequestration, nutrient retention and implication. Appl. Soil Ecol. 2023, 191, 105068. [Google Scholar] [CrossRef]
  23. Liu, M.; Liu, X.; Zhao, Y.; Dong, W.; Liu, E. Effects of film mulching on soil microbial carbon source metabolism in dry-farmland. Acta Ecol. Sin. 2022, 42, 9213–9225. [Google Scholar]
  24. Chen, L.; Sun, S.; Zhou, Y.; Zhang, B.; Peng, Y.; Zhuo, Y.; Ai, W.; Gao, C.; Wu, B.; Liu, D.; et al. Straw and straw biochar differently affect fractions of soil organic carbon and microorganisms in farmland soil under different water regimes. Environ. Technol. Innov. 2023, 32, 103412. [Google Scholar] [CrossRef]
  25. Li, Y.; Li, Z.; Cui, S.; Liang, G.; Zhang, Q. Microbial-derived carbon components are critical for enhancing soil organic carbon in no-tillage croplands: A global perspective. Soil Tillage Res. 2021, 205, 104758. [Google Scholar] [CrossRef]
  26. Tao, F.; Huang, Y.; Hungate, B.A.; Manzoni, S.; Frey, S.D.; Schmidt, M.W.; Reichstein, M.; Carvalhais, N.; Ciais, P.; Jiang, L. Microbial carbon use efficiency promotes global soil carbon storage. Nature 2023, 618, 981–985. [Google Scholar] [CrossRef]
  27. Ma, L.; Niu, W.; Li, G.; Du, Y.; Sun, J.; Siddique, K.H. Linking microbial carbon-degrading potential to organic carbon sequestration in fertilized soils: Insights from metagenomics. Land Degrad. Dev. 2023, 34, 6021–6035. [Google Scholar] [CrossRef]
  28. Ippolito, T.; Balkovič, J.; Skalsky, R.; Folberth, C.; Krisztin, T.; Neff, J. Predicting spatiotemporal soil organic carbon responses to management using EPIC-IIASA meta-models. J. Environ. Manag. 2023, 344, 118532. [Google Scholar] [CrossRef]
  29. Lin, B.; Cheng, J.; Duan, H.; Liu, W.; Dang, Y.P.; Zhao, X.; Zhang, H. Optimizing straw and nitrogen fertilizer resources for low-carbon sustainable agriculture. Resour. Conserv. Recycl. 2024, 209, 107743. [Google Scholar] [CrossRef]
  30. Ren, T.; Ukalska-Jaruga, A.; Smreczak, B.; Cai, A. Dissolved organic carbon in cropland soils: A global meta-analysis of management effects. Agric. Ecosyst. Environ. 2024, 371, 109080. [Google Scholar] [CrossRef]
  31. Sun, Q.; Gu, X.; Wang, Y.; Gao, H.; Wang, X.; Chen, X.; Sun, S. Impact of straw return on greenhouse gas emissions from maize fields in China: Meta-analysis. Front. Plant Sci. 2025, 16, 1493357. [Google Scholar] [CrossRef]
  32. Liu, X.; Tan, S.; Song, X.; Wu, X.; Zhao, G.; Li, S.; Liang, G. Response of soil organic carbon content to crop rotation and its controls: A global synthesis. Agric. Ecosyst. Environ. 2022, 335, 108017. [Google Scholar] [CrossRef]
  33. Bregaglio, S.; Mongiano, G.; Ferrara, R.M.; Ginaldi, F.; Lagomarsino, A.; Rana, G. Which are the most favourable conditions for reducing soil CO2 emissions with no-tillage? Results from a meta-analysis. Int. Soil Water Conserv. Res. 2022, 10, 497–506. [Google Scholar] [CrossRef]
  34. Li, N.; Zhao, Y.; Han, J.; Yang, Q.; Liang, J.; Liu, X.; Wang, Y.; Huang, Z. Impacts of future climate change on rice yield based on crop model simulation—A meta-analysis. Sci. Total Environ. 2024, 949, 175038. [Google Scholar] [CrossRef]
  35. Mao, L.; Zhang, H.; Yang, Z.; Li, Y.; Shen, Y. Site-specific effects of fertilizer on hay and grain yields of oats: Evidence from large-scale field experiments. J. Sci. Food Agric. 2025, 105, 2429–2439. [Google Scholar] [CrossRef] [PubMed]
  36. Bai, Y.; Cotrufo, M.F. Grassland soil carbon sequestration: Current understanding, challenges, and solutions. Science 2022, 377, 603–608. [Google Scholar] [CrossRef] [PubMed]
  37. Xiao, L.; Kuhn, N.J.; Zhao, R.; Cao, L. Net effects of conservation agriculture principles on sustainable land use: A synthesis. Glob. Change Biol. 2021, 27, 6321–6330. [Google Scholar] [CrossRef]
  38. Ding, W.; Gao, H.; Qi, Z.; Sun, L.; Zheng, C.; Huang, J.; Filipović, V.; He, H. Enhancing soil ecological stoichiometry and orchard yield through ground cover management: A meta-analysis across China. Agric. Ecosyst. Environ. 2025, 384, 109556. [Google Scholar] [CrossRef]
  39. Huang, M.; Gu, C.; Bai, Y. Effect of fertilization on methane and nitrous oxide emissions and global warming potential on agricultural land in China: A meta-analysis. Agriculture 2023, 14, 34. [Google Scholar] [CrossRef]
  40. Zhou, S.; Li, X.; Zhang, P.; Lu, G.; Zhang, X.; Zhang, H.; Zhang, F. Carbon Sequestration Capacity after Ecological Restoration of Open-Pit Mines: A Case Study in Yangtze River Basin, Jurong City, Jiangsu Province. Sustainability 2024, 16, 8149. [Google Scholar] [CrossRef]
  41. Jha, S.K.; Mishra, V.K.; Damodaran, T.; Singh, A.K.; Sharma, P.C.; Sharma, D.K.; Ojha, D.; Singh, Y.P. Conservation tillage and waste crop residue based zinc fortification in rice and wheat under reclaimed sodic soils: Progress toward nutrient circularity and sustainability. J. Agric. Food Chem. 2023, 71, 2853–2863. [Google Scholar] [CrossRef] [PubMed]
  42. Mastiholi, A.B.; Sowmya, B.; Maheswarappa, H.; Gondi, S.P.; Shantappa, T.; Rudresh, D.; Gopali, J. Organic and natural farming improve microbial diversity and dehydrogenase activity in clusterbean-tomato cropping sequence. Arch. Agron. Soil Sci. 2023, 69, 3705–3716. [Google Scholar] [CrossRef]
  43. Chen, W.; Chen, C.; Gao, J. Towards rural neo-endogenous development driven by knowledge. Acta Geogr. Sin. 2024, 80, 259–271. [Google Scholar]
  44. Gen, P.; Chen, W.; Yang, J.; Yang, L. Obstacles and paths for local implantation of rural ecological innovation technologies: A case of implementing natural agricultural technology in Chenzhuang Village. Resour. Sci. 2020, 42, 1298–1310. [Google Scholar]
  45. Tatsumi, C.; Lin, J.; Ishiguro, M.; Uchida, Y. Natural farming diversifies resource-utilisation patterns and increases network complexity in soil microbial community of paddy fields. Agric. Ecosyst. Environ. 2023, 356, 108618. [Google Scholar] [CrossRef]
  46. Wang, F.; Li, B.; Tian, S.; Zheng, D.; Ge, Q. Updated Scheme for Eco-Geographical Regionalization in China. Acta Geogr. Sin. 2024, 79, 3–16. [Google Scholar]
  47. Zhang, X.-Y.; Zhang, G.-B.; Yang, J.; Jing, M.A.; Hua, X.U.; Zu-Cong, C.A.I. Straw application altered CH4 emission, concentration and 13C-isotopic signature of dissolved CH4 in a rice field. Pedosphere 2012, 22, 13–21. [Google Scholar] [CrossRef]
  48. Payen, F.T.; Sykes, A.; Aitkenhead, M.; Alexander, P.; Moran, D.; MacLeod, M. Soil organic carbon sequestration rates in vineyard agroecosystems under different soil management practices: A meta-analysis. J. Clean. Prod. 2021, 290, 125736. [Google Scholar] [CrossRef]
  49. Lima, J.; Manning, T.; Rutherford, K.; Baima, E.; Dewhurst, R.; Walsh, P.; Roehe, R. Taxonomic annotation of 16S rRNA sequences of pig intestinal samples using MG-RAST and QIIME2 generated different microbiota compositions. J. Microbiol. Methods 2021, 186, 106235. [Google Scholar] [CrossRef]
  50. Zhang, Q.; Liu, Y.; Liu, Y.; Liu, H.; Zhang, Z.; Gao, Q.; Wang, Y.; Feng, Y.; Yang, G.; Ren, C. The contributions of soil biochemical characteristics and soil organic carbon (SOC) structure to SOC mineralization rate during forest succession on the Loess Plateau, China. Land Degrad. Dev. 2022, 33, 3375–3386. [Google Scholar] [CrossRef]
  51. Wang, C.; Li, W.; Shen, T.; Cheng, W.; Yan, Z.; Yu, L. Influence of soil bacteria and carbonic anhydrase on karstification intensity and regulatory factors in a typical karst area. Geoderma 2018, 313, 17–24. [Google Scholar] [CrossRef]
  52. van der Wal, A.; de Boer, W.; Smant, W.; van Veen, J. Initial decay of woody fragments in soil is influenced by size, vertical position, nitrogen availability and soil origin. Plant Soil 2007, 301, 189–201. [Google Scholar] [CrossRef]
  53. Chang, F.; He, S.; Dang, C. Assisted selection of biomarkers by linear discriminant analysis effect size (LEfSe) in microbiome data. J. Vis. Exp. 2022, 16, e61715. [Google Scholar]
  54. Angelini, M.E.; Heuvelink, G.; Kempen, B. Multivariate mapping of soil with structural equation modelling. Eur. J. Soil Sci. 2017, 68, 575–591. [Google Scholar] [CrossRef]
  55. Dar, A.A.; Parthasarathy, N. Ecological drivers of soil carbon in Kashmir Himalayan forests: Application of machine learning combined with structural equation modelling. J. Environ. Manag. 2023, 330, 117147. [Google Scholar] [CrossRef] [PubMed]
  56. Wang, C.; Li, T.; Guo, X.; Xia, L.; Lu, C.; Wang, C. Plus-InVEST Study of the Chengdu-Chongqing urban agglomeration’s land-use change and carbon storage. Land 2022, 11, 1617. [Google Scholar] [CrossRef]
  57. Gong, K.; Huang, Z.; Qu, M.; He, Z.; Chen, J.; Wang, Z.; Yu, Q.; Feng, H.; He, J. Influences of climate change on carbon and water fluxes of the ecosystem in the Qinling Mountains of China. Ecol. Indic. 2024, 166, 112504. [Google Scholar] [CrossRef]
  58. Saiya-Cork, K.; Sinsabaugh, R.; Zak, D. The effects of long term nitrogen deposition on extracellular enzyme activity in an Acer saccharum forest soil. Soil Biol. Biochem. 2002, 34, 1309–1315. [Google Scholar] [CrossRef]
  59. Qin, L.; Freeman, C.; Jia, X.; Zhang, Z.; Liu, B.; Zhang, S.; Jiang, M. Microbial enzyme activity and stoichiometry signal the effects of agricultural intervention on nutrient cycling in peatlands. Ecol. Indic. 2021, 122, 107242. [Google Scholar] [CrossRef]
  60. Borase, D.; Nath, C.; Hazra, K.; Senthilkumar, M.; Singh, S.; Praharaj, C.; Singh, U.; Kumar, N. Long-term impact of diversified crop rotations and nutrient management practices on soil microbial functions and soil enzymes activity. Ecol. Indic. 2020, 114, 106322. [Google Scholar] [CrossRef]
  61. Alam, S.A.; Starr, M.; Clark, B.J. Tree biomass and soil organic carbon densities across the Sudanese woodland savannah: A regional carbon sequestration study. J. Arid Environ. 2013, 89, 67–76. [Google Scholar] [CrossRef]
  62. Fu, Q.; Xu, L.; Zheng, H.; Chen, J. Spatiotemporal dynamics of carbon storage in response to urbanization: A case study in the Su-Xi-Chang region, China. Processes 2019, 7, 836. [Google Scholar] [CrossRef]
  63. Jones, P.G.; Thornton, P.K. Representative soil profiles for the Harmonized World Soil Database at different spatial resolutions for agricultural modelling applications. Agric. Syst. 2015, 139, 93–99. [Google Scholar] [CrossRef]
  64. Liang, Y.; Liu, L.; Huang, J. Integrating the SD-CLUE-S and InVEST models into assessment of oasis carbon storage in northwestern China. PLoS ONE 2017, 12, e0172494. [Google Scholar] [CrossRef]
  65. Wang, N.; Guo, Z.; Shang, D.; Li, K. Carbon trading price forecasting in digitalization social change era using an explainable machine learning approach: The case of China as emerging country evidence. Technol. Forecast. Soc. Change 2024, 200, 123178. [Google Scholar] [CrossRef]
  66. Min, K.; Lynch, L.; Zheng, T.; Chen, F.; Liang, C. Factors driving microbial biomass and necromass relationships display ecosystem-dependent responses. Eur. J. Soil Sci. 2024, 75, e13555. [Google Scholar] [CrossRef]
  67. Hu, Y.; Li, Y.; Wang, L.; Tang, Y.; Chen, J.; Fu, X.; Le, Y.; Wu, J. Variability of soil organic carbon reservation capability between coastal salt marsh and riverside freshwater wetland in Chongming Dongtan and its microbial mechanism. J. Environ. Sci. 2012, 24, 1053–1063. [Google Scholar] [CrossRef]
  68. Qin, J.; Liu, H.; Zhao, J.; Wang, H.; Zhang, H.; Yang, D.; Zhang, N. The roles of bacteria in soil organic carbon accumulation under nitrogen deposition in stipa baicalensis steppe. Microorganisms 2020, 8, 326. [Google Scholar] [CrossRef] [PubMed]
  69. Zhang, H.; Liu, T.; Wang, Y.; Tang, M. Exogenous arbuscular mycorrhizal fungi increase soil organic carbon and change microbial community in poplar rhizosphere. Plant Soil Environ. 2019, 65, 152. [Google Scholar] [CrossRef]
  70. Liu, T.; Chen, Z.; Rong, L.; Duan, X. Land-use driven changes in soil microbial community composition and soil fertility in the dry-Hot Valley region of southwestern China. Microorganisms 2022, 10, 956. [Google Scholar] [CrossRef]
  71. Hu, Y.; Cong, M.; Chen, M.; Abulaizi, M.; Yu, G.; Yang, Z.; Zhu, X.; Jia, H. Soil bacteria mediate organic carbon stability during alpine wetland biogeomorphic succession in the arid region of Central Asia. Plant Soil 2024, 497, 429–447. [Google Scholar] [CrossRef]
  72. Sun, Y.; Liu, Z.; Zhang, Y.; Lai, Z.; She, W.; Bai, Y.; Feng, W.; Qin, S. Microbial communities and their genetic repertoire mediate the decomposition of soil organic carbon pools in revegetation shrublands in a desert in northern China. Eur. J. Soil Sci. 2020, 71, 93–105. [Google Scholar] [CrossRef]
  73. Miao, Y.; Wang, W.; Xu, H.; Xia, Y.; Gong, Q.; Xu, Z.; Zhang, N.; Xun, W.; Shen, Q.; Zhang, R. A novel decomposer-exploiter interaction framework of plant residue microbial decomposition. Genome Biol. 2025, 26, 20. [Google Scholar] [CrossRef] [PubMed]
  74. Yu, F.-M.; Jayawardena, R.S.; Luangharn, T.; Zeng, X.-Y.; Li, C.-J.-Y.; Bao, S.-X.; Ba, H.; Zhou, D.-Q.; Tang, S.-M.; Hyde, K.D. Species diversity of fungal pathogens on cultivated mushrooms: A case study on morels (Morchella, Pezizales). Fungal Divers. 2024, 125, 157–220. [Google Scholar] [CrossRef]
  75. Yang, Y.; Dou, Y.; Wang, B.; Wang, Y.; Liang, C.; An, S.; Soromotin, A.; Kuzyakov, Y. Increasing contribution of microbial residues to soil organic carbon in grassland restoration chronosequence. Soil Biol. Biochem. 2022, 170, 108688. [Google Scholar] [CrossRef]
  76. Bharti, P.; Das, A.; Kumar, S.; Rakshit, R. Assessment of Soil Specific Enzyme Activities in Aggregates Size Fractions: A Case Study from Subtropical Agro-ecosystem. Eurasian Soil Sci. 2024, 57, 646–656. [Google Scholar] [CrossRef]
  77. Zhang, Y.; Wang, P.; Liu, Y.; Wang, J. Effects of long-term crop cultivation on soil organic carbon in China’s farmland: A meta-analysis. Acta Pedol. Sin. 2024, 61, 1628–1638. [Google Scholar]
  78. Zhang, S.; Ren, T.; Fang, Y.; Zhao, J.; Zhu, J.; Cong, W.-f.; Lambers, H.; Lu, J. Enhancing soil labile organic matter through oilseed rape-rice rotation and straw returning in paddy-upland systems. Plant Soil 2025, 1–18. [Google Scholar] [CrossRef]
  79. Feng, S.; Tan, S.; Zhang, A.; Zhang, Q.; Pan, G.; Qu, F.; Smith, P.; Li, L.; Zhang, X. Effect of household land management on cropland topsoil organic carbon storage at plot scale in a red earth soil area of South China. J. Agric. Sci. 2011, 149, 557–566. [Google Scholar] [CrossRef] [PubMed]
  80. Liu, C.; Li, J.; Sun, W.; Gao, Y.; Yu, Z.; Dong, Y.; Li, P. Temporal and Spatial Variations in Soil Elemental Stoichiometry Coupled with Alterations in Agricultural Land Use Types in the Taihu Lake Basin. Agriculture 2023, 13, 484. [Google Scholar] [CrossRef]
  81. Shen, Q.; Niu, J.; Liu, Q.; Liao, D.; Du, T. A resilience-based approach for water resources management over a typical agricultural region in Northwest China under water-energy-food nexus. Ecol. Indic. 2022, 144, 109562. [Google Scholar] [CrossRef]
  82. Lockwell, J.; Guidi, W.; Labrecque, M. Soil carbon sequestration potential of willows in short-rotation coppice established on abandoned farm lands. Plant Soil 2012, 360, 299–318. [Google Scholar] [CrossRef]
  83. Shen, Y.; Huang, Y.; Zong, L.; Zhang, W.; Xu, M.; Liu, L. Simulation and prediction of soil organic carbon dynamics in Jiangsu Province based on model and GIS techniques. Sci. Agric. Sin. 2003, 36, 1312–1317. [Google Scholar]
  84. Chen, Y.; Shen, J.; Liu, L.; Sun, Y.; Pan, Y.; Lin, W. Preservation of organic matter in aqueous deposits and soils across the Mars-analog qaidam basin, NW China: Implications for biosignature detection on Mars. J. Geophys. Res. Planets 2022, 127, e2022JE007418. [Google Scholar] [CrossRef]
  85. Ma, M.; Qu, Y.; Lyu, J.; Zhang, X.; Su, Z.; Gao, H.; Yang, X.; Chen, X.; Jiang, T.; Zhang, J. The 2022 extreme drought in the Yangtze River Basin: Characteristics, causes and response strategies. River 2022, 1, 162–171. [Google Scholar] [CrossRef]
  86. Gao, M.; Xu, H.; Ma, M.; Gao, G.; Chen, X.; Chen, J.; Liu, X.; Qi, L. Global intercountry croplands’ greenhouse gas emissions differences and their potential drivers from economic levels perspective. Ecol. Indic. 2024, 167, 112635. [Google Scholar] [CrossRef]
  87. Beni, C.; Neri, U.; Papetti, P.; Altimari, A. Natural horticultural systems in organic farming as a tool for resilience: Improvement of economic performance and prevention of soil erosion. Agroecol. Sustain. Food Syst. 2021, 45, 1375–1398. [Google Scholar] [CrossRef]
  88. Tian, J.; Dungait, J.A.; Hou, R.; Deng, Y.; Hartley, I.P.; Yang, Y.; Kuzyakov, Y.; Zhang, F.; Cotrufo, M.F.; Zhou, J. Microbially mediated mechanisms underlie soil carbon accrual by conservation agriculture under decade-long warming. Nat. Commun. 2024, 15, 377. [Google Scholar] [CrossRef]
  89. Wang, X.; Yu, G.; Kuzyakov, Y.; Yin, B.; Kappler, A.; Liu, C. Contribution of fungal biomass to persistent soil carbon across natural ecosystems. Sci. China Earth Sci. 2025, 68, 444–456. [Google Scholar] [CrossRef]
  90. Liang, Y.; Wei, L.; Wang, S.; Hu, C.; Xiao, M.; Zhu, Z.; Deng, Y.; Wu, X.; Kuzyakov, Y.; Chen, J. Long-term fertilization suppresses rice pathogens by microbial volatile compounds. J. Environ. Manag. 2023, 336, 117722. [Google Scholar] [CrossRef]
  91. Qian, Y.; Sun, J.; Hillier, J.; Sheng, J.; Guo, Z.; Zhu, P.; Cheng, K.; Pan, G.; Li, Y.; Wang, X. Green manure rotation and application increase rice yield and soil carbon in the Yangtze River valley of China. Pedosphere 2023, 33, 589–599. [Google Scholar]
  92. Tripathy, S.; Biswas, S.; Singh, P.; Ghose, T.; Purakayastha, T.; Ahmed, N.; Pandey, R.; Das, T.; Ramakrishnan, B. Soil quality, resilience, and crop productivity under 32-year-old long-term rice-rice system in acidic alfisol of Assam. J. Soil Sci. Plant Nutr. 2023, 23, 5333–5344. [Google Scholar] [CrossRef]
  93. Zhang, J.; Zheng, C.; Zhang, L.; Zhang, C.; Lv, Y.; Nie, L.; Zhang, X.; Li, B.; Cao, W.; Li, M. Effects of Chinese milk vetch returning on soil properties, microbial community, and rice yield in paddy soil. Sustainability 2022, 14, 16065. [Google Scholar] [CrossRef]
  94. Meier, E.A.; Thorburn, P.J.; Kragt, M.E.; Dumbrell, N.P.; Biggs, J.S.; Hoyle, F.C.; van Rees, H. Greenhouse gas abatement on southern Australian grains farms: Biophysical potential and financial impacts. Agric. Syst. 2017, 155, 147–157. [Google Scholar] [CrossRef]
  95. Sharma, R.; Sindhu, S.S.; Glick, B.R. Potassium solubilizing microorganisms as potential biofertilizer: A sustainable climate-resilient approach to improve soil fertility and crop production in agriculture. J. Plant Growth Regul. 2024, 43, 2503–2535. [Google Scholar] [CrossRef]
  96. Li, C.; Jia, Z.; Tang, Y.; Zhang, S.; Li, T.; Ma, S.; Nie, H.; Zhai, L.; Zhang, B.; Liu, X. Mineral-solubilizing microbial inoculants facilitate the rejuvenation of soil multifunctionality and plant growth at abandoned mine sites. Land Degrad. Dev. 2024, 35, 442–454. [Google Scholar] [CrossRef]
  97. Dong, S.; Xu, Y.; Li, S.; Shen, H.; Yang, M.; Xiao, J. Restoration actions associated with payment for ecosystem services promote the economic returns of alpine grasslands in China. J. Clean. Prod. 2024, 458, 142439. [Google Scholar] [CrossRef]
  98. Feng, X.; Wang, S. Plant influences on soil microbial carbon pump efficiency. Glob. Change Biol. 2023, 29, 3854–3856. [Google Scholar] [CrossRef]
  99. Tang, X.; Liu, S.; Zhou, G.; Zhang, D.; Zhou, C. Soil-atmospheric exchange of CO2, CH4, and N2O in three subtropical forest ecosystems in southern China. Glob. Change Biol. 2006, 12, 546–560. [Google Scholar] [CrossRef]
  100. Yang, X.; Xiong, J.; Du, T.; Ju, X.; Gan, Y.; Li, S.; Xia, L.; Shen, Y.; Pacenka, S.; Steenhuis, T.S.; et al. Diversifying crop rotation increases food production, reduces net greenhouse gas emissions and improves soil health. Nat. Commun. 2024, 15, 198. [Google Scholar] [CrossRef]
  101. Zhou, X.; Guan, F.; Zhang, X.; Li, C.; Zhou, Y. Response of moso bamboo growth and soil nutrient content to strip cutting. Forests 2022, 13, 1293. [Google Scholar] [CrossRef]
  102. Li, P.; Zhou, G.; Du, H.; Lu, D.; Mo, L.; Xu, X.; Shi, Y.; Zhou, Y. Current and potential carbon stocks in Moso bamboo forests in China. J. Environ. Manag. 2015, 156, 89–96. [Google Scholar] [CrossRef] [PubMed]
  103. Lal, R. Soil organic matter and water retention. Agron. J. 2020, 112, 3265–3277. [Google Scholar] [CrossRef]
  104. Luo, G.; Li, L.; Friman, V.-P.; Guo, J.; Guo, S.; Shen, Q.; Ling, N. Organic amendments increase crop yields by improving microbe-mediated soil functioning of agroecosystems: A meta-analysis. Soil Biol. Biochem. 2018, 124, 105–115. [Google Scholar] [CrossRef]
  105. Reganold, J.P.; Wachter, J.M. Organic agriculture in the twenty-first century. Nat. Plants 2016, 2, 1–8. [Google Scholar] [CrossRef]
  106. Seufert, V.; Ramankutty, N.; Foley, J.A. Comparing the yields of organic and conventional agriculture. Nature 2012, 485, 229–232. [Google Scholar] [CrossRef]
Figure 1. Overview showing the study area and schematic diagram of the experimental design for the (a) Spatial distribution of the sites for meta-analysis and (b) Geographical location of the research area and (c) Field experiment research area and (d) Land use types selected in the field trials (including natural farming fields (NF), conventional farming fields (CF), primary forest land (PF), and nursery planting land (NP)).
Agriculture 15 01499 g001
Figure 2. Rate of change in SOC content under different conditions (climate, soil properties, agronomic measures). ITN, IAN, IOP, and IOK represent initial TN, initial alkali-N, initial olsen-P, and initial olsen-K, respectively.
Agriculture 15 01499 g002
Figure 3. Effects of different agronomic measures on CH4 emissions from paddy fields and CH4 absorption in dry farming.
Agriculture 15 01499 g003
Figure 4. CO2 emission effects of farmland soils under different agricultural management practices (subgroup analysis).
Agriculture 15 01499 g004
Figure 5. Relative abundance of microbial community composition under different agricultural management practices. The chart displays the top 10 microbial communities in terms of relative abundance. CP represents conventional farming practices characterized by plowing without straw return, while GP represents green farming practices characterized by no-till with straw return.
Agriculture 15 01499 g005
Figure 6. Linear discriminant analysis histogram of different farming practices (LDA > 3.5).
Agriculture 15 01499 g006
Figure 7. Structural equation model of plant–microbe–soil carbon. TN: total nitrogen; SOM: Soil Organic Matter; DOC: Dissolved Organic Nitrogen; SWC: soil water content; Ca: exchangeable calcium; Silt: soil silt; CEC: cation exchange capacity; CUE: carbon use efficiency; T, B, and F PLFA: total, bacterial, and fungal phospholipid fatty acids; MBC: microbial biomass carbon; MNC: microbial necromass carbon. Red arrows indicate significantly positive correlation pathways (p < 0.05), green arrows indicate significantly negative correlation pathways (p < 0.05), short black arrow indicates that this indicator is showing an increasing trend, and grey dashed lines indicate non-significant pathways. The values next to the arrows represent significant standardized coefficients, and the arrow width indicates the strength of the relationship. R2 represents the proportion of variance explained by the model. * indicates p < 0.05; ** indicates p < 0.01; *** indicates p < 0.001.
Agriculture 15 01499 g007
Figure 8. Structure equation models of plant–microbe–soil carbon of different microbial species. SOM: soil organic matter; SWC: soil water content; Ca: exchangeable calcium; CEC: cation exchange capacity; CUE: carbon use efficiency; B PLFA and F PLFA: bacterial and fungal phospholipid fatty acids; MBC: microbial biomass carbon; BNC and FNC: bacterial necromass carbon and fungal necromass carbon. Red arrows indicate significantly positive correlation pathways (p < 0.05), green arrows indicate significantly negative correlation pathways (p < 0.05), short black arrow indicates that this indicator is showing an increasing trend, and grey dashed lines indicate non-significant pathways. The values next to the arrows represent significant standardized coefficients, and the arrow width indicates the strength of the relationship. R2 represents the proportion of variance explained by the model. * indicates p < 0.05; ** indicates p < 0.01; *** indicates p < 0.001.
Agriculture 15 01499 g008
Figure 9. Differences in soil enzyme activity across various land cover types: (a) BG; (b) CBH; (c) AP; (d) LAP; (e) BX; (f) NAG; (g) GAL; (h) S. Different lowercase letters above the bars indicate statistically significant differences between treatments at the p < 0.05 level.
Agriculture 15 01499 g009
Figure 10. Impact of different land cover conditions on soil enzyme stoichiometry and enzyme vectors: (a) The activity measurement ratio of C, N and P cycle enzymes; (b) Vector situation; (c) Enzyme Stoichiometric Ratio. Different lowercase letters above the bars indicate statistically significant differences between treatments at the p < 0.05 level.
Agriculture 15 01499 g010
Figure 11. Greenhouse gas flux across different land use types in Chenzhuang: (a) CH4 gas fluxes of five types of soil samples; (b) CH4 gas fluxes of five water body samples; (c) CO2 gas fluxes of five types of soil samples; (d) CO2 gas fluxes of five water body samples. Different lowercase letters above the bars indicate statistically significant differences between treatments at the p < 0.05 level.
Agriculture 15 01499 g011
Figure 12. Spatial distribution map of SOC density in Chenzhuang.
Agriculture 15 01499 g012
Figure 13. Spatial distribution of carbon storage in Chenzhuang, 2023.
Agriculture 15 01499 g013
Figure 14. Carbon cycle formed by the catalytic linkage of the plant–microbe–soil carbon pools through enzymes. PDC: plant-derived carbon pool; MDC: microbial-derived carbon pool; ENC: enzyme network for carbon; CUEP: CUE of plants; CUEM: CUE of microorganisms; + indicates that the index shows an increasing trend under the influence of agricultural measures; − indicates that the index shows a decreasing trend under the influence of agricultural measures. Solid line arrows indicate promoting effects, dashed line arrows indicate inhibitory effects, and the yellow area represents the soil carbon cycle under green agricultural production mode. The green area represents natural farming measures promote soil carbon sequestration in farmland.
Agriculture 15 01499 g014
Table 1. Carbon density coefficient of different land types in Jurong City.
Land Use TypeAboveground BiomassSubsurface BiomassSoil Organic Matter
Plowland0.263.728.71
Forest land1.965.3412.76
Grassland1.633.998.03
Water area0.1401.22
Building land0.1202.38
Unused land0.0601.74
Plowland0.263.728.71
Forest land1.965.3412.76
Table 2. CH4 and CO2 emissions from paddy fields and dry farming under different agricultural management practices (kg·hm−2).
TotalityPaddy FieldDry Farming
nMeanSEnMeanSEnMeanSE
CH4PT0594.550.89395.100.7720−2.580.98
NT667.350.25462.550.7820−1.820.25
NT0345.230.47253.250.719−1.990.37
NTR329.250.12211.220.1111−1.200.39
CO2PT059200.3374.2518300.4520.47413.771.67
NT69168.2528.5623255.1742.12462.221.07
NT035223.4745.3212332.1031.09234.252.44
NTR3490.2228.3511117.2030.01231.791.51
Table 3. Correlation analysis of environmental factors and soil carbon emission effect values.
Independent VariableCH4 EmissionCH4 AbsorptionCO2 Emission
nRegression CoefficientR2nRegression CoefficientR2nRegression CoefficientR2
NT0/PT0AAT190.17860.0265100.03550.1455270.1123 *0.2137
MAP20−0.00060.1277100.00050.0785280.0008 **0.2630
Soil pH210.3965 ***0.420580.35470.225832−0.07780.0167
ED200.12580.2351100.04780.110938−0.01100.0026
FR19−0.00350.077810−0.03550.299934−0.22550.0085
NTR/PT0AAT100.35790.0124120.1122 **0.7039300.11030.1271
MAP10−0.03350.0874120.0077 ***0.7852300.0112 *0.1893
Soil pH23−0.25250.027780.8965 *0.600226−0.2598 *0.2149
ED21−0.07810.0087120.2558 **0.602533−0.1108 *0.1532
FR190.00070.075812−0.0736 **0.7782310.00050.0016
NT/PT0AAT32−0.04580.0012220.1022 *0.2056570.1394 **0.1524
MAP30−0.00010.0348220.0078 *0.3221580.1002 *** 0.2068
Soil pH380.18780.2476160.4452 *0.278958−0.1447 *0.1027
ED410.01120.0007220.08890.365771−0.00350.0540
FR37−0.00070.005822−0.0115 **0.258965−0.00090.0040
Note: NT0/PT0: compares no-tillage with no straw return to conventional tillage with no straw return; NTR/PT0: compares no-tillage with straw return to conventional tillage with no straw return; NT/PT0: compares no-tillage to conventional tillage with no straw return. “n” denotes the number of data sets; AAT: average annual temperature; MAP: mean annual precipitation; ED: experimental duration; FR: fertilization rates; * indicates p < 0.05; ** indicates p < 0.01; *** indicates p < 0.001.
Table 4. t-test of changes in relative abundance of dominant microorganisms at phylum and class levels under different agricultural management practices.
Microbial ClassDominant MicroorganismFarming Method
CPGPp
BacteriaPhylumAcidobacteria0.37 ± 0.010.39 ± 0.01<0.05 *
Proteobacteria0.34 ± 0.030.39 ± 0.02>0.05
Gemmatimonadetes0.054 ± 0.010.046 ± 0.007>0.05
Classa-Proteobacteria0.31 ± 0.020.30 ± 0.01>0.05
b-Proteobacteria0.23 ± 0.0020.35 ± 0.01<0.01 **
g-Proteobacteria0.10 ± 0.010.06 ± 0.01>0.05
FungusPhylumChytridiomycota0.53 ± 0.120.47 ± 0.10>0.05
Ascomycota0.20 ± 0.100.21 ± 0.08>0.05
Mucoromycota0.16 ± 0.040.14 ± 0.03>0.05
ClassUnclassified0.48 ± 0.030.47 ± 0.06>0.05
Glomeromycetes0.22 ± 0.090.25 ± 0.01<0.01 **
Agaricomycetes0.04 ± 0.010.15 ± 0.09>0.05
Note: * indicates p < 0.05; ** indicates p < 0.01.
Disclaimer/Publisher’s Note: The statements, opinions and data contained in all publications are solely those of the individual author(s) and contributor(s) and not of MDPI and/or the editor(s). MDPI and/or the editor(s) disclaim responsibility for any injury to people or property resulting from any ideas, methods, instructions or products referred to in the content.

