Article

Cultivated Land Suitability Prediction in Southern Xinjiang Typical Areas Based on Optimized MaxEnt Model

1
Key Laboratory of Coupling Processes and Effects of Natural Resources Elements, Ministry of Natural Resources, Beijing 100055, China
2
College of Geography and Remote Sensing Science, Xinjiang University, Urumqi 830046, China
3
Integrated Survey and Command Center for Natural Resources, China Geological Survey, Beijing 100055, China
*
Author to whom correspondence should be addressed.
Agriculture 2025, 15(14), 1498; https://doi.org/10.3390/agriculture15141498
Submission received: 15 May 2025 / Revised: 26 June 2025 / Accepted: 2 July 2025 / Published: 12 July 2025
(This article belongs to the Section Digital Agriculture)

Abstract

To ensure food security in Xinjiang, scientifically conducting land suitability evaluation is of significant importance. This paper takes an arid and ecologically fragile region of southern Xinjiang—Qiemu County—as an example. Based on the optimized Maximum Entropy (MaxEnt) model, 14 multi-source environmental variables including climate, soil, hydrology, and topography are integrated. The ENMeval package is used to optimize the model parameters, and Spearman’s rank correlation analysis is employed to screen key variables. The spatial distribution of land suitability and the dominant factors are systematically assessed. The results show that the model AUC values for the mountainous and plain areas are 0.987 and 0.940, respectively, indicating high accuracy. In the plain area, land suitability is primarily influenced by the soil sand content, while in the mountainous region, the annual accumulated temperature plays a leading role. The highly suitable areas are mainly distributed in the northern plains and parts of the southern mountains. This study clarifies the suitable areas for land development and environmental thresholds, providing a scientific basis for the development of land resources in arid regions and the implementation of the “store grain in the land” strategy.

1. Introduction

Arable land is the most fundamental agricultural production space and an essential resource foundation for ensuring food security [1]. Currently, the national situation of having a large population and limited land remains unchanged, with the issues of “non-agriculturalization” and “non-grain cultivation” in arable land being prominent. Food security still faces significant pressure [2]. The limited availability of arable land and the extensive use of land have become constraints on the high-quality development of agriculture and the coordinated development of the ecological environment [3]. Developing reserve arable land resources is an important measure to alleviate land pressure, improve food production capacity, and implement the “store grain in the land” strategy [4]. Therefore, scientifically evaluating land suitability and reasonably demarcating suitable development areas is a key prerequisite for advancing the protection and efficient utilization of arable land resources.
Land suitability evaluation is a key method based on the comprehensive analysis of natural factors such as soil, climate, hydrology, and topography to identify suitable cultivation areas [5]. In recent years, with the development of remote sensing and geographic information technologies, the methods for evaluating land suitability have become increasingly diverse, including hierarchical analysis, weighted composite methods, and machine learning models [6]. Among these, the Maximum Entropy model (MaxEnt) has been widely used in ecological suitability studies due to its advantages such as low input sample requirements, strong generalization ability, and high prediction accuracy. Previous studies have used the MaxEnt model to predict and assess the suitability of crop cultivation areas [7], land use change trends [8], and ecosystem service supply areas [9], providing decision-making support for resource development.
Nevertheless, systematic studies on land suitability in arid areas remain relatively limited, especially in the complex environmental conditions and ecologically fragile areas of southern Xinjiang [10]. Xinjiang is an important strategic reserve area for China’s reserve arable land resources, with large contiguous areas of arable land and unused land [11]. However, issues such as soil salinization and water scarcity are also prominent [12,13,14]. Qiemu County, located on the southeastern edge of the Taklamakan Desert, is a typical arid ecological fragile zone and a key area for land development focus [15]. It is also a critical node in the current strategic deployment of the “Southward Movement of the Corps” and the “Desert Counterattack” strategy.
Based on this, this study focuses on a typical arid area of southern Xinjiang—Qiemu County. By integrating 14 types of climate, soil, hydrology, and topography multi-source environmental variables, an arable land suitability evaluation index system is constructed. The ENMeval package is used to optimize the MaxEnt model parameters, and Spearman’s correlation analysis is combined to identify key dominant factors. The spatial pattern of land suitability and its dominant mechanisms are systematically assessed. The study objectives are as follows: (1) to establish a land suitability evaluation model adapted to the environmental characteristics of arid regions; (2) to identify the dominant environmental factors and key thresholds affecting the distribution of arable land; (3) to demarcate the key areas suitable for arable land development, providing decision support for the development and protection of arable land resources in frontier regions.
Compared to previous studies, the innovations of this research mainly include (1) the first application of the optimized MaxEnt model in land suitability evaluation in a typical arid area of southern Xinjiang, improving the accuracy and scientificity of suitability delineation; (2) distinguishing between the environmental differences between mountainous and plain areas, constructing separate models, and refining regional differentiated management strategies; (3) identifying suitable thresholds for key variables, providing quantifiable evidence for land development, and contributing to precise site selection and rational development in arid and fragile ecological areas.

2. Materials and Methods

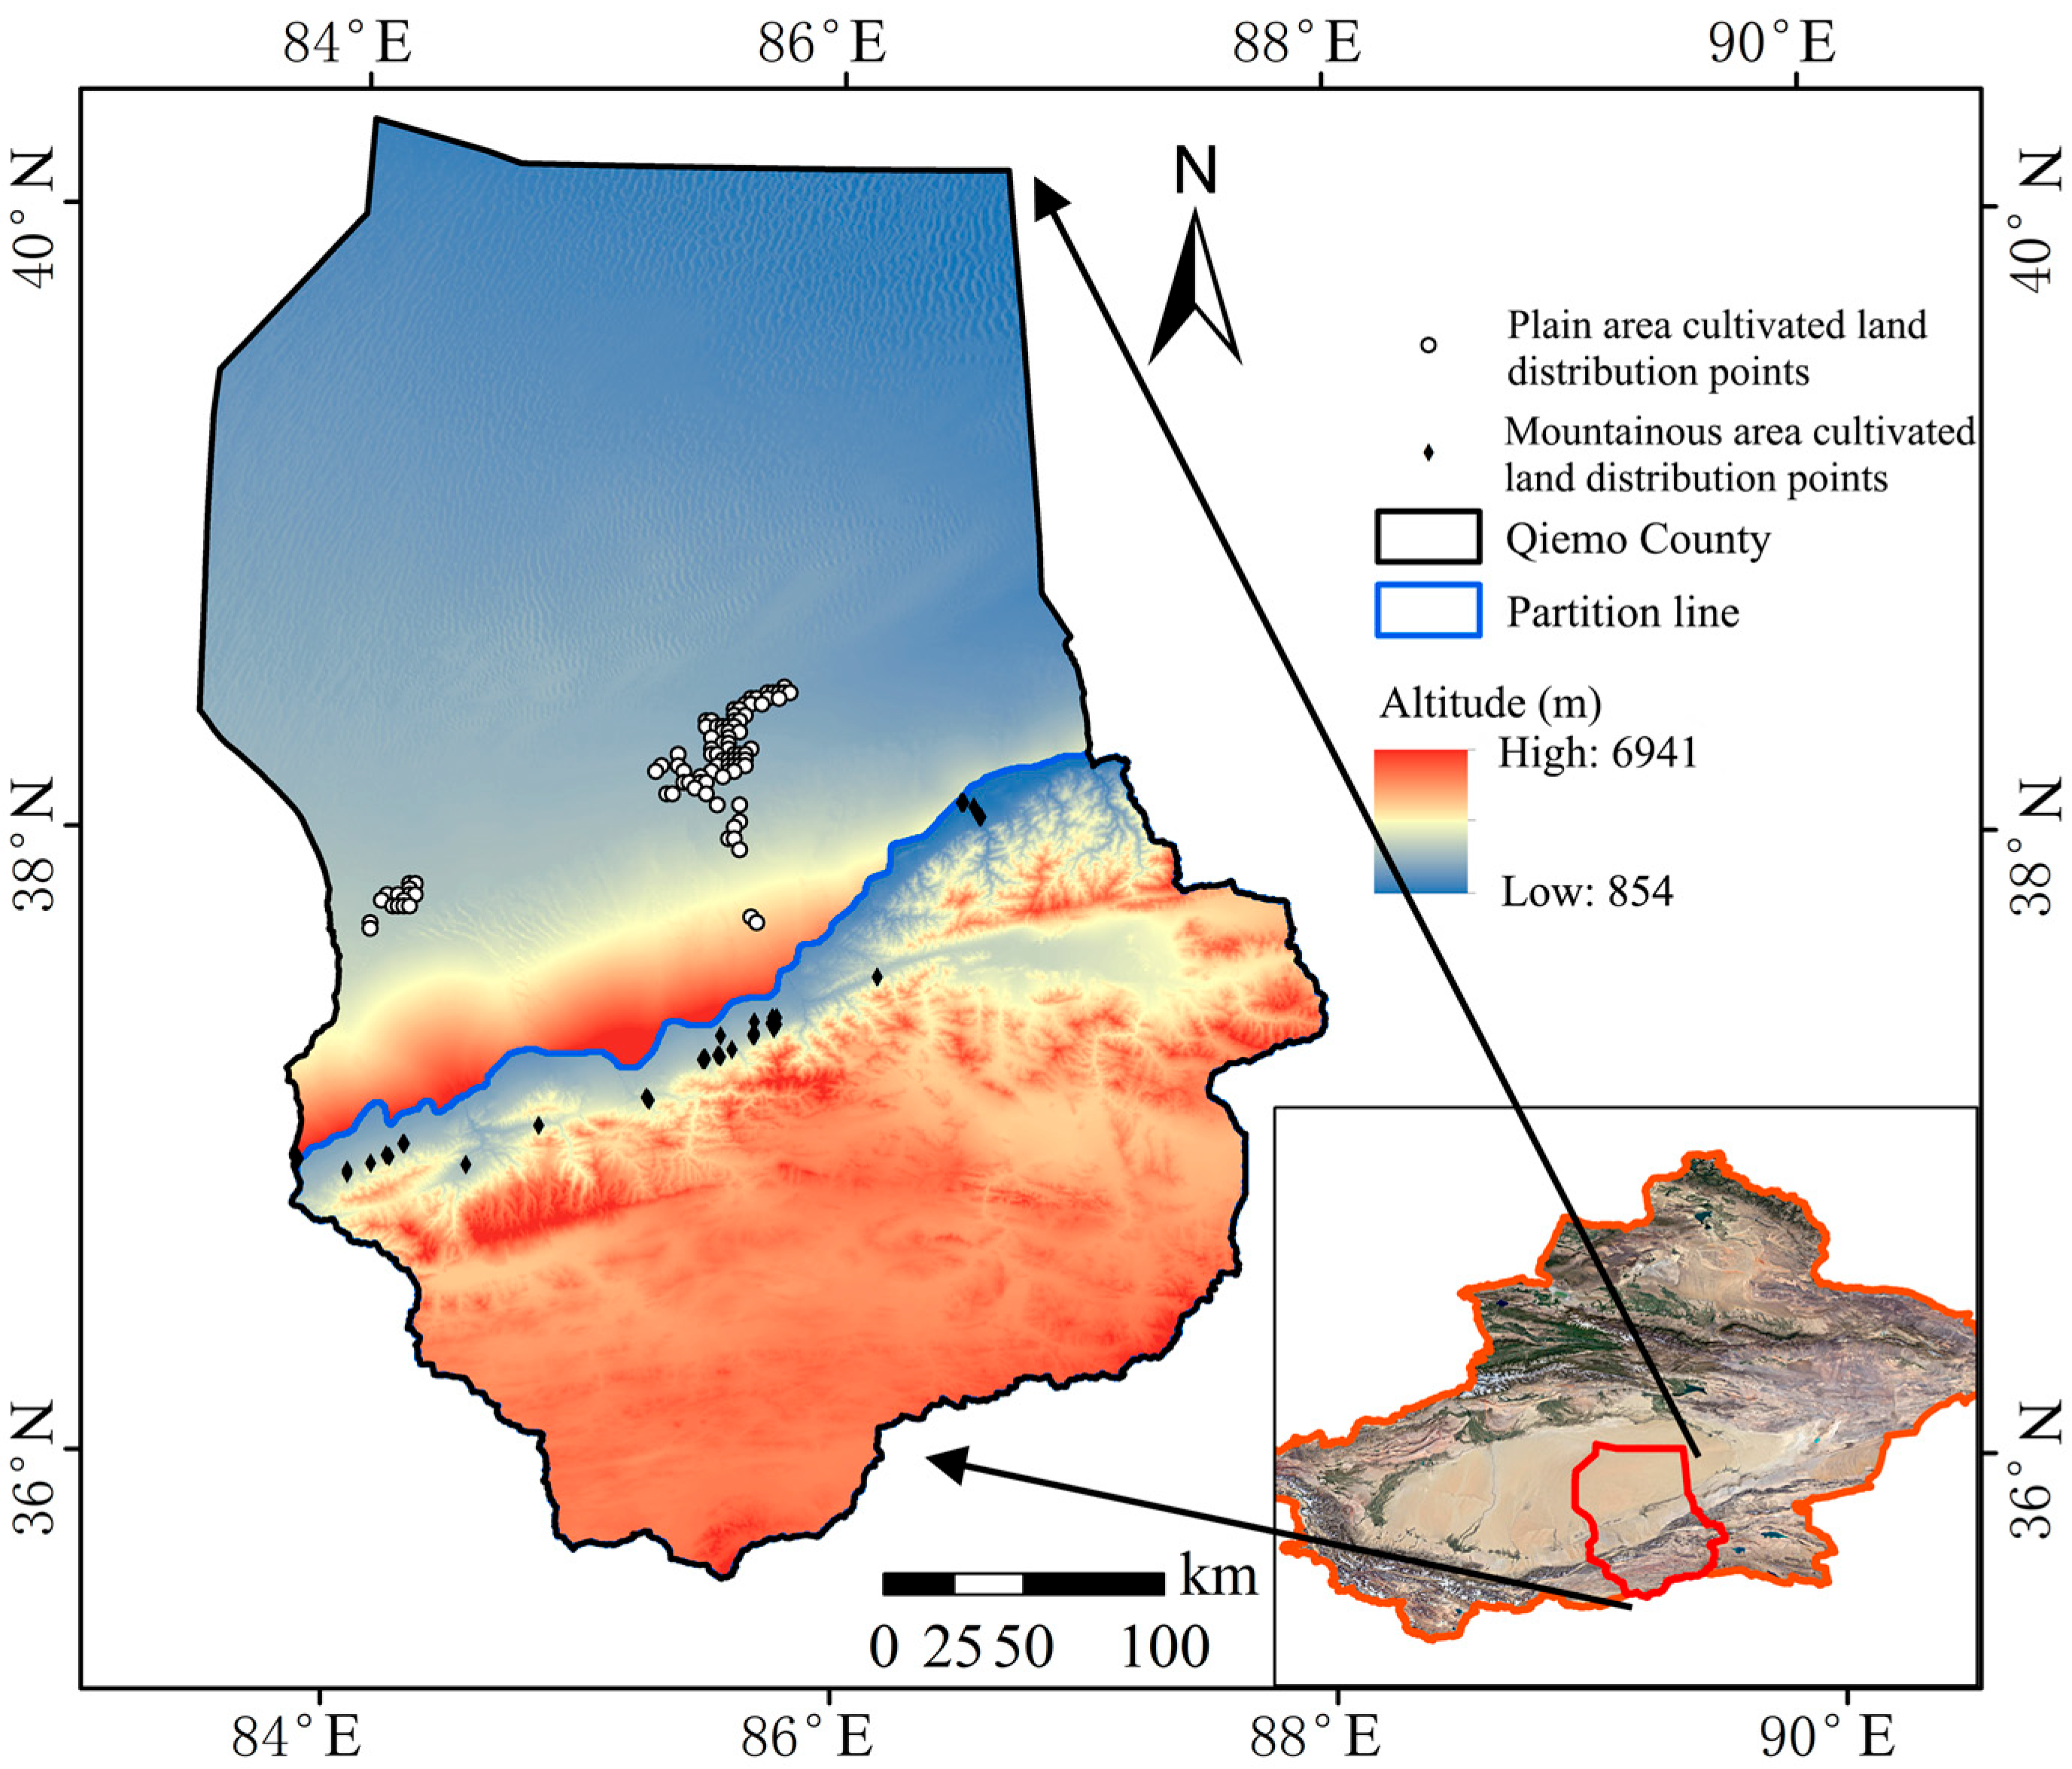
2.1. Overview of the Study Area

Qiemo County is located in the southwestern part of Bayingolin Mongol Autonomous Prefecture in the Xinjiang Uygur Autonomous Region, situated on the southeastern edge of the Tarim Basin and the northern foothills of the Altun Mountains [16]. Its geographical coordinates range from 83°25′ to 87°30′ E and 35°40′ to 40°10′ N. It borders Ruoqiang County to the east and Minfeng County in the Hotan region to the west. To the south, it is bounded by the Altun and East Kunlun Mountains, adjoining the Tibet Autonomous Region, while to the north it extends into the Taklamakan Desert and faces Yuli County across the desert [17]. Covering a total area of 138,600 square kilometers, it is the second-largest county in China by administrative area. Qiemo County has a warm temperate, extremely arid continental climate, with distinct solar energy advantages. The total annual solar radiation reaches 119.2 kilocalories per square centimeter. The diurnal temperature variation is significant, with a maximum daily range of up to 24 °C. The annual average temperature is 10.5 °C, with recorded extremes ranging from −24.8 °C to 41.5 °C. The frost-free period is relatively short, averaging 165 days. Annual precipitation is minimal, with an average of less than 25 mm. The area is characterized by high evaporation rates, dry air, and frequent strong winds and sandstorms, particularly in spring and summer. According to the Atlas of Asian Soils, the plains of Qiemo County are predominantly composed of aeolian sandy soils and saline soils. Aeolian sandy soils are extensively distributed along the edges of deserts and in broad open plains, characterized by a loose texture with poor water retention and nutrient-holding capacity. Saline soils are mainly found in low-lying areas and exhibit significant salinization. In the mountainous regions, desert brown soils are the dominant type. These soils are typically located in mountainous and piedmont zones, featuring a high content of rocks and gravel, shallow soil layers, and relatively low nutrient levels.
There are significant differences in climate (temperature and precipitation), geology, soil, and hydrological characteristics between the plains and mountainous regions of Xinjiang [18]. Therefore, conducting suitability assessments separately for these two regions ensures greater accuracy and scientific rigor. Based on the macro-geomorphological patterns and topographic features of Xinjiang, this study divides Qiemo County into two zones: the plain region and the mountainous region (Figure 1), with respective areas of 82,020 km2 and 56,580 km2.

2.2. Acquisition and Filtering of Cultivated Land Distribution Data

The cultivated land data for Qiemo County used in this study were primarily obtained from the China Land-Use and Land-Cover Change (CNLUCC) dataset (http://www.resdc.cn, accessed on 17 November 2024). This dataset was developed using Landsat satellite imagery from the United States as the main information source and was constructed through manual visual interpretation to build a national-scale, multi-temporal land use/land cover thematic database for China [19]. In this study, the data used represent the mode value across five time periods—2000, 2005, 2010, 2015, and 2020—serving as an average spatial distribution of cultivated land over the past two decades.
To avoid the effects of spatial autocorrelation caused by excessive proximity among cultivated land distribution points [20], the buffer tool in ArcGIS 10.8 was employed to filter the point data. Based on the principle of retaining only one distribution point within each 1 km × 1 km area, the dataset was refined accordingly. The final number of points used for model construction is shown in Table 1. The filtered data were saved in .csv format for use in the MaxEnt model (v3.4.4).

2.3. Acquisition and Selection of Environmental Data

In this study, 27 environmental variables potentially influencing cropland distribution were initially selected (Table 2), encompassing six categories: temperature, precipitation, topography, hydrology, soil, and geology. Climate factor data, including temperature and precipitation, were obtained from the National Meteorological Science Data Center (https://data.cma.cn/) [21]. Topographic data were sourced from the Geospatial Data Cloud platform (https://www.gscloud.cn/) [22], with slope and aspect derived from elevation (DEM) data through resampling in ArcGIS 10.8. Hydrological data were obtained from HydroSHEDS (https://hydrosheds.org/) [23]. Soil data, representing the most detailed nationwide soil dataset to date, were provided by the National Tibetan Plateau Data Center (https://data.tpdc.ac.cn/home) [24]. Geological data were based on previous research [25] on bedrock depth across China. All environmental variables were resampled in ArcGIS to a uniform resolution of 1 km × 1 km, using the “WGS 1984” geographic coordinate system.

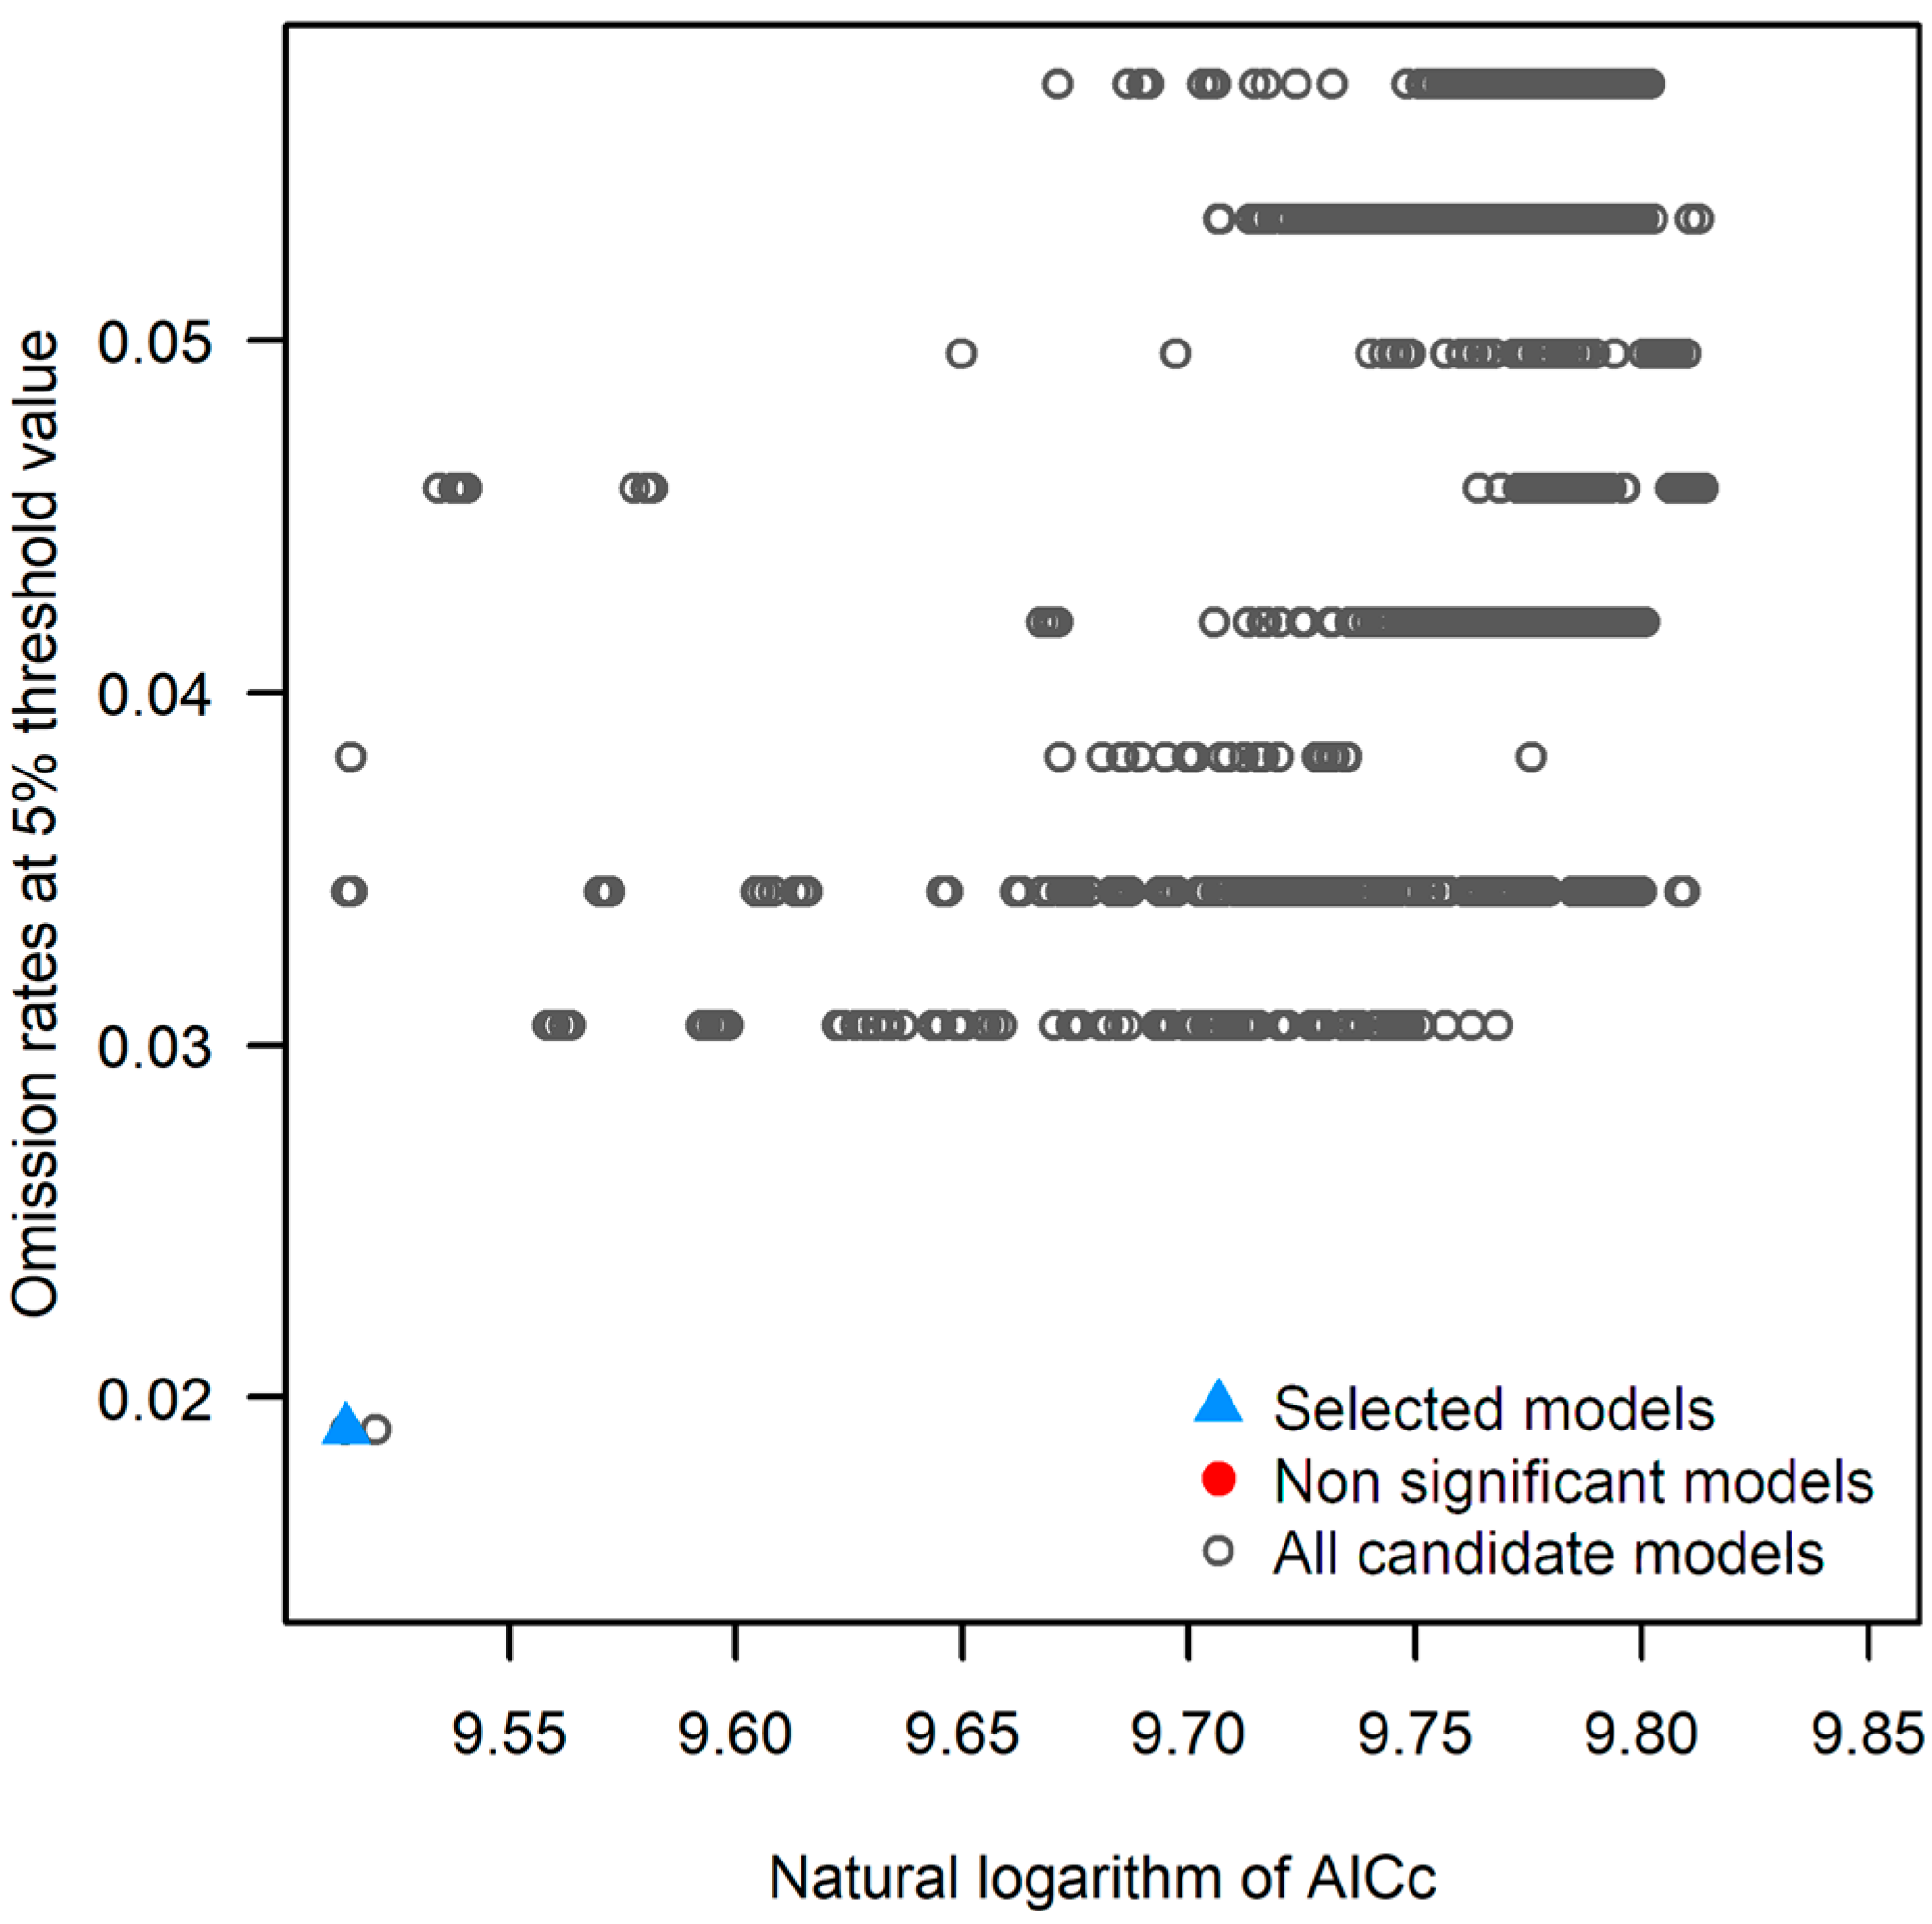
2.4. Model Development and Optimization

The MaxEnt model may suffer from overfitting when simulating the potential distribution of cropland [26]. In this study, the ENMeval package (R 4.3.2) was employed to perform cross-validation and tuning of the MaxEnt model. Specifically, a range of eight regularization multipliers (RMs) from 0 to 4, increasing by 0.1 increments, was tested alongside six feature combinations (FC): L, LQ, LQH, H, LQHP, and LQHPT (where L = linear, Q = quadratic, H = hinge, P = product, T = threshold). These combinations were cross-compared as model parameters [27]. Subsequently, the 48 parameter combinations were evaluated using the ENMeval package. The final MaxEnt model was selected based on combinations with an omission rate below 5% and a low delta AICc (the difference in Akaike Information Criterion corrected for small sample size between the best and current models) [28].

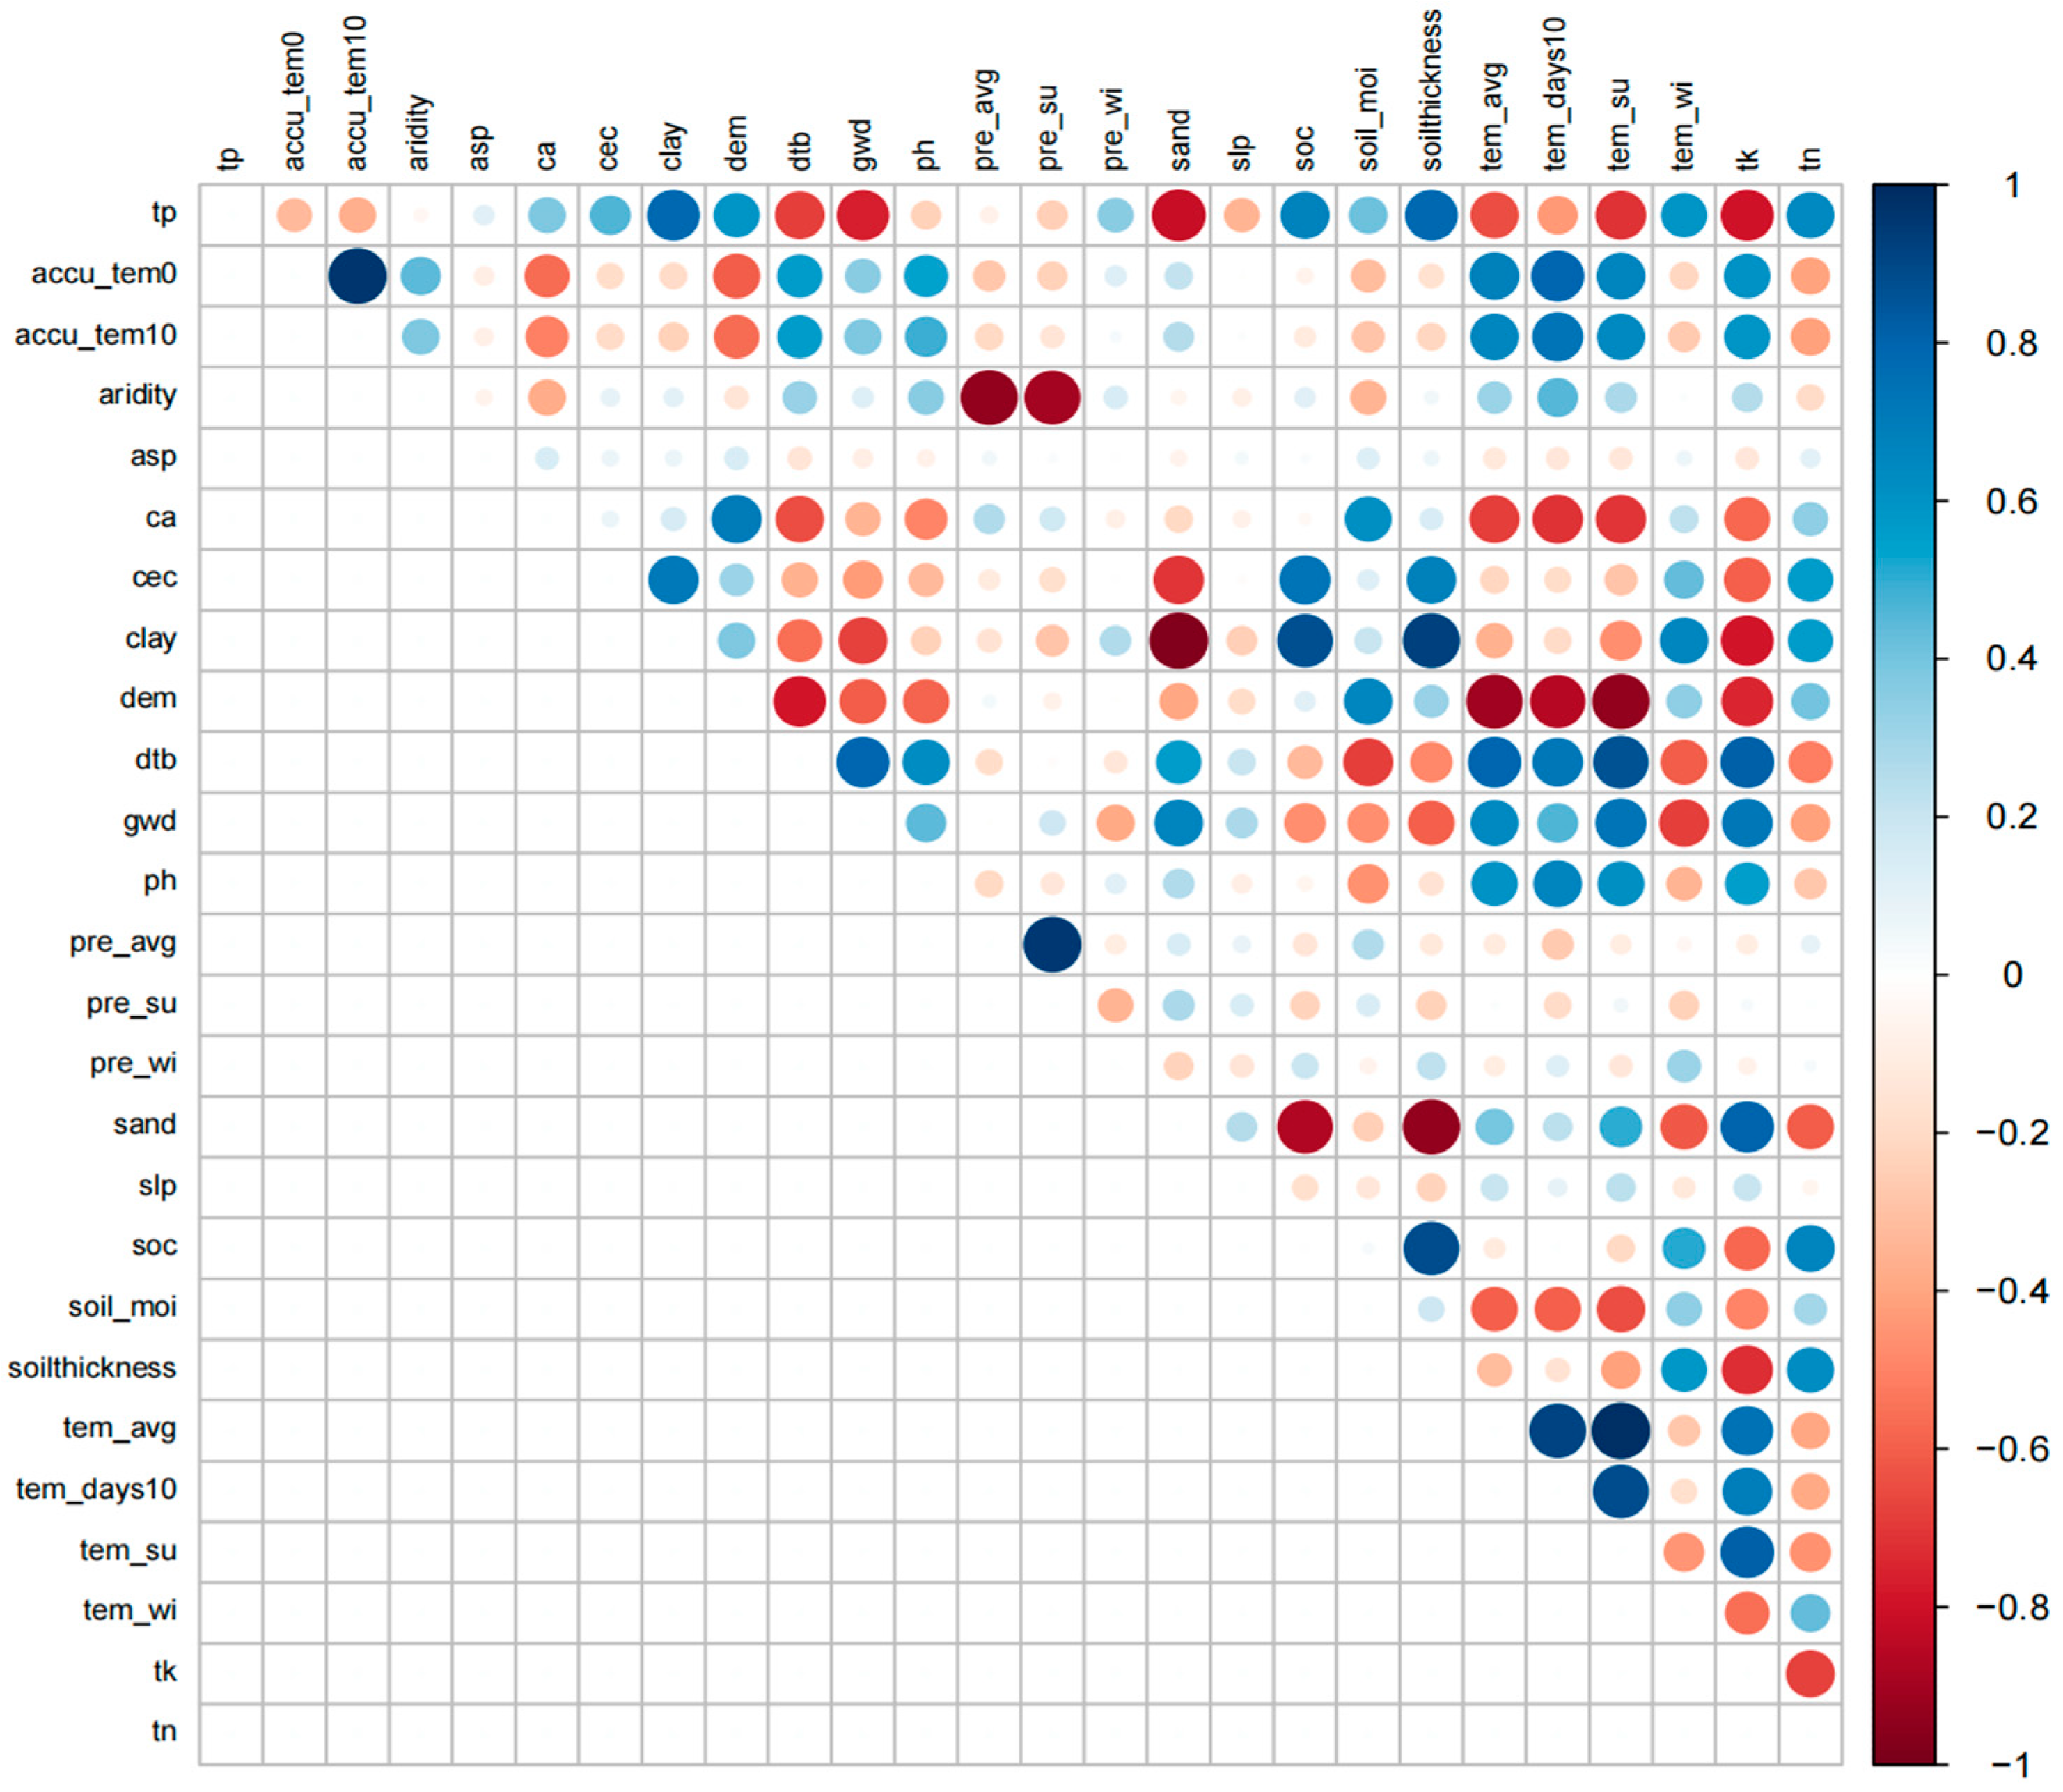
2.5. Selection and Elimination of Environmental Variables

To avoid issues of autocorrelation and multicollinearity among variables, this study employed Spearman’s correlation coefficient and the plotting functionality in R for variable screening and analysis [29]. Based on the analysis results (Figure 2), variables with |correlation coefficients| less than 0.7 were selected for modeling. Additionally, the jackknife test results from the MaxEnt model were used to evaluate the contribution of each environmental variable to model prediction, and variables with a low contribution were excluded [30]. Ultimately, the environmental variables and their contribution rates used for analyzing the suitability distribution in mountainous and plain areas are presented in Table 3 and Table 4. A total of 14 variables were used for the analysis of mountainous areas, and 12 variables were used for plains.

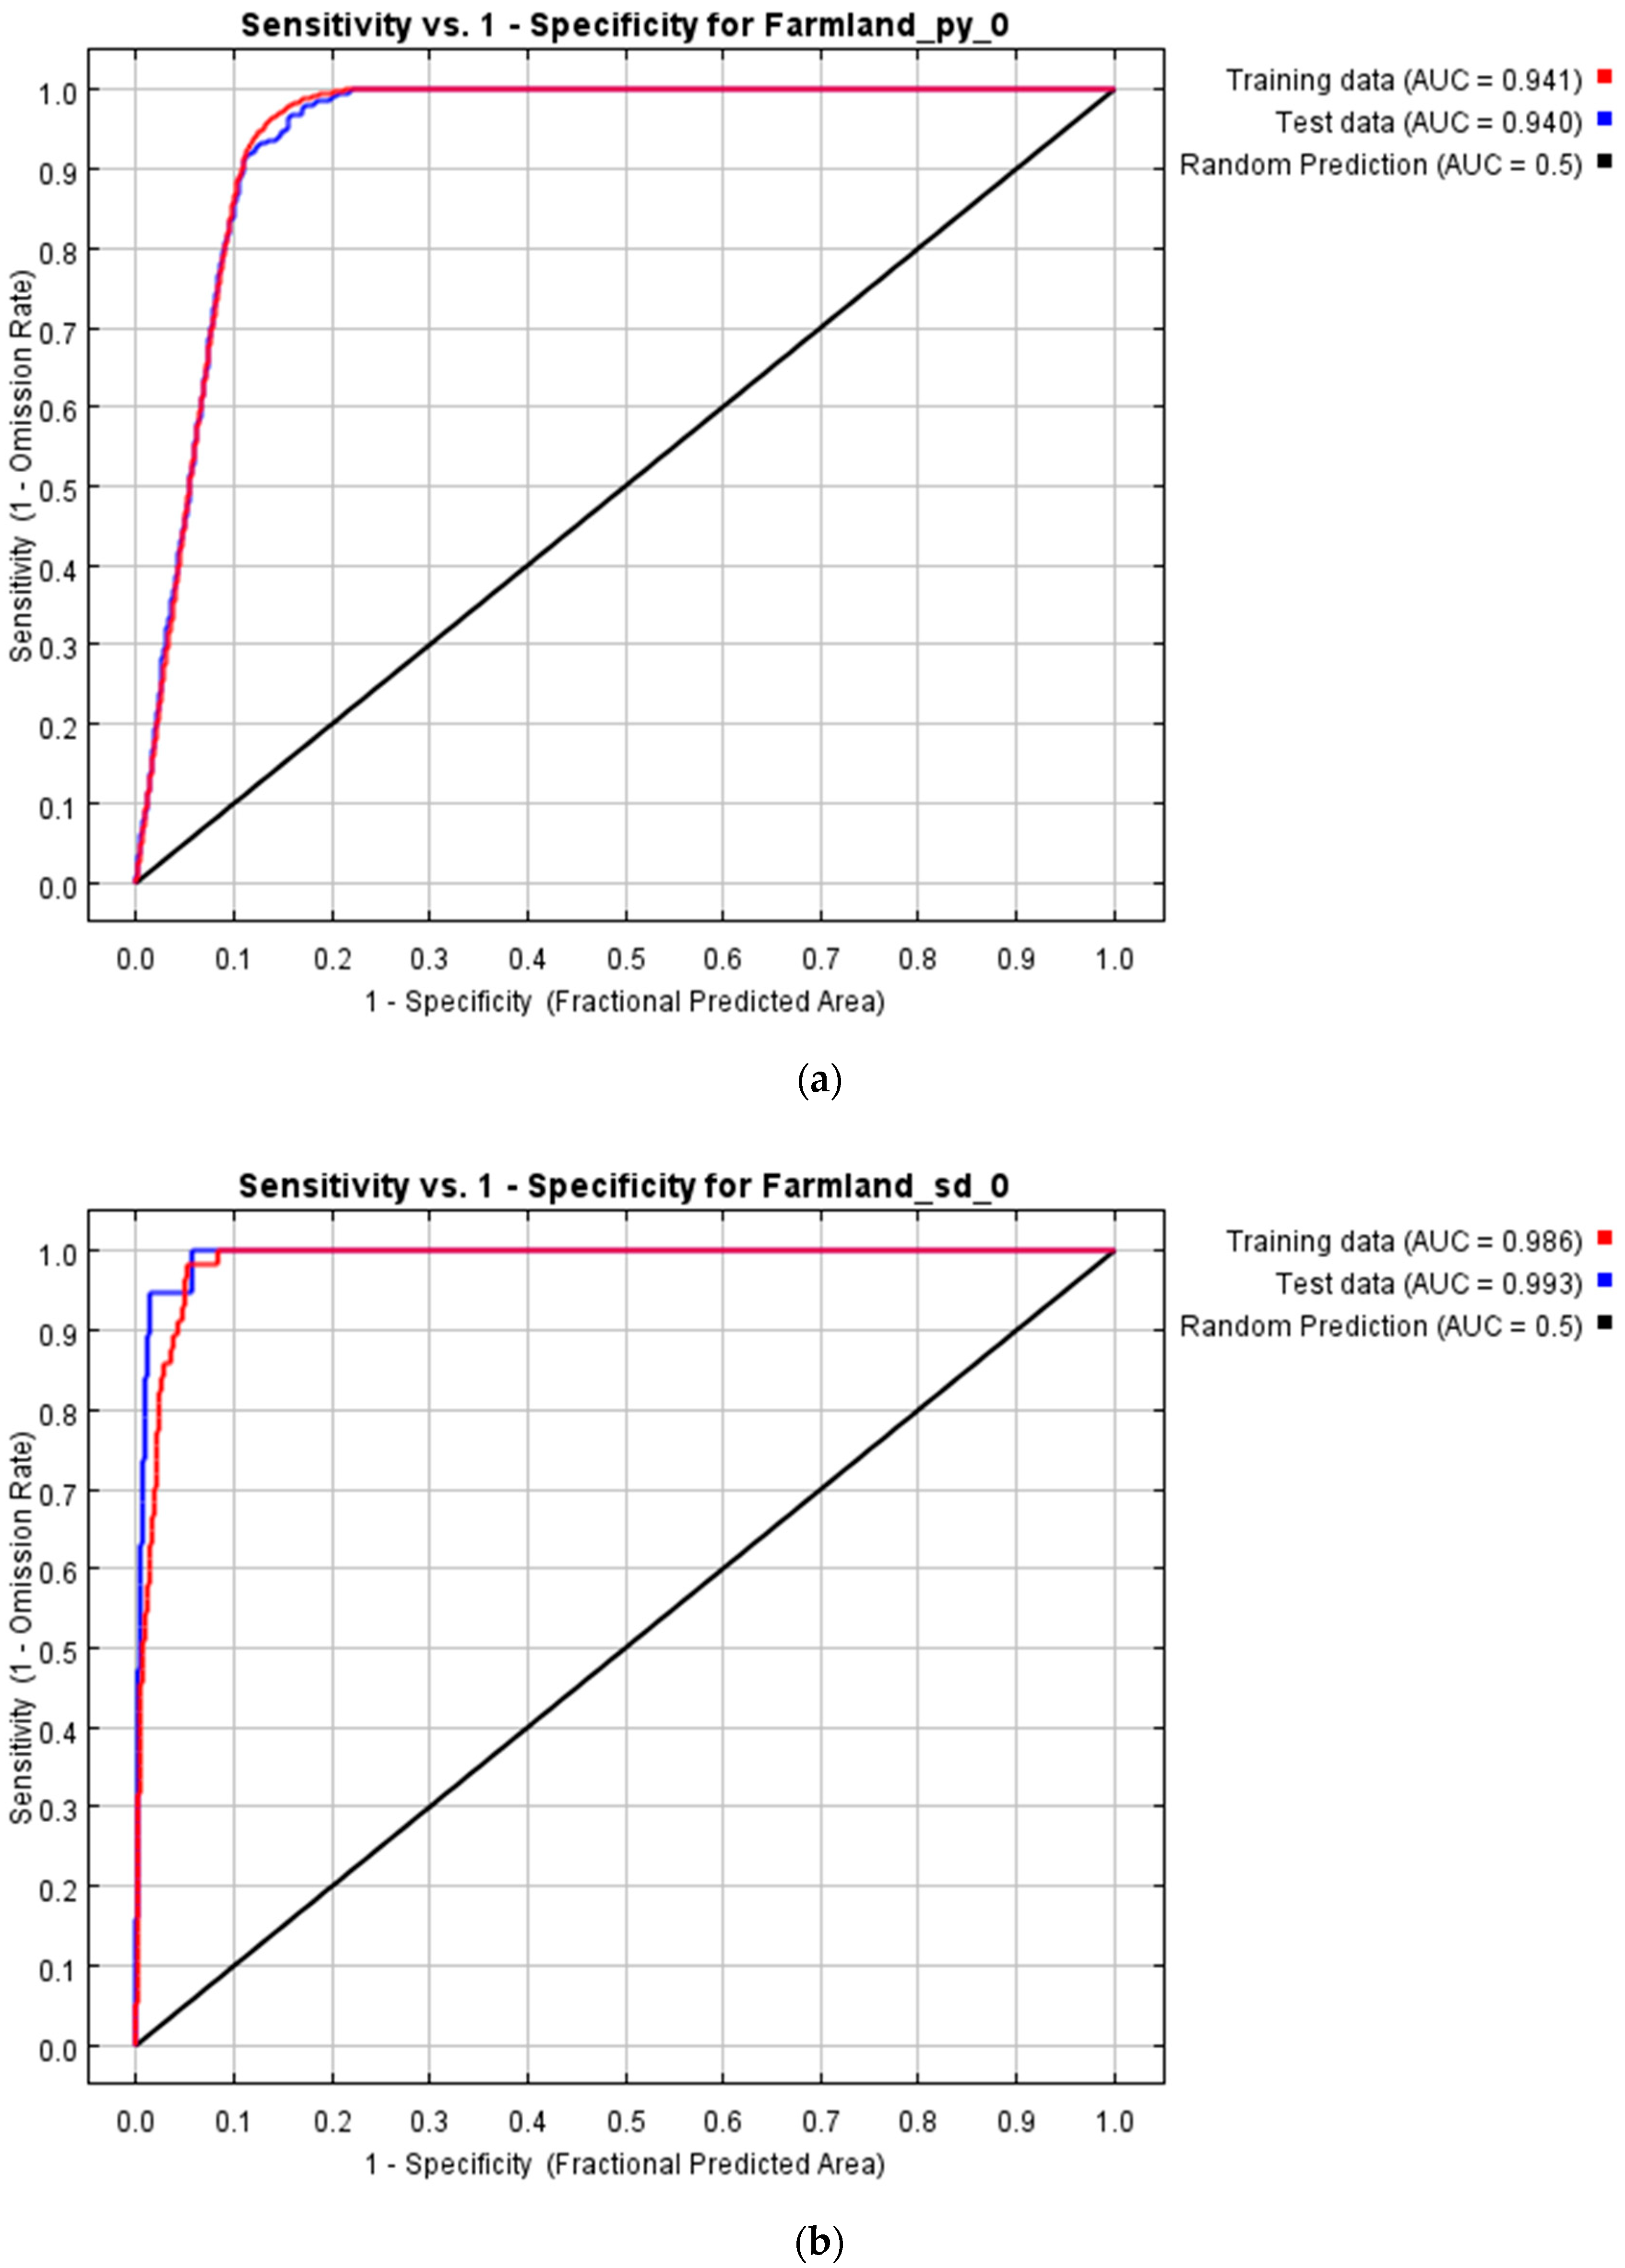
2.6. Model Accuracy Evaluation

The MaxEnt model was used to predict the potential suitable cropland areas in Qiemo County. The occurrence data (in .csv format) and environmental data (in .asc format) were imported into the software. The “Jackknife” method was selected, and the output format was set to logistic. Subsequently, 25% of the occurrence data was used as the test set for model validation, while the remaining 75% served as the training set. The optimized values for the regularization multiplier (RM) and feature combination (FC) were applied, and the model was run with 10 replicates [31]. All other parameters were kept at default settings during model construction. To evaluate the model’s accuracy, the area under the receiver operating characteristic curve (AUC value) was used as the primary metric to assess the MaxEnt model’s predictive performance [32]. AUC values range from 0 to 1, with higher values indicating greater predictive accuracy. An AUC value below 0.7 indicates poor performance, between 0.7 and 0.8 indicates moderate performance, between 0.8 and 0.9 indicates good performance, and above 0.9 reflects excellent predictive accuracy [33].

2.7. Classification of Suitability Levels

The average output values generated by the model were imported into ArcGIS 10.8 software. Using the conversion tools within ArcGIS, the files were transformed from .asc format into raster data. Referring to previously established classification criteria [34], the suitable growth areas were divided into four levels based on the mean logistic values and actual distribution conditions: areas with logistic values (P) less than 0.2 were classified as unsuitable; values between 0.2 and 0.4 were considered to have low suitability; values between 0.4 and 0.6 were deemed moderate suitability; and areas with P values greater than or equal to 0.6 were categorized as having high suitability (Table 5). Finally, the area corresponding to each suitability level was calculated and summarized.

3. Results

3.1. Model Optimization Results and Accuracy Assessment

Based on the model optimization results, 1241 combinations of model parameters were cross-validated using feature combination (FC) and regularization multipliers (RMs). Among them, only one parameter combination met the criteria of omission rates below 5% and a low delta AICc [35], with FC set to “L” and RM set to 0.1. Under these conditions, the omission rate was 4.1% and the delta AICc was low, indicating that this parameter combination yielded a better predictive performance (Figure 3).
The AUC values used in the final analysis for the distribution of suitable cultivated land areas in both the mountainous and plain regions of Qiemo County are shown in Figure 4 and are significantly higher than the random prediction (AUC = 0.5), indicating strong model performance [36]. The modeling parameters selected in this study were as follows: cultivated land FC (feature combination) = L, and RM (regularization multiplier) = 0.1. Under these parameters, the average AUC values of the prediction model for cultivated land suitability in the test set were 0.986 for the mountainous region and 0.941 for the plain region, both significantly higher than the random prediction (AUC = 0.5), indicating excellent predictive performance [37]. This suggests that the model’s predictions exhibit a high degree of fit and reliability, and can be used to predict the potential distribution of cultivated land.

3.2. Analysis of Key Environmental Factors Influencing Cultivated Land Suitability in the Plain Region

This study employed the output of the MaxEnt model, using regularized training gain from the jackknife method, permutation importance, and individual response curves to identify the dominant environmental factors influencing the ecological and geographical distribution of cultivated land (Table 3, Figure 5 and Figure 6). As shown by the jackknife test results using training data from the plain region (Figure 5), the environmental variables that yielded the highest gain when used in isolation were the soil sand content (sand), soil thickness (soilthickness), distance to fifth-order river systems (wat), and soil organic carbon (soc), indicating that these variables contain unique information not provided by others. Meanwhile, the greatest decrease in model gain occurred when the accumulated temperature above 10 °C (accu_tem10) was omitted, suggesting that this variable provides the most useful information for suitability analysis in the plain region. According to the contribution rates and permutation importance in Table 3, the soil sand content (sand), soil thickness (soilthickness), distance to fifth-order rivers (wat), and accumulated temperature above 10 °C (accu_tem10) contributed 68.5%, 17.4%, 7%, and 2.2%, respectively, with a cumulative contribution rate of 95.1%. Their corresponding permutation importances were 1.9%, 0.4%, 74.9%, and 9.1%, summing to 86.3%. These results indicate that the above four environmental factors are the dominant variables influencing the spatial distribution of cultivated land suitability in the plain region.
Based on the four dominant environmental factors identified above, individual factor models were developed. The single-factor response curves depict the relationship between the probability of species presence and each environmental variable, clearly revealing the correlated variation trends between the probability of cultivated land suitability in Qiemo County and the dominant environmental factors [38].
The response curve for the soil sand content is shown in Figure 6a. The soil sand content (sand) exhibits a negative correlation with cultivated land suitability. When sand ranges from 23.3% to 31.6%, the probability of suitable cultivated land distribution in the plain region reaches its peak, representing optimal conditions. As the sand content continues to increase, the probability of suitability gradually declines, approaching zero when the sand content nears 100%. When the sand content is below 43.32%, the land is considered suitable for cultivation (LOV > 0.5); when it exceeds 58.34%, the land is unsuitable (LOV < 0.2). Similarly, the response curve for the soil thickness (soilthickness), shown in Figure 6b, indicates that the cultivated land suitability increases with greater soil thickness. When the soil thickness exceeds 76 cm, the land becomes moderately suitable (LOV > 0.2); the most suitable range is between 156 and 168 cm. The response curve for the Euclidean distance to fifth-order river systems (wat), shown in Figure 6c, demonstrates that the cultivated land suitability improves as the proximity to the water system increases. When the distance to the water system is less than 0.14 × 10⁵ m, the land is considered moderately suitable (LOV > 0.2). The response curve for accumulated temperature above 10 °C (accu_tem10), shown in Figure 6d, indicates that when this value exceeds 4363 °C, the land is unsuitable for cultivation (LOV < 0.2); when it is below 3727 °C, the land is considered suitable (LOV > 0.5).

3.3. Potential Distribution of Suitable Cultivated Land in the Plain Region

The total area of the plain region is approximately 82,020 km2. The suitable areas are primarily distributed in the northern part of Qiemo County. Among them, the low-suitability area covers 6220 km2, accounting for about 7.59% of the total area; the medium-suitability area covers 2080 km2, or approximately 2.54%; and the high-suitability area covers 1280 km2, representing about 1.57% of the total area (Figure 7).

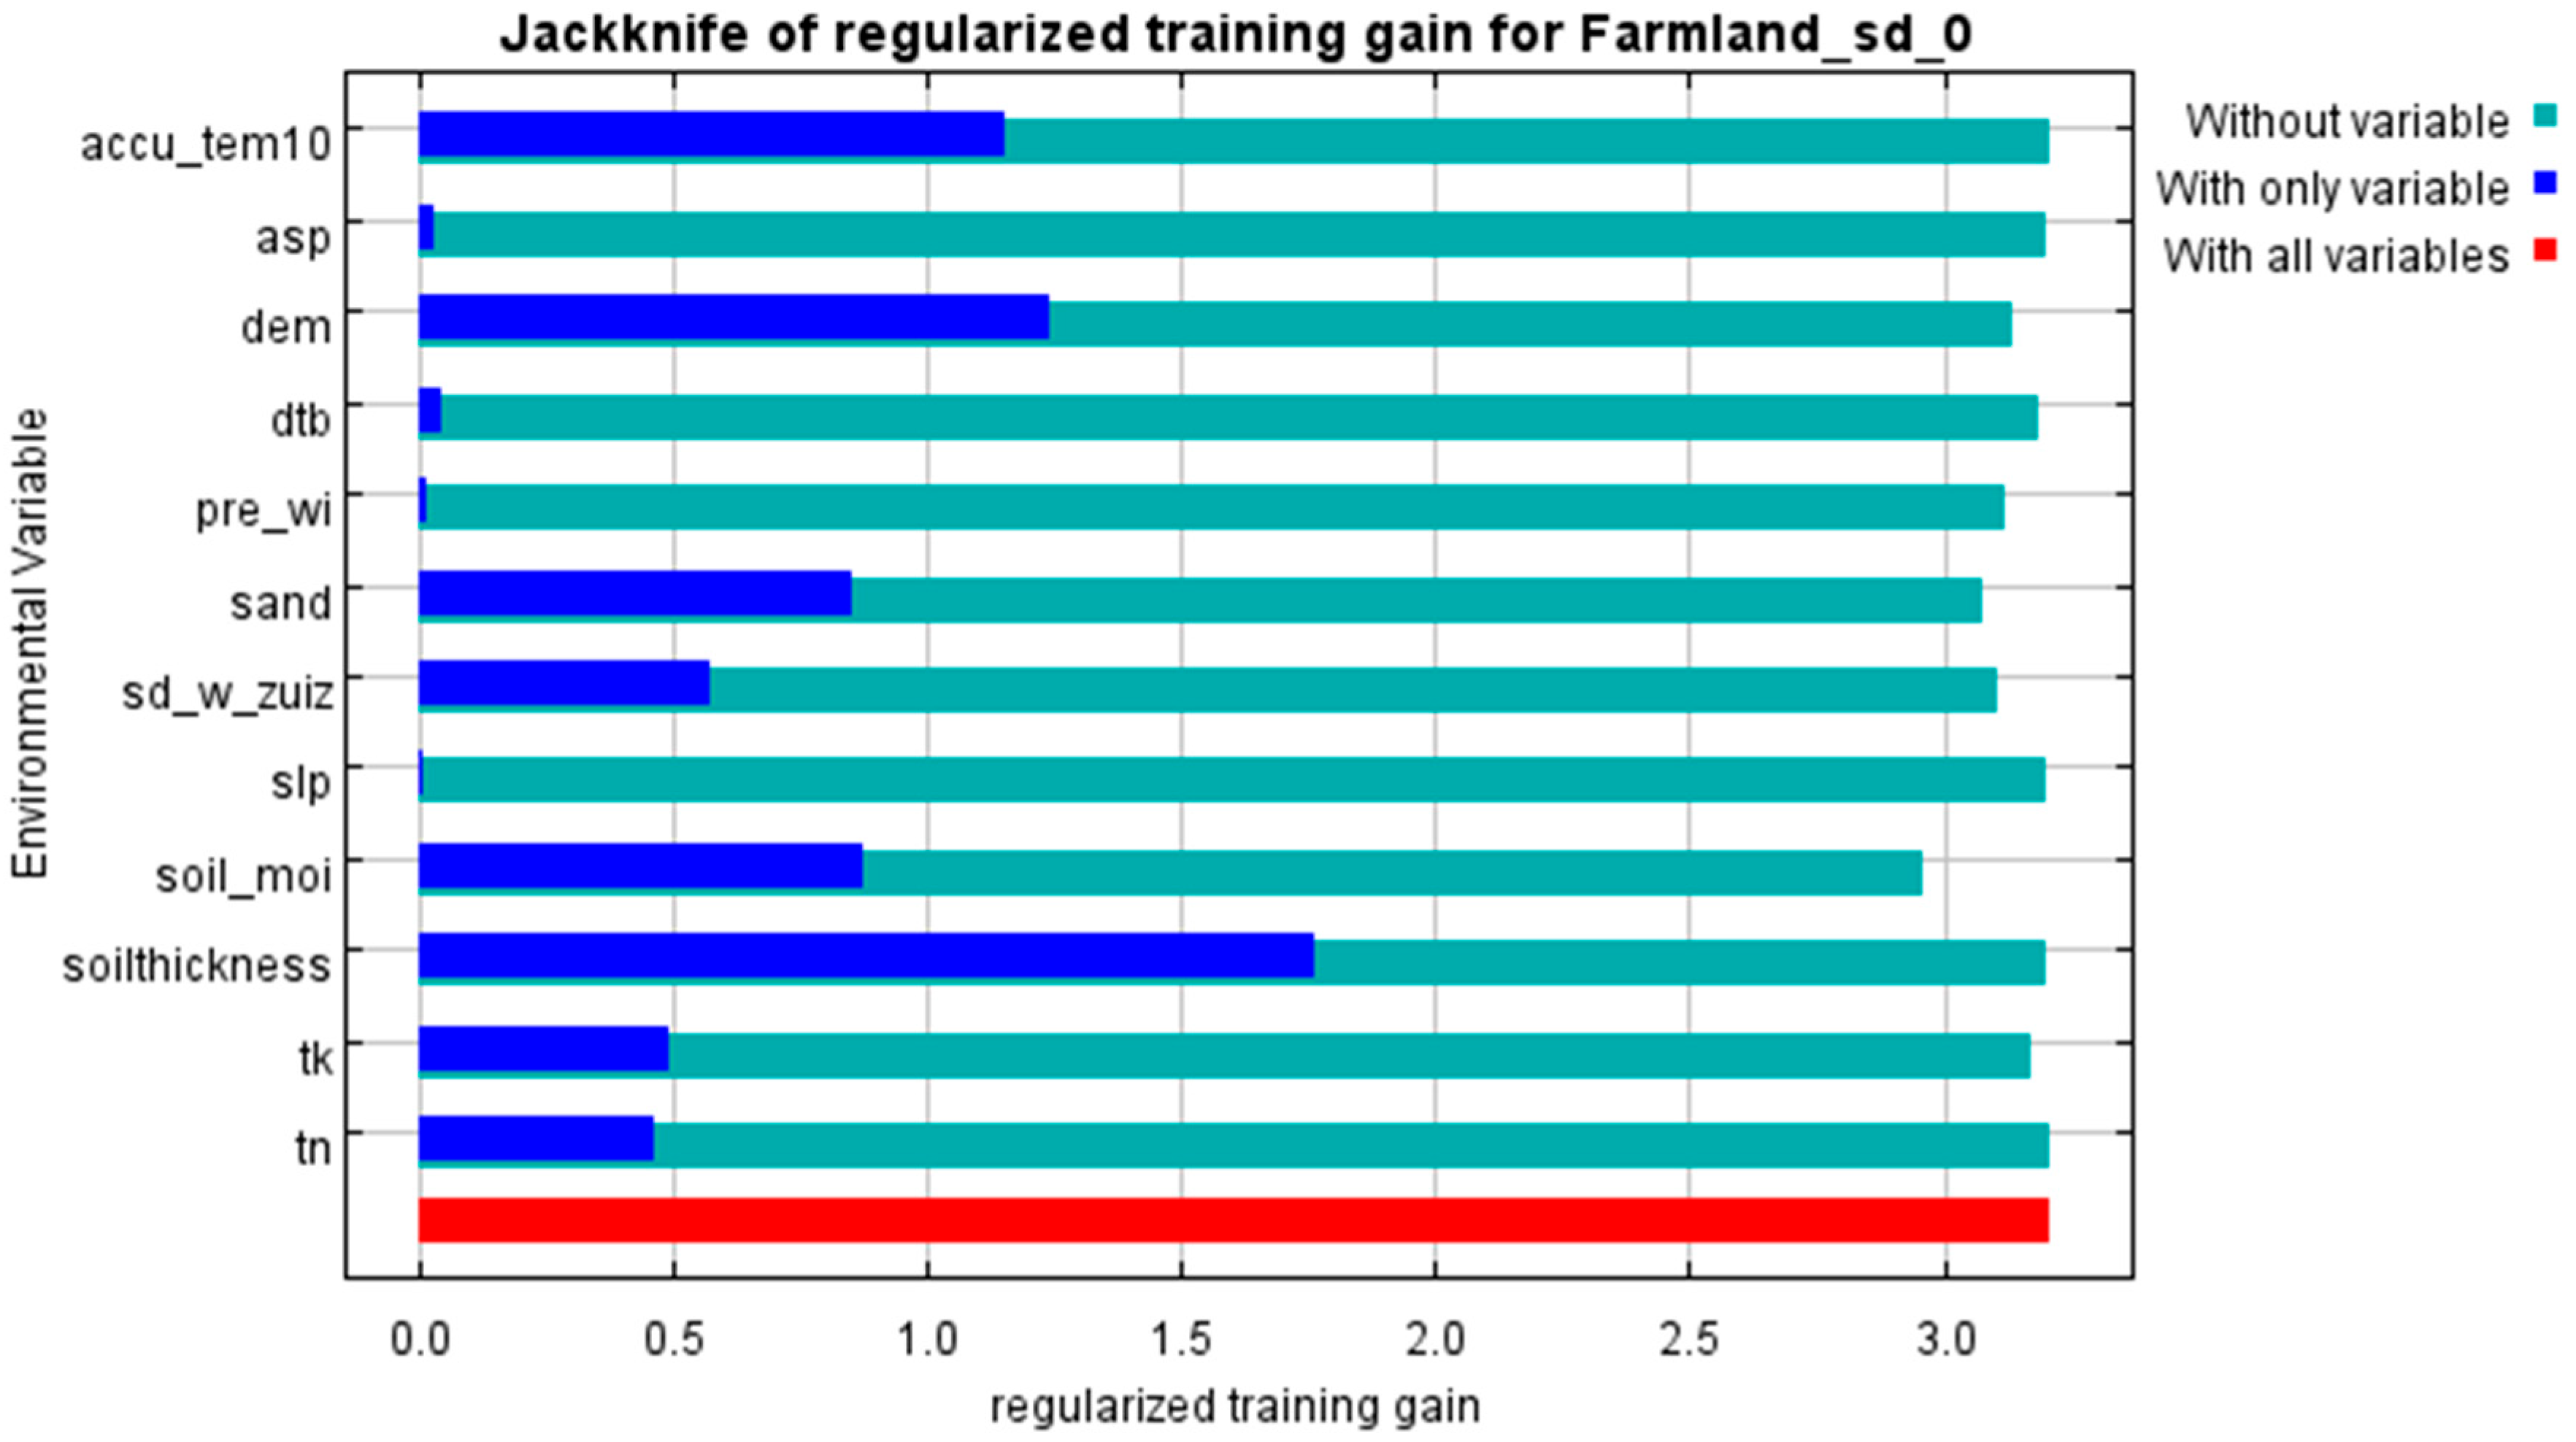
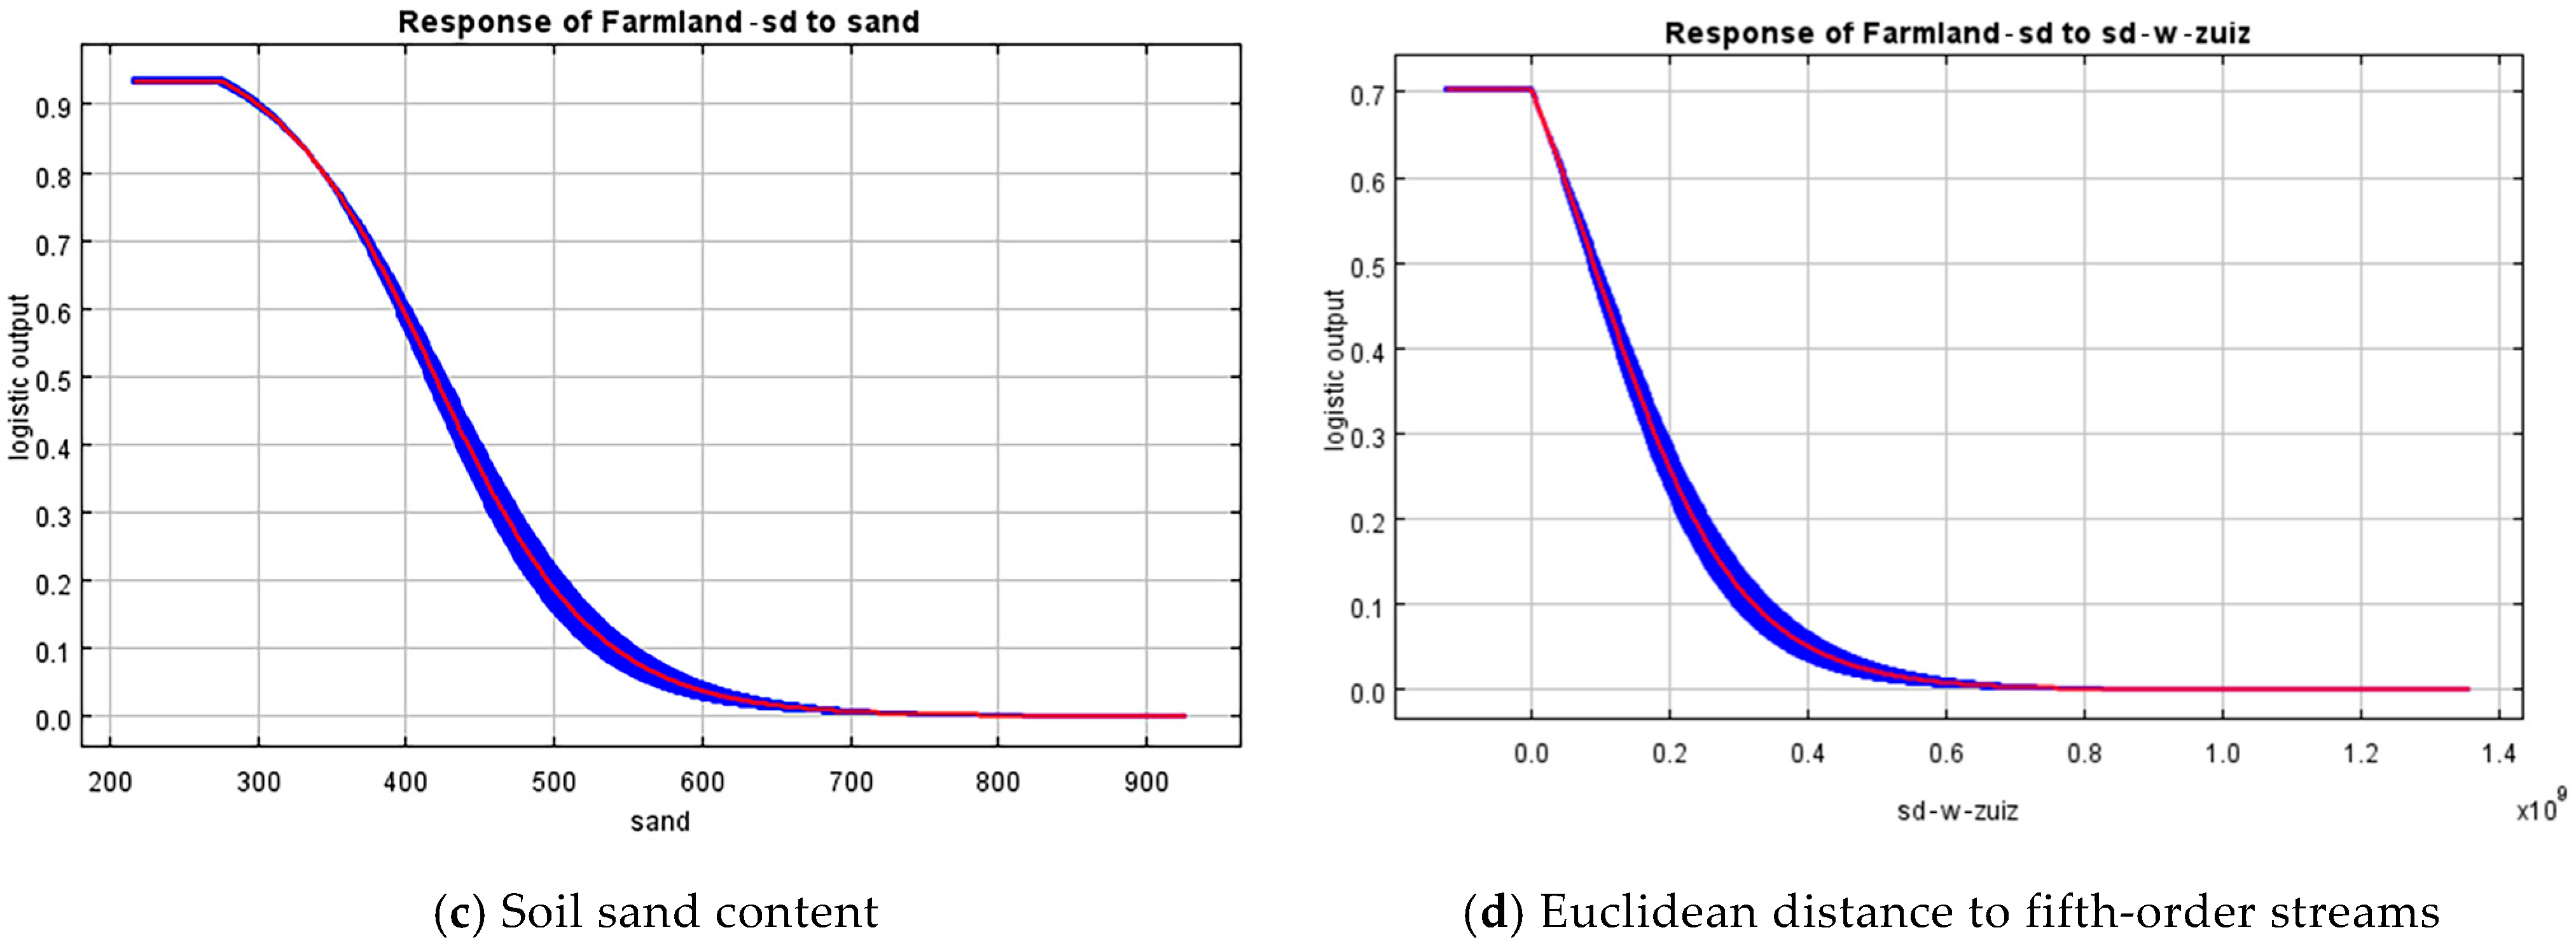
3.4. Analysis of Key Environmental Factors Influencing Cultivated Land Suitability in the Mountainous Region

Similarly, the jackknife test results based on training data from the mountainous region (Figure 8) indicate that the environmental variables yielding the highest gain when used in isolation are the soil thickness (soilthickness), elevation (dem), accumulated temperature above 10 °C (accu_tem10), and soil sand content (sand). This suggests that these variables contain unique information not captured by other environmental factors. At the same time, the greatest reduction in model gain occurred when the soil moisture (soil_moi) was excluded, indicating that soil moisture provides the most useful information for analyzing cultivated land suitability in the mountainous region.
According to the contribution rates and permutation importance in Table 4, an accumulated temperature above 10 °C (accu_tem10), the soil thickness (soilthickness), the soil sand content (sand), and the Euclidean distance to fifth-order river systems (sd_w_zuiz) contribute 40.8%, 18.6%, 17.9%, and 10.7%, respectively, with a cumulative contribution of 88%. Their corresponding permutation importances are 0.7%, 0.5%, 16%, and 6.6%, totaling 23.8%. These results indicate that the above four environmental factors are the dominant variables influencing the spatial distribution of cultivated land suitability in the mountainous region.
The single-factor response curves (Figure 9) show that an accumulated temperature above 10 °C (accu_tem10) has a positive correlation with cultivated land suitability (Figure 9a). When accu_tem10 is below 0 °C, the suitability is nearly zero, and the suitability increases with higher temperatures. The suitability reaches its peak when accu_tem10 reaches 3700 °C, representing optimal conditions. The land is moderately suitable (LOV > 0.5) when accu_tem10 exceeds 2300 °C, and unsuitable (LOV < 0.2) when it is below 1200 °C. Similarly to accu_tem10, the cultivated land suitability in the mountainous region increases with soil thickness (soilthickness) until reaching a plateau at the optimal value (Figure 9b). When the soil thickness exceeds 80 cm, the land becomes moderately suitable (LOV > 0.2), and reaches peak suitability at 133.2 cm. In contrast, the cultivated land suitability decreases with increasing soil sand content (sand) and Euclidean distance to fifth-order rivers (sd_w_zuiz). As shown in Figure 9c, the land is suitable (LOV > 0.5) when the sand content is below 43.32%, and becomes unsuitable (LOV < 0.2) when it exceeds 48.34%. As for the distance to water systems, when the distance is less than 0.23 × 10⁹ m, the land is moderately suitable (LOV > 0.2), with suitability increasing the closer the land is to the water system (Figure 9d).

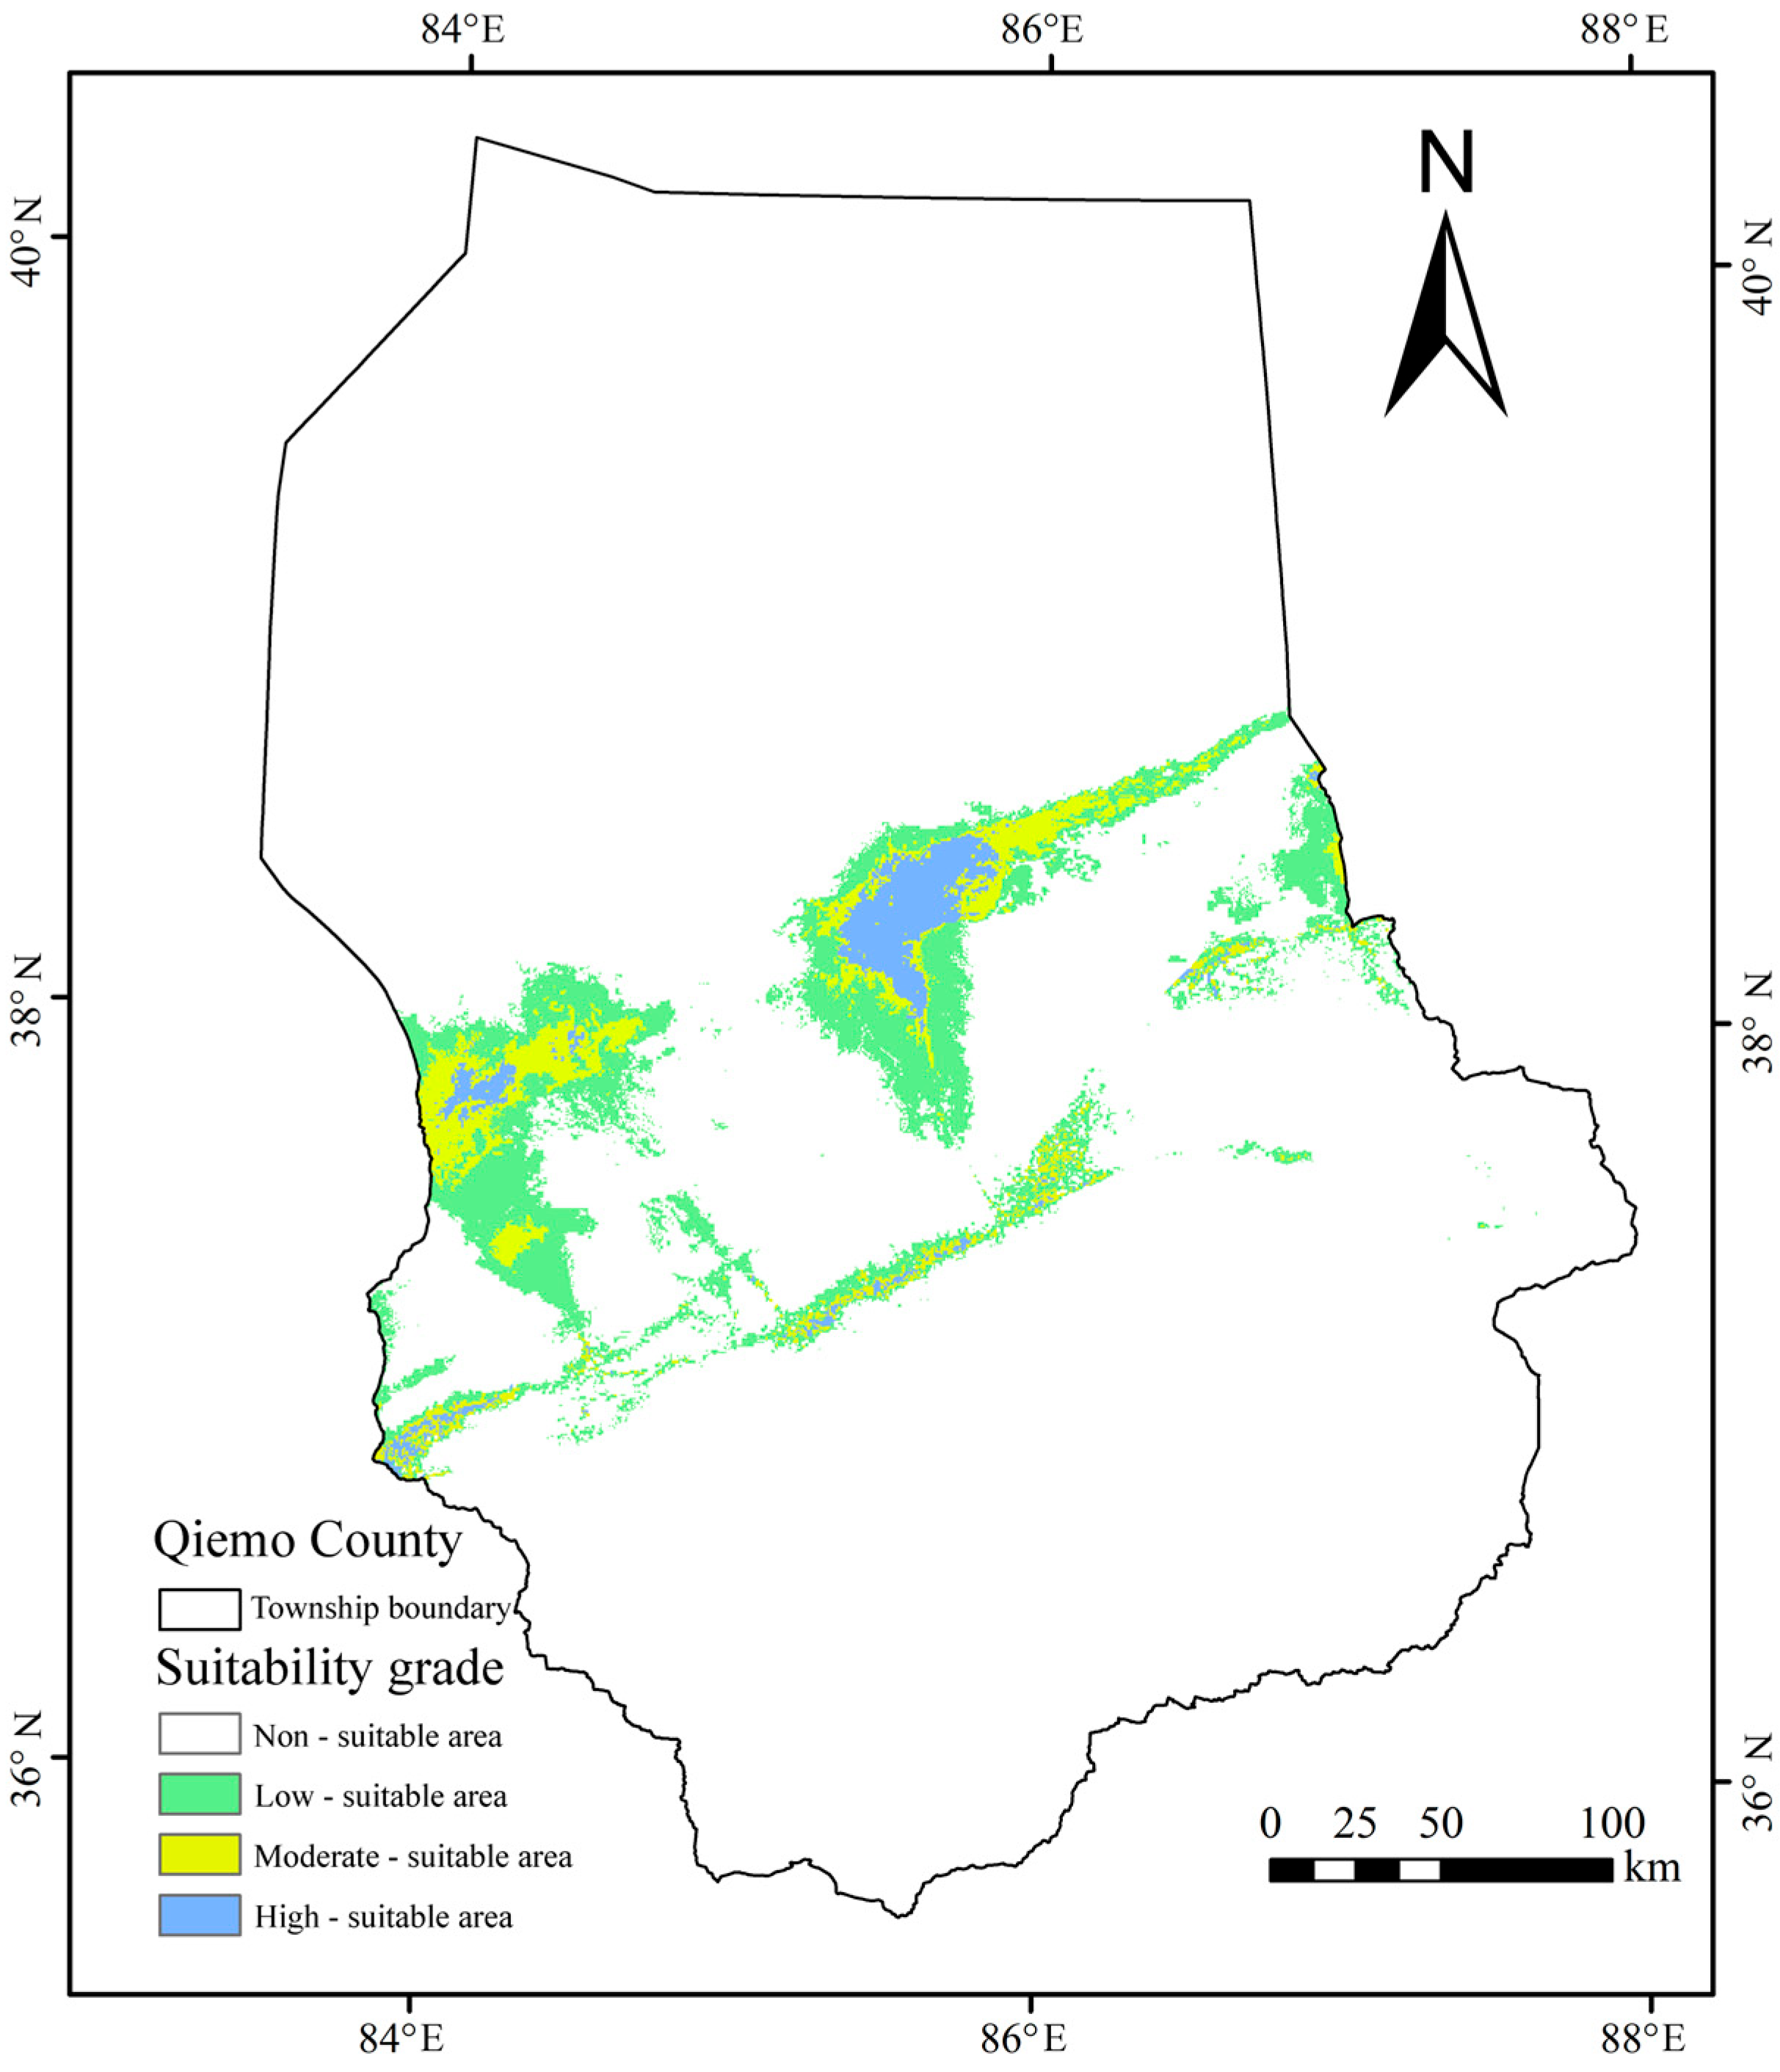
3.5. Potential Distribution of Suitable Cultivated Land in the Mountainous Region

The total area of the mountainous region is approximately 56,580 km2. Suitable cultivated land areas are mainly concentrated in the southern part of the region, with scattered distributions in the southwest and southeast. Specifically, the low-suitability area covers 1700 km2, accounting for about 3% of the total area; the medium-suitability area covers 560 km2, approximately 1%; and the high-suitability area covers 230 km2, accounting for around 0.4% of the total area (Figure 7).

4. Discussion

4.1. Dominant Environmental Factors Affecting Potential Cultivated Land Suitability

This study assessed the potential suitability of cultivated land in Qiemo County using the MaxEnt model. The model optimization results indicate that a specific feature combination (FC set to L) and regularization multiplier (RM = 0.1) provide robust predictive performance, with an omission rate of 4.1% and a low delta AICc, suggesting strong model accuracy. The AUC values for the mountainous and plain regions were 0.987 and 0.940, respectively—substantially higher than the random prediction level (AUC = 0.5)—demonstrating the reliability of the model results. The analysis identified the soil sand content, soil thickness, distance to fifth-order river systems, and accumulated temperature above 10 °C as key factors influencing cultivated land suitability. In the plain region, the soil sand content had the greatest impact: when it exceeded 58.3%, the area was deemed unsuitable for cultivation. This may be due to the influence of the sand content on the soil physical structure and water retention capacity, which, in turn, affects the soil thickness and erosion potential [39]. A study on land use landscape pattern changes and their main driving factors in Alxa Left Banner found that the soil sand content and distance to water systems contributed significantly to cultivated land variation, classifying them as accessibility-related drivers—consistent with this study’s findings [40]. Increased sand content enhances soil drainage but reduces the water-holding capacity, potentially leading to increased erosion and reduced soil thickness [41]. Moreover, the soil sand content may also influence the proximity of cultivated land to water sources. In areas with a high sand content, enhanced drainage can result in rapid water loss, increasing the dependence on nearby water sources.
In arid regions such as southern Xinjiang, sandy soils often require more frequent irrigation to sustain crop growth, thereby intensifying water dependency. In the mountainous region, an accumulated temperature above 10 °C had the most significant impact. When this value exceeded 2300 °C, land became moderately suitable for cultivation, with peak suitability occurring around 3700 °C. Research on cotton-growing regions in Hotan, Xinjiang, showed a strong relationship between cotton yield potential and various temperature metrics, supporting the relevance of accumulated temperature to crop distribution—aligned with the results of this study [42]. The accumulated temperature reflects the thermal conditions of a region and significantly affects crop growth cycles and soil microbial activity [43]. Excessively high temperatures can accelerate soil moisture evaporation, affecting soil humidity and stability, thereby influencing crop growth. Conversely, low temperatures may slow plant growth, potentially reducing the soil thickness and cultivated land suitability [44]. Furthermore, higher accumulated temperatures may increase evaporation, especially in arid regions, raising the need for irrigation to maintain soil moisture levels [45]. As such, regions with higher accumulated temperatures may require a greater proximity to water sources to ensure adequate crop water supply.

4.2. Limitations and Prospects

The MaxEnt model has been widely applied in predicting the potential distribution of species [46]. Its default parameters were determined based on optimal values obtained by the original developers through testing datasets of 266 species across six geographic regions. However, uncritically applying these default parameters may lead to overfitting, thereby reducing the accuracy of the model’s predictions [47]. An excessive number of variables can also introduce multicollinearity issues, weakening the model’s fit and interpretability [48].
Therefore, this study employed R language-based optimization to adjust model parameters and select appropriate environmental variables for simulation, achieving better prediction results than the default settings. The research focused on analyzing the impact of key environmental factors under natural conditions on the potential spatial distribution of suitable cultivated land. The optimized MaxEnt model used in this study effectively predicted the potential suitable areas for cultivation, which largely corresponded to the actual geographic distribution.
However, this study still has certain limitations. In addition to average climatic conditions, extreme weather events—such as heatwaves and droughts—can also severely impact the arable land suitability [49]. Heatwaves may lead to crop dehydration, soil cracking, and reduced microbial activity, while droughts can cause water shortages and irrigation failures [50]. These factors pose significant risks to the stability of arable land systems, especially in arid regions. Due to the current lack of high-resolution extreme climate datasets, such variables were not included in the model prediction. Future research could consider incorporating indices such as the Standardized Precipitation Evapotranspiration Index (SPEI) and the Heat Wave Magnitude Index (HWMI), alongside climate change scenarios, to evaluate the vulnerability and adaptive capacity of arable land systems under extreme climatic conditions. This would enhance both the adaptability of the model and its relevance for policy-making.

5. Conclusions

This study employed the Maximum Entropy (MaxEnt) model to systematically assess the potential suitability of cultivated land in Qiemo County, a representative area of southern Xinjiang. By integrating key environmental factors such as climate, soil, hydrology, and topography, the following conclusions were drawn:
(1)
The optimized MaxEnt model achieved AUC values of 0.987 and 0.940 for mountainous and plain areas, respectively, which are significantly higher than random prediction levels. This indicates that the model possesses a high prediction accuracy and reliability.
(2)
The analysis revealed that the soil sand content, soil thickness, distance to fifth-order rivers, and accumulated temperature above 10 °C are the key factors affecting the suitability of cultivated land in Qiemo County. In the plain areas, the soil sand content had the greatest impact, with a suitable range of 23.3–31.6%. In the mountainous areas, accumulated temperature had the most significant influence, with a suitable range of 2300–3700 °C. Other suitable ranges in the plain areas include soil thickness > 76 cm, distance to water bodies < 0.14 × 10⁵ m, and accumulated temperature > 10 °C < 3727 °C. For mountainous areas, the suitable ranges are soil thickness > 80 cm, distance to rivers < 0.23 × 10⁹ m, and soil sand content < 43.32%.
(3)
Suitable areas in the plains are mainly distributed in the northern part of Qiemo County, with a total area of approximately 8.202 × 10⁴ km2, of which highly suitable areas account for about 1.57%. Suitable areas in the mountainous region are primarily located in the south, totaling approximately 5.658 × 10⁴ km2, with highly suitable areas accounting for about 0.4%. It is recommended that cultivated land development be prioritized in environmentally suitable areas such as plain regions with a sand content < 58.3% and mountainous regions with accumulated temperature > 2300 °C.
(4)
Future research should further incorporate human activity factors such as land use changes, socio-economic conditions, and irrigation infrastructure to build a more comprehensive land suitability evaluation model, in order to improve the practical adaptability of predictions and their policy guidance value. Additionally, it is recommended to combine scenario simulation methods to assess the dynamic impact of climate change on the spatial pattern of land suitability, thus providing scientific support for the sustainable use of land resources and agricultural layout optimization in southern Xinjiang.

Author Contributions

All authors contributed extensively to this work. Conceptualization, Y.T. and X.L. (Xinping Luo); methodology, Y.T. and R.L.; software, Y.T. and X.L. (Xiaohuang Liu); investigation, C.L.; resources, C.L. and H.L.; data curation, Y.T. and C.W.; writing—original draft preparation, Y.T.; writing—review and editing, X.L. (Xiaohuang Liu), R.L., and C.W.; supervision, C.L.; formal analysis, P.Z.; project administration, X.L. (Xiaohuang Liu); funding acquisition, X.L. (Xiaohuang Liu), H.Z., H.L., X.L. (Xinping Luo), H.Z., and C.W. All authors have read and agreed to the published version of the manuscript.

Funding

This research was funded by the Research Project on Integrated Technology System for Natural Resources Observation and Monitoring (Grant No. DD20230514, Source: Second-level Special Project of Geological Survey); the Key Technology Research on Investigation, Monitoring and Analysis of Farmland and Reserve Resources in the Important Source Area of the Tarim River (Grant No. 2024ZRBSHZ013, Source: Ministry–Province Cooperative Project); the Key Technology Research on Monitoring, Analysis and Evaluation of Uncultivated Farmland in Xinjiang (Grant No. 2024ZRSBHZ049, Source: Ministry–Province Cooperative Project); the Comprehensive Full—parameter Observation Construction of Typical Ecosystems in Xinjiang (Grant No. 2021xjkk140104, Source: Sub-topic of the Third Comprehensive Scientific Expedition to Xinjiang under the National Special Project on Basic Scientific Resources Investigation); the Departmental Budget of the Xinjiang Natural Resources Department “Implementation Assessment of Farmland Reserve Resources Development and Utilization Plan and Preliminary Feasibility Study of National Large-scale Farmland Increase Projects” and the Department Budget Project of the Natural Resources Department of Xinjiang Uygur Autonomous Region “Construction of Natural Resources Monitoring and Early Warning System” (No. ZSDYS2024002).

Institutional Review Board Statement

Not applicable.

Data Availability Statement

All data generated or analyzed during this study are included in this published article.

Acknowledgments

We would like to express our heartfelt gratitude to all those who contributed to the completion of this manuscript. Their support, guidance, and encouragement have been invaluable throughout this research process.

Conflicts of Interest

The authors declare no conflicts of interest.

References

  1. Xu, Y.; Yang, H.; Duan, J. Recommendations for the overall layout adjustment of China’s agricultural regions during the 15th Five-Year Plan period. Bull. Chin. Acad. Sci. 2024, 39, 663–675. [Google Scholar]
  2. Zhao, A.; Bai, Y. The dialectical relationship between “storing grain in the land” and “storing grain in grass” from the perspective of agricultural ethics—Also on Chapter II “Cultivated Land Protection” of the Food Security Guarantee Law. Acta Prataculturae Sin. 2024, 33, 183–193. [Google Scholar]
  3. Zhou, Z.; Liu, X.; Liu, R.; Liu, J.; Liu, W.; Yang, Q.; Luo, X.; Wang, R.; Xing, L.; Zhao, H.; et al. Sugarcane Distribution Simulation and Climate Change Impact Analysis in China. Agriculture 2025, 15, 491. [Google Scholar] [CrossRef]
  4. Wu, H.; Meng, Y.; Huang, H.; Chen, W. Spatiotemporal coupling characteristics of net carbon sink and agricultural production from cultivated land use in China. J. Soil Water Conserv. 2022, 36, 360–368+376. [Google Scholar]
  5. Wang, P.; Zhang, L.; Lu, R. Evolution characteristics and mechanisms of ecological efficiency of cultivated land use under the “border–grain–ecology” security perspective: A case study of the China–Vietnam border region. Acta Ecol. Sin. 2024, 44, 4637–4649. [Google Scholar]
  6. Yang, Q.; Ji, C.; Li, N.; Lin, H.; Li, M.; Li, H.; Heng, S.; Liang, J. Analysis of the Distribution Pattern of Asparagus in China Under Climate Change Based on a Parameter-Optimized MaxEnt Model. Agriculture 2025, 15, 320. [Google Scholar] [CrossRef]
  7. Ali, S.; Makanda, T.A.; Umair, M.; Ni, J. MaxEnt model strategies to studying current and future potential land suitability dynamics of wheat, soybean and rice cultivation under climatic change scenarios in East Asia. PLoS ONE 2023, 18, e0296182. [Google Scholar] [CrossRef]
  8. Li, X.L.; Wu, K.N.; Hao, S.H.; Yue, Z.; Ran, Z.; Ma, J.L. Mapping cropland suitability in China using optimized MaxEnt model. Field Crops Res. 2023, 302, 109064, ISSN 0378-4290. [Google Scholar] [CrossRef]
  9. Yang, S.L.; Wang, H.M.; Tong, J.; Bai, Y.; Alatalo, J.M.; Liu, G.; Fang, Z.; Zhang, F. Impacts of environment and human activity on grid-scale land cropping suitability and optimization of planting structure, measured based on the MaxEnt model. Sci. Total Environ. 2022, 836, 155356, ISSN 0048-9697. [Google Scholar] [CrossRef]
  10. Gan, T.; Qian, Q.; Liu, Z.; Xu, D. Simulation of Suitable Distribution Areas of Magnolia officinalis in China Based on the MaxEnt Model and Analysis of Key Environmental Variables. Agriculture 2024, 14, 2303. [Google Scholar] [CrossRef]
  11. Meng, M.; Yang, Y.; Yang, L. Coupling relationship between the development of reserve cultivated land resources and the ecological environment in Xinjiang. J. Zhejiang Agric. Sci. 2020, 32, 543–551. [Google Scholar]
  12. Li, Y.; Fan, J.; Guan, X.; Liu, H.; Yin, F. Current situation and policy recommendations for agricultural water-saving development in Xinjiang irrigation areas. J. Huazhong Agric. Univ. 2024, 43, 93–98. [Google Scholar]
  13. Chen, X.; Yang, J.; Liu, C.; Hu, S. Soil salinization in Xinjiang under large-scale agriculture and its regulation strategies. Soils 2007, 03, 347–353. [Google Scholar]
  14. Zhang, Y.; Mu, Z.; Tian, X. Spatial equilibrium evaluation of water resources in Xinjiang. Hydropower Energy Sci. 2023, 41, 56–60. [Google Scholar]
  15. Zhao, Y.; Pan, Y.; Su, J.; Zhang, Z. A review of green and eco-friendly sand control technologies in arid areas of China. J. Desert Res. 2021, 41, 195–202. [Google Scholar]
  16. Zhang, F.; Zhou, J.; Zeng, Y.; Chen, Y.; Wang, S. Characteristics and formation causes of four rare earth elements in oasis soil of Qiemo County, Xinjiang. J. Arid Land Resour. Environ. 2021, 35, 135–142. [Google Scholar]
  17. Gong, Q.; Li, S.; Zheng, W.; Tang, Z. Morphological characteristics of four dwarf plants during the non-growing season in the Taklimakan Desert. Grassl. Sci. 2025, 14, 1–18. [Google Scholar]
  18. Zhao, X.; Liu, X.; Liu, J.; Li, H.; Zhang, W. Cultivated land suitability evaluation in Xinjiang based on multiple environmental elements. Mod. Geol. 2024, 38, 718–733. [Google Scholar]
  19. Zhu, M.; Zhao, K.; Shao, Z.; Li, L. Spatiotemporal changes in wetland carbon storage in the Guangdong–Hong Kong–Macao Greater Bay Area based on the InVEST model. Environ. Sci. 2025, 46, 1–19. [Google Scholar]
  20. Qing, J.; Xu, C.; Yang, B.; Yang, Z.; Qi, D.; Yang, X.; Gu, X.; Dai, Q. Corridor planning for giant pandas in the Xiaoxiangling Mountains. Acta Ecol. Sin. 2016, 36, 1125–1133. [Google Scholar]
  21. Jia, L.; Yu, K.; Li, Z.; Li, P.; Xu, G.; Zhao, B.; Gao, B.; Yang, Z. Spatiotemporal variation in potential evapotranspiration and attribution analysis of runoff in typical basins of the Qinling Mountains. Trans. Chin. Soc. Agric. Eng. 2025, 40, 59–71. [Google Scholar]
  22. Ma, Q.; Li, Z.; Dong, F. Construction of a digital twin flood control model for a river basin: A case study of the “23.7” flood in the Ziya River. J. Hydraul. Eng. 2025, 6, 1–12. [Google Scholar]
  23. Chen, C.; Yang, X.; Chen, J.; Wang, Q.; Liu, T. Construction and analysis of county-level water security patterns in northern Guangdong from a comprehensive perspective. J. Environ. Eng. Technol. 2023, 13, 1931–1940. [Google Scholar]
  24. Chen, H.; Yao, S.; Peng, W.; Peng, W.; Li, W.; Zhang, W.; Wang, Z.; Liu, X.; Zhao, M.; Sun, L.; et al. Spatial coupling of supply-demand flows of water purification ecosystem services for ecological compensation: A case study of the Yangtze River Delta Green Ecological Integration Demonstration Zone. Acta Ecol. Sin. 2025, 11, 1–13. [Google Scholar]
  25. Yan, F.; Shangguan, W.; Zhang, J. Depth-to-bedrock map of China at a spatial resolution of 100 meters. Sci. Data 2020, 7, 2. [Google Scholar] [CrossRef]
  26. Qiao, S.; Wang, Y.; Chen, Y.; Zhao, Y.; Zeng, W.; Jin, S.; Gao, M. Impact of climate change on the distribution and future trends of five species of Litsea. Acta Ecol. Sin. 2025, 7, 1–20. [Google Scholar]
  27. Phillips, S.J.; Anderson, R.P.; Dudík, M. Opening the black box: An open-source release of MaxEnt. Ecography 2017, 40, 887–893. [Google Scholar] [CrossRef]
  28. Warren, D.L.; Seifert, S.N. Ecological niche modeling in MaxEnt: The importance of model complexity and the performance of model selection criteria. Ecol. Appl. 2011, 21, 335–342. [Google Scholar] [CrossRef]
  29. Li, X.; Zhang, L.; Bai, Q.; Ma, S.; Yang, H.; Pan, Y.; Deng, Z. Impact of climate change on the potential suitable habitat of Erigeron breviscapus in China. J. Zhejiang Agric. Sci. 2024, 36, 1844–1855. [Google Scholar]
  30. Shao, Z.; Zhou, W.; Yang, F.; Li, F.; Zhou, X. Prediction of potential suitable habitats of Gynostemma pentaphyllum based on the MaxEnt model. J. South. Agric. 2021, 52, 1124–1131. [Google Scholar]
  31. Liu, L.; Xiao, H.; Yang, Y. Prediction of suitable habitats for Rheum tanguticum under climate change scenarios in China based on MaxEnt and GIS. Chin. J. Appl. Ecol. 2023, 34, 1969–1978. [Google Scholar]
  32. Li, G.; Wang, X.; Zhang, J.; Hu, F.; Zang, H.; Gao, T.; Li, Y.; Huang, M. Prediction of the Potentially Suitable Areas of Sesame in China Under Climate Change Scenarios Using MaxEnt Model. Agriculture 2024, 14, 2090. [Google Scholar] [CrossRef]
  33. Li, X.; Lu, Y.; Liu, X. Simulation and prediction of suitable habitat of Sophora alopecuroides based on MaxEnt model. Chin. J. Ecol. 2021, 40, 17–24. [Google Scholar]
  34. Jin, Z.; Yu, W.; Zhao, H.; Xian, X.; Jing, K.; Yang, N.; Lu, X.; Liu, W. Potential Global Distribution of Invasive Alien Species, Anthonomus grandis Boheman, under Current and Future Climate Using Optimal MaxEnt Model. Agriculture 2022, 12, 1759. [Google Scholar] [CrossRef]
  35. Liu, Y.; Li, R.; Han, Y. Prediction of suitable distribution area of Ceratoides latens under future climate change scenarios based on MaxEnt model. Pratacult. Sci. 2024, 41, 1113–1122. [Google Scholar]
  36. Liu, R.; Liu, Q.; Su, X. Prediction of suitable distribution areas of Glycyrrhiza uralensis based on MaxEnt model and GIS technology. China Pharm. 2023, 34, 1824–1830. [Google Scholar]
  37. Wang, Y.; Wang, D.; Liu, Y. Prediction of suitable distribution areas of Thymus quinquecostatus based on MaxEnt model. Acta Bot. Boreali-Occident. Sin. 2023, 43, 1343–1353. [Google Scholar]
  38. Gong, Y.; He, H.; Liang, M. Prediction of suitable distribution of Salvia miltiorrhiza based on MaxEnt and GIS. Chin. Agric. Sci. Bull. 2022, 38, 99–107. [Google Scholar]
  39. Bai, M.; Fan, W.; Liu, J. Prediction of suitable distribution area of Codonopsis pilosula under different climate change scenarios in Gansu Province. Mod. Chin. Med. 2022, 24, 2071–2077. [Google Scholar]
  40. Yang, B.; Yang, H.; Liu, Y. Suitability evaluation of cultivated land in Gansu Province based on multiple models. J. Arid Land Resour. Environ. 2024, 38, 94–100. [Google Scholar]
  41. Xu, Y.; Bai, S.; Zhang, D. Spatial and temporal pattern evolution and driving mechanisms of cultivated land multifunctionality in the Loess Plateau. China Land Sci. 2023, 37, 1–13. [Google Scholar]
  42. Zhang, Y.; Zhang, L.; Zhang, J. Study on ecological security pattern in urban fringe areas based on InVEST and MCR models: A case study of Jingmen City. Res. Soil Water Conserv. 2023, 30, 248–258. [Google Scholar]
  43. He, Y.; Zhang, Y.; Yang, H. Identifying ecological sources and constructing ecological security pattern in the Pearl River Delta. Acta Ecol. Sin. 2023, 43, 6721–6731. [Google Scholar]
  44. Zhang, X.; Du, X.; Sun, Y. Evaluation of ecosystem service function of Xinyang City based on InVEST model. Environ. Eng. 2024, 42, 222–229. [Google Scholar]
  45. Wang, H.; Yang, Y.; Jiang, Z. Spatial and temporal evolution characteristics and influencing factors of ecosystem service value in the Yellow River Basin based on InVEST model. Acta Ecol. Sin. 2023, 43, 6162–6174. [Google Scholar]
  46. Zhang, J.; Zhang, L.; Wang, Y. Assessment of carbon storage function of woodland ecosystems in Zhangjiakou City based on InVEST model. J. Beijing For. Univ. 2024, 46, 123–132. [Google Scholar]
  47. Zhao, J.; Zhang, Y.; Zhang, W. Land use change and ecosystem service value response in Shihezi reclamation area based on InVEST model. Arid Land Geogr. 2023, 46, 1220–1231. [Google Scholar]
  48. He, H.; Liu, S.; Liu, G. Prediction of the suitable distribution of Elaphurus davidianus under future climate change in China. Acta Ecol. Sin. 2023, 43, 2962–2971. [Google Scholar]
  49. Diwen, D.; Hui, T.; Gang, D. Study on Population and Farmland Exposure to Heat Waves in Xinjiang. Trans. Chin. Soc. Agric. Eng. 2022, 38, 288–295. [Google Scholar]
  50. Hao, Z.; Ling, H.; Lilil, C. Water Supply and Demand Evaluation and Optimization of Cropping Structure in Farmland in the Hengshao Arid Corridor. Resour. Sci. 2024, 46, 1032–1044. [Google Scholar]
Figure 1. Schematic diagram of research area zoning.
Agriculture 15 01498 g001
Figure 2. Spatial autocorrelation of 27 environmental variables. tp: total phosphorus in soil; accu_tem0: annual accumulated temperature > 0 °C; accu_tem10: annual accumulated temperature > 10 °C; aridity: aridity index; asp: aspect; ca: exchangeable calcium (Ca2+); cec: cation exchange capacity; clay: clay content in soil; dem: elevation; dtb: distance to bedrock; gwd: groundwater depth; ph: soil pH; pre_avg: annual average precipitation; pre_su: summer precipitation (June–August); pre_wi: winter precipitation (December–February); sand: sand content in soil; slp: slope; soc: soil organic carbon; soil_moi: soil moisture; soilthickness: soil thickness; tem_avg: annual average temperature; tem_su: summer average temperature (June–August); tem_wi: winter average temperature (December–February); tk: total potassium in soil; tn: total nitrogen in soil.
Agriculture 15 01498 g002
Figure 3. Optimal model parameter combination selection diagram.
Agriculture 15 01498 g003
Figure 4. Receiver operating characteristic curve (ROC) and area under the curve (AUC) in plain areas (a) and mountainous areas (b).
Agriculture 15 01498 g004
Figure 5. Results of jackknife test for farmland in plain areas.
Agriculture 15 01498 g005
Figure 6. Response curve between the top 4 environmental factors ranked by importance and the suitability of farmland in plain areas.
Agriculture 15 01498 g006
Figure 7. Distribution map of suitable farmland areas in Qiemo County.
Agriculture 15 01498 g007
Figure 8. Results of suitability knife cutting test for cultivated land in mountainous areas.
Agriculture 15 01498 g008
Figure 9. Response curve between the top 4 environmental factors ranked by importance and the suitability of cultivated land in mountainous areas.
Agriculture 15 01498 g009aAgriculture 15 01498 g009b
Table 1. Contribution rate of environmental variables.
Cultivated Land TypeArea (km2)Number of Grid Points Used in the Model
Cultivated land in plain region82,019327,464
Cultivated land in mountainous region56,580225,899
Table 2. MaxEnt model’s required environment variables.
Variable TypeVariable NameDescriptionSpatial
Resolution
MinMaxMedian
TemperatureTem_AvgAnnual average temperature (°C)1 km−3.212.68.4
Tem_SuSummer average temperature (June–August) (°C)1 km10.429.122.8
Tem_WiWinter average temperature (December–February) (°C)1 km−19.50.4−10.2
Accu_Tem0Annual accumulated temperature > 0 °C (°C)1 km32052503780
Accu_Tem10Annual accumulated temperature > 10 °C (°C)1 km048002980
Tem_Days10Number of stable days > 10 °C per year (d)1 km0214150
PrecipitationPre_AvgAnnual average precipitation (mm)1 km4.5145.255.3
Pre_SuSummer average precipitation (June–August) (mm)1 km1.265.023.8
Pre_WiWinter average precipitation (December–February) (mm)1 km0.112.63.4
AridityAridity index1 km12.184.633.7
TopographyDEMElevation (m)30 m121158602580
SLPSlope (°)0.247.35.7
ASPAspect (°)0360185
HydrologyWatEuclidean distance to level-5 river network (m)1 km017,5006200
GW_DepthGroundwater depth (m)1 km1.222.39.7
SoilSoil_MoiSoil moisture (m3/m3)1 km0.020.180.07
SoilThicknessSoil thickness (cm)1 km2016095
SandSand content (%)1 km22.592.868.3
ClayClay content (%)1 km3.231.614.8
CECCation exchange capacity (me/hg)1 km4.832.115.7
pHSoil pH1 km6.19.27.8
SOCSoil organic carbon (g/hg)1 km0.182.91.1
CaExchangeable Ca2+ (me/hg)1 km0.514.86.2
TNTotal nitrogen (g/hg)1 km0.030.240.11
TPTotal phosphorus (g/hg)1 km0.020.190.08
TKTotal potassium (g/hg)1 km0.382.61.3
GeologyDTBDistance to bedrock (cm)100 m0.611.84.2
Table 3. Importance of dominant environmental variables in plain areas.
VariableContribution Rate (%)Permutation Importance (%)
SoilThickness68.51.9
Sand17.40.4
Wat7.074.9
Accu_Tem102.29.1
Pre_Avg1.76.2
Pre_Wi1.36.2
TN1.30.0
SLP0.20.6
CEC0.10.3
Tem_Wi0.10.3
SOC0.10.2
Soil_Moi0.00.0
pH0.00.0
Ca0.00.0
Table 4. Importance of dominant environmental variables in mountainous areas.
VariableContribution Rate (%)Permutation Importance (%)
Accu_Tem1040.80.7
SoilThickness18.60.5
Sand17.916.0
Wat10.76.6
Soil_Moi4.915.6
SLP3.00.8
Pre_Wi1.65.9
DEM1.248.4
TK0.94.2
DTB0.40.9
ASP0.10.0
TN0.00.4
Table 5. Classification criteria for suitable areas.
Logistic Output Value (LOV)Suitability Class
<0.2Unsuitable Area
0.2–0.4Low-Suitability Area
0.4–0.6Moderate-Suitability Area
≥0.6High-Suitability Area
Disclaimer/Publisher’s Note: The statements, opinions and data contained in all publications are solely those of the individual author(s) and contributor(s) and not of MDPI and/or the editor(s). MDPI and/or the editor(s) disclaim responsibility for any injury to people or property resulting from any ideas, methods, instructions or products referred to in the content.

