Article

Vegetable Productivity, Soil Physicochemical and Biochemical Properties, and Microbiome in Response to Organic Substitution in an Intensive Greenhouse Production System

1
School of Plant Protection and Environment, Henan Institute of Science and Technology, Xinxiang 453003, China
2
School of Horticulture Landscape Architecture, Henan Institute of Science and Technology, Xinxiang 453003, China
*
Author to whom correspondence should be addressed.
Agriculture 2025, 15(14), 1493; https://doi.org/10.3390/agriculture15141493
Submission received: 10 June 2025 / Revised: 9 July 2025 / Accepted: 9 July 2025 / Published: 11 July 2025
(This article belongs to the Section Agricultural Systems and Management)

Abstract

Partial substitution of mineral N fertilizer with manure (organic substitution) is considered as an effective way to reduce N input in intensive agroecosystems. Here, based on a 3-year field experiment, we assessed the influence of different organic substitution ratios (15%, 30%, 45%, and 60%, composted chicken manure applied) on vegetable productivity and soil physicochemical and biochemical properties as well as microbiome (metagenomic sequencing) in an intensive greenhouse production system (cucumber-tomato rotation). Organic substitution ratio in 30% got a balance between stable vegetable productivity and maximum N reduction. However, higher substitution ratios decreased annual vegetable yield by 23.29–32.81%. Organic substitution (15–45%) improved soil fertility (12.18–19.94% increase in soil total organic carbon content) and such improvement was not obtained by higher substitution ratio. Soil mean enzyme activity was stable to organic substitution despite the activities of some selected enzymes changed (catalase, urease, sucrase, and alkaline phosphatase). Organic substitution changed the species and functional structures rather than diversity of soil microbiome, and enriched the genes related to soil denitrification (including nirK, nirS, and nosZ). Besides, the 30% of organic substitution obviously enhanced soil microbial network complexity and this enhancement was mainly associated with altered soil pH. At the level tested herein, organic substitution ratio in 30% was suitable for greenhouse vegetable production locally. Long-term influence of different organic substitution ratios on vegetable productivity and soil properties in intensive greenhouse system needs to be monitored.

1. Introduction

China’s greenhouse vegetable production scale has rapidly expanded since 2000 because of continuous economic growth and strong domestic consumption demand. Nowadays, China is the largest greenhouse vegetable producer in the world, and vegetable cultivation is an important source of income for many people in the countryside. Yet, in pursuit of high economic returns, the overuse of nitrogen (N) fertilizer prevails in greenhouse vegetable production [1]. The average N application rate of greenhouse vegetable production exceeds 2000 kg N hm−2 yr−1, which is larger than five times the rate used for grain crops [2]. Excessive N fertilization leads to low N utilization efficiency (generally lower than 20%) [3]. Besides, an oversupply of N fertilizer incurs significant accumulation of soil nitrate (NO3-N). A previous meta-analysis showed that soil NO3-N accumulation in 0–100 cm depth averaged up to 504 ± 188 kg N hm−2 across the main greenhouse vegetable production regions in China [4]. High amounts of soil NO3-N accumulation trigger severe environmental consequences, such as groundwater pollution, eutrophication, and gaseous N emissions. Not only these, prolonged overuse of N fertilizer adversely affects soil quality (e.g., soil acidification and salinization, nutrient imbalance, and decreased microbial activity, function, and biodiversity) [5,6,7,8], considerably harming land sustainable productivity. Given that China’s agriculture must achieve a transformation from solely pursuing high-yielding crops to fully coordinating yield, resource use efficiency, and environmental costs in the coming decades, reducing N input in intensive greenhouse production has become an urgent task for ensuring the green and sustainable development of the vegetable industry.
Organic substitution (partial substitution of chemical N fertilizer with organic fertilizer) is recommended by the Chinese government for reducing N input in intensive agroecosystems. For intensive greenhouse vegetable cultivation, many previous researches indicated the positive influences of this nutrient management regime, e.g., improving N use efficiency, vegetable quality index, and net ecosystem economic benefit [9,10], declining N leaching and runoff losses and gaseous N emissions [11,12,13,14], promoting soil carbon sequestration and aggregate stability [15,16,17], and enhancing soil nutrient availability and enzyme activities [18,19,20]. Moreover, as an engine of sustainable soil productivity, soil microbes and their response to organic substitution were also explored in greenhouse vegetable production. Zhang et al. [21] confirmed that organic substitution facilitated the growth of soil bacteria, fungi, actinomycetes, and arbuscular mycorrhizal fungi; Rong et al. [22] revealed that organic substitution increased microbial biomass and altered microbial community composition; Luan et al. [23] reported that organic substitution improved the functional diversity of soil microbial community. Yet, all these results involving soil microbial properties were obtained through the phospholipid fatty acids and enzymatic assessments rather than soil microbiome sequencing. There remains limited information on how soil microbial taxa respond to organic substitution at a finer taxonomic level in the condition of intensive greenhouse vegetable cultivation. Besides, the influence of organic substitution on microbial community functioning in intensively greenhouse vegetable-cropped soil is still paid little attention. Increasing the knowledge involved can help to optimize the organic substitution regime by providing insight into soil microbial ecology. More importantly, the optimal organic substitution ratio is not fixed, but varies with cropping systems, tillage patterns, soil backgrounds and initial fertility levels, and the organic materials applied [24,25,26]. Hence, clarifying the optimal organic substitution ratio locally is the prerequisite for fertilization reduction plan recommendation to vegetable producers, and is also of practical significance for structuring crop nutrient management strategy at the regional scale [27,28].
Microbial interactions are ubiquitous in nature. No microorganism can exist in isolation, and the lifestyle of one species is also not a simple accumulation or extinction of its population; conversely, microorganisms usually interact with each other, forming a complex interactive network (i.e., so-called microbial ecological network) [29]. Even, it has been assumed that microbial interactions may contribute to soil functions more than species diversity [30,31,32]. Microbial co-occurrence network analysis based on high-throughput metagenomic sequencing data has been indicated as an effective method to characterize species interactions in a complex community [33,34]. A positive link in such a network is commonly due to cross-feeding, co-aggregation, co-colonization, or niche overlap between two taxa, and, on the contrary, a negative link probably originates from competition, amensalism, prey-predator, or other reasons [35]. One of the most important properties of a co-occurrence network is the complexity (reflected by the number of links and the degree of nodes) [36,37,38]. Recently, studies have clearly demonstrated microbial co-occurrence network complexity as a crucial driver for ecosystem multifunctionality and productivity [39,40,41,42,43,44,45]. The underlying mechanism is that complex networks have higher functional redundancy and thus hold a strong ability to cope with environmental changes or suppress soil-borne pathogen infection on plants [46,47,48,49]. Agricultural management practices (such as fertilization) can significantly influence soil microbial network complexity [50,51,52,53]. Also, there is a parabolic relationship between network complexity and N application rate [43,54]. The low or moderate N rate strengthens, but the excessive rate weakens network complexity [55,56,57]. This suggests a strong need to focus on soil microbial network complexity in the high-input agricultural system (especially in intensive greenhouse vegetable production systems undergoing long-term excessive N supply), and implies that reducing N supply may be a potential solution to strengthen network complexity. On the other hand, organic amendments (such as biochar, manure, green manure, straw, and compost) have been revealed to increase soil microbial network complexity as compared with solely chemical fertilization [58,59,60], although the underlying mechanism is still rarely understood [61,62]. Just right, organic substitution is composed of reduced chemical N supply and increased organic supply.
Cucumber and tomato are the major greenhouse vegetable crops in China due to their relatively high yields, prices, and nutritional values (not only for eating raw but also for cooking). Cucumber and tomato cultivation play an important role in ensuring farmers’ incomes. Cucumber and tomato rotation are always the main greenhouse planting pattern, especially in northern China. Xinxiang district, located in Henan province, is one of the most important greenhouse vegetable production bases in northern China. However, excessive N fertilization is very common in local vegetable cultivation, leading to serious environmental issues, soil degradation, and low N use efficiency [63]. We believe that organic substitution is one of the feasible options to solve the above problems. Therefore, a field experiment (cucumber and tomato rotation), containing the treatments with various ratios of organic substitution for chemical N fertilizer, was established in this region. The first aim of this study was to assess the effect of various organic substitution ratios for chemical N fertilizer on crop productivity, soil physicochemical and biochemical properties, as well as microbial community diversity, structure, and functioning in an intensive greenhouse vegetable production system. The second aim of this study was to assess the effect of organic substitution on microbial interaction networks in intensively cultivated greenhouse soil. Correspondingly, we propose two hypotheses: (1) organic substitution can influence vegetable productivity and soil microbiome, and meanwhile, the influence degree is regulated by the substitution ratio; and (2) in the intensively cultivated greenhouse soil (subjected to long-term excessive N fertilization), organic substitution can enhance microbial network complexity. We believe that, beyond the greenhouse vegetable system, the results obtained in this study can also provide potential guidance towards improving N fertilization management in other high-input agricultural ecosystems.

2. Materials and Methods

2.1. Study Region, Experimental Design, and Sample Collection

The study region is located at Zhuzhuangtun village (35.225° N, 114.224° E; altitude of 55 m a.s.l.), Muye town, Xinxiang district, Henan province of central China. This region has always been one of the important greenhouse vegetable production bases in northern China since the 1980s. It has a warm temperate continental monsoon climate with distinct four seasons. It is very cold in winter (average temperature of 0.2 °C in January) and hot in summer (average temperature of 27.3 °C in July), and the annual air temperature averages 14 °C. The annual rainfall averages 573.4 mm with uneven distribution. Most of the precipitation is concentrated in June, July, and August. There are about 220 frost-free days and 2400 h of sunshine annually. The soil type is classified as Fluvo-aquic soil in China and Fluvisols in the USDA soil taxonomy. Before the beginning of field experiment, the topsoil (0–20 cm depth) was collected to determine soil basic physicochemical properties, which were as follows: total organic carbon 15.26 g kg−1, total nitrogen 1.67 g kg−1, NH4+-N 3.43 mg kg−1, NO3-N 178.88 mg kg−1, available phosphorus 204.67 mg kg−1, available potassium 414.68 mg kg−1, and a pH of 7.80 (a soil/water ratio of 1/5, w/v).
The field experiment was established in February 2022. In consistent with local agricultural practice, in the greenhouse, two seasons of vegetables were planted each year: spring cucumber (February to July) and autumn tomato (July to November). There was no planting for the remaining time. Five treatments representing various organic substitution ratios were employed, with each treatment in five replications (a total of 25 subplots subjected to a completely randomized block arrangement). Farmers’ conventional fertilization practice (not only solely mineral fertilization but also excessive N supply) was applied as the control (zero nitrogen reduction, denoted as FCFP). Chicken manure was used to replace 15%, 30%, 45%, and 60% of chemical N fertilizer, respectively (denoted as 85%FCFP+CM, 70%FCFP+CM, 55%FCFP+CM, and 40%FCFP+CM, respectively). All treatments received an identical amount of total N input. Composted chicken manure contained 25.4% organic matter, 2.21% N, 1.65% P2O5, and 1.24% K2O. The fertilization amounts for each treatment are listed in Table 1. Chicken manure was applied once a year (before cucumber transplanting), spread evenly on the soil surface, and incorporated into the topsoil by rotary tiller. The chemical fertilizers used were compound fertilizer (N: P2O5: K2O in the ratio 16: 5: 28), calcium superphosphate (P2O5 12%), and potassium sulfate (K2O 51%). In each season, 30% chemical fertilizers were used by basal application, and the remaining 70% fertilizers were used by multi-split topdressing (fertigation at an interval of 7–10 d as needed). Cucumber and tomato varieties used were Jinchun 4 and Fendu 53, respectively. Other cultivation and management practices were in accordance with local conventional methods.
Vegetable yield in each season was recorded (from 2022 to 2024, in total six seasons, cucumber and tomato, each for three seasons). Meanwhile, we assessed the net economic benefit in each treatment. Here, the net economic benefit was calculated by annual economic output minus annual economic input. The annual economic output was obtained by directly selling cucumbers and tomatoes in the market. The annual economic input mainly consisted of fertilizers. All the calculations were priced in US dollars (the exchange rate RMB: USD is 7.1:1). For yield and economic analyses, each treatment included 15 samples (n = 15, five replications for each treatment × three seasons). Soil samples were collected at the end of the tomato season in 2024, at which time the field experiment had continued for three cucumber-tomato cycles. Hence, for the soil analysis involved, each treatment included five samples (n = 5). In each subplot, five topsoil samples (0–20 cm) were randomly collected by auger and then mixed thoroughly. In the final, a total of 25 composite samples were obtained. In the lab, each fresh composite sample was divided into three subsamples: one was stored at −80 °C for soil microbiome analysis, another was air-dried at room temperature and then sieved for physicochemical analysis, and the third was used immediately to determine soil enzyme activities.

2.2. Soil Physicochemical and Biochemical Properties

Soil pH, available nitrogen (AN) and phosphorus (AP) and potassium (AK), and total organic carbon (TOC) and nitrogen (TN) were determined. The pH was analyzed in water solution (soil: water ratio 1:5, w/v). AN was analyzed by the alkaline hydrolysis diffusion method. AP was analyzed via the molybdenum antimony colorimetric method. AK was analyzed by a flame photometer after NH4OAc solution extraction. TN was tested by an automatic Kjeldahl distillation-titration method. TOC was analyzed by exothermic heating and oxidation with potassium dichromate. The details of the above analyses were from [64].
The activities of several soil enzymes associated with nutrient turnover were determined. Urease (URE) was analyzed using the indophenol blue colorimetry. β-glucosidase (GLU) was analyzed by measuring the glucose released when the soil sample was incubated with arbutin solution. Sucrase (SUR) was examined by 3,5-dinitrosalicylic acid colorimetry after co-incubation of the soil sample and sucrose solution. Alkaline phosphatase (ALP) was analyzed by measuring the phenol released when the soil sample was incubated with disodium phenyl phosphate solution. Arylsulfatase (ARY) was tested by detecting the nitrophenol released when the soil sample was incubated with nitrophenol sulfate potassium solution. Catalase (CAT) was analyzed by KMnO4 solution, titrating the residual H2O2 after co-incubation of the soil sample with H2O2 solution. The details of the above analyses were from [65]. The mean soil enzyme activity (GME) was reflected by the geometric mean of all tested enzymes.

2.3. DNA Extraction, Metagenomic Sequencing, and Bioinformatic Analysis

Total microbial DNA was extracted from 0.2 g of fresh soil sample using the FastPure Soil DNA Isolation Kit (Vazyme Biotech, Nanjing, China) in line with the manufacturer’s instructions. The concentration and purity of extracted DNA were checked with the help of a microfluorometer (TBS-380, Turner Biosystems, Sunnyvale, CA, USA) and a nucleic acid protein meter (NanoDrop2000, Thermo Fisher Scientific, Waltham, MA, USA), respectively. The quality of extracted DNA was checked by 1.0% agarose gel electrophoresis. DNA extract was fragmented to an average size of about 400 bp by using Covaris M220 (Covaris, Woburn, MA, USA) for paired-end library construction. Paired-end library was constructed by NEXTFLEX Rapid DNA-Seq (Bio Scientific, Austin, TX, USA). Adapters containing the full complement of sequencing primer hybridization sites were ligated to the blunt ends of fragments. Paired-end sequencing was performed on Illumina NovaSeqTM X Plus (Illumina, San Diego, CA, USA) at Shanghai Majorbio Bio-Pharm Technology Co., Ltd. (Shanghai, China) using NovaSeq Reagent Kits according to the manufacturer’s instructions. Raw reads have been deposited in the NCBI SRA database under BioProject accession number PRJNA1272007.
The paired-end reads were trimmed of adaptors, and the low-quality reads (length < 50 bp or with a quality value < 20 or having N bases) were removed by fastp (version 0.20.0). Metagenomics data were assembled by MEGAHIT (version 1.1.2), which makes use of succinct de Bruijn graphs. Contigs with a length ≥ 300 bp were selected as the final assembly result. Then, the contigs were used for further gene prediction and annotation. Open reading frames (ORFs) from each assembled contig were predicted using Prodigal (version 2.6.3). The predicted ORFs with a length ≥100 bp were retrieved and translated into amino acid sequences by means of the NCBI translation table. A non-redundant gene catalog was constructed using CD-HIT (version 4.6.1) with 90% sequence identity and 90% coverage. High-quality reads were aligned to non-redundant gene catalogs to calculate gene abundance with 95% identity through SOAPaligner (version 2.21). Representative sequences of the non-redundant gene catalog were aligned to the NR database with an e-value cutoff of 1 × 10⁻⁵ (Diamond version 2.0.13) for taxonomic annotations. Cluster of orthologous groups of proteins (COG) annotation for representative sequences was performed using Diamond (version 2.0.13) against the eggNOG database with an e-value cutoff of 1 × 10⁻⁵. KEGG annotation was conducted using Diamond (version 0.8.35) against the Kyoto Encyclopedia of Genes and Genomes database under the condition of an e-value cutoff of 1 × 10⁻⁵. The above-mentioned procedures and details of bioinformatic analysis on sequencing data were as described in the Majorbio Cloud platform (https://www.majorbio.com/) (accessed on 8 February 2025) [66,67].

2.4. Statistical Analysis

Statistical analysis was performed by one-way ANOVA (Duncan’s testing, 95% probability) to check significant differences between treatments (SPSS software, version 25.0). Mean values and standard deviation were reported here. The correlation between various data was examined by one-variable regression modeling. Species and functional diversity (reflected by Shannon and Chao1 indexes) were computed to indicate the numbers of species and functional genes annotated, respectively, using the “vegan” package of R software (version 2.3.0). Principal coordinate analysis (PCoA, Bray-Curtis dissimilarity) was conducted to assess the changes in soil microbial community structures. Analysis of similarities (ANOSIM) was applied to examine significant differences in community structures between treatments. Distance-based redundancy analysis (db-RDA) was performed to scan the environmental factors driving microbial community structure, and the significance of these factors was checked by Mantel testing. Random forest analysis was applied to detect the important microbial taxa/functional modules that contributed to differential species/functional structures across treatments. Co-occurrence networks were structured to assess the complexity of interactions between microbial taxa (genus level) through R software (version 2.3.0), and network topological properties were calculated by Gephi software (version 0.9.2) [68,69]. For increasing network robustness, only the genus with relative abundance > 0.1% was selected to construct the network [70]. All pair-wise Spearman correlations between taxa were calculated, and the correlations with 0.99 > |r| > 0.60 and p < 0.05 were included in network analysis. Soil microbial co-occurrence network complexity was reflected by two topological parameters, namely, the number of links and the degree of each node, with a higher number of links and average degree representing higher network complexity [55]. For detecting the soil environmental factors that can significantly drive network complexity (i.e., average degree), stepwise multiple linear regression was performed (p < 0.05 to accept and p > 0.05 to remove a variable) [71].

3. Results

3.1. Changes in Vegetable Yield and Economic Benefits

Compared with FCFP, cucumber yield in 85%FCFP+CM and 70%FCFP+CM did not change, while that in 55%FCFP+CM and 40%FCFP+CM significantly lowered by 22.12% and 34.99%, respectively (Figure 1A). Tomato yield in 85%FCFP+CM and 70%FCFP+CM did not differ from that in FCFP, but significant declines by 24.70% and 30.17% were observed for 55%FCFP+CM and 40%FCFP+CM, respectively (Figure 1B). The annual vegetable yield (cucumber plus tomato) was not affected by 85%FCFP+CM and 70%FCFP+CM, but was significantly decreased by 55%FCFP+CM and 40%FCFP+CM (Figure 1C). Overall, under the condition of substituting 30% of chemical N fertilizer with manure, greenhouse productivity was still stable (no compromise on yield), and meanwhile, there was no decline in net economic benefits (Table 2).

3.2. Changes in Soil Physicochemical and Biochemical Properties

Organic substitution significantly influenced soil physicochemical properties (Table 3). TOC was increased by organic substitution, and that in 85%FCFP+CM, 70%FCFP+CM, and 55%FCFP+CM significantly increased by 19.90%, 15.37%, and 12.14% compared with FCFP, respectively. 40%FCFP+CM did not affect TOC (p > 0.05). Although organic substitution also increased TN to a certain degree, no statistical difference between treatments was observed. The highest pH was recorded in 70%FCFP+CM, followed by 55%FCFP+CM, and they had a significant increase of 0.23 and 0.18 units compared to FCFP, respectively. 85%FCFP+CM and 40%FCFP+CM did not alter pH. As expected, organic substitution decreased AN, which in 85%FCFP+CM, 70%FCFP+CM, 55%FCFP+CM, and 40%FCFP+CM significantly reduced by 22.88%, 31.24%, 16.91%, and 29.02%, respectively. For AP, only in 70%FCFP+CM was a significant reduction observed as compared to FCFP. Organic substitution increased AK, which in 85%FCFP+CM, 70%FCFP+CM, and 55%FCFP+CM significantly increased by 42.90%, 21.48%, and 24.85%, respectively. 40%FCFP+CM did not affect AK.
Organic substitution also affected soil enzyme activities (Table 3). Compared to FCFP, CAT in 85%FCFP+CM significantly decreased by 5.26%, while that in 55%FCFP+CM significantly increased by 5.26%. Organic substitution ratios in 15% and 30% did not affect URE, but higher organic substitution ratios (45% and 60%) decreased URE. Organic substitution increased SUR, and the highest SUR was recorded in 70%FCFP+CM. ALP in 85%FCFP+CM and 40%FCFP+CM reduced by 27.59% and 26.88%, respectively, and no significant change was observed for other treatments. Neither GLU nor ARY was affected by organic substitution. Meanwhile, organic substitution did not alter the soil mean enzyme activity (GME).

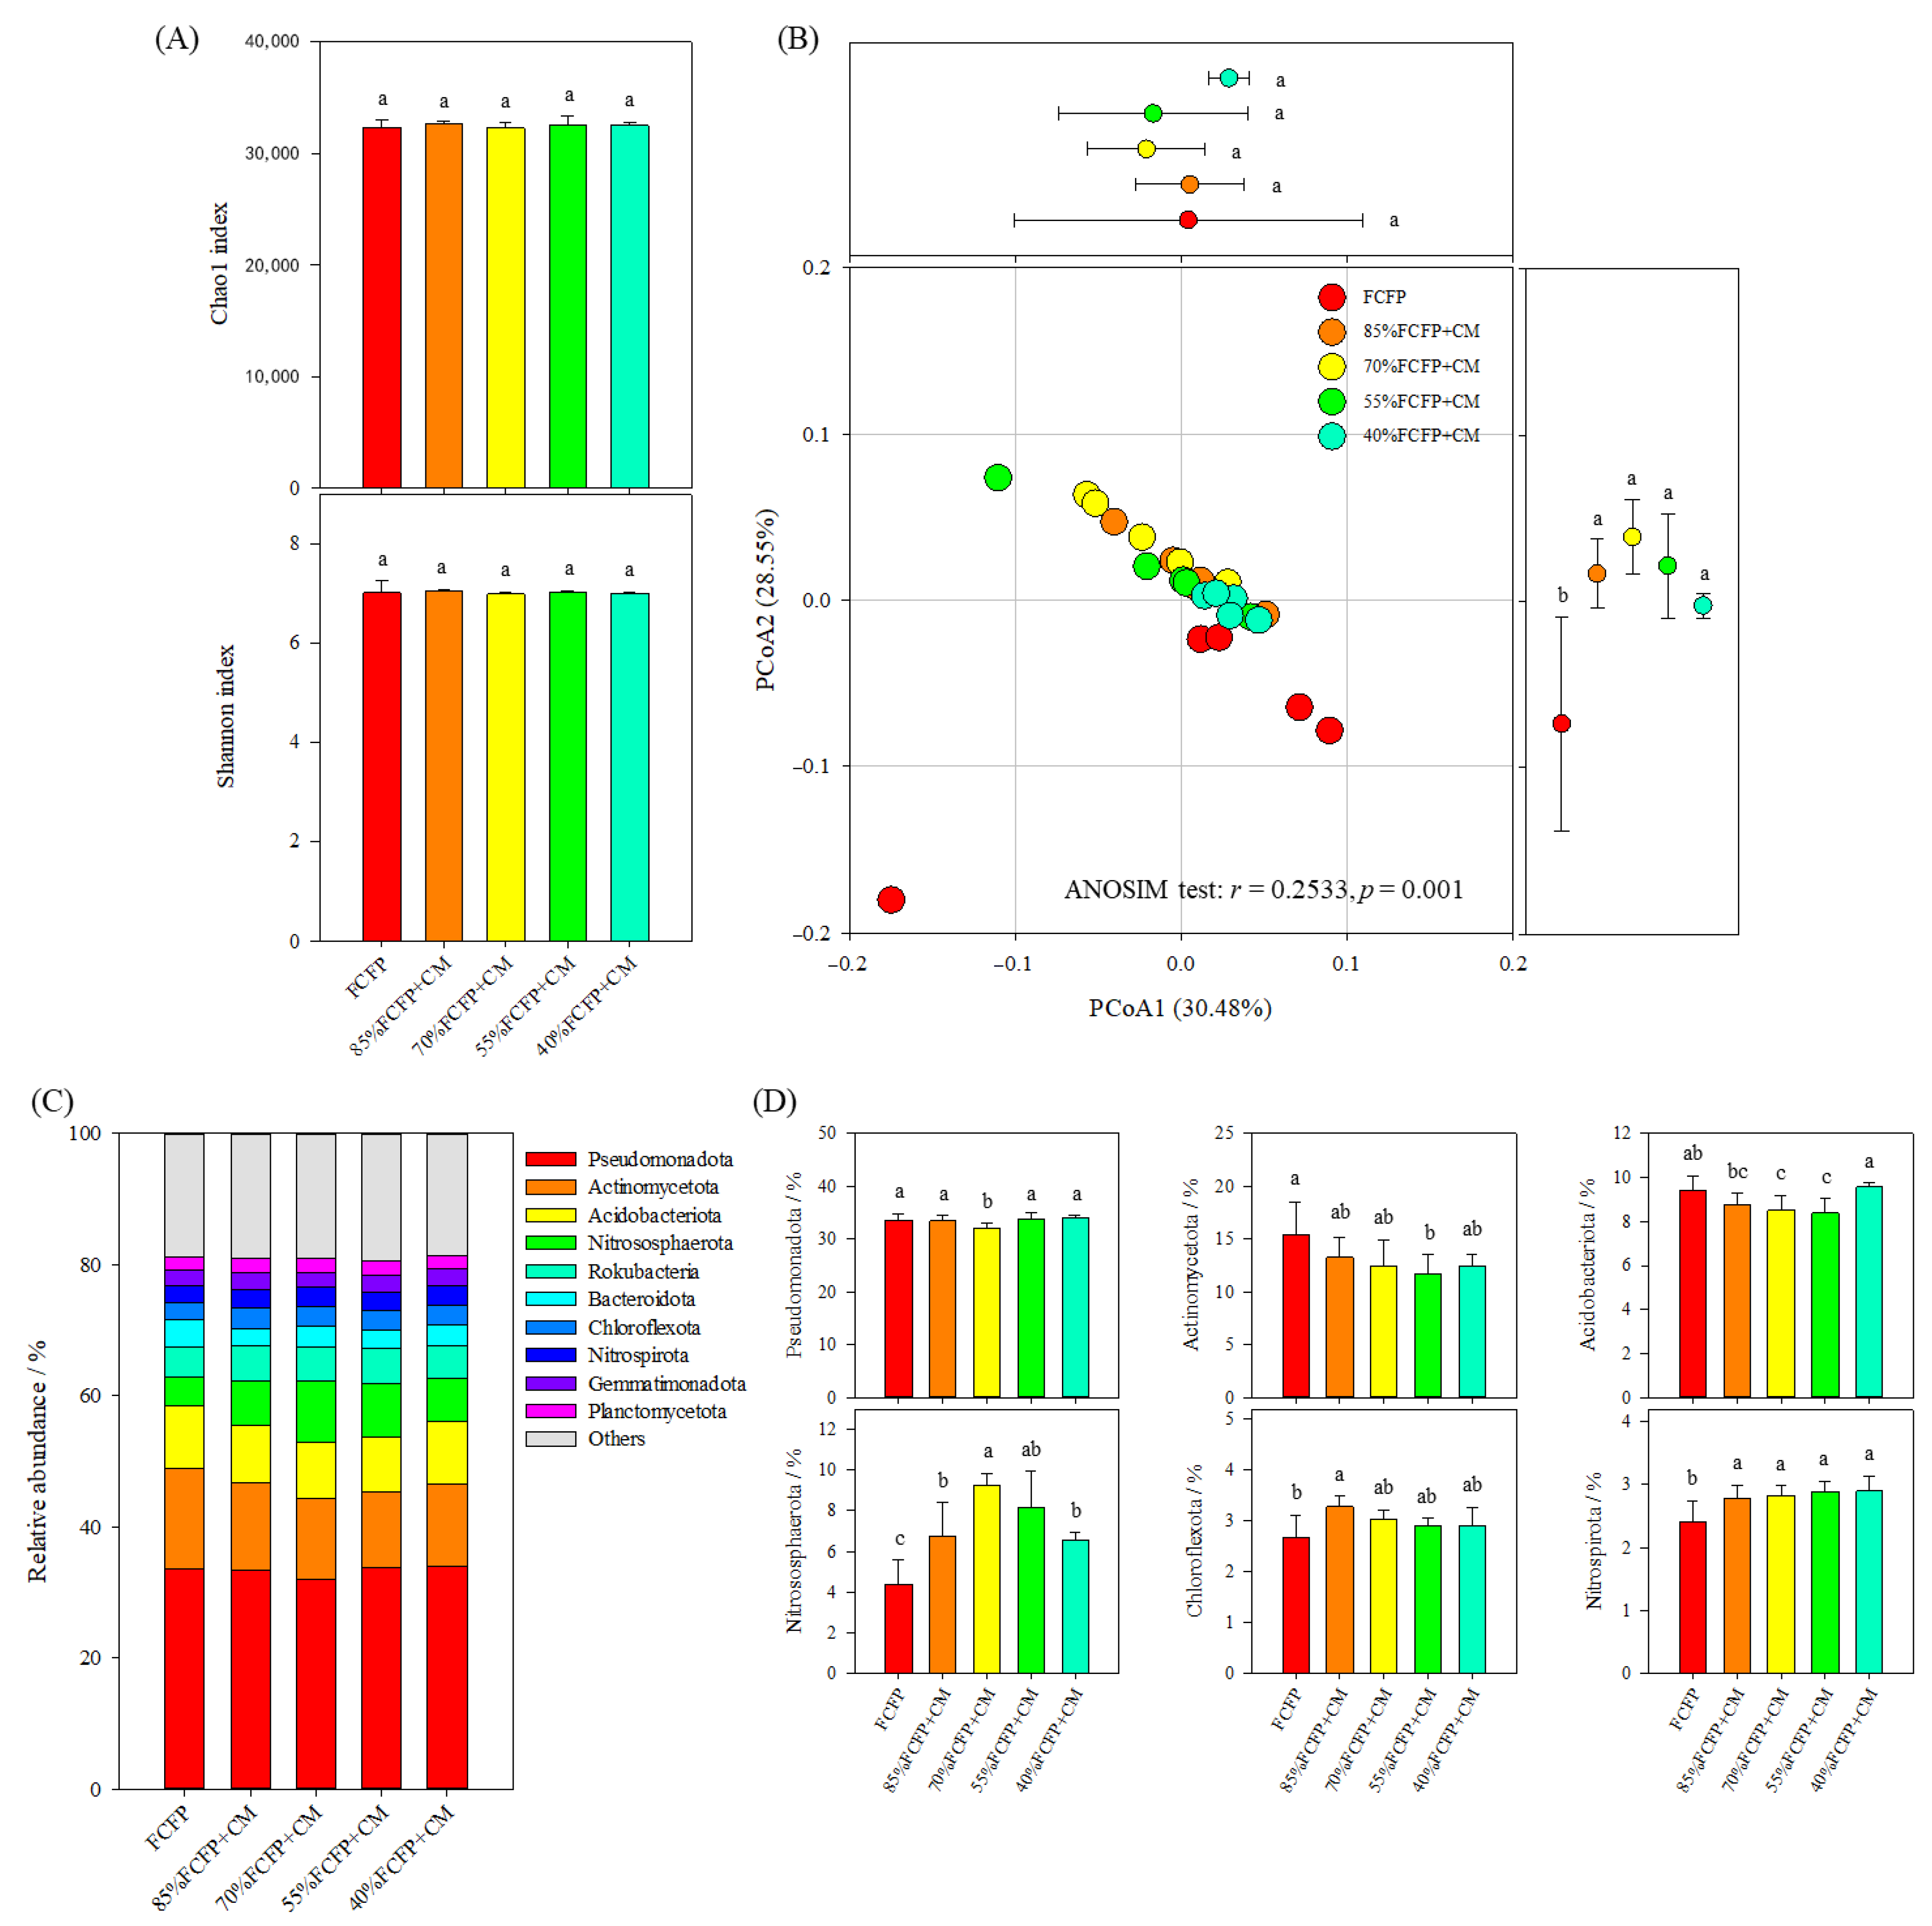
3.3. Species Diversity and Structure of Soil Microbiome

Organic substitution did not alter species richness (Chao1 index) and diversity (Shannon index) of the soil microbiome (Figure 2A), but changed species structure (clearly demonstrated by PCoA and ANOSIM) (Figure 2B). However, there was no clear separation between the soil samples receiving organic substitution along either PCoA1 or PCoA2 axis, suggesting that the overall species structure of the soil microbiome was not dependent on the organic substitution ratio. Additionally, no significant linear correlation between annual vegetable yield and species richness, diversity, and structure of soil microbiome was found (Figure S1). The db-RDA demonstrated that there were four soil physicochemical variables driving species structure of soil microbiome, namely, pH (Mantel testing: R2 = 0.4932, p = 0.001), AN (Mantel testing: R2 = 0.4611, p = 0.003), AP (Mantel testing: R2 = 0.3355, p = 0.011), and TOC (Mantel testing: R2 = 0.3058, p = 0.021) (Figure S2).
At the phylum level, Pseudomonadota and Actinomycetota were the major members in the soil microbiome (Figure 2C). However, they were slightly affected by organic substitution (Figure 2D). In brief, only in 70%FCFP+CM relative abundance of Pseudomonadota was observed a significant decline by 4.51%; only in 55%FCFP+CM relative abundance of Actinomycetota was found a significant reduction by 24.45%. By comparison, some non-predominant members were strongly influenced by organic substitution (Figure 2D). Relative abundance of Acidobacteriota decreased first and then increased with increasing organic substitution ratio (parabolic pattern: r = 0.6620, p = 0.0018, n = 25), but the opposite was observed for that of Nitrososphaerota (parabolic pattern: r = 0.7993, p < 0.0001, n = 25). All the treatments received organic substitution enriched Nitrospirota (increasing by 15.76–20.79% in relative abundance). Nevertheless, all these significantly changed phyla did not correlate with greenhouse productivity (i.e., annual vegetable yield) (Figure S3). Neither Pseudomonadota nor Actinomycetota was linked with soil environmental variables tested in this study (Figure S4). In terms of non-predominant phyla, Acidobacteriota negatively correlated to AK; Chloroflexota negatively correlated to AN but positively to TOC; Nitrospirota negatively correlated to AN but positively to pH; Nitrososphaerota negatively correlated to AN but positively to AK (Figure S4).
A total of 5821 microbial genera were detected in this study, 167 of which were abundant genera (relative abundance exceeding 0.1%). The abundant genera altogether occupied 71% of the total community. Regarding the abundant genera, a random forest modeling was used to identify the important genera that led to dissimilar community structure between treatments. The top 30 important genera were listed in Figure S5, and the responses of these important genera to organic substitution were illustrated in Table 4. Compared with FCFP, 85%FCFP+CM enriched Acidobacterium, Microvirga, Nitrosopumilus, Methyloceanibacter, Promineifilum, unclassified Nitrososphaeraceae, Rubrobacter, unclassified Dormibacteraeota, Gaiellasilicea, Methylobacterium, Pelagibius, Defluviicoccus, and Inquilinus, and declined Rhodospirillum, Aldersonia, Dongia, Chloracidobacterium, Rhodococcus, Parvularcula, and Nocardia; 70%FCFP+CM enriched Acidobacterium, Microvirga, Nitrosopumilus, Promineifilum, unclassified Nitrososphaeraceae, Rubrobacter, unclassified Dormibacteraeota, Gaiellasilicea, Methylobacterium, Pelagibius, Defluviicoccus, and Inquilinus, whereas reduced Rhodospirillum, Hypericibacter, Steroidobacter, Dongia, Chloracidobacterium, Phenylobacterium, Rhodococcus, Parvularcula, and Nocardia; 55%FCFP+CM enriched Rhodospirillum, Microvirga, Hypericibacter, Nitrosopumilus, Promineifilum, unclassified Nitrososphaeraceae, Gaiellasilicea, Methylobacterium, Pelagibius, Defluviicoccus, Inquilinus, and unclassified Nitrososphaerota, whereas decreased Aldersonia, Steroidobacter, Chloracidobacterium, Phenylobacterium, Rhodococcus, and Nocardia; 40%FCFP+CM enriched Acidobacterium, Microvirga, Nitrosopumilus, Methyloceanibacter, Promineifilum, unclassified Nitrososphaeraceae, Methylobacterium, Limnobacter, and Leptolyngbya, and conversely, lowered Rhodospirillum, Aldersonia, Dongia, Rhodococcus, and Nocardia. Interestingly, more than half of these 30 genera were significantly linked to AN, but no genus was linked to pH (Figure S4). Yet, for these 30 important genera, the vast majority did not correlate with annual vegetable yield (Figure S6).

3.4. Functional Diversity and Structure of Soil Microbiome

With the help of the functional annotation by the KEGG database, we also assessed the effect of organic substitution on the functional profile of the soil microbiome. Neither functional richness nor diversity was influenced by organic substitution (Figure 3A). Nevertheless, there was a significant change in the functional structure of the soil microbiome across treatments (Figure 3B). Especially, along the PCoA2 axis, a clear separation between soil samples was found. Nonetheless, we did not observe a significant correlation between annual vegetable yield and functional richness, diversity, and structure of soil microbiome (Figure S1). The db-RDA demonstrated that there were four soil environmental variables significantly driving functional structure of soil microbiome, namely, pH (Mantel testing: R2 = 0.5274, p = 0.002), AN (Mantel testing: R2 = 0.4119, p = 0.001), TOC (Mantel testing: R2 = 0.2823, p = 0.025), and AP (Mantel testing: R2 = 0.2513, p = 0.043) (Figure S7).
In total, 441 KEGG modules were obtained via functional annotation. A random forest modeling was further conducted to unearth the important modules that caused differential functional structure of the soil microbiome across treatments. The top 30 important modules are shown in Figure S8, and the responses of these important modules to organic substitution are illustrated in Table 5. As compared to FCFP, 85%FCFP+CM enriched M00378, M00144, M00358, M00529, M00959, M00159, M00914, M00055, M00664, and M00545, and meanwhile, down-regulated M00786, M00538, M00736, M00096, and M00128; 70%FCFP+CM enriched M00378, M00023, M00358, M00763, M00529, M00959, M00847, M00159, M00914, M00911, M00031, M00055, M00664, and M00545, while down-regulating M00786, M00538, M00736, M00960, M00096, M00128, and M00083; 55%FCFP+CM enriched M00378, M00023, M00358, M00763, M00529, M00847, M00159, M00914, M00072, M00911, M00031, M00055, M00664, M00146, and M00545, and down-regulated M00786, M00538, M00736, M00096, and M00128; 40%FCFP+CM enriched M00529, M00159, M00967, M00914, M00055, and M00664, but down-regulated M00786, M00538, M00736, and M00144. The number of the modules with significant change in the relative abundance was 15, 21, 20, and 10 in 85%FCFP+CM, 70%FCFP+CM, 55%FCFP+CM, and 40%FCFP+CM, respectively, suggesting that moderate organic substitution affected the functional structure of the soil microbiome more strongly. However, for these important KEGG modules, only four had a significant correlation with greenhouse productivity (Figure S9). Regarding soil physicochemical properties, more KEGG modules were linked with AN rather than pH (Figure S10).

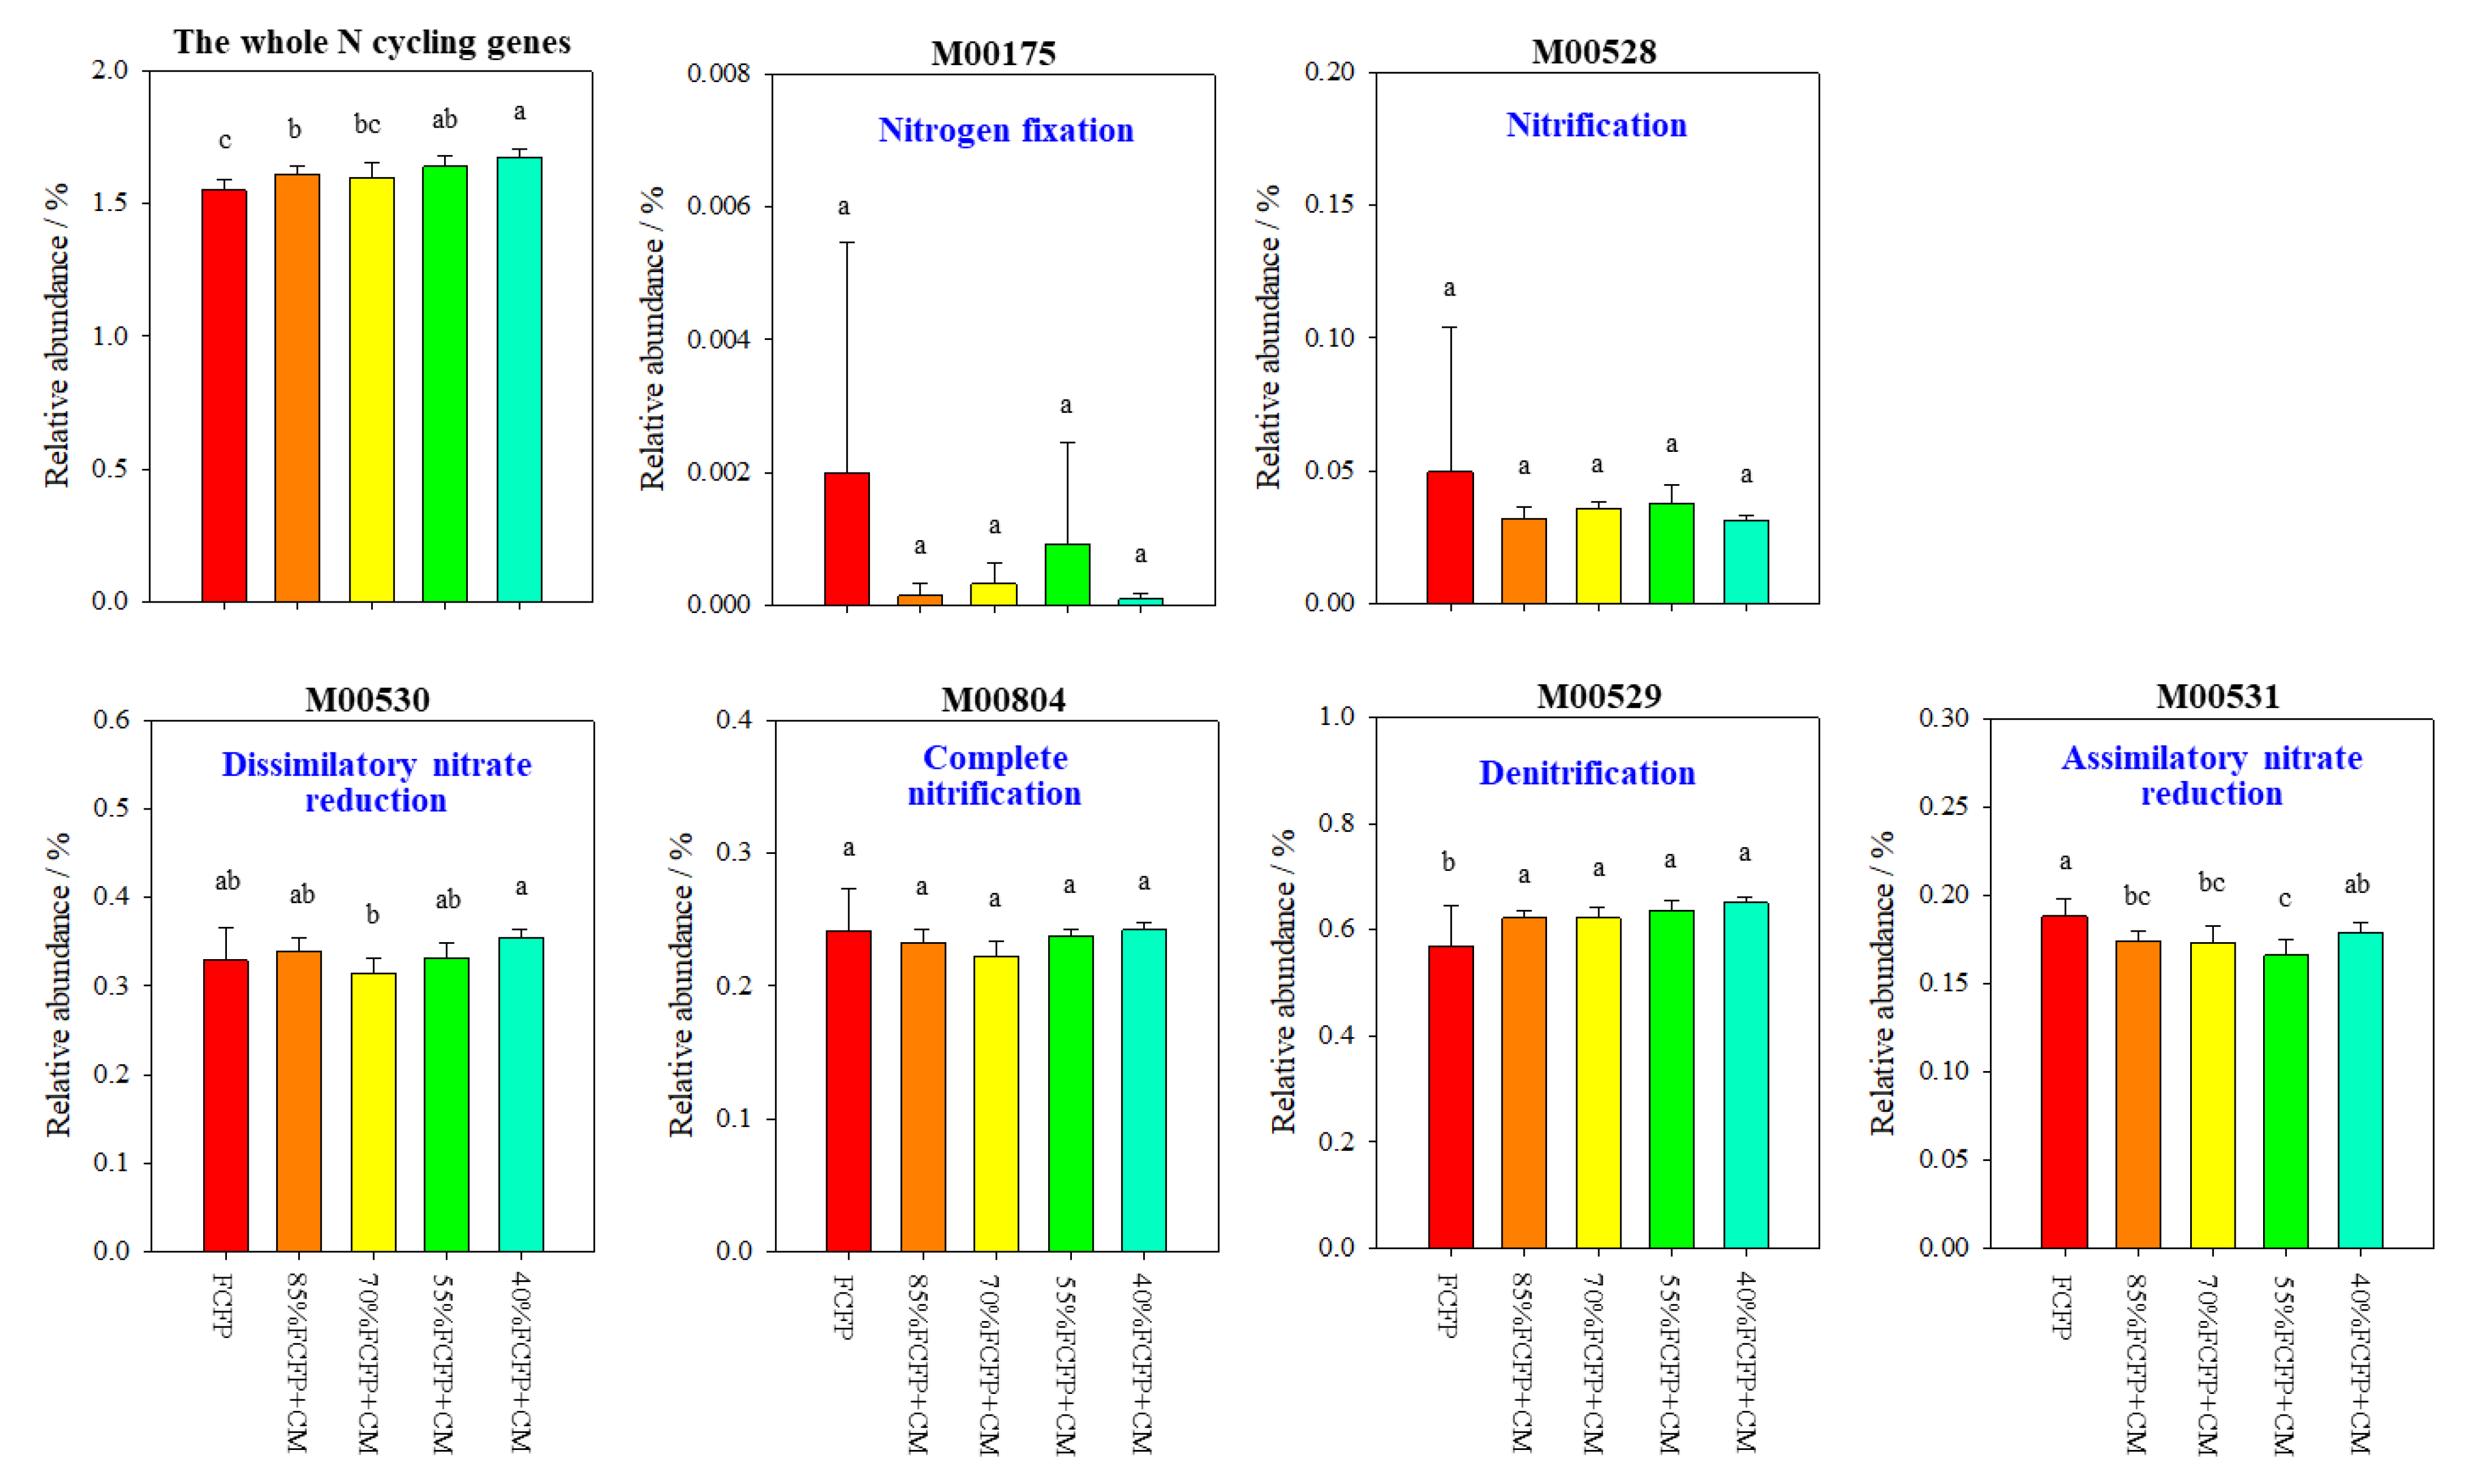
3.5. KEGG Modules and Functional Genes Associated with Soil N Cycling

Organic substitution significantly affected soil N cycling. Relative abundance of the whole N cycling genes significantly increased with increasing organic substitution ratio (linear pattern: r = 0.7202, p < 0.0001, n = 25) (Figure 4). Organic substitution increased the relative abundance of the denitrification module, and this did not depend on the organic substitution ratio. Relative abundance of assimilatory nitrate reduction module decreased first and then increased with increasing organic substitution ratio (parabolic pattern: r = 0.6739, p = 0.0013, n = 25) and the bottom was recorded in 55%FCFP+CM. Organic substitution did not affect the relative abundance of other N cycling-related modules, such as N fixation, nitrification, and dissimilatory nitrate reduction.
Further, we found that, in the denitrification module, organic substitution enriched nirK and nirS genes, and meanwhile, these enrichments did not rely on the organic substitution ratio (Table 6). Relative abundance of the nosZ gene generally increased as the organic substitution ratio increased (linear pattern: r = 0.5387, p = 0.0055, n = 25), and that in 40%FCFP+CM significantly increased by 18.17% as compared to FCFP. In the assimilatory nitrate reduction module, organic substitution decreased the relative abundances of the narB and nasD genes. For narB gene, its relative abundance in 85%FCFP+CM, 55%FCFP+CM, and 40%FCFP+CM significantly lowered by 25.23%, 27.85%, and 27.49%, respectively; for nasD gene, its relative abundance in 85%FCFP+CM, 70%FCFP+CM, 55%FCFP+CM, and 40%FCFP+CM significantly lowered by 15.56%, 17.65%, 23.32%, and 12.12%, respectively. The relative abundance of the nirA gene increased first and then declined with increasing organic substitution ratio (parabolic pattern: r = 0.7406, p = 0.0002, n = 25).
In terms of significantly changed N cycling-associated modules, denitrification was negatively linked with AN; assimilatory nitrate reduction was negatively related to AK (Figure S11). Regarding N cycling-associated genes, nasD was negatively linked to TOC; nirA was positively linked to TOC and AK but negatively to AP; nirK was positively linked to TOC and AK but negatively to AN; nirS was negatively linked to AN; nosZ and narB did not link to any soil physicochemical variables tested in this study (Figure S11). Further, we found that annual vegetable yield is highly and negatively linked to the relative abundance of the whole N cycling genes, and at the same time, negatively correlated to the denitrification module and nosZ gene, but positively to the nirA gene (Figure S11).

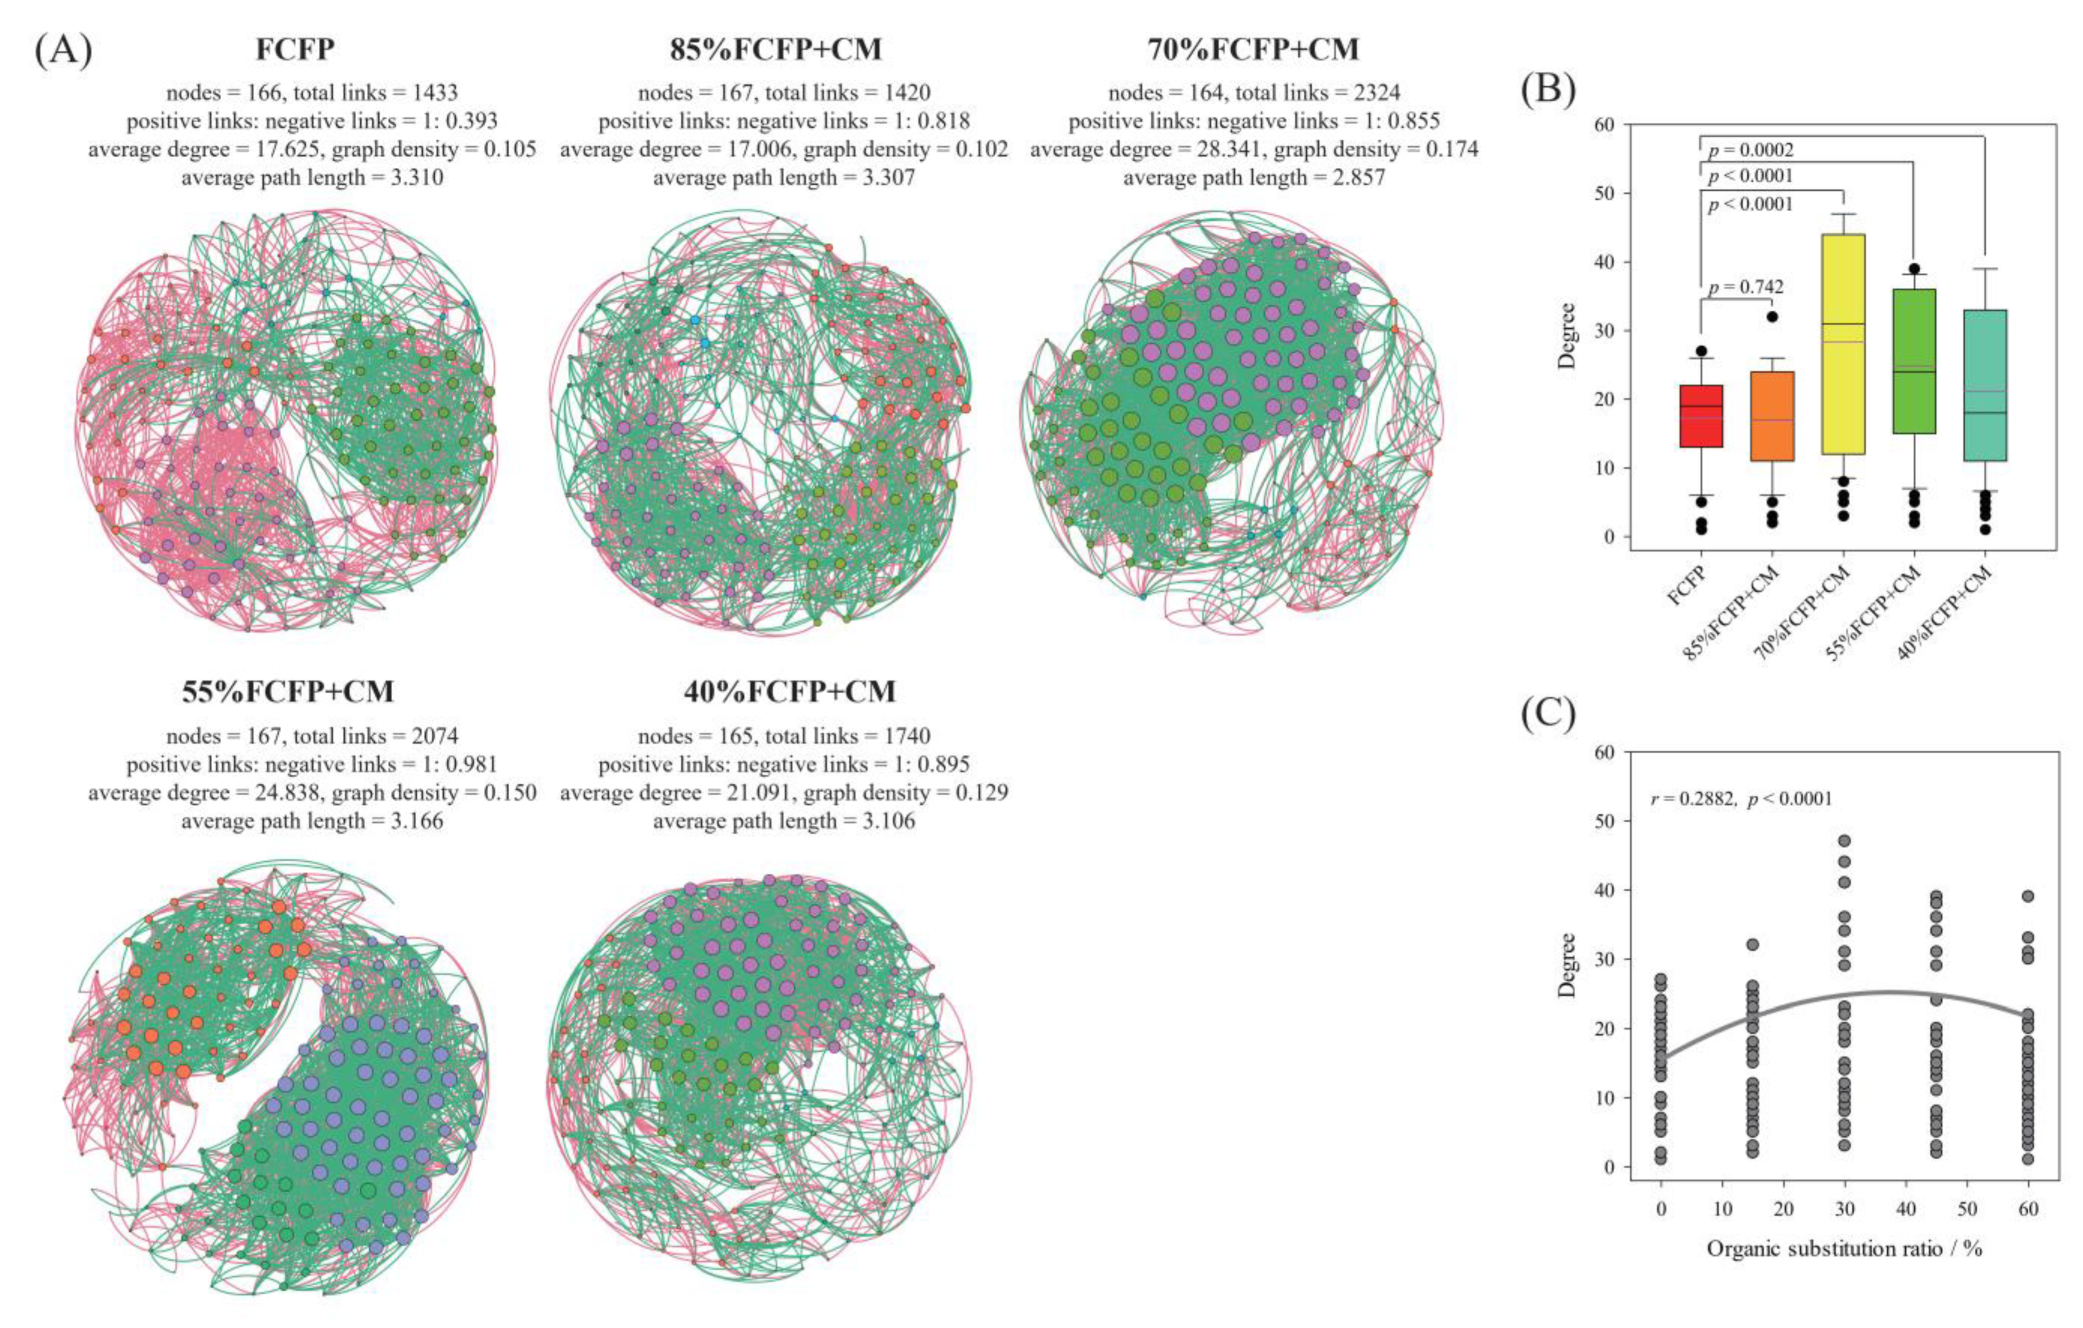
3.6. Co-Occurrence Network of Soil Microbiome

The co-occurrence networks under various fertilization treatments and their network topological properties are shown in Figure 5A. The number of nodes was comparable between networks (ranging from 164 to 167). However, there were obvious changes in the number of links between networks. Compared with FCFP, the number of total links in 85%FCFP+CM did not change, but in 70%FCFP+CM, 55%FCFP+CM, and 40%FCFP+CM, it increased by 62.18%, 44.73%, and 21.42%, respectively. A similar trend was also observed for average degree. As compared to FCFP, the average degree in 70%FCFP+CM, 55%FCFP+CM, and 40%FCFP+CM increased by 60.80%, 40.92%, and 19.67%, respectively. These clearly indicated higher network complexity in 70%FCFP+CM, 55%FCFP+CM, and 40%FCFP+CM networks. Interestingly, we found that organic substitution increased the proportion of negative links in the network, and such an increase did not rely on the organic substitution ratio (Figure 5A). Statistical analysis did indeed indicate that organic substitution significantly changed microbial network complexity (reflected by the degree of each node) (Figure 5B), and meanwhile, network complexity parabolically correlated with organic substitution ratio (Figure 5C). These strongly suggest that the organic substitution ratio is an important factor regulating soil microbial network complexity. Further, stepwise multiple linear regression demonstrated that, regarding soil physicochemical variables tested in this study, pH was the most important one significantly driving soil microbial network complexity, followed by AP (Table 7).

4. Discussion

4.1. Organic Substitution Ratio of 30% Was Suitable for Local Greenhouse Vegetable Cultivation

Given high environmental costs by N overfertilization, reducing N input in intensive agroecosystems has become an inevitable way for China’s agricultural transformation towards the green and sustainable development [72], particularly for the greenhouse vegetable system, where N supply far exceeds other systems [73,74,75]. Organic substitution is advocated for reducing N input in intensive agricultural systems. However, the key is to clarify the optimal organic substitution ratio, which commonly differs across crop systems and production patterns, in turn limiting the effectiveness of organic substitution at a regional scale. So far, the optimal organic substitution ratio in an intensive greenhouse production system has rarely been reported in northern China. Thus, in the present study, we investigated the response of vegetable productivity, soil physicochemical and biochemical properties, and the diversity, structure, and functional profiles of soil microbiome, as well as soil microbial interactions with various organic substitution ratios in an intensively cultivated greenhouse production system located at Xinxiang district of northern China. By means of a 3-year field experiment, we observed that organic substitution ratio in 30% is suitable for greenhouse vegetable cultivation locally, the reasons behind this were from the following three aspects: (1) organic substitution ratio in 30% maintained vegetable yield and farmers’ economic benefits (Figure 1 and Table 2), achieving a relative balance between stable crop productivity and maximum reduction in N supply; (2) this substitution ratio enhanced soil fertility (directly confirmed by increased soil TOC content) (Table 3), which is extremely important for ensuring sustainable land use because greenhouse vegetable production (commonly featured with higher planting intensity and faster soil organic carbon consumption) requires higher soil fertility as compared with the open field vegetable production and cereal systems [76]; (3) this substitution ratio furthest raised soil pH and prevented soil acidification (Table 3), benefitting to sustainable vegetable production in the intensive greenhouse cultivation system. With the help of a global meat-analysis, Du et al. [77] revealed that the yield of vegetables was more susceptible to soil acidification compared to that of other main crops (such as wheat, maize, and legume), because vegetable crops have faster growth rate, shorter growth cycle, and weaker root system, and therefore, have poor ability to resist acid damage. Still, it must be admitted that the above benefits resulted from the 30% of organic substitution in the intensive, and the high-input greenhouse vegetable production system tested here needs verification over a longer experimental duration. The monitoring of such long-term influence on vegetable productivity and soil properties will also be our next research focus.

4.2. Soil Physicochemical and Biochemical Properties Were Altered by Organic Substitution

Soil TOC increased first and then declined with increasing organic substitution ratio (parabolic pattern: r = 0.6282, p = 0.0040, n = 25) (Table 3). Especially in 40%FCFP+CM, TOC did not differ significantly from that in FCFP, despite this fertilization treatment receiving the highest amount of organic carbon input. This result deviates from the traditional viewpoint that increasing organic input commonly increases soil organic carbon content, accompanied by an obvious dosage effect. We speculate that extremely insufficient mineral N input may stimulate soil organic carbon mineralization for meeting vegetable plant N demand [78], and in turn, contribute to low TOC in 40%FCFP+CM. This speculation can be supported by the previous study that investigated the influence of long-term partial substitution of chemical fertilizer with green manure on organic matter mineralization in paddy soil [79]. Another study involved in a 6-year organic substitution for open-field vegetable production also demonstrated that a high organic substitution ratio intensified soil organic carbon mineralization and the priming effect [15]. Soil ‘microbial N mining’ process, by which some microbes use labile substrates to require N from decomposition of recalcitrant organic carbon, may thrive at low N availability/N-limited condition [20,78,80]. Our finding highlights the importance of optimizing the organic substitution ratio for soil fertility enhancement in an intensive greenhouse vegetable production system. In accordance with the expectation, organic substitution significantly decreased soil AN content due to reduced mineral N supply (Table 3), and soil N enrichment resulting from continuous overuse of N fertilizer was reversed. Such a decline in soil inorganic N residual also means a lower risk of environmental N loss.
Besides, organic substitution also influenced soil enzyme activities, particularly URE and SUR (Table 3). In general, URE decreased linearly with increasing organic substitution ratio (linear pattern: r = 0.6553, p = 0.0004, n = 25), and SUR first increased and then declined (parabolic pattern: r = 0.8448, p < 0.0001, n = 25) (Table 3). These suggest that greenhouse soil C/N turnover was altered by organic substitution. Nevertheless, a single soil enzyme only catalyzes a specific reaction and thus cannot be representative of the general soil biological process [81]. In the current study, soil mean enzyme activity (i.e., GME) did not change after receiving organic substitution, demonstrating that it may not be suitable as a reliable indicator to predict the effectiveness of organic substitution in intensive and high-input greenhouse vegetable systems, at least under the condition of the short-term experimental duration.

4.3. Soil Microbiome Did Not Link to the Productivity of Intensive Greenhouse Vegetable System

In this study, neither species (i.e., taxonomic) nor functional diversity of the soil microbiome responded to organic substitution (Figure 2A and Figure 3A). However, both the species and functional structure of the soil microbiome were significantly changed by organic substitution (Figure 2B and Figure 3B), which was attributable to the changes in soil physicochemical properties, such as pH, AN, AP, and TOC. Different microbial taxa adapt to different niches, and the habitat-associated niche alterations directly drive the change in microbial community structure [55,82]. Additionally, the functional structure of the soil microbiome responded to the organic substitution ratio more strongly compared to the species structure (Figure 2B and Figure 3B). This phenomenon is not surprising because a single microbial taxon does not perform only one function. Consequently, even slight alterations in species structure may lead to a larger change in the functional structure of the soil microbiome.
Notably, there was no significant relationship between the diversity and structure of soil microbiome (not only at the species level but also at the functional level) and greenhouse vegetable productivity (Figure S1). Even the most important species and functional modules in the soil microbiome did not have a close relationship with the productivity (Figures S3, S6 and S9). Such a loose relationship between the soil microbiome and crop production could be explained by the following three aspects. First, vegetable crops (i.e., cucumber and tomato) have a fast growth rate and are subjected to continuous harvesting within a single growing season, and thus, vegetable yield formation relies more on soil nutrient supply [83]. Nevertheless, soil microorganisms/microbiome-driven organic matter decomposition and nutrient release are a relatively slow process [84] and may not meet the strong nutrient demand of vegetable crops in a short time. Second, long-term intensive agriculture (i.e., high planting intensity and high chemical inputs), such as the greenhouse vegetable system tested here, simplifies the soil microbial community and weakens the diversity, structure, and function of soil microbiome, consequently inhibiting the general role of soil microbiome on crop production [85,86,87]. Long-term excessive N supply leads to a N-enriched soil environment. However, as compared to the abundant taxa, the rare taxa (specialists, characterized by narrow geographic range, strict habitat specificity, and small local population size) cannot adapt to high N loading and, in turn, become extinct [88,89]. Despite their low abundance, the rare taxa play a crucial role in ensuring community stability and ecosystem function [38,90,91]. Third, the metagenomic sequencing covers all microorganisms in soil, including bacteria, fungi, archaea, and viruses, maybe, only one or two of which, rather than the overall microbiome, link closely to vegetable productivity in intensive greenhouse production. It is urgently necessary to investigate the long-term effect of organic substitution on soil microbiome in an intensive greenhouse system, also including the feedback of such effect on greenhouse system productivity.

4.4. Organic Substitution Enriched Denitrification-Associated Functional Gene in Greenhouse Soil

Consistent with previous observations [92,93,94,95], organic substitution affected soil N cycling and the functional genes involved (Figure 4 and Table 6). This is because altered N input drives the alterations in substrate availability for various N cycling processes and soil physicochemical and biochemical environment [96,97,98]. Additionally, across all tested soil samples, the relative abundance of the denitrification module exceeded that of other N functional modules (Figure 4). One possible reason is that, in an intensive greenhouse vegetable system, high irrigation frequency and high soil nitrate residue benefit the growth of denitrifying microbes, with the former meaning frequent anoxic conditions (low O2 availability) and the latter meaning high substrate availability [99].
We further found that, of all N cycling-related functional genes, organic substitution enriched denitrification-related functional genes, mainly nirK (encoding Cu-nitrite reductase), nirS (encoding cd1-nitrite reductase), and nosZ (encoding N2O reductase) (Table 6). Particularly, the relative abundance of the denitrification module and the nosZ gene negatively correlated with vegetable yield (Figure S11). These findings imply that a high organic substitution ratio exerts a negative influence on greenhouse productivity, probably by stimulating denitrification-associated soil N losses. However, this requires further verification (need to determine gaseous N emissions in the greenhouse system). There was a study confirming the increase in cumulative N2O emissions with increasing organic substitution ratio (from 0 to 100%) in an intensive greenhouse vegetable cultivation system [100]. Besides, based on quantitative PCR approach, Xiao et al. [101] reported that the 20% of organic substitution with milk vetch increased the abundance of nirS gene in rice-based rotation system; Yang et al. [93] found that the 50% of organic substitution with spent mushroom substrate increased nirS, nirK, and nosZI gene abundances and these increases might be attributed to organic material input rather than reduced mineral N supply; Xu et al. [102] further reported that organic substitution (even substitution ratio up to 87.5%) increased the abundance of nirS, nirK, and nosZ genes in the soil subjected to 11-year greenhouse vegetable cultivation. The above observations agree with the results obtained here. However, there were also inconsistent observations, including a decline in abundance for nirS and nirK genes but an increased abundance for nosZ gene in wheat-rice double cropping system [92,103], increase in nirS and nirK gene abundances while decrease in nosZ gene abundance in vegetable production on nitrate-rich soils [100], no change in abundance of nirS and nirK genes and declined abundance of nosZ gene in rainfed maize system located at the Northern China [104], and declined abundance of nirS gene in open-field vegetable-cropped soil in Southwest China [105]. The discrepancy between the above observations shows that cropping systems, soil background, and climate conditions may govern, at least partly, the response of soil N cycling-related functional genes to organic substitution. Exploring the response of soil N cycling to organic substitution at a regional scale or specific production scenarios is extremely necessary.

4.5. Complexity of Soil Microbial Network Depends on Organic Substitution Ratio

Here, the complexity of microbial co-occurrence network parabolically responded to increased organic substitution ratio, and moderate organic substitution (i.e., substitution ratio in 30%) strengthened network complexity most strongly (Figure 5). These supported our hypothesis that organic substitution can enhance microbial network complexity in the intensively cultivated greenhouse soil. On the other hand, by means of an insight into soil microbial species interaction, the findings obtained in this study highlight the importance of optimizing the organic substitution ratio. It is infeasible to pursue N fertilization reduction in an intensive greenhouse vegetable production system through blindly raising the organic substitution ratio because this is unconducive to improving microbial network complexity further. Some previous researchers also reported the enhancement of soil microbial network complexity by organic substitution in vegetable cultivation systems and other agricultural systems [106,107,108,109], supporting our results. Long-term excessive N input in intensive greenhouse production leads to high N loading (imposes N inhibition on microorganisms) and soil acidification. Organic substitution reversed the N-enriched soil environment and relieved N inhibition to some extent, and also increased soil pH. These may widen the niches suitable for many microbial taxa and thus contribute to establishing more species interactions. Yet, whether the increased complexity of soil microbial networks in the condition of organic substitution is mainly associated with reduced chemical N input or increased organic input is still in debate. He et al. [110] indicated that organic substitution, but not direct chemical fertilizer reduction, enhanced soil microbial network complexity in a 3-year spring wheat field experiment. On the contrary, Liu et al. [48] reported that the complexity of the bacterial co-occurrence network was enhanced by reduced N supply and only slightly affected by organic amendment in a 4-year wheat and maize cropping field experiment. Therefore, there may be distinct mechanisms of action on organic substitution-mediated network complexity enhancement across various cropping systems, soil background, and climate conditions, and the organic materials applied. In addition, we also found that organic substitution increased the ratio of negative links in the network (Figure 5A). This may arise from the decreased soil N availability (caused by organic substitution), intensifying microbial N competition. Regarding soil physicochemical variables, the pH exerted the strongest impact on the complexity of the soil microbial network (Table 7). This is in line with recent research showing that soil pH plays a crucial role in microbial interactions and thus network complexity [111,112,113,114]. Soil pH is directly correlated with the availability of soil nutrients and many metal ions, all of which significantly structure the environmental conditions (niche) associated with microbial growth and survival as well as metabolic activity. So, even a slight alteration in soil pH will have a significant influence on microbial interaction.

5. Conclusions

Our results indicated that moderate organic substitution was suitable for intensive greenhouse production, stabilizing vegetable productivity and ensuring net economic benefits, preventing soil acidification, enhancing soil fertility, and strengthening soil microbial network complexity. This finding can provide a valuable direction towards sustainable crop production and land use in intensive agricultural systems. These gains can, to a certain degree, promote the early realization of several UN Sustainable Development Goals (SDGs) (such as Goal 1: no poverty; Goal 2: zero hunger; and Goal 15: life on land), against the background of “one earth”. Notably, we observed that organic substitution enriched denitrification-associated functional genes in intensively cultivated greenhouse soil, suggesting that it is extremely necessary to incorporate eco-environmental effect monitoring (especially greenhouse gas emissions) into the organic substitution-related research framework, to achieve the coordination among sustainable vegetable production, soil quality improvement, and eco-environmental friendliness. We also believe that integrating organic substitution regime with other beneficial agricultural practices, such as enhanced efficiency fertilizers (urease and nitrification inhibitors), controlled-release fertilizers, green manure/catch crop/cover crop, biochar, and no till, etc., will accelerate the achievement of the green and sustainable development of vegetable industry.

Supplementary Materials

The following supporting information can be downloaded at: https://www.mdpi.com/article/10.3390/agriculture15141493/s1, Figure S1: Pearson’s linear relationships of annual vegetable yield and soil microbial parameters (n = 25). * p < 0.05, ** p < 0.01, *** p < 0.001. S-Shannon species: Shannon index of soil microbiome; S-Chao1 species: Chao1 index of soil microbiome; S-PCoA1: the first principal component of species structure of soil microbiome; S-PCoA2: the second principal component of species structure of soil microbiome; F-Shannon: functional Shannon index of soil microbiome; F-Chao1: functional Chao1 index of soil microbiome; F-PCoA1: the first principal component of functional structure of soil microbiome; F-PCoA2: the second principal component of functional structure of soil microbiome; Figure S2: The distance-based redundancy analysis (db-RDA) to scan the environmental variables significantly driving microbial community structure, and the significance of these physicochemical variables checked by Mantel tests; Figure S3: Pearson’s linear relationships of annual vegetable yield and the relative abundances of major microbial phyla (n = 25). * p < 0.05, ** p < 0.01, *** p < 0.001; Figure S4: Pearson’s linear relationships of soil physicochemical factors and the relative abundances of major microbial phyla and important microbial genera (n = 25). * p < 0.05, ** p < 0.01, *** p < 0.001. TOC: total organic carbon; TN: total nitrogen; AN: available nitrogen; AP: available phosphorus; AK: available potassium; Figure S5: Random Forest analysis to identify the important microbial genera that contributed to differential species structures between treatments; Figure S6: Pearson’s linear relationships of annual vegetable yield and the relative abundances of important microbial genera (n = 25). * p < 0.05, ** p < 0.01, *** p < 0.001; Figure S7: The distance-based redundancy analysis (db-RDA) to scan the environmental variables significantly driving the functional structure of soil microbiome, and the significance of these physicochemical variables checked by Mantel tests; Figure S8: Random Forest analysis to identify the important KEGG modules that contributed to differential functional structures between treatments; Figure S9: Pearson’s linear relationships of annual vegetable yield and the relative abundances of important microbial functional modules (n = 25). * p < 0.05, ** p < 0.01, *** p < 0.001; Figure S10: Pearson’s linear relationships of soil physicochemical factors and the relative abundances of important microbial functional modules (n = 25). * p < 0.05, ** p < 0.01, *** p < 0.001. TOC: total organic carbon; TN: total nitrogen; AN: available nitrogen; AP: available phosphorus; AK: available potassium; Figure S11: Pearson’s linear relationships of soil physicochemical factors and the abundance of the whole N cycling genes, the relative abundance of denitrification module, the relative abundance of assimilatory nitrate reduction, and the relative abundances of the genes involved (n = 25). * p < 0.05, ** p < 0.01, *** p < 0.001. TOC: total organic carbon; TN: total nitrogen; AN: available nitrogen; AP: available phosphorus; AK: available potassium.

Author Contributions

Conceptualization, X.L.; methodology, H.X., Y.C., Y.Z., F.W. and Y.L.; software, X.L., H.X., C.S. and B.C.; validation, X.L., H.X., Y.C. and F.W.; formal analysis, X.L., Y.C. and Y.Z.; investigation, X.L., Y.C., Y.Z., F.W. and C.S.; resources, X.L., Y.L. and C.S.; data curation, X.L. and B.C.; writing—original draft preparation, X.L., H.X., Y.C., Y.Z. and F.W.; writing—review and editing, X.L., H.X., Y.C., Y.Z. and F.W.; visualization, X.L. and Y.L.; supervision, X.L. and B.C.; project administration, X.L. and B.C.; funding acquisition, X.L. and B.C. All authors have read and agreed to the published version of the manuscript.

Funding

This research was funded by the Major Science and Technology Special Project of Henan Province (grant number: 241100110200).

Institutional Review Board Statement

Not applicable.

Data Availability Statement

The data used to support the findings of this study are available from the corresponding author upon request.

Acknowledgments

The authors would like to thank the anonymous reviewers for their helpful comments and suggestions.

Conflicts of Interest

The authors declare no conflicts of interest.

References

  1. Zhou, P.; Bai, X.; Wang, H.; Yang, M.; Bao, L.; Deng, X.; Chen, Z.; Zhou, J. Optimizing nitrogen and water management for sustainable greenhouse vegetable production with less greenhouse gas emissions. Agric. Ecosyst. Environ. 2023, 352, 108529. [Google Scholar] [CrossRef]
  2. Zhang, M.; Wang, L.; Wang, Q.; Chen, D.; Liang, X. The environmental and socioeconomic benefits of optimized fertilization for greenhouse vegetables. Sci. Total Environ. 2024, 908, 168252. [Google Scholar] [CrossRef]
  3. Dan, X.; Meng, L.; He, M.; Chen, S.; He, X.; Zhao, C.; Li, X.; Cai, Z.; Zhang, J.; Müller, C. Gross N transformations and plant N use efficiency in intensive vegetable production soils. Soil Biol. Biochem. 2022, 174, 108817. [Google Scholar] [CrossRef]
  4. Bai, X.; Jiang, Y.; Miao, H.; Xue, S.; Chen, Z.; Zhou, J. Intensive vegetable production results in high nitrate accumulation in deep soil profiles in China. Environ. Pollut. 2021, 287, 117598. [Google Scholar] [CrossRef] [PubMed]
  5. Fan, Y.; Zhang, Y.; Hess, F.; Huang, B.; Chen, Z. Nutrient balance and soil changes in plastic greenhouse vegetable production. Nutr. Cycl. Agroecosyst. 2020, 117, 77–92. [Google Scholar] [CrossRef]
  6. Li, J.; Wan, X.; Liu, X.; Chen, Y.; Slaughter, L.C.; Weindorf, D.C.; Dong, Y. Changes in soil physical and chemical characteristics in intensively cultivated greenhouse vegetable fields in North China. Soil Till. Res. 2019, 195, 104366. [Google Scholar] [CrossRef]
  7. Shen, W.; Lin, X.; Shi, W.; Min, J.; Gao, N.; Zhang, H.; Yin, R.; He, X. Higher rates of nitrogen fertilization decrease soil enzyme activities, microbial functional diversity and nitrification capacity in a Chinese polytunnel greenhouse vegetable land. Plant Soil 2010, 337, 137–150. [Google Scholar] [CrossRef]
  8. Shen, W.; Hu, M.; Qian, D.; Xue, H.; Gao, N.; Lin, X. Microbial deterioration and restoration in greenhouse-based intensive vegetable production systems. Plant Soil 2021, 463, 1–18. [Google Scholar] [CrossRef]
  9. Bi, R.; Zhang, Q.; Zhan, L.; Xu, X.; Zhang, X.; Dong, Y.; Yan, X.; Xiong, Z. Biochar and organic substitution improved net ecosystem economic benefit in intensive vegetable production. Biochar 2022, 4, 46. [Google Scholar] [CrossRef]
  10. Liu, L.; Wei, C.; Xu, X.; Min, W.; Li, Y.; Hou, Z.; Zhang, Q.; Anna, G.; Xiong, Z. Bio-manure substitution declines soil N2O and NO emissions and improves nitrogen use efficiency and vegetable quality index. J. Environ. Manag. 2024, 367, 121960. [Google Scholar] [CrossRef]
  11. Han, Z.; Leng, Y.; Sun, Z.; Li, Z.; Xu, P.; Wu, S.; Liu, S.; Li, S.; Wang, J.; Zou, J. Substitution of organic and bio-organic fertilizers for mineral fertilizers to suppress nitrous oxide emissions from intensive vegetable fields. J. Environ. Manag. 2024, 349, 119390. [Google Scholar] [CrossRef]
  12. Huang, R.; Liu, J.; He, X.; Xie, D.; Ni, J.; Xu, C.; Zhang, Y.; Ci, E.; Wang, Z.; Gao, M. Reduced mineral fertilization coupled with straw return in field mesocosm vegetable cultivation helps to coordinate greenhouse gas emissions and vegetable production. J. Soils Sediments 2020, 20, 1834–1845. [Google Scholar] [CrossRef]
  13. Wang, Y.; Yao, Z.; Wang, Y.; Yan, G.; Janz, B.; Wang, X.; Zhan, Y.; Wang, R.; Zheng, X.; Zhou, M.; et al. Characteristics of annual NH3 emissions from a conventional vegetable field under various nitrogen management strategies. J. Environ. Manag. 2023, 342, 118276. [Google Scholar] [CrossRef]
  14. Wang, J.; Zhang, L.; Liu, K.; Zhou, B.; Gao, H.; Han, X.; Liu, S.; Huang, S.; Zhang, A.; Hua, K.; et al. Minimizing the potential risk of soil nitrogen loss through optimal fertilization practices in intensive agroecosystems. Agron. Sustain. Dev. 2025, 45, 9. [Google Scholar] [CrossRef]
  15. Xu, X.; Bi, R.; Song, M.; Wang, B.; Dong, Y.; Zhang, Q.; Xiong, Z. Optimizing organic substitution: Balancing carbon sequestration and priming effects of a six-year field experiment for sustainable vegetable production. Sustain. Prod. Consump. 2024, 44, 14–24. [Google Scholar] [CrossRef]
  16. Fei, C.; Zhang, S.; Li, J.; Liang, B.; Ding, X. Partial substitution of rice husks for manure in greenhouse vegetable fields: Insight from soil carbon stock and aggregate stability. Land Degrad. Dev. 2021, 32, 3962–3972. [Google Scholar] [CrossRef]
  17. Luan, H.; Gao, W.; Huang, S.; Tang, J.; Li, M.; Zhang, H.; Chen, X. Partial substitution of chemical fertilizer with organic amendments affects soil organic carbon composition and stability in a greenhouse vegetable production system. Soil Till. Res. 2019, 191, 185–196. [Google Scholar] [CrossRef]
  18. Zhang, Y.; Gao, W.; Ma, L.; Luan, H.; Tang, J.; Li, R.; Li, M.; Huang, S.; Wang, L. Long-term partial substitution of chemical fertilizer by organic amendments influences soil microbial functional diversity of phosphorus cycling and improves phosphorus availability in greenhouse vegetable production. Agric. Ecosyst. Environ. 2023, 341, 108193. [Google Scholar] [CrossRef]
  19. Yuan, S.; Li, R.; Zhang, Y.; Luan, H.; Tang, J.; Wang, L.; Ji, H.; Huang, S. Effects of long-term partial substitution of inorganic fertilizer with pig manure and/or straw on nitrogen fractions and microbiological properties in greenhouse vegetable soils. J. Integ. Agric. 2024, 23, 2083–2098. [Google Scholar] [CrossRef]
  20. Luan, H.; Gao, W.; Huang, S.; Tang, J.; Li, M.; Zhang, H.; Chen, X.; Masiliūnas, D. Organic amendment increases soil respiration in a greenhouse vegetable production system through decreasing soil organic carbon recalcitrance and increasing carbon-degrading microbial activity. J. Soils Sediments 2020, 20, 2877–2892. [Google Scholar] [CrossRef]
  21. Zhang, Y.; Gao, W.; Luan, H.; Tang, J.; Li, R.; Li, M.; Zhang, H.; Huang, S. Effects of a decade of organic fertilizer substitution on vegetable yield and soil phosphorus pools, phosphatase activities, and the microbial community in a greenhouse vegetable production system. J. Integ. Agric. 2022, 21, 2119–2133. [Google Scholar] [CrossRef]
  22. Rong, Q.; Li, R.; Huang, S.; Tang, J.; Zhang, Y.; Wang, L. Soil microbial characteristics and yield response to partial substitution of chemical fertilizer with organic amendments in greenhouse vegetable production. J. Integ. Agric. 2018, 17, 1432–1444. [Google Scholar] [CrossRef]
  23. Luan, H.; Gao, W.; Huang, S.; Tang, J.; Li, M.; Zhang, H.; Chen, X.; Masiliūnas, D. Substitution of manure for chemical fertilizer affects soil microbial community diversity, structure and function in greenhouse vegetable production systems. PLoS ONE 2020, 15, e0214041. [Google Scholar] [CrossRef]
  24. Hijbeek, R.; ten Berge, H.F.M.; Whitmore, A.P.; Barkusky, D.; Schröder, J.J.; van Ittersum, M.K. Nitrogen fertiliser replacement values for organic amendments appear to increase with N application rates. Nutr. Cycl. Agroecosyst. 2018, 110, 105–115. [Google Scholar] [CrossRef]
  25. Zhang, X.; Fang, Q.; Zhang, T.; Ma, W.; Velthof, G.L.; Hou, Y.; Oenema, O.; Zhang, F. Benefits and trade-offs of replacing synthetic fertilizers by animal manures in crop production in China: A meta-analysis. Glob. Change Biol. 2020, 26, 888–900. [Google Scholar] [CrossRef] [PubMed]
  26. Fan, X.; Chen, Z.; Niu, Z.; Zeng, R.; Ou, J.; Liu, X.; Wang, X. Replacing synthetic nitrogen fertilizer with different types of organic materials improves grain yield in China: A meta-analysis. Agronomy 2021, 11, 2429. [Google Scholar] [CrossRef]
  27. Fan, Y.; Feng, Q.; Huang, Y.; Yang, N.; Fan, H.; Li, B.; Wang, X.; Yang, L.; Yen, H.; Wu, F.; et al. Determining optimal range of reduction rates for nitrogen fertilization based on responses of vegetable yield and nitrogen losses to reduced nitrogen fertilizer application. Sci. Total Environ. 2024, 924, 171523. [Google Scholar] [CrossRef]
  28. Liu, Y.; Zhuang, M.; Liang, X.; Lam, S.K.; Chen, D.; Malik, A.; Li, M.; Lenzen, M.; Zhang, L.; Zhang, R.; et al. Localized nitrogen management strategies can halve fertilizer use in Chinese staple crop production. Nat. Food 2024, 5, 825–835. [Google Scholar] [CrossRef]
  29. Tu, Q.; Yan, Q.; Deng, Y.; Michaletz, S.T.; Buzzard, V.; Weiser, M.D.; Waide, R.; Ning, D.; Wu, L.; He, Z.; et al. Biogeographic patterns of microbial co-occurrence ecological networks in six American forests. Soil Biol. Biochem. 2020, 148, 107897. [Google Scholar] [CrossRef]
  30. Ma, B.; Wang, H.; Dsouza, M.; Lou, J.; He, Y.; Dai, Z.; Brookes, P.C.; Xu, J.; Gilbert, J.A. Geographic patterns of co-occurrence network topological features for soil microbiota at continental scale in eastern China. ISME J. 2016, 10, 1891–1901. [Google Scholar] [CrossRef]
  31. Konopka, A.; Lindemann, S.; Fredrickson, J. Dynamics in microbial communities: Unraveling mechanisms to identify principles. ISME J. 2015, 9, 1488–1495. [Google Scholar] [CrossRef]
  32. Oña, L.; Shreekar, S.K.; Kost, C. Disentangling microbial interaction networks. Trends Microbiol. 2025, 33, 619–634. [Google Scholar] [CrossRef] [PubMed]
  33. Miao, Y.; Zhou, F.; Ding, S.; Zhu, Z.; Huo, Z.; Chen, Q.; Liu, Z. Addition of high-quality plant residue alters microbial keystone taxa and network complexity and increases soil phosphorus (P) availability. Agronomy 2024, 14, 3036. [Google Scholar] [CrossRef]
  34. Barberán, A.; Bates, S.T.; Casamayor, E.O.; Fierer, N. Using network analysis to explore co-occurrence patterns in soil microbial communities. ISME J. 2012, 6, 343–351. [Google Scholar] [CrossRef] [PubMed]
  35. Zhou, Z.; Gao, T.; Zhu, Q.; Yan, T.; Li, D.; Xue, J.; Wu, Y. Increases in bacterial community network complexity induced by biochar-based fertilizer amendments to karst calcareous soil. Geoderma 2019, 337, 691–700. [Google Scholar] [CrossRef]
  36. Yu, J.; Deem, L.M.; Crow, S.E.; Deenik, J.L.; Penton, C.R. Biochar application influences microbial assemblage complexity and composition due to soil and bioenergy crop type interactions. Soil Biol. Biochem. 2018, 117, 97–107. [Google Scholar] [CrossRef]
  37. Chen, S.; Qi, G.; Luo, T.; Zhang, H.; Jiang, Q.; Wang, R.; Zhao, X. Continuous-cropping tobacco caused variance of chemical properties and structure of bacterial network in soils. Land Degrad. Dev. 2018, 29, 4106–4120. [Google Scholar] [CrossRef]
  38. Riddley, M.; Hepp, S.; Hardeep, F.N.U.; Nayak, A.; Liu, M.; Xing, X.; Zhang, H.; Liao, J. Differential roles of deterministic and stochastic processes in structuring soil bacterial ecotypes across terrestrial ecosystems. Nat. Commun. 2025, 16, 2337. [Google Scholar] [CrossRef]
  39. Wang, K.; Xue, K.; Liu, W.; Zhang, B.; Wu, W.; Zhao, R.; Cui, L.; Wang, Z.; Zhou, S.; Tang, L.; et al. Warming decouples associations between microbial network complexity and ecosystem multifunctionality in alpine grasslands. Agric. Ecosyst. Environ. 2024, 374, 109189. [Google Scholar] [CrossRef]
  40. Yang, X.; Song, W.; Yang, X.; Yang, T.; Bao, W.; Wang, C.; Li, J.; Zhong, S.; Jiang, Q.; Li, L.; et al. Microbial network structure, not plant and microbial community diversity, regulates multifunctionality under increased precipitation in a cold steppe. Front. Microbiol. 2024, 14, 1349747. [Google Scholar] [CrossRef]
  41. Li, S.; Zhang, B.; Li, Y.; Zhao, T.; Zheng, J.; Qiao, J.; Zhang, F.; Han, G.; Bisseling, T.; Zhao, M. Destabilized bacterial and fungal network weakens soil multifunctionality under increasing grazing stress. Appl. Soil Ecol. 2025, 206, 105827. [Google Scholar] [CrossRef]
  42. Chen, W.; Wang, J.; Chen, X.; Meng, Z.; Xu, R.; Duoji, D.; Zhang, J.; He, J.; Wang, Z.; Chen, J.; et al. Soil microbial network complexity predicts ecosystem function along elevation gradients on the Tibetan Plateau. Soil Biol. Biochem. 2022, 172, 108766. [Google Scholar] [CrossRef]
  43. Chen, X.; Tian, J.; Liu, S.; Wei, Z.; Wang, Y.; Song, X.; Zhang, X.; Bai, Y. The complexity of the bacterial community in response to fertilization determines forage production in a semiarid grassland. Ecol. Indic. 2022, 139, 108918. [Google Scholar] [CrossRef]
  44. Luo, W.; Wang, P.; Liu, J.; Tao, J. Microbial keystone taxa and network complexity, rather than diversity, sustain soil multifunctionality along an elevational gradient in a subtropical karst mountain. CATENA 2025, 256, 109115. [Google Scholar] [CrossRef]
  45. Xiao, Y.; Wang, J.; Wang, B.; Fan, B.; Zhou, G. Soil microbial network complexity predicts soil multifunctionality better than soil microbial diversity during grassland-farmland-shrubland conversion on the Qinghai-Tibetan Plateau. Agric. Ecosyst. Environ. 2025, 379, 109356. [Google Scholar] [CrossRef]
  46. Tao, J.; Meng, D.; Qin, C.; Liu, X.; Liang, Y.; Xiao, Y.; Liu, Z.; Gu, Y.; Li, J.; Yin, H. Integrated network analysis reveals the importance of microbial interactions for maize growth. Appl. Microbiol. Biotechnol. 2018, 102, 3805–3818. [Google Scholar] [CrossRef]
  47. Biggs, C.R.; Yeager, L.A.; Bolser, D.G.; Bonsell, C.; Dichiera, A.M.; Hou, Z.; Keyser, S.R.; Khursigara, A.J.; Lu, K.; Muth, A.F.; et al. Does functional redundancy affect ecological stability and resilience? A review and meta-analysis. Ecosphere 2020, 11, e03184. [Google Scholar] [CrossRef]
  48. Liu, X.; Zhang, Y.; Wang, F. Effect of reduced subsequent N supply and organic amendment on soil bacterial community in a wheat-maize rotation system with over-fertilization. Appl. Soil Ecol. 2023, 181, 104659. [Google Scholar] [CrossRef]
  49. Singh, B.K.; Jiang, G.; Wei, Z.; Sáez-Sandino, T.; Gao, M.; Liu, H.; Xiong, C. Plant pathogens, microbiomes, and soil health. Trends Microbiol. 2025. [Google Scholar] [CrossRef]
  50. Yu, Y.; Wu, M.; Petropoulos, E.; Zhang, J.; Nie, J.; Liao, Y.; Li, Z.; Lin, X.; Feng, Y. Responses of paddy soil bacterial community assembly to different long-term fertilizations in southeast China. Sci. Total Environ. 2019, 656, 625–633. [Google Scholar] [CrossRef]
  51. Xue, C.; Ryan Penton, C.; Zhu, C.; Chen, H.; Duan, Y.; Peng, C.; Guo, S.; Ling, N.; Shen, Q. Alterations in soil fungal community composition and network assemblage structure by different long-term fertilization regimes are correlated to the soil ionome. Biol. Fert. Soils 2018, 54, 95–106. [Google Scholar] [CrossRef]
  52. Ma, B.; Lv, X.; Cai, Y.; Chang, S.X.; Dyck, M.F. Liming does not counteract the influence of long-term fertilization on soil bacterial community structure and its co-occurrence pattern. Soil Biol. Biochem. 2018, 123, 45–53. [Google Scholar] [CrossRef]
  53. Li, B.; Roley, S.S.; Duncan, D.S.; Guo, J.; Quensen, J.F.; Yu, H.; Tiedje, J.M. Long-term excess nitrogen fertilizer increases sensitivity of soil microbial community to seasonal change revealed by ecological network and metagenome analyses. Soil Biol. Biochem. 2021, 160, 108349. [Google Scholar] [CrossRef]
  54. Zhang, Y.; Niu, D.; Li, Q.; Liu, H.; Wang, Y.; Xu, J.; Du, B.; Guo, D.; Liu, Y.; Fu, H.; et al. Nonlinear response of soil microbial network complexity to long-term nitrogen addition in a semiarid grassland: Implications for soil carbon processes. Agric. Ecosyst. Environ. 2025, 380, 109407. [Google Scholar] [CrossRef]
  55. Liu, X.; Cheng, Y.; Zhang, Y.; Li, Y.; Wang, F.; Shen, C. Soil microbiome response to reduced nitrogen supply in an over-fertilized wheat-maize system. Agronomy 2024, 14, 2631. [Google Scholar] [CrossRef]
  56. Wang, C.; Shi, Z.; Li, A.; Geng, T.; Liu, L.; Liu, W. Long-term nitrogen input reduces soil bacterial network complexity by shifts in life history strategy in temperate grassland. iMeta 2024, 3, e194. [Google Scholar] [CrossRef]
  57. Ma, L.; Niu, W.; Li, G.; Du, Y.; Sun, J.; Zhang, Q.; Siddique, K.H.M. Crucial role of rare taxa in preserving bacterial community stability. Land Degrad. Dev. 2024, 35, 1397–1410. [Google Scholar] [CrossRef]
  58. Ling, N.; Zhu, C.; Xue, C.; Chen, H.; Duan, Y.; Peng, C.; Guo, S.; Shen, Q. Insight into how organic amendments can shape the soil microbiome in long-term field experiments as revealed by network analysis. Soil Biol. Biochem. 2016, 99, 137–149. [Google Scholar] [CrossRef]
  59. Schmid, C.A.O.; Schröder, P.; Armbruster, M.; Schloter, M. Organic amendments in a long-term field trial—Consequences for the bulk soil bacterial community as revealed by network analysis. Microb. Ecol. 2018, 76, 226–239. [Google Scholar] [CrossRef]
  60. Liu, Z.; Guo, Q.; Feng, Z.; Liu, Z.; Li, H.; Sun, Y.; Liu, C.; Lai, H. Long-term organic fertilization improves the productivity of kiwifruit (Actinidia chinensis Planch.) through increasing rhizosphere microbial diversity and network complexity. Appl. Soil Ecol. 2020, 147, 103426. [Google Scholar] [CrossRef]
  61. Yang, L.; Sun, R.; Li, J.; Zhai, L.; Cui, H.; Fan, B.; Wang, H.; Liu, H. Combined organic-inorganic fertilization builds higher stability of soil and root microbial networks than exclusive mineral or organic fertilization. Soil Ecol. Lett. 2022, 5, 220142. [Google Scholar] [CrossRef]
  62. Liu, H.; Huang, X.; Tan, W.; Di, H.; Xu, J.; Li, Y. High manure load reduces bacterial diversity and network complexity in a paddy soil under crop rotations. Soil Ecol. Lett. 2020, 2, 104–119. [Google Scholar] [CrossRef]
  63. Liu, X.; Cheng, Y.; Zhang, Y.; Wang, F.; Li, Y.; Shen, C.; Chen, B. Exploring suitable nitrification inhibitor in an intensively cultivated greenhouse soil and its effect on the abundance and community of soil ammonia oxidizers. Agronomy 2025, 15, 255. [Google Scholar] [CrossRef]
  64. Bao, S. Analytical Methods in Soil and Agricultural Chemistry; China Agricultural Press: Beijing, China, 2008. [Google Scholar]
  65. Li, Z.; Luo, Y.; Teng, Y. Analytical Methods in Soil and Environmental Microbiology; Science Press: Beijing, China, 2008. [Google Scholar]
  66. Ren, Y.; Yu, G.; Shi, C.; Liu, L.; Guo, Q.; Han, C.; Zhang, D.; Zhang, L.; Liu, B.; Gao, H.; et al. Majorbio Cloud: A one-stop, comprehensive bioinformatic platform for multiomics analyses. iMeta 2022, 1, e12. [Google Scholar] [CrossRef]
  67. Han, C.; Shi, C.; Liu, L.; Han, J.; Yang, Q.; Wang, Y.; Li, X.; Fu, W.; Gao, H.; Huang, H.; et al. Majorbio Cloud 2024: Update single-cell and multiomics workflows. iMeta 2024, 3, e217. [Google Scholar] [CrossRef]
  68. Hartman, K.; van der Heijden, M.G.A.; Wittwer, R.A.; Banerjee, S.; Walser, J.C.; Schlaeppi, K. Cropping practices manipulate abundance patterns of root and soil microbiome members paving the way to smart farming. Microbiome 2018, 6, 14. [Google Scholar]
  69. Gao, M.; Xiong, C.; Gao, C.; Tsui, C.K.M.; Wang, M.; Zhou, X.; Zhang, A.; Cai, L. Disease-induced changes in plant microbiome assembly and functional adaptation. Microbiome 2021, 9, 187. [Google Scholar] [CrossRef]
  70. Liu, C.; Li, X.; Mansoldo, F.R.P.; An, J.; Kou, Y.; Zhang, X.; Zeng, J.; Vermelho, A.; Wang, J.; Yao, M. Microbial habitat specificity largely affects microbial co-occurrence patterns and functional profiles in wetland soils. Geoderma 2022, 418, 115866. [Google Scholar] [CrossRef]
  71. Liu, X.; Wang, F.; Zhang, Y.; Shen, C. N fertilizer reduction combined with organic amendment enhances soil multifunctionality by altering nutrient availability and fungal community structure in an intensive grain production system. J. Soil Sci. Plant Nutr. 2024, 24, 3969–3985. [Google Scholar] [CrossRef]
  72. Zhang, F.; Cui, Z.; Zhang, W. Managing nutrient for both food security and environmental sustainability in China: An experiment for the world. Front. Agric. Sci. Eng. 2014, 1, 53–61. [Google Scholar]
  73. Wang, X.; Zou, C.; Gao, X.; Guan, X.; Zhang, W.; Zhang, Y.; Shi, X.; Chen, X. Nitrous oxide emissions in Chinese vegetable systems: A meta-analysis. Environ. Pollut. 2018, 239, 375–383. [Google Scholar] [CrossRef] [PubMed]
  74. Qasim, W.; Xia, L.; Lin, S.; Wan, L.; Zhao, Y.; Butterbach-Bahl, K. Global greenhouse vegetable production systems are hotspots of soil N2O emissions and nitrogen leaching: A meta-analysis. Environ. Pollut. 2021, 272, 116372. [Google Scholar] [CrossRef] [PubMed]
  75. Ding, W.; Lei, H.; Xu, C.; Huadong, K.; Hu, L. Characteristics and spatial distribution of apparent nitrogen balance in the greenhouse vegetable cropping system in China. J. Agric. Resour. Environ. 2020, 37, 353–360. [Google Scholar]
  76. Dong, J.; Xu, Y.; Quan, Z.; Yin, Y.; Zhao, Y.; Xu, Q.; Tian, K.; Huang, B.; Cai, Z.; Ma, Y.; et al. The obstacles and countermeasures of soil sustainability in protected horticulture in China. Acta Pedol. Sinica. 2024, 61, 1467–1480. [Google Scholar]
  77. Du, L.; Zhang, Z.; Chen, Y.; Wang, Y.; Zhou, C.; Yang, H.; Zhang, W. Heterogeneous impact of soil acidification on crop yield reduction and its regulatory variables: A global meta-analysis. Field Crop Res. 2024, 319, 109643. [Google Scholar] [CrossRef]
  78. Guo, H.; Ye, C.; Zhang, H.; Pan, S.; Ji, Y.; Li, Z.; Liu, M.; Zhou, X.; Du, G.; Hu, F.; et al. Long-term nitrogen & phosphorus additions reduce soil microbial respiration but increase its temperature sensitivity in a Tibetan alpine meadow. Soil Biol. Biochem. 2017, 113, 26–34. [Google Scholar]
  79. Xu, P.; Wu, J.; Wang, H.; Han, S.; Zhu, J.; Fu, Q.; Geng, M.; Hu, H.; Huang, Q. Long-term partial substitution of chemical fertilizer with green manure regulated organic matter mineralization in paddy soil dominantly by modulating organic carbon quality. Plant Soil 2021, 468, 459–473. [Google Scholar] [CrossRef]
  80. Yuan, X.; Niu, D.; Gherardi, L.A.; Liu, Y.; Wang, Y.; Elser, J.J.; Fu, H. Linkages of stoichiometric imbalances to soil microbial respiration with increasing nitrogen addition: Evidence from a long-term grassland experiment. Soil Biol. Biochem. 2019, 138, 107580. [Google Scholar] [CrossRef]
  81. Nannipieri, P.; Giagnoni, L.; Renella, G.; Puglisi, E.; Ceccanti, B.; Masciandaro, G.; Fornasier, F.; Moscatelli, M.C.; Marinari, S. Soil enzymology: Classical and molecular approaches. Biol. Fert. Soils 2012, 48, 743–762. [Google Scholar] [CrossRef]
  82. Zhang, H.; Luo, G.; Wang, Y.; Fei, J.; Xiangmin, R.; Peng, J.; Tian, C.; Zhang, Y. Crop rotation-driven change in physicochemical properties regulates microbial diversity, dominant components, and community complexity in paddy soils. Agric. Ecosyst. Environ. 2023, 343, 108278. [Google Scholar] [CrossRef]
  83. Bergstrand, K. Organic fertilizers in greenhouse production systems—A review. Sci. Hortic. 2022, 295, 110855. [Google Scholar] [CrossRef]
  84. Gutser, R.; Ebertseder, T.; Weber, A.; Schraml, M.; Schmidhalter, U. Short-term and residual availability of nitrogen after long-term application of organic fertilizers on arable land. J. Plant Nutr. Soil Sci. 2005, 168, 439–446. [Google Scholar] [CrossRef]
  85. Tsiafouli, M.A.; Thébault, E.; Sgardelis, S.P.; de Ruiter, P.C.; van der Putten, W.H.; Birkhofer, K.; Hemerik, L.; de Vries, F.T.; Bardgett, R.D.; Brady, M.V.; et al. Intensive agriculture reduces soil biodiversity across Europe. Glob. Change Biol. 2015, 21, 973–985. [Google Scholar] [CrossRef] [PubMed]
  86. Yan, B.; Deng, T.; Shi, L. Towards sustainable productivity of greenhouse vegetable soils: Limiting factors and mitigation strategies. Plants 2024, 13, 2885. [Google Scholar] [CrossRef] [PubMed]
  87. De Graaff, M.; Hornslein, N.; Throop, H.L.; Kardol, P.; van Diepen, L.T.A. Effects of agricultural intensification on soil biodiversity and implications for ecosystem functioning: A meta-analysis. Adv. Agron. 2019, 155, 1–44. [Google Scholar]
  88. Chakraborty, D.; Jousset, A.; Wei, Z.; Banerjee, S. Rare taxa in the core microbiome. Trends Microbiol. 2025, 33, 727–737. [Google Scholar] [CrossRef]
  89. Xu, Q.; Vandenkoornhuyse, P.; Li, L.; Guo, J.; Zhu, C.; Guo, S.; Ling, N.; Shen, Q. Microbial generalists and specialists differently contribute to the community diversity in farmland soils. J. Adv. Res. 2022, 40, 17–27. [Google Scholar] [CrossRef]
  90. Zhao, Y.; Ran, W.; Xu, W.; Song, Y. ITS amplicon sequencing revealed that rare taxa of tea rhizosphere fungi are closely related to the environment and provide feedback on tea tree diseases. Microbiol. Spectr. 2024, 13, e01889-24. [Google Scholar] [CrossRef]
  91. Zhang, N.; Dong, C.; Li, L.; Li, H.; Li, W.; Huang, F. Rare bacterial and fungal taxa respond strongly to combined inorganic and organic fertilization under short-term conditions. Appl. Soil Ecol. 2024, 203, 105639. [Google Scholar] [CrossRef]
  92. Kong, D.; Jin, Y.; Yu, K.; Swaney, D.P.; Liu, S.; Zou, J. Low N2O emissions from wheat in a wheat-rice double cropping system due to manure substitution are associated with changes in the abundance of functional microbes. Agric. Ecosyst. Environ. 2021, 311, 107318. [Google Scholar] [CrossRef]
  93. Yang, G.; Ma, Y.; Xu, W.; Ma, X.; Lu, C. Spent mushroom substrate as a substitute for chemical fertilizer changes N-cycling genes and reduces N2O emission in different textured soils. Biol. Fert. Soils 2024, 60, 87–99. [Google Scholar] [CrossRef]
  94. Shen, H.; Zhang, Q.; Zhu, S.; Duan, P.; Zhang, X.; Wu, Z.; Xiong, Z. Organic substitutions aggravated microbial nitrogen limitation and decreased nitrogen-cycling gene abundances in a three-year greenhouse vegetable field. J. Environ. Manag. 2021, 288, 112379. [Google Scholar] [CrossRef]
  95. Hou, H.; Liu, X.; Zhou, W.; Ji, J.; Lan, X.; Lv, Z.; Liu, Y.; Zhang, J.; Müller, C. N transformation mechanisms and N dynamics of organic fertilisers as partial substitutes for chemical fertilisers in paddy soils. J. Soils Sediments 2022, 22, 2516–2529. [Google Scholar] [CrossRef]
  96. Zhong, Y.; Yan, W.; Shangguan, Z. Soil carbon and nitrogen fractions in the soil profile and their response to long-term nitrogen fertilization in a wheat field. CATENA 2015, 135, 38–46. [Google Scholar] [CrossRef]
  97. Zhang, M.; Wang, C.; Luo, S.; Xia, Y.; Xu, Q.; Yang, L.; Yue, K.; Fan, Y. Influence of nitrogen fertilization on soil organic nitrogen components in agroecosystems: A meta-analysis. Acta Ecol. Sin. 2025, 45, 1328–1338. [Google Scholar]
  98. Chen, Y.; Li, Y.; Qiu, T.; He, H.; Liu, J.; Duan, C.; Cui, Y.; Huang, M.; Wu, C.; Fang, L. High nitrogen fertilizer input enhanced the microbial network complexity in the paddy soil. Soil Ecol. Lett. 2023, 6, 230205. [Google Scholar] [CrossRef]
  99. Rohe, L.; Apelt, B.; Vogel, H.J.; Well, R.; Wu, G.M.; Schlüter, S. Denitrification in soil as a function of oxygen availability at the microscale. Biogeosciences 2021, 18, 1185–1201. [Google Scholar] [CrossRef]
  100. Ju, S.; Min, J.; Li, Z.; Hao, Y.; Wu, X.; Kronzucker, H.J.; Shi, W. Manure-nitrogen substitution for urea leads to higher yield but increases N2O emission in vegetable production on nitrate-rich soils. Agric. Ecosyst. Environ. 2025, 383, 109541. [Google Scholar] [CrossRef]
  101. Xiao, X.; Xie, G.; Yang, Z.; He, N.; Yang, D.; Liu, M. Variation in abundance, diversity, and composition of nirK and nirS containing denitrifying bacterial communities in a red paddy soil as affected by combined organic-chemical fertilization. Appl. Soil Ecol. 2021, 166, 104001. [Google Scholar] [CrossRef]
  102. Xu, W.; Zhao, D.; Ma, Y.; Yang, G.; Ambus, P.L.; Liu, X.; Luo, J. Effects of long-term organic fertilizer substitutions on soil nitrous oxide emissions and nitrogen cycling gene abundance in a greenhouse vegetable field. Appl. Soil Ecol. 2023, 188, 104877. [Google Scholar] [CrossRef]
  103. Kong, D.; Zhang, X.; Yu, Q.; Jin, Y.; Jiang, P.; Wu, S.; Liu, S.; Zou, J. Mitigation of N2O emissions in water-saving paddy fields: Evaluating organic fertilizer substitution and microbial mechanisms. J. Integr. Agric. 2024, 23, 3159–3173. [Google Scholar] [CrossRef]
  104. Xie, L.; Li, L.; Xie, J.; Wang, J.; Mumtaz, M.Z.; Effah, Z.; Fudjoe, S.K.; Khaskheli, M.A.; Luo, Z.; Li, L. Optimal substitution of inorganic fertilizer with organic amendment sustains rainfed maize production and decreases soil N2O emissions by modifying denitrifying bacterial communities in Northern China. Eur. J. Agron. 2024, 160, 127287. [Google Scholar] [CrossRef]
  105. Huang, R.; Wang, Y.; Liu, J.; Gao, J.; Zhang, Y.; Ni, J.; Xie, D.; Wang, Z.; Gao, M. Partial substitution of chemical fertilizer by organic materials changed the abundance, diversity, and activity of nirS-type denitrifying bacterial communities in a vegetable soil. Appl. Soil Ecol. 2020, 152, 103589. [Google Scholar] [CrossRef]
  106. Tang, Q.; Xia, Y.; Ti, C.; Shan, J.; Zhou, W.; Li, C.; Yan, X.; Yan, X. Partial organic fertilizer substitution promotes soil multifunctionality by increasing microbial community diversity and complexity. Pedosphere 2023, 33, 407–420. [Google Scholar] [CrossRef]
  107. Gao, Y.; Wang, J.; Ge, Y.; Lei, Y.; Wei, X.; Xu, Y.; Zheng, X. Partial substitution of nitrogen fertilizers by organic products of rural waste co-composting impacts on farmland soil quality. Environ. Technol. Innov. 2024, 33, 103470. [Google Scholar] [CrossRef]
  108. Wang, X.; Zhao, S.; Xu, X.; Liu, M.; Jiang, R.; Zhang, J.; Duan, Y.; He, P.; Zhou, W. Response of soil microbial properties in the life cycle of potatoes to organic substitution regimes in North China. Soil Till. Res. 2024, 237, 106000. [Google Scholar] [CrossRef]
  109. Tian, L.; Wang, Y.; Jin, D.; Zhou, Y.; Mukhamed, B.; Liu, D.; Feng, B. The application of biochar and organic fertilizer substitution regulates the diversities of habitat specialist bacterial communities within soil aggregates in proso millet farmland. Biochar 2025, 7, 6. [Google Scholar] [CrossRef]
  110. He, H.; Peng, M.; Hou, Z.; Li, J. Organic substitution contrasting direct fertilizer reduction increases wheat productivity, soil quality, microbial diversity and network complexity. Environ. Technol. Innov. 2024, 36, 103784. [Google Scholar] [CrossRef]
  111. Che, J.; Wu, Y.; Yang, H.; Chang, Y.; Wu, W.; Lyu, L.; Wang, X.; Cao, F.; Li, W. Enhanced complexity of interkingdom co-occurrence networks in blueberry rhizosphere microbial communities under soil pH stress. Appl. Soil Ecol. 2025, 212, 106191. [Google Scholar] [CrossRef]
  112. Yang, Y.; Shi, Y.; Fang, J.; Chu, H.; Adams, J.M. Soil microbial network complexity varies with pH as a continuum, not a threshold, across the North China Plain. Front. Microbiol. 2022, 13, 895687. [Google Scholar] [CrossRef]
  113. Zhang, J.; Guo, Z.; Liu, J.; Pan, X.; Huang, Y.; Cui, X.; Wang, Y.; Jin, Y.; Sheng, J. Neutral pH induces complex and stable soil microbial networks in agricultural ecosystems. Plant Soil 2025. [Google Scholar] [CrossRef]
  114. Guo, Y.; Song, B.; Li, A.; Wu, Q.; Huang, H.; Li, N.; Yang, Y.; Adams, J.M.; Yang, L. Higher pH is associated with enhanced co-occurrence network complexity, stability and nutrient cycling functions in the rice rhizosphere microbiome. Environ. Microbiol. 2022, 24, 6200–6219. [Google Scholar] [CrossRef] [PubMed]
Figure 1. The effects of organic substitution on cucumber yield (A), tomato yield (B), and the annual vegetable yield (C). FCFP, farmers’ conventional fertilization practice; 85%FCFP+CM, substituting 15% of chemical N fertilizer with chicken manure; 70%FCFP+CM, substituting 30% of chemical N fertilizer with chicken manure; 55%FCFP+CM, substituting 45% of chemical N fertilizer with chicken manure; 40%FCFP+CM, substituting 60% of chemical N fertilizer with chicken manure. Different lowercase letters represent significant differences between treatments at the p < 0.05 level (n = 15). In each boxplot, the box represents the 25th–75th percentiles, and the whiskers show the 10th–90th percentiles. Horizontal black lines show the median values, and horizontal pink lines show the average values. The black dots at the bottom and top represent the minimum and maximum values, respectively.
Agriculture 15 01493 g001
Figure 2. The effects of organic substitution on species richness and diversity of soil microbiome (A), the species level-based PCoA analysis (B), the community members at phylum level in various fertilization treatments (C), and the effects of organic substitution on the relative abundance of various community members (D). FCFP, farmers’ conventional fertilization practice; 85%FCFP+CM, substituting 15% of chemical N fertilizer with chicken manure; 70%FCFP+CM, substituting 30% of chemical N fertilizer with chicken manure; 55%FCFP+CM, substituting 45% of chemical N fertilizer with chicken manure; 40%FCFP+CM, substituting 60% of chemical N fertilizer with chicken manure. Data in panels A, B, and D are expressed by mean ± standard deviation (n = 5). Different letters above the error bars indicate significant differences between treatments at p < 0.05.
Agriculture 15 01493 g002
Figure 3. The effects of organic substitution on the KO (KEGG Orthology)-based functional richness and diversity of soil microbiome (A) and the KO (KEGG Orthology)-based PCoA analysis (B). FCFP, farmers’ conventional fertilization practice; 85%FCFP+CM, substituting 15% of chemical N fertilizer with chicken manure; 70%FCFP+CM, substituting 30% of chemical N fertilizer with chicken manure; 55%FCFP+CM, substituting 45% of chemical N fertilizer with chicken manure; 40%FCFP+CM, substituting 60% of chemical N fertilizer with chicken manure. Data in the figure are reflected by mean ± standard deviation (n = 5). Different letters above the error bars indicate significant differences between treatments at p < 0.05.
Agriculture 15 01493 g003
Figure 4. The changes in relative abundance of soil N cycling-associated KEGG modules. FCFP, farmers’ conventional fertilization practice; 85%FCFP+CM, substituting 15% of chemical N fertilizer with chicken manure; 70%FCFP+CM, substituting 30% of chemical N fertilizer with chicken manure; 55%FCFP+CM, substituting 45% of chemical N fertilizer with chicken manure; 40%FCFP+CM, substituting 60% of chemical N fertilizer with chicken manure. Data in the figure are expressed by mean ± standard deviation (n = 5). Different letters above the error bars indicate significant differences between treatments at p < 0.05. The blue font represents the name of this functional module.
Agriculture 15 01493 g004
Figure 5. The influence of organic substitution on soil microbial co-occurrence networks (A). A link indicates a significant Spearman correlation. The nodes belonging to the same module are marked with the same color. The comparison of the microbial network complexity between treatments (B). Pearson correlation testing between organic substitution ratio and microbial network complexity (C). FCFP, farmers’ conventional fertilization practice; 85%FCFP+CM, substituting 15% of chemical N fertilizer with chicken manure; 70%FCFP+CM, substituting 30% of chemical N fertilizer with chicken manure; 55%FCFP+CM, substituting 45% of chemical N fertilizer with chicken manure; 40%FCFP+CM, substituting 60% of chemical N fertilizer with chicken manure.
Agriculture 15 01493 g005
Table 1. Experimental design and fertilization rates employed in this study (kg hm−2).
TreatmentCucumber SeasonTomato SeasonThe Whole Year
NPKChicken ManureNPKChicken ManureNPKChicken Manure
FCFP12351681794092512613430216029431370
85%FCFP+CM1050168179414,660786126134301836294313714,660
70%FCFP+CM865168179429,321647126134301512294313729,321
55%FCFP+CM680168179443,981508126134301188294313743,981
40%FCFP+CM494168179458,64237012613430864294313758,642
Table 2. Economic benefit analysis of the treatments employed in this study.
TreatmentAnnual Input (USD hm−2)Annual Output (USD hm−2)Net Economic Benefits
(USD hm−2)
Chemical FertilizerChicken ManureCucumberTomato
FCFP9507053014 ± 2493 a17483 ± 897 a60990 ± 2580 a
85%FCFP+CM808153754887 ± 4808 a18087 ± 1672 a64357 ± 4261 a
70%FCFP+CM6655107451933 ± 4435 a17111 ± 1340 a61316 ± 4740 a
55%FCFP+CM5229161141285 ± 3079 b13165 ± 1585 b47611 ± 5128 b
40%FCFP+CM3803214734465 ± 5038 c12208 ± 1567 b40722 ± 6038 c
FCFP, farmers’ conventional fertilization practice; 85%FCFP+CM, substituting 15% of chemical N fertilizer with chicken manure; 70%FCFP+CM, substituting 30% of chemical N fertilizer with chicken manure; 55%FCFP+CM, substituting 45% of chemical N fertilizer with chicken manure; 40%FCFP+CM, substituting 60% of chemical N fertilizer with chicken manure. Data in the table are represented by mean ± standard deviation (n = 15). Different lowercase letters in the same column represent significant differences between treatments at the p < 0.05 level. The prices for chemical fertilizer (based on compound fertilizer), chicken manure, cucumber, and tomato were 0.70 USD kg−1, 0.04 USD kg−1, 0.70 USD kg−1, and 0.28 USD kg−1, respectively. Notably, we only calculated fertilizer costs and no other input (such as pesticides, herbicides, labor, energy, time, etc.) was included, and therefore, actual economic benefits were lower than the data listed in this table.
Table 3. Effect of organic substitution on soil physicochemical and biochemical properties.
FCFP85%FCFP+CM70%FCFP+CM55%FCFP+CM40%FCFP+CM
TOC/g kg−113.79 ± 0.99 c16.54 ± 0.92 a15.92 ± 0.56 ab15.47 ± 1.23 ab14.91 ± 0.83 bc
TN/g kg−11.62 ± 0.64 a1.84 ± 0.44 a1.93 ± 0.49 a1.77 ± 0.48 a1.67 ± 0.29 a
pH7.65 ± 0.09 c7.54 ± 0.16 c7.88 ± 0.10 a7.83 ± 0.07 ab7.70 ± 0.15 bc
AN/mg kg−1161.50 ± 2.88 a124.55 ± 21.08 bc111.04 ± 5.29 c134.20 ± 12.68 b114.64 ± 2.67 c
AP/mg kg−1213.53 ± 16.89 a196.23 ± 6.40 ab184.25 ± 13.54 b206.19 ± 14.64 a211.00 ± 4.59 a
AK/mg kg−1338.00 ± 13.29 d483.00 ± 63.65 a410.60 ± 7.40 bc422.00 ± 31.57 b371.40 ± 12.76 cd
CAT/mL KMnO4 g−1 h−18.37 ± 0.42 b7.93 ± 0.18 c8.62 ± 0.27 ab8.81 ± 0.09 a8.59 ± 0.10 ab
URE/µg NH4+-N g−1 h−177.66 ± 2.78 a77.48 ± 2.54 a74.15 ± 4.31 ab71.13 ± 1.49 b71.79 ± 3.64 b
GLU/µg glucose g−1 h−145.91 ± 10.04 ab46.98 ± 8.70 a35.59 ± 7.16 b32.79 ± 7.99 b42.43 ± 11.61 ab
SUR/µg glucose g−1 h−1154.94 ± 13.04 d198.09 ± 6.12 ab201.66 ± 8.99 a190.06 ± 2.68 bc186.05 ± 1.79 c
ALP/µg phenol g−1 h−16.07 ± 1.12 a4.40 ± 0.59 b6.90 ± 1.20 a5.63 ± 0.76 ab4.44 ± 1.60 b
ARY/µg PNP g−1 h−10.11 ± 0.04 abc0.18 ± 0.05 a0.16 ± 0.06 ab0.09 ± 0.06 bc0.06 ± 0.02 c
GME11.94 ± 1.05 ab12.71 ± 1.00 a12.75 ± 1.38 a10.26 ± 2.68 b10.31 ± 1.36 b
FCFP, farmers’ conventional fertilization practice; 85%FCFP+CM, substituting 15% of chemical N fertilizer with chicken manure; 70%FCFP+CM, substituting 30% of chemical N fertilizer with chicken manure; 55%FCFP+CM, substituting 45% of chemical N fertilizer with chicken manure; 40%FCFP+CM, substituting 60% of chemical N fertilizer with chicken manure. Data in the table are represented by mean ± standard deviation (n = 5). Different lowercase letters within the same row represent significant differences between treatments at the p < 0.05 level. TOC, total organic carbon; TN, total nitrogen; AN, available nitrogen; AP, available phosphorus; AK, available potassium; CAT, catalase; URE, urease; GLU, β-glucosidase; SUR, sucrase; ALP, alkaline phosphatase; ARY, arylsulfatase; GME, soil mean enzyme activity.
Table 4. The influence of organic substitution on the relative abundance of the top 30 important genera predicted by random forest modeling (%).
GenusFCFP85%FCFP+CM70%FCFP+CM55%FCFP+CM40%FCFP+CM
Acidobacterium0.28 ± 0.05 d0.34 ± 0.01 b0.38 ± 0.03 a0.29 ± 0.01 cd0.33 ± 0.02 bc
Rhodospirillum0.33 ± 0.08 a0.22 ± 0.02 b0.20 ± 0.03 b0.31 ± 0.02 a0.21 ± 0.02 b
Microvirga0.25 ± 0.02 c0.34 ± 0.04 ab0.37 ± 0.05 a0.33 ± 0.02 b0.30 ± 0.01 b
Hypericibacter0.23 ± 0.03 b0.22 ± 0.01 b0.19 ± 0.03 c0.27 ± 0.01 a0.23 ± 0.02 b
Nitrosopumilus0.08 ± 0.02 c0.11 ± 0.03 b0.15 ± 0.01 a0.14 ± 0.02 a0.12 ± 0.01 ab
Methyloceanibacter0.26 ± 0.05 b0.37 ± 0.09 a0.27 ± 0.03 b0.29 ± 0.04 b0.36 ± 0.02 a
Promineifilum0.17 ± 0.03 c0.46 ± 0.03 a0.47 ± 0.07 a0.35 ± 0.08 b0.36 ± 0.03 b
unclassified Nitrososphaeraceae1.59 ± 0.65 c2.63 ± 0.81 b4.02 ± 0.10 a3.36 ± 0.48 ab2.95 ± 0.33 b
Aldersonia0.31 ± 0.08 a0.12 ± 0.01 b0.10 ± 0.03 b0.10 ± 0.03 b0.09 ± 0.01 b
Steroidobacter1.36 ± 0.21 a1.13 ± 0.15 ab0.97 ± 0.11 b1.08 ± 0.27 b1.34 ± 0.03 a
Rubrobacter0.19 ± 0.02 b0.23 ± 0.01 a0.23 ± 0.01 a0.20 ± 0.01 b0.20 ± 0.01 b
unclassified Dormibacteraeota0.14 ± 0.02 b0.18 ± 0.02 a0.17 ± 0.01 a0.15 ± 0.01 b0.14 ± 0.01 b
Dongia0.56 ± 0.13 a0.41 ± 0.05 b0.36 ± 0.05 b0.53 ± 0.05 a0.37 ± 0.06 b
Chloracidobacterium1.58 ± 0.96 a0.94 ± 0.11 b0.88 ± 0.12 b0.90 ± 0.07 b1.32 ± 0.16 ab
Phenylobacterium0.14 ± 0.01 a0.12 ± 0.01 ab0.12 ± 0.00 c0.12 ± 0.01 bc0.13 ± 0.00 ab
Reyranella0.20 ± 0.07 a0.19 ± 0.01 a0.18 ± 0.01 a0.19 ± 0.00 a0.17 ± 0.00 a
Rhodococcus0.45 ± 0.09 a0.21 ± 0.02 b0.19 ± 0.06 b0.19 ± 0.04 b0.18 ± 0.02 b
Sphingomonas3.05 ± 1.05 ab2.47 ± 0.36 ab2.12 ± 0.54 b2.87 ± 0.78 ab3.30 ± 0.44 a
Parvularcula0.19 ± 0.07 a0.08 ± 0.02 bc0.04 ± 0.02 c0.11 ± 0.04 abc0.15 ± 0.10 ab
Nocardia0.24 ± 0.03 a0.12 ± 0.01 b0.11 ± 0.02 b0.11 ± 0.02 b0.11 ± 0.01 b
Gaiellasilicea0.27 ± 0.05 c0.46 ± 0.07 a0.46 ± 0.06 a0.37 ± 0.05 b0.33 ± 0.04 bc
Methylobacterium0.11 ± 0.01 c0.14 ± 0.01 ab0.14 ± 0.01 a0.14 ± 0.01 ab0.13 ± 0.00 b
Pelagibius0.13 ± 0.02 b0.18 ± 0.02 a0.18 ± 0.03 a0.18 ± 0.01 a0.14 ± 0.01 b
Actinomadura0.14 ± 0.06 a0.13 ± 0.01 a0.12 ± 0.01 a0.11 ± 0.01 a0.11 ± 0.01 a
Defluviicoccus0.11 ± 0.01 c0.15 ± 0.02 ab0.16 ± 0.02 a0.15 ± 0.02 ab0.13 ± 0.01 bc
Inquilinus0.10 ± 0.01 c0.14 ± 0.02 ab0.14 ± 0.02 a0.14 ± 0.01 ab0.12 ± 0.02 bc
Limnobacter0.19 ± 0.05 b0.30 ± 0.14 ab0.26 ± 0.08 b0.30 ± 0.09 ab0.42 ± 0.08 a
Leptolyngbya0.18 ± 0.03 b0.20 ± 0.01 b0.19 ± 0.01 b0.20 ± 0.02 b0.23 ± 0.02 a
Ilumatobacter0.67 ± 0.18 ab0.62 ± 0.12 ab0.67 ± 0.16 ab0.50 ± 0.09 b0.71 ± 0.06 a
unclassified Nitrososphaerota0.54 ± 0.15 b0.76 ± 0.25 ab0.97 ± 0.15 ab1.13 ± 0.61 a0.67 ± 0.04 b
FCFP, farmers’ conventional fertilization practice; 85%FCFP+CM, substituting 15% of chemical N fertilizer with chicken manure; 70%FCFP+CM, substituting 30% of chemical N fertilizer with chicken manure; 55%FCFP+CM, substituting 45% of chemical N fertilizer with chicken manure; 40%FCFP+CM, substituting 60% of chemical N fertilizer with chicken manure. Data in the table are expressed by mean ± standard deviation (n = 5). Different lowercase letters within the same row indicate significant differences between treatments at p < 0.05.
Table 5. The influence of organic substitution on the relative abundance of the top 30 important KEGG modules predicted by random forest modeling (%).
KEGG ModuleFunctionFCFP85%FCFP+CM70%FCFP+CM55%FCFP+CM40%FCFP+CM
M00786Fumitremorgin alkaloid biosynthesis0.008 ± 0.004 a0.003 ± 0.001 b0.003 ± 0.000 b0.004 ± 0.001 b0.004 ± 0.001 b
M00378F420 biosynthesis0.106 ± 0.018 c0.134 ± 0.012 ab0.149 ± 0.009 a0.143 ± 0.021 a0.120 ± 0.005 bc
M00538Toluene degradation0.027 ± 0.002 a0.023 ± 0.002 b0.018 ± 0.002 c0.024 ± 0.002 b0.022 ± 0.002 b
M00094Ceramide biosynthesis0.008 ± 0.002 a0.008 ± 0.001 a0.007 ± 0.001 a0.008 ± 0.001 a0.008 ± 0.001 a
M00736Nocardicin A biosynthesis0.009 ± 0.005 a0.004 ± 0.001 b0.004 ± 0.001 b0.005 ± 0.001 b0.004 ± 0.001 b
M00023Tryptophan biosynthesis0.546 ± 0.015 b0.555 ± 0.010 ab0.565 ± 0.003 a0.563 ± 0.011 a0.554 ± 0.004 ab
M00960Lysine degradation0.111 ± 0.017 a0.106 ± 0.004 ab0.098 ± 0.006 b0.109 ± 0.003 ab0.109 ± 0.004 ab
M00144NADH: quinone oxidoreductase1.799 ± 0.009 bc1.828 ± 0.020 a1.813 ± 0.030 ab1.781 ± 0.012 cd1.770 ± 0.023 d
M00358Coenzyme M biosynthesis0.093 ± 0.009 c0.106 ± 0.006 b0.117 ± 0.010 a0.109 ± 0.005 ab0.101 ± 0.005 bc
M00096C5 isoprenoid biosynthesis0.558 ± 0.003 a0.543 ± 0.007 b0.527 ± 0.012 c0.540 ± 0.011 b0.556 ± 0.007 a
M00763Ornithine biosynthesis0.050 ± 0.005 c0.061 ± 0.012 bc0.075 ± 0.007 a0.073 ± 0.015 ab0.063 ± 0.003 abc
M00529Denitrification0.569 ± 0.078 b0.621 ± 0.013 a0.622 ± 0.019 a0.636 ± 0.020 a0.651 ± 0.011 a
M00883Lipoic acid biosynthesis0.096 ± 0.003 a0.100 ± 0.003 a0.100 ± 0.005 a0.097 ± 0.003 a0.098 ± 0.005 a
M00959Guanine ribonucleotide degradation0.587 ± 0.022 b0.614 ± 0.008 a0.608 ± 0.012 a0.590 ± 0.003 b0.597 ± 0.005 ab
M00847Heme biosynthesis0.101 ± 0.008 c0.113 ± 0.009 bc0.132 ± 0.007 a0.121 ± 0.014 ab0.113 ± 0.004 bc
M00159V/A-type ATPase0.092 ± 0.016 c0.125 ± 0.027 ab0.153 ± 0.013 a0.146 ± 0.030 ab0.119 ± 0.006 b
M00884Lipoic acid biosynthesis0.085 ± 0.004 a0.089 ± 0.002 a0.089 ± 0.005 a0.086 ± 0.002 a0.087 ± 0.003 a
M00967Flavone degradation0.0008 ± 0.0003 b0.0009 ± 0.0004 b0.0007 ± 0.0002 b0.001 ± 0.0003 ab0.0014 ± 0.0006 a
M00914Coenzyme A biosynthesis0.295 ± 0.009 c0.320 ± 0.014 ab0.333 ± 0.011 a0.330 ± 0.019 ab0.315 ± 0.006 b
M00128Ubiquinone biosynthesis0.024 ± 0.007 a0.017 ± 0.001 b0.017 ± 0.002 b0.019 ± 0.001 b0.019 ± 0.002 ab
M00072N-glycosylation by oligosaccharyltransferase0.011 ± 0.002 b0.015 ± 0.005 ab0.017 ± 0.005 ab0.018 ± 0.007 a0.012 ± 0.001 ab
M00911Riboflavin biosynthesis0.175 ± 0.010 b0.183 ± 0.012 ab0.190 ± 0.006 a0.194 ± 0.007 a0.183 ± 0.006 ab
M00031Lysine biosynthesis0.070 ± 0.010 c0.086 ± 0.018 bc0.108 ± 0.010 a0.105 ± 0.024 ab0.088 ± 0.005 abc
M00083Fatty acid biosynthesis1.216 ± 0.046 a1.194 ± 0.008 ab1.170 ± 0.032 b1.178 ± 0.021 ab1.189 ± 0.019 ab
M00861beta-Oxidation0.099 ± 0.070 a0.059 ± 0.005 a0.058 ± 0.003 a0.060 ± 0.001 a0.063 ± 0.002 a
M00882Lipoic acid biosynthesis0.085 ± 0.004 a0.090 ± 0.002 a0.089 ± 0.006 a0.086 ± 0.002 a0.087 ± 0.003 a
M00055N-glycan precursor biosynthesis0.043 ± 0.003 c0.051 ± 0.006 b0.060 ± 0.004 a0.051 ± 0.005 b0.050 ± 0.003 b
M00664Nodulation0.012 ± 0.001 b0.015 ± 0.001 a0.016 ± 0.001 a0.015 ± 0.002 a0.015 ± 0.001 a
M00146NADH dehydrogenase (ubiquinone) 1 alpha subcomplex0.027 ± 0.005 b0.028 ± 0.002 b0.028 ± 0.002 b0.034 ± 0.005 a0.032 ± 0.003 ab
M00545Trans-cinnamate
degradation
0.378 ± 0.021 d0.405 ± 0.016 ab0.418 ± 0.003 a0.398 ± 0.015 bc0.384 ± 0.009 cd
FCFP, farmers’ conventional fertilization practice; 85%FCFP+CM, substituting 15% of chemical N fertilizer with chicken manure; 70%FCFP+CM, substituting 30% of chemical N fertilizer with chicken manure; 55%FCFP+CM, substituting 45% of chemical N fertilizer with chicken manure; 40%FCFP+CM, substituting 60% of chemical N fertilizer with chicken manure. Data in the table are expressed by mean ± standard deviation (n = 5). Different lowercase letters within the same row indicate significant differences between treatments at p < 0.05.
Table 6. The changes in relative abundance of soil N cycling genes associated with denitrification and assimilatory nitrate reduction (%).
KEGG ModuleGeneFCFP85%FCFP+CM70%FCFP+CM55%FCFP+CM40%FCFP+CM
DenitrificationnarG0.0505 ± 0.0081 a0.0545 ± 0.0035 a0.0501 ± 0.0040 a0.0540 ± 0.0029 a0.0567 ± 0.0020 a
DenitrificationnapA0.0152 ± 0.0032 a0.0157 ± 0.0010 a0.0153 ± 0.0007 a0.0158 ± 0.0013 a0.0163 ± 0.0023 a
DenitrificationnapB0.0037 ± 0.0010 a0.0043 ± 0.0005 a0.0040 ± 0.0006 a0.0041 ± 0.0008 a0.0040 ± 0.0007 a
DenitrificationnirK0.0624 ± 0.0087 b0.0784 ± 0.0065 a0.0859 ± 0.0022 a0.0857 ± 0.0046 a0.0788 ± 0.0026 a
DenitrificationnirS0.0064 ± 0.0009 b0.0080 ± 0.0007 a0.0083 ± 0.0002 a0.0078 ± 0.0009 a0.0087 ± 0.0009 a
DenitrificationnorB0.0259 ± 0.0059 a0.0253 ± 0.0013 a0.0238 ± 0.0017 a0.0239 ± 0.0029 a0.0275 ± 0.0009 a
DenitrificationnorC0.0057 ± 0.0015 a0.0062 ± 0.0004 a0.0059 ± 0.0005 a0.0062 ± 0.0008 a0.0065 ± 0.0005 a
DenitrificationnosZ0.0232 ± 0.0037 b0.0246 ± 0.0009 ab0.0262 ± 0.0012 ab0.0254 ± 0.0024 ab0.0274 ± 0.0014 a
Assimilatory nitrate reductionnarB0.0061 ± 0.0019 a0.0046 ± 0.0005 b0.0053 ± 0.0004 ab0.0044 ± 0.0008 b0.0044 ± 0.0005 b
Assimilatory nitrate reductionnasA0.0406 ± 0.0031 ab0.0394 ± 0.0026 ab0.0368 ± 0.0033 b0.0367 ± 0.0037 b0.0427 ± 0.0011 a
Assimilatory nitrate reductionnasB0.0012 ± 0.0003 a0.0010 ± 0.0001 a0.0009 ± 0.0002 a0.0010 ± 0.0003 a0.0010 ± 0.0001 a
Assimilatory nitrate reductionnirA0.0070 ± 0.0006 bc0.0081 ± 0.0010 a0.0084 ± 0.0005 a0.0078 ± 0.0001 ab0.0068 ± 0.0006 c
Assimilatory nitrate reductionnasE0.0086 ± 0.0047 a0.0070 ± 0.0008 a0.0078 ± 0.0006 a0.0075 ± 0.0013 a0.0064 ± 0.0006 a
Assimilatory nitrate reductionnasD0.0119 ± 0.0019 a0.0100 ± 0.0005 b0.0098 ± 0.0005 b0.0091 ± 0.0005 b0.0104 ± 0.0008 b
FCFP, farmers’ conventional fertilization practice; 85%FCFP+CM, substituting 15% of chemical N fertilizer with chicken manure; 70%FCFP+CM, substituting 30% of chemical N fertilizer with chicken manure; 55%FCFP+CM, substituting 45% of chemical N fertilizer with chicken manure; 40%FCFP+CM, substituting 60% of chemical N fertilizer with chicken manure. Data in the figure are represented by mean ± standard deviation (n = 5). Data in the table are expressed by mean ± standard deviation (n = 5). Different lowercase letters within the same row indicate significant differences between treatments at p < 0.05.
Table 7. The influences of soil physicochemical properties on microbial co-occurrence network complexity through the stepwise multiple linear regression modeling (n = 25).
Dependent VariableIndependent
Variable
Contribution of Independent
Variable
Significance of Independent
Variable
Coefficient of Determination of Full ModelSignificance of Full Model
ADpH68.90%p < 0.001R2 = 0.592p < 0.001
AP33.00%p = 0.019
AD, average degree; AP, available phosphorus.
Disclaimer/Publisher’s Note: The statements, opinions and data contained in all publications are solely those of the individual author(s) and contributor(s) and not of MDPI and/or the editor(s). MDPI and/or the editor(s) disclaim responsibility for any injury to people or property resulting from any ideas, methods, instructions or products referred to in the content.

