Article

Selenium Alleviates Low-Temperature Stress in Rice by Regulating Metabolic Networks and Functional Genes

1
Beet Quality Inspection and Test Center, Ministry of Agriculture and Rural Affairs, College of Advanced Agriculture and Ecological Environment, Heilongjiang University, Harbin 150080, China
2
Harbin Academy of Agricultural Sciences, Harbin 150030, China
3
School of Resources and Environment, Northeast Agricultural University, Harbin 150030, China
*
Authors to whom correspondence should be addressed.
Agriculture 2025, 15(14), 1489; https://doi.org/10.3390/agriculture15141489
Submission received: 17 May 2025 / Revised: 8 July 2025 / Accepted: 9 July 2025 / Published: 11 July 2025
(This article belongs to the Special Issue Genetic Research and Breeding to Improve Stress Resistance in Rice)

Abstract

Low temperature is a major abiotic stress affecting rice productivity. Selenium (Se) treatment has been shown to enhance plant resilience to cold stress. In this study, low concentrations of selenium (ColdSe1) alleviated the adverse effects of cold stress on rice seedlings, improving fresh weight, plant height, and chlorophyll content by 36.9%, 24.3%, and 8.4%, respectively, while reducing malondialdehyde (MDA) content by 29.1%. Se treatment also increased the activities of antioxidant enzymes, including catalase (CAT), superoxide dismutase (SOD), and peroxidase (POD), by 25.2%, 42.7%, and 33.3%, respectively, and upregulated flavonoids, soluble sugars, cysteine (Cys), glutathione (GSH), and oxidized glutathione (GSSG). Transcriptome analysis revealed that ColdSe1 treatment upregulated genes associated with amino and nucleotide sugar metabolism, glutathione metabolism, and fructose and mannose metabolism. It also alleviated cold stress by modulating the MAPK signaling pathway, phytohormone signaling, and photosynthesis-related pathways, enriching genes and transcription factors linked to antioxidant metabolism and photosynthesis. Metabolomic analyses showed that ColdSe1 positively influenced amino acid glucose metabolism, glycerolipid metabolism, hormonal pathways, and alanine/glutamate pathways under cold stress, while also upregulating metabolites associated with plant secondary metabolites (e.g., flavonoids, phenolic compounds) and antioxidant metabolism (e.g., α-linolenic acid metabolism). In contrast, high selenium concentrations (ColdSe2) disrupted phenylpropanoid biosynthesis, α-linolenic acid metabolism, and ABC transporter function, exacerbating cold-stress injury. This study highlights the critical role of Se in mitigating cold stress in rice, offering a theoretical basis for its application as an agricultural stress reliever.

1. Introduction

Rice, a staple food crop, is highly susceptible to low temperatures. Low-temperature stress during the vegetative growth stage can severely impair seedling development, leading to reduced yields [1]. In China, crops in high-altitude and high-latitude regions are prone to encountering chilling injury. Specifically, the spring cold waves in northern China can disrupt seedling establishment, resulting in significant agricultural economic losses [2]. Therefore, developing effective technologies to enhance the low-temperature tolerance of rice seedlings is crucial for addressing this issue.
Low-concentration selenium (Se) applications have been demonstrated to exert beneficial effects on plant growth [3]. Extensive research has demonstrated its applicability across a range of crops, including rice, maize, rapeseed, mustard, and tobacco [4]. Notably, selenium has been shown to enhance physiological resilience in cold-stressed strawberry seedlings, while also alleviating oxidative stress and elevating key metabolites such as starch, amino acids, and proline in coffee plants under low-temperature conditions [5,6].
In tea plants, Se enhances cold tolerance through stabilizing photosynthetic and membrane systems, while also regulating growth and secondary metabolism [7]. Additionally, Se application boosts photosynthesis, growth, and biomass production in rice, resulting in increased tiller numbers, grains per panicle, grain weight, and overall yield. Concurrently, selenium improves antioxidant capacity by reducing malondialdehyde (MDA) accumulation and enhancing antioxidant enzyme activity, thereby contributing to yield enhancement [8]. Additionally, selenium improves grain quality by increasing amylose, phenolic compound, flavonoid, lipid, and protein content [9]. Under low-temperature stress (0–5 °C), plant leaf cells undergo significant physiological adjustments [10]. This stress induces excessive production of reactive oxygen species (ROS), including superoxide anions, hydroxyl radicals, and hydrogen peroxide [11], which activate specific ROS-scavenging mechanisms [12]. These mechanisms include enzymatic antioxidants (e.g., superoxide dismutase, catalase, ascorbate peroxidase) and non-enzymatic compounds (e.g., reduced ascorbate, glutathione) [13], with the ascorbate–glutathione cycle playing a pivotal role in mitigating oxidative damage [14,15]. However, the regulatory mechanisms by which selenium governs these antioxidant systems in cold-stressed rice remain poorly understood.
Se, as an essential trace element, plays a pivotal role in enhancing rice productivity and stress tolerance, thereby contributing to food security [16]. The application of bio-nano Se has demonstrated remarkable potential in improving rice yield, grain quality, and organic selenium content [17]. Notably, foliar application of nanosil exhibits superior bioavailability compared to soil treatments, particularly during the critical seedling stage when leaves serve as the primary defense mechanism against cold stress. Despite these advancements, the molecular mechanisms underlying rice’s response to selenium remain inadequately understood. To advance the cultivation of selenium-enriched rice in cold regions, we employed an integrated approach combining physiology, RNA sequencing (RNA-Seq), and LC-MS metabolomics to investigate the mechanisms of selenium-mediated cold adaptation. Specifically, this study (i) quantifies selenium-dependent phenotypic variations; (ii) assesses physiological responses; (iii) identifies differentially expressed genes (DEGs) and metabolic pathway perturbations; and (iv) elucidates molecular adaptation processes. These findings will lay the foundation for the mechanistic framework of selenium-enhanced cold tolerance in rice.

2. Materials and Methods

2.1. Plant Material and Growing Conditions

The experiment was conducted at Heilongjiang University in 2024. Uniform, plump, and vigorous rice seeds were disinfected with 1% sodium hypochlorite for 30 min, followed by soaking in clean water for 24 h. Subsequently, seeds were incubated at 32 °C in darkness for 48 h. Those with optimal germination were selected and sown in high-temperature sterilized sand, where they were cultivated in an artificial climate chamber. During this period, a quantified 1/2 Hoagland nutrient solution was supplied daily. The cultivation conditions in the control climate chamber were maintained at 25 °C with a 10 h day and 14 h night cycle. When rice seedlings reached the two-leaf stage, four treatments were implemented: (1) CK: no cold treatment and no selenium (Se) treatment; (2) Cold: treatment at 9 °C for 10 days; (3) ColdSe1: treatment at 9 °C for 10 days with the addition of Se at a concentration of 1 mg/kg; (4) ColdSe2: treatment at 9 °C for 10 days with the addition of Se at a concentration of 4 mg/kg. The Se concentrations were determined based on relevant studies regarding Se-enriched rice [18]. Each treatment was replicated three times, with nutrient solutions replaced weekly.

2.2. Measurement of Morphological and Physiological Traits

After 10 days of treatment, rice plants exhibiting comparable growth conditions were selected from each treatment group to measure fresh weight and plant height. Leaves were collected, wrapped in aluminum foil, and frozen in liquid nitrogen before being transferred to a −80 °C freezer for analysis of enzyme-related indicators, oxidative stress, transcriptomes, and metabolomes. Chlorophyll, glutathione (GSH), oxidized glutathione (GSSH), cysteine (Cys), soluble sugars, flavonoids, malondialdehyde (MDA), catalase (CAT), peroxidase (POD), and superoxide dismutase (SOD) were determined using standard kits provided by Shanghai Enzyme-linked Biotechnology Co., Ltd. (Shanghai, China) (www.mlbio.cn) (accessed on 3 December 2024).

2.3. Library Construction for Omics Analysis

RNA isolation was performed using the Tiangen Plant Total RNA Extraction Kit (Tiangen Biotech (Beijing) Co., Ltd., Beijing, China). The concentration and quality of the extracted RNA were assessed using the Agilent 2100 Bioanalyzer system (Agilent Technologies, Inc., Santa Clara, CA, USA). RNA samples that met the quality control standards were frozen in dry ice and subsequently transported to Shanghai Majorbio Co., Ltd. for further experiments. During the cDNA library preparation stage, paired-end sequencing with a depth of 3 million reads and targeted library preparation methods were employed to ensure data accuracy and integrity. Specifically, the mRNA fraction was isolated from total RNA using a magnetic bead-based method. The isolated mRNA was treated with a specialized buffer to induce fragmentation, and the resulting fragments served as templates for cDNA synthesis. The double-stranded cDNA products were purified using the AMPure XP bead system (Beckman Coulter Life Sciences, Beverly, CA, USA), followed by end repair, polyA tail addition, and adapter ligation. The modified cDNA was size-selected using AMPure XP bead system, and a complete cDNA library was constructed through PCR amplification. The library concentration was accurately quantified using quantitative PCR to ensure it was no less than 2 nM. The quality-checked cDNA library was ultimately sequenced on the Illumina sequencing platform (Illumina, Inc., San Diego, CA, USA). Sequencing data were aligned to the rice reference genome (Oryza_sativa.IRGSP-1.0.dna.toplevel.fa.gz) using HISAT2 version 2.2.1 software (https://daehwankimlab.github.io/hisat2/download/) (accessed on 16 May 2025).

2.4. Quality Control of Transcriptome Data

Transcript assembly was performed using Cufflinks version 2.2.0 software to identify both known and novel transcripts. Specific filtering criteria included the following: first, the removal of sequences containing adapters; second, the exclusion of paired fragments when the proportion of N bases in any sequence fragment exceeded 10%; and finally, the removal of corresponding paired fragments if the proportion of low-quality bases (Q ≤ 20) in any sequence fragment surpassed 50%. Read counts for each sample gene were obtained using RSEM [19], based on the results of the genome comparison and the genome annotation files. Differentially expressed genes (DEGs) were selected using a false discovery rate (FDR) threshold of <0.05 and a |log2 fold change (FC)| > 1. By integrating resources from the Gene Ontology (GO) and Kyoto Encyclopedia of Genes and Genomes (KEGG) databases, systematic annotation of gene functions was performed. At a significance level of FDR ≤ 0.05, the functional categories and metabolic pathways of differentially expressed genes were clearly identified.

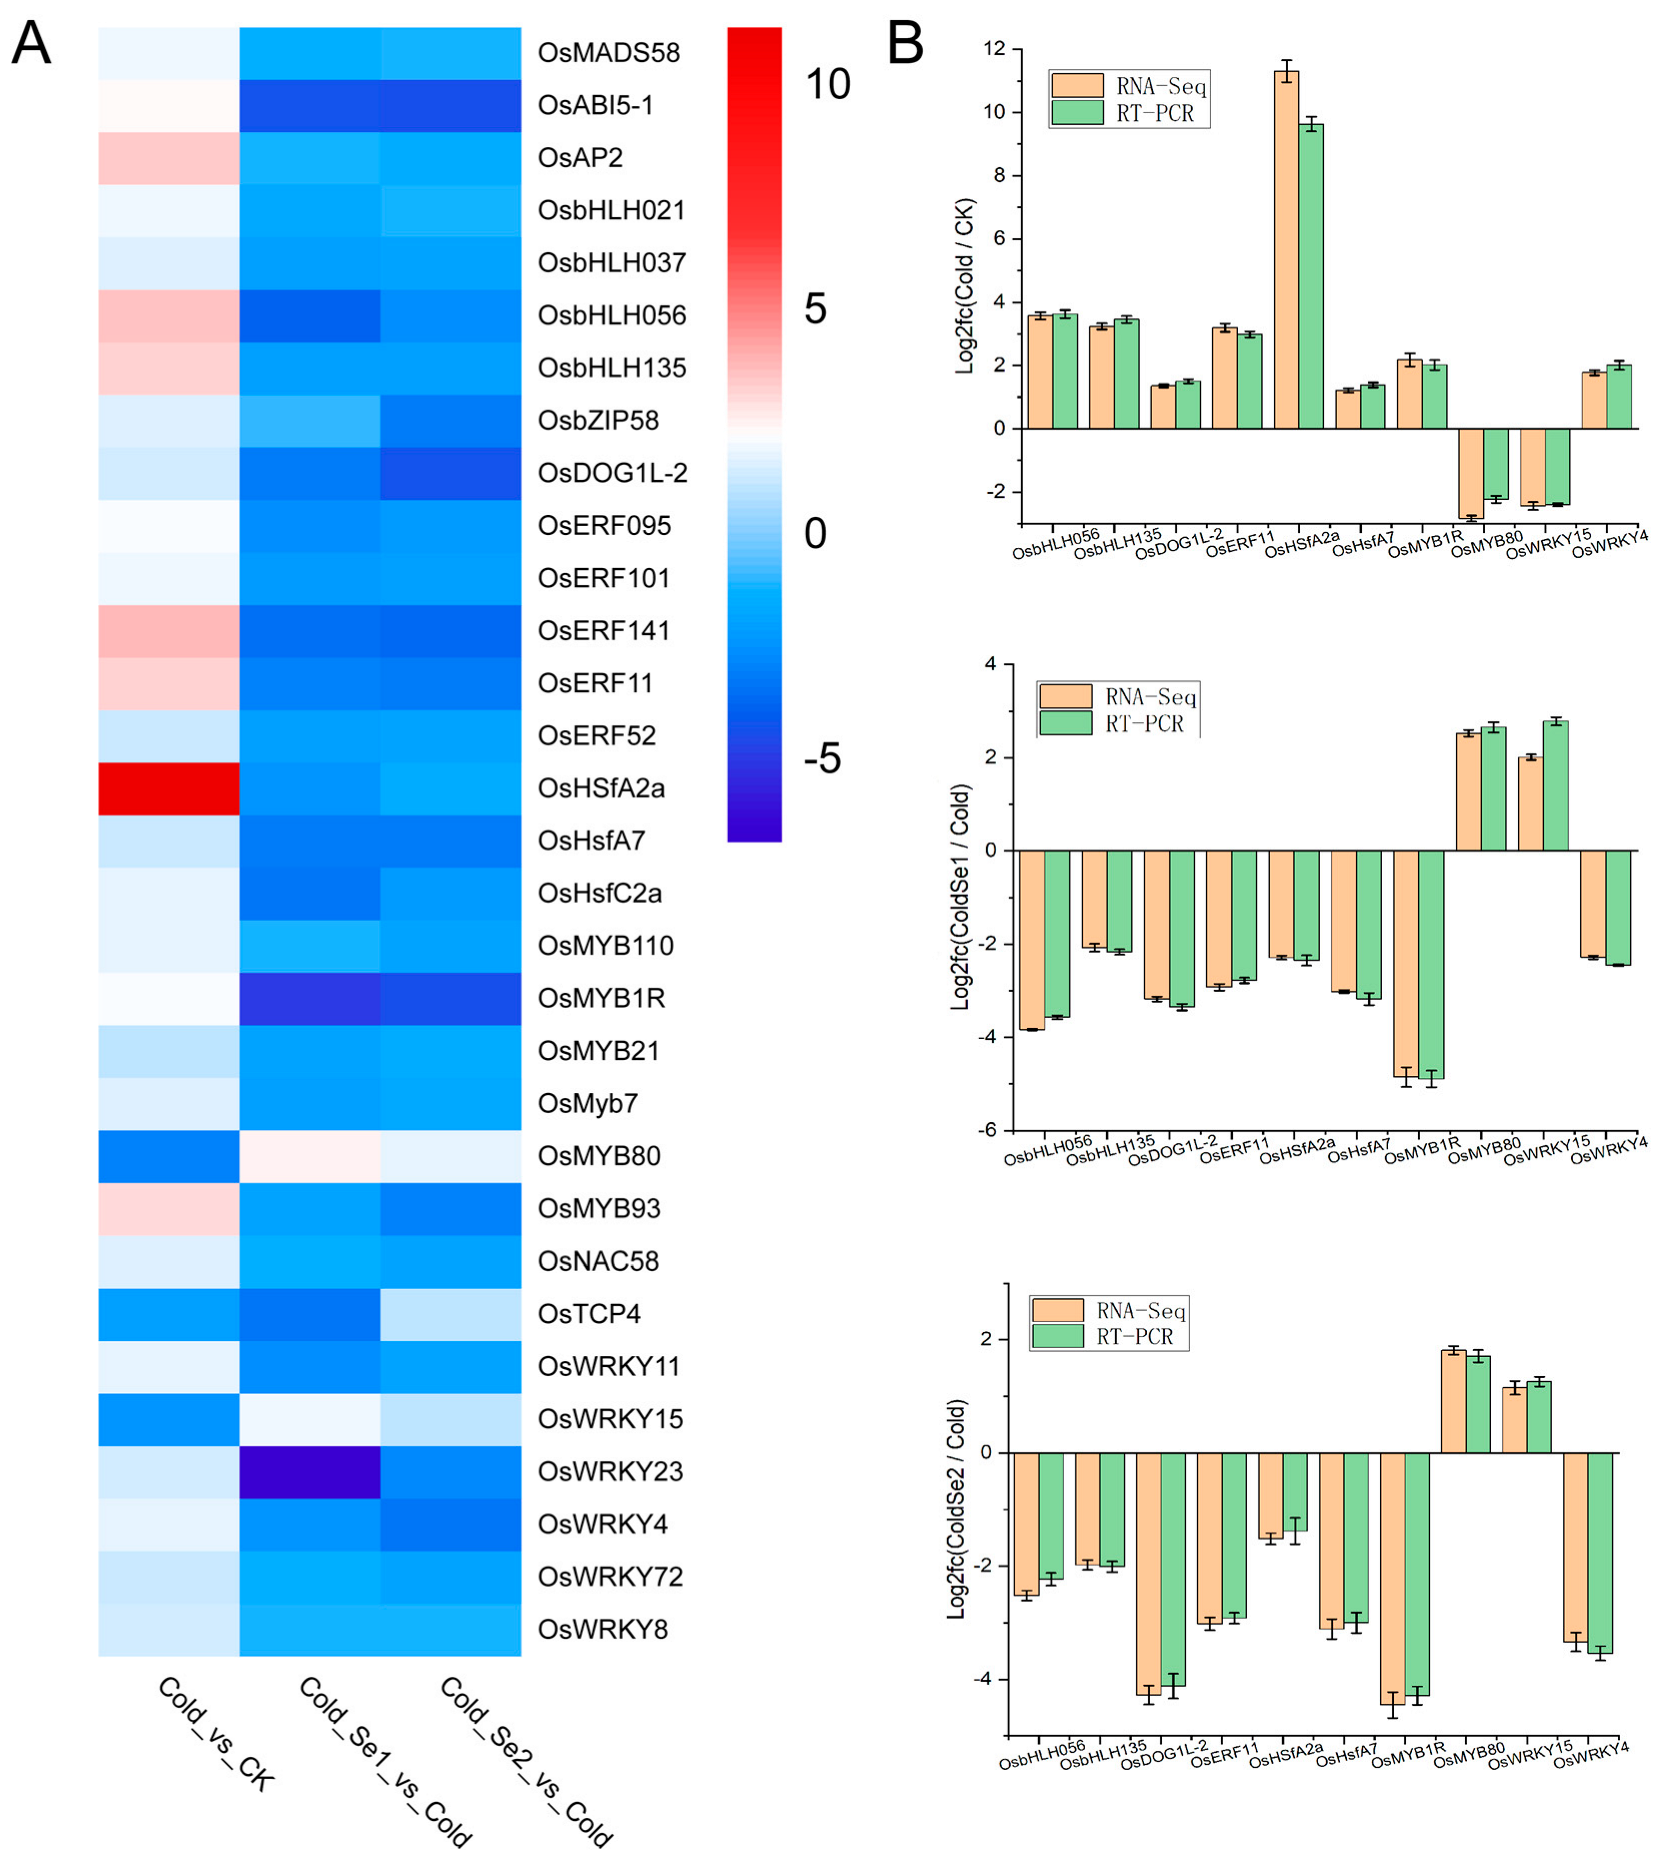
2.5. Validation of Differentially Expressed Transcription Factors Associated with Selenium Induction Using qRT-PCR

The purified total RNA was subjected to reverse transcription using the PrimeScript RT Master Mix (Takara Bio Inc., Shiga, Japan). Gene expression analysis was performed on the Applied Biosystems QuantStudio 3 system (Thermo Fisher Scientific, Dreieich, Germany), utilizing SYBR Premix Ex Taq II (Takara Bio Inc., Kusatsu, Shiga, Japan) as the detection reagent. For data normalization, Osactin1 was selected as the endogenous reference gene [20]. The relative quantitative analysis of the target gene was conducted using the comparative 2−ΔΔCT value method [21]. The correlation between the RNA-Seq and qRT-PCR experimental results was evaluated and graphically represented using Origin 2018 software (OriginLab, Northampton, MA, USA). Detailed information regarding all specific primer sequences involved in the experimental process is provided in Table S1.

2.6. Metabolomics Analysis

In this study, metabolites in the samples were systematically detected and analyzed through metabolomics analysis. Initially, an internal standard solution at a concentration of 1 μg/mL was added to the sample fragments, corresponding to a volume of 8 μL. Subsequently, 2 mL of methanol was added for preliminary treatment. Following this, 2 mL of dichloromethane was incorporated and thoroughly mixed. An additional 2 mL of dichloromethane and 1.6 mL of ultrapure water were then added, and the supernatant was discarded after centrifugation to ensure the integrity of the extraction process. Two replicate extractions of the remaining supernatant were performed using dichloromethane. The collected supernatant was then concentrated and dried under a nitrogen atmosphere, followed by re-solubilization in 1 mL of isopropanol and filtration through a 0.22 μm organic filter membrane. For the metabolomic analysis, an AB Sciex Triple 4 quadrupole electrospray ionization mass spectrometer (ESI/MS) (AB Sciex, Marlborough, MA, USA) coupled with a Shimadzu UPLC LC-2A (Shimadzu, Kyoto, Japan) ultra-high-performance liquid chromatography system was employed. The methodology was adapted from the work of Gwak et al. (2014) [22]. Qualitative identification of metabolites was achieved by determining the precise molecular weights of the characteristic peaks in the samples using high-resolution QTOF mass spectrometry and comparing them with metabolite information in the database. For quantitative analysis, the ion signal intensities of the characteristic peaks in the mass spectrometry diagram served as the basis for quantification, ensuring the accuracy and reliability of the analysis results.

2.7. Statistical Analysis

The analysis of variables derived from the experimental data was conducted using SPSS version 22.0 (Softonic International, Barcelona, Spain). A one-way analysis of variance (ANOVA) was employed to evaluate the statistical differences between the treatment groups. Results from Fisher’s Least Significant Difference (LSD) test indicated significant differences (p < 0.05) between the treatment groups. Additionally, principal component analysis (PCA) and the generation of corresponding graphs were performed using Origin 2018 software (OriginLab, Northampton, MA, USA).

3. Results

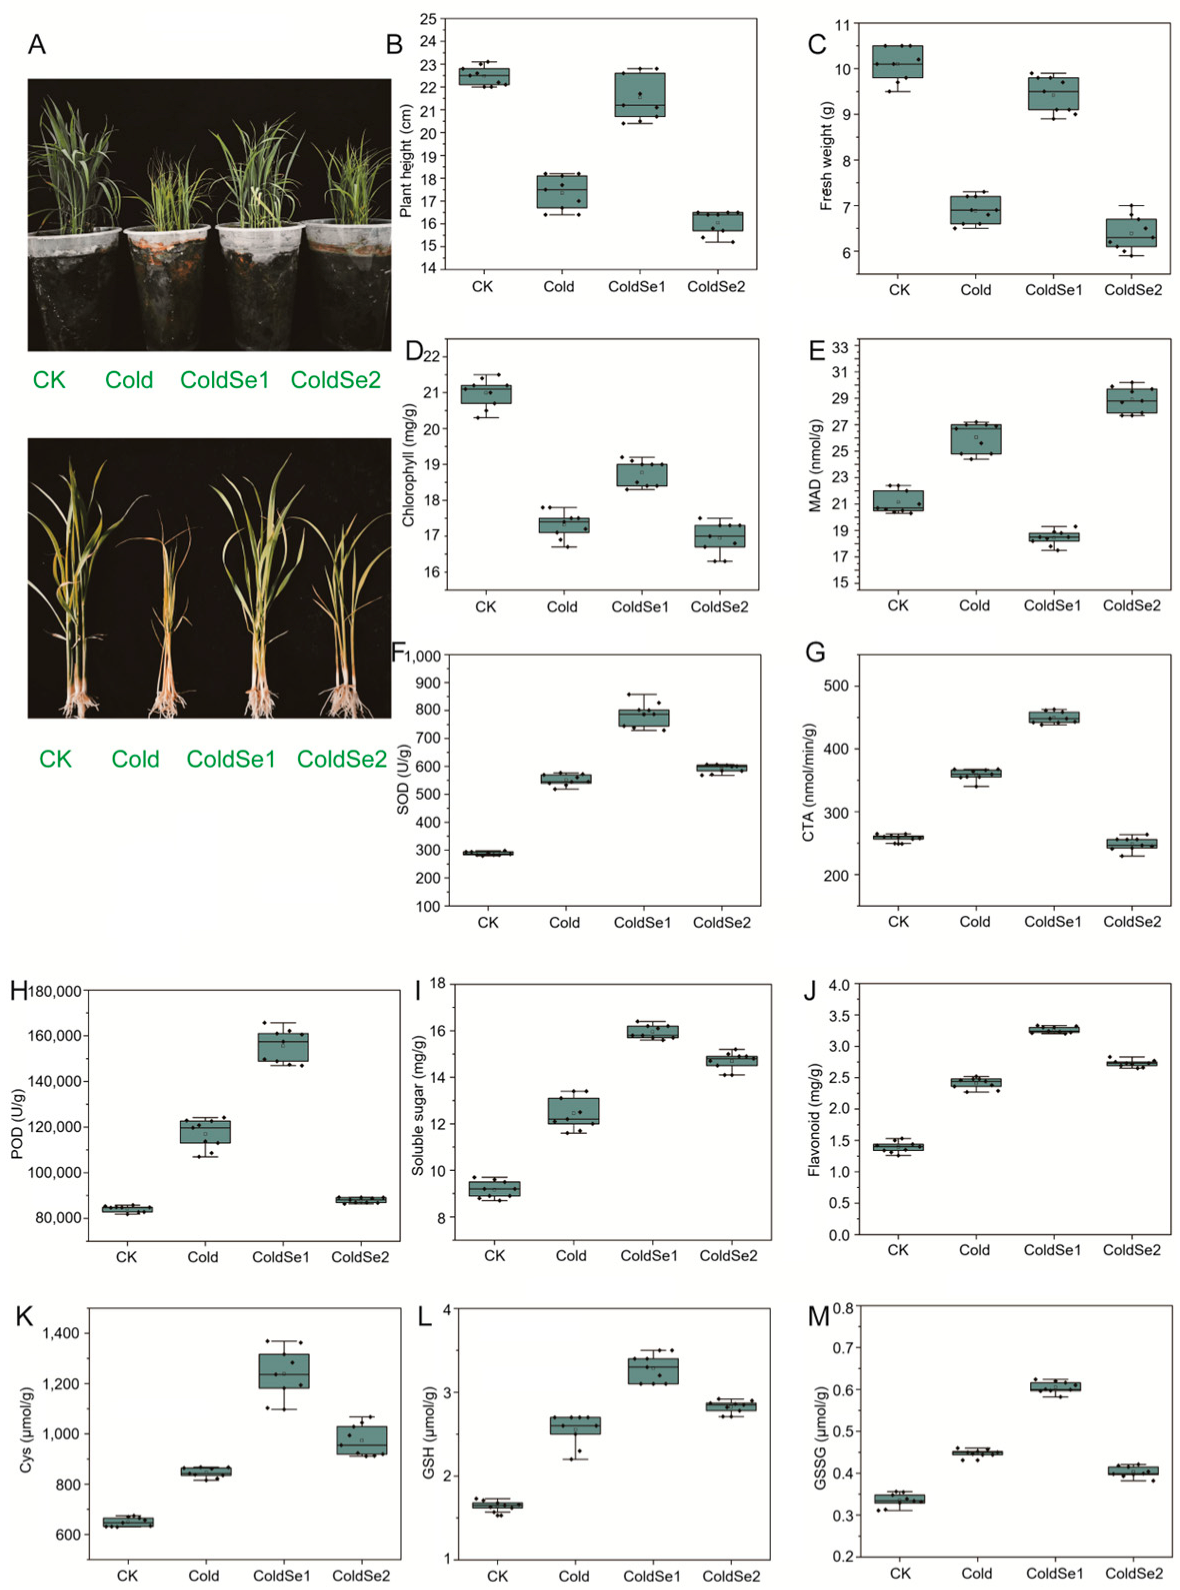
3.1. Measurement of Plant Morphological and Physiological Phenotypes

Cold stress significantly suppressed rice seedling growth, resulting in decreased plant height, fresh weight, and chlorophyll content, while simultaneously intensifying oxidative damage. The ColdSe1 treatment substantially alleviated these physiological impairments, resulting in a 36.9% increase in fresh weight and a 24.3% increase in plant height compared to cold-stressed controls. Chlorophyll content also rose by 8.4%, while MDA levels, an indicator of oxidative damage, decreased significantly by 29.1% (p < 0.05; Figure 1A–E). These findings demonstrate that ColdSe1 effectively mitigated cold stress-induced physiological damage, enhancing growth and reducing oxidative stress. In contrast, high-concentration selenium (ColdSe2) exacerbated cold-induced injury. Cold stress significantly upregulated the activities of CAT, SOD, and POD, with ColdSe1 further enhancing this antioxidant response and substantially reducing cellular damage. Specifically, the activities of CAT, SOD, and POD increased significantly by 25.2%, 42.7%, and 33.3%, respectively (Figure 1F–H). Additionally, flavonoid and soluble sugar contents increased by 35.5% and 28.4%, respectively (Figure 1I,J). In comparison, the contents of Cys, GSH, and GSSG increased significantly by 46.5%, 29.3%, and 35.0% (Figure 1K–M), respectively. These results highlight the beneficial effects of selenium supplementation (1 mg/kg) in enhancing antioxidant defense mechanisms and mitigating cold damage in rice seedlings under low-temperature conditions.

3.2. Enrichment of Differentially Expressed Functional Genes in Rice Seedlings

Transcriptomic analysis produced 77.15 Gb of clean data across 12 samples, with each sample exceeding 5.15 Gb and Q30 scores surpassing 95.57% (Table S2). A total of 21 common DEGs with distinct expression patterns were identified across the three comparison groups. In the Cold vs. CK comparison, 1012 DEGs were upregulated and 629 were downregulated. Notably, ColdSe1 treatment significantly increased the number of DEGs compared to the Cold group with 1135 upregulated and 1356 downregulated (Figure S1, Table S3). GO enrichment analysis of the ColdSe1 vs. Cold comparison identified the top five DEGs with the highest |log2FC| values: OsLEA25, OsLEA20, OsWRKY23, RAB16B, and Os10g0505900 (Figure 2A). Furthermore, KEGG enrichment analysis for the same comparison revealed the highest |log2FC| values in C10150, OsGSTU19, Os03g082830, Os04g049360, and Os03g0278250, primarily associated with amino sugar and nucleotide sugar metabolism, glutathione metabolism, and fructose and mannose metabolism (Figure 2B).

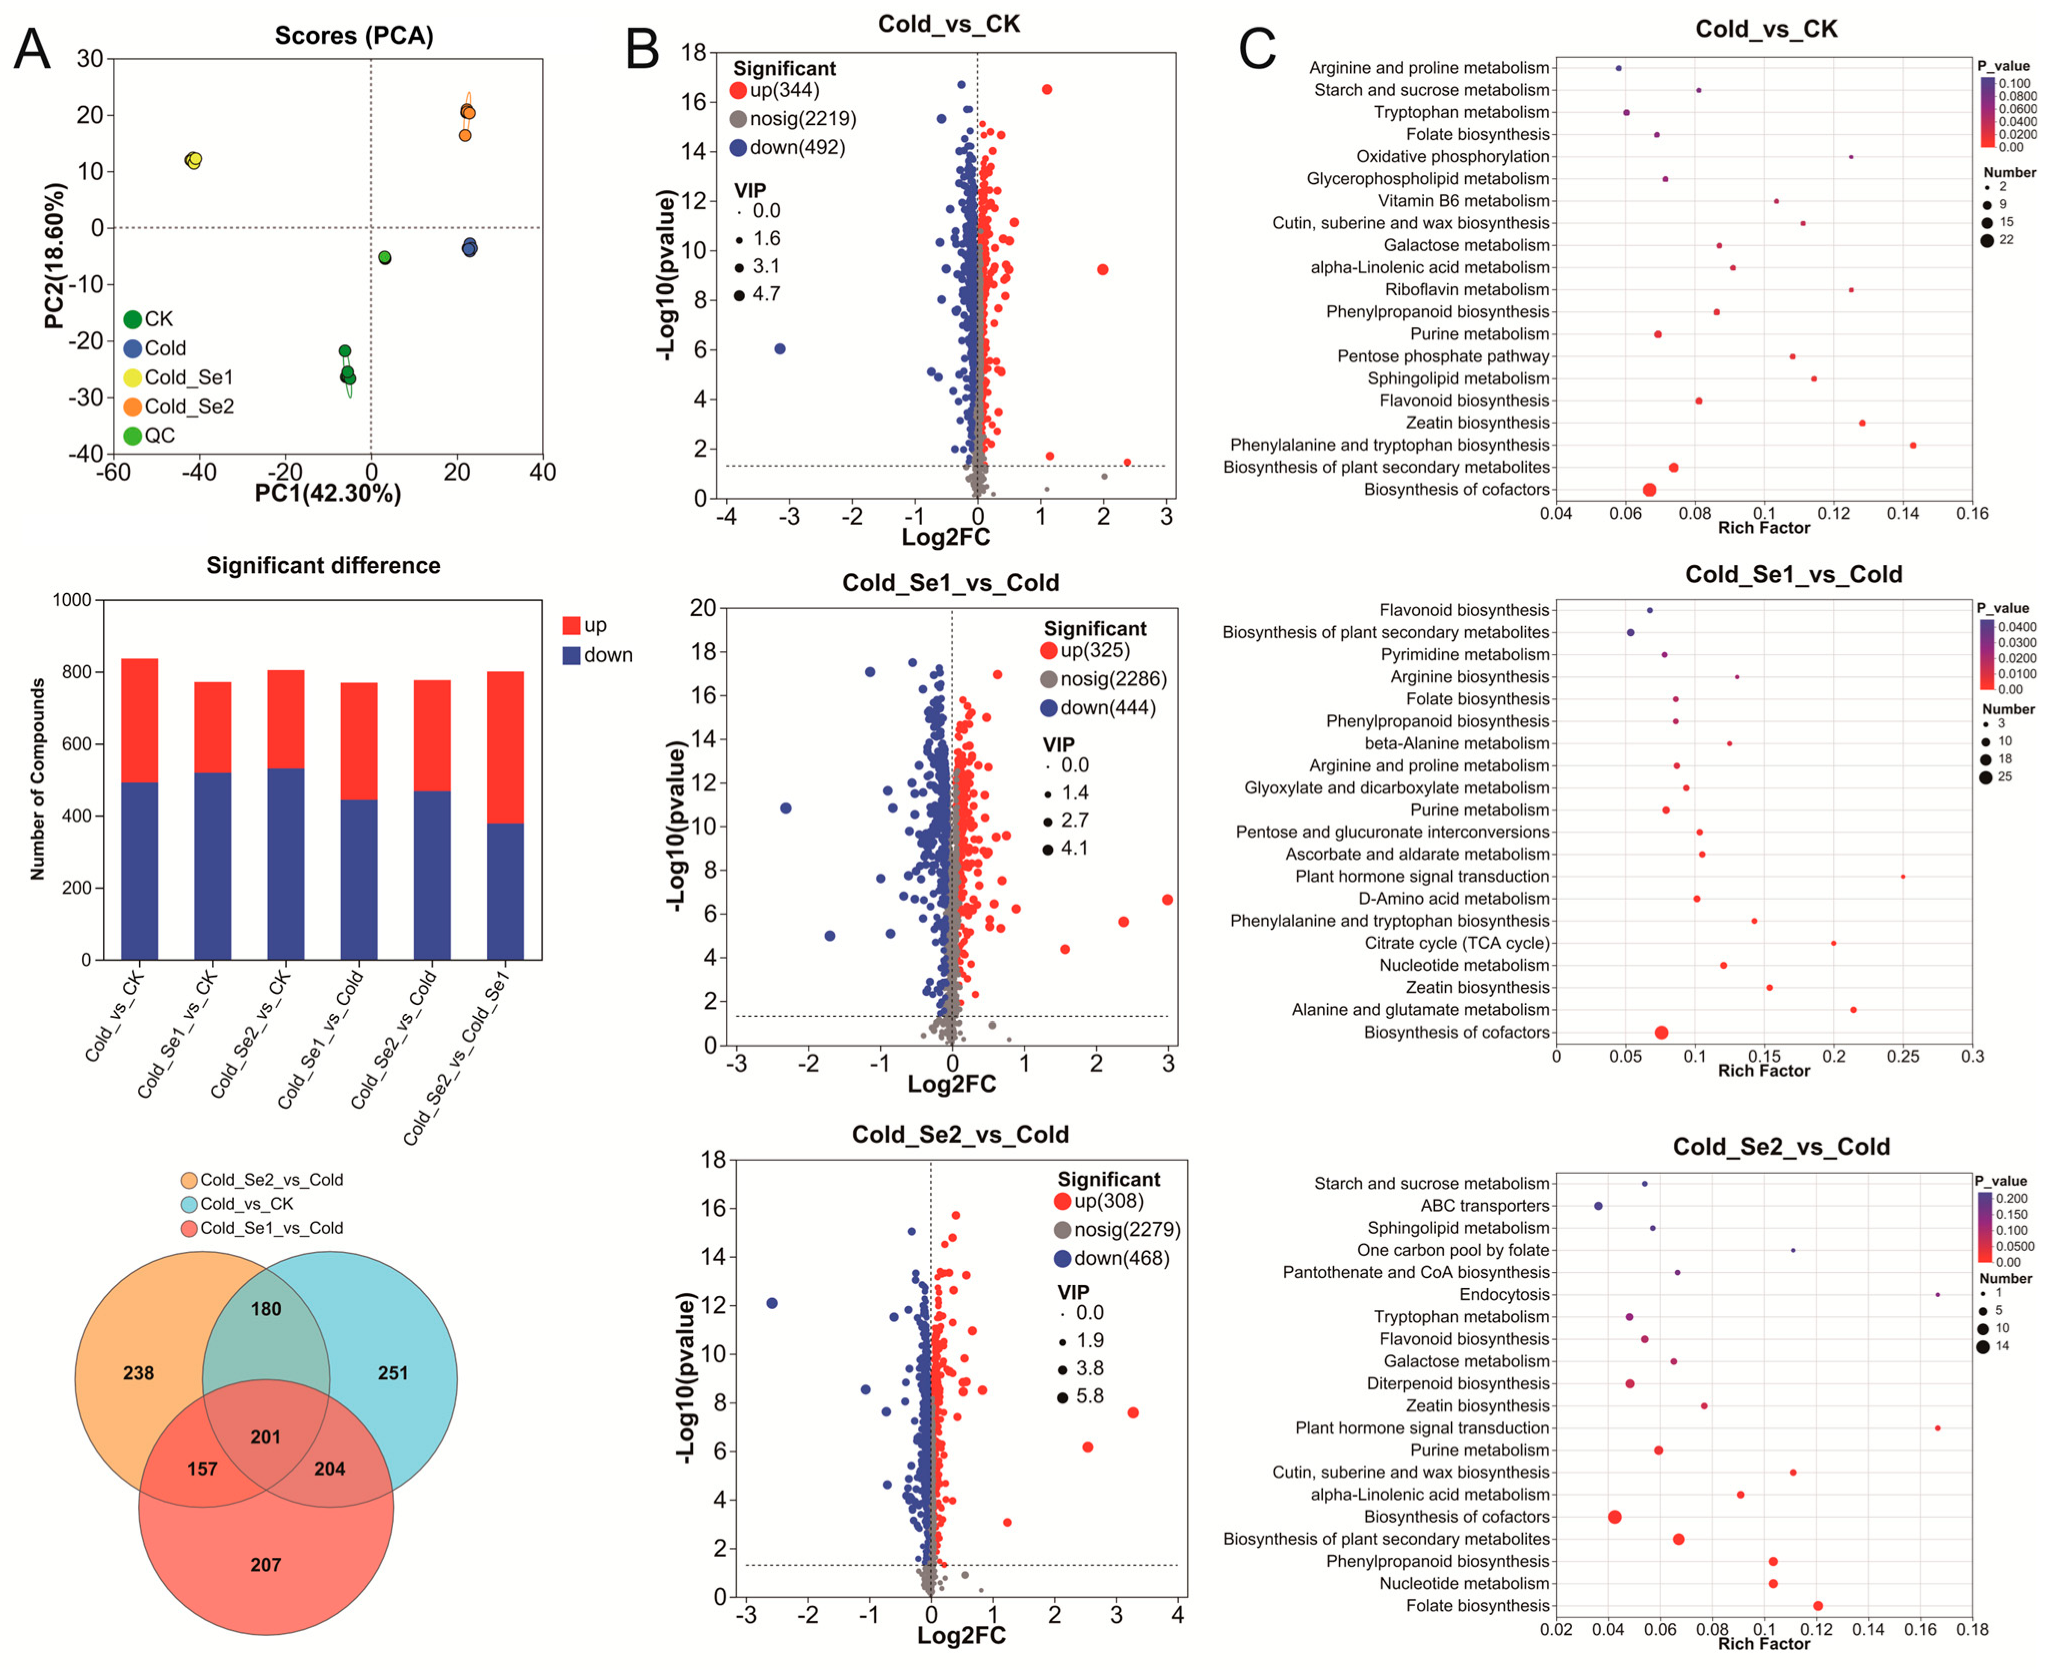
3.3. GO and KEGG Pathway Enrichment Analysis of DEGs in Rice Seedlings

Under cold stress, a total of 1641 DEGs were identified in the Cold_vs_CK comparison, including 1012 upregulated and 629 downregulated genes. In the ColdSe1_vs_Cold comparison, 701 DEGs with 115 upregulated and 586 downregulated genes were identified. In contrast, the ColdSe2_vs_Cold comparison exhibited a significantly reduced differential expression, identifying only 160 DEGs (2 upregulated and 158 downregulated) (Figure 3A), as visualized through clustering heatmaps (Figure S2). GO enrichment analysis revealed that in the Cold_vs_CK comparison, the DEGs were predominantly associated with chloroplast-related functions, including the chloroplast, photosystem, chloroplast thylakoid membrane, plastid thylakoid membrane, thylakoid membrane, photosynthetic membrane, plastid membrane, and thylakoid (Figure 3B, Table S4). In the ColdSe1 treatment, the DEGs were significantly enriched in processes related to responses to inorganic substances, water deprivation, salt stress, water response, reactions to acid chemicals, various stimuli, temperature stimulation, abscisic acid, chemical responses, alcohol responses, and responses to oxygen-containing compounds (Figure 3B, Table S5). The ColdSe2_vs_Cold comparison revealed enrichment in processes related to abscisic acid, cold acclimation, lipid responses, temperature stimulation, cold responses, acid chemical reactions, general chemical responses, inorganic substance reactions, and hormonal responses (Figure 3B, Table S6). Notably, the number of DEGs significantly decreased across the three comparison groups following selenium treatment (Figure S3), suggesting that selenium plays a regulatory role in gene expression under cold stress. Furthermore, KEGG enrichment analysis revealed that the DEGs in the ColdSe1_vs_Cold group were primarily associated with photosynthesis-antenna proteins, terpenoid backbone biosynthesis, carotenoid biosynthesis, protein processing in the endoplasmic reticulum, porphyrin metabolism, plant hormone signal transduction, and the MAPK signaling pathway (Figure 3C, Table S7). Selenium treatment mediates a complex regulatory network involving various transcription factors, notably from the R2R3MYB, bHLH, NAC, zinc-finger, and WRKY families [23,24,25,26]. Our study identified 32 transcription factors (TFs) across the three comparison groups. Notably, except for OsMYB80 and OsWRKY15, all other TFs were upregulated in the Cold_vs_CK group. Interestingly, OsMYB80 and OsWRKY15 were the only TFs among the 32 that were upregulated in the ColdSe1_vs_Cold group, indicating that Se treatment can alter the transcriptomic profile of rice leaves under cold stress (Table S8, Figure 4A). Additionally, 10 of these TFs exhibited consistency between transcriptomic and RT-PCR data (Figure 4B).

3.4. Key Pathways of DEG Involvement in Rice Seedlings

This study analyzes the selenium-mediated regulation of key pathways, including MAPK signaling, plant hormone signaling, photosynthetic systems, photosynthetic antenna proteins, phenylpropanoid biosynthesis, and porphyrin metabolism. For ColdSe1, genes associated with porphyrin metabolism were significantly suppressed compared to the Cold group (Figure 5). Similarly, photosynthesis-related genes (Os04g0690800, Os03g0659233) exhibited significant downregulation. In the photosynthesis-antenna protein pathway, ColdSe1 treatment led to significant upregulation of genes encoding Os03g0165375 and Os09g0439500. In the MAPK signaling pathway, functional genes encoding heavy-metal ATPases (Os06g0665800), Reversion-To-ethylene Sensitivity1 (Os05g0539800), and receptor-like protein kinase (Os06g0203800 and Os06g0130100) were significantly upregulated. In plant hormone signal transduction, ColdSe1 treatment resulted in the downregulation of genes associated with indole-3-acetic acid–amido synthetase (Os01g0785400), bZIP transcription factor (Os01g0859300), the SAUR gene family (Os02g0445100), TIFY family gene (Os03g0180900) and OsAux/IAA transcriptional repressor (Os03g0797800), and Os01g0221000 and Os04g0608300. In phenylpropanoid biosynthesis, Os08g0270400, Os01g0315600, and Os06g0592200 were significantly upregulated under ColdSe1 treatment. Notably, porphyrin metabolism genes were universally downregulated under ColdSe1. Collectively, these findings demonstrate selenium’s critical role in fine-tuning photosynthetic and stress-response pathways during cold adaptation in rice.

3.5. Metabolome Analysis of Rice Seedlings

This study investigates the mechanism by which Se alleviates cold stress in rice seedlings through metabolomic profiling. A total of 9165 metabolites were identified, including 2381 differentially expressed metabolites (DEMs). Distinct clustering patterns were observed among the treatment groups (Figure 6A,B). KEGG analysis revealed that the DEMs in the Cold_vs_CK comparison were predominantly involved in the following: (i) the biosynthesis of plant secondary metabolites (including phenylalanine, tyrosine, tryptophan, zeatin, flavonoids, sphingolipids, and phenylpropanoids), and (ii) the pentose phosphate and purine metabolism pathways. In contrast, the Se-treated groups exhibited notable enrichment of DEMs in pathways such as zeatin biosynthesis, nucleotide metabolism, the citrate cycle (TCA cycle), the biosynthesis of phenylalanine, tyrosine, and tryptophan, D-amino acid metabolism, plant hormone signal transduction, ascorbate/aldarate metabolism, and pentose–glucuronate interconversions (Figure 6C).

3.6. Integrated Transcriptomic and Metabolomic Analysis

To elucidate the mechanisms underlying selenium treatment in low-temperature regulation, this study investigates the correlation patterns between gene expression profiles and metabolites. Functional annotation results based on the KEGG database revealed that, compared to the control group, DEGs and DAMs exhibited significant co-localization characteristics in 19 metabolic pathways following low-temperature treatment. Notably, pathways specifically enriched by selenium treatment include ABC transporters, biosynthesis of various plant secondary metabolites, diterpenoid biosynthesis, linoleic acid metabolism, tyrosine metabolism, pyrimidine metabolism, and cutin, suberine, and wax biosynthesis (Table S9, Figure 7A). In the ColdSe1_vs_Cold group, Se treatment resulted in DEGs and DAMs being annotated to 18 metabolic pathways (Table S10, Figure 7A). These pathways include biosynthesis of unsaturated fatty acids, biosynthesis of various plant secondary metabolites, flavone and flavonol biosynthesis, flavonoid biosynthesis, phenylpropanoid biosynthesis, diterpenoid biosynthesis, folate biosynthesis, vitamin B6 metabolism, and thiamine metabolism (Figure S4). As demonstrated by previous studies, the metabolism of α-linolenic acid and arachidonic acid relies on glutathione peroxidase (GPX) for antioxidant protection. Se, a key component of GPX and an important antioxidant enzyme, directly influences the metabolism of both α-linolenic acid and arachidonic acid upon administration [27]. Additionally, Se serves as a potent inducer of secondary metabolic pathways, thereby affecting these metabolic processes. However, in the ColdSe2_vs_Cold group, only seven pathways were annotated in both DEGs and DAMs, including phenylpropanoid biosynthesis, sphingolipid metabolism, α-linolenic acid metabolism, tryptophan metabolism, cutin, suberine, and wax biosynthesis, glycolysis/gluconeogenesis, and ABC transporters (Table S11, Figure 7B). Se significantly enhances the activity and gene expression of phenylalanine ammonia-lyase (PAL) [28], and selenite has been shown to activate defense responses, including the phenylpropane pathway, by inducing oxidative stress signals in Arabidopsis thaliana and rice [29]. Furthermore, α-linolenic acid metabolism, which is downstream of the jasmonic acid (JA) pathway, is also stimulated by selenium stress [30]. ABC transporter proteins play a crucial role through exocytosis and cistronization [31]. However, it is noteworthy that all intermediates of these metabolic pathways were downregulated under conditions of high selenium stress (Table S11).

4. Discussion

Low-temperature stress induces structural damage to plant cell membranes and triggers ROS overproduction. In response, plants elicit antioxidant defense mechanisms, encompassing enzymatic components such as SOD, POD, and CAT, as well as non-enzymatic antioxidants like glutathione and ascorbic acid, to detoxify ROS and alleviate oxidative damage [31,32,33]. Selenium supplementation enhances ROS elimination via multiple pathways: upregulating GPX activity; potentially stimulating glutathione biosynthesis; elevating ascorbic acid levels; and engaging in stress-responsive hormonal signaling pathways [27,34,35,36,37]. Furthermore, cold stress disrupts photosynthetic function by promoting chlorophyll degradation, thereby impairing photosynthetic efficiency. Se may alleviate these effects by preserving enzymatic activities and maintaining membrane integrity, reducing lipid peroxidation (e.g., MDA accumulation) and stabilizing photosynthetic efficiency. This stabilization is attributed to selenium’s enhanced antioxidant capacity, which helps maintain membrane fluidity under low-temperature conditions [38,39,40,41]. In this study, cold stress significantly inhibited rice seedling growth and exacerbated oxidative injury. The application of ColdSe1 treatment effectively mitigated these effects by enhancing antioxidant capacity, increasing soluble sugars and flavonoids, and elevating levels of Cys, reduced GSH, and GSSG. These findings show that low-dose selenium upregulates antioxidant enzyme activity and metabolite levels, thereby conferring robust protection against cold-induced oxidative stress. Conversely, ColdSe2 application exacerbated physiological damage and cold sensitivity in the seedlings. While selenium is a toxic metal, it can enhance plant growth at low concentrations. However, most angiosperms, as non-accumulators, exhibit limited tolerance to selenium concentrations exceeding 10–100 μg Se g−1 dry weight and struggle to thrive in selenium-rich soils [27]. In contrast, both seleniferous and non-seleniferous soil-dwelling selenium indicator species exhibit tolerance to selenium concentrations approaching 1 mg Se g−1 dry weight, while accumulating species demonstrate the capacity to absorb levels exceeding this threshold [42]. In this study, a selenium concentration of 4 mg/kg was found to impair the antioxidant system in rice seedlings, resulting in stunted growth. This toxicity appears to be linked to selenite metabolism, evidenced by decreased levels of GSH, GSSH, and Cys at higher selenium concentrations compared to lower ones. Such reductions may be due to protein structural abnormalities caused by selenocysteine derived from GSH during nitrite reduction [43,44]. Additionally, transcriptional and metabolomic analyses revealed significant downregulation of phenylpropanone biosynthesis, alpha-linolenic acid metabolism, and ABC transporters—metabolites integral to selenium metabolism [28,29,30,31]. These findings collectively underscore the critical need for precise optimization of selenium application rates to enhance rice stress resistance in agricultural practices.
Transcriptional regulation in plants under cold stress encompasses multiple genes, metabolic pathways, and signaling factors [45,46]. Transcriptome analyses indicate that low selenium concentrations enhance energy metabolic processes, particularly photosystem I and II activities, in rice seedlings under environmental stress. This enhancement improves photosynthesis and antioxidant stress mechanisms while modulating phytohormone signaling through upregulation of IAA, ABA, and JAZ [47]. However, the role of selenium-mediated transcriptional regulation in rice under low-temperature stress remains poorly understood. Our GO and KEGG analyses reveal that cold stress primarily affects photosynthesis-associated genes, chloroplast function, and core metabolic pathways. The concomitant upregulation of genes related to inorganic substance response, salt tolerance, and temperature stimulus confirms the activation of systemic stress pathways. Notably, ColdSe1 treatment induced significant transcriptional reprogramming, enriching genes associated with ABA response, cold acclimation, and lipid metabolism. This indicates that cold tolerance may be enhanced through hormone signaling and membrane stabilization mechanisms. ColdSe1 specifically upregulated key transcription factors, such as OsWRKY15 and OsMYB80, highlighting selenium’s role in modulating transcriptional regulators for stress adaptation. Pathway analysis further revealed correlations between selenium and key processes, including photosynthetic apparatus modulation, hormone signal transduction, phenylpropanoid biosynthesis, and MAPK signaling. Under ColdSe1 conditions, the downregulation of porphyrin metabolism genes indicates a reallocation of metabolic resources toward stress responses. Conversely, the upregulation of photosynthesis-antenna proteins and MAPK components suggests enhanced light-harvesting capabilities and improved stress signaling. In waxy maize, selenium treatment significantly increased glutathione metabolism, phenylpropanoid biosynthesis, and phenylalanine metabolism [48]. Notably, phenylpropanoid biosynthesis was significantly enhanced under ColdSe1, with genes such as Os08g0270400, Os01g0315600, and Os06g0592200 showing as significantly upregulated. These findings provide valuable insights into the molecular mechanisms underlying selenium-mediated stress responses.
Research indicates that selenium supplementation effectively alleviates low-temperature stress in plants by elevating antioxidant compound levels and enhancing photosynthetic protein metabolism. Exogenous selenium further regulates cold-stress responses through ascorbate–glutathione cycle enzyme activation and induction of photosynthesis- and ATP synthesis-related proteins. These mechanisms collectively enhance plant growth, developmental adaptation, and cold tolerance [49,50]. Selenium treatment significantly influences the metabolism of rice seedlings by enriching key metabolic pathways, including ABC transporters, secondary metabolite biosynthesis, and diterpenoid biosynthesis. This finding underscores the potential of selenium in mitigating cold-induced metabolic disorders in plants. Under cold stress, glutamate, acting as an amino acid/peptide analogue within carboxylic acid derivatives, serves dual roles in glutathione metabolism and nitrogen assimilation, positioning it as a critical intersection between amino acid metabolism and antioxidant defense systems. Concurrently, the upregulation of protoporphyrin highlights its role in porphyrin metabolism, while the downregulation of 16-hydroxyhexadecanoic acid correlates with the enrichment of genes involved in cutin, suberin, and wax biosynthesis. Se treatment regulates the expression of genes involved in various metabolic pathways, including amino sugar and nucleotide sugar metabolism (OsUGE1, OsXIP), plant hormone signal transduction (OsJAZ2, OsPP2C06/OsABI2, OsPP15, OsPR1, OsPP2C37, OsPP2C51, and OsSAUR29), glycerolipid metabolism (OsGPAT3 and OspPLAIVα), alanine, aspartate, and glutamate metabolism (OsGABA-T and OsGDH3), and glutathione metabolism (OsGSTU3, OsGSTU5, OsGSTU19, OsGSTU1, Os1-Cys, OsGSTU40, and OsGSTU6). The substantial influence of selenium treatment on plant metabolic pathways [51,52,53,54] highlights its role in mitigating cold stress. Key mechanisms include enhanced cell wall synthesis via amino sugar metabolism and improved membrane lipid fluidity through glycerolipid metabolism. Additionally, selenium modulates hormone signaling to upregulate stress-responsive genes. The element also supports cellular homeostasis by regulating carbon–nitrogen metabolism via the alanine/glutamate pathway and optimizing energy supply. It is noteworthy that the application of selenium enhances the synthesis of glutathione and the activity of GPX, which may improve cold tolerance by influencing the antioxidant defense system and effectively scavenging reactive oxygen species (ROS).

5. Conclusions

This study revealed that low concentrations of selenium substantially mitigated the adverse effects of cold stress on rice seedlings, as demonstrated by significant increases in fresh weight, plant height, and chlorophyll content, alongside a notable reduction in MDA content, a marker of oxidative damage. In contrast, high selenium concentrations exacerbated cold-stress damage, underscoring the critical role of selenium dosage in its efficacy. Selenium treatment significantly enhanced the activity of antioxidant enzymes, including CAT, SOD, and POD, while upregulating metabolites associated with antioxidant defense, such as flavonoids, soluble sugars, Cys, GSH, and GSSG. These findings further confirm that selenium alleviates cold stress by bolstering antioxidant defense mechanisms. Omics analysis demonstrated that selenium treatment modulates multiple key genes and signaling pathways, including the MAPK pathway, plant hormone signal transduction, and photosynthesis-related pathways. Notably, selenium upregulated transcription factors involved in cold-stress responses and significantly enriched genes associated with antioxidant metabolism and photosynthesis. Additionally, selenium treatment increased the content of metabolites linked to plant secondary metabolites and antioxidant metabolism, thereby enhancing rice seedlings’ resistance to cold stress. Consequently, low selenium concentrations can effectively enhance rice’s tolerance to low-temperature environments and reduce oxidative damage. Advocating for the adoption of selenium-enriched rice varieties in cold regions offers a promising strategy to address low-temperature stress.

Supplementary Materials

The following supporting information can be downloaded at https://www.mdpi.com/article/10.3390/agriculture15141489/s1: Figure S1. Identification of differentially expressed genes (DEGs) in comparison groups. A DEG Venn diagram. B Bar graph showing the upregulated and downregulated DEGs of different comparison groups in different colors, upregulated (red) and downregulated (blue); Figure S2. Quality control of transcriptome data and changes in DEG expression. Heatmap showing the results of the clustering analysis of DEGs. Upregulation is represented by the red box, and downregulation by the blue box; Figure S3. GO entries for DEGs detected jointly by the three comparison groups. The size of the bubbles in the plot corresponds to the number of related differentially expressed genes, and the color intensity of the bubbles indicates the enrichment strength of each pathway. CK, control; Cold, 9 °C/10 d; Cold_Se1, 9 °C/10 d cold + 1 mg/kg Se; Cold_Se2, 9 °C/10 d cold + 4 mg/kg Se; Figure S4. Pathway analysis between DEG and DAM in the ColdSe1_vs_Cold group. A Pathway annotation information for metabolites and genes; red represents metabolite-annotated pathways, green represents gene-annotated pathways. B Selenium treatment resulted in DEGs and DAMs being annotated to metabolic pathways; Table S1. Sequences of the primer pairs used for qRT-PCR; Table S2. Evaluation statistics of sequencing data of underground samples of Oryza sativa. CK, control; Cold, 9 °C/10 d; ColdSe1, 9 °C/10 d cold + 1 mg/kg Se; ColdSe2, 9 °C/10 d cold + 4 mg/kg Se; Table S3. Statistics of upregulated and downregulated DEGs. CK, control; Cold, 9 °C/10 d; ColdSe1, 9 °C/10 d cold + 1 mg/kg Se; ColdSe2, 9 °C/10 d cold + 4 mg/kg Se; Table S4. Gene Ontology (GO) enrichment analysis for Cold_vs_CK comparison; Table S5. Gene Ontology (GO) enrichment analysis for ColdSe1_vs_Cold comparison; Table S6. Gene Ontology (GO) enrichment analysis for ColdSe2_vs_Cold comparison; Table S7. KEGG enrichment analysis for ColdSe1_vs_Cold comparison; Table S8. Statistics of differentially expressed transcription factors; Table S9. DEGs and DAMs exhibited significant co-localization characteristics for Cold_vs_CK; Table S10. DEGs and DAMs exhibited significant co-localization characteristics for ColdSe1_vs_Cold; Table S11. DEGs and DAMs exhibited significant co-localization characteristics for ColdSe2_vs_Cold.

Author Contributions

Data curation, N.L., Q.Y. and B.C.; investigation and formal analysis, C.L., F.B. and J.L.; writing—original draft preparation, N.L., Q.Y., B.C., C.L., X.P., F.B., J.L. and Y.L.; writing—review and editing, X.P. and Y.L. All authors have read and agreed to the published version of the manuscript.

Funding

This work was supported by the Heilongjiang Postdoctoral Science Foundation (LBH-Z22245); the Harbin Science and Technology Research (College Cooperation) Project (GJ2021TZ002007); Basic Scientific Research in Colleges and Universities in Heilongjiang Province (2020-KYYWF-1028); and the Central Leading Local Science and Technology Development Project (ZY2022A-HRB-02).

Institutional Review Board Statement

Not applicable.

Data Availability Statement

All raw sequencing data have been deposited at the NCBI Sequence Read Archive (https://www.ncbi.nlm.nih.gov/sra (accessed on 12 April 2025); SRR33525336, SRR33525335, SRR33525334, SRR33525333, SRR33525332, SRR33525331, SRR33525330, SRR33525329, SRR33525328, SRR33525327, SRR33525326, SRR33525325).

Conflicts of Interest

The authors declare that they have no competing interests.

References

  1. Zhou, S.; Wu, T.; Li, X.; Wang, S.; Hu, B. Identification of candidate genes controlling cold tolerance at the early seedling stage from Dongxiang wild rice by QTL mapping, BSA-Seq and RNA-Seq. BMC Plant Biol. 2024, 24, 649. [Google Scholar] [CrossRef] [PubMed]
  2. Wu, B.; Chen, S.; Cheng, S.; Li, C.; Li, S.; Chen, J.; Zha, W.; Liu, K.; Xu, H.; Li, P.; et al. Transcriptome Analysis Revealed the Dynamic and Rapid Transcriptional Reprogramming Involved in Cold Stress and Related Core Genes in the Rice Seedling Stage. Int. J. Mol. Sci. 2023, 24, 1914. [Google Scholar] [CrossRef] [PubMed]
  3. Liu, C.; Zhou, G.; Qin, H.; Guan, Y.; Wang, T.; Ni, W.; Xie, H.; Xing, Y.; Tian, G.; Lyu, M.; et al. Metabolomics combined with physiology and transcriptomics reveal key metabolic pathway responses in apple plants exposure to different selenium concentrations. J. Hazard. Mater. 2024, 464, 132953. [Google Scholar] [CrossRef] [PubMed]
  4. Kaur, N.; Sharma, S.; Kaur, S.; Nayyar, H. Selenium in agriculture: A nutrient or contaminant for crops? Arch. Agron. Soil Sci. 2014, 60, 1593–1624. [Google Scholar] [CrossRef]
  5. Huang, C.; Qin, N.; Sun, L.; Yu, M.; Hu, W.; Qi, Z. Selenium Improves Physiological Parameters and Alleviates Oxidative Stress in Strawberry Seedlings under Low-Temperature Stress. Int. J. Mol. Sci. 2018, 19, 1913. [Google Scholar] [CrossRef]
  6. De Sousa, G.F.; Silva, M.A.; De Morais, E.G.; Van Opbergen, G.A.Z.; Van Opbergen, G.G.A.; De Oliveira, R.R.; Amaral, D.; Brown, P.; Chalfun-Junior, A.; Guilherme, L.R.G. Selenium enhances chilling stress tolerance in coffee species by modulating nutrient, carbohydrates, and amino acids content. Front. Plant Sci. 2022, 13, 1000430. [Google Scholar] [CrossRef]
  7. Liu, K.; Li, S.; Han, J.; Zeng, X.; Ling, M.; Mao, J.; Li, Y.; Jiang, J. Effect of selenium on tea (Camellia sinensis) under low temperature: Changes in physiological and biochemical responses and quality. Environ. Exp. Bot. 2021, 188, 104475. [Google Scholar] [CrossRef]
  8. Zhang, M.; Tang, S.; Huang, X.; Zhang, F.; Pang, Y.; Huang, Q.; Yi, Q. Selenium uptake, dynamic changes in selenium content and its influence on photosynthesis and chlorophyll fluorescence in rice (Oryza sativa L.). Environ. Exp. Bot. 2014, 107, 39–45. [Google Scholar] [CrossRef]
  9. Cabral Gouveia, G.C.; Galindo, F.S.; Dantas Bereta Lanza, M.G.; Caroline da Rocha Silva, A.; Pereira de Brito Mateus, M.; Souza da Silva, M.; Rimoldi Tavanti, R.F.; Tavanti, T.R.; Lavres, J.; Reis, A.R.D. Selenium toxicity stress-induced phenotypical, biochemical and physiological responses in rice plants: Characterization of symptoms and plant metabolic adjustment. Ecotoxicol. Environ. Saf. 2020, 202, 110916. [Google Scholar] [CrossRef]
  10. Rajashekar, C.B.; Panda, M. Water stress is a component of cold acclimation process essential for inducing full freezing tolerance in strawberry. Sci. Hortic. 2014, 174, 54–59. [Google Scholar] [CrossRef]
  11. Huang, C.; Wang, D.; Sun, L.; Wei, L. Effects of exogenous salicylic acid on the physiological characteristics of Dendrobium officinale under chilling stress. Plant Growth Regul. 2016, 79, 199–208. [Google Scholar] [CrossRef]
  12. Gupta, S.; Gupta, M. Alleviation of selenium toxicity in Brassica juncea L.: Salicylic acid-mediated modulation in toxicity indicators, stress modulators, and sulfur-related gene transcripts. Protoplasma 2016, 253, 1515–1528. [Google Scholar] [CrossRef]
  13. Dai, H.; Jia, G.; Shan, C. Jasmonic acid-induced hydrogen peroxide activates MEK1/2 in upregulating the redox states of ascorbate and glutathione in wheat leaves. Acta Physiol. Plant. 2015, 37, 1–6. [Google Scholar] [CrossRef]
  14. Wang, S.; Liang, D.; Li, C.; Hao, Y.; Ma, F.; Shu, H. Influence of drought stress on the cellular ultrastructure and antioxidant system in leaves of drought-tolerant and drought-sensitive apple rootstocks. Plant Physiol. Biochem. 2012, 51, 81–89. [Google Scholar] [CrossRef] [PubMed]
  15. Diao, M.; Ma, L.; Wang, J.; Cui, J.; Fu, A.; Liu, H.Y. Selenium Promotes the Growth and Photosynthesis of Tomato Seedlings Under Salt Stress by Enhancing Chloroplast Antioxidant Defense System. J. Plant Growth Regul. 2014, 33, 671–682. [Google Scholar] [CrossRef]
  16. Al-Huqail, A.A.; Alghanem, S.M.S.; Alhaithloul, H.A.S.; Abbas, Z.K.; Al-Balawi, S.M.; Darwish, D.B.E.; Ali, B.; Malik, T.; Javed, S. Selenium mitigates vanadium toxicity through enhanced nutrition, photosynthesis, and antioxidant defense in rice (Oryza sativa L.) seedlings. BMC Plant Biol. 2024, 24, 1071. [Google Scholar] [CrossRef]
  17. Huang, S.; Qin, H.; Jiang, D.; Lu, J.; Zhu, Z.; Huang, X. Bio-nano selenium fertilizer improves the yield, quality, and organic selenium content in rice. J. Food Compos. Anal. 2024, 132, 106348. [Google Scholar] [CrossRef]
  18. Kühlbrandt, W. Structure and Mechanisms of F-Type ATP Synthases. Annu. Rev. Biochem. 2019, 88, 515–549. [Google Scholar] [CrossRef]
  19. Li, B.; Dewey, C.N. RSEM: Accurate transcript quantification from RNA-Seq data with or without a reference genome. BMC Bioinform. 2011, 12, 323. [Google Scholar] [CrossRef]
  20. Siahpoosh, M.R.; Sanchez, D.H.; Schlereth, A.; Scofield, G.N.; Furbank, R.T. Modification of OsSUT1 gene expression modulates the salt response of rice Oryza sativa cv. Taipei 309. Plant Sci. 2012, 182, 101–111. [Google Scholar] [CrossRef]
  21. Livak, K.J.; Schmittgen, T.D. Analysis of relative gene expression data using real-time quantitative PCR and the 2(-Delta Delta C(T)) Method. Methods 2021, 25, 402–408. [Google Scholar] [CrossRef] [PubMed]
  22. Gwak, Y.; Hwang, Y.S.; Wang, B.; Kim, M.; Jeong, J.; Lee, C.G.; Hu, Q.; Han, D.; Jin, E. Comparative analyses of lipidomes and transcriptomes reveal a concerted action of multiple defensive systems against photooxidative stress in Haematococcus pluvialis. J. Exp. Bot. 2014, 65, 4317–4334. [Google Scholar] [CrossRef] [PubMed]
  23. Pu, Z.; Wei, G.; Liu, Z.; Chen, L.; Guo, H.; Li, Y.; Li, Y.; Dai, S.; Wang, J.; Li, W.; et al. Selenium and anthocyanins share the same transcription factors R2R3MYB and bHLH in wheat. Food Chem. 2021, 356, 129699. [Google Scholar] [CrossRef]
  24. Guo, L.; Liao, Y.; Deng, S.; Li, J.; Bu, X.; Zhu, C.; Zhang, W.; Cong, X.; Cheng, S.; Chen, Q.; et al. Genome-wide analysis of NAC transcription factors and exploration of candidate genes regulating selenium metabolism in Broussonetia papyrifera. Planta 2024, 260, 1. [Google Scholar] [CrossRef] [PubMed]
  25. Larabee, J.L.; Hocker, J.R.; Hanas, J.S. Mechanisms of inhibition of zinc-finger transcription factors by selenium compounds ebselen and selenite. J. Inorg. Biochem. 2009, 103, 419–426. [Google Scholar] [CrossRef]
  26. Liu, X.M.; Yuan, Z.G.; Rao, S.; Zhang, W.W.; Ye, J.B.; Cheng, S.Y.; Xu, F. Identification, characterization, and expression analysis of WRKY transcription factors in Cardamine violifolia reveal the key genes involved in regulating selenium accumulation. BMC Plant Biol. 2024, 24, 860. [Google Scholar] [CrossRef]
  27. Abdullah; Wani, K.I.; Hayat, K.; Naeem, M.; Aftab, T. Multifaceted role of selenium in plant physiology and stress resilience: A review. Plant Sci. 2025, 355, 112456. [Google Scholar] [CrossRef]
  28. Djanaguiraman, M.; Prasad, P.V.; Seppanen, M. Selenium protects sorghum leaves from oxidative damage under high temperature stress by enhancing antioxidant defense system. Plant Physiol. Biochem. 2010, 48, 999–1007. [Google Scholar] [CrossRef]
  29. Schiavon, M.; Ertani, A.; Parrasia, S.; Vecchia, F.D. Selenium accumulation and metabolism in algae. Aquat. Toxicol. 2017, 189, 1–8. [Google Scholar] [CrossRef]
  30. Kumar, A.; Singh, R.P.; Singh, P.K.; Awasthi, S.; Chakrabarty, D.; Trivedi, P.K.; Tripathi, R.D. Selenium ameliorates arsenic induced oxidative stress through modulation of antioxidant enzymes and thiols in rice (Oryza sativa L.). Ecotoxicology 2014, 23, 1153–1163. [Google Scholar] [CrossRef]
  31. Panda, A.; Fatnani, D.; Parida, A.K. Uptake, impact, adaptive mechanisms, and phytoremediation of heavy metals by plants: Role of transporters in heavy metal sequestration. Plant Physiol. Biochem. 2025, 221, 109578. [Google Scholar] [CrossRef]
  32. Devireddy, A.R.; Tschaplinski, T.J.; Tuskan, G.A.; Muchero, W.; Chen, J.G. Role of Reactive Oxygen Species and Hormones in Plant Responses to Temperature Changes. Int. J. Mol. Sci. 2021, 22, 8843. [Google Scholar] [CrossRef]
  33. Awasthi, R.; Bhandari, K.; Nayyar, H. Temperature stress and redox homeostasis in agricultural crops. Front. Environ. Sci. 2015, 3, 11. [Google Scholar] [CrossRef]
  34. Guo, Z.; Cai, L.; Liu, C.; Chen, Z.; Guan, S.; Ma, W.; Pan, G. Low-temperature stress affects reactive oxygen species, osmotic adjustment substances, and antioxidants in rice (Oryza sativa L.) at the reproductive stage. Sci. Rep. 2022, 12, 6224. [Google Scholar] [CrossRef] [PubMed]
  35. Toh, P.; Nicholson, J.L.; Vetter, A.M.; Berry, M.J.; Torres, D.J. Selenium in Bodily Homeostasis: Hypothalamus, Hormones, and Highways of Communication. Int. J. Mol. Sci. 2022, 23, 15445. [Google Scholar] [CrossRef]
  36. Zoidis, E.; Seremelis, I.; Kontopoulos, N.; Danezis, G.P. Selenium-Dependent Antioxidant Enzymes: Actions and Properties of Selenoproteins. Antioxidants 2018, 7, 66. [Google Scholar] [CrossRef] [PubMed]
  37. McKenzie, R.C.; Arthur, J.R.; Beckett, G.J. Selenium and the regulation of cell signaling, growth, and survival: Molecular and mechanistic aspects. Antioxid. Redox Signal. 2002, 4, 339–351. [Google Scholar] [CrossRef]
  38. Chen, T.F.; Zheng, W.J.; Wong, Y.S.; Yang, F. Selenium-induced changes in activities of antioxidant enzymes and content of photosynthetic pigments in Spirulina platensis. J. Integr. Plant Biol. 2008, 50, 40–48. [Google Scholar] [CrossRef]
  39. Habibi, G. Effect of drought stress and selenium spraying on photosynthesis and antioxidant activity of spring barley. Acta Agric. Slov. 2013, 101, 31–39. [Google Scholar] [CrossRef]
  40. Song, J.; Xin, L.; Gao, F.; Liu, H.; Wang, X. Effects of Foliar Selenium Application on Oxidative Damage and Photosynthetic Properties of Greenhouse Tomato under Drought Stress. Plants 2024, 13, 302. [Google Scholar] [CrossRef]
  41. Quispe, A.P.V.; de Morais, E.G.; Benevenute, P.A.N.; de Sousa Lima, J.; Dos Santos, L.C.; Silva, M.A.; Chalfun-Júnior, A.; Marchiori, P.E.R.; Guilherme, L.R.G. Priming effect with selenium and iodine on broccoli seedlings: Activation of biochemical mechanisms to mitigate cold damages. Plant Physiol. Biochem. 2025, 223, 109876. [Google Scholar] [CrossRef] [PubMed]
  42. Moreno Rodriguez, M.J.; Cala Rivero, V.; Jiménez Ballesta, R. Selenium distribution in topsoils and plants of a semi-arid Mediterranean environment. Environ. Geochem. Health 2005, 27, 513–519. [Google Scholar] [CrossRef] [PubMed]
  43. Pilon-Smits, E.A.; Garifullina, G.F.; Abdel-Ghany, S.; Kato, S.; Mihara, H.; Hale, K.L.; Burkhead, J.L.; Esaki, N.; Kurihara, T.; Pilon, M. Characterization of a NifS-like chloroplast protein from Arabidopsis. Implications for its role in sulfur and selenium metabolism. Plant Physiol. 2002, 130, 1309–1318. [Google Scholar] [CrossRef]
  44. Rizwan, M.; Ali, S.; Rehman, M.Z.U.; Rinklebe, J.; Tsang, D.C.; Tack, F.M.; Abbasi, G.H.; Hussain, A.; Igalavithana, A.D.; Lee, B.C.; et al. Effects of selenium on the uptake of toxic trace elements by crop plants: A review. Crit. Rev. Environ. Sci. Technol. 2021, 51, 2531–2566. [Google Scholar] [CrossRef]
  45. Kidokoro, S.; Shinozaki, K.; Yamaguchi-Shinozaki, K. Transcriptional regulatory network of plant cold-stress responses. Trends Plant Sci. 2022, 27, 922–935. [Google Scholar] [CrossRef]
  46. Chinnusamy, V.; Zhu, J.; Zhu, J.K. Cold stress regulation of gene expression in plants. Trends Plant Sci. 2007, 12, 444–451. [Google Scholar] [CrossRef] [PubMed]
  47. Zhu, S.; Sun, S.; Zhao, W.; Yang, X.; Mao, H.; Sheng, L.; Chen, Z. Utilizing transcriptomics and proteomics to unravel key genes and proteins of Oryza sativa seedlings mediated by selenium in response to cadmium stress. BMC Plant Biol. 2024, 24, 360. [Google Scholar] [CrossRef]
  48. Guo, G.; Wang, Y.; Zhang, B.; Yu, H.; Li, L.; Cao, G.; Chen, B.; Li, C.; Bu, F.; Teng, S.; et al. Comparative transcriptomic and metabolomic analysis reveals mechanisms of selenium-regulated anthocyanin synthesis in waxy maize (Zea mays L.). Front. Plant Sci. 2024, 15, 1466756. [Google Scholar] [CrossRef]
  49. Chongping, H.; Wenjie, H.; Junlin, L. Selenium-and Nano-Selenium-Mediated Cold-Stress Tolerance in Crop Plants. In Selenium and Nano-Selenium in Environmental Stress Management and Crop Quality Improvement; Springer: Cham, Switzerland, 2022; pp. 173–190. [Google Scholar]
  50. Chu, J.; Yao, X.; Zhang, Z. Responses of wheat seedlings to exogenous selenium supply under cold stress. Biol. Trace Elem. Res. 2010, 136, 355–363. [Google Scholar] [CrossRef]
  51. Jiang, X.; Zhou, W.; Li, D.; Wang, H.; Yang, Y.; You, J.; Liu, H.; Ai, L.; Zhang, M. Combined transcriptome and metabolome analyses reveal the effects of selenium on the growth and quality of Lilium lancifolium. Front. Plant Sci. 2024, 15, 1399152. [Google Scholar] [CrossRef]
  52. Nazir, F.; Kumari, S.; Mahajan, M.; Khan, M.I.R. An explicit story of plant abiotic stress resilience: Overtone of selenium, plant hormones and other signaling molecules. Plant Soil. 2022, 486, 135–163. [Google Scholar] [CrossRef]
  53. Callejón-Leblic, B.; Selma-Royo, M.; Collado, M.C.; Gómez-Ariza, J.L.; Abril, N.; García-Barrera, T. Untargeted Gut Metabolomics to Delve the Interplay between Selenium Supplementation and Gut Microbiota. J. Proteome Res. 2022, 21, 758–767. [Google Scholar] [CrossRef] [PubMed]
  54. Wallenberg, M.; Olm, E.; Hebert, C.; Björnstedt, M.; Fernandes, A.P. Selenium compounds are substrates for glutaredoxins: A novel pathway for selenium metabolism and a potential mechanism for selenium-mediated cytotoxicity. Biochem. J. 2010, 429, 85–93. [Google Scholar] [CrossRef] [PubMed]
Figure 1. Identification of morphological and physiological phenotypes of rice under selenium mediation at a low temperature. (A) The growth morphology of the aboveground part of rice. (BD) The morphological indicators of rice. (EM) The physiological response-related indicators of rice seedlings. (CAT, catalase, SOD, superoxide dismutase, POD, peroxidase, Cys, cysteine, GSH, glutathione, CK, control; Cold, 9 °C/10 d; ColdSe1, 9 °C/10 d cold + 1 mg/kg Se; ColdSe2, 9 °C/10 d cold + 4 mg/kg Se). Boxes span the interquartile range (IQR, 25th–75th percentiles), center lines represent medians, and whiskers extend to 1.5 × IQR from the quartiles. Dots indicate outliers.
Agriculture 15 01489 g001
Figure 2. Enrichment diagram of the top 20 differentially expressed functional genes of GO and KEGG. (A) DEGs in GO enrichment analysis, and (B) DEGs in KEGG enrichment analysis. (CK, control; Cold, 9 °C/10 d; ColdSe1, 9 °C/10 d cold + 1 mg/kg Se; ColdSe2, 9 °C/10 d cold + 4 mg/kg Se.) The left side of the chordal graph distributes gene names in order of log2FC from largest to smallest, with a larger log2FC indicating a larger differential gene expression fold. On the right is term information on the significant enrichment of differential genes.
Agriculture 15 01489 g002
Figure 3. The distribution and functional analysis of differentially expressed genes (DEGs). (A) Visualization of upregulated and downregulated gene expression through a volcano plot, (B) GO functional pathway analysis, and (C) display of the top 20 KEGG metabolic pathways, highlighting the significant changes in gene expression differences. The x-axis represents the enrichment index, while the y-axis labels the pathway names. The size of the bubbles in the plot corresponds to the number of related differentially expressed genes, and the color intensity of the bubbles indicates the enrichment strength of each pathway. CK, control; Cold, 9 °C/10 d; Cold_Se1, 9 °C/10 d cold + 1 mg/kg Se; Cold_Se2, 9 °C/10 d cold + 4 mg/kg Se.
Agriculture 15 01489 g003
Figure 4. Heatmap of expression levels of differentially expressed transcription factors (A) and RT-PCR validation (B). Data are presented as the mean ± standard deviation for three biological replicates. The line on the bar graph indicates the standard error. CK, control; Cold, 9 °C/10 d; Cold_Se1, 9 °C/10 d cold + 1 mg/kg Se; Cold_Se2, 9 °C/10 d cold + 4 mg/kg Se.
Agriculture 15 01489 g004
Figure 5. The primary regulatory pathways mediated by selenium under low-temperature stress. The bubble color indicates the size of the |log2 (FC)| value. CK, control; Cold, 9 °C/10 d; Cold_Se1, 9 °C/10 d cold + 1 mg/kg Se; Cold_Se2, 9 °C/10 d cold + 4 mg/kg Se.
Agriculture 15 01489 g005
Figure 6. Selenium-mediated metabolomic regulation under low-temperature stress. (A) DEM PCA analysis, DEM stacking diagram, DEM Venn diagram. (B) Volcano plots of DEM upregulation and downregulation. (C) DEM Kegg enrichment analysis. The X-axis represents the rich factor, and the Y-axis represents the pathway’s name. The bubble size represents the number of DEMs involved. The bubble color indicates the enrichment degree of the pathway. CK, control; Cold, 9 °C/10 d; Cold_Se1, 9 °C/10 d cold + 1 mg/kg Se; Cold_Se2, 9 °C/10 d cold + 4 mg/kg Se.
Agriculture 15 01489 g006
Figure 7. Integrated analysis of the transcriptome and metabolome. (A) Venn diagram of DEGs and DEMs enrichment analysis. (B) Bubble plot of common metabolic pathways in different treatment groups; the size of the bubbles in the plot corresponds to the number of related differentially expressed genes, and the color intensity of the bubbles indicates the enrichment strength of each pathway. CK, control; Cold, 9 °C/10 d; Cold_Se1, 9 °C/10 d cold + 1 mg/kg Se; Cold_Se2, 9 °C/10 d cold + 4 mg/kg Se.
Agriculture 15 01489 g007
Disclaimer/Publisher’s Note: The statements, opinions and data contained in all publications are solely those of the individual author(s) and contributor(s) and not of MDPI and/or the editor(s). MDPI and/or the editor(s) disclaim responsibility for any injury to people or property resulting from any ideas, methods, instructions or products referred to in the content.

