Article

Spatiotemporal Evolution and Driving Factors of LULC Change and Ecosystem Service Value in Guangdong: A Perspective of Food Security

1
College of Land Science and Spatial Planning, Hebei GEO University, Shijiazhuang 050031, China
2
Institute of Hydrogeology and Environmental Geology, Chinese Academy of Geological Sciences, Shijiazhuang 050061, China
3
Key Laboratory of Groundwater Remediation of Hebei Province & China Geological Survey, Key Laboratory of Groundwater Contamination and Remediation, Hebei Province & China Geological Survey, Shijiazhuang 050061, China
4
The First Geological Brigade of Hebei Bureau of Geology and Mineral Resources Exploration, Handan 056000, China
5
Hebei Geological Environment Monitoring Institute, Shijiazhuang 050022, China
*
Author to whom correspondence should be addressed.
Agriculture 2025, 15(14), 1467; https://doi.org/10.3390/agriculture15141467
Submission received: 10 June 2025 / Revised: 30 June 2025 / Accepted: 7 July 2025 / Published: 8 July 2025
(This article belongs to the Section Ecosystem, Environment and Climate Change in Agriculture)

Abstract

Amid global efforts to balance sustainable development and food security, ecosystem service value (ESV), a critical bridge between natural systems and human well-being, has gained increasing importance. This study explores the spatiotemporal dynamics and driving factors of land use changes and ESV from a food security perspective, aiming to inform synergies between ecological protection and food production for regional sustainability. Using Guangdong Province as a case study, we analyze ESV patterns and spatial correlations from 2005 to 2023 based on three-phase land use and socioeconomic datasets. Key findings: I. Forestland and cropland dominate Guangdong’s land use, which is marked by the expansion of construction land and the shrinking of agricultural and forest areas. II. Overall ESV declined slightly: northern ecological zones remained stable, while eastern/western regions saw mild decreases, with cropland loss threatening grain self-sufficiency. III. Irrigation scale, forestry output, and fertilizer use exhibited strong interactive effects on ESV, whereas urban hierarchy influenced ESV independently. IV. ESV showed significant positive spatial autocorrelation, with stable agglomeration patterns across the province. The research provides policy insights for optimizing cropland protection and enhancing coordination between food production spaces and ecosystem services, while offering theoretical support for land use regulation and agricultural resilience in addressing regional food security challenges.

1. Introduction

Ecosystem services refer to the benefits that humans obtain directly or indirectly from ecosystems [1]. Ecosystem service value (ESV), as a comprehensive embodiment of various service functions provided by natural ecosystems for human survival and development, covers core dimensions such as food production, soil and water conservation, climate regulation, and biodiversity maintenance [2], serving as crucial natural capital supporting the sustainable development of human society. Among them, food production, a key component of ESV supply services, highly depends on basic functions provided by ecosystems, including soil fertility maintenance, water resource regulation, and natural pest and disease control [3]. The synergistic effects of different ecosystems, such as forests, wetlands, and farmlands [4], directly determine the stability and sustainability of food production capacity [5]. However, affected by intensified global climate change, rapid land-use transformation, and high-intensity human activities, ecosystem services are severely threatened [6]: deforestation, wetland degradation, and intensive utilization of cultivated land lead to a decline in soil and water conservation capacity [7,8]; the frequent occurrence of extreme climate events increases the risks of food production [9,10]; biodiversity loss weakens pollination and pest and disease regulation functions [11,12], forcing agricultural production to rely heavily on inputs of chemical fertilizers and pesticides, which triggers a vicious cycle of ecological degradation, fluctuations in agricultural production [13], and environmental pressure, fundamentally shaking the ecological foundation of food security. This makes ensuring food production capacity and maintaining ecosystem health dual core propositions for global sustainable development [14,15]. As China’s largest economic province [16] and a major grain marketing region, Guangdong has long had a grain self-sufficiency rate below 40% [17], facing particularly prominent pressures in cultivated land protection. Therefore, it is imperative to investigate the mechanism of the spatiotemporal differentiation of ESV in Guangdong, quantify the contribution of different ecosystem services to food production from the perspective of food security, and explore paths to enhance the resilience of food security through optimized ecosystem management. This research holds fundamental scientific significance and practical guiding value for achieving global food security strategic objectives [18].
The ecosystem service value represents a quantitative assessment of an ecosystem’s service capacity [19], with its evaluation approaches primarily categorized into monetization and energy valuation [20]. Among these, the monetary-form ESV is particularly accessible for public comprehension and policymaker utilization, effectively facilitating spatial planning, ecological regulation, and ecological restoration, thus becoming the most widely adopted methodology [21]. In 1997, Costanza et al. published a seminal study on global ESV in Nature [22], which galvanized substantial scholarly attention toward ESV assessment. This research taxonomized ecosystem services into four major categories: provisioning services, regulating services, supporting services, and cultural services, thereby establishing the theoretical groundwork [23] and methodological paradigm [24] for subsequent ESV evaluation studies. Empirical investigations on ESV have converged on multiple dimensions, including ESV assessment [25,26], spatiotemporal dynamics [27,28], ecological impacts [29,30], trade-off-synergy analyses [31], and scenario-based simulation forecasting [32,33]. Concurrently, scholars have identified that the influencing factors of ecosystem services can be dichotomized into natural determinants [34] and anthropogenic factors [35,36]. These insights provide critical scientific underpinnings for policy design aimed at reconciling ecological conservation [37], food security [38,39], and sustainable development [40] at the regional scale.
Although existing studies have constructed a complete research system around ESV, which includes multi-dimensional practices such as localization adaptation of theoretical frameworks and evaluation methods, analysis of spatiotemporal dynamic evolution, interpretation of service trade-off and synergy mechanisms, and identification of natural-human driving factors, the systematic research on the quantitative correlation of sustainable resource supply is still insufficient. In particular, under the global food security agenda, the mechanisms and key driving pathways of ESV have not yet been clarified. This study designates Guangdong Province as the research domain, examining land-use changes from 2005 to 2023 and quantifying the spatiotemporal dynamics of its ESV. By investigating driving factors through the lens of food security, the research aims to furnish a scientific foundation for synergistic optimization of regional food security safeguards and eco-productive spatial configurations. It will provide a precise and scientific basis for delineating grain production functional areas in Guangdong Province and optimizing the spatial layout of ecology and production. Through regional cases, it will extract a collaborative governance paradigm for food security and ecological protection suitable for areas with prominent human–land conflicts, offering localized practical references for food security governance under the framework of the United Nations Sustainable Development Goals.

2. Materials and Methods

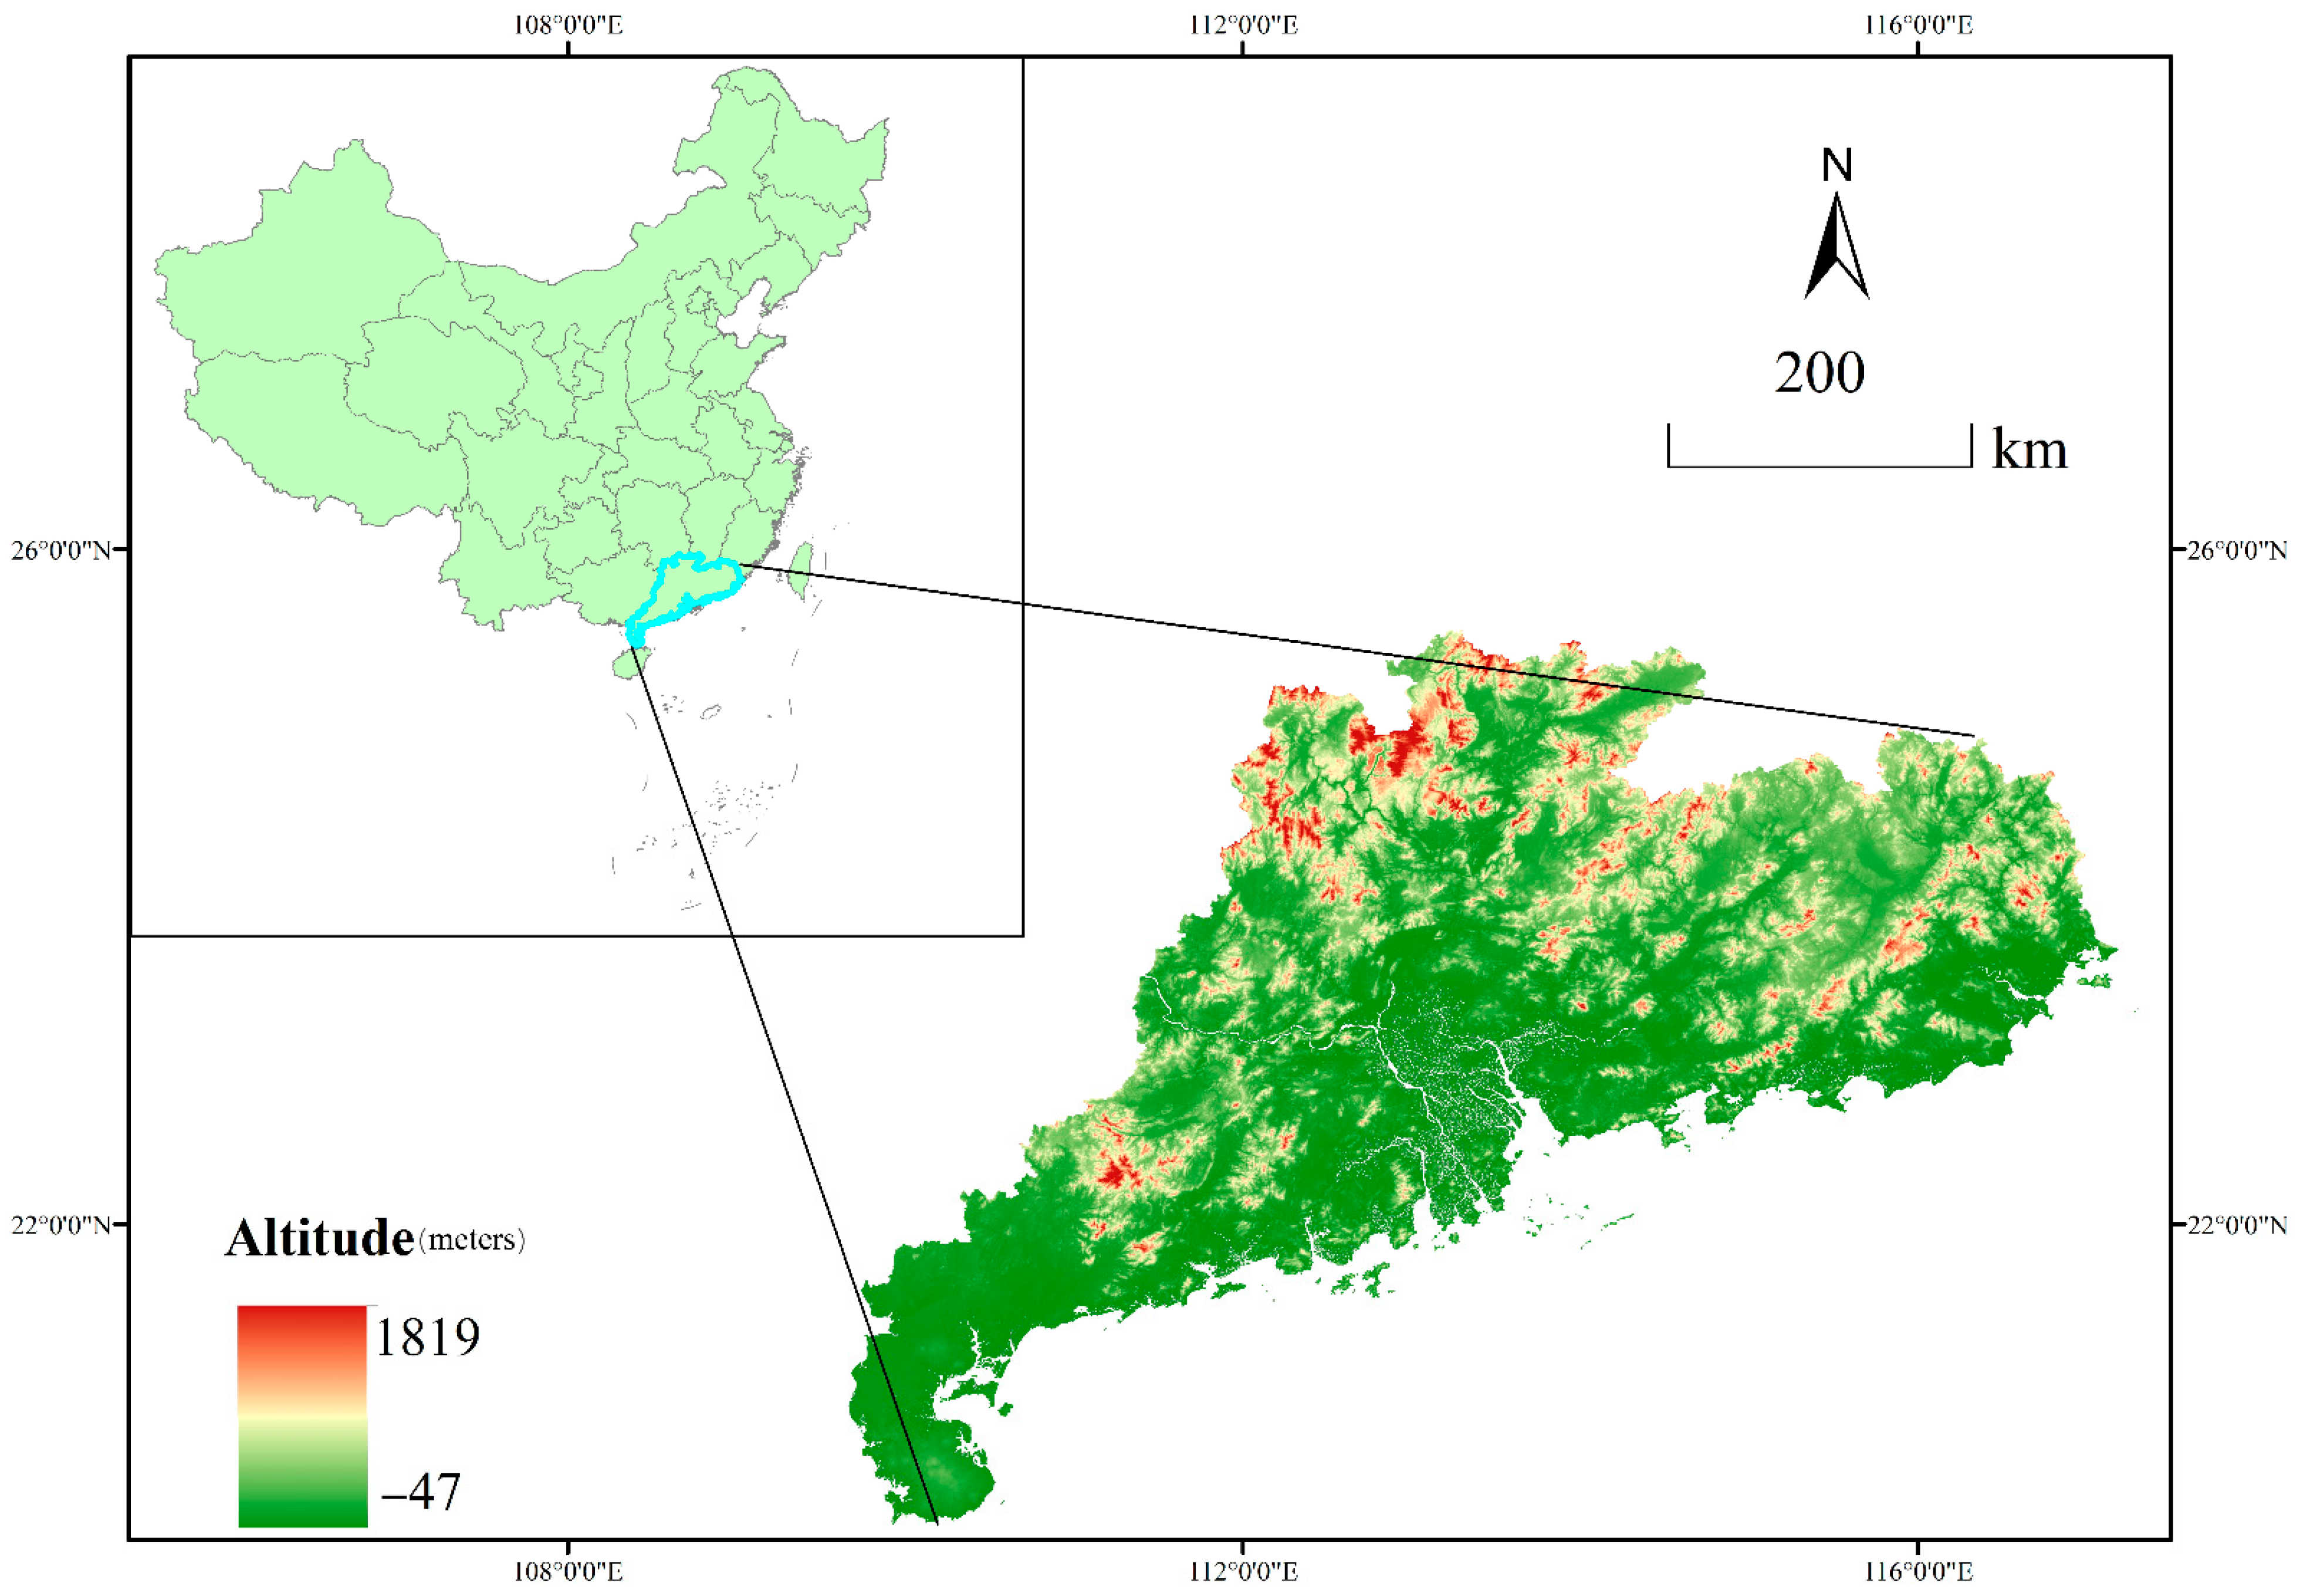
2.1. Overview of the Research Area

Guangdong Province is situated at the southern tip of mainland China, with geographical coordinates spanning 20°13′–25°31′ North latitude and 109°39′–117°19′ East longitude (Figure 1), governing 21 prefecture-level cities. Its terrain is predominantly characterized by mountainous and hilly terrains, with the Nanling Mountain Range traversing the northern part, while the Pearl River Delta Plain constitutes the primary alluvial area. The Pearl River water system runs through the entire province, forming a complex hydrographic network. The region experiences a subtropical and tropical monsoon climate, with an annual average temperature of 21.9 °C and precipitation of 1789.3 mm, ensuring abundant hydrothermal conditions. As a leading economic powerhouse in China, Guangdong’s regional GDP reached 13.2 trillion CNY in 2023, having remained the nation’s top economic performer for 35 consecutive years, with development centered on Guangdong. Blessed with pristine ecological endowments, it hosts ecological units such as the Nanling National Nature Reserve and Zhanjiang Mangrove Wetlands, positioning itself as a critical zone for biodiversity conservation [41].
In 2024, Guangdong’s total grain output reached 13.134 million tons, a 2.2% year-on-year increase, accompanied by growth in both planting area and unit yield—specifically, a 72.67 km2 expansion in sown area and a 10,800 kg/km2 rise in yield. Nevertheless, the province faces challenges including relatively low per capita grain output and self-sufficiency rate, declining sown areas and yields in some regions, and unbalanced development across municipalities, all of which pose threats to food security [42].

2.2. Research Method

2.2.1. Land Use Type Transfer Matrix

The land use transition matrix [43,44] serves to characterize the areal dynamics and mutual conversions of various land types within a specific temporal framework. In this study, the transition matrix is employed to analyze the transition trajectories and change trends of different land categories and ESV in Guangdong Province from 2005 to 2023 [45], as outlined in Equation (1).
Z i j = z 11   z 11     z 11 z 11 z 11 z 11 z 11   z 11           z 11
Zij denotes the land area; n equals 6; i and j signify the pre-transition and post-transition land types, respectively.

2.2.2. ESV

In assessing the ESV of each province, this study referenced the scholarly work of Xie Gaodi [46] to determine the ESV equivalence coefficients, defined as the economic value of ESV equivalence factors per unit area. These coefficients were derived from a standard ratio set at 1/7 of the economic value of grain production per unit area. The specific calculation procedures are outlined in Equation (2).
E = 1 7 n f = 1   d f p f q f D ( f = 1,2 , , n )
In this equation, E represents the economic value of food production services provided per unit area of farmland ecosystem (100 million CNY·km2). q f denotes the average market price of crop type f (wheat, corn, and rice), q f represents the yield per unit area of crop type f   (kg·km2),   d f   signifies the specific planting area of crop type f (km2), and D is the total planting area of all crops within the study region (km2).
To ensure the stability of the assessment results and eliminate the impact of annual fluctuations in grain market prices on the evaluation of ESV equivalence per unit area in Guangdong, the sown area, yield per unit area, and market prices of three crops (wheat, corn, and rice) in Guangdong Province for 2005, 2013, and 2023 were selected as basic data. Through calculation, the ESV equivalence per unit area in Guangdong Province was determined to be 216762.9 (CNY·km2). The ESV per unit area of each land type is shown in Table 1 (CNY/km2).

2.2.3. Ecological Sensitivity Analysis of ESV

The Sensitivity Index (CS) is adopted to reveal the degree of dependence of ecosystem service value (ESV) changes over time on value coefficients, so as to reduce the uncertainty of the results [47,48]. In this paper, the sensitivity index is calculated by increasing or decreasing the ecological service value coefficients of each land type by 50%. The formula is as follows:
C S = E S V j E S V i E S V i ( V C j k V C i k ) / V C i k
In the formula, V C j k and V C i k represent the ecological service value coefficients per unit area of the k-th ecosystem before and after adjustment, respectively, and E S V j and E S V i represent the total ecological service values before and after adjustment, respectively. ( E S V j E S V i ) / E S V i represents the change rate of ecological service value, V C j k V C i k / V C i k represents the change rate of value coefficient, and C S is the sensitivity of the ecological service value coefficients of each ecosystem in the study area. If C S > 1 , it indicates that E S V is elastic to V C , and the accuracy and reliability of the value coefficients are low; if C S < 1 , it indicates that E S V is inelastic to V C , and the results are credible.

2.2.4. Geodetector

Geodetector is a spatial analysis model based on the principle of spatial heterogeneity that analyzes spatial data and reveals the driving factors behind geographic elements [49]. Compared with traditional statistical methods, Geodetector does not assume linear relationships and is immune to multicollinearity. The formula is as follows:
q = 1 h = 1 l N h σ h 2 N σ 2
In the formula, q represents the degree to which the detection factor explains the spatial heterogeneity of the dependent variable; h is the total number of strata in the study area; N and N h   are the sample sizes of the study area and detection zone respectively; σ h 2 and   σ 2   are the overall variance of the study area and the discrete variance of each region respectively.

2.2.5. Spatial Autocorrelation Analysis

Two analytical methods, the global Moran’s I index and local Moran’s I index [50,51], were employed to investigate the spatial differentiation patterns of ESV. The global Moran’s I index was applied to explore the overall spatial distribution patterns of ESV intensity and their interrelationships, aiming to capture the macro-level overall spatial pattern between them (Equation (4)). In contrast, the local Moran’s I index focuses on revealing the spatial characteristics and local spatial autocorrelation within specific regions (Equation (5)).
I = i = 1 n j = 1 n w i j ( x i x ¯ ) S 2 i = 1 n j = 1 n w i j
I i = ( x i x ¯ ) j = 1 n w i j ( x i x ¯ ) S 2
In the formula, I and I i represent the global Moran’s I index and local Moran’s I index, respectively, and n is the total number of cities in Guangdong Province. w i j denotes elements of the n × n spatial weight matrix. x i and x j are the observed values of a specific attribute in region i and region j , respectively. x ¯ is the mean value of this attribute across all regions.

2.3. Data Source and Description

The land use data for this study were sourced from the Resource and Environmental Science & Data Cloud Platform of the Chinese Academy of Sciences (https://www.resdc.cn/) [52]. It utilizes the China Land Use Dataset with a spatial resolution of 1 km. This dataset encompasses the years 2005, 2013, and 2023, and is derived from the supervised classification of historical remote sensing images and subsequent manual correction. Based on the land-use characteristics of Guangdong Province, the land-use types in the study area were classified into six categories: cropland, forestland, grassland, water area, built-up land, and unused land. Data on average grain prices were derived from the National Compilation of Agricultural Product Cost and Benefit Data [53]. The socioeconomic data used by the geographic detector were sourced from the “2023 Guangdong Rural Statistical Yearbook” [54].

3. Results and Analysis

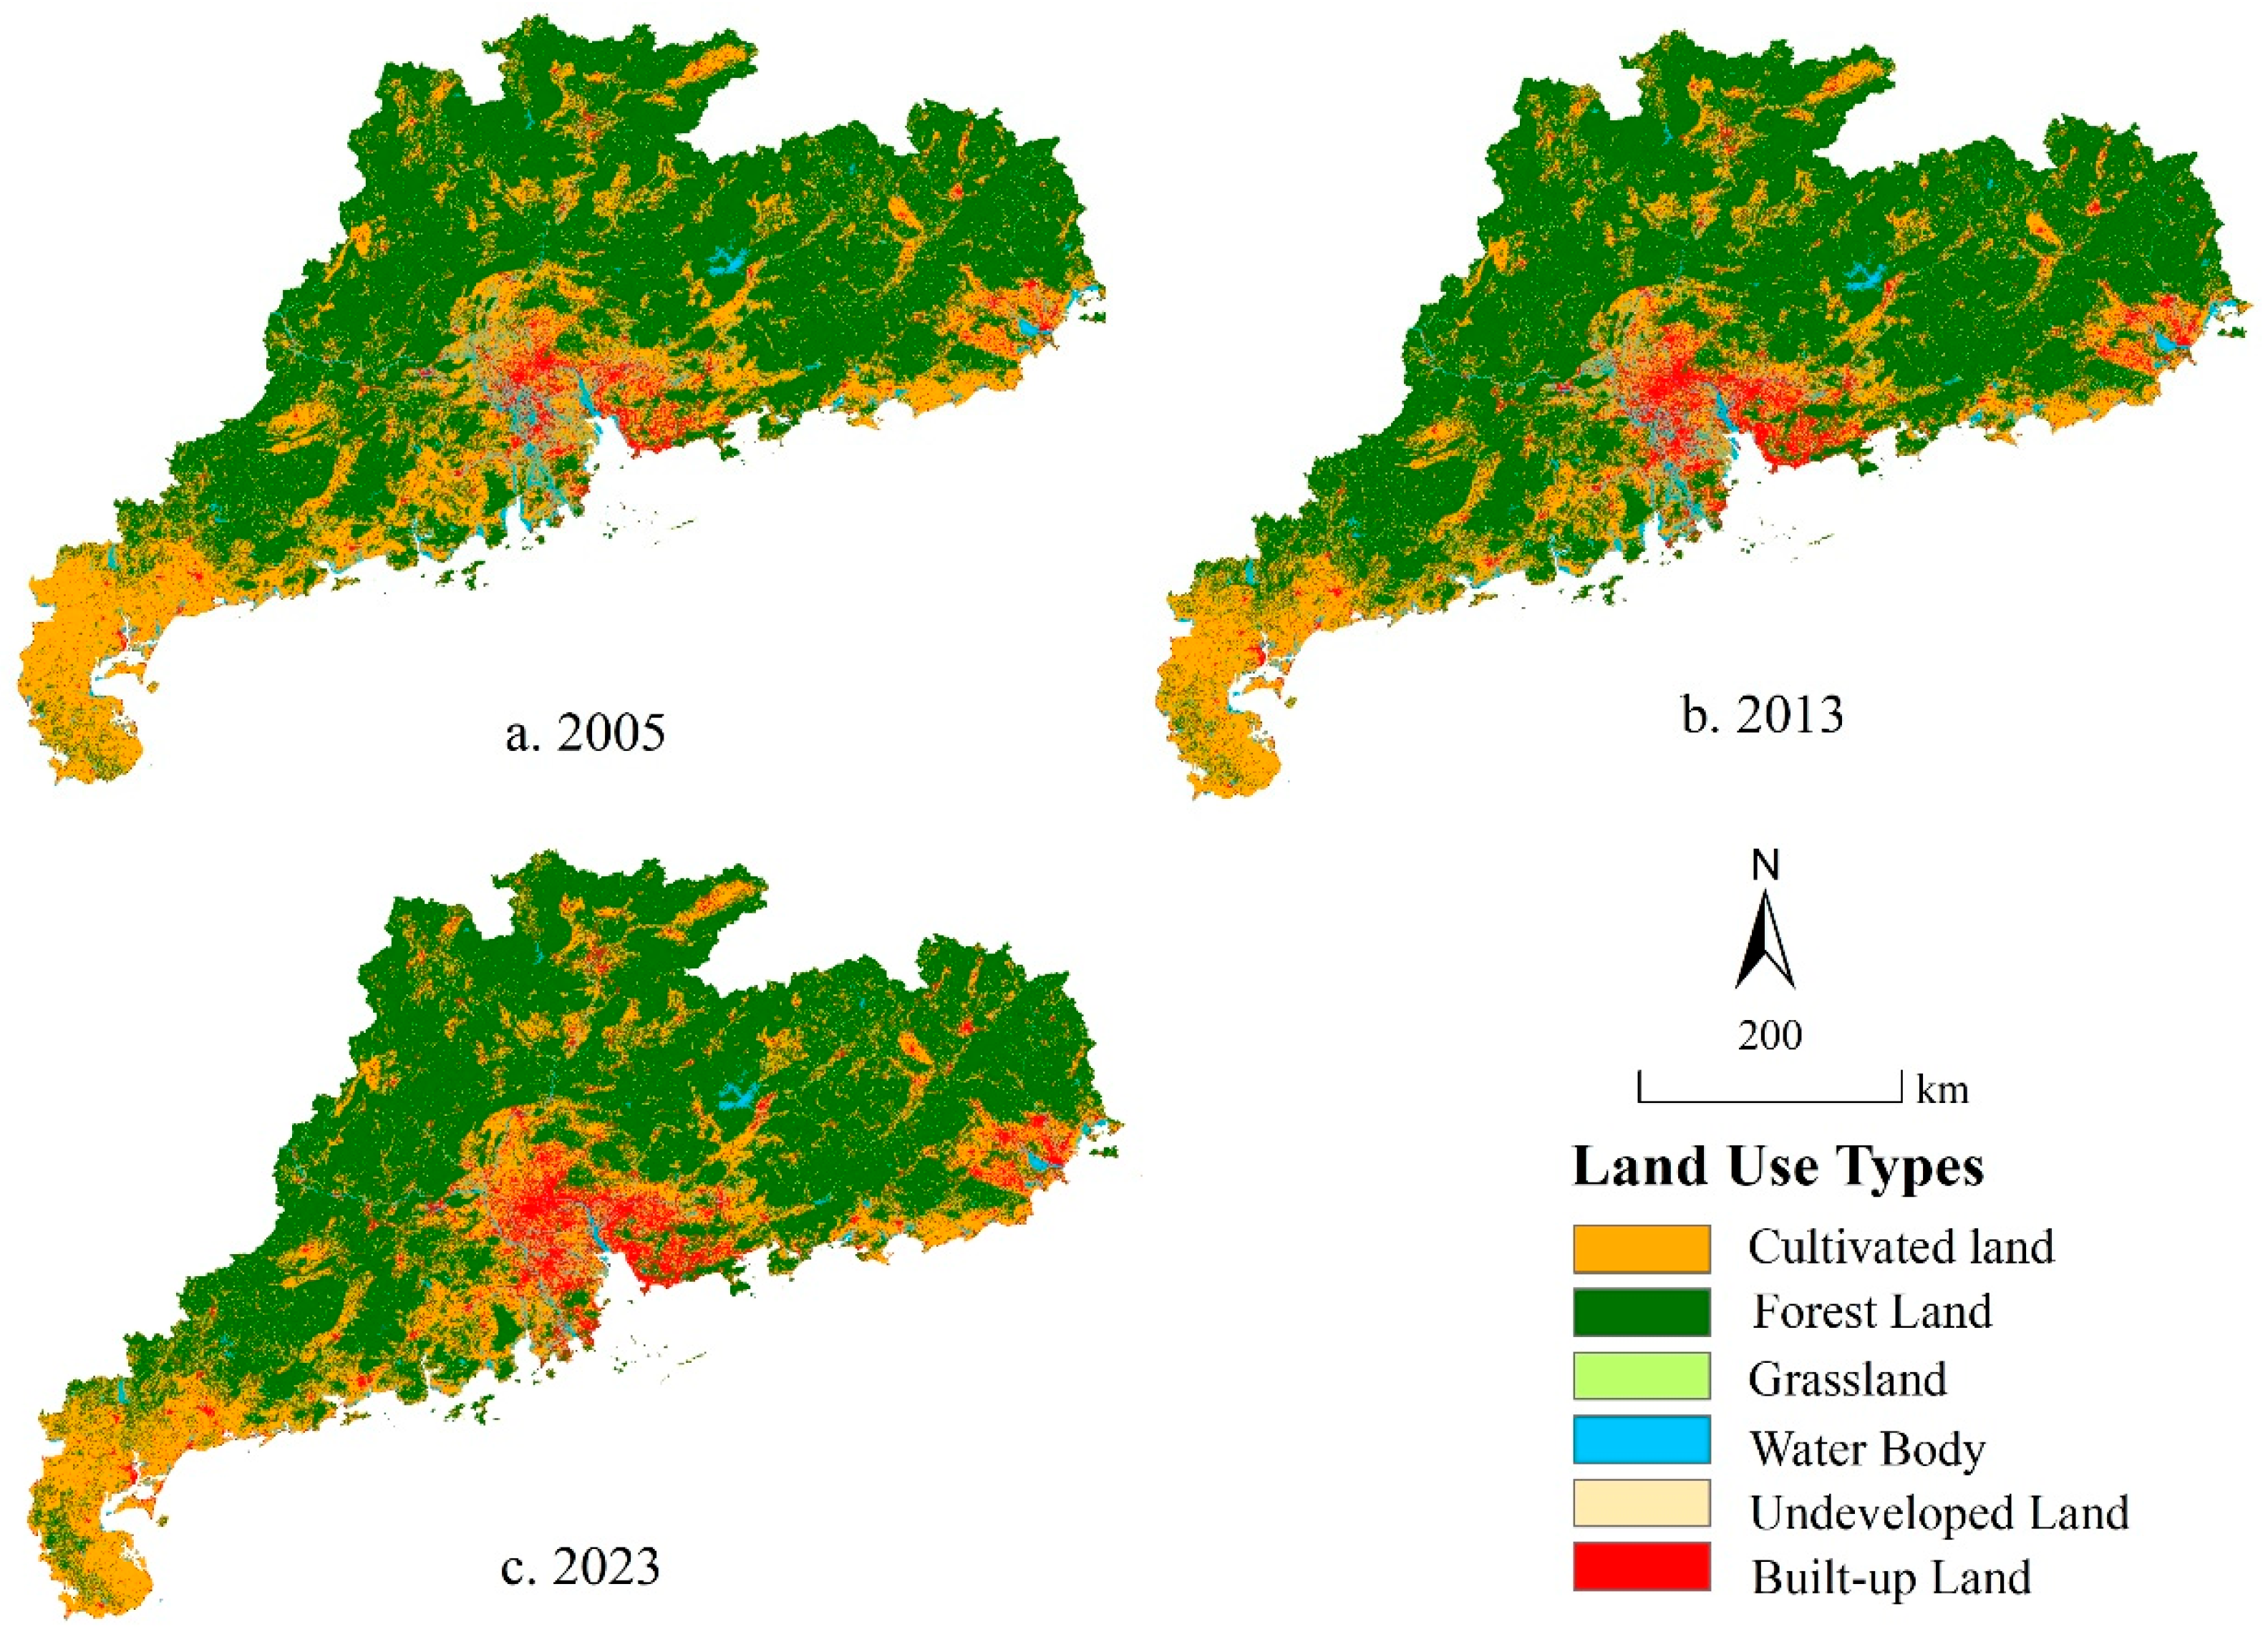
3.1. Analysis of Land Use Change

3.1.1. Overall Analysis of Land Use Change

To deeply analyze the composition of land use types and their internal dynamic change processes in Guangdong Province at different time nodes (Table 2), land use type data of Guangdong were employed, where the area proportion of each land use type is expressed as a percentage, reflecting its relative size to the total area. As shown in Figure 2, the overall area proportions of land types from largest to smallest were forestland, cropland, built-up land, water area, grassland, and unused land. However, due to the decline in water area, grassland exceeded water area in 2023 in terms of area. From 2005 to 2023, forestland and cropland dominated the land use types in Guangdong, collectively accounting for approximately 87.46% of the total basin area. Land use changes exhibited characteristics of continuous expansion of built-up land, a gradual reduction in cropland and forestland, and a slight decline in water area and grassland.
The area of built-up land increased from 10,567.84 km2 to 13,885.59 km2, with its proportion rising from 5.95% to 7.81%. Driven primarily by urbanization in the Pearl River Delta, industrial development in the Guangdong-Hong Kong-Macao Greater Bay Area, and transportation infrastructure construction, this expansion encroached on cropland, forestland, and water areas. The cropland area decreased from 42,833.97 km2 to 40,941.26 km2, with its proportion dropping from 24.11% to 23.04%, attributed to urbanization-induced occupation of high-quality cropland, agricultural structural adjustment, and ecological conversion of farmland. Despite the implementation of the cropland occupation–compensation balance policy, cropland protection in economically developed regions still faced pressures. The forestland area decreased from 108,358.57 km2 to 107,372.24 km2, with its proportion declining from 60.99% to 60.42%. Although still the largest land use type, part of it was reduced due to construction development or agricultural expansion, while policies such as forest carbon sink projects and ecological public welfare forest protection in Guangdong mitigated the decline to some extent. The water area decreased from 8017.57 km2 to 7690.79 km2, with its proportion dropping from 4.51% to 4.33%, while the grassland area stabilized at approximately 7700 km2, accounting for about 4.35%. The changes in both were related to land reclamation from the sea, inland development, and local ecological adjustments. Comparing the two phases, built-up land expanded more significantly from 2005 to 2013, while the growth rate slowed down from 2013 to 2023, reflecting the difference between the earlier extensive urbanization and the later strengthened territorial spatial planning and control.

3.1.2. Analysis of Land Use Change in Various Cities

Land use changes across cities in Guangdong Province exhibited notable regional disparities and structural restructuring characteristics (Table 3). Overall, built-up land expansion was most pronounced in core Pearl River Delta cities: Dongguan’s built-up land proportion increased from 47.20% to 54.28%, and Shenzhen’s rose from 45.49% to 51.97%. Leveraging export-oriented economies and industrial cluster development, both cities saw land resources highly concentrated in industrial, urban, and transportation infrastructure. Guangzhou’s built-up land proportion surged from 17.60% to 22.79%, while cropland proportion dropped from 30.89% to 26.94% alongside urbanization. Foshan’s built-up land proportion increased from 26.64% to 33.75%, likely due to “three old” reconstruction (redevelopment of outdated urban areas, industrial sites, and villages) enhancing stock land use efficiency. Zhongshan’s built-up land proportion rose from 25.58% to 32.38%, primarily driven by industrial platform expansion transforming land use structures. Zhuhai’s built-up land proportion increased from 16.87% to 27.70%, with accelerated land function conversion in coastal zones. Huizhou’s built-up land proportion grew from 4.60% to 7.78%, marked by significant industrial land expansion, while Jiangmen’s increased from 6.05% to 8.19%, notably driven by coastal construction demands. Cropland areas in these cities all showed declining trends. Beyond urban expansion, agricultural “non-grainization” emerged as a critical factor, reflecting dual pressures from agricultural restructuring and urbanization.
Northern Guangdong and ecologically sensitive areas are dominated by forest land: Heyuan City maintained forest land coverage stable at 77–78%. Strict ecological protection policies strictly constrained forest land development, with construction land proportion only increasing from 0.91% to 1.86%, making it one of the cities with the lowest development intensity around the Pearl River Delta. Meizhou City sustained forest land at approximately 75%, while its construction land proportion rose from 1.06% to 1.73%, primarily driven by moderate urban expansion in downtown areas. Shaoguan City witnessed a slight decline in forest land from 73.12% to 72.78%, with localized economic development causing forest fragmentation, though its overall ecological barrier function remained stable. Qingyuan City saw construction land increase from 1.79% to 2.76%, with notable growth in industrial land during the Guangqing integration process, yet forest land in northern mountainous areas remained dominant. Yunfu City experienced an increase in construction land from 3.14% to 5.02%, driven by industrial transfer industrial park construction, leading to a decline in forest land from 69.52% to 68.75%, which still exceeded the provincial average. The effectiveness of forest land protection in these regions benefits from the implementation of the Guangdong Provincial Forest Protection and Management Regulations, which stipulate systems such as forest land use regulation and classified management of ecological public welfare forests, providing legal safeguards for regional ecological security.
In coastal cities, water area and grassland utilization exhibited a pattern of coexistence of development and conservation: Shantou’s water area proportion declined from 15.38% to 15.19%, as land reclamation for port-based industries reduced tidal flat areas, while river wetland protection measures achieved partial effectiveness; Zhanjiang’s water area proportion decreased from 6.54% to 6.46%, with expansion of mariculture ponds offsetting part of the natural water reduction, and built-up land proportion increased from 7.31% to 8.48%, primarily driven by port–industrial projects; Shanwei’s built-up land proportion rose from 2.73% to 4.28%, driven by coastal development zone construction, while grassland proportion slightly declined from 20.57% to 20.25%, with coastal dune vegetation areas stabilized by ecological restoration; Yangjiang’s built-up land proportion increased from 3.65% to 5.48%, propelled by tourism development and coastal new area construction, with water area proportion dropping from 3.86% to 3.71% in relation to reservoir construction and river regulation; Maoming’s built-up land proportion grew from 5.92% to 6.93%, marked by significant expansion of coastal new areas and high-tech zones, while grassland proportion stabilized at approximately 3.2%, mainly distributed in low-mountain grass slopes with minimal fluctuations due to forestry policies.
The proportion of unused land remains extremely low across all regions. In Shanwei City alone, due to the distribution of coastal tidal flats and mountainous bare rock, the proportion of unused land marginally declined from 0.66% to 0.64%, while cities like Shenzhen and Dongguan consistently maintained a 0% unused land rate, reflecting the highly developed nature of land use in Guangdong Province.
Notably, cropland protection has been notably effective in non-Pearl River Delta regions: cities in eastern and northern Guangdong, such as Chaozhou, Jieyang, and Meizhou, have limited the decline in cropland proportion to 1–2%, significantly lower than in core Pearl River Delta areas. This achievement can be attributed to the provincial fiscal compensation mechanism for major grain-producing areas and high-standard farmland construction projects. Meanwhile, cities along the western Pearl River Estuary, such as Zhongshan and Zhuhai, may have improved cropland quality through the “occupation-compensation balance” policy. Although their cropland areas have decreased, concentrated agricultural parks have ensured stable grain production capacity.

3.2. ESV Analysis Results

3.2.1. ESV Temporal Change Analysis

From 2005 to 2023, the ESV of Guangdong Province showed a downward trend, with the total ESV decreasing from 6488.24 billion CNY in 2005 to 6367.64 billion CNY in 2023, a cumulative reduction of 120.59 billion CNY (Table 4). The contribution rates of Guangdong’s ESV followed the order of forestland > water area > cropland > grassland > unused land, with forestland consistently serving as the primary contributor, accounting for 67.33% in 2005 and 67.98% in 2023, to highlight the core role of forest ecosystems. During 2005–2023, the ESV of cropland, grassland, and water areas declined while forestland ESV decreased marginally, and unused land ESV experienced minimal reduction. Cropland ESV dropped from 372.32 billion CNY in 2005 to 355.87 billion CNY in 2023, a decrease of 16.45 billion CNY with a decline rate of 4.42%, mainly due to urbanization-induced cropland occupation and agricultural structural adjustments. Grassland ESV declined from 203.35 billion CNY to 201.89 billion CNY, a reduction of 1.46 billion CNY with a decline rate of 0.72%, showing minimal fluctuations that reflect relatively stable grassland ecological functions. Water area ESV saw the most significant decline, decreasing from 1543.53 billion CNY to 1480.61 billion CNY, a reduction of 62.91 billion CNY with a decline rate of 4.08%, including a reduction of 34.82 billion CNY during 2005–2013 and a further 28.09 billion CNY decline during 2013–2023, which may be related to precipitation fluctuations and reduced total water resources caused by climate change as well as intense human activities. Forestland ESV decreased from 4368.79 billion CNY to 4329.02 billion CNY, a reduction of 39.77 billion CNY with a decline rate of 0.91%, benefiting from forest protection policies that basically maintained forestland area, though changes in forest quality or structure may have caused a slight decline in service value per unit area. Unused land ESV had a small reduction, but its impact on the overall ESV was negligible due to its small base. Overall, the decline in Guangdong’s ESV is attributed to land use changes, particularly the encroachment of cropland and water areas by expanding built-up land, and the increased intensity of water resource development and utilization.

3.2.2. ESV Spatial Change Analysis

Using the natural break method, ESV was classified into five grades (Figure 3 and Table 5). Core economic zones in the Pearl River Delta witnessed significant ESV declines: Shenzhen’s ESV fell from 48.63 billion CNY to 41.72 billion CNY, a decline of 14.2%, as intense urbanization-driven built-up land expansion encroached on ecological lands such as cropland and wetlands; development activities like the Qianhai land reclamation project in Shenzhen compressed ecological spaces. Zhuhai’s ESV dropped from 101.80 billion CNY to 85.40 billion CNY, a decline of 16.1%, with construction projects in the Hengqin New Area converting ecological land to urban use. Dongguan’s ESV decreased from 76.94 billion CNY to 70.90 billion CNY, a decline of 7.8%, as manufacturing-driven industrial land sprawl led to the decline of agricultural ecological functions. Zhongshan’s ESV fell from 84.45 billion CNY to 79.06 billion CNY, a decline of 6.4%, with urban construction and industrial park development squeezing ecological spaces. Guangzhou’s ESV declined from 251.24 billion CNY to 242.31 billion CNY, a decline of 3.6%, as expanding urban scale and population agglomeration exerted sustained pressure on ecosystems. Foshan’s ESV dropped from 146.89 billion CNY to 138.56 billion CNY, a decline of 5.7%, with overlapping industrialization and urbanization fragmenting ecological lands. Huizhou’s ESV decreased from 395.94 billion CNY to 385.06 billion CNY, a decline of 2.8%, with land development in the Guangdong-Hong Kong-Macao Greater Bay Area causing a moderate ESV decline. Jiangmen’s ESV fell from 397.79 billion CNY to 389.67 billion CNY, a decline of 2.1%, as gradual impacts from urban development and agricultural restructuring affected ecosystem service values.
In the northern Guangdong ecological barrier zone, cities maintained stable ESV levels: Heyuan experienced a slight decrease from 61.502 billion CNY to 61.188 billion CNY (−0.5%), with policies such as Dongjiang water source protection and returning farmland to forest effectively sustaining forest and grassland areas; Meizhou saw a decline from 56.088 billion CNY to 55.866 billion CNY (−0.4%) as ecological function zone management policies curbed large-scale land use changes; Qingyuan’s ESV dropped from 66.421 billion CNY to 65.963 billion CNY (−0.7%), with ecological protection in the Nanling Mountains and retention of agricultural spaces mitigating ESV decline; Shaoguan’s ESV decreased from 64.218 billion CNY to 63.880 billion CNY (−0.5%), attributable to the positive effects of forest resource protection and mine ecological restoration projects.
Differentiated patterns emerged in eastern and western Guangdong: Shantou’s ESV first increased by 3.0% to 9.485 billion CNY in 2013 compared to 2005, possibly linked to wetland restoration in the Han River Delta and periodic expansion of water areas, but fell back to 9.106 billion CNY by 2023, indicating limited long-term effects of localized ecological projects; Jieyang experienced a 1.0% decline from 16.098 billion CNY to 15.932 billion CNY with relatively slow urbanization causing minimal ecosystem disturbance; Shanwei saw a 1.5% decrease from 17.473 billion CNY to 17.212 billion CNY influenced by slight impacts from coastal zone development and fisheries structure adjustment; Chaozhou’s ESV dropped by 0.6% from 10.733 billion CNY to 10.668 billion CNY supported by the strong stability of agricultural ecosystems and hilly forest lands; Maoming recorded a 1.0% decline from 38.580 billion CNY to 38.173 billion CNY with localized ecological pressures arising from agricultural land intensification and industrial park construction; Zhanjiang’s ESV fell by 1.2% from 39.380 billion CNY to 38.901 billion CNY reflecting a trade-off between port industrial development and coastal wetland protection; Yangjiang experienced a 1.7% decrease from 26.865 billion CNY to 26.408 billion CNY with initial effects emerging from balancing coastal tourism development and forest land protection; Yunfu saw a 1.3% decline from 25.658 billion CNY to 25.318 billion CNY as tensions emerged between stone industry development and mountain ecosystem conservation; Zhaoqing’s ESV dropped by 1.7% from 61.110 billion CNY to 60.069 billion CNY, and as a transitional zone connecting the Pearl River Delta and northern Guangdong, contradictions between urban expansion and ecological protection gradually became evident.
From the food security perspective, cropland, as the core carrier of food production, saw its ESV decline from 37.232 billion CNY to 35.587 billion CNY, a decline of 4.42%, reflecting multiple challenges to regional food security. The primary cause of the cropland ESV decline is the encroachment of cropland by built-up land during urbanization: from 2005 to 2023, the province’s cropland area decreased by 1892.71 km2, with most occupied cropland being high-quality irrigated paddy fields, directly weakening the spatial foundation for food production. The trend of non-grain production shift triggered by agricultural structural adjustment further intensifies this pressure: the expansion of cash crop planting areas has reduced grain crop sown areas, implicitly threatening grain self-sufficiency. Although the cropland occupation–compensation balance policy has maintained the area red line, quality gaps between newly added cropland and occupied cropland limit the effectiveness of grain production capacity compensation. Additionally, the degradation of cropland ecological functions has reduced the resilience of food production systems: factors such as excessive fertilizer use and cropland fragmentation have affected soil fertility and farmland ecosystem connectivity, indirectly leading to declines in ecological service values provided by cropland, including food production support and soil-water conservation. Geodetector results indicate that the irrigation area, as a core driving factor, significantly supports cropland ESV. In the future, measures such as optimizing built-up land distribution, promoting high-standard farmland construction, and strengthening ecological protection of cropland are needed to address the dilemmas of cropland quantity reduction and ecological function degradation, achieving synergistic improvement of food security and ecosystem services.

3.3. Sensitivity Analysis of Ecosystem Service Value

By increasing the ecosystem service value coefficients of each ecosystem type by 50%, the sensitivity indices of ecosystem service value in Guangdong Province were calculated, and the results are shown in Table 6. It can be found that the sensitivity index of forest land is the highest, which is caused by the area advantage of forest land, making its proportion in the total ecosystem service value the largest. All sensitivity indices are less than 1, indicating that the ecosystem service value coefficients in the study area are inelastic. This shows that the adjustment of value coefficients has little impact on the ecosystem service value, and the estimated results of ecosystem service value are credible.

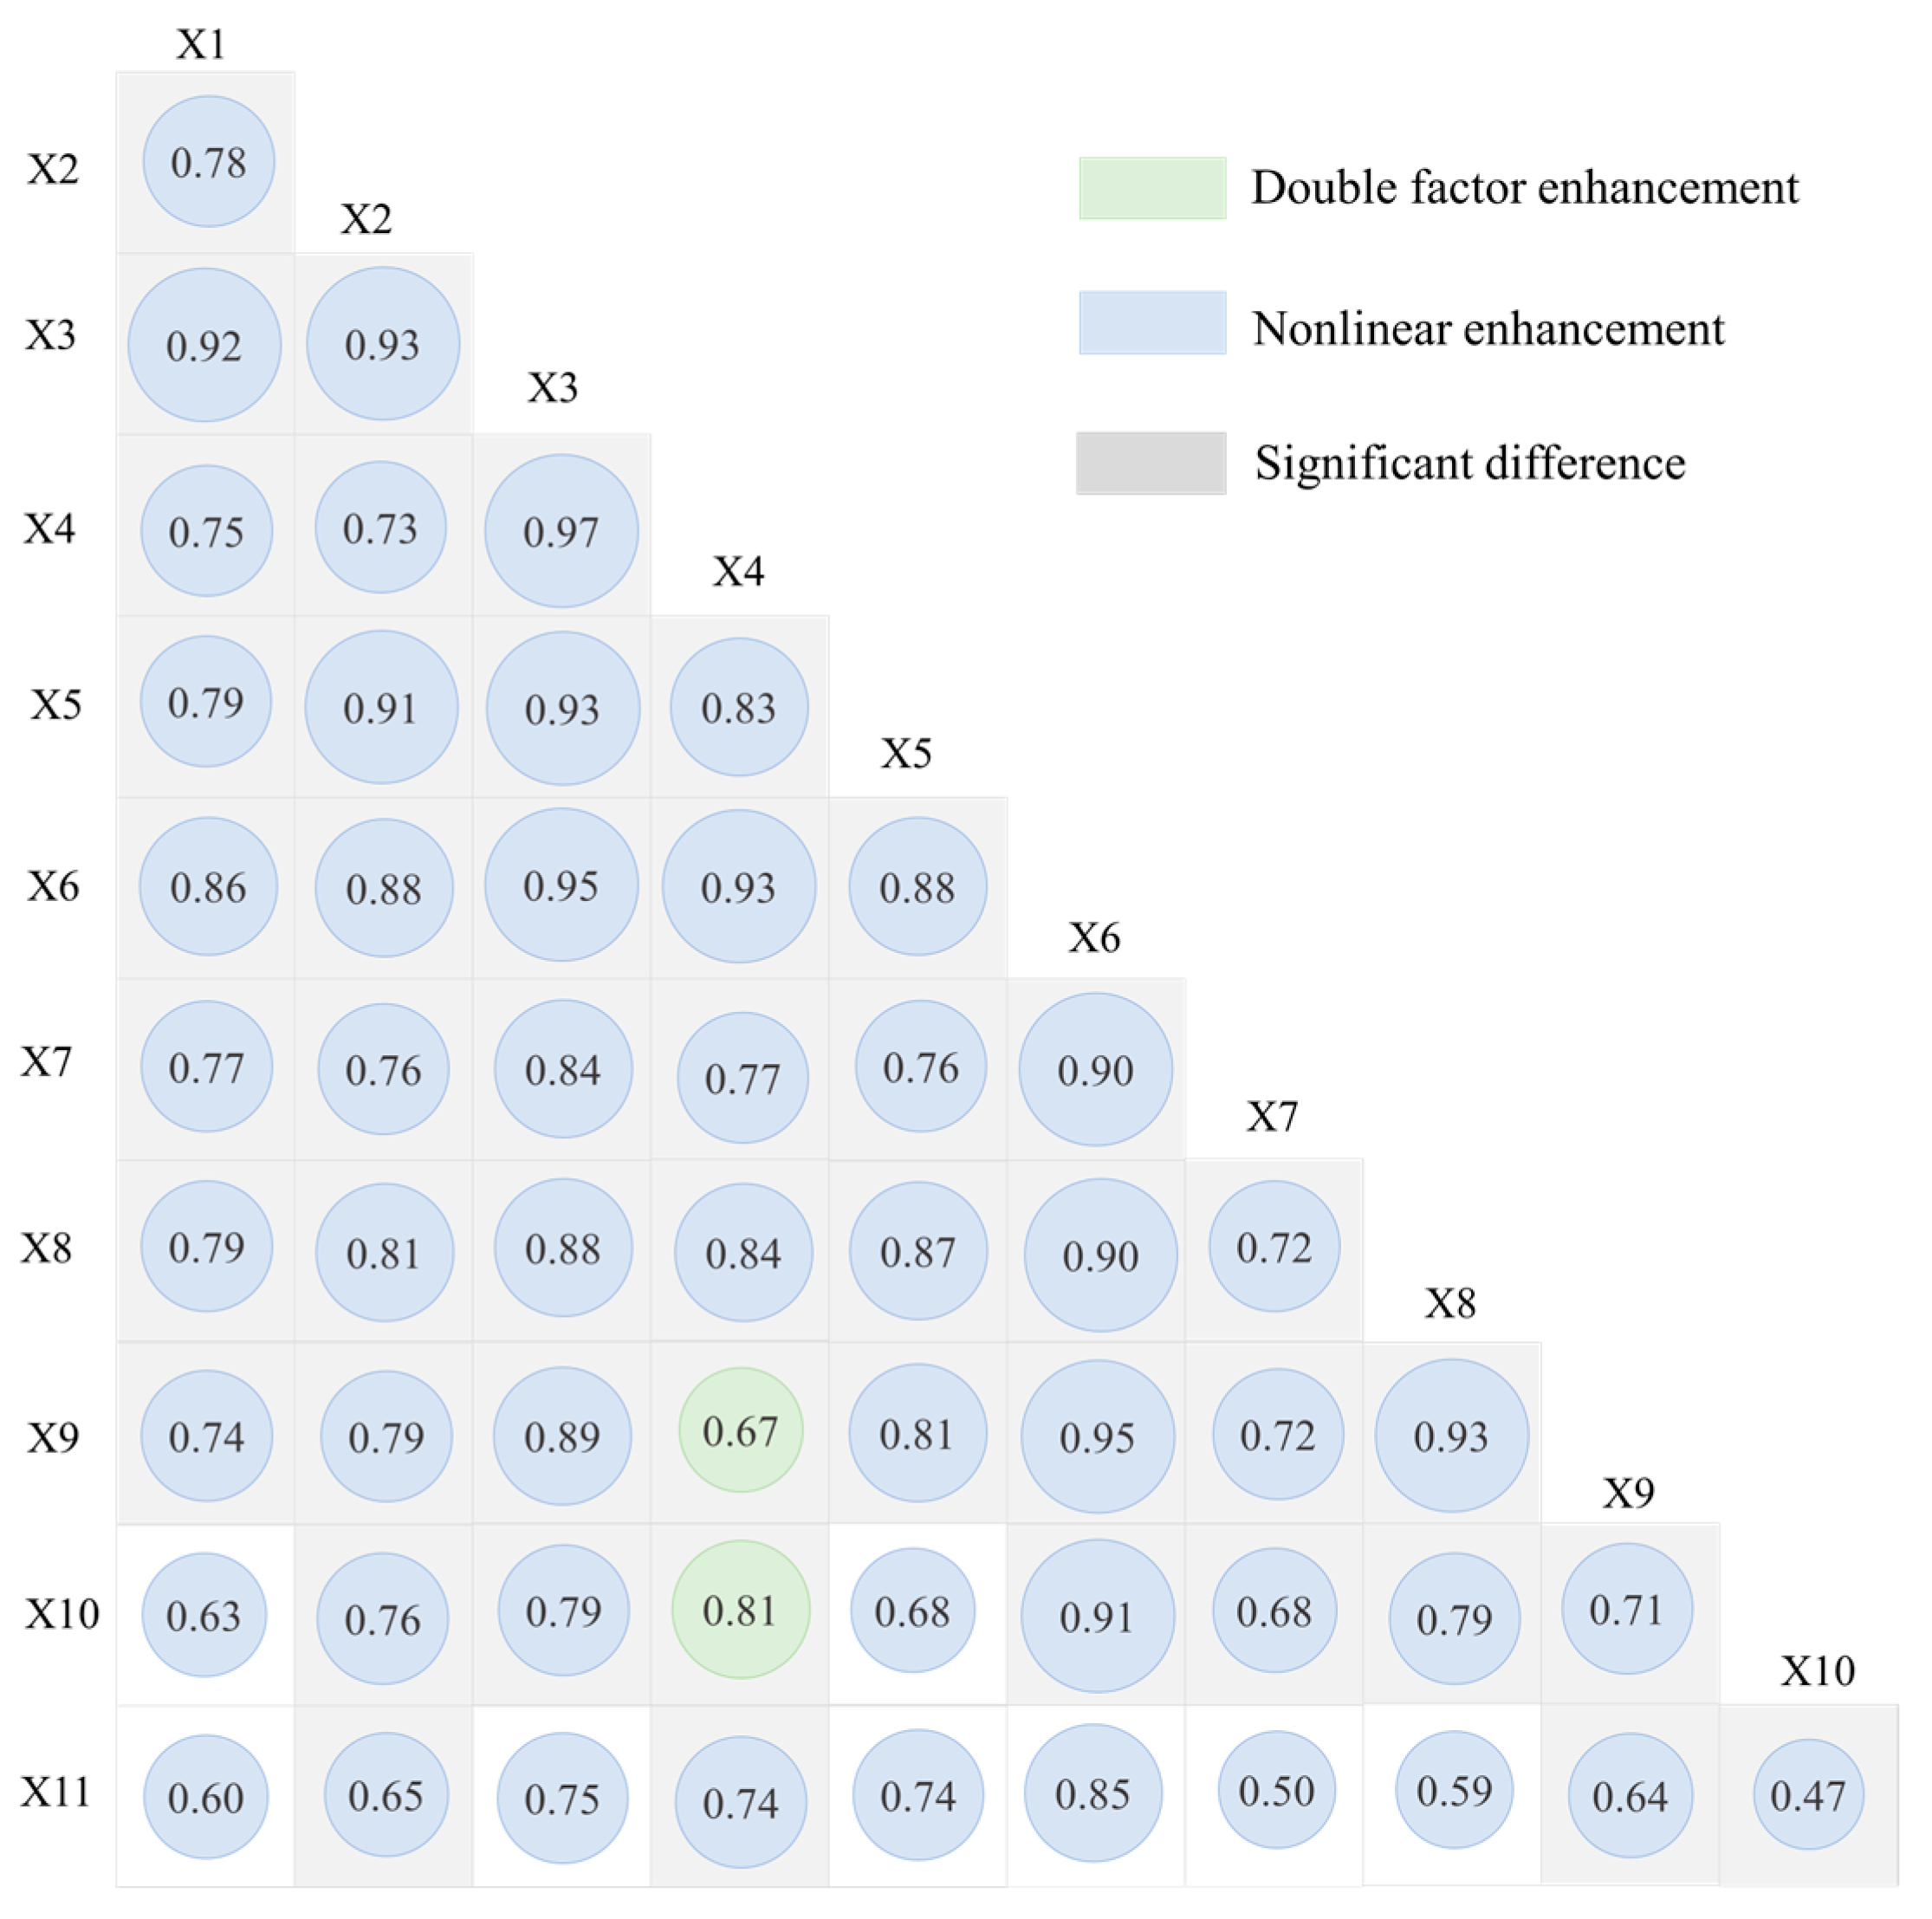
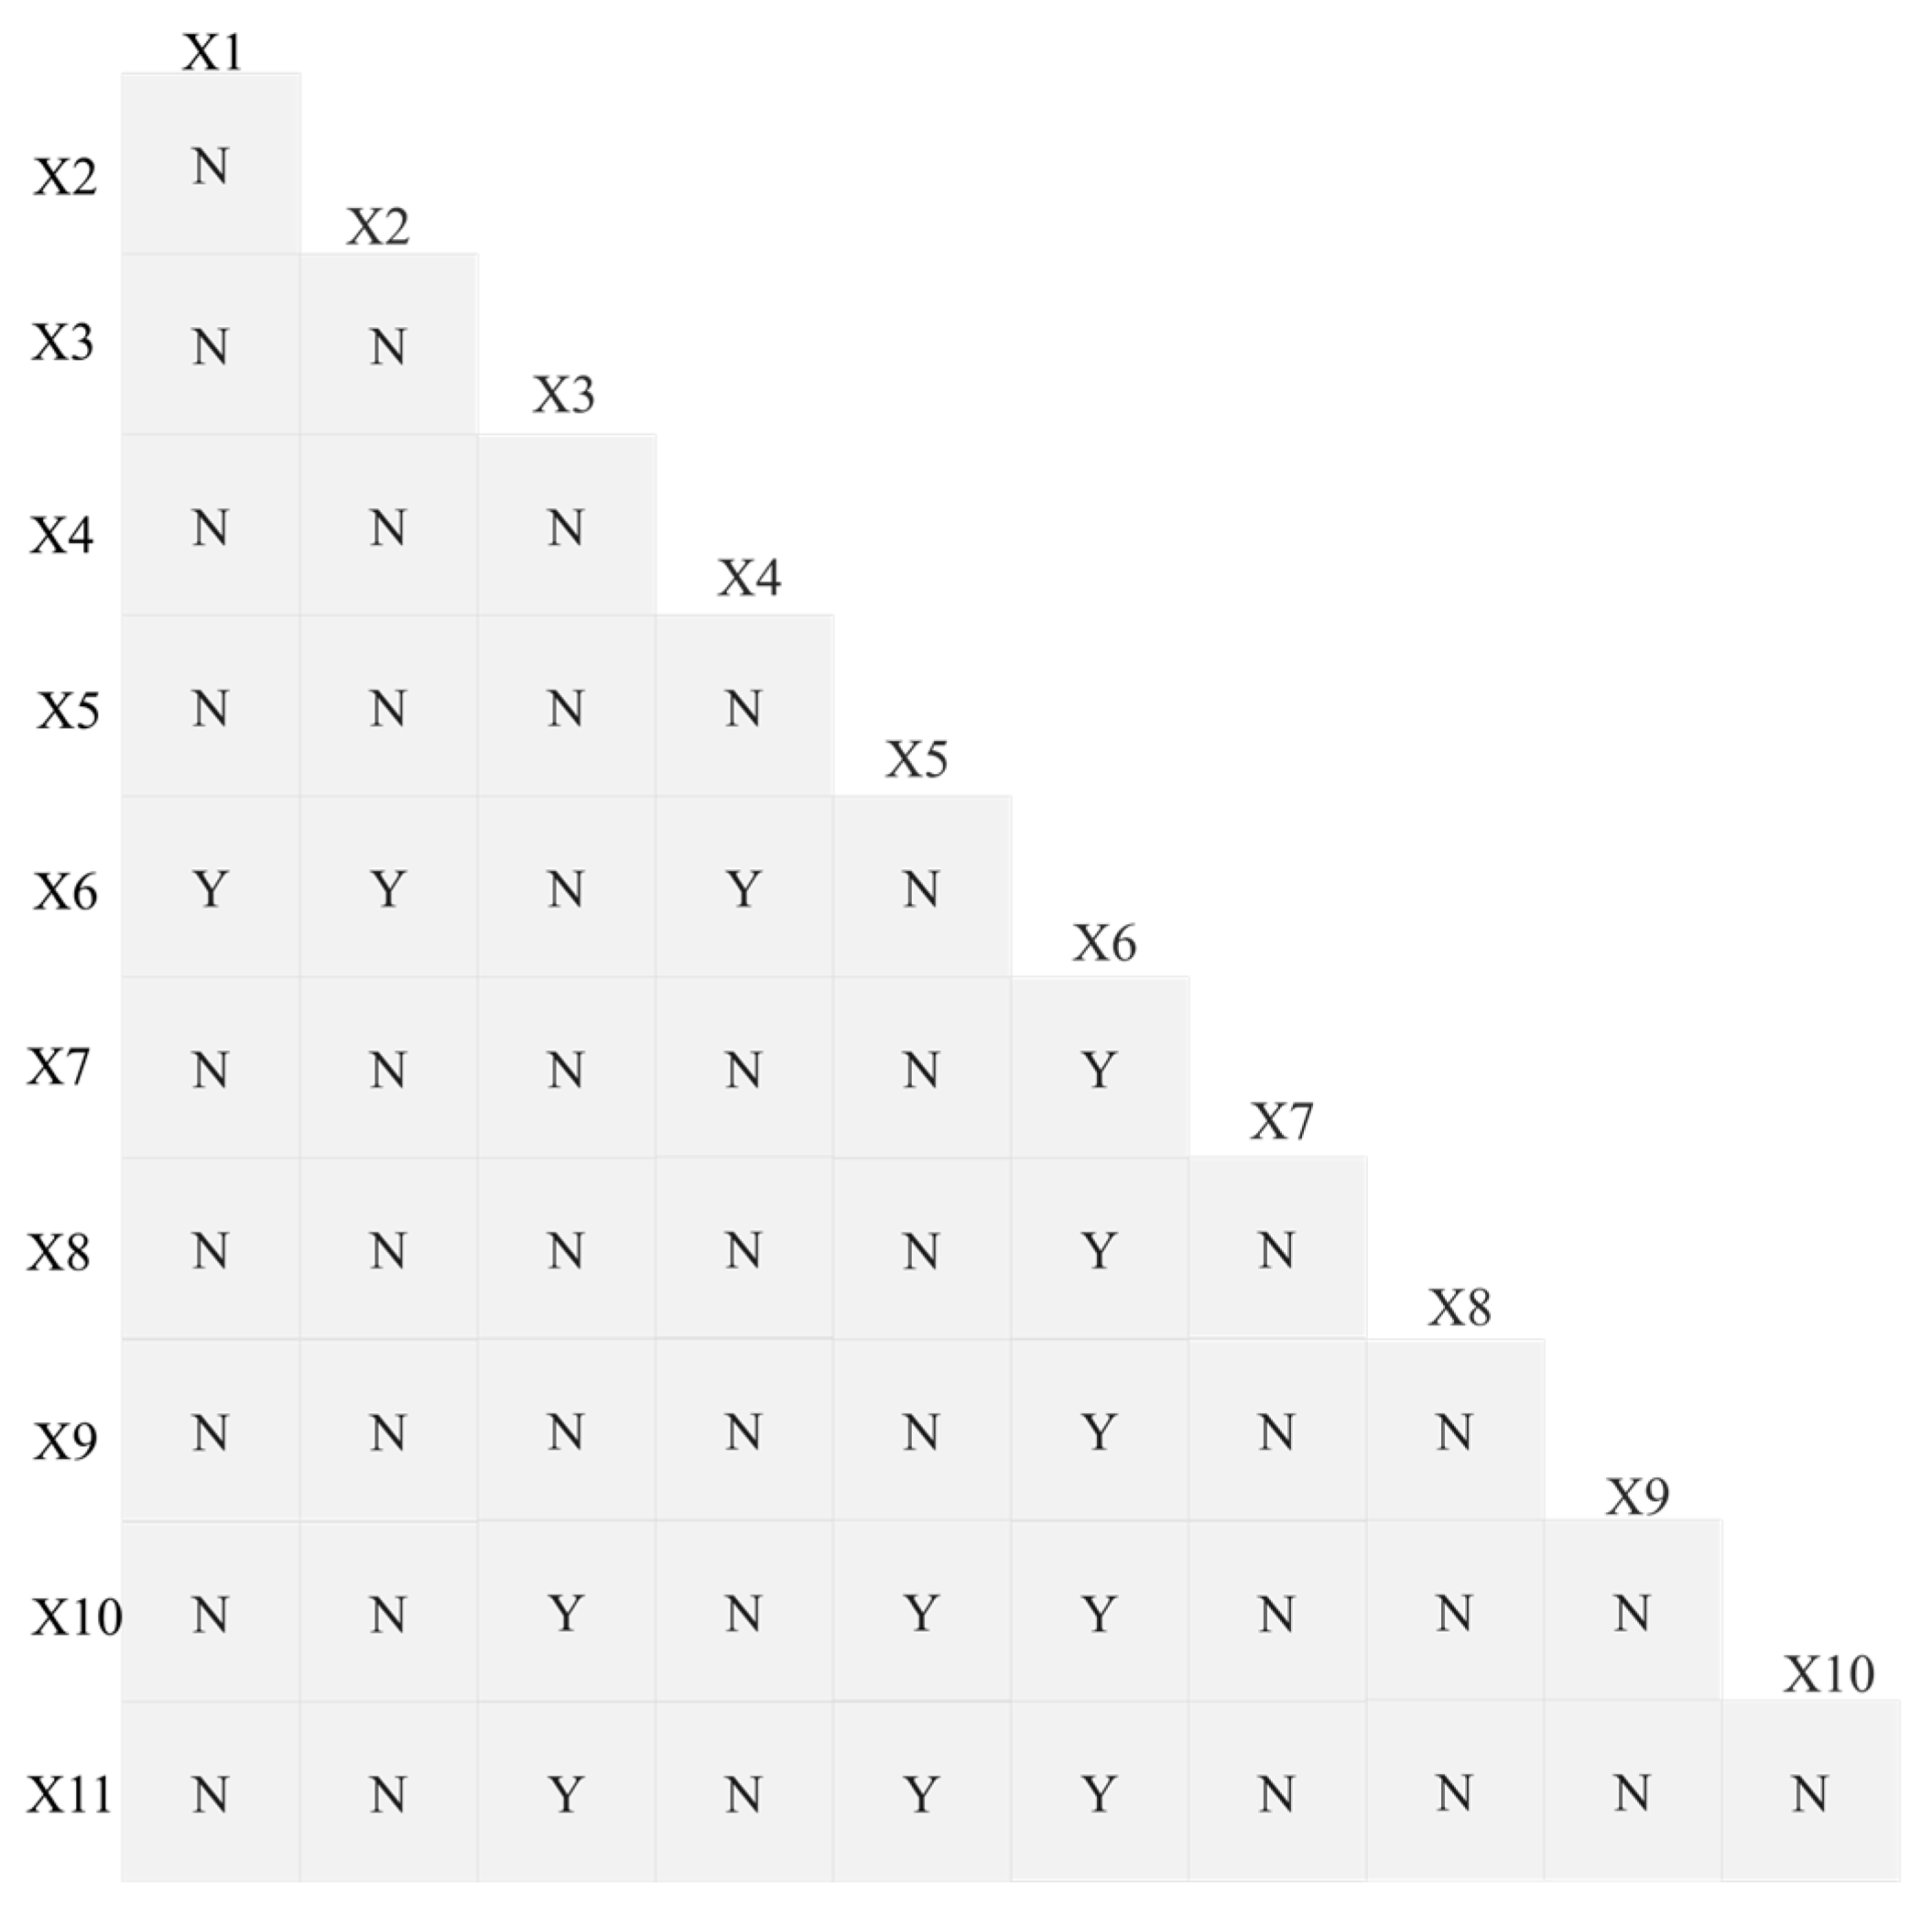
3.4. Results of Geographic Detector Analysis

Considering the actual food production situations across all provinces in China and integrating dimensions such as social, economic, and agricultural development, referencing relevant studies [55,56,57], this study takes the ESV of 21 cities in Guangdong in 2023 as the dependent variable Y and selects the following indicators in 2023 as independent variables X: X1 grain output (tons) directly reflecting the scale of food production, X2 total agricultural machinery power (kWh) measuring the capacity for agricultural mechanized operations, X3 forestry production (km2) reflecting the utilization degree of forestry resources, X4 number of rural professional technical association members (persons) representing the capacity of grassroots agricultural technical services, X5 fertilizer application amount (tons) converted to reflect the intensity of agricultural material input, X6 irrigation area (km2) indicating the capacity of farmland water conservancy protection, X7 number of electromechanical wells (units) measuring the supporting level of irrigation facilities, X8 proportion of primary industry (%) reflecting the contribution of agriculture to the regional economy, X9 gross agricultural output value (CNY) representing the scale of agricultural economy, X10 foreign capital utilized in agriculture, forestry, animal husbandry, and fishery (USD) measuring the capacity for agricultural opening-up and capital introduction, and X11 urban hierarchy reflecting regional development levels and agricultural location advantages.

3.4.1. Single-Factor Detection Results

In the study, urban hierarchy was divided into three grades (first-tier cities, second-tier cities, and third-tier cities), while other independent variables were categorized into four grades through percentile grouping in SPSS 25.0 [58]. Factor detection using Geodetector yielded the q values of driving factors for the ESV spatial differentiation pattern and their ranking (Table 7). Irrigation area exhibited the strongest explanatory power (q = 0.792), indicating that the level of farmland water conservancy facilities is a core factor influencing ESV-efficient irrigation, which may enhance ESV by ensuring crop growth and reducing water stress. Forestry production (q = 0.663) showed that forest resource utilization and ecological protection are directly linked to functions such as carbon sequestration and soil-water conservation, with a high q value reflecting the significant contribution of regional forest management or ecological projects to ESV. Fertilizer application amount (q = 0.662) revealed a significant double-edged effect of agricultural material input intensity: reasonable fertilization can boost productivity, but excessive use may trigger non-point source pollution, requiring a comprehensive assessment with ecological thresholds. Grain output (q = 0.542) and proportion of primary industry (q = 0.539) respectively reflect the scale of food production and the economic status of agriculture—high-value areas may improve resource utilization efficiency through large-scale production but may also face ecological pressures from intensive development. Total agricultural machinery power (q = 0.506) is positively correlated with production efficiency, though its impact on ESV may be indirectly manifested through reduced labor input, energy consumption reduction, or changes in land use patterns. Gross agricultural output value (q = 0.480) reflects the scale of the agricultural economy, and its relationship with ESV may depend on regional industrial structures. The number of rural professional technical association members (q = 0.406) and the number of electromechanical wells (q = 0.448) showed insufficient explanatory power, possibly due to high regional technical penetration or small differences in water resource conditions. Foreign capital utilized in agriculture, forestry, animal husbandry, and fishery (q = 0.306) and urban hierarchy (q = 0.264) had weak impacts on ESV, suggesting that ESV spatial differentiation relies more on local agricultural production factors than on macro-regional hierarchies or foreign capital investment.

3.4.2. Interactive Factor Detection Results

During the study period, spatial overlay interaction detection was conducted on the factors, and the detection results showed (Figure 4) that the explanatory power of different driving factors for agricultural net carbon sink after interaction was greater than that of any single factor, and all interaction types manifested as bivariate enhancement or nonlinear enhancement. Thus, it can be concluded that the spatial differentiation pattern of the agricultural net carbon sink in the study area is the result of coupled interactions among multiple influencing factors, highlighting the complex characteristics between the agricultural net carbon sink and its influencing factors. Overall, the explanatory power of each interacting factor was enhanced to varying degrees, and the main influencing factors always exhibited high interaction enhancement. As seen from the interaction impact matrix, the synergistic effects of various factors on the spatial differentiation of ESV showed significant differences: combinations such as forestry production and irrigation area (q value of 0.95), number of rural professional technical association members and forestry production (q value of 0.97), and irrigation area and gross agricultural output value (q value of 0.95) all had interaction q values exceeding 0.95, indicating strong synergistic effects among these factors. Improved irrigation conditions can provide water security for agricultural growth, and the superimposition of technical guidance from professional associations can significantly enhance service values such as carbon sequestration and soil-water conservation in ecosystems. The high interactivity between irrigation facilities and gross agricultural output value reflects that efficient irrigation, while promoting agricultural production increases, indirectly optimizes resource allocation through large-scale production, amplifying the positive spillover effects of ecosystem services.
The interaction q values of the fertilizer application amount and irrigation area (q = 0.88), as well as the total agricultural machinery power and irrigation area (q = 0.88), are close to 0.9, indicating technical compatibility between agricultural input factors and infrastructure: irrigation system upgrades can improve fertilizer utilization efficiency and reduce the risk of non-point source pollution; the synergy between mechanized operations and irrigation can reduce manual energy consumption, thereby enhancing grain production efficiency and ESV. The lower interaction q values between urban hierarchy and other factors suggest that the impact of urban hierarchy on agricultural ecosystem services is more manifested as an independent effect, with weak linkage effects with other production factors. This is closely related to the differentiation of agricultural functions in different tiers of cities in Guangdong, possibly due to the divergent positioning between urban ecological service-oriented agriculture in first-tier cities and grain-production-oriented agriculture in small- and medium-sized cities.

3.4.3. Ecological Risk Factor Detection Results

Based on the significance test of ecological factors using Geodetector (α = 0.05), Figure 5 shows that irrigation area is the only core factor significantly influencing total grain output, number of rural professional technical association members, proportion of primary industry, and gross agricultural output value (all marked with “Y”), highlighting its fundamental supporting role in food production, technical demand, and industrial economy. Foreign capital utilized in agriculture, forestry, animal husbandry, and fishery, and urban hierarchy, as exogenous factors, significantly affect forestry production, fertilizer application amount, and irrigation area, reflecting the regulatory effects of foreign technology introduction and urban hierarchy radiation on regional agricultural ecology. The remaining factors (marked with “N”) showed no significant influence, primarily due to the diminishing marginal effect of machinery power caused by the popularization of agricultural mechanization in Guangdong, the concentration of rural technical services in irrigation, and forestry being driven by policy rather than local factors.

3.5. Spatial Autocorrelation Test Results

During the study period, the global Moran’s I index and z-value showed a trend of stabilization (Table 8). The results of 999 Monte Carlo permutation tests indicated that the ESV across Guangdong Province during this period had a significant positive spatial autocorrelation (p < 0.05), suggesting that the spatial pattern of ESV was consistent with theoretical expectations and could effectively reflect the spatial distribution characteristics of ESV in Guangdong Province. This provides a reasonable basis for subsequent analysis of the influencing factors of ESV spatial distribution.
The stability maintained during the study period reflects that the intrinsic spatial correlation of ESV in Guangdong Province did not undergo fundamental changes. A plausible explanation is that the Pearl River Delta region, bolstered by its robust industrial foundation, policy advantages, and talent resources, has long dominated as a leading area with high ESV, forming a distinct high-value agglomeration zone. In contrast, eastern, western, and northern Guangdong have exhibited low-value clustering due to relatively weak infrastructure and single-dimensional industrial structures. Although Moran’s I value showed a slight increase in 2023, the magnitude of change remained modest, indicating that the spatial agglomeration degree of Guangdong’s ESV is relatively moderate, without extreme polarization. Meanwhile, this also implies that Guangdong still has considerable space and potential to promote regional coordinated development.
From the spatiotemporal patterns of the local Moran’s I (Figure 6), the spatial agglomeration characteristics of Guangdong’s ESV exhibited remarkable stability from 2005 to 2023: high–high agglomeration persisted in the mountainous areas of northern Guangdong, likely associated with the region’s forest coverage exceeding 70%, which provided a high ecological baseline and synergistic ecological endowments among surrounding cities and counties; low–low agglomeration remained long-term solidified in the coastal areas of eastern Guangdong, possibly due to the squeeze from urbanization and industrial development, leading to fragmentation of agricultural land, a low ESV baseline, and synchronized decline in ecosystem service values in surrounding areas due to similar development pathways; high–low heterogeneous zones were stably distributed in the western Pearl River Delta, where the retention of river network wetlands and ecological agriculture maintained relatively high ESV, while surrounding areas suffered from ESV depression caused by construction land encroachment under the development spillover effects of the Guangzhou-Foshan metropolitan circle, forming “isolated high-value clusters.” Overall, the spatial locking effect between ecological richness in northern Guangdong and ecological low values in coastal areas showed no significant alteration.

4. Discussion

4.1. Research Marginal Contribution

Existing studies have primarily focused on the relationships between land use and ESV, the trade-offs of ESV [36], or changes in landscape patterns [59], yet they lack specific and targeted analyses from the perspective of food security in an international context. Moreover, many social data are based on grid-based estimation, suffering from issues such as insufficient precision. Additionally, the image data [60] used in existing studies exhibit a certain degree of temporal lag. Therefore, the marginal contributions of this paper are as follows: this research systematically analyzed the impacts of land use type changes in 21 prefecture-level cities of Guangdong Province from 2005 to 2023 on food security, deeply explored the driving factors related to food security, and revealed the spatial autocorrelation characteristics of food security. From the perspective of land use type changes, it identified the potential threats to food security posed by trends such as the fluctuating decline in cultivated land area, while also recognizing positive factors like land consolidation that alleviate the pressure of cultivated land reduction, providing a direction for targeted land resource management in the future. In terms of driving factors, geographic detectors were employed to comprehensively analyze the impacts of natural, socioeconomic, and policy factors on food security, enriching the understanding of the influence mechanisms of food security. Spatial autocorrelation tests clearly demonstrated the spatial agglomeration patterns and stability of food security, providing a scientific basis for formulating food security strategies from a regional spatial perspective. As China’s top grain-consuming province, Guangdong’s research carries profound typical significance. Its study, centering on a food-security-oriented perspective and focusing on the coordinated development of sustainable use and food production, offers new evaluation dimensions for regional ecological and economic sustainability. At the macro level, it also supplies forward-looking and strategic decision-making references for safeguarding national food security, optimizing the national strategic resource layout, and tackling the global food crisis.

4.2. Theoretical and Practical Significance

The theoretical significance lies in deepening the understanding of the complex influence system of food security, clarifying the independent and interactive effects of various factors, and refining the regional food security theoretical framework. In practical applications, it provides empirical evidence for governments at all levels in Guangdong Province to formulate precise food security policies, assists in optimizing land resource allocation, rationally guiding industrial development, and strengthening agricultural input guarantees, thereby promoting the improvement of food security levels in Guangdong Province. It also offers a reference paradigm for similar research and practices in other regions, possessing significant reference value.

4.3. Policy Recommendations

In terms of land use planning, it is necessary to optimize the allocation of land resources and reasonably regulate the relationship between the expansion of construction land and the protection of cultivated land, forest land, water areas, and grasslands. For example, core cities in the Pearl River Delta should guide construction directions to improve land use efficiency, while promoting regional coordination and industrial transfer to optimize the province’s land layout. The Northern Guangdong Ecological Zone needs to continuously strengthen ecological protection policies to achieve the organic integration of ecology and economy. In terms of cultivated land protection, it is essential to improve the financial compensation mechanism to enhance farmers’ enthusiasm for protection, promote the construction of high-standard farmland, and strictly implement the cultivated land requisition-compensation balance system to ensure the quantity and quality of cultivated land. Supervision and assessment of cultivated land protection responsibilities must be strengthened and incorporated into the performance system of local governments.
In the field of ecological protection and restoration, it is necessary to strengthen the protection of forestland ecosystems and increase the cultivation of forestland resources to improve forest quality. For example, we can refer to Xinfeng County, Shaoguan City, Guangdong Province. Implementing the Smart Forestry Forest Quality Improvement Project and adopting advanced technologies such as “unmanned aerial vehicle afforestation + near-natural mixed forest construction + Internet of Things monitoring” has significantly improved forest quality and the value of ecosystem services. For areas where the value of ecosystem services has declined, ecological restoration projects should be carried out to enhance their functions. At the level of agricultural development, it is necessary to improve the construction level of agricultural water conservancy facilities and promote water-saving technologies. Use chemical fertilizers scientifically and rationally, promote precision fertilization technology, and strengthen the adaptive research on agricultural technologies to develop planting models suitable for local conditions.
In terms of food security guarantees, ensuring the stability of the area and quality of cultivated land is of crucial importance, as it can enhance the resilience of grain production. Technically, from Xingning City, Meizhou City, Guangdong Province, by implementing the Ultra-High-Yield and High-Quality Rice Integration Technology Demonstration Project and adopting high-yield varieties such as “Qingxiangyou 19 Xiang” as well as technologies like ultrasonic seed treatment and intelligent water and fertilizer management, the grain yield has been increased. Promote the development of the grain industry, cultivate and strengthen the industrial chain, and facilitate industrial integration. Meanwhile, the grain reserve system should be improved, and a monitoring and early-warning mechanism should be established to ensure regional food security. In terms of policies and management, advanced technologies should be used to establish a dynamic monitoring system to obtain accurate data. Meanwhile, in terms of improving policies and regulations to clarify responsibilities and strengthening policy implementation supervision, Shunde District, Foshan City, Guangdong Province, promotes special rectification and improves the system through supervision proposals. At the same time, it innovates the integrated supervision model in the field of market supervision to ensure policy implementation. In addition, regional cooperation and coordination should be strengthened to achieve resource sharing and promote the rational utilization of land and ecological protection.

4.4. Research Limitations

The study is limited by the coarse spatial resolution (1 km) of the land use data, which may obscure fine-scale urban–rural land use transitions and introduce uncertainties in ESV calculations. Additionally, the reliance on Xie Gaodi’s equivalent factor method—assuming fixed ecosystem service values across regions and overlooking ecosystem quality variations—could bias ESV assessment results. The decline in ecosystem service value (ESV) may be underestimated to some extent, as existing methods may not fully capture the complexity of all relevant ecological factors and their interactions. Future research will employ models like INVEST for deeper exploration. In the selection of driving factors, although multiple aspects are covered, there may still be potentially important factors that have not been identified, such as the details of agricultural technological innovation and the differences in individual farmers’ behaviors. Moreover, the self-sufficiency rate of food can also better measure regional food security, leading to an incomplete exploration of the driving mechanism. Furthermore, the spatial autocorrelation analysis mainly focuses on describing global and local characteristics, showing a slight insufficiency in discussing the causes of spatial heterogeneity. The research is limited by the number of provincial units, and there are certain limitations in the identification of weak interactions by geographic detectors. Subsequent studies can expand the sample range, combine county-scale data or grid data, and further verify the intensity of factor action through multi-scale analysis, thereby enhancing the universality and reliability of the conclusion.

4.5. Future Research Directions

In the future, efforts can be made to further improve data quality by adopting higher-precision land use monitoring technologies and multisource data fusion methods to more accurately grasp the dynamics of land use changes. The scope of driving factor analysis should be expanded to deeply explore the impacts of micro-level and emerging factors, such as the behaviors of new agricultural business entities and the application of digital agricultural technologies. Meanwhile, the depth of spatial analysis should be strengthened by using methods like geographically weighted regression to thoroughly investigate the causes of spatial heterogeneity and construct more accurate food security prediction models, providing more robust support for precise policy-making and sustainable development of food security in Guangdong Province and even nationwide.

5. Conclusions

Spatiotemporal evolution and driving mechanisms of land use: from 2005 to 2023, land use in Guangdong Province was dominated by forest land and cultivated land, exhibiting characteristics of construction land expansion, gradual contraction of cultivated and forest land, and modest declines in water and grassland areas. Core cities in the Pearl River Delta experienced significant urban sprawl, while forest land remained stable in the northern Guangdong ecological zone. Coastal cities showed a coexistence of water-grassland development and conservation, and non-PRD areas achieved notable cultivated land protection outcomes. Construction land expansion was driven by urbanization, industrial growth, and infrastructure development; cultivated land reduction was influenced by urban encroachment and agricultural structural adjustment; forest land changes resulted from both construction activities and ecological protection policies; water-grassland dynamics were linked to reclamation, inland development, and ecological regulation; and cultivated land protection benefited from fiscal compensation mechanisms, high-standard farmland construction, and the “occupation-compensation balance” policy.
Changes in ecosystem service value and its link to food security: Guangdong’s ESV decreased from 648.824 billion CNY to 636.764 billion CNY between 2005 and 2023, primarily due to construction land encroachment on cultivated land, water areas, and increased water resource development intensity. Forest land remained the primary contributor to ESV despite a slight decline in its own value, while water area values experienced the most significant reduction. Cities in the northern Guangdong ecological barrier zone maintained overall ESV stability: Heyuan, Meizhou, Qingyuan, and Shaoguan saw minor ESV decreases, but their ecological functions were preserved through the effective implementation of ecological protection policies and projects. In eastern and western Guangdong, ESV changes showed differentiated patterns: Shantou’s ESV first increased, then decreased; cities like Jieyang and Chaozhou exhibited modest declines due to urbanization rates and agricultural ecosystem stability; cities such as Zhanjiang and Yangjiang experienced varying degrees of ESV decline due to trade-offs between industrial development and ecological conservation. From a food security perspective, a 4.42% decline in cultivated land area, non-grain cultivation, and ecological function degradation directly weakened the spatial carrier for food production and system resilience, threatening regional food self-sufficiency.
Interactive effects and explanatory power of driving factors: single-factor detection revealed that irrigation area was the core driving factor, with enhanced explanatory power when interacting with factors such as forestry production and fertilizer application rates, indicating apparent impacts of agricultural water conservancy facilities, forest resource utilization, and agricultural material inputs on ESV. The interaction between fertilizer application rates and irrigation area suggested the potential technological synergy of agricultural inputs and infrastructure, as upgraded irrigation systems may improve fertilizer use efficiency and reduce agricultural pollution. The low interaction q-value between city hierarchy and other factors suggested that urban development levels primarily influenced agricultural ecosystem services through independent effects rather than synergistic interactions.
Spatial autocorrelation and agglomeration characteristics of ESV: the study area showed stable global Moran’s I and z-values, indicating positive spatial autocorrelation in ESV, with relatively stable spatial distributions between economically developed and less-developed regions. Guangdong’s ESV exhibited notable spatial agglomeration with certain stability: high–high clusters formed in northern Guangdong due to high forest coverage; low–low clusters persisted in eastern coastal areas due to urbanization and industrial development; high–low heterogeneous zones emerged in western PRD from ecological retention amid surrounding development. Overall, the spatial agglomeration and locking effects of ecological values showed no significant changes.

Author Contributions

Conceptualization, B.W.; methodology, B.W.; software, B.W. and B.Z.; validation, B.W. and Y.D.; formal analysis, B.W.; investigation, B.W.; resources, Y.D.; data curation, B.W.; writing—original draft preparation, B.W.; writing—review and editing, B.W.; visualization, X.J.; supervision, Y.Z.; project administration, B.W. and S.Z.; funding acquisition, C.W., X.T. and Y.D. All authors have read and agreed to the published version of the manuscript.

Funding

Supported by Key Program of Hebei Natural Science Foundation (Class A, Grant No. D2024504001) and National Natural Science Foundation of China (Grant No. 41701368).

Institutional Review Board Statement

It does not involve human participants, animal experiments or any content that may involve ethical review, and therefore does not require the approval of the relevant institutional review committee.

Data Availability Statement

The land-use data in this study were sourced from the Resource and Environment Science and Data Center, Chinese Academy of Sciences (https://www.resdc.cn/), spe-cifically three periods of Landsat remote sensing image datasets with a spatial resolu-tion of 1 km, covering the years 2005, 2013, and 2023. Data on average grain prices were derived from the National Compilation of Agricultural Product Cost and Benefit Data, while socioeconomic data were collected from the Guangdong Agricultural Statistical Yearbook.

Conflicts of Interest

The authors declare no conflict of interest.

References

  1. Chen, H.; Sloggy, M.R.; Dhiaulhaq, A.; Escobedo, F.J.; Rasheed, A.R.; Sánchez, J.J.; Yang, W.; Yu, F.; Meng, Z. Boundary of ecosystem services: Guiding future development and application of the ecosystem service concepts. J. Environ. Manag. 2023, 344, 118752. [Google Scholar] [CrossRef]
  2. Zhao, B.; Kreuter, U.; Li, B.; Ma, Z.; Chen, J.; Nakagoshi, N. An ecosystem service value assessment of land-use change on Chongming Island, China. Land Use Policy 2004, 21, 139–148. [Google Scholar] [CrossRef]
  3. Holt, A.R.; Alix, A.; Thompson, A.; Maltby, L. Food production, ecosystem services and biodiversity: We can’t have it all everywhere. Sci. Total. Environ. 2016, 573, 1422–1429. [Google Scholar] [CrossRef] [PubMed]
  4. He, H.; Pan, Y.; Zhu, W.; Liu, X.; Zhu, X. Measurement of terrestrial ecosystem service value in China. Chin. J. Appl. Ecol. 2005, 16, 1122–1127. [Google Scholar]
  5. Zeng, B.; Wen, B.; Zhang, X.; Zhao, S.; Shang, G.; An, S.; Li, Z. Analysis on Spatiotemporal Variation in Soil Drought and Its Influencing Factors in Hebei Province from 2001 to 2020. Agriculture 2025, 15, 1109. [Google Scholar] [CrossRef]
  6. Zhang, X.; Song, W.; Gao, H. A Sharpe ratio-integrated indicator system for land use changes ecological risks: Within coupled disaster-economic assessment frameworks. Ecol. Indic. 2025, 176, 113704. [Google Scholar] [CrossRef]
  7. Mataveli, G.; Maure, L.A.; Sanchez, A.; Dutra, D.J.; de Oliveira, G.; Jones, M.W.; Amaral, C.; Artaxo, P.; Aragão, L.E.O.C. Forest Degradation Is Undermining Progress on Deforestation in the Amazon. Glob. Chang. Biol. 2025, 31, e70209. [Google Scholar] [CrossRef]
  8. Sugden, A.M.; Funk, M. Degradation exceeds deforestation. Science 2020, 369, 1335–1336. [Google Scholar] [CrossRef]
  9. Yeni, F.; Alpas, H. Vulnerability of global food production to extreme climatic events. Food Res. Int. 2017, 96, 27–39. [Google Scholar] [CrossRef]
  10. Gaupp, F.; Hall, J.; Hochrainer-Stigler, S.; Dadson, S. Changing risks of simultaneous global breadbasket failure. Nat. Clim. Chang. 2019, 10, 54–57. [Google Scholar] [CrossRef]
  11. Kärvemo, S.; Björkman, C.; Johansson, T.; Weslien, J.; Hjältén, J.; Lewis, O. Forest restoration as a double-edged sword: The conflict between biodiversity conservation and pest control. J. Appl. Ecol. 2017, 54, 1658–1668. [Google Scholar] [CrossRef]
  12. Sekulic, G.; Rempel, C.B. Evaluating the Role of Seed Treatments in Canola/Oilseed Rape Production: Integrated Pest Management, Pollinator Health, and Biodiversity. Plants 2016, 5, 32. [Google Scholar] [CrossRef] [PubMed]
  13. Rahman, S.; Anik, A.R. Productivity and efficiency impact of climate change and agroecology on Bangladesh agriculture. Land Use Policy 2020, 94, 104507. [Google Scholar] [CrossRef]
  14. Geijzendorffer, I.R.; Cohen-Shacham, E.; Cord, A.F.; Cramer, W.; Guerra, C.; Martín-López, B. Ecosystem services in global sustainability policies. Environ. Sci. Policy 2017, 74, 40–48. [Google Scholar] [CrossRef]
  15. Yuan, M.-H.; Lo, S.-L. Ecosystem services and sustainable development: Perspectives from the food-energy-water Nexus. Ecosyst. Serv. 2020, 46, 101217. [Google Scholar] [CrossRef]
  16. Lv, L.; Luo, H.; Zhang, B. Relationship between electricity consumption and economic growth of Guangdong Province in China. Front. Energy 2012, 6, 351–355. [Google Scholar]
  17. Xiao, Y.; Zhao, J.; Zhang, Y.; Wang, S. Grain Self-Sufficiency in Guangdong, China: Current Trends and Future Perspectives. Foods 2025, 14, 1126. [Google Scholar] [CrossRef]
  18. Wen, B.; Liu, F. The evolution and configuration mechanism of spatial correlation network in China’s innovation ecosystem. Environ. Technol. Innov. 2025, 38, 104157. [Google Scholar] [CrossRef]
  19. Zhao, Y.; Zhang, X.; Wu, Q.; Huang, J.; Ling, F.; Wang, L. Characteristics of spatial and temporal changes in ecosystem service value and threshold effect in Henan along the Yellow River, China. Ecol. Indic. 2024, 166, 112531. [Google Scholar] [CrossRef]
  20. Vargas, L.; Willemen, L.; Hein, L. Assessing the Capacity of Ecosystems to Supply Ecosystem Services Using Remote Sensing and An Ecosystem Accounting Approach. Environ. Manag. 2018, 63, 1–15. [Google Scholar] [CrossRef]
  21. Wang, F.; Wu, Y.; Zhang, Y.; Wang, J.; Xue, Z.; Tan, X.; Jia, W. Research on ecosystem service value and landscape ecological risk prediction and zoning: Taking Fujian province as an example. Ecol. Model. 2025, 507, 111173. [Google Scholar] [CrossRef]
  22. Costanza, R.; d’Arge, R.; de Groot, R.; Farber, S.; Grasso, M.; Hannon, B.; Limburg, K.; Naeem, S.; O’Neill, R.V.; Paruelo, J.; et al. The value of the world’s ecosystem services and natural capital. Nature 1997, 387, 253–260. [Google Scholar] [CrossRef]
  23. Li, Q.; Yang, L.; Jiao, H.; He, Q. Spatiotemporal Analysis of the Impacts of Land Use Change on Ecosystem Service Value: A Case from Guiyang, China. Land 2024, 13, 211. [Google Scholar] [CrossRef]
  24. Liu, Y.; Hou, X.; Li, X.; Song, B.; Wang, C. Assessing and predicting changes in ecosystem service values based on land use/cover change in the Bohai Rim coastal zone. Ecol. Indic. 2019, 111, 106004. [Google Scholar] [CrossRef]
  25. Ai, M.; Chen, X.; Yu, Q. Spatial correlation analysis between human disturbance intensity (HDI) and ecosystem services value (ESV) in the Chengdu-Chongqing urban agglomeration. Ecol. Indic. 2024, 158, 111555. [Google Scholar] [CrossRef]
  26. Huang, C.; Zhao, D.; Deng, L. Landscape pattern simulation for ecosystem service value regulation of Three Gorges Reservoir Area, China. Environ. Impact Assess. Rev. 2022, 95, 106798. [Google Scholar] [CrossRef]
  27. Ding, T.; Chen, J.; Fang, Z.; Wang, Y. Exploring the differences of ecosystem service values in different functional areas of metropolitan areas. Sustain. Prod. Consum. 2023, 38, 341–355. [Google Scholar] [CrossRef]
  28. Jiang, T.; Qu, Y.; Zhang, X.; Jing, L.; Feng, K.; Zhang, G.; Han, Y. Evaluating Ecological Drought Vulnerability from Ecosystem Service Value Perspectives in North China. Remote. Sens. 2024, 16, 3733. [Google Scholar] [CrossRef]
  29. Ling, H.; Yan, J.; Xu, H.; Guo, B.; Zhang, Q. Estimates of shifts in ecosystem service values due to changes in key factors in the Manas River basin, northwest China. Sci. Total. Environ. 2018, 659, 177–187. [Google Scholar] [CrossRef]
  30. Sannigrahi, S.; Chakraborti, S.; Joshi, P.K.; Keesstra, S.; Sen, S.; Paul, S.K.; Kreuter, U.P.; Sutton, P.C.; Jha, S.; Dang, K.B. Ecosystem service value assessment of a natural reserve region for strengthening protection and conservation. J. Environ. Manag. 2019, 244, 208–227. [Google Scholar] [CrossRef]
  31. Wang, Y.; Zhang, Z.; Chen, X. Spatiotemporal change in ecosystem service value in response to land use change in Guizhou Province, southwest China. Ecol. Indic. 2022, 144, 109514. [Google Scholar] [CrossRef]
  32. Han, X.; Yu, J.; Shi, L.; Zhao, X.; Wang, J. Spatiotemporal evolution of ecosystem service values in an area dominated by vegetation restoration: Quantification and mechanisms. Ecol. Indic. 2021, 131, 108191. [Google Scholar] [CrossRef]
  33. Yang, Y.; Qin, T.; Yan, D.; Liu, S.; Feng, J.; Wang, Q.; Liu, H.; Gao, H. Analysis of the evolution of ecosystem service value and its driving factors in the Yellow River Source Area, China. Ecol. Indic. 2023, 158, 111344. [Google Scholar] [CrossRef]
  34. Haque, N.; Mahi, M.M.; Sharif, S.; Rudra, R.R.; Sharifi, A. Changes in the economic value of ecosystem services in rapidly growing urban areas: The case of Dhaka, Bangladesh. Environ. Sci. Pollut. Res. 2023, 30, 52321–52339. [Google Scholar] [CrossRef]
  35. Du, H.; Zhao, L.; Zhang, P.; Li, J.; Yu, S. Ecological compensation in the Beijing-Tianjin-Hebei region based on ecosystem services flow. J. Environ. Manag. 2023, 331, 117230. [Google Scholar] [CrossRef]
  36. Liu, J.; Pei, X.; Zhu, W.; Jiao, J. Understanding the intricate tradeoffs among ecosystem services in the Beijing-Tianjin-Hebei urban agglomeration across spatiotemporal features. Sci. Total. Environ. 2023, 898, 165453. [Google Scholar] [CrossRef]
  37. Zhai, Y.; Zhai, G.; Yu, Z.; Lu, Z.; Chen, Y.; Liu, J. Coupling coordination between urbanization and ecosystem services value in the Beijing-Tianjin-Hebei urban agglomeration. Sustain. Cities Soc. 2024, 113, 105715. [Google Scholar] [CrossRef]
  38. Arunrat, N.; Sereenonchai, S. Assessing Ecosystem Services of Rice–Fish Co-Culture and Rice Monoculture in Thailand. Agronomy 2022, 12, 1241. [Google Scholar] [CrossRef]
  39. Bommarco, R.; Vico, G.; Hallin, S. Exploiting ecosystem services in agriculture for increased food security. Glob. Food Secur. 2018, 17, 57–63. [Google Scholar] [CrossRef]
  40. Cruz-Garcia, G.S.; Sachet, E.; Vanegas, M.; Piispanen, K. Are the major imperatives of food security missing in ecosystem services research? Ecosyst. Serv. 2016, 19, 19–31. [Google Scholar] [CrossRef]
  41. Pan, Y.; Bai, J.; Turner, S. History in Points, Lines and Polygons: Time Depth in the Landscape of Guangdong Province, Southern China. Land 2023, 12, 1979. [Google Scholar] [CrossRef]
  42. Ye, Y.-Q.; Qin, Z.; Zhang, J.-E.; Xiao, H.-S. Time-series analysis of grain production characteristics in Guangdong Province from 1949 to 2006. Chin. J. Eco-Agric. 2010, 17, 765–769. [Google Scholar] [CrossRef]
  43. Liu, Y.; Ma, C.; Ma, L.; Li, N. Ecological effects of land use and land cover change in the typical ecological functional zones of Egypt. Ecol. Indic. 2024, 168, 112747. [Google Scholar] [CrossRef]
  44. Aslam, R.W.; Shu, H.; Tariq, A.; Naz, I.; Ahmad, M.N.; Quddoos, A.; Javid, K.; Mustafa, F.; Aeman, H. Monitoring Landuse Change in Uchhali and Khabeki Wetland Lakes, Pakistan using Remote Sensing Data. Gondwana Res. 2024, 129, 252–267. [Google Scholar] [CrossRef]
  45. De Rosa, M.; Odgaard, M.V.; Staunstrup, J.K.; Knudsen, M.T.; Hermansen, J.E. Identifying Land Use and Land-Use Changes (LULUC): A Global LULUC Matrix. Environ. Sci. Technol. 2017, 51, 7954–7962. [Google Scholar] [CrossRef]
  46. Xie, G.D.; Zhang, C.X.; Zhang, L.M.; Chen, W.H.; Li, S.M. Improvement of the valuation method for ecosystem services based on the value equivalent factor per unit area. J. Nat. Resour. 2015, 30, 1243–1254. (In Chinese) [Google Scholar]
  47. Koç, G.; Uzmay, A. Construction of a Farm-Level Food Security Index: Case Study of Turkish Dairy Farms. Soc. Indic. Res. 2024, 175, 687–714. [Google Scholar] [CrossRef]
  48. McKune, S.L.; Borresen, E.C.; Young, A.G.; Ryley, T.D.A.; Russo, S.L.; Camara, A.D.; Coleman, M.; Ryan, E.P. Climate change through a gendered lens: Examining livestock holder food security. Glob. Food Secur. 2015, 6, 1–8. [Google Scholar] [CrossRef]
  49. Wang, J.F.; Hu, Y. Environmental health risk detection with Geog Detector. Environ. Model. Softw. 2012, 20, 114–115. [Google Scholar] [CrossRef]
  50. Shortridge, A. Practical limits of Moran’s autocorrelation index for raster class maps. Comput. Environ. Urban Syst. 2007, 31, 362–371. [Google Scholar] [CrossRef]
  51. Zhang, D.; Zhang, Y. Moran’s I of VRPAD: A human activity-sensitive spatial pattern index for vegetation restoration evaluation. J. Environ. Manag. 2025, 387, 125948. [Google Scholar] [CrossRef]
  52. Chinese Academy of Sciences Resource and Environment Science & Data Cloud Platform. China Land Use Dataset (2005, 2013, 2023). Available online: http://www.resdc.cn (accessed on 6 January 2022).
  53. Compilation Committee of National Agricultural Product Cost and Benefit Data. National Compilation of Agricultural Product Cost and Benefit Data [Monograph]; China Statistics Press: Beijing, China, 2024.
  54. Guangdong Provincial Bureau of Statistics & Relevant Department(s) (Ed.) Guangdong Rural Statistical Yearbook; Guangdong Provincial Bureau of Statistics & Relevant Department(s): Guangzhou, China, 2023.
  55. Hu, W.; Cheng, J.; Zheng, M.; Jin, X.; Yao, J.; Guo, F. A Multi-Scenario Simulation and Driving Factor Analysis of Production–Living–Ecological Land in China’s Main Grain Producing Areas: A Case Study of the Huaihe River Eco-Economic Belt. Agriculture 2025, 15, 349. [Google Scholar] [CrossRef]
  56. Yu, L.; Li, Y.; Luo, G.; Ge, G.; Zhang, H.; Tang, F.; Yu, M. Spatiotemporal evolution and driving mechanism of slope cultivated land in karst mountainous areas of Southwest China—A case study of Puding County, Guizhou Province. Land Degrad. Dev. 2024, 35, 568–585. [Google Scholar] [CrossRef]
  57. Dai, Z.Z.; Chang, S.; Zhao, G.R.; Duan, J.J.; Liang, H.Y.; Zhu, Z.Y.; Liu, S.L.; Feng, Y.Z.; Wang, X. Unlocking China’s grain yield potential: Harnessing technological and spatial synergies in diverse cropping systems. Agric. Syst. 2025, 226, 104308. [Google Scholar]
  58. Wang, X.; Meng, Q.; Zhang, L.; Hu, D. Evaluation of urban green space in terms of thermal environmental benefits using geographical detector analysis. Int. J. Appl. Earth Obs. Geoinf. 2021, 105, 102610. [Google Scholar] [CrossRef]
  59. Wang, Z.; Wang, H.; Liu, Z.; Feng, R.; Pan, Y. Evolution of Ecosystem Service Values and the Response to Landscape Pattern Change in the Huaihe River Eco-Economic Belt. Land 2023, 12, 1405. [Google Scholar] [CrossRef]
  60. Lang, Y.; Chao, H.; Xiao, J. The Relationship Between Carbon Emissions and Ecosystem Services in Guangdong Province, China: The Perspective of Ecological Function Zones. Land 2024, 13, 2227. [Google Scholar] [CrossRef]
Figure 1. Location of Guangdong Province.
Agriculture 15 01467 g001
Figure 2. Land use types in Guangdong Province from 2005 to 2023.
Agriculture 15 01467 g002
Figure 3. ESV of various cities in Guangdong from 2005 to 2023.
Agriculture 15 01467 g003
Figure 4. Interactive factor detection results.
Agriculture 15 01467 g004
Figure 5. Ecological risk factor detection results.
Agriculture 15 01467 g005
Figure 6. Agglomeration of local indicators of bivariate spatial connection from 2005 to 2023.
Agriculture 15 01467 g006
Table 1. ESV coefficients.
TypeCultivated LandForest LandGrasslandWater AreaConstruction LandUndeveloped Land
ESV coefficients8692.1940,317.926,141.6192,51802319.36
Table 2. Land use conversion in Guangdong Province from 2005 to 2023.
YearTypeCultivated LandForest LandGrasslandWater AreaConstruction LandUndeveloped Land
2005Area/km242,833.97108,358.577778.738017.5710,567.84107.93
Proportion/%24.11%60.99%4.38%4.51%5.95%0.06%
2013Area/km241,648.78107,788.957724.777836.6912,558.49106.93
Proportion/%23.44%60.67%4.35%4.41%7.07%0.06%
2023Area/km240,941.26107,372.247722.777690.7913,885.59105.93
Proportion/%23.04%60.42%4.35%4.33%7.81%0.06%
Table 3. Land use conversion in Guangdong Province from 2013 to 2023.
CityYear20052023
TypeCultivated LandForest LandGrasslandWater AreaConstruction LandUndeveloped LandCultivated LandForest LandGrasslandWater AreaConstruction LandUndeveloped Land
ChaozhouArea/km2922.031459.17242.8177.25241.955910.981452.18239.8176.25263.995
Proportion/%30.25%47.87%7.97%5.81%7.94%0.16%29.89%47.64%7.87%5.78%8.66%0.16%
DongguanArea/km2377.46577.8285.77249.961154.20263.62536.6285.39232.421327.170
Proportion/%15.44%23.63%3.51%10.22%47.20%0.00%10.78%21.95%3.49%9.51%54.28%0.00%
FoshanArea/km21386.57857.2421.81517.881011.4211186.04810.2924.2493.161281.231
Proportion/%36.53%22.58%0.57%13.64%26.64%0.03%31.25%21.35%0.64%12.99%33.75%0.03%
GuangzhouArea/km22218.973022119.5555.681264.4531936.662953.4122.47536.021638.513
Proportion/%30.89%42.07%1.66%7.74%17.60%0.04%26.94%41.08%1.70%7.45%22.79%0.04%
HeyuanArea/km22225.7512,236.52589.84451.43142.8802141.4612182.07580.85451.54290.50
Proportion/%14.23%78.21%3.77%2.89%0.91%0.00%13.69%77.86%3.71%2.89%1.86%0.00%
HuizhouArea/km22910.157197.15244.89384.7517.3242696.547090.32233.9361.66876.054
Proportion/%25.85%63.93%2.18%3.42%4.60%0.04%23.94%62.96%2.08%3.21%7.78%0.04%
JiangmenArea/km22778.624741.05278.07910.11560.7222691.284653.35279.48890.04759.582
Proportion/%29.97%51.14%3.00%9.82%6.05%0.02%29.01%50.17%3.01%9.60%8.19%0.02%
JieyangArea/km21769.192337.09561.26190.61364.452.781743.22319.16556.2187.61416.422.78
Proportion/%33.86%44.73%10.74%3.65%6.97%0.05%33.36%44.38%10.64%3.59%7.97%0.05%
MaomingArea/km22689.97263.8364.31311.75669.565.982642.687204.12366.31305.04783.983.16
Proportion/%23.79%64.25%3.22%2.76%5.92%0.05%23.38%63.72%3.24%2.70%6.93%0.03%
MeizhouArea/km22718.0811,974.33805.88173.52167.9312667.8211,927.47796.04175.4273.990
Proportion/%17.16%75.59%5.09%1.10%1.06%0.01%16.84%75.30%5.03%1.11%1.73%0.00%
QingyuanArea/km24097.1912,923.861262.32387.12339.6213998.7912,842.961259.35385.12523.891
Proportion/%21.55%67.98%6.64%2.04%1.79%0.01%21.03%67.56%6.62%2.03%2.76%0.01%
ShantouArea/km2743.74491.15161.99319.92362.920.09698.83483.76155.05319.08443.550.09
Proportion/%35.76%23.62%7.79%15.38%17.45%0.00%33.27%23.03%7.38%15.19%21.12%0.00%
ShanweiArea/km21285.541995.19968.47299.86128.5731.271255.111975.33953.68293.81201.6830.27
Proportion/%27.30%42.37%20.57%6.37%2.73%0.66%26.65%41.94%20.25%6.24%4.28%0.64%
ShaoguanArea/km23311.113,411.021115.67226.07274.4633246.1613,349.411117.66224.07401.013
Proportion/%18.05%73.12%6.08%1.23%1.50%0.02%17.70%72.78%6.09%1.22%2.19%0.02%
ShenzhenArea/km2173.34749.2529.283.92864.210111.9705.5236.5858.92987.790
Proportion/%9.12%39.44%1.54%4.42%45.49%0.00%5.89%37.12%1.92%3.10%51.97%0.00%
YangjiangArea/km22358.084563.35249.32299.38282.927.662267.554526.37247.32287.75424.987.66
Proportion/%30.38%58.80%3.21%3.86%3.65%0.10%29.21%58.32%3.19%3.71%5.48%0.10%
YunfuArea/km21763.885401.34275.1184.58244.2101681.15341.07273.1283.58390.260
Proportion/%22.70%69.52%3.54%1.09%3.14%0.00%21.64%68.75%3.52%1.08%5.02%0.00%
ZhanjiangArea/km25691.674669.6596.12797.14890.2235.825618.094610.9896.88787.731033.238.82
Proportion/%46.73%38.34%0.79%6.54%7.31%0.29%46.10%37.84%0.80%6.46%8.48%0.32%
ZhaoqingArea/km22425.911,124.78255.66700.22376.3602336.6611,076.14251660.99558.130
Proportion/%16.30%74.75%1.72%4.70%2.53%0.00%15.70%74.42%1.69%4.44%3.75%0.00%
ZhongshanArea/km2580.35366.652335.39441.50497.28351.724314.03558.840
Proportion/%33.63%21.24%0.12%19.43%25.58%0.00%28.81%20.38%0.23%18.20%32.38%0.00%
ZhuhaiArea/km2324.73452.5510.38417.92244.590275.79437.747.38338.45405.810
Proportion/%22.39%31.21%0.72%28.82%16.87%0.00%18.82%29.88%0.50%23.10%27.70%0.00%
Table 4. ESV changes in different land use types in Guangdong Province from 2005 to 2023 (100 million CNY).
TypeCultivated LandForest LandGrasslandWater AreaConstruction LandUndeveloped LandTotal
2005372.324368.79203.351543.5300.256488.24
2013362.024345.82201.941508.7000.256418.73
2023355.874329.02201.891480.6100.256367.64
Table 5. Changes in ESV of each city in Guangdong Province from 2005 to 2023 (100 million CNY).
City200520132023
Chaozhou107.33 107.08 106.68
Dongguan76.94 72.96 70.90
Foshan146.89 139.48 138.56
Guangzhou251.24 246.01 242.31
Heyuan615.02 613.76 611.88
Huizhou395.94 391.09 385.06
Jiangmen397.79 391.88 389.67
Jieyang160.98 159.79 159.32
Maoming385.80 384.00 381.73
Meizhou560.88 559.91 558.66
Qingyuan664.21 661.01 659.63
Shantou92.09 94.85 91.06
Shanwei174.73 173.99 172.12
Shaoguan642.18 640.32 638.80
Shenzhen48.63 43.03 41.72
Yangjiang268.65 266.24 264.08
Yunfu256.58 254.54 253.18
Zhanjiang393.80 393.16 389.01
Zhaoqing611.10 604.49 600.69
Zhongshan84.45 80.93 79.06
Zhuhai101.80 95.01 85.40
Table 6. Analysis of ecosystem service value sensitivity in Guangdong Province from 2005 to 2023.
TypeCultivated LandForest LandGrasslandWater AreaConstruction LandUndeveloped Land
20050.0573840.6733400.0313410.2378960.0000000.000039
20130.0564000.6770530.0314610.2350470.0000000.000039
20230.0558870.6798470.0317050.2325220.0000000.000039
Table 7. Single-factor detection results.
Independent VariableX1X2X3X4X5X6X7X8X9X10X11
q value0.5420.5060.6630.4060.6620.7920.4480.5390.480.3060.264
p value0.0230.0350.0040.0930.0040.0000.0630.0240.0470.1310.082
Table 8. Global Moran’s index.
YearESV
Moran’s Ip-Valuez-Value
20050.2530.0351.866
20130.2530.0481.817
20230.2540.0291.935
Disclaimer/Publisher’s Note: The statements, opinions and data contained in all publications are solely those of the individual author(s) and contributor(s) and not of MDPI and/or the editor(s). MDPI and/or the editor(s) disclaim responsibility for any injury to people or property resulting from any ideas, methods, instructions or products referred to in the content.

