Article

Harnessing Bacillus subtilis–Moss Synergy: Carbon–Structure Optimization for Erosion-Resistant Barrier Formation in Cold Mollisols

1
School of Water Conservancy and Civil Engineering, Northeast Agricultural University, Harbin 150030, China
2
Heilongjiang Provincial Key Laboratory of Water Resources and Water Conservancy Engineering in Cold Region, Northeast Agricultural University, Harbin 150030, China
3
Joint Laboratory for International Cooperation on Cold Region Black Soil Habitat Health of Ministry of Education, Harbin 150030, China
4
Key Laboratory of Effective Utilization of Agricultural Water Resources of Ministry of Agriculture, Northeast Agricultural University, Harbin 150030, China
5
College of Water Conservancy and Electric Power, Heilongjiang University, Harbin 150030, China
*
Authors to whom correspondence should be addressed.
Tianxiao Li is regarded as first author.
Agriculture 2025, 15(14), 1465; https://doi.org/10.3390/agriculture15141465
Submission received: 22 May 2025 / Revised: 1 July 2025 / Accepted: 5 July 2025 / Published: 8 July 2025
(This article belongs to the Section Agricultural Soils)

Abstract

Soil degradation exerts profound impacts on soil ecological functions, global food security, and human development, making the development of effective technologies to mitigate degradation a critical research focus. Microorganisms play a leading role in rehabilitating degraded land, improving soil hydraulic properties, and enhancing soil structural stability. Mosses contribute to soil particle fixation through their unique rhizoid structures; however, the mechanisms underlying their interactions in mixed inoculation remain unclear. Therefore, this study addresses soil and water loss caused by rainfall erosion in the cold black soil region. We conducted controlled laboratory experiments cultivating Bacillus subtilis and cold-adapted moss species, evaluating the erosion mitigation effects of different biological treatments under gradient slopes (3°, 6°, 9°) and rainfall intensities (70 mm h−1, 120 mm h−1), and elucidating their carbon-based structural reinforcement mechanism. The results indicated that compared to the control group, Treatment C significantly increased the mean weight diameter (MWD) and geometric mean diameter (GMD) of soil aggregates by 121.6% and 76.75%, respectively. In separate simulated rainfall events at 70 mm h−1 and 120 mm h−1, Treatment C reduced soil loss by 95.70% and 96.75% and decreased runoff by 38.31% and 67.21%, respectively. Crucially, the dissolved organic carbon (DOC) loss rate in Treatment C was only 21.98%, significantly lower than that in Treatment A (32.32%), Treatment B (22.22%), and the control group (51.07%)—representing a 59.41% reduction compared to the control. This demonstrates the following: (1) Bacillus subtilis enhances microbial metabolism, driving carbon conversion into stable pools, while mosses reduce carbon leaching via physical barriers, synergistically forming a dual “carbon protection–structural reinforcement” barrier. (2) The combined inoculation optimizes soil structure by increasing the proportion of large soil particles and enhancing aggregate stability, effectively suppressing soil loss even under extreme rainfall erosion. This study elucidates, for the first time, the biological pathway through which microbe–moss interactions achieve synergistic carbon sequestration and erosion resistance by regulating aggregate formation and pore water dynamics. It provides a scalable “carbon–structure”-optimized biotechnology system (co-inoculation of Bacillus subtilis and moss) for the ecological restoration of the cold black soil region.

1. Introduction

Soil and water are fundamental components of the biogeosphere [1]. In recent years, global climate change and anthropogenic activities have accelerated soil erosion, leading to environmental degradation and associated ecological issues [2,3,4]. Rainfall-induced erosion is reported to account for over 33% of global annual soil loss, with China experiencing approximately 5 billion tons of soil erosion per year [5]. Within China, the Northeast Mollisol Region, a vital grain production base, faces severe threats from soil and water erosion. The fertile yet highly erodible mollisol layer is thinning at an alarming rate of 1–3 cm per year [6]. Given the unique value and non-renewable nature of these cold-region mollisol resources, the development of efficient and eco-friendly erosion control technologies is urgently required to safeguard national food security.
As a primary agent driven by exogenic forces, rainfall erosion significantly compromises soil structural stability, negatively impacting key indicators such as aggregate stability, bulk density, water infiltration rate, and microbial activity. This initiates a self-reinforcing cycle where erosion acts as a trigger, progressively destabilizing soil structure and depleting soil nutrients [7,8,9]. The rainfall erosion process comprises splash erosion and wash erosion. During splash erosion, raindrop kinetic energy transmits momentum, continuously disrupting surface soil aggregates. This fragmentation renders soil particles more susceptible to detachment and transport by surface runoff [10,11]. As rainfall duration increases, the loosened surface structure resulting from splash impact becomes vulnerable to powerful runoff. This runoff entrains fine- and medium-sized aggregates, facilitating their transport and inducing significant nutrient loss, thereby exacerbating soil degradation [12,13,14,15]. Consequently, identifying effective measures to mitigate soil and water loss, while ensuring sustainable agricultural productivity, presents a critical scientific challenge for achieving ecological sustainability in cold mollisol regions.
Conventional soil and water conservation measures offer some short-term mitigation against rainfall erosion but are often costly and difficult to maintain and may induce secondary pollution [16]. Consequently, developing low-impact, high-efficiency soil amendment technologies has emerged as a critical research priority. Typical moss communities thrive in persistently moist environments with limited physical disturbance. However, addressing soil and water conservation needs in areas experiencing high-intensity rainfall erosion, recent research has focused on identifying pioneer moss species exhibiting exceptional stress tolerance [17]. The tolerance mechanisms possessed by these pioneer mosses enable their survival during inter-rainfall periods [18]. Concurrently, their low, prostrate growth form and dense rhizoidal networks mitigate runoff detachment forces [19]. Furthermore, their high environmental adaptability facilitates rapid colonization across diverse settings, enabling progressive outward expansion. Research indicates that when moss-dominated biocrust cover reaches or exceeds 40%, it effectively reduces rainfall erosion during high-intensity precipitation events (90–150 mm·h−1) [20]. Functioning as pioneer species in erosion-degraded lands, these mosses establish the initial framework of the biological soil crust. The resulting biocrust layer efficiently dissipates raindrop kinetic energy [21]. Crucially, even under the stress of alternating dry–wet cycles, they rapidly stabilize the surface substrate. They secrete binding agents such as polysaccharides and organic acids, enhancing soil particle aggregation and stimulating microbial activity [22,23]. This process creates essential conditions for the subsequent establishment of vascular plants and the overall ecosystem restoration. However, in erosion-prone environments characterized by frequent high-intensity rainfall and intense runoff, the initial establishment of mosses faces challenges, and the erosion resistance of moss crusts alone may be limited under extreme hydrological conditions. Amidst these limitations and the rise of microbial technology, the interaction between soil microorganisms and soil physicochemical properties has garnered substantial attention in erosion control research [24,25]. Notably, Bacillus subtilis, a functional soil bacterium exhibiting plant growth promotion, stress tolerance, and structural exudate secretion capabilities, has proven effective in improving soil structure and suppressing erosion [26,27]. Its application potential stems from multiple advantages: environmental adaptability and functional diversity, demonstrated cold tolerance under frigid conditions, the capacity to enhance aggregate stability in erodible soils, and compatibility for synergistic interaction with moss rhizoids to promote colonization [28]. Previous research indicates that microbial synergies with non-vascular plants (e.g., lichens, mosses) can facilitate rapid surface restoration, erosion mitigation, and soil structural rehabilitation. Moss cover provides a favorable microhabitat for microbial activity, while microbial bio cementation reinforces the erosion resistance of the soil matrix beneath the moss crust. Simultaneously, organic acids and accumulated organic matter secreted by mosses serve as substrates for microbial metabolism, further promoting aggregate formation and stability [29]. This biologically driven accumulation of soil organic carbon and its enhancement of soil aggregate structure and stability is termed the ‘Carbon-based Structural Enhancement Effect’ (CSEE). This effect is recognized as a core mechanism by which biological synergies enhance soil erosion resistance. Here, we define “biological synergy” as the phenomenon of enhanced ecological complementarity observed when Bacillus subtilis and moss are co-inoculated. Nevertheless, a theoretical gap exists regarding the erosion control efficacy of microbe–plant synergies under the unique climatic and edaphic conditions of frigid mollisol regions. Therefore, we hypothesize the following: (1) Bacillus subtilis–moss synergy, driven by niche complementarity, optimizes particle size distribution to achieve a water conductivity-retention equilibrium. (2) The synergistic effect couples carbon dynamics with structural–hydraulic improvements, conferring sustainable resilience to erosion resistance.
Building upon this foundation, this study addresses rainfall erosion in frigid mollisols by leveraging the functional traits of mosses and Bacillus subtilis. We innovatively designed three treatments: moss inoculation alone, B. subtilis inoculation alone, and their co-inoculation. By monitoring dynamic changes in key physicochemical indicators—including soil aggregate stability, water-holding capacity, and organic carbon content—we systematically elucidate the mechanisms by which mosses and B. subtilis suppress rainfall erosion and identify the optimal application strategy. This research is crucial for developing nature-based, low-cost, and sustainable erosion control solutions for Northeast China’s mollisol region and similar ecologically vulnerable zones. The findings offer a scientific basis and technical guidance for regional and national soil conservation plans and ecological restoration projects.

2. Materials and Methods

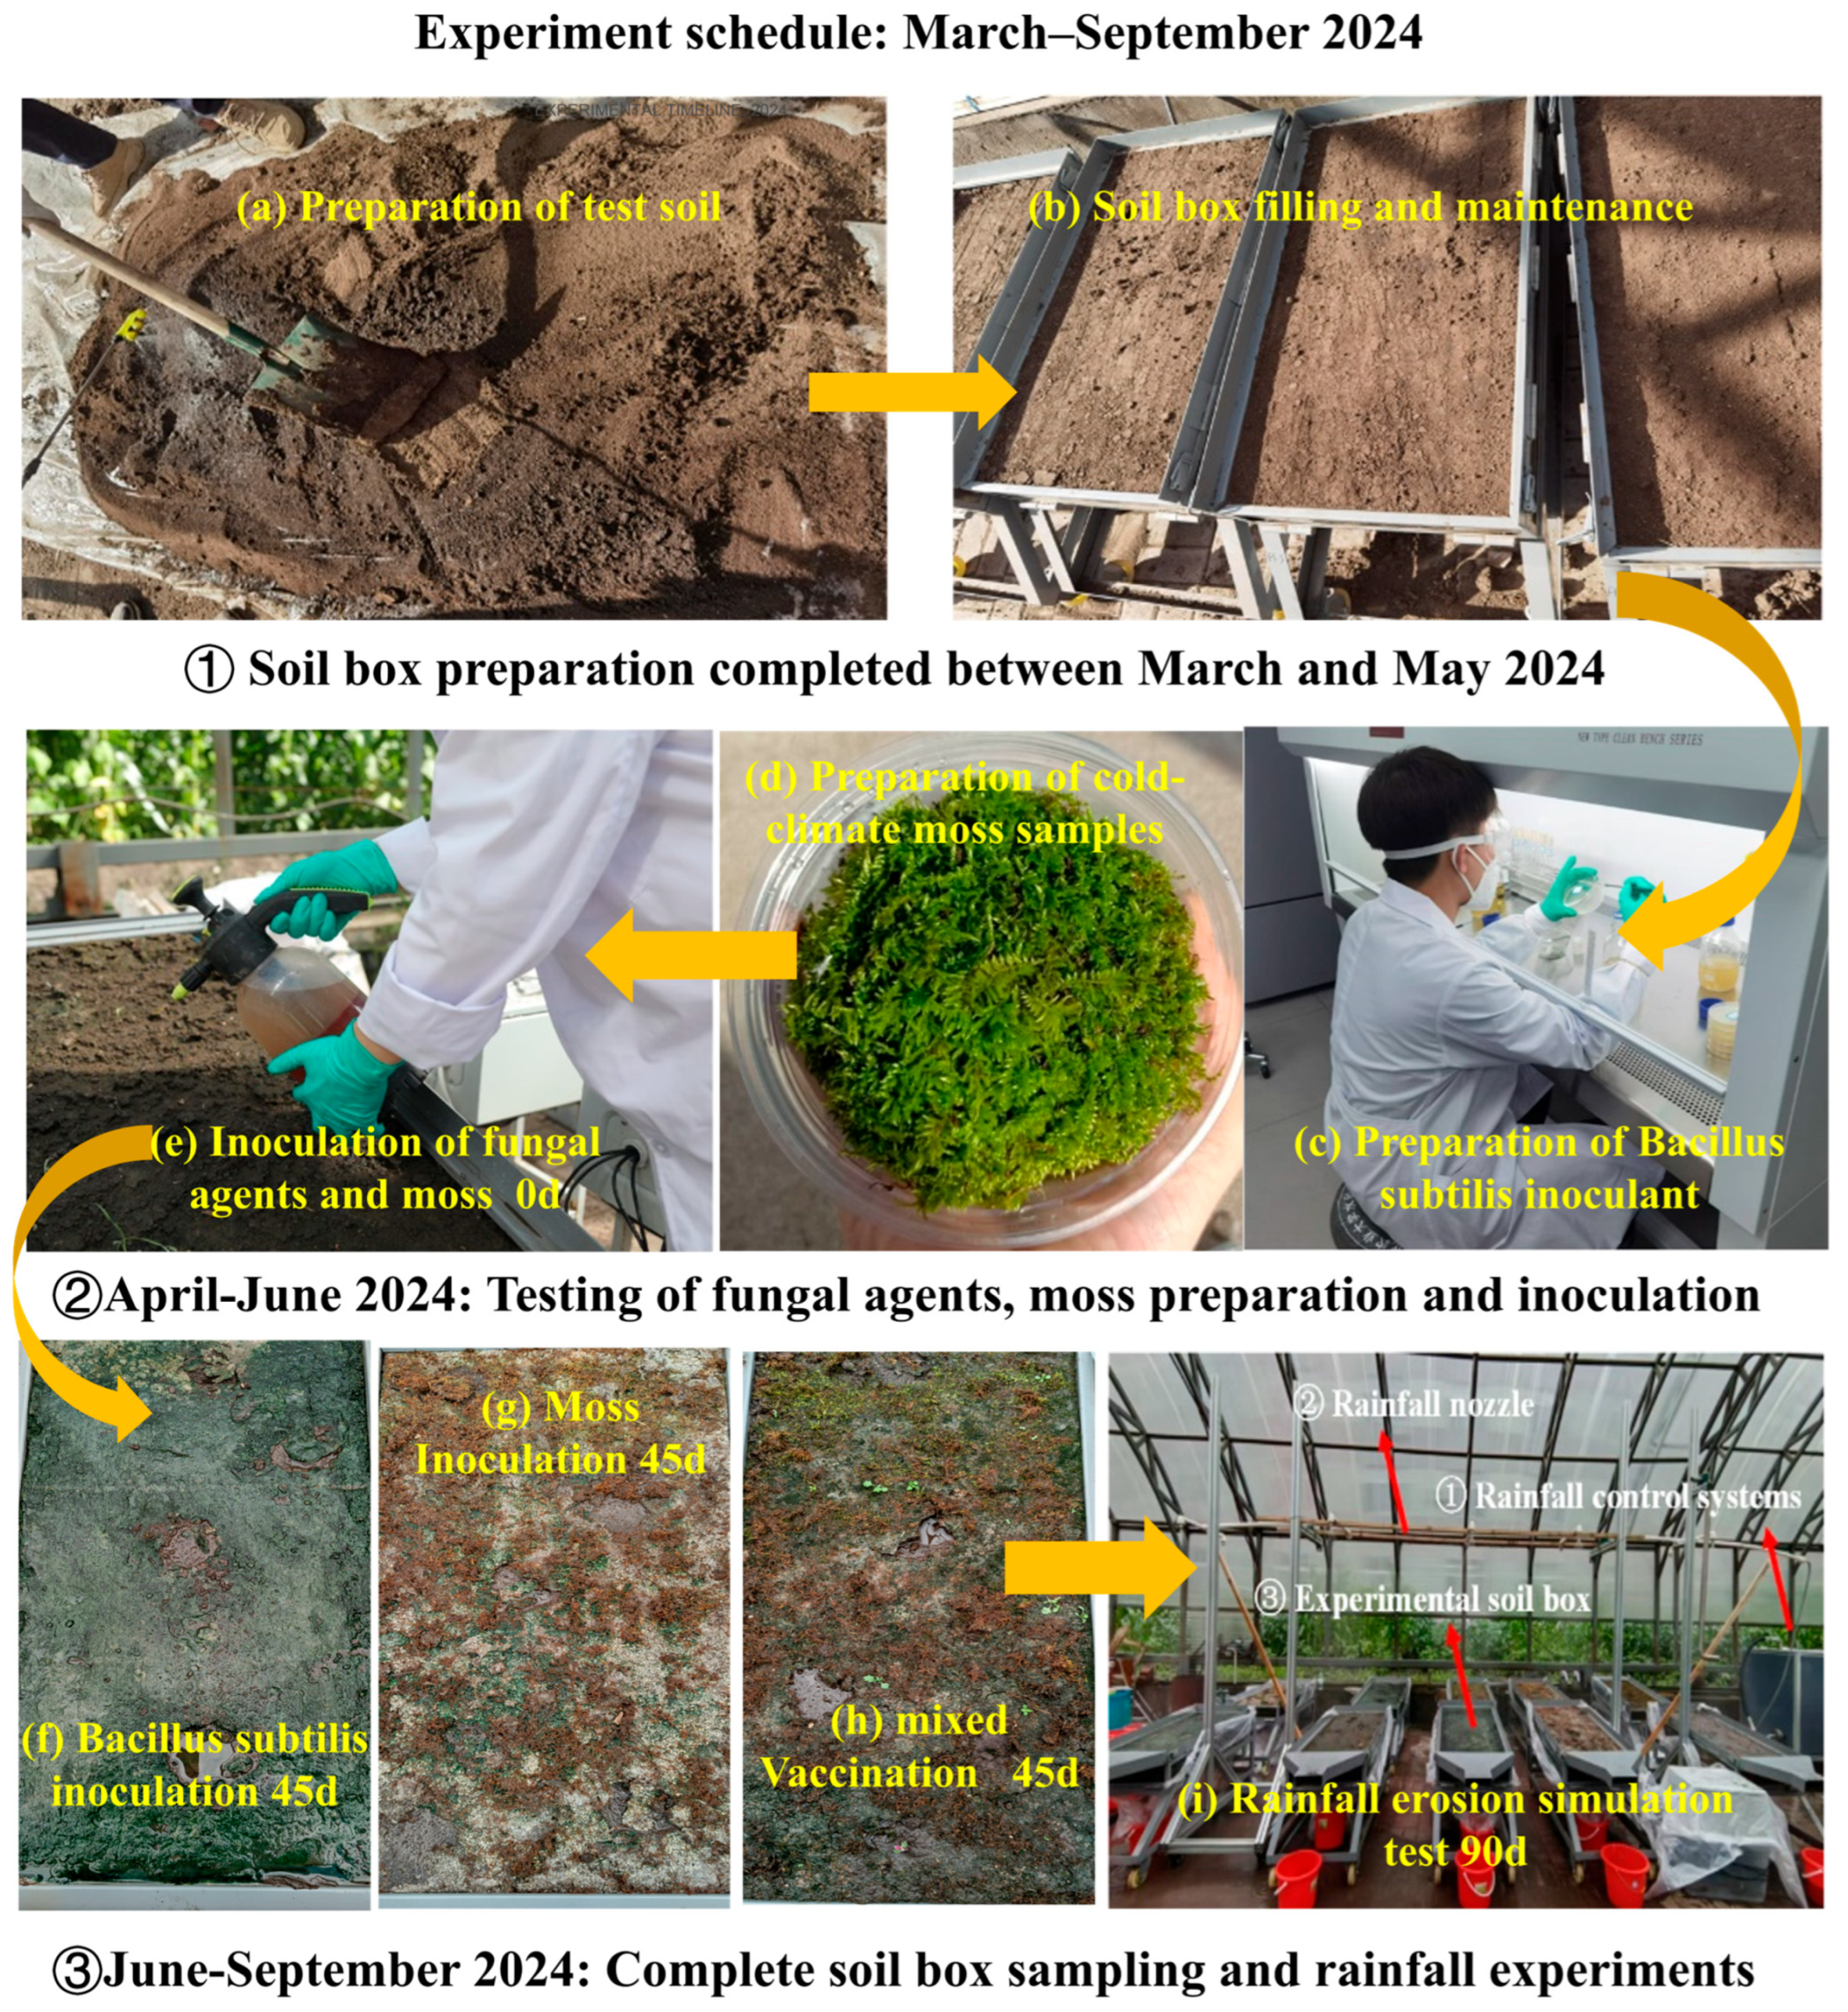
2.1. Preparation of Test Materials

2.1.1. Soil Sample Collection

Experimental soil collection and preparation: Soil samples were collected from the Songnen Plain (45° N, 126° E) within China’s mollisol region. In March 2024, fresh soil samples were acquired from the cultivated layer (0–20 cm depth) of the selected area using a multi-point random composite sampling method. To control spatial heterogeneity, a total of 30 independent sampling points were established, with each point spaced more than 5 m apart. At each sampling point, intact soil cores spanning the complete 0–20 cm depth were extracted using a stainless-steel soil auger. After the removal of surface litter, soil samples from the same depth interval were homogenized. Collected soil samples were immediately placed into sterile sealed bags and transported to the laboratory in a refrigerated container at 4 °C. Within the laboratory, soil samples were air-dried naturally at room temperature in a dark, ventilated location. After air-drying, visible plant roots, stones, and other debris were carefully removed. Subsequently, the soil was sieved through a 2 mm mesh and thoroughly mixed to ensure homogeneity. The processed soil was stored in clean, sealed containers placed in a cool, dry location for later use as the test soil in subsequent flume simulation experiments. Soil bulk density, particle size distribution, and soil organic matter were determined using the cutting ring method, laser diffraction analysis, and the potassium dichromate oxidation (external heating) method, respectively. The prepared homogeneous soil was stored in clean, sealed polyethylene containers placed in a cool, dry, dark environment for later use. The storage period did not exceed one month.

2.1.2. Preparation of Bacillus subtilis Inoculant

The Bacillus subtilis strain used in the experiment was isolated, purified, and cultivated in-house from soil samples collected in April 2024 from the Songnen Plain in the cold black soil region of China. It was identified via standard Gram staining and observed to form spores. Combined with its colony morphological characteristics (grayish-white, wrinkled, opaque) and physiological–biochemical properties (positive Voges–Proskauer test), it was confirmed as Bacillus subtilis for subsequent experiments. This strain was selected based on its excellent adaptability to cold conditions, its ability to secrete extracellular polymeric substances (EPSs) and other aggregate-stabilizing compounds, and its proven effectiveness in enhancing soil erosion resistance. To prepare a highly viable and environmentally resilient inoculant, a spore suspension form was adopted. Spores exhibit superior stress tolerance, facilitating colonization and functionality in field environments. Primary culture was initiated in Luria–Bertani (LB) medium; subsequently, this culture was inoculated into 3% Trypticase Soy Broth (TSB) medium for secondary growth. Following cultivation, the broth was centrifuged to collect the spore pellet, which was then purified using the Sacks and Alderton two-phase extraction system. The optical density (OD) of the culture was monitored spectrophotometrically. The broth underwent repeated cycles of high-speed centrifugation in a refrigerated centrifuge with supernatant removal. The final spore pellet was resuspended in sterile physiological saline to adjust the bacterial concentration to 5 × 10⁸ colony-forming units per milliliter (CFU·mL−1), yielding the prepared Bacillus subtilis inoculant (Figure 1c). This concentration represents the optimal viability endpoint during cultivation, signifying the optimal balance for achieving both high spore yield and stable cell density [26].

2.1.3. Moss Source Preparation and Application Methods

The moss species used in the experiment was the wild peat moss Sphagnum palustre (Sphagnaceae), identified according to the GBIF classification system. This species is common in cold chernozem regions and is characterized by dense tufting growth and the formation of thick, cushion-like mats. Its extensive rhizoid network and high water retention capacity have been demonstrated to effectively reduce raindrop splash erosion and runoff scouring, making it a preferred species for soil and water conservation. Samples were collected from the Changbai Mountains in Jilin Province in February 2024. Under natural field conditions, well-developed moss crusts were selected, and the top layer of crust with a thickness of 10 mm was collected using a shovel. After transport to the laboratory, the collected moss material was gently rinsed with running tap water to remove the majority of adhering soil, debris, and impurities. It was then soaked in a 70% ethanol solution for 30 s, followed by thorough rinsing three times with deionized water. The cleaned moss was placed on sterile filter paper to absorb surface moisture. Sterile scissors were used to cut the moss plants into small fragments approximately 1–2 cm in length. The prepared moss crust inoculum was evenly spread on the surface of the prepared soil blocks at an inoculation density of 700 g·m−2 [30]. Cultivation occurred under controlled conditions in an artificial climate chamber with a diurnal temperature variation of ±20 °C, an air humidity of 50%, a 12 -h photoperiod, light intensity of 1000 lux, and surface soil moisture content of 20%. During the cultivation period, soil moisture content changes were monitored in real-time via sensors, and water was replenished periodically to maintain a suitable growth environment (Figure 1d).

2.2. Experimental Design

This study employed a two-factor completely randomized design to evaluate the effectiveness of Bacillus subtilis and Sphagnum palustre moss, applied individually and in combination, in controlling rainfall erosion in cryogenic black soil. As shown in Figure 1a,b. Four treatments and three slope gradients were tested under two rainfall intensities (Table 1). Each treatment combination had three replicates, for a total of 36 soil boxes. The experimental design is presented in Table 1.
The experimental setup utilized self-designed soil flumes (1 m × 0.5 m × 0.2 m), with an effective erosion area of 0.5 m2. The flumes allowed free slope adjustment, featured ventilation holes at the bottom, and had a sediment collection device at the front (Figure 1b). Soil samples retrieved from the experimental area were air-dried, crushed, and sieved through a 2-mm mesh. A 2-cm thick layer of fine sand was laid at the bottom of each flume to ensure permeability. Soil was packed in 5-cm layers, ensuring close contact between each layer and the one below to prevent stratification. Water was applied slowly layer by layer using a watering can until each soil layer reached 20% gravimetric water content. The target soil bulk density was 1.2 g·cm−3. To ensure uniform soil density and minimize edge effects, the edges of the flumes were tamped (Figure 1a). After filling, the flumes were covered with plastic wrap, and the dynamic changes in soil moisture content within each layer were monitored in real-time using sensors. Based on the slope range of the Songnen Plain, the experimental slopes were set at 3°, 6°, and 9°.
The treatment groups were divided based on the inoculation method: single inoculation treatments (Group A: Bacillus subtilis only; Group B: moss only), combined inoculation treatment (Group C: Bacillus subtilis and moss simultaneously), and a control group (Group CK: sprayed with an equal mass of sterile water) (Figure 1f–h). For all treatments, Bacillus subtilis was applied by surface spraying at 3 L·m−2 of bacterial suspension, and moss was surface-spread at 0.6 kg·m−2 (fresh weight). The combined inoculation group followed the sequence of first inoculating Bacillus subtilis followed by moss (Figure 1e). A preliminary experiment verified inoculation feasibility by measuring soil surface colony-forming units (CFUs) and moss survival rate. Each treatment had three replicates. Soil sampling was conducted at 0 days (initial state), 5 days, 10 days, 15 days, 20 days (rapid development stage), 30 days, 45 days, and 90 days (mature stage) post-inoculation to measure changes in soil nutrients. This non-destructive sampling aimed to preserve the biological crust and avoid disturbing the soil surface. These time points were selected to determine the dynamic changes in soil nutrients during the colonization of Bacillus subtilis, moss growth stages, and their synergistic interactions. After completion of all erosion experiments (48 h after the 90-day rainfall), destructive soil samples were collected from the 0–10 cm layer in the experimental flumes for determining the soil water characteristic curve and particle size distribution. This sampling was independent of the erosion process.
To allow sufficient colonization of the soil surface by viable bacteria and moss from the inoculants and the establishment of stable communities, two simulated rainfall experiments were conducted after the biological crusts reached maturity (Figure 1i): a conventional heavy rain test (45 days) at 70 mm·h−1 intensity, and an extreme heavy rain test (90 days) at 120 mm·h−1 intensity. Due to the natural recovery period of biological crusts after heavy rainfall, the same sample could not withstand two consecutive high-intensity rainfall tests. Therefore, this study employed an independent sample design; the two rainfall tests represented the response of different biological crusts to different types of rainfall erosion scenarios, rather than a time-series comparison. The rainfall intensity of 70 mm·h−1 was selected as it represents the most common erosive rainfall intensity in the study area, while 120 mm·h−1 represents an extreme rainfall intensity emerging in the region under the influence of global climate change [20]. These thresholds (70 mm·h−1 and 120 mm·h−1) for erosive and extreme rainfall intensities were established based on statistical analysis of effective rainfall events from the study area’s meteorological station. Pre-rainfall treatment was performed one day before each rainfall experiment to bring the test rainfall to a uniform state, ensuring the experiment proceeded. Concurrently, all treatment flumes were continuously colonized under identical environmental conditions without artificial drying. This preserved the natural soil hydraulic properties formed during the colonization of Bacillus subtilis and moss, accurately reflecting the actual erosion control effectiveness of the biological treatments under rainfall.
The artificial rainfall simulator was provided by Spraying Systems Co (USA) (Figure 1i). The rainfall system consisted of five nozzles and a rainfall control system. The control system regulated the required rainfall intensity based on preset values by adjusting the nozzle diameter to control raindrop size and rainfall uniformity. Based on rainfall characteristics of the Songnen Plain, the rainfall height was set at 2.5 m, rainfall uniformity exceeded 85%, raindrop diameter distribution was 1.2–1.5 mm, terminal velocity was 4–6 m·s−1, and spray angle was 80° ± 5°. Before each test, preliminary runs were conducted using a standard rain gauge grid (50 cm spacing) to measure spatial distribution and intensity, ensuring the achievement of preset values (error < ±5%). The rainfall duration was 30 min.

2.3. Measurement Indicators and Methods

2.3.1. Soil Particle Size Analysis

A laser particle size analyzer was used for soil particle size analysis. The soil was sieved and air-dried, and then about 0.3 g of a soil sample was put into a 50 mL test tube, 10 mL of hydrogen peroxide (H2O2) with a concentration of 10% was added and heated in water to be allowed to fully react in order to effectively remove the organic matter in the sample, and 10 mL of hydrogen chloride (HCl) with a concentration of 10% was added and boiled to be allowed to fully react in order to remove the carbonate. The test tube was filled with deionized water and left to stand for 12 h. The upper layer of clear liquid was extracted and left to stand repeatedly to remove acid until the pH was 6.5–7.0, and then 10 mL of sodium hexametaphosphate dispersant with a concentration of 0.1 mol·L−1 was added, and the sample was dispersed using ultrasonic agitation for 30 s. The volume percentage of soil with different particle sizes ranging from 0.02 to 2000 μm and bulk density (g·cm−3) of soil were obtained by measurement with a laser particle sizer. Each soil sample in the experiment was treated with the same method and measurement process, and three replications were set up [31].
To quantitatively analyze the regulatory effects of biological treatments on particle size distribution, curve fitting was performed using the Gauss formula, and the peak width w = 2σ was defined and substituted into the standard Gaussian formula as follows. This quantified the influence of different treatments on the migration of dominant particle sizes (xc) and the uniformity of distribution (w). The standard Gauss formula is as follows.
y = y 0 + A ω π 2 exp 2 x x c ω 2
where xc is the position of the particle size center, characterizing the most representative dominant particle size fraction in the soil. Its migration reflects the direction of aggregate reorganization. w is the peak width, quantifying the distribution range of the dominant particle size fraction (an increase in peak width indicates reduced size uniformity, as biological action promotes multi-level particle aggregation). A is the peak area, representing the overall volume proportion of particles in the dominant size fraction. Its change reveals the growth and decline of key components for structural stability. y0 is the baseline offset, representing the background noise or baseline.

2.3.2. Soil Moisture Characterization Curve

To quantitatively describe the dynamic process of the soil water retention curve (SWRC) from saturation to dryness, this study adopts the van Genuchten model for fitting analysis. Undisturbed soil samples for water characteristic determination were collected from the 0–5 cm soil layer in the flumes, preserving natural structure and pore integrity. Immediately after sampling, the cutting rings were sealed at both ends with plastic wrap and stored at 4 °C until analysis. Soil water characteristic curves under different treatments were obtained using a high-speed refrigerated centrifuge (CR21GIII, Tokyo, Japan). This method simulates soil water potential (ψ) through centrifugal force; at equilibrium, centrifugal force equals soil water potential [32]. Soil cores in cutting rings were saturated by immersion for 24 h and weighed to obtain saturated mass. The saturated rings were placed in the centrifuge rotor, and different soil water potentials (0, −10, −30, −50, −100, −330, −500, −1000, −3000, −5000, −10,000, −15,000 kPa) were sequentially applied at 4 °C. After equilibration at each soil water potential level, the rings were immediately removed, the external moisture was wiped off, and the equilibrated mass was weighed to avoid evaporation. After equilibration at the final soil water potentials (−15,000 kPa), the rings were oven-dried at 105 °C for 24 h to determine their dry weight. The volumetric water content and bulk density corresponding to each soil water potential level were calculated.
The relationship between soil water potential and volumetric water content was fitted using the van Genuchten model.
θ Ψ = θ r + θ s θ r 1 + α Ψ n m
where θs is the saturated water content (cm3·cm−3), the θ value at ψ = 0 kPa; θr is the residual water content (cm3·cm−3), the θ value at ψ = −∞ kPa; ψ represents soil water potentials, the negative pressure of water in the soil (kPa). α is the inverse of the air-entry value (kPa−1), a parameter related to soil pore size distribution. A larger α value indicates soil drains more easily. n and m are dimensionless parameters related to the shape of the soil distribution, with m = 1 − 1/n. A larger n value indicates higher pore uniformity.
To systematically evaluate the effects of different treatments on soil hydraulic properties, three key soil water characteristic parameters were selected as evaluation indicators: saturated water content (θs, soil volumetric water content at a soil water potential of 0 kPa), field capacity (θfc, soil volumetric water content at a soil water potential of −33 kPa), and permanent wilting point (θwp, soil volumetric water content at a soil water potential of −1500 kPa).

2.3.3. Water-Stable Soil Aggregates

Soil aggregate water stability was determined using a DIK soil aggregate analyzer (Daiki, Japan). Soil aggregate stability indices were calculated, including mean weight diameter (MWD, mm), geometric mean diameter (GMD, mm), water-stable aggregate content > 0.25 mm (WR0.25, %), percentage of aggregate destruction (PAD, %), and fractal dimension (D). These stability indices comprehensively characterize the resistance of soil aggregates to hydraulic disruption from different perspectives, which is crucial for assessing soil erodibility. Large and stable aggregates are reflected in high MWD, GMD, and WR0.25 values and low PAD values, effectively reducing the dispersion, migration, and loss of soil particles under rainfall and runoff, thereby lowering erosion risk. The fractal dimension D provides information on the complexity of the aggregate size distribution; typically, a lower D value indicates better aggregate structure and stronger erosion resistance.
The calculation formulas for each indicator are as follows:
MWD = i = 1 n x i ¯ W i
Mean weight diameter (MWD; mm): MWD is the weighted average of aggregate diameters across all size fractions, weighted by their mass proportion. It intuitively reflects the average size of aggregates. A higher MWD value indicates a higher proportion of larger, more stable aggregates in the soil, signifying better structural stability and typically stronger erosion resistance.
GMD = exp i = 1 n W i ln x i ¯
Geometric mean diameter (GMD; mm): GMD is the logarithmic transformation of the geometric mean of aggregate diameters. It is more sensitive to changes in smaller-sized aggregates. Used in conjunction with MWD, it provides a more comprehensive description of the average size distribution characteristics of aggregates. Higher GMD values also indicate better aggregate stability and potential erosion resistance.
WR 0.25 = 1 M x < 0.25 M T
Water-stable aggregates > 0.25 mm (WR0.25; %): WR0.25 represents the percentage (by weight) of aggregates remaining in the size fraction > 0.25 mm after wet sieving, relative to the total aggregate weight (unit: %). This is one of the most used and core indicators for evaluating soil structural water stability.
PAD = DR 0.25 WR 0.25 DR 0.25 ×   100 %
Percentage of aggregate destruction (PAD; %): PAD represents the proportion of aggregates originally >0.25 mm in dry sieving that break down under water immersion and agitation. It directly quantifies the degree of structural disruption to aggregates caused by water.
M r < x i ¯ M T = x i ¯ x max 3 D
Fractal dimension (D; dimensionless): D is calculated based on the mass–size relationship of the aggregate size distribution. It describes the complexity of the aggregate size distribution and pore structure characteristics.
Here, x i ¯ is the average diameter of the ith particle size, mm; Wi is the percentage of the total volume of agglomerates of the corresponding particle size of x i ¯ , %; Mx<0.25 is the weight of < 0.25 mm agglomerates, g; MT is the total weight of agglomerates, g; DR0.25 is the content of mechanically stable > 0.25 mm agglomerates, as measured by the dry sieving method DR0.25, %; M r   <   x i ¯ is the mass percentage of agglomerates with a particle size smaller than x i ¯ ; xmax is the maximum particle size of the agglomerates, mm.

2.3.4. Runoff and Sediment Yield

During rainfall, high-frequency sampling commenced at the 2nd, 4th, 6th, 9th, and 12th minutes when a stable, continuous water film or rill flow appeared in the flumes without significant changes in ponding depth, to capture the rapid changes in the initial runoff stage. Sampling intervals were then extended to 15, 20, 25, and 30 min to quantify the erosion process. All runoff was collected continuously (each data measurement was repeated three times, and the average value was used for statistical comparison). Runoff samples collected at each time point were allowed to settle in their respective collection buckets for 48 h to ensure full sediment settling. After settling, the volume of runoff collected during that interval (L) was measured using a graduated cylinder. The supernatant was carefully decanted, and the sediment was transferred to pre-weighed containers. The sediment was oven-dried at 105 °C for 24 h to constant weight. After cooling and weighing, the sediment concentration (g·L−1) at that time point was calculated as the dry sediment weight (g) divided by the corresponding runoff volume (L). These measurements were used to quantify the effects of different moss and bacteria treatments on surface runoff and soil erosion processes.

2.3.5. Remaining Soil Indicators

To comprehensively evaluate the soil erosion process and the ameliorative effects of moss and bacteria treatments, this section monitored key indicators closely related to soil hydrological characteristics and the carbon cycle. These parameters were selected because they fundamentally influence erosion dynamics: soil moisture and temperature regulate runoff generation and aggregate stability, while soil dissolved organic carbon (DOC) and MBC reflect carbon mobility and microbial-mediated soil cohesion—critical factors in erosion resistance and treatment efficacy. Monitored indicators included soil moisture, temperature, dissolved organic carbon (DOC), and microbial biomass carbon (MBC). Soil volumetric water content (θ, m3 m−3) and temperature (°C) were automatically collected using a CR200 soil water temperature monitoring system (Campbell Scientific Inc., Logan, UT, USA). Stevens HydraProbe II sensors (Stevens Water Monitoring Systems, Inc., Portland, OR, USA) were installed during the layered filling of the experimental flumes at a depth of 5 cm. Sensors were connected to a data logger (PC 2SQ, Jinzhou Sunshine Technology Co., Ltd., Jinzhou, China), which automatically collected and stored data every 30 min. Soil dissolved organic carbon (DOC) was determined from 0.5 M K2SO4 extracts. Total organic carbon (TOC) and total inorganic carbon (TIC) in the extracts were measured using a total organic carbon analyzer (TOC Analyzer). DOC concentration was calculated as the difference between TOC and TIC according to standard methods [33]. Soil microbial biomass carbon (MBC) was determined using the chloroform fumigation extraction method. Specifically, two equal aliquots of fresh soil were taken; one was fumigated with chloroform for 24 h, and the other served as a non-fumigated control. After fumigation, both soil samples were extracted with 0.5 M K2SO4 solution, and the organic carbon content in the extracts was measured. MBC was calculated as the difference in extractable organic carbon between fumigated and non-fumigated samples divided by a conversion factor.

2.4. Statistical Analysis

Data processing, graphing, and tabulation were performed using SPSS (IBM, Armonk, NY, USA, SPSS Statistics 27) and Origin Pro 8.5 software. All statistical analyses were based on sample data from three independent replicate experiments (n = 3). The Shapiro–Wilk test was used to assess the assumption of normal distribution for each dataset, and Levene’s test was used to assess the assumption of homogeneity of variances among groups. If both assumptions were satisfied, one-way analysis of variance (ANOVA) was used to compare differences among treatments, followed by post hoc multiple comparisons using the LSD method. If the assumptions of normality or homogeneity of variances were violated, the non-parametric Kruskal–Wallis test was used instead, followed by Dunn–Bonferroni-corrected post hoc comparisons. Statistical results were analyzed at significance levels of 0.05 and 0.01. CANOCO 5.0 (RDA) was used to analyze the correlations between soil structural properties (independent variables: Xc, w, A, θs, a, DEI, MWD, GMD, WR0.25, PAD, D, DOC, MBC) and rainfall erosion indicators (dependent variables: runoff volume, soil loss, sediment concentration in runoff).

3. Results

3.1. Differences in Soil Particle Size Distribution and Soil Aggregate Stability in Different Treatment Groups

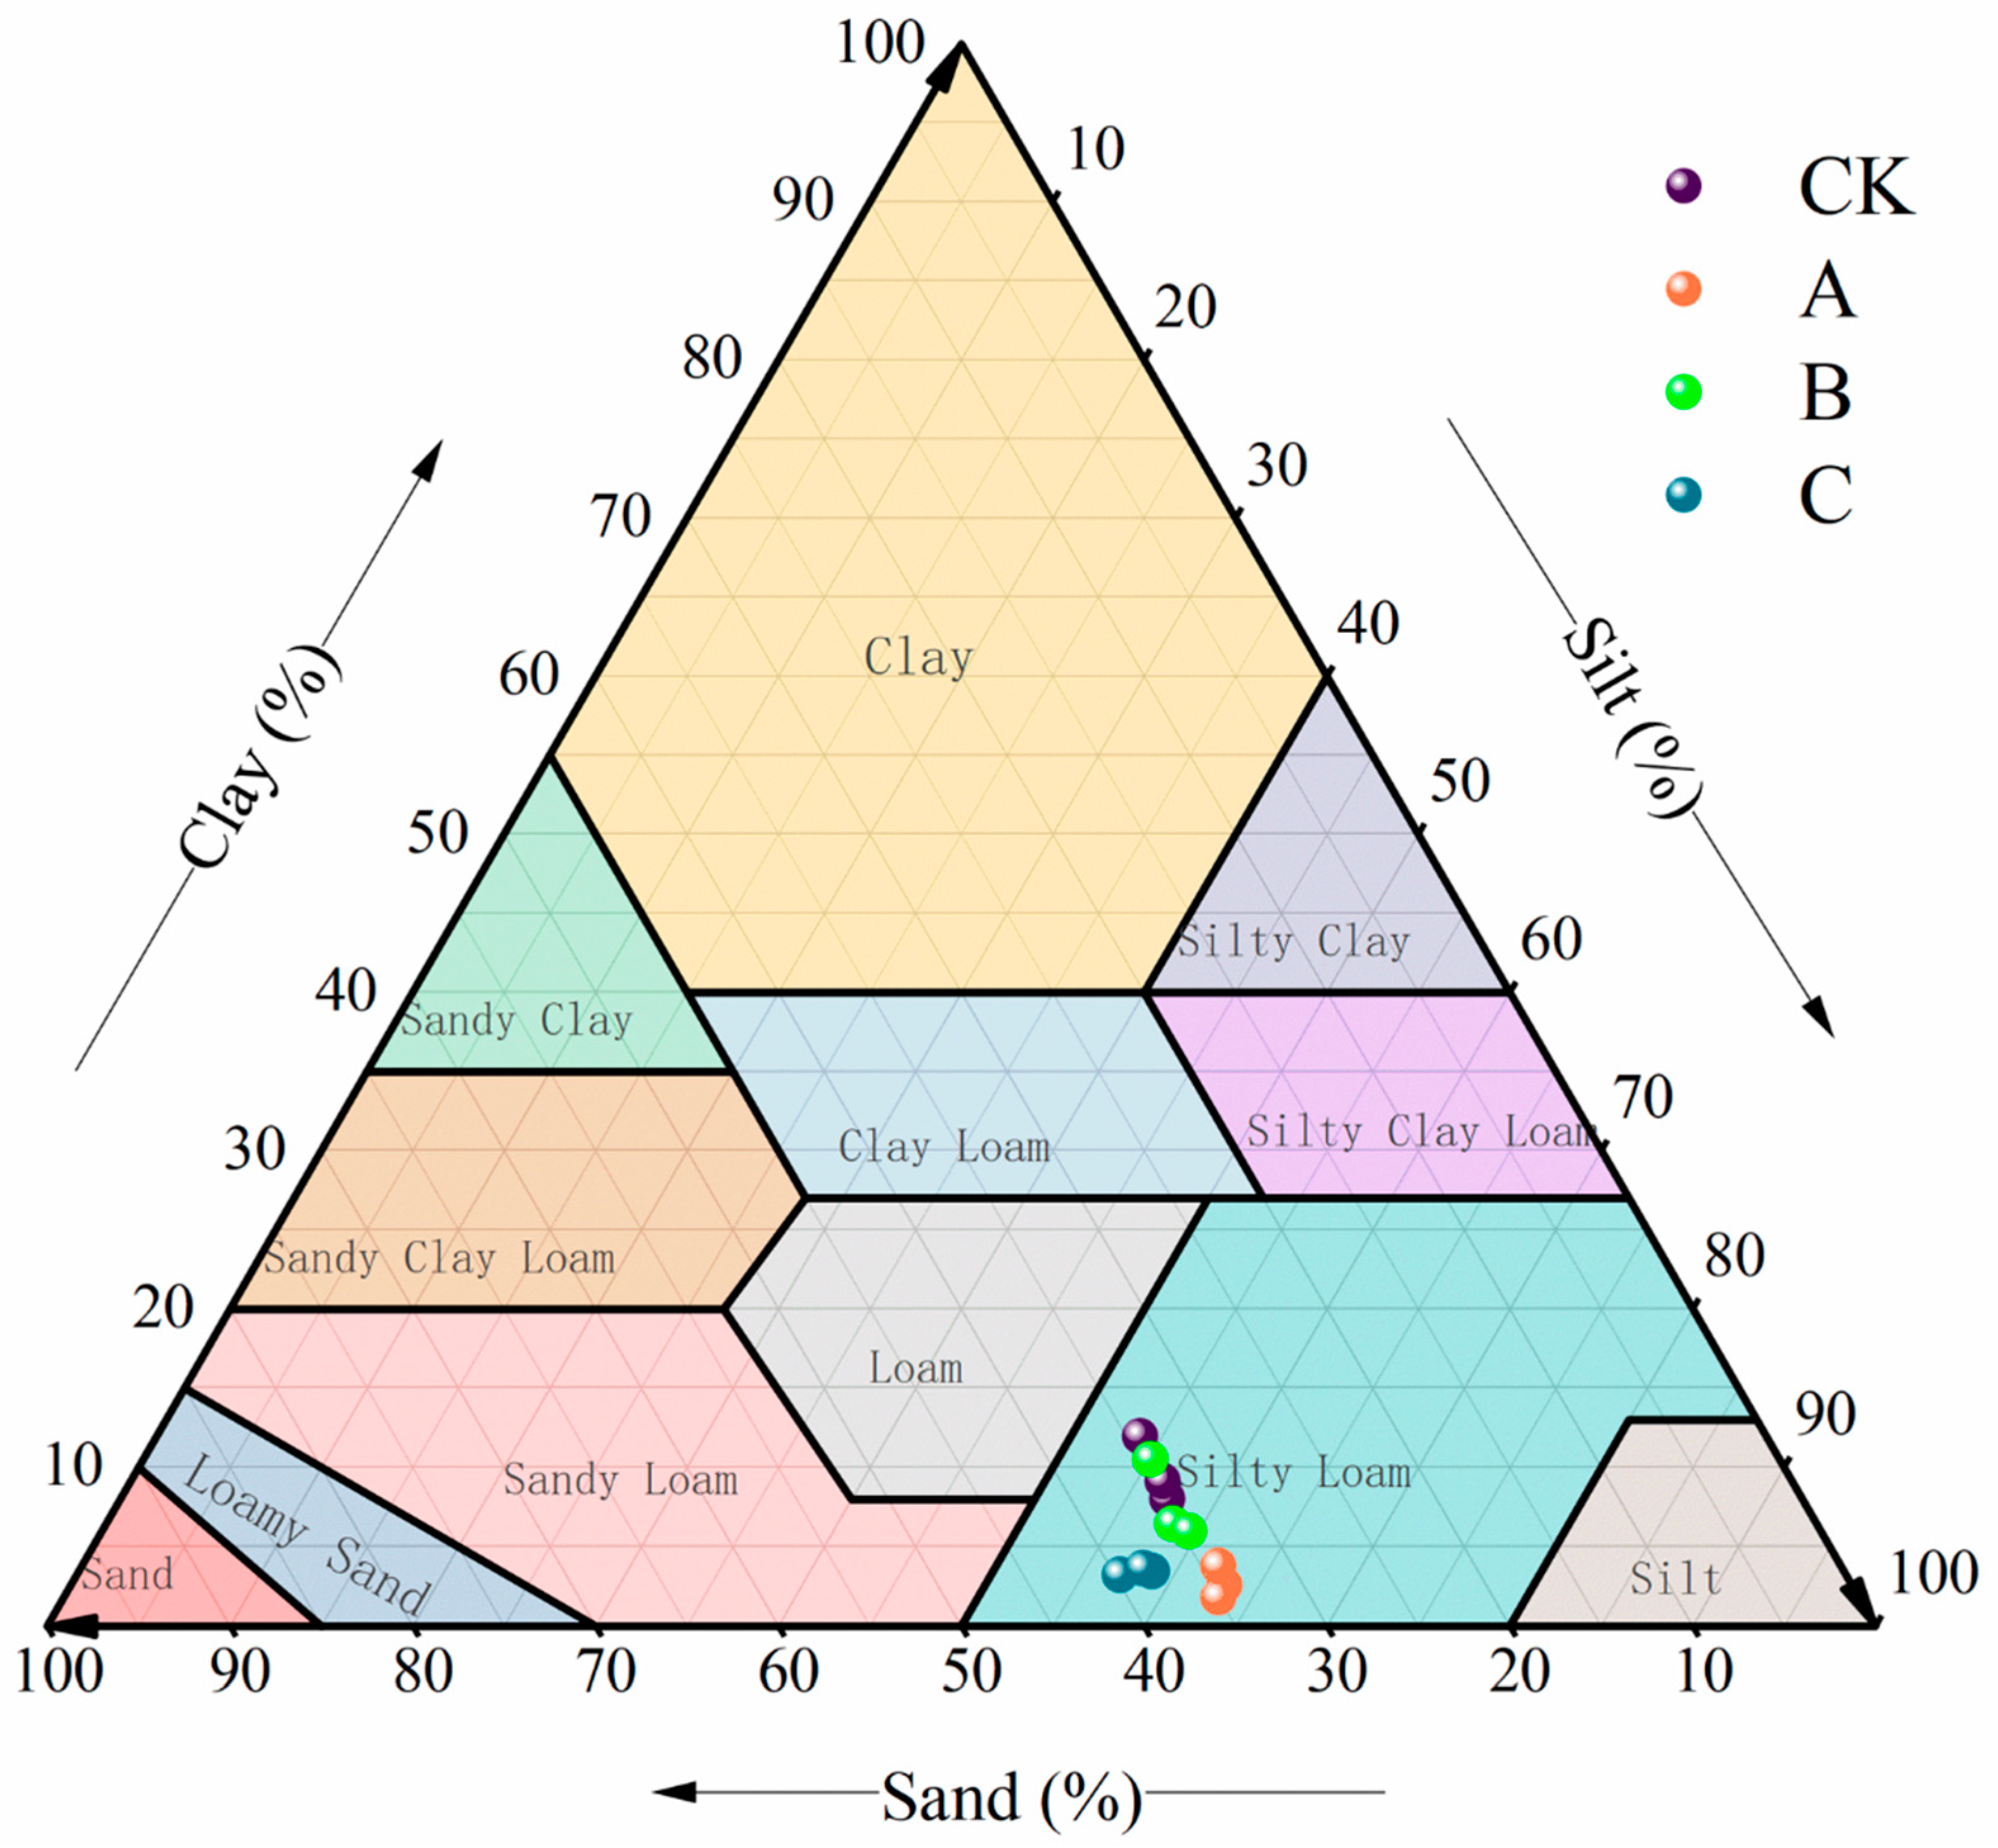
3.1.1. Soil Particle Size Distribution

The combination of soil particle sizes has a significant influence on soil structure and its function. The particle size distribution curves were fitted based on the Gaussian model, with model R2 > 0.7 indicating credible fitting. The fitting results are presented in Table 2. ANOVA revealed highly significant effects (p < 0.01) of different treatments on the main peak position (Xc), distribution width (w), and peak area (A). LSD post hoc tests showed the following: The Xc value of Treatment C (Xc = 19.459 μm) was significantly shifted rightward by 114.1% compared to the control (CK) (Xc = 9.094 μm) (p < 0.01). Its distribution width parameter (w = 22.763 μm) expanded by 135.9% relative to the control (w = 9.653 μm) (p < 0.01). The peak area (A = 196.299) increased by 119.3% compared to the control (A = 89.531) (p < 0.01). The Xc values of Treatment A and Treatment B were 14.165 μm and 11.342 μm, respectively, representing increases of 56.1% and 24.8% compared to the control (p < 0.05). However, the increases in their distribution width and peak area were smaller and not statistically significant (p > 0.05). Statistical analysis of soil particle size distribution indicated the following: Treatment C reduced the clay fraction by 59.80% (p < 0.01), while simultaneously increasing the coarse silt and fine sand fractions by 158.91% (p < 0.01) and 181.15% (p < 0.01), respectively. This is consistent with the rightward shift of Xc, expansion of w, and increase in A observed in the Gaussian model. Treatment A reduced clay by 48.73% (p < 0.05) but showed no significant change in coarse silt (p > 0.05). Treatment B resulted in a 9.36% reduction in fine sand (p < 0.05). The peak area of Treatment B (A = 126.145) increased by 41.0% compared to the CK, but the Xc shift was not significant (p > 0.05). Notably, the proportions of coarse silt and fine sand in Treatment C were increased by an average of 48.93% and 71.75%, respectively, compared to Treatments A and B (p < 0.05).
Treatments A, B, and C and the control all fell within the silty loam region on the soil texture ternary diagram (Figure 2). The texture coordinates of the control and Treatment B were close. The coordinate positions of Treatment A and Treatment C showed significant displacement compared to the CK (p < 0.05).

3.1.2. Water-Stable Soil Aggregates

Based on the proportion of water-stable soil aggregates, the soil aggregate stability index for different treatments was calculated, as shown in Figure 3 and Table 3. MWD and GMD reflect the soil structure’s resistance to erosion, PAD indicates the breakdown rate of soil aggregates, and the fractal dimension (D) represents the soil’s physical structure and erosion resistance. Under identical treatment conditions (Figure 3), compared to the control (CK) MWD (0.37 ± 0.04 mm) and GMD (0.26 ± 0.02 mm), Treatment C showed the greatest increase in MWD (0.82 ± 0.03 mm) and GMD (0.46 ± 0.01 mm), being 121.6% and 76.75% higher respectively, indicating a significant improvement in aggregate stability (p < 0.01). The WR0.25 for Treatment C (52.79 ± 2.57%) increased by 44.43% compared to the control WR0.25 (36.55 ± 1.91%) (p < 0.05). Simultaneously, Treatment C exhibited the smallest PAD (21.92 ± 3.37%), representing a 38.67% reduction compared to the control (p < 0.05).
In contrast, Treatment A showed smaller average increases in MWD (0.66 ± 0.03 mm) and GMD (0.37 ± 0.02 mm) of 77.87% and 39.26% higher than the control, respectively (p < 0.05). The WR0.25 for Treatment A (50.26 ± 1.37%) increased by 37.1% compared to the control WR0.25 (36.55 ± 1.91%) (p < 0.05). The PAD for Treatment A (27.79 ± 2.80%) was 22.24% lower than the control, but this difference was not significant (p > 0.05). Treatment B showed increases in MWD (0.47 ± 0.04 mm) and GMD (0.31 ± 0.01 mm), averaging 27.00% and 17.81% higher than the control, respectively, which were not significant (p > 0.05). Its WR0.25 (45.70 ± 0.87%) increased by 25.03% compared to the control (p < 0.05), while its PAD (27.20 ± 1.40%) decreased by 23.89% compared to the control (p > 0.05). Under different slope conditions (Table 3), significance analysis indicated no significant differences for the same treatment across slopes, meaning slope gradient had no effect on soil aggregate stability.

3.2. Effects of Bacterial and Moss Inoculation on Soil Moisture Characteristics

The soil water retention curves were fitted based on the van Genuchten model (Figure 4). The model demonstrated excellent fitting performance, with the coefficient of determination (R2) exceeding 0.97 for all treatments, indicating its adequacy in describing the soil hydraulic characteristics across the different treatments. As visually presented in Figure 4 and Table 4, the changes in volumetric water content with soil water potential are intuitively displayed for the three treatments. The volumetric water content of the different curves under varying soil water potential reflects the differences in soil water content among the treatments. Concurrently, the slope of the curves indicates the sensitivity of soil water content to changes in soil water potential. Among the four treatments, the control group and Treatment B exhibited significantly higher saturated water content and total porosity compared to Treatment A and Treatment C (Figure 5). Furthermore, the control group had the highest saturated water content, averaging 51.52 cm3·cm−3, which was higher than the mean values for Treatment B (46.81 cm3·cm−3), Treatment A (42.84 cm3·cm−3), and Treatment C (42.79 cm3·cm−3). Simultaneously, the hydraulic conductivity parameter (α = 0.100 kPa−1) for the control group was considerably lower than that for Treatment A, Treatment B, and Treatment C. Under the same slope, the saturated water content corresponding to saturated soil water potential for Treatment A, Treatment B, and Treatment C decreased by an average of 16.84% (p < 0.05), 9.14% (p > 0.05), and 16.95% (p < 0.05), respectively, compared to the control group. Conversely, the residual water content for Treatment A and Treatment C increased by an average of 50.98% (p < 0.01) and 24.5% (p < 0.05), respectively, compared to the control, while Treatment B showed a decrease of 2.94% (p > 0.05). The plant-available water capacity (PAWC) for Treatment A, Treatment B, and Treatment C was 24.07% (p < 0.05), 7.41% (p > 0.05), and 5.5% (p > 0.05) higher, respectively, than that of the control group. Within the same slope, as soil water potential increased, the volumetric water content curves for the control group and Treatment B exhibited a steeper decline, particularly in the low soil water potential region. In contrast, the soil water potential–volumetric water content curves for Treatment C and Treatment A were relatively flat. Within the low soil water potential range, the changes in volumetric water content for these two treatments were minor. As soil water potential increased further into the high soil water potential range, the changes in volumetric water content for all four treatments stabilized, and the slope of the curves gradually decreased. Under different slopes for the same treatment, the soil water retention curves for the three treatment groups did not exhibit significant shifts with increasing slope. The impact of slope variation on the water retention curves of the three treatment groups was negligible, and the increase in water-holding capacity was not significant (p > 0.05).

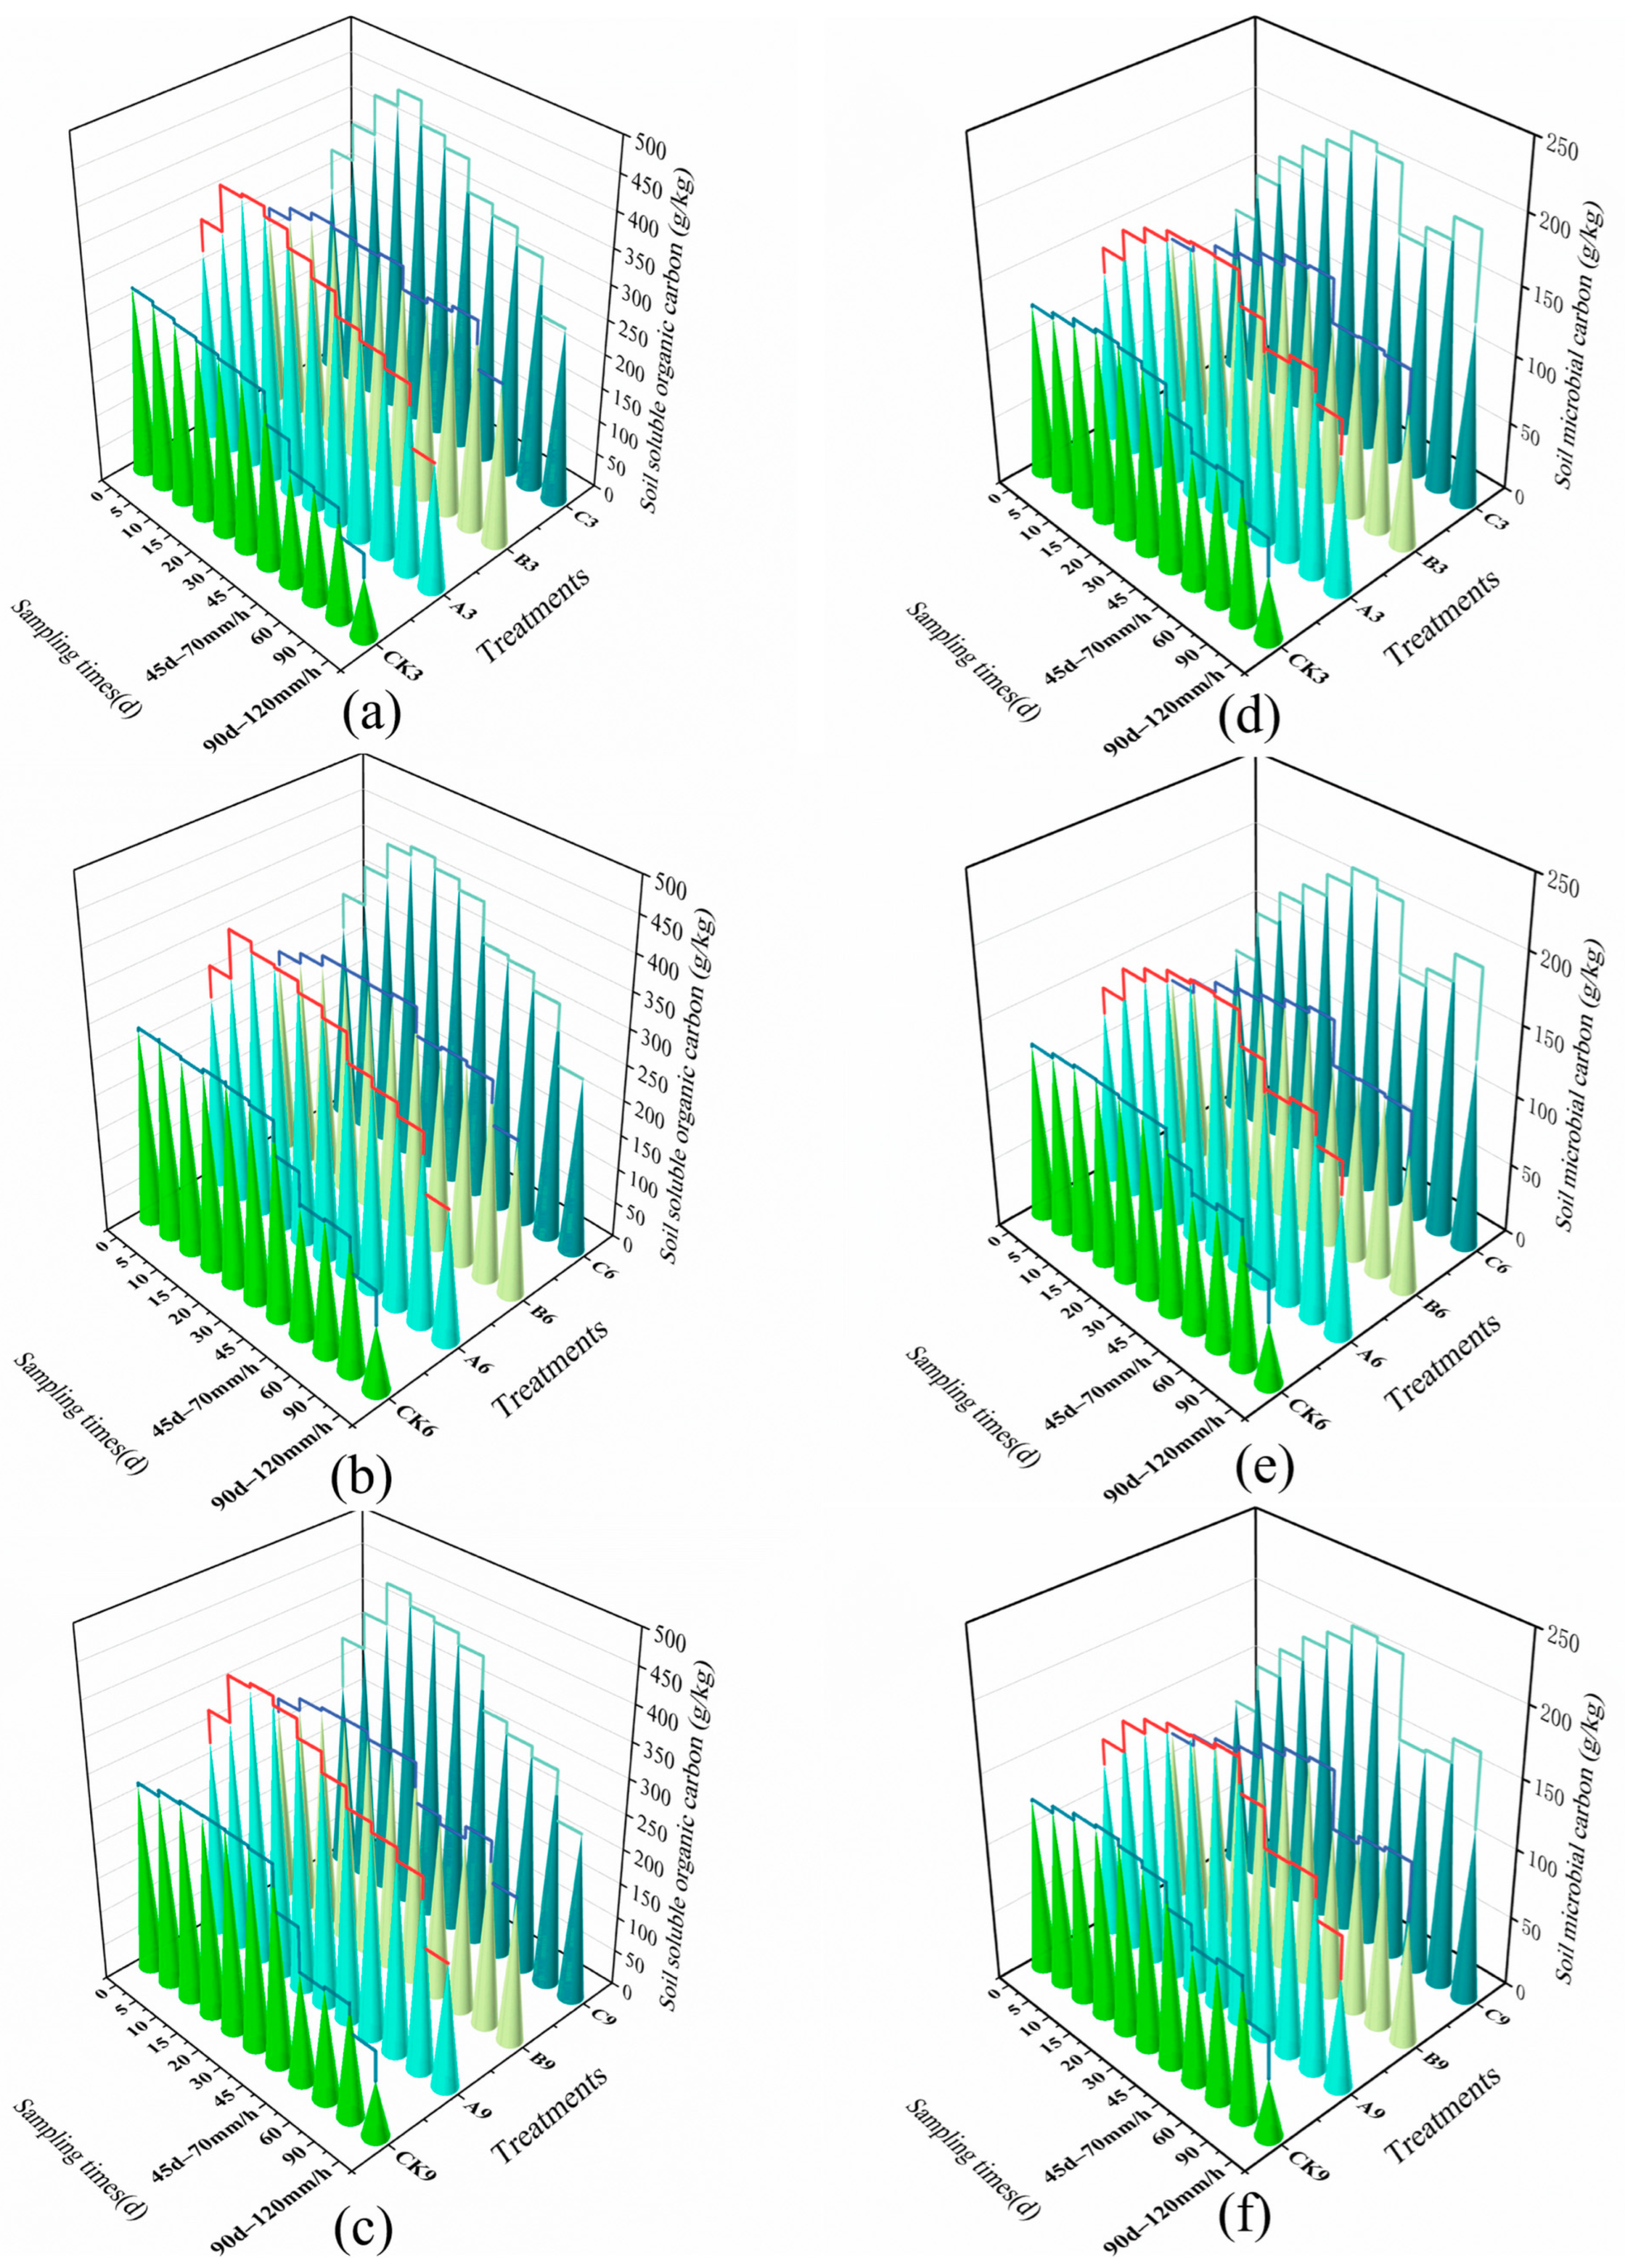
3.3. Characteristics of the Effects of Bacterial and Moss Inoculation on Soil Organic Carbon

The dynamic responses of the soil active carbon pool (DOC) and microbial biomass carbon (MBC) are shown in Figure 6. Under the 3° slope condition, the MBC concentration of Treatment C exhibited continuous accumulation: it reached 157.28 mg·kg−1 after 5 days of inoculation, representing a 28.4% increase from the initial value of 122.45 mg·kg−1. It peaked at 214.32 mg·kg−1 by day 45, reflecting a cumulative increase of 75.0%, and remained at 133.11 mg·kg−1 after two simulated rainfall events, significantly higher than the 45.26 mg·kg−1 in the control group at the same time point (p < 0.01). DOC dynamics synchronously showed, as depicted in Figure 6, that the DOC concentration of Treatment C increased to 334.24 mg·kg−1 after 5 days of inoculation, a 20.7% increase from the initial value of 276.86 mg·kg−1. After the first simulated rainfall, it maintained a level of 372.28 mg·kg−1, while the control CK decreased to 162.20 mg·kg−1 over the same period, a cumulative decline of 40.7%. Treatment A initially showed rapid DOC release, reaching 322.57 mg·kg−1 at 5 days, but decreased to 299.31 mg·kg−1 after the conventional rainstorm simulation; Treatment B exhibited a more gradual DOC increase, reaching 316.03 mg·kg−1 by day 45.
After the 70 mm·h−1 conventional rainstorm, at the 3° slope, Treatment C demonstrated a DOC retention rate of 89.3%, significantly higher than CK3’s 65.2% (p < 0.05), and an MBC retention rate of 77.7%, 4.4 percentage points higher than CK3’s 73.3%. At the 6° slope, the DOC loss rate for Treatment C was 28.34%, lower than CK6’s 38.71%. After the 120 mm·h−1 extreme rainstorm, at the 3° slope, Treatment C’s DOC loss rate was 23.7%, 47.1% lower than CK3’s 44.8% (p < 0.01). At the 9° slope, Treatment C’s DOC loss rate (37.71%) and MBC loss rate (36.09%) were significantly lower than CK9’s 66.91% and 65.78%, respectively (p < 0.01).
Treatment C showed a progressive increase in the DOC loss rate with an increase in slope, but the rate of increase was moderated; in contrast, the control CK’s DOC loss rate increased from 44.8% at 3° to 66.91% at 9°, a rise of 49.4%. Treatments A and B exhibited significant slope sensitivity: at the 9° slope, Group A’s DOC loss rate of 34.5% represented a 15.4% increase compared to its rate at the 3° slope. Group B’s DOC loss rate reached 28.34% after rainfall at the 6° slope, a 13.2% increase from its rate of 15.1% at the 3° slope.

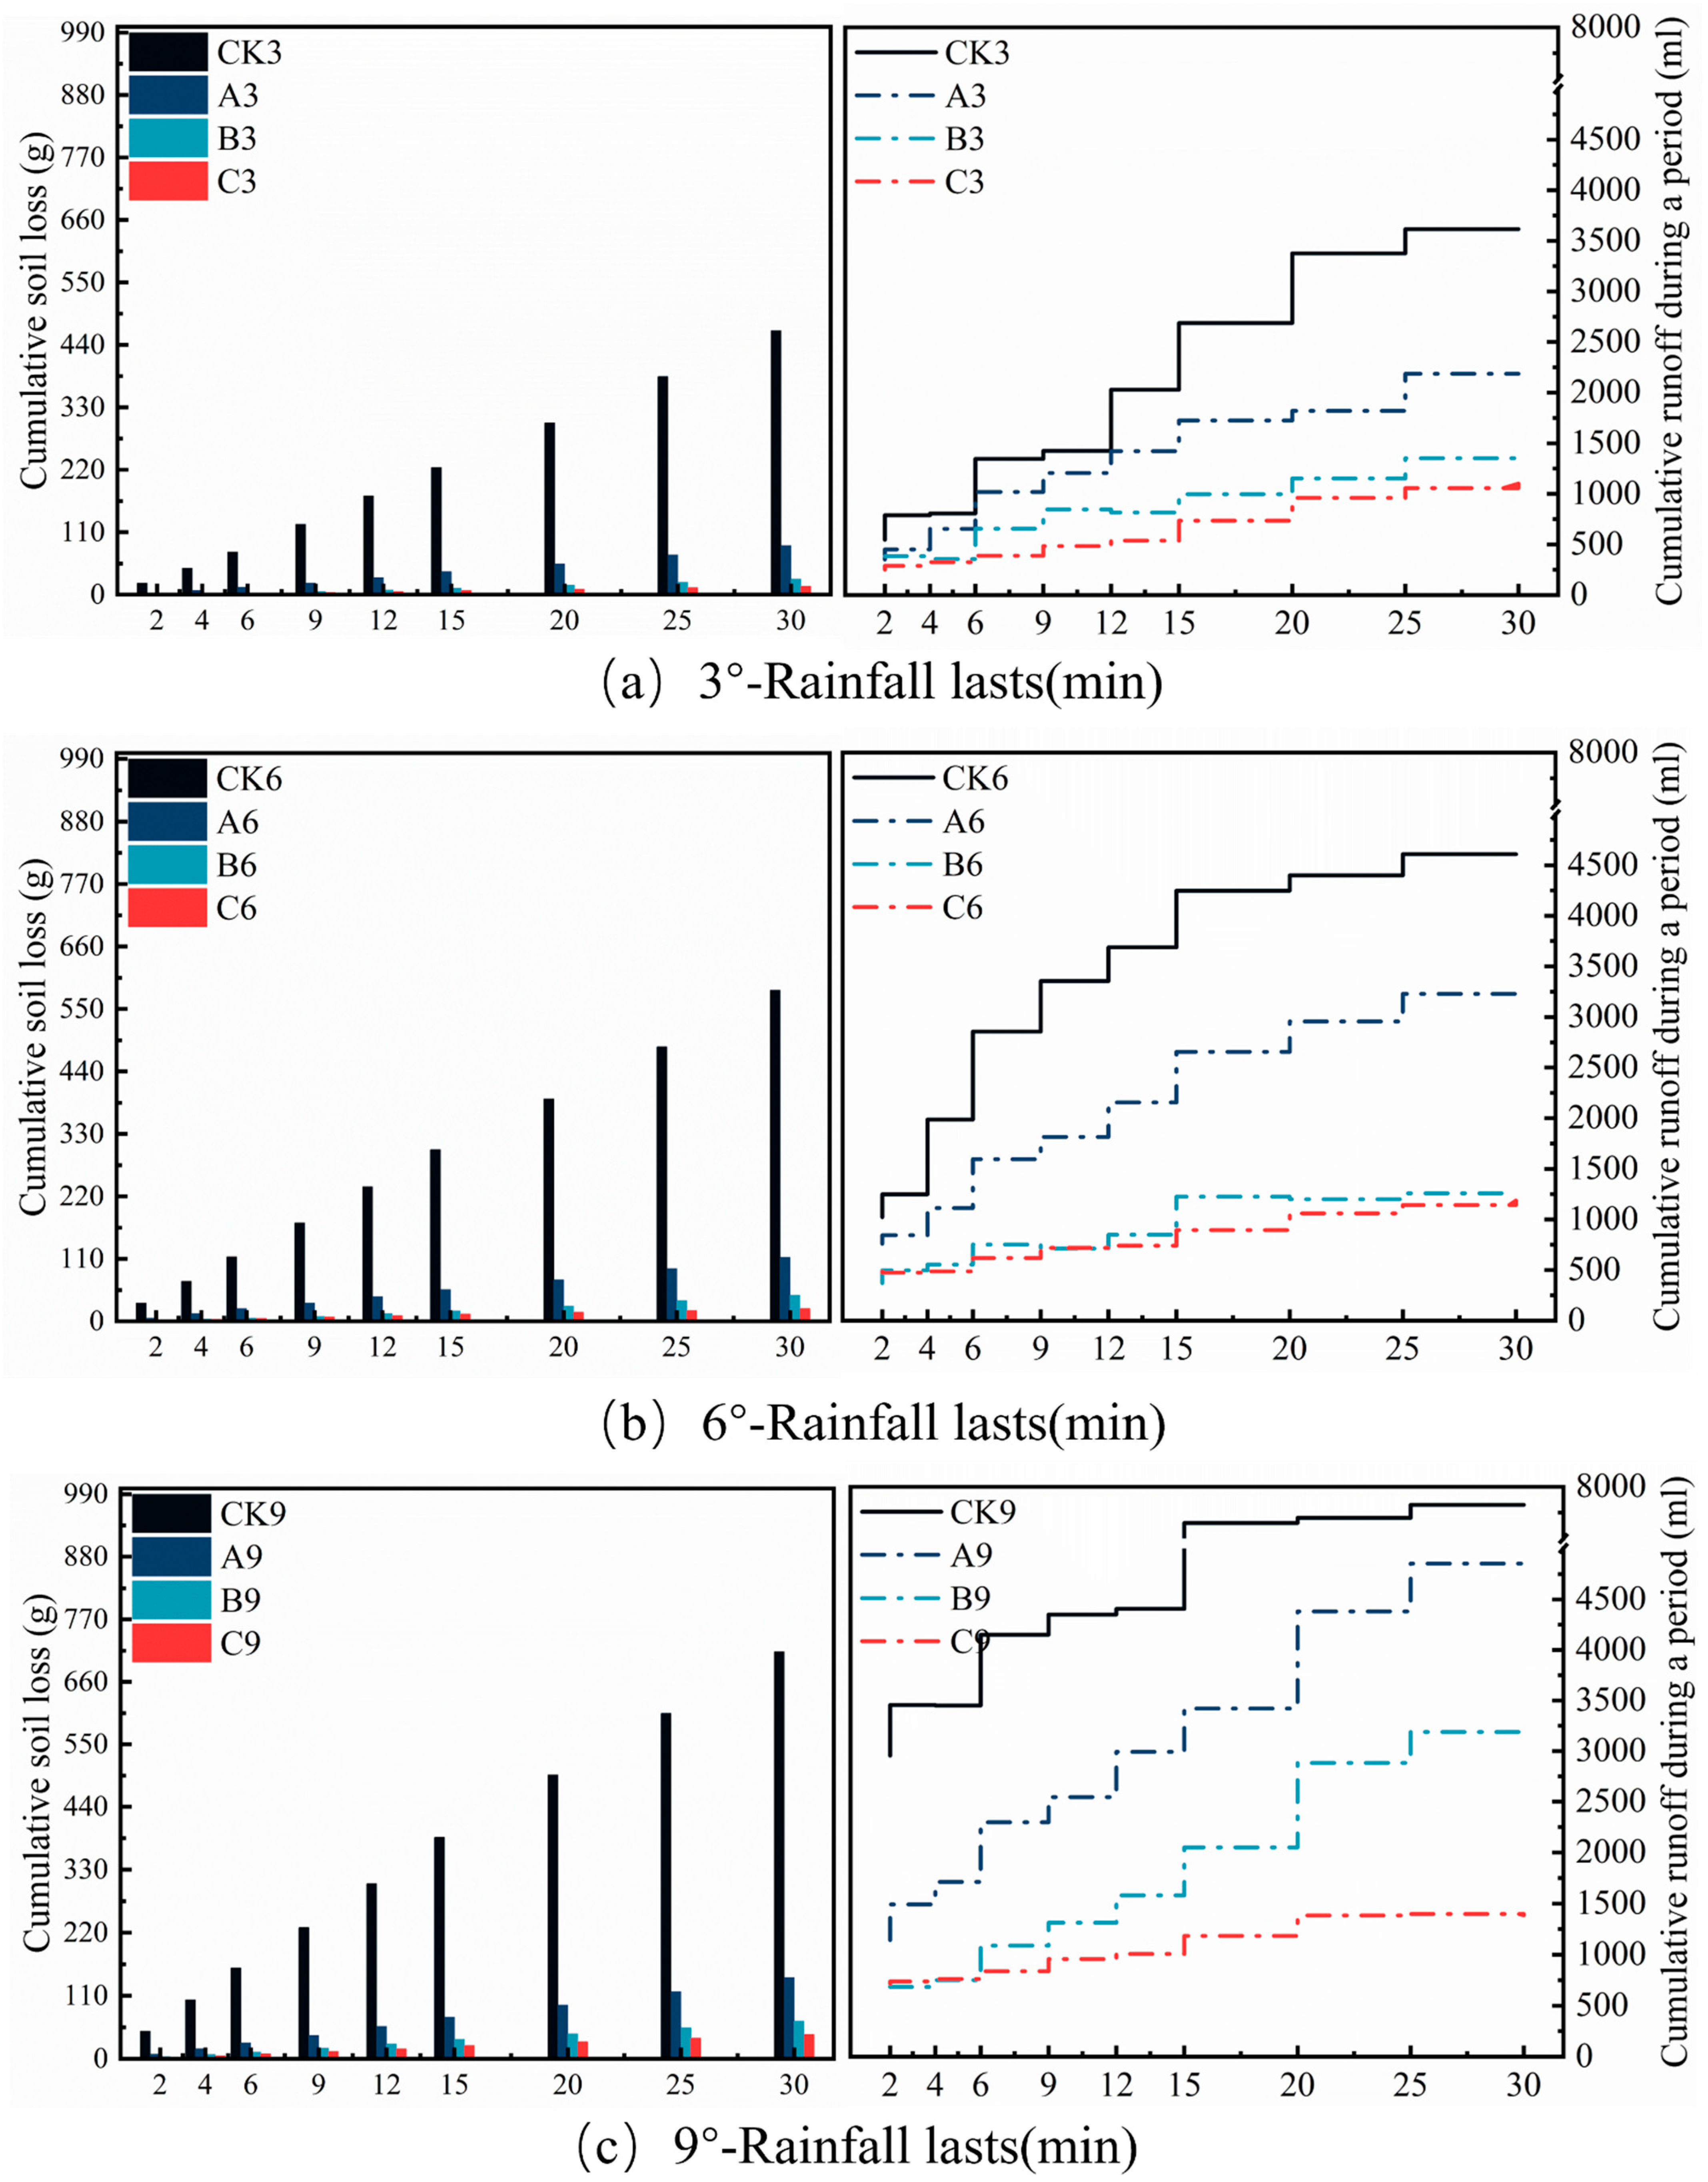
3.4. Effects of Bacterial and Moss Inoculation on Rainfall-Induced Soil Erosion

The hydrological effects of different treatment groups under rainfall intensities of 70 mm·h−1 and 120 mm·h−1 are shown in Figure 7 and Figure 8, respectively. As rainfall intensity covaried with incubation time in this study, the observed differences in results under the two rainfall intensities may stem from differences in incubation time, differences in rainfall intensity, or their interaction and cannot be solely attributed to the maturation effect of treatments over time. Based on this, the analysis in this section strictly focuses on comparing the effects of different treatment groups (CK, A, B, C) on hydrological and erosion parameters across slopes (3°, 6°, 9°) within each specific rainfall intensity experiment (Table 5 and Table 6).
In the experiment simulating a 70 mm·h−1 conventional rainstorm, Table 5 data show that all treatment groups (A, B, and C) significantly reduced soil loss, runoff volume, and sediment concentration, but their effectiveness varied with treatment group and slope as shown in Figure 6. Specifically, at the 3° slope, Treatment C performed best, reducing soil loss significantly to 5.21 g—a 95.70% reduction compared to the control CK3 (121.17 g). Its runoff volume (4.59 L) and sediment concentration (1.13 g·L−1) were also significantly reduced by 38.31% and 93.06%, respectively (p < 0.01). The sediment reduction efficacy of Treatment B (soil loss: 8.28 g) and Treatment A (soil loss: 23.83 g) was sequentially lower, reducing soil loss by 93.16% and 80.33% compared to the CK, respectively (p < 0.01). When the slope increased to 6°, compared to the control CK6 (195.84 g soil loss), Treatment C (soil loss: 14.92 g) maintained the highest sediment reduction rate of 92.38%, and its runoff reduction rate (54.92%) was significantly higher than that of Treatment A (24.79%) (p < 0.05). At the 9° steep slope, Treatment C reduced soil loss by 94.12% compared to the control, while Treatment A (soil loss: 54.23 g) achieved an 85.76% sediment reduction rate. Multiple comparison analysis further confirmed a significant gradient in soil loss: CK9(a) > CK6(b) > CK3(c) > A9(d) > A6(e) > A3(f) > B9, B6(g) > C9, C6(h) > B3(i) > C3(j). Treatment C exhibited optimal performance at the 3° slope and differed significantly from all other treatments. Runoff analysis revealed that at the 9° high slope, the control group CK9 showed no significant difference from CK6, but Treatment C consistently fell within the lowest runoff group across all slopes.
In the independent experiment simulating a 120 mm·h−1 extreme rainstorm (Figure 9), Table 6 data similarly confirmed the significant efficacy of Treatments A, B, and C (p < 0.01). Specifically, at the 3° slope, Treatment C was most effective, reducing soil loss significantly to 15.13 g—a 96.75% reduction compared to the control CK3 (465.02 g). Its runoff volume (5.45 L) and sediment concentration (2.78 g·L−1) decreased significantly by 67.21% and 90.06%, respectively (p <0.01). Treatment B (soil loss: 27.14 g) and Treatment A (soil loss: 86.41 g) reduced soil loss by 94.16% and 81.42% compared to the control, respectively (p < 0.01). As the slope increased to 6°, Treatment C (soil loss: 22.28 g) maintained a sediment reduction efficiency of 96.18%, with a runoff reduction rate of 74.57%. Under extreme rainfall at the 9° steep slope, Treatment C still achieved a 94.09% sediment reduction rate while significantly reducing runoff volume by 75.12% (p < 0.01); at this slope, soil loss for Treatment B and Treatment A decreased by 90.78% and 80.15%, respectively. Multiple comparison analysis showed a more pronounced stratification of soil loss under extreme rainfall conditions, as depicted in Figure 7: CK9 (a) > CK6 (b) > CK3 (d) > A9 (f) > A6 (g) > A3 (h) > B9 (i) > B6, C9 (j) > B3, C6 (k) > C3 (l). Treatment C maintained the lowest soil loss at the 3° slope and was significantly superior to all other treatments. Runoff analysis revealed that C9 and B3 belonged to the same lowest runoff group.

3.5. Correlation Between Soil Physicochemical Properties and Rainfall Erosion Indicators

Spearman correlation analysis indicated that erosion indicators RV, SL, and SC exhibited significant negative correlations with soil aggregate stability (Table 7). Strong negative correlations were particularly prominent with mean weight diameter (MWD) (p < 0.01), geometric mean diameter (GMD) (p < 0.01), and water-stable aggregates >0.25 mm (WR0.25) (p < 0.05). Concurrently, extremely significant negative correlations existed with dissolved organic carbon (DOC) (p < 0.01) and microbial biomass carbon (MBC) (p < 0.01). Conversely, erosion indicators showed significant positive correlations with the percentage of aggregate destruction (PAD) (p < 0.01) and fractal dimension (D) (p < 0.05).
Redundancy analysis (RDA) further elucidated the erosion response mechanisms within the multivariate space. The first two ordination axes (Axis 1 and Axis 2) cumulatively explained 78.18% of the total variation, clearly delineating the primary and secondary dimensions of association between soil properties and erosion responses. For the dominant Axis 1 (projection values indicated in parentheses), erosion indicators exhibited strong negative associations with erosion-resistant factors, including DOC (−85), WR0.25 (−81), MWD (−74), GMD (−73), Xc (−76), w (−74), and A (−84), while showing significant positive correlations with erosion-promoting factors, including PAD (+79), θs (+83), D (+66), and DEI (+57). For the secondary Axis 2 (projection values indicated in parentheses), erosion indicators showed weak positive correlations with Xc (+42), w (+46), and A (+35), and weak negative correlations with DOC (−48) and WR0.25 (−38).
Notably, RDA projection values reflect the relative contribution strength of variables within the multivariate constrained space (Figure 10). While Spearman correlation showed no direct monotonic relationship between DEI and erosion (p > 0.05), its positive projection on Axis 1 (+57) suggests it may indirectly participate in erosion mechanisms by regulating the physical processes of erosion-promoting factors like PAD and D. Similarly, the reinforced projection values for parameters such as Xc, w, and A stem from the capture of their synergistic effects with core erosion-resistant factors within the multivariate space. These results collectively reveal that soil erosion resistance is primarily governed by the synergistic regulation of aggregate stability and organic matter activity, while structural dispersibility forms the physical basis for erosion occurrence. The indirect mechanisms of parameters such as DEI and Xc will be systematically analyzed in the discussion section in conjunction with soil structure formation processes.

4. Discussion

Soil microorganisms critically contribute to restoring degraded land, improving soil hydraulic properties such as infiltration and water retention, and reducing soil hydrophobicity [34,35]. Cold-region mosses exhibit significant potential for controlling soil and water loss through their unique structure and plant morphology [36,37]. This study delineates a dual-process mechanism where Bacillus subtilis and mosses synergistically enhance erosion resistance: the moss canopy dissipates raindrop energy while bacterial cementation stabilizes soil aggregates. The essence of this mechanism lies in the functional complementarity between Bacillus subtilis and cold-region mosses overcoming the limitations of single amendments. This not only validates the core hypothesis that “Bacillus subtilis and cold-region mosses, through functional complementarity, enhance soil structural stability, balance hydraulic properties, regulate carbon turnover, and strengthen soil erosion resistance,” but also elucidates the unique ecological logic of biological synergy in erosion resistance for cold-region black soils.
Soil particle size distribution and aggregate stability form the foundation of soil physical properties, directly determining water transport characteristics and erosion resistance potential [38]. Experimental data indicate that the combined treatment (Treatment C) exhibited average increases of 48.93% and 71.75% in coarse silt and fine sand fractions compared to single treatments. This significant enrichment of coarse particles provided the direct material basis for the pronounced rightward shift of Xc and the broadening of the distribution range (w), collectively establishing a continuous and stable skeleton-filling gradation system. This “right-shift–broadening–peak-amplification” triad signifies the establishment of a coarse-particle-dominated gradation system. The primary driving mechanism for this change in particle size distribution stems from the ecological niche complementarity of microbes and mosses: Bacillus subtilis secretes cementing substances such as extracellular polysaccharides and organic acids, facilitating the transformation of microaggregates into larger particles and directly elevating Xc values [39]. In contrast, moss rhizoids possess simple structures and limited secretions, lacking the deep penetration capability of higher plant roots. However, their dense rhizoid network effectively intercepts fine particles, forcing coarse particles to rearrange into a stable skeletal structure and significantly expanding the particle size distribution range (135.9% increase in w value) [40,41,42]. The cementing effect of microorganisms and the physical sieving by mosses created a continuous particle size gradient (119.3% increase in peak area A), far exceeding the localized cementation of Treatment A and the physical fixation limitations of Treatment B. This optimized gradation structure directly enhanced erosion resistance through the following mechanisms: Treatment C exhibited a 121.98% increase in MWD, a 38.67% reduction in aggregate destruction percentage (PAD = 21.92%) compared to the control, and a 3.2% decrease in fractal dimension (D). This indicates that the large-particle skeleton enhances structural stability significantly by improving mechanical interlocking and pore connectivity. The strong negative correlations of Xc (−76), w (−74), and A (−84) with erosion indicators in the redundancy analysis (RDA) further corroborate this mechanism.
The optimization of soil structure reshapes the pore network, profoundly influencing the dynamic response of the soil water retention curve (SWRC) [43]. This association was empirically demonstrated in our SWRC data: Treatment C optimized pore distribution by altering the soil particle size structure: an increase in the proportion of macropores significantly enhanced saturated hydraulic conductivity, while the retention of micropores improved water-holding capacity. This dual effect manifested as a “bimodal” characteristic on the SWRC: rapid water drainage occurred in the low-suction range (0–10 kPa) due to high macropore connectivity, while water retention in micropores within the medium-to-high-suction range (10–1500 kPa) increased field capacity compared to the CK. The overall smoothness of the SWRC curve and its stable slope across the entire soil water potential range indicated uniform pore distribution and a dynamic balance between water transport and retention. This water transport–retention balance plays a core dynamic buffering role during rainfall erosion: macropores dominate rapid infiltration during the initial rainfall phase, while the water-holding effect of micropores dampens drastic potential changes during the later phase. This ultimately reduces soil loss and runoff volume, directly aligning with the RDA finding that saturated water content θs (+83) is a core erosion-promoting factor. In contrast, single treatments induced a hydrological vicious cycle due to structural defects. Treatment A, characterized by excessive clay content, resulted in a total porosity drop to 42.75%. Its SWRC shifted towards higher water retention and lower conductivity, specifically showing a steep decline even at low suction, prolonged water residence time, impeded drainage, and a high risk of surface runoff formation and soil detachment during heavy rainfall. Treatment B, lacking organic cementation, exhibited a high aggregate PAD of 24.7%, leading to structural instability under runoff scouring and a surge in sediment concentration. Notably, although the drainage efficiency index (DEI) showed no direct correlation with erosion in Spearman analysis (p > 0.05), its positive projection on RDA Axis 1 (+57) revealed a crucial indirect pathway: impaired drainage induces rapid soil saturation, weakens matric suction, disintegrates water-stable aggregates, and ultimately amplifies structural dispersibility. Significantly, the permanent wilting point of Treatment C was markedly higher than that of the control and Treatment B. This implies that Treatment C can maintain higher soil moisture content, benefiting sustained microbial activity, reducing the formation of shrinkage cracks and vulnerability due to excessive drying, lowering erosion initiation risk, and enhancing soil structural resilience. These phenomena indicate that single amendments struggle to reconcile the conflict between water transport and retention, whereas the synergistic amendment achieves a dynamic balance in SWRC transport–retention properties through particle size optimization and aggregate stabilization. This series of findings confirms the “Hydraulic–Structural Coupling Erosion Hypothesis.”
The dynamics of the active carbon pool serve as the biochemical engine for sustainable erosion resistance. The improvement in soil properties further drives differential responses in nutrient storage and transformation efficiency. This hydraulic–structural synergy induces spatial heterogeneity in the carbon pool response: Treatment C exhibited a 92% increase in DOC content compared to the control, creating a “structure–hydraulic–carbon sink” tripartite enhancement effect. Experimental results demonstrate that different treatments, through synergistic or competitive interactions involving microbe–moss–soil interplay, significantly influenced the balance mechanism between carbon pool transformation and water retention: The DOC and MBC contents of Treatment C were significantly higher than those of other treatments. This advantage stems from a dual mechanism of physical protection and microbial metabolism: large aggregates reduce contact between organic matter and microbial enzymes through an “encapsulation effect,” delaying DOC mineralization; simultaneously, MBC forms a positive feedback loop with aggregate stability, as secreted extracellular polymeric substances cement soil particles, constructing a “microbe–aggregate” symbiotic system. The strong co-localization of DOC (−85) and mean weight diameter (MWD = −74) on RDA Axis 1 statistically confirms the significance of carbon–structure synergy in erosion resistance. In contrast, single treatments were trapped in carbon turnover dilemmas: Treatment A promoted the formation of soil microaggregates by decomposing active carbon and increasing microbial biomass carbon. However, its poor hydraulic conductivity reduced oxygen diffusion rates in soil pores, inhibited microbial activity, slowed organic matter mineralization, decreased the conversion efficiency of DOC to MBC, and thus weakened the capacity for organic carbon sequestration via microbial pathways. Treatment B suffered from slow moss litter decomposition, insufficient to drive microbial cementation, leading to a decoupling between the carbon pool and structural stability. Concurrently, its loose structure and lower permanent wilting point indicated a disconnect between carbon fixation and water-holding capacity. Notably, moss growth in Treatment C was poorer than in Treatment B, suggesting competitive interactions exist between Bacillus subtilis and cold-region mosses. Due to niche overlap, their interaction is not purely mutually beneficial; consideration must be given to the potential inhibitory effect of one species when it becomes dominant. Despite inhibited moss biomass growth, the physical barrier formed by moss residues and living tissues effectively reduced DOC leaching losses. Simultaneously, Bacillus subtilis utilized this intercepted DOC as a carbon source for vigorous metabolism, increasing MBC content, accelerating the secretion of extracellular polymeric substances, and further strengthening the cementation of soil aggregates.
Based on two independent simulated rainfall tests, the anti-erosion contribution of the above mechanism was verified. The control group and Treatment B exhibited high saturated water content, theoretically capable of buffering water retention to delay soil saturation and reduce runoff generation. However, their loose and fragmented soil structure resulted in significantly weaker erosion resistance than Treatment C. In contrast, Treatment C, through soil structure improvement, enhanced surface shear resistance while maintaining relatively high water-holding capacity, effectively suppressing the synergistic destructive effects of raindrop impact and runoff scouring. This structural reinforcement enabled Treatment C to achieve superior erosion suppression, even under comparable hydraulic parameters, by reducing particle detachment and enhancing matrix stability. The erosion inhibition advantage of Treatment C stems from three synergistic aspects: (1) Detachment Resistance Dominated by Structural Stability: Ecological niche complementarity-driven particle size optimization and aggregate stability enhancement significantly increased soil resistance to raindrop impact and runoff shear forces, effectively reducing particle detachment. In contrast, the control group suffered accelerated loss of active carbon (DOC) due to aggregate fragmentation caused by loose structure. (2) Runoff Reduction Regulated by Hydraulic Dynamic Balance: The water transport–retention balance characterized by the SWRC enabled Treatment C to rapidly infiltrate water during the initial phase of heavy rain, reducing surface runoff volume and weakening runoff erosive power. Conversely, the control group experienced surface ponding and a surge in runoff coefficient due to conductivity barriers, exacerbating the mechanical transport of DOC and MBC. (3) Biologically Coupled Effect Strengthened by Carbon Turnover: Bacillus subtilis assimilated intercepted DOC, increased MBC, and accelerated the secretion of extracellular polymeric substances, forming an erosion-resistant “biofilm” between particles. This process embodies the core of carbon–structure–hydraulic coupling, endowing erosion resistance with sustainable resilience. In comparison, the single amendments of Treatment A and Treatment B struggled to achieve long-term erosion resistance.
Comprehensive analysis established the fundamental framework through Spearman correlations, such as the highly significant negative correlation between MWD and soil loss revealing the contribution of aggregate stability to erosion resistance. RDA, however, uncovered latent pathways; for instance, although DEI showed no direct monotonic correlation, its indirect erosion-promoting role was activated in rainfall experiments—drainage impairment caused early soil saturation, triggering the runoff detachment threshold. Finally, functional integration was achieved through simulated rainfall: Treatment C, via the triple synergy of “soil structure optimization through ecological niche complementarity,” “regulation of infiltration–runoff dynamics via water transport–retention balance,” and “carbon turnover reinforcement and sustainability,” achieved significant reductions in soil loss and runoff sediment concentration. Therefore, the essence of erosion inhibition lies in the synergistic amendment reconstructing a trinity functional network of “aggregate–pore–microbe,” where structural optimization is the foundation, and microbe-driven carbon dynamics are key to maintaining the sustainability of erosion resistance capacity.

5. Conclusions

Artificial inoculation of Bacillus subtilis combined with mosses enhanced soil structural stability, carbon sequestration capacity, and erosion resistance, contributing to reduced rainfall-induced erosion. Experimental results demonstrated clear differences between single-component applications (bacterial or moss alone) and the combined treatment: the mixed inoculation significantly increased the proportion of large soil particles while achieving greater aggregate stability and carbon sequestration effects compared to individual treatments. During rainfall simulations, the combined treatment mitigated erosion under both low- and high-intensity rainfall conditions through synergistic effects involving two key components: moss cover attenuated raindrop kinetic energy while bacterial cementation stabilized soil structure. Notably, while exhibiting enhanced erosion resistance, this study revealed an asynchrony between soil structural stability and water retention capacity, indicating the need to re-evaluate conventional porosity-centered water retention theories by incorporating aggregate-microbe interaction mechanisms. Although water-holding capacity showed limited improvement, the combined approach enhanced aggregate stability and reduced rainfall-induced nutrient loss via dual components: (1) physical barrier formation and (2) biological binding reinforcement. Importantly, these benefits were achieved without substantially compromising soil water availability, demonstrating the ecological viability and potential economic benefits of this approach for engineering applications. Generally, surface inoculation with Bacillus subtilis and mosses can be considered an approach aligned with green sustainability principles. Nevertheless, the relative contribution and interaction between physical barriers and biological cementation within the carbon–-water-soil coupling system remains unclear. Simultaneously, while this study confirmed the synergistic effect of Bacillus subtilis-moss co-inoculation, the existence of competitive interactions suggests that the biomass ratio used may not be optimal and requires further optimization. It must be acknowledged that, due to the limitations of the bioremediation cycle, this study was unable to conduct multi-time point tests with fixed rainfall intensity on samples from the same batch. Although the 45-day and 90-day experiments represent erosion resistance performance at different biological stages, the differences in rainfall intensity limited the detailed analysis of the time effect. This suggests that future studies need to address this issue through sample replication designs. Future research should explore different ratios or application sequences to balance competition, while conducting long-term field monitoring or large-scale field trials to decipher the carbon transformation network of soil microbial communities (including the inoculated B. subtilis), quantify the spatiotemporal coupling laws of aggregate evolution and pore water transport, and validate the resilience capacity of this technology to extreme hydrological events.

Author Contributions

Conceptualization, T.L., S.Z., Z.X., Q.F., and F.M.; Data Curation, T.L., S.Z., and Z.X.; Formal Analysis, T.L., S.Z., Z.X., Q.F., M.L., D.L., and Q.L.; Investigation, T.L., S.Z., Z.X., F.M., and M.L.; Methodology, T.L., S.Z., Z.X., F.M., M.L., and D.L.; Resources, T.L., Q.F., D.L., and Q.L.; Software, T.L., S.Z., Z.X., Q.F., F.M., and Q.L.; Validation, T.L., S.Z., F.M., M.L., D.L., and Q.L.; Writing—Original Draft, T.L. and S.Z.; Writing—Review and Editing, T.L. and S.Z. All authors have read and agreed to the published version of the manuscript.

Funding

This research was funded by the National Natural Science Foundation of China, grant number 52179033, and the Joint Fund of the National Natural Science Foundation of China, grant number U20A20318.

Institutional Review Board Statement

Not applicable.

Data Availability Statement

The raw data supporting the conclusions of this article will be made available by the authors on request.

Acknowledgments

We acknowledge that this research has been supported by the National Natural Science Foundation of China (52179033) and the Joint Fund of the National Natural Science Foundation of China (U20A20318).

Conflicts of Interest

All authors declare that they have no potential conflicts of interest with the International Joint Laboratory for the Health of Black Soil Habitats in Cold Regions. The entity provided laboratory facilities but had no role in research design, analysis, or manuscript preparation. No potential conflicts of interest exist.

References

  1. Sáez-Sandino, T.; Delgado-Baquerizo, M. Soil carbon worldwide is reduced by an increasing number of global change stressors. Nat. Clim. Change 2024, 14, 683–684. [Google Scholar] [CrossRef]
  2. Borrelli, P.; Robinson, D.A.; Fleischer, L.R.; Lugato, E.; Ballabio, C.; Alewell, C.; Meusburger, K.; Modugno, S.; Schutt, B.; Ferro, V.; et al. An assessment of the global impact of 21st century land use change on soil erosion. Nat. Commun. 2017, 8, 2013. [Google Scholar] [CrossRef]
  3. Li, J.; Pei, J.; Fang, C.; Li, B.; Nie, M. Drought may exacerbate dryland soil inorganic carbon loss under warming climate conditions. Nat. Commun. 2024, 15, 617. [Google Scholar] [CrossRef] [PubMed]
  4. Wang, M.; Zhang, S.; Guo, X.; Xiao, L.; Yang, Y.; Luo, Y.; Mishra, U.; Luo, Z. Responses of soil organic carbon to climate extremes under warming across global biomes. Nat. Clim. Change 2023, 14, 98–105. [Google Scholar] [CrossRef]
  5. Wuepper, D.; Borrelli, P.; Finger, R. Countries and the global rate of soil erosion. Nat. Sustain. 2019, 3, 51–55. [Google Scholar] [CrossRef]
  6. Fang, H.; Zhai, Y.; Li, C. Evaluating the impact of soil erosion on soil quality in an agricultural land, northeastern China. Sci. Rep. 2024, 14, 15629. [Google Scholar] [CrossRef]
  7. Ma, R.; Tian, Z.; Zhao, Y.; Wu, Y.; Liang, Y. Response of soil quality degradation to cultivation and soil erosion: A case study in a Mollisol region of Northeast China. Soil Tillage Res. 2024, 242, 106159. [Google Scholar] [CrossRef]
  8. Wang, H.; Yang, S.; Wang, Y.; Gu, Z.; Xiong, S.; Huang, X.; Sun, M.; Zhang, S.; Guo, L.; Cui, J.; et al. Rates and causes of black soil erosion in Northeast China. Catena 2022, 214, 106250. [Google Scholar] [CrossRef]
  9. Yuan, C.; Fan, H. Response mechanism of black soil structure to compound erosion forces in sloping farmland, Northeast China. Soil Tillage Res. 2024, 240, 106103. [Google Scholar] [CrossRef]
  10. Anderson, R.L.; Rowntree, K.M.; Le Roux, J.J. An interrogation of research on the influence of rainfall on gully erosion. Catena 2021, 206, 105482. [Google Scholar] [CrossRef]
  11. Zhao, X.; Song, X.; Li, L.; Wang, D.; Meng, P.; Li, H. Effect of microrelief features of tillage methods under different rainfall intensities on runoff and soil erosion in slopes. Int. Soil Water Conserv. Res. 2024, 12, 351–364. [Google Scholar] [CrossRef]
  12. Chen, P.; Xie, Y.; Ren, X.; Cheng, C.; Wei, X. Spatial variation of soil organic carbon density in the black soil region of Northeast China under the influence of erosion and deposition. J. Clean. Prod. 2024, 475, 143616. [Google Scholar] [CrossRef]
  13. Li, X.; Fan, H.; Wang, P.; Zhang, X.; Li, A.; Yang, X.; Zhang, G. Interactive effect of soil dispersity and rainfall intensity on splash erosion: Insights from laboratory tests. Catena 2024, 238, 107843. [Google Scholar] [CrossRef]
  14. Wang, N.; Zheng, Z.; Li, T.; He, S.; Zhang, X.; Wang, Y.; Yu, H.; Huang, H.; Ye, D. Soil surface roughness impacts erosion behavior through selective regulation of flow properties in rainfall-seepage scenarios. Soil Tillage Res. 2025, 246, 106350. [Google Scholar] [CrossRef]
  15. Wu, X.; Cai, C.; Li, D.; Zhou, J.; Zhang, W. Non-linear response of sediment size characteristics and associated transport patterns to soil structural stability in sheet erosion under field rainfall simulation. Catena 2023, 228, 107120. [Google Scholar] [CrossRef]
  16. Coban, O.; De Deyn, G.B.; van der Ploeg, M. Soil microbiota as game-changers in restoration of degraded lands. Science 2022, 375, abe0725. [Google Scholar] [CrossRef]
  17. Phillips, M.L.; McNellis, B.E.; Howell, A.; Lauria, C.M.; Belnap, J.; Reed, S.C. Biocrusts mediate a new mechanism for land degradation under a changing climate. Nat. Clim. Change 2022, 12, 71–76. [Google Scholar] [CrossRef]
  18. Chamizo, S.; Rodríguez-Caballero, E.; Román, J.R.; Cantón, Y. Effects of biocrust on soil erosion and organic carbon losses under natural rainfall. Catena 2017, 148, 117–125. [Google Scholar] [CrossRef]
  19. Zeng, Z.; Liu, D.D.; Dai, Q.H.; Zeng, J.; Jiang, J. Effects of moss patches on the sediment loss, flow hydraulics and surface microtopography of soil slopes in karst mountainous areas. Catena 2025, 249, 108672. [Google Scholar] [CrossRef]
  20. Guo, Q.; Wang, Z.L.; Shen, N. Plot-based study to evaluate raindrop detachment capacity on moss-dominated biocrusted slope under simulated rainfall with different intensities. Catena 2023, 226, 107084. [Google Scholar] [CrossRef]
  21. Reed, S.C.; Coe, K.K.; Sparks, J.P.; Housman, D.C.; Zelikova, T.J.; Belnap, J. Changes to dryland rainfall result in rapid moss mortality and altered soil fertility. Nat. Clim. Change 2012, 2, 752–755. [Google Scholar] [CrossRef]
  22. Wang, L.; Li, J.; Zhang, S.; Huang, Y.; Ouyang, Z.; Mai, Z. Biological soil crust elicits microbial community and extracellular polymeric substances restructuring to reduce the soil erosion on tropical island, South China Sea. Mar. Environ. Res. 2024, 197, 106449. [Google Scholar] [CrossRef]
  23. Yang, Y.; Zhang, Y.; Yu, X.; Jia, G. Soil microorganism regulated aggregate stability and rill erosion resistance under different land uses. Catena 2023, 228, 107176. [Google Scholar] [CrossRef]
  24. Li, C.; Chen, X.; Jia, Z.; Zhai, L.; Zhang, B.; Gruters, U.; Ma, S.; Qian, J.; Liu, X.; Zhang, J.; et al. Meta-analysis reveals the effects of microbial inoculants on the biomass and diversity of soil microbial communities. Nat. Ecol. Evol. 2024, 8, 1270–1284. [Google Scholar] [CrossRef]
  25. Sáez-Sandino, T.; García-Palacios, P.; Maestre, F.T.; Plaza, C.; Guirado, E.; Singh, B.K.; Wang, J.; Cano-Díaz, C.; Eisenhauer, N.; Gallardo, A.; et al. The soil microbiome governs the response of microbial respiration to warming across the globe. Nat. Clim. Change 2023, 13, 1382–1387. [Google Scholar] [CrossRef]
  26. Deng, Z.; Wang, J.; Yan, Y.; Wang, J.; Shao, W.; Wu, Z. Biochar-based Bacillus subtilis inoculants promote plant growth: Regulating microbial community to improve soil properties. J. Environ. Manag. 2024, 373, 123534. [Google Scholar] [CrossRef] [PubMed]
  27. Morris, E.K.; Morris, D.J.P.; Vogt, S.; Gleber, S.C.; Bigalke, M.; Wilcke, W.; Rillig, M.C. Visualizing the dynamics of soil aggregation as affected by arbuscular mycorrhizal fungi. ISME J. 2019, 13, 1639–1646. [Google Scholar] [CrossRef]
  28. Li, Z.; Kravchenko, A.N.; Cupples, A.; Guber, A.K.; Kuzyakov, Y.; Philip Robertson, G.; Blagodatskaya, E. Composition and metabolism of microbial communities in soil pores. Nat. Commun. 2024, 15, 3578. [Google Scholar] [CrossRef]
  29. Ruan, Z.; Chen, K.; Cao, W.; Meng, L.; Yang, B.; Xu, M.; Xing, Y.; Li, P.; Freilich, S.; Chen, C.; et al. Engineering natural microbiomes toward enhanced bioremediation by microbiome modeling. Nat. Commun. 2024, 15, 4694. [Google Scholar] [CrossRef]
  30. Liao, K.J.; Tao, Y.; Zeng, Y.Y.; Tu, J.W.; She, S.J.; Fu, Y.J.; Hou, L.H.; Chen, L.Z. A feasible method of induced biological soil crust propagation through the inoculation of moss and addition of soil amendments in a Pb-Zn tailing pond. Sci. Total Environ. 2024, 910, 168569. [Google Scholar] [CrossRef]
  31. Bittelli, M.; Andrenelli, M.C.; Simonetti, G.; Pellegrini, S.; Artioli, G.; Piccoli, I.; Morari, F. Shall we abandon sedimentation methods for particle size analysis in soils? Soil Tillage Res. 2019, 185, 36–46. [Google Scholar] [CrossRef]
  32. Karup, D.; Moldrup, P.; Tuller, M.; Arthur, E.; de Jonge, L.W. Prediction of the soil water retention curve for structured soil from saturation to oven-dryness. Eur. J. Soil Sci. 2017, 68, 57–65. [Google Scholar] [CrossRef]
  33. Jones, D.L.; Willett, V.B. Experimental evaluation of methods to quantify dissolved organic nitrogen (DON) and dissolved organic carbon (DOC) in soil. Soil Biol. Biochem. 2006, 38, 991–999. [Google Scholar] [CrossRef]
  34. Sadeghi, S.H.; Najafinejad, A.; Gharemahmudli, S.; Darki, B.Z.; Behbahani, A.M.; Kheirfam, H. Reduction in soil loss caused by a freeze-thaw cycle through inoculation of endemic soil microorganisms. Appl. Soil Ecol. 2021, 157, 103770. [Google Scholar] [CrossRef]
  35. Xiao, Z.X.; Hou, R.J.; Li, T.X.; Meng, F.X.; Fu, Q.; Li, M.; Liu, D.; Ji, Y.; Dong, S.Q. Mechanism of microbial inhibition of rainfall erosion in black soil area, as a soil structure builder. Soil Tillage Res. 2023, 233, 105819. [Google Scholar] [CrossRef]
  36. Liu, Y.P.; Jia, R.L.; Wang, W.F.; Wan, Y.C.; Gao, Y.H.; Zhan, H.T.; Ren, J.; Chen, Z.; Qiu, F.; Zhu, J. Vascular plant communities and biocrusts act as controlling factors in mitigating soil erosion on the Great Wall in a semi-humid area of Northwestern China. Sci. Total Environ. 2024, 918, 170515. [Google Scholar] [CrossRef]
  37. Sun, F.H.; Xiao, B.; Tuller, M. Multifaceted impacts of moss-dominated biocrusts on dryland soils: From soil pore structure to aeration and water infiltration. Catena 2024, 236, 107755. [Google Scholar] [CrossRef]
  38. Vaezi, A.R.; Sadeghian, N.; Cerdà, A. Particle size distribution of sediment detached from rills under raindrop impact in semi-arid soils. J. Hydrol. 2020, 590, 125317. [Google Scholar] [CrossRef]
  39. Gharemahmudli, S.; Sadeghi, S.H.; Najafinejad, A.; Darki, B.Z.; Behbahani, A.M.; Kheirfam, H. Controlling enhanced surface runoff components as a result of a freezing-thawing cycle by inoculating soil bacteria and cyanobacteria. Soil Tillage Res. 2024, 237, 105989. [Google Scholar] [CrossRef]
  40. Gao, L.Q.; Bowker, M.A.; Sun, H.; Zhao, J.; Zhao, Y.G. Linkages between biocrust development and water erosion and implications for erosion model implementation. Geoderma 2020, 357, 113973. [Google Scholar] [CrossRef]
  41. Sun, F.H.; Xiao, B.; Kidron, G.J. Towards the influences of three types of biocrusts on soil water in drylands: Insights from horizontal infiltration and soil water retention. Geoderma 2022, 428, 116136. [Google Scholar] [CrossRef]
  42. Wang, W.; Li, M.Y.; Zhou, R.; Mo, F.; Wang, B.Z.; Zhu, L.; Tao, H.Y.; Zhu, Y.; Wang, W.L.; Zhao, Z.Y.; et al. Moss-dominated biocrust-based biodiversity enhances carbon sequestration via water interception and plant-soil-microbe interactions. Iscience 2023, 26, 105773. [Google Scholar] [CrossRef] [PubMed]
  43. Ng, C.W.W.; Peprah-Manu, D. Pore structure effects on the water retention behaviour of a compacted silty sand soil subjected to drying-wetting cycles. Eng. Geol. 2023, 313, 106963. [Google Scholar] [CrossRef]
Figure 1. Flow chart of the test. Note: (a) Experimental soil preparation, showing the process of preparing the test soil. (b) Layered soil filling, the process of filling the test soil into the flume according to predetermined requirements. (c) Preparation and cultivation process of the Bacillus subtilis inoculant used in the experiment. (d) Cryogenic moss samples used in the experiment. (e) Process of inoculating the prepared Bacillus subtilis inoculant (surface spraying) and cryogenic moss inoculum (surface spreading) onto the soil surface of the flumes. (fh) State of the three different experimental treatment groups after inoculation and cultivation, corresponding to the bacteria-only group, moss-only group, and bacteria–moss group, respectively. (i) Process of conducting simulated rainfall erosion tests on the treatment groups according to the experimental design.
Agriculture 15 01465 g001
Figure 2. Soil texture distribution map. Note: CK: mean values from three replicates each for the 3°, 6°, 9° treatments. A: mean values from three replicates each for the 3°, 6°, 9° treatments. B: mean values from three replicates each for the 3°, 6°, 9° treatments. C: mean values from three replicates each for the 3°, 6°, 9° treatments.
Agriculture 15 01465 g002
Figure 3. Soil particle size distribution of different treatments. Note: Gaussian model fitting of soil particle size distribution under different treatments: 3° slope (ac); 6° slope (df); 9° slope (gi). CK3, CK6, CK9: mean values for 3°, 6°, 9° slopes (control). A3, A6, A9: mean values for 3°, 6°, 9° slopes (Treatment A). B3, B6, B9: mean values for 3°, 6°, 9° slopes (Treatment B). C3, C6, C9: mean values for 3°, 6°, 9° slopes (Treatment C). The particle size axis in Figure 2 uses a logarithmic scale.
Agriculture 15 01465 g003
Figure 4. Characteristic curves of soil moisture for different treatments (n = 1.5). Note: In Figure 4, ψ represents soil water potential, the negative pressure of water in the soil (kPa), with the scale presented logarithmically; volumetric water content: cm3·cm−3; θfc: field capacity (cm3·cm−3), the volumetric soil water content at a suction of −33 kPa; θwp: permanent wilting point (cm3·cm−3), the volumetric soil water content at a suction of −1500 kPa; n: pore size distribution parameter. Model goodness of fit: the coefficient of determination R2 for all treatments exceeded 0.97.
Agriculture 15 01465 g004
Figure 5. Comparison of total soil porosity and bound water capacity under different treatments. Note: In Figure 5, TP represents total porosity (cm3·cm−3), the proportion of pore volume to total volume; θr: residual water content (cm3·cm−3), the portion of water content retained in the soil under specific conditions that is difficult for plants to absorb or further remove.
Agriculture 15 01465 g005
Figure 6. Soil carbon dynamics of different treatments. (a) Soil soluble organic carbon content at a 3° slope; (b) Soil soluble organic carbon content at a 6° slope; (c) Soil soluble organic carbon content at a 9° slope; (d) Soil microbial biomass carbon content at a 3° slope; (e) Soil microbial biomass carbon content at a 6° slope; (f) Soil microbial biomass carbon content at a 9° slope.
Agriculture 15 01465 g006
Figure 7. Runoff and soil erosion under 70 mm·h−1 rainfall intensity under different treatments. Soil loss is calculated as a cumulative value over time intervals, and runoff is a cumulative curve over time intervals.
Agriculture 15 01465 g007
Figure 8. Runoff and soil erosion under 120 mm·h−1 rainfall intensity under different treatments. Soil loss is calculated as a cumulative value over time intervals, and runoff is a cumulative curve over time intervals.
Agriculture 15 01465 g008
Figure 9. Surface morphology after rainfall erosion with different treatment histories.
Agriculture 15 01465 g009
Figure 10. Effect of RDA-based soil physicochemical indicators on rainfall erosion. Note: RV: runoff volume; SL: soil loss; SC: sediment concentration; Xc: particle size distribution centroid; w: peak width; A: peak area; θs: saturated water content; α: inverse of air-entry pressure parameter; DEI: drainage efficiency index (DEI = θs − θ(−10 kPa)); soil aggregate stability indicators: MWD, GMD, WR0.25, PAD, D; DOC: soil dissolved organic carbon; MBC: soil microbial biomass carbon.
Agriculture 15 01465 g010
Table 1. Experimental programme settings.
Treatment GroupInoculation
Treatment
SlopeRainfall IntensityProcess
Description
Sample Size
Bacillus subtilis treatment group (A)3 L m−2 Bacillus subtilis culture solution70 mm·h−1, 120 mm·h−1A33
70 mm·h−1, 120 mm·h−1A63
70 mm·h−1, 120 mm·h−1A93
Moss treatment group (B)0.6 kg m−2 moss (fresh weight)70 mm·h−1, 120 mm·h−1B33
70 mm·h−1, 120 mm·h−1B63
70 mm·h−1, 120 mm·h−1B93
Moss + Bacillus subtilis treatment group (C)3 L m−2 Bacillus subtilis culture solution, 0.6 kg m−2 moss (fresh weight)70 mm·h−1, 120 mm·h−1C33
70 mm·h−1, 120 mm·h−1C63
70 mm·h−1, 120 mm·h−1C93
Control group
(CK)
3 L m−2 sterile water70 mm·h−1, 120 mm·h−1CK33
70 mm·h−1, 120 mm·h−1CK63
70 mm·h−1, 120 mm·h−1CK93
Table 2. Parameters of Gaussian formula for curve fitting under different treatments.
Modeling Parametersxc (μm)w (μm)A (%·μm)R2
CK36.812 ± 0.314 e6.571 ± 0.653 c70.55 ± 8.321 d0.82
A314.793 ± 0.762 bc16.67 ± 1.748 ab142.723 ± 19.822 bc0.79
B314.358 ± 0.474 bc12.415 ± 1.042 b169.776 ± 17.455 b0.88
C311.841 ± 0.714 cd12.821 ± 1.578 b122.134 ± 19.221 c0.74
CK68.695 ± 0.360 e8.913 ± 0.767 c83.757 ± 8.835 d0.85
A610.528 ± 0.477 d10.934 ± 1.031 bc126.479 ± 14.972 c0.83
B68.000 ± 0.231 e7.979 ± 0.488 c100.452 ± 7.437 cd0.92
C619.618 ± 1.437 ab23.490 ± 3.560 a206.061 ± 43.733 a0.75
CK911.775 ± 0.577 c13.475 ± 1.301 b114.288 ± 14.109 c0.82
A917.175 ± 1.136 b19.982 ± 2.702 a194.228 ± 35.763 ab0.70
B911.669 ± 0.823 c13.47 ± 1.862 b108.209 ± 19.097 cd0.69
C926.92 ± 1.797 a31.978 ± 4.971 a260.702 ± 60.691 a0.71
Average value of the same treatment
CK9.094 ± 1.4479.653 ± 2.05389.531 ± 13.1210.83
A14.165 ± 1.94515.862 ± 2.709154.476 ± 20.8760.77
B11.342 ± 1.86311.288 ± 1.652126.145 ± 21.5360.83
C19.459 ± 4.37622.763 ± 5.883196.299 ± 42.8790.78
T-test<0.01<0.01<0.01
Note: Each data point represents the mean value of three replicates ± standard deviation. CK: mean value from nine replicates (CK3, CK6, CK9). A: mean value from nine replicates (A3, A6, A9). B: Mean value from nine replicates (B3, B6, B9). C: mean value from nine replicates (C3, C6, C9). Xc: position of the particle size center, characterizing the most representative dominant particle size fraction in the soil. w: peak width, quantifying the distribution range of the dominant particle size fraction. A: peak area, representing the overall volume proportion of particles in the dominant size fraction. R2: goodness of fit of the model to the measured data; R2 > 0.7 is considered credible. Different lowercase letters within the same column indicate significant differences between treatments at p < 0.05; the same letters indicate no significant difference. T-Test: paired t-test between Treatment A, Treatment B, Treatment C, and CK; p < 0.01 indicates a significant difference.
Table 3. Indicators of water-stable soil aggregates in different treatments.
TreatmentsMWD (mm)GWD (mm)WR0.25 (%)PAD (%)D
CK30.38 ± 0.04 e0.27 ± 0.02 ef35.81 ± 2.41 a37.08 ± 2.64 a2.51 ± 0.01 a
A30.67 ± 0.04 b0.35 ± 0.02 bc49.41 ±1.49 bcd29.02 ± 2.56 bc2.49 ± 0.02 ab
B30.48 ± 0.02 c0.32 ± 0.03 cd44.34 ± 0.31 e29.36 ± 0.43 bc2.50 ± 0.01 ab
C30.84 ± 0.02 a0.47 ± 0.01 a52.72 ± 3.53 ab22.07 ± 3.92 de2.43 ± 0.02 c
CK60.34 ± 0.03 e0.24 ± 0.03 f37.68 ± 2.18 a33.72 ± 3.41 ab2.51 ± 0.01 a
A60.65 ± 0.04 b0.36 ± 0.02 bc51.15 ± 1.32 ab26.51 ± 2.93 cd2.49 ± 0.03 ab
B60.46 ± 0.06 cd0.30 ± 0.01 de46.74 ±1.39 cde25.55 ±1.63 cde2.50 ± 0.01 ab
C60.83 ± 0.03 a0.47 ± 0.01 a53.92 ± 2.27 a20.24 ± 2.78 e2.43 ± 0.02 c
CK90.39 ± 0.05 de0.27 ± 0.02 ef36.15 ± 1.14 a36.42 ± 0.88 a2.50 ± 0.03 ab
A90.66 ± 0.02 b0.39 ± 0.02 b50.21 ±1.29 abc27.85 ±2.89 bcd2.48 ± 0.02 ab
B90.47 ± 0.04 c0.31 ± 0.01 de46.01 ± 0.90 de26.69 ± 2.12 cd2.50 ± 0.03 ab
C90.80 ± 0.02 a0.46 ± 0.01 a51.72 ± 1.91 ab23.45 ± 0.40 cde2.45 ± 0.07 bc
Average value of the same treatment
CK0.37 ± 0.040.26 ± 0.0236.55 ± 1.9135.74 ± 2.312.51 ± 0.02
A0.66 ± 0.030.37 ± 0.0250.26 ± 1.3727.79 ± 2.802.49 ± 0.02
B0.47 ± 0.040.31 ± 0.0145.70 ± 0.8727.20 ± 1.402.50 ± 0.01
C0.82 ± 0.030.46 ± 0.0152.79 ± 2.5721.92 ± 3.372.43 ± 0.04
T-test<0.01<0.01<0.01<0.01<0.01
Note: Each data point represents the mean value of three replicates ± standard deviation. CK: mean value from nine replicates (CK3, CK6, CK9). A: mean value from nine replicates (A3, A6, A9). B: mean value from nine replicates (B3, B6, B9). C: mean value from nine replicates (C3, C6, C9). MWD: mean weight diameter; GMD: geometric mean diameter; WR0.25: water-stable aggregates > 0.25 mm content; PAD: percentage of aggregate destruction; D: fractal dimension, calculated based on the mass–size relationship of the aggregate size distribution. Different lowercase letters within the same column indicate significant differences between treatments at p < 0.05; the same letters indicate no significant difference. T-Test: paired t-test between Treatment A, Treatment B, Treatment C, and CK; p < 0.01 indicates a significant difference.
Table 4. Parameters characterizing soil moisture (n = 1.5).
Treatmentsθs
(cm3·cm−3)
θr
(cm3·cm−3)
FC
(cm3·cm−3)
PWP
(cm3·cm−3)
PAWC
(cm3·cm−3)
a (kPa−1)
CK30.519 ± 0.012 a0.113 ± 0.007 de0.312 ± 0.016 ab0.261 ± 0.005 ab0.051 ± 0.004 bc0.100 ± 0.023 a
A30.431 ± 0.006 bd0.152 ± 0.006 a0.337 ± 0.008 a0.285 ± 0.001 a0.052 ± 0.009 bc0.028 ± 0.006 c
B30.473 ± 0.009 b0.103 ± 0.004 ef0.29 ± 0.008 bc0.238 ± 0.004 bc0.052 ± 0.007 bc0.100 ± 0.017 a
C30.431 ± 0.010 cd0.131 ± 0.007 bc0.312 ± 0.008 ab0.256 ± 0.002 b0.056 ± 0.005 bc0.054 ± 0.015 bc
CK60.517 ± 0.014 a0.102 ± 0.007 ef0.313 ± 0.008 ab0.253 ± 0.007 b0.060 ± 0.005 a0.100 ± 0.026 a
A60.427 ± 0.006 cd0.142 ± 0.006 ab0.336 ± 0.003 ac0.235 ± 0.004 bc0.101 ± 0.006 ab0.024 ± 0.005 c
B60.477 ± 0.014 bc0.096 ± 0.006 f0.288 ± 0.007 b0.209 ± 0.005 c0.079 ± 0.010 bc0.100 ± 0.026 a
C60.431 ± 0.008 cd0.129 ± 0.006 cd0.317 ± 0.004 ab0.258 ± 0.005 b0.059 ± 0.001 bc0.045 ± 0.011 bc
CK90.508 ± 0.017 a0.090 ± 0.009 f0.296 ± 0.006 bc0.244 ± 0.005 bc0.052 ± 0.002 bc0.100 ± 0.031 a
A90.426 ± 0.006 cd0.167 ± 0.005 a0.322 ± 0.014 ab0.275 ± 0.006 a0.047 ± 0.005 c0.051 ± 0.011 bc
B90.455 ± 0.015 bc0.098 ± 0.007 f0.269 ± 0.021 c0.227 ± 0.007 c0.042 ± 0.007 c0.100 ± 0.031 a
C90.421 ± 0.006 d0.121 ± 0.005 de0.307 ± 0.016 ab0.250 ± 0.008 b0.057 ± 0.004 bc0.042 ± 0.008 c
Average value of the same treatment
CK0.515 ± 0.005 a0.102 ± 0.011 ab0.307 ± 0.008 b0.253 ± 0.008 ab0.054 ± 0.004 b0.100 ± 0.002 a
A0.428 ± 0.003 c0.154 ± 0.012 a0.332 ± 0.007 a0.265 ± 0.024 a0.067 ± 0.027 a0.034 ± 0.014 b
B0.468 ± 0.011 b0.099 ± 0.003 ab0.282 ± 0.010 c0.225 ± 0.013 c0.058 ± 0.017 b0.100 ± 0.011 a
C0.428 ± 0.005 c0.127 ± 0.005 ab0.312 ± 0.005 b0.255 ± 0.004 a0.057 ± 0.001 b0.047 ± 0.006 b
Note: Each data point represents the mean of three replicates ± standard deviation. CK: mean of nine replicates (CK3, CK6, CK9), A: mean of nine replicates (A3, A6, A9), B: mean of nine replicates (B3, B6, B9), C: mean of nine replicates (C3, C6, C9). Different lowercase letters within the same column indicate significant differences between treatments at p < 0.05, while the same letters indicate no significant difference; ψ: soil water potential (kPa); θs: saturated water content (cm3·cm−3), volumetric soil water content at ψ = 0 kPa; θr: residual water content (cm3·cm−3), volumetric soil water content at ψ = −∞ kPa; FC: field capacity, volumetric soil water content at a suction of −33 kPa; PWP: permanent wilting point, volumetric soil water content at a suction of −1500 kPa; PAWC: plant-available water capacity (cm3·cm−3), the difference between field capacity and permanent wilting point; α: inverse of air-entry pressure (kPa−1), a parameter related to soil pore size distribution; n: pore size distribution parameter. Different lowercase letters within the same column indicate significant differences between treatments at p < 0.05, while the same letters indicate no significant difference.
Table 5. Hydrological statistics under 70 mm·h−1 rainfall intensity for different treatments.
TreatmentSoil Loss
(g)
Runoff Volume
(L)
Infiltration Volume
(L)
Sediment Concentration (g·L−1)
CK3121.17 ± 3.15 c7.44 ± 1.44 b17.24 ± 1.98 bc16.29 ± 1.51 a
A323.83 ± 1.48 f5.05 ± 0.86 c19.11 ± 2.24 b4.72 ± 0.25 b
B38.28 ± 0.77 i4.01 ± 0.65 c21.10 ± 1.85 a2.07 ± 0.25 c
C35.21 ± 0.70 j4.59 ± 0.19 c19.15 ± 1.91 b1.13 ± 0.11 d
CK6195.84 ± 5.19 b13.11 ± 1.12 a14.18 ± 1.87 c14.94 ± 1.01 a
A638.39 ± 3.45 e9.86 ± 1.01 b17.45 ± 1.49 bc3.90 ± 0.55 b
B619.27 ± 1.10 g5.95 ± 0.25 c19.15 ± 3.44 b3.24 ± 0.07 c
C614.92 ± 0.85 h5.91 ± 0.99 c17.76 ± 2.74 bc2.52 ± 0.20 d
CK9380.88 ± 5.95 a30.99 ± 2.55 a11.42 ± 1.64 c12.29 ± 1.05 a
A954.23 ± 3.96 d18.16 ± 1.31 b9.15 ± 1.29 d2.99 ± 0.33 c
B930.84 ± 1.48 g11.50 ± 1.01 b12.98 ± 1.45 c2.68 ± 0.05 c
C922.38 ± 2.18 h10.93 ± 1.54 b10.01 ± 1.08 c2.05 ± 0.11 c
Note: Each treatment was replicated three times. CK3, CK6, CK9 represent the mean values for the control (CK) at slopes of 3°, 6°, and 9°, respectively; A3, A6, A9 represent the mean values for Treatment A at slopes of 3°, 6°, and 9°, respectively; B3, B6, B9 represent the mean values for Treatment B at slopes of 3°, 6°, and 9°, respectively; C3, C6, C9 represent the mean values for Treatment C at slopes of 3°, 6°, and 9°, respectively. Different lowercase letters within the same column indicate significant differences between treatments at p < 0.05, while the same letters indicate no significant difference.
Table 6. Hydrological statistics under 120 mm·h−1 rainfall intensity for different treatments.
TreatmentSoil Loss
(g)
Runoff Volume
(L)
Infiltration Volume
(L)
Sediment Concentration (g·L−1)
CK3465.02 ± 8.15 d16.62 ± 3.10 c24.41 ± 2.83 c27.98 ± 1.81 a
A386.41 ± 4.23 h10.83 ± 1.25 d21.78 ± 1.19 d7.98 ± 0.15 d
B327.14 ± 1.57 k6.94 ± 0.44 e29.51 ± 2.18 a3.91 ± 0.06 f
C315.13 ± 1.10 i5.45 ± 0.28 e24.70 ± 2.05 c2.78 ± 0.04 g
CK6582.85 ± 9.16 b27.41 ± 3.19 b23.76 ± 1.43 c21.26 ± 1.05 b
A6112.3 ± 2.08 g17.12 ± 2.65 c20.54 ± 1.65 d6.56 ± 0.25 e
B645.81 ± 2.16 j7.41 ± 1.10 e27.92 ± 4.18 ab6.18 ± 0.13 e
C622.28 ± 1.53 k6.97 ± 0.83 e22.45 ± 2.75 cd3.20 ± 0.03 f
CK9712.94 ± 10.50 a37.46 ± 3.64 a23.61 ± 2.06 c19.03 ± 1.41 c
A9141.51 ± 5.74 f24.83 ± 2.79 b20.27 ± 1.46 d5.70 ± 0.11 e
B965.73 ± 4.45 i14.22 ± 1.16 d25.76 ± 3.11 bc4.62 ± 0.09 f
C942.16 ± 2.77 j9.32 ± 0.85 de22.64 ± 3.66 cd4.53 ± 0.28 f
Note: Each treatment was replicated three times. CK3, CK6, CK9 represent the mean values for the control (CK) at slopes of 3°, 6°, and 9°, respectively; A3, A6, A9 represent the mean values for Treatment A at slopes of 3°, 6°, and 9°, respectively; B3, B6, B9 represent the mean values for Treatment B at slopes of 3°, 6°, and 9°, respectively; C3, C6, C9 represent the mean values for Treatment C at slopes of 3°, 6°, and 9°, respectively. Different lowercase letters within the same column indicate significant differences between treatments at p < 0.05, while the same letters indicate no significant difference.
Table 7. Spearman correlation coefficient between soil parameters and rainfall erosion indices.
Soil ParametersRVSLSC
Xc−0.378−0.469−0.497
w−0.175−0.252−0.280
A−0.420−0.510−0.517
a0.3620.4470.497
us0.3380.4230.423
DEI0.0040.0630.105
MWD−0.671 *−0.741 **−0.769 **
GMD−0.649 *−0.709 **−0.709 **
WR0.25−0.594 *−0.657 *−0.643 *
PAD0.699 *0.720 **0.657 *
D0.5440.619 *0.623 *
D0C−0.923 **−0.923 **−0.853 **
MBC−0.874 **−0.871 **−0.793 **
Note: RV: runoff volume; SL: soil loss; SC: sediment concentration; Xc: particle size distribution centroid; w: peak width; A: peak area; θs: saturated water content; α: inverse of air-entry pressure parameter; DEI: drainage efficiency index (DEI = θₛ − θ(−10 kPa)); soil aggregate stability indicators: MWD, GMD, WR0.25, PAD, D; DOC: soil dissolved organic carbon; MBC: soil microbial biomass carbon. * Significant at p < 0.05 level; ** Significant at p < 0.01 level.
Disclaimer/Publisher’s Note: The statements, opinions and data contained in all publications are solely those of the individual author(s) and contributor(s) and not of MDPI and/or the editor(s). MDPI and/or the editor(s) disclaim responsibility for any injury to people or property resulting from any ideas, methods, instructions or products referred to in the content.

