
Subsidy Policy Interactions in Agricultural Supply Chains: An Interdepartmental Coordination Perspective


Abstract
1. Introduction
- Under various subsidy policies and their combinations, how are the decisions of supply chain members (supplier, platform) and the government (higher-level department) formulated, and what are the resulting impacts on social welfare, stakeholder profits, and departmental utility?
- What are the differential impacts of various subsidy policies on the respective performance indicators of the two competing government departments?
- How can the higher-level department optimally allocate its budget across different subsidy combinations to improve key outcomes, such as social welfare and overall supply chain performance?
2. Literature Review
2.1. Subsidy Programs
2.2. Agricultural Supply Chain
2.3. Interdepartmental Coordination Within Government
3. Model Setup and Assumptions
3.1. Model Setup
3.2. Model Assumptions
4. Model Solving and Discussions
4.1. Discussions
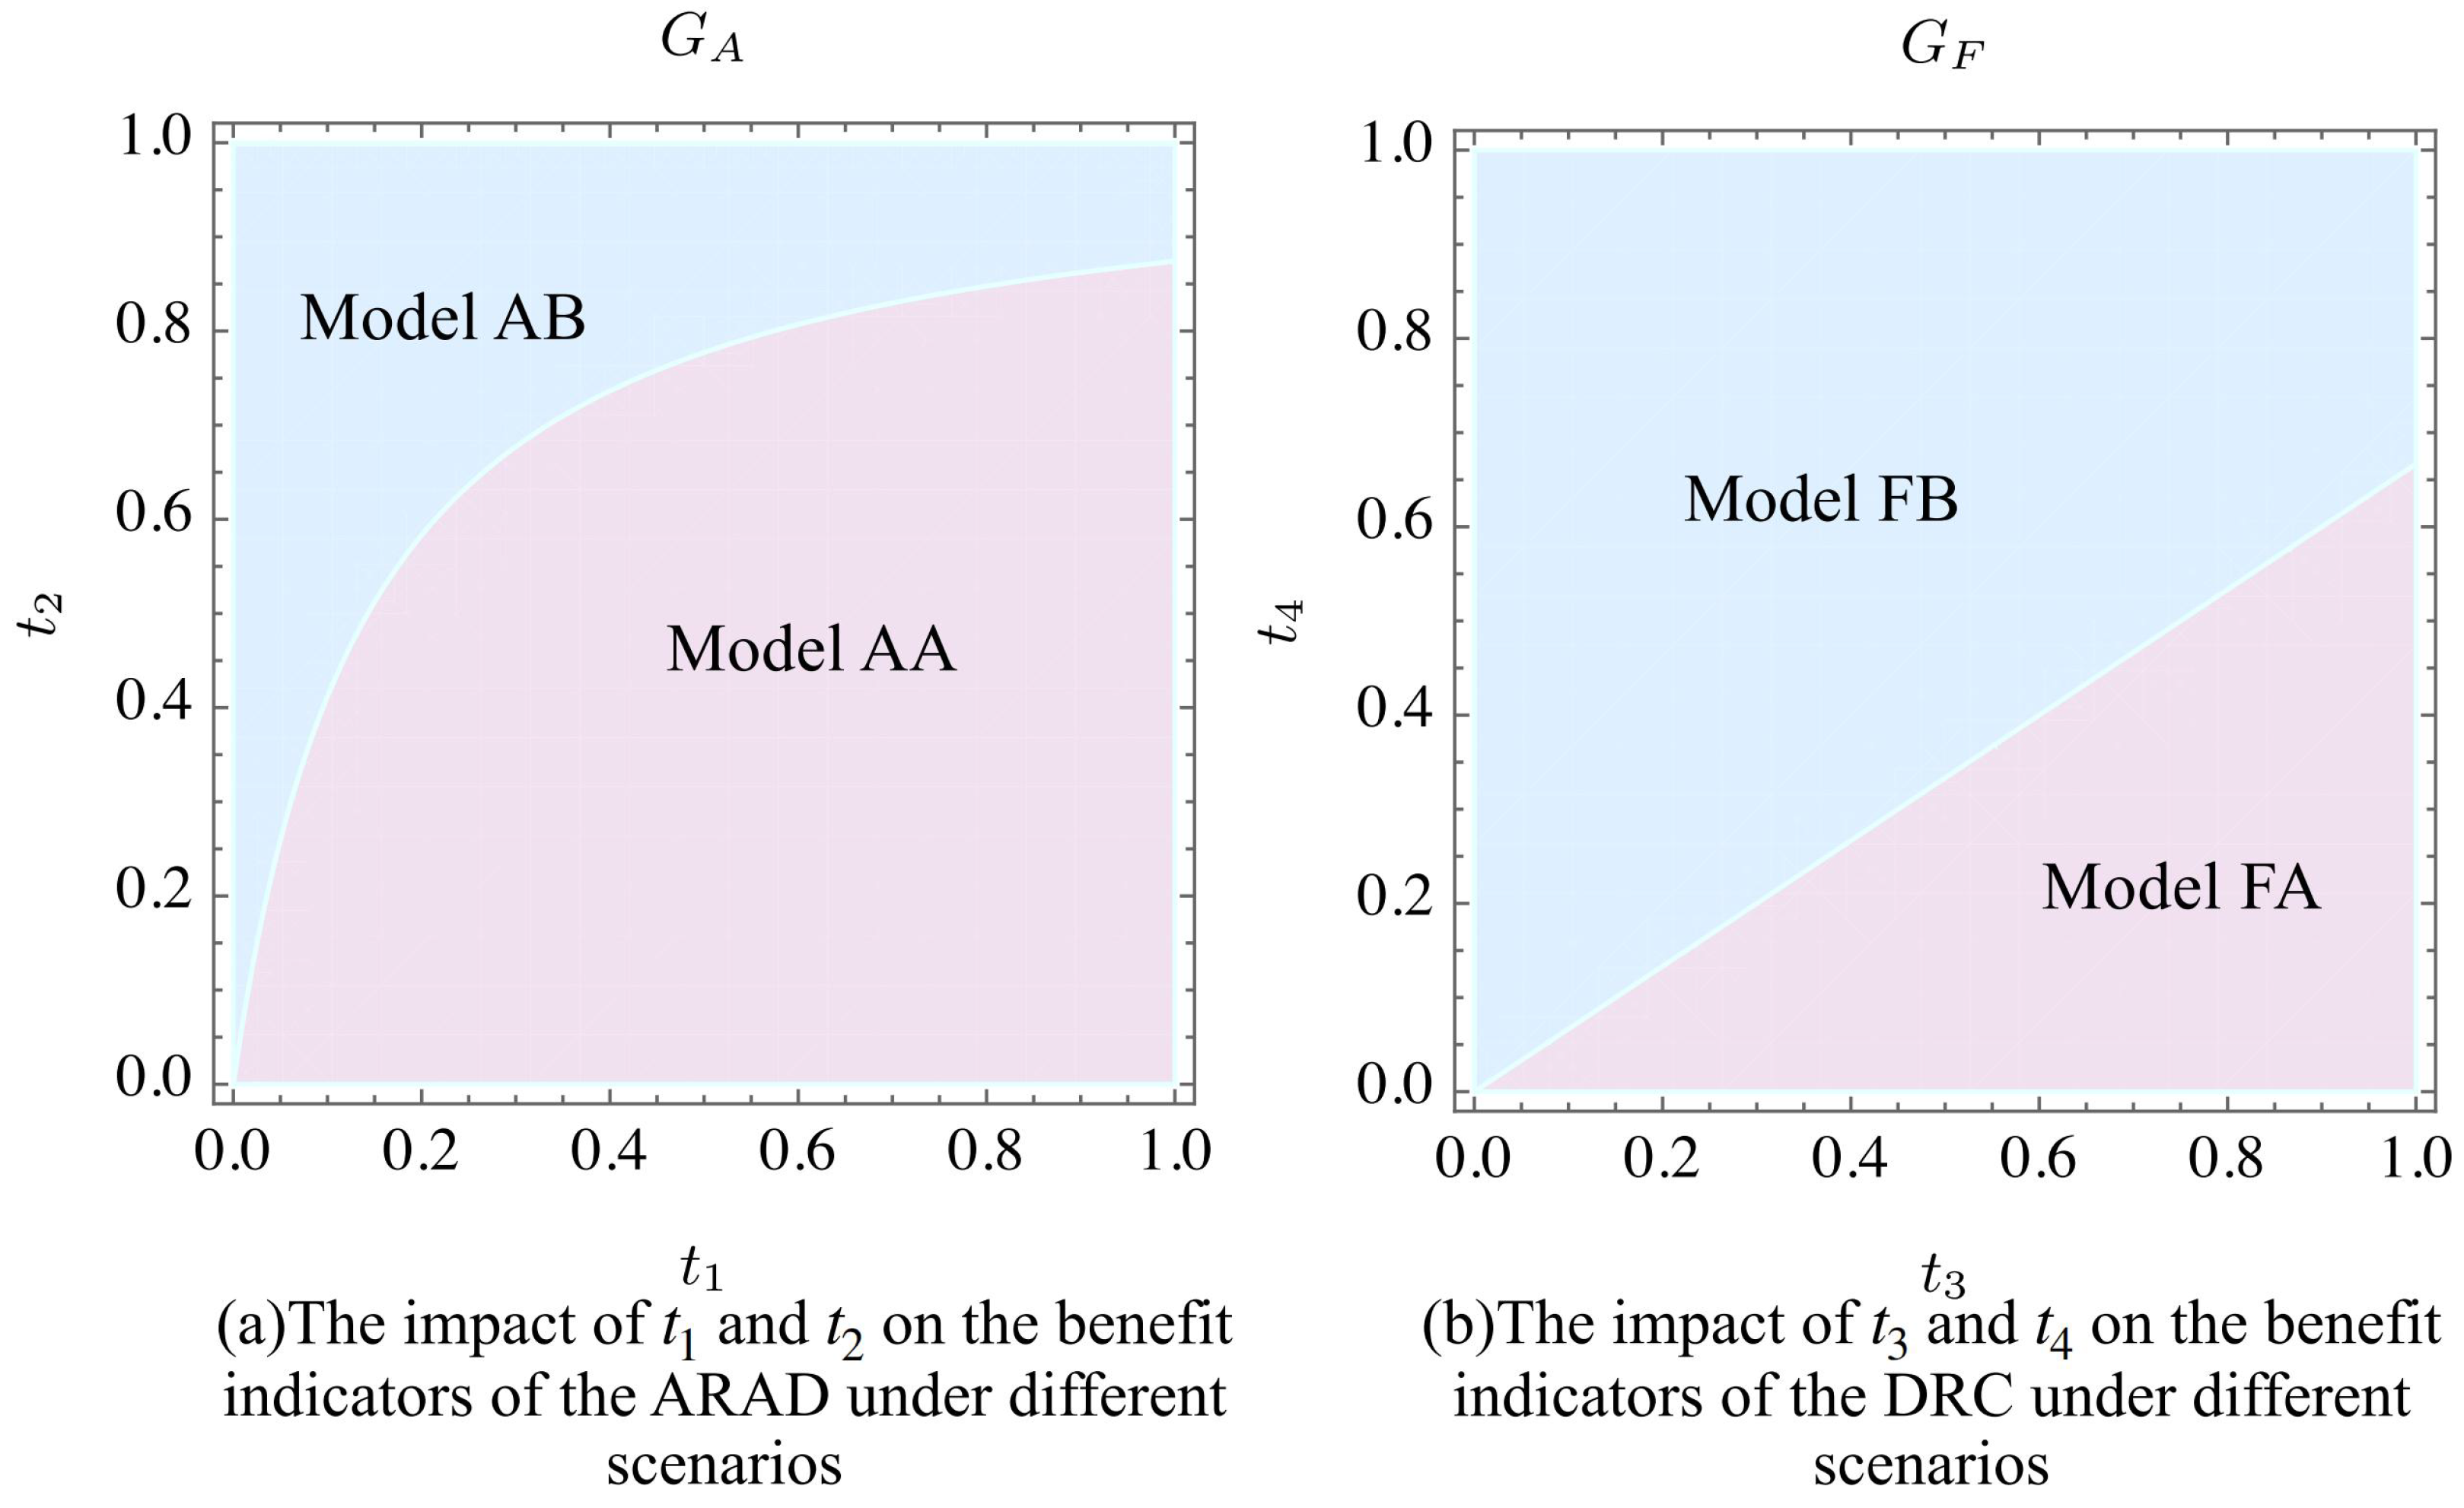
4.1.1. A Comparison Between Model AA and Model AB
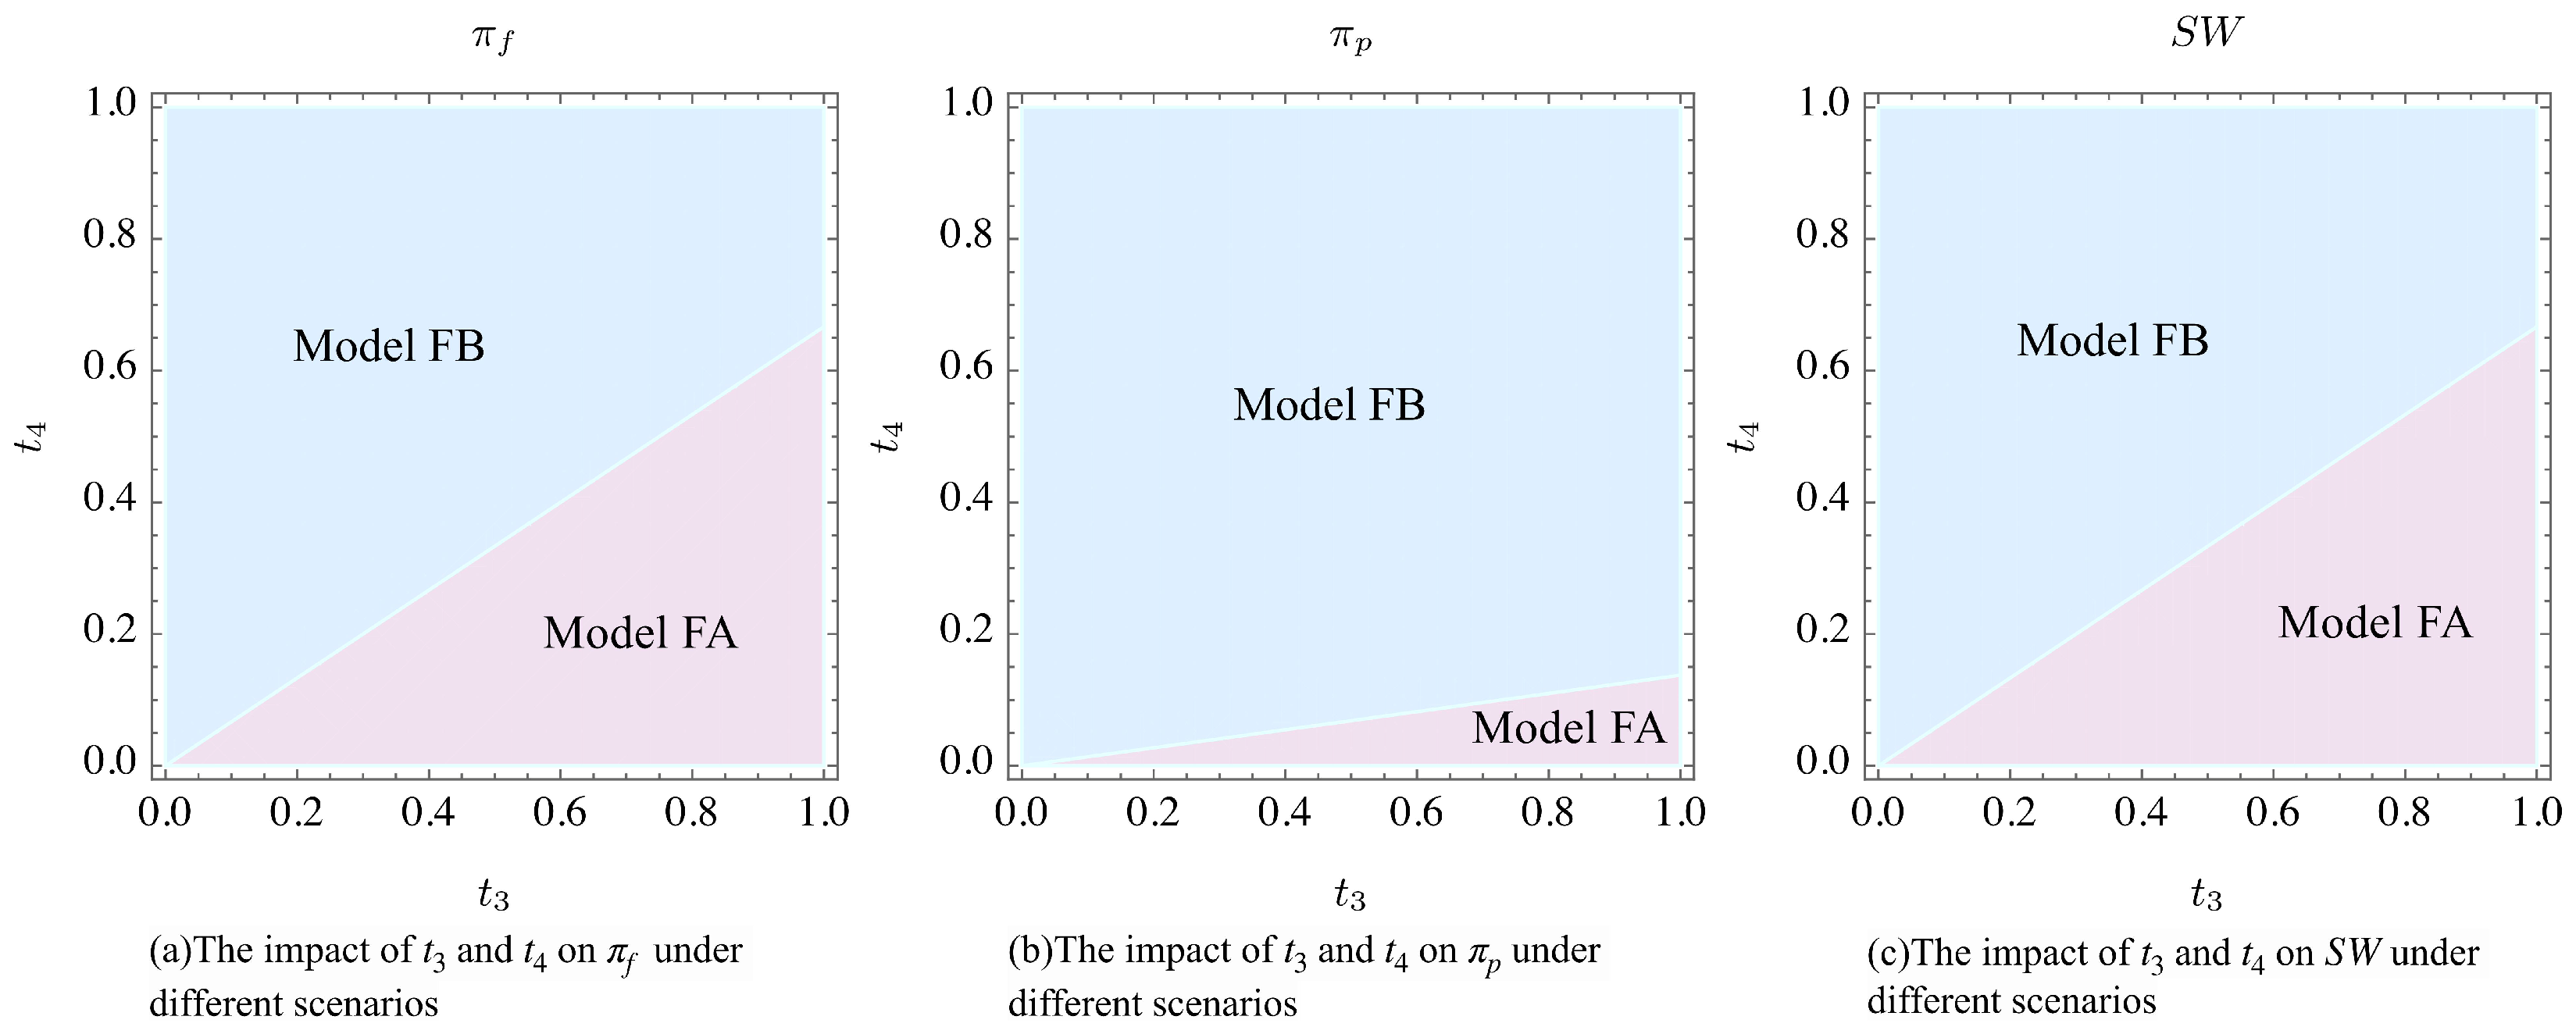
4.1.2. A Comparison Between Model FA and Model FB
5. Interdepartmental Coordination Within Government
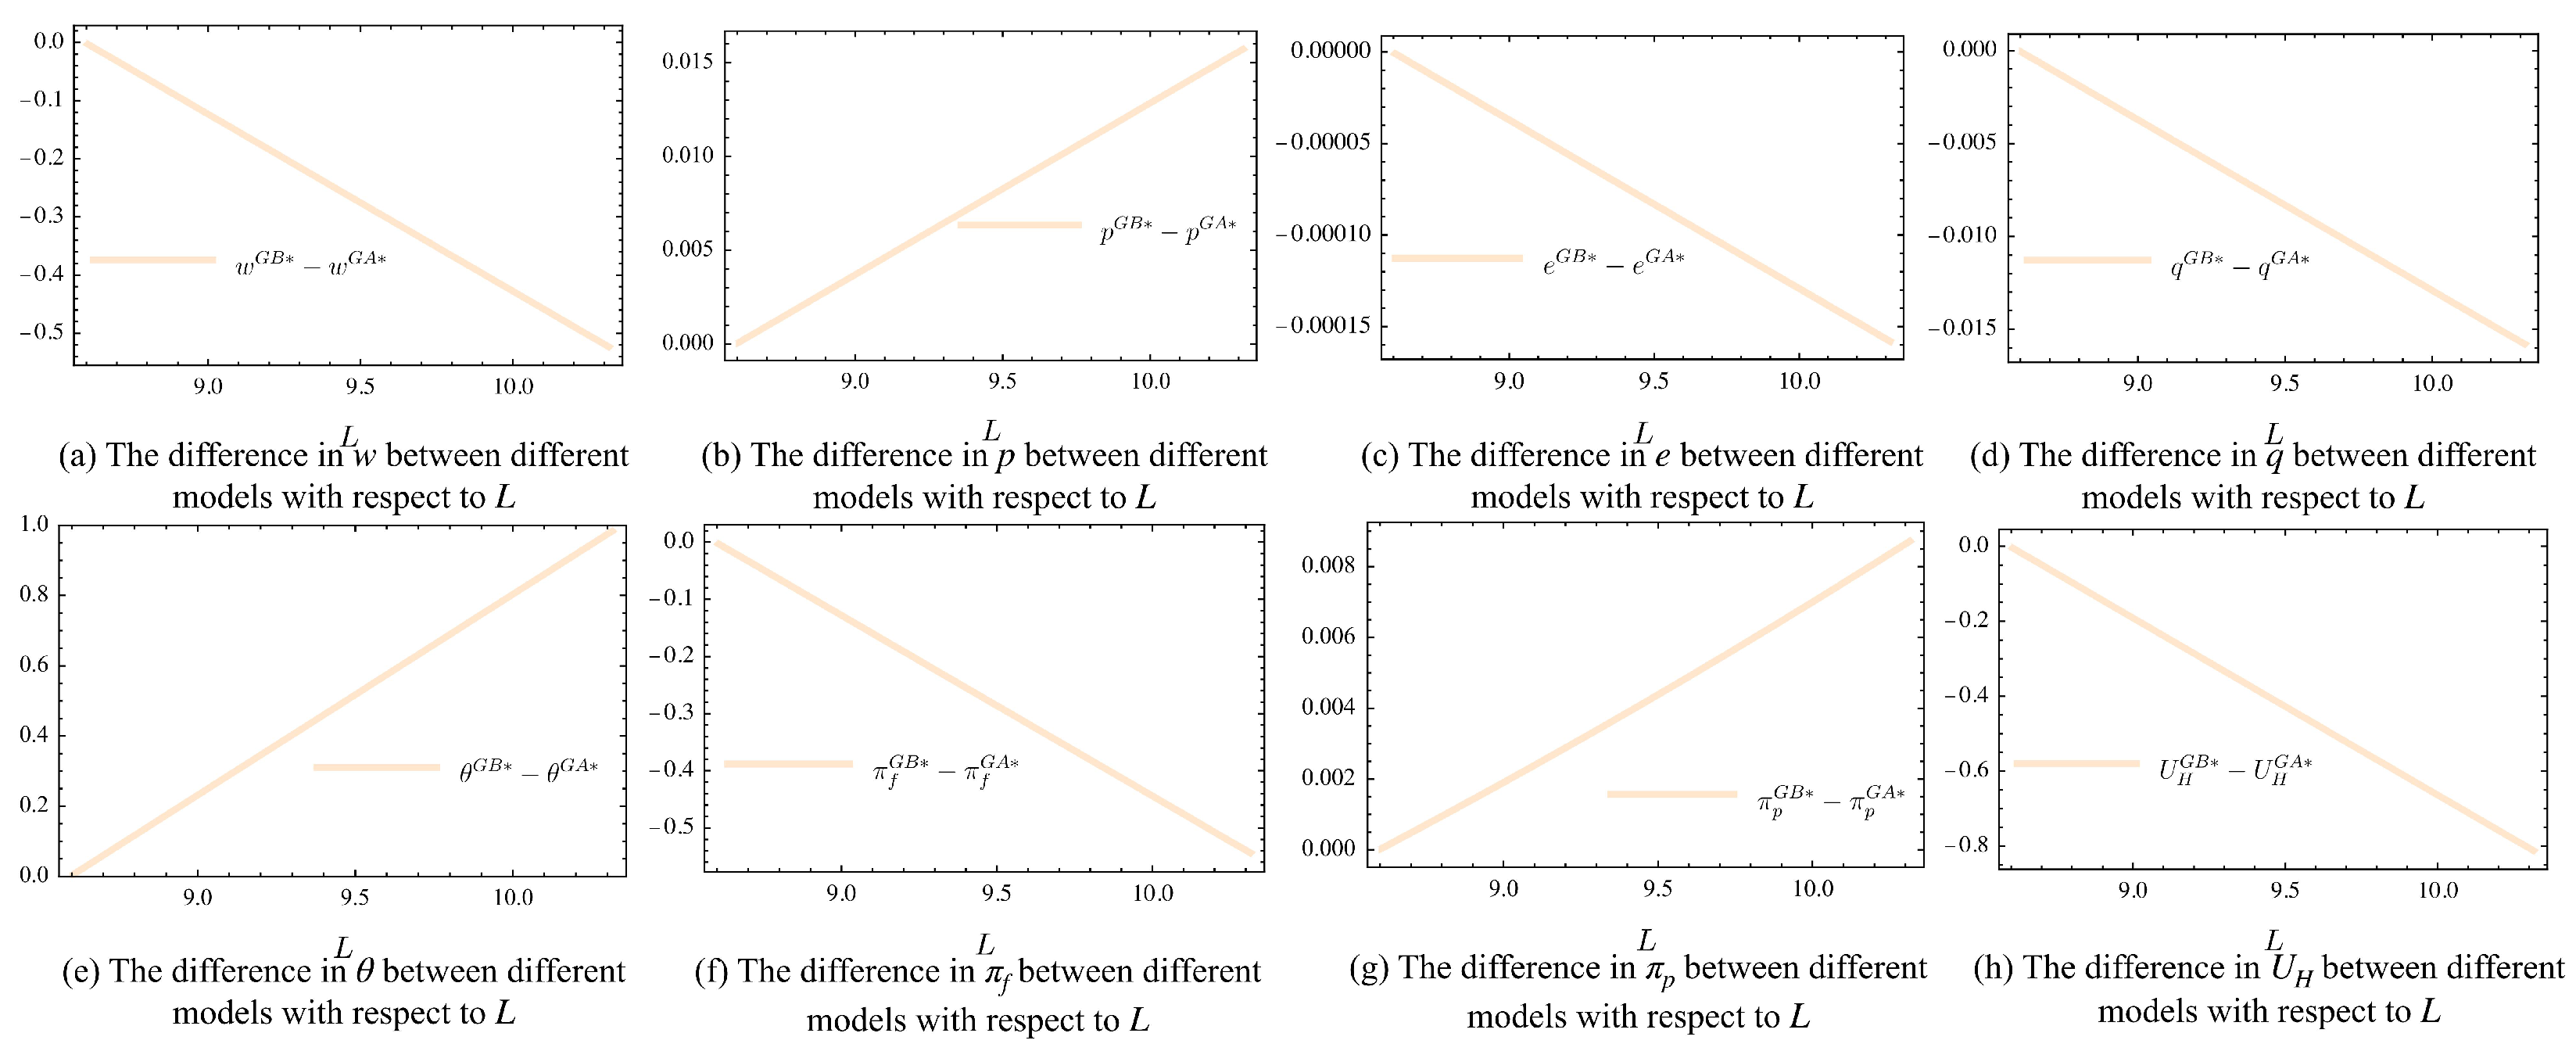
A Comparison Between Model GA and Model GB
6. Analysis
6.1. Impact of Subsidy Rate Interactions on Supply Chain Members’ Profits and Social Welfare Under the Scenario of Providing a Single Subsidy
6.2. Comparison of Performance Indicators
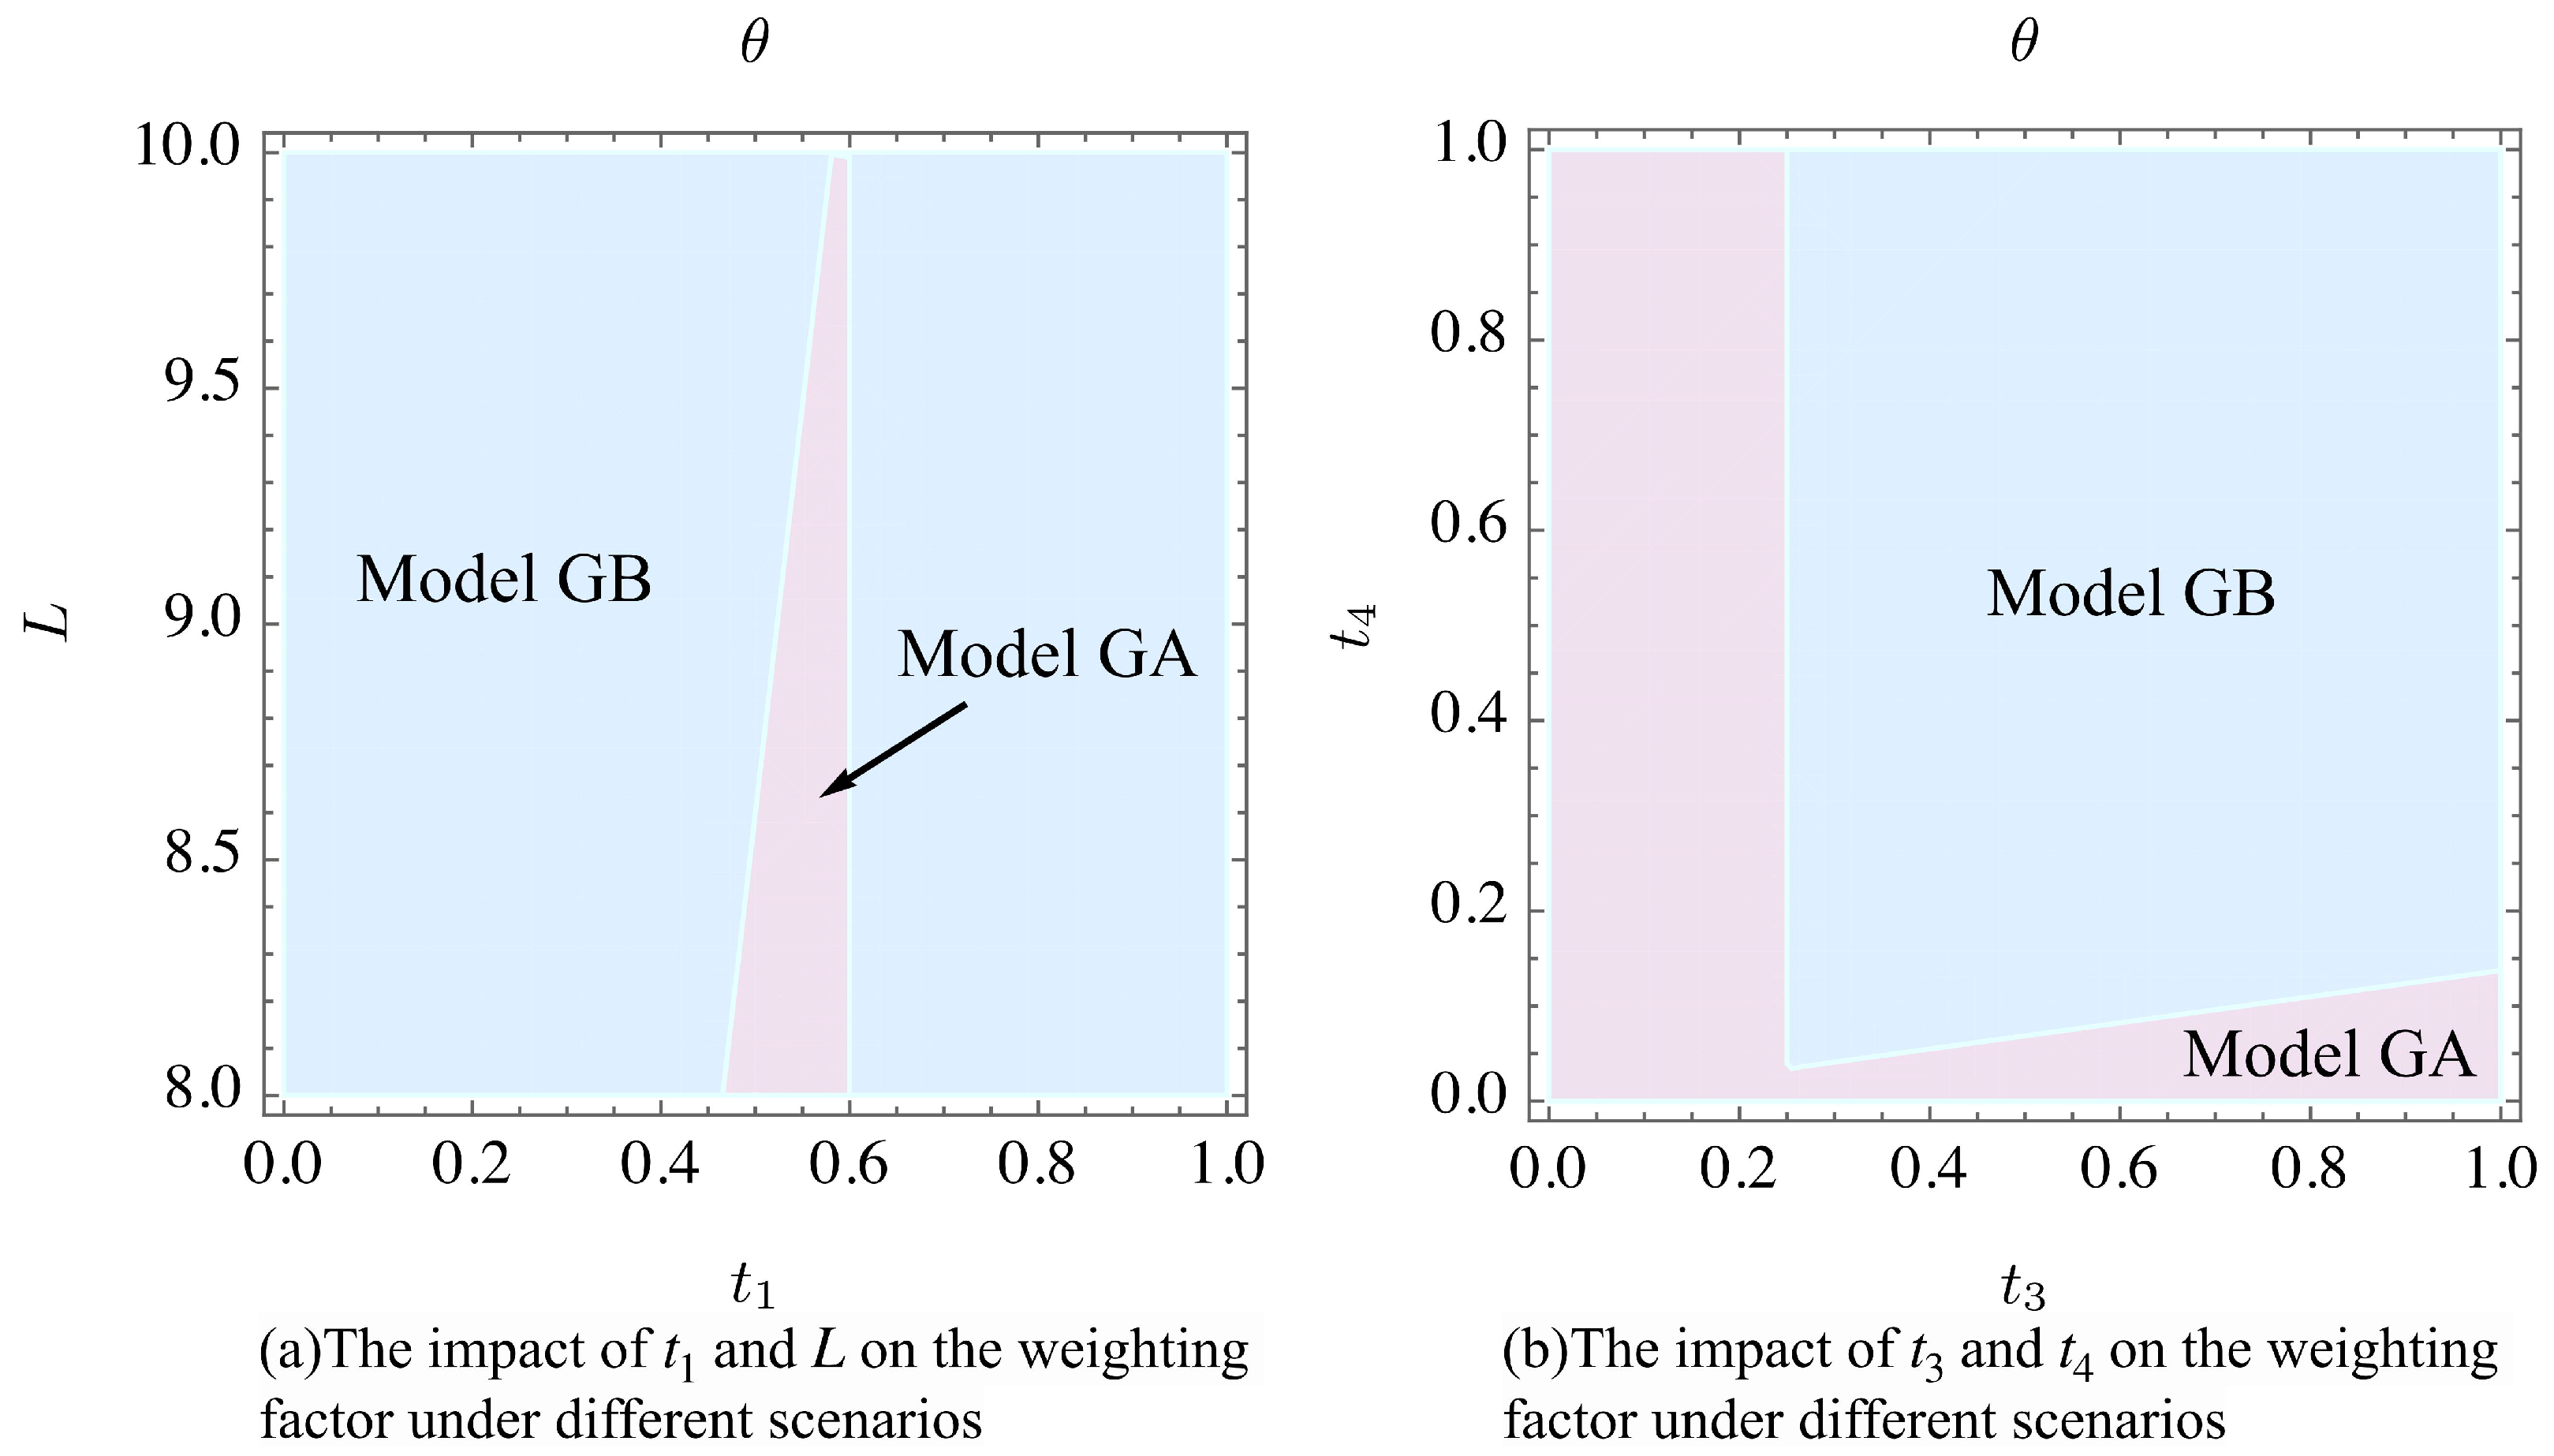
6.3. Analysis of Weighting Factors
6.4. Extended Analysis
7. Discussion
8. Concluding Remarks
8.1. Conclusions
8.2. Management Implications
8.3. Limitations and Future Research
Supplementary Materials
Author Contributions
Funding
Institutional Review Board Statement
Data Availability Statement
Acknowledgments
Conflicts of Interest
Abbreviations
| ARAD | Agriculture and Rural Affairs Department |
| DRC | Development and Reform Commission |
| GDP | Gross Domestic Product |
References
- Chintapalli, P.; Tang, C.S. Crop minimum support price versus cost subsidy: Farmer and consumer welfare. Prod. Oper. Manag. 2022, 31, 1753–1769. [Google Scholar] [CrossRef]
- Fan, T.; Feng, Q.; Li, Y.; Shanthikumar, J.G.; Wu, Y. Output-Oriented Agricultural Subsidy Design. Manag. Sci. 2024, 70, 1448–1464. [Google Scholar] [CrossRef]
- National Development and Reform Commission of the People’s Republic of China. Land Transfer is an Effective Way to Promote Large-Scale and Intensive Agricultural Operations. 2008. Available online: https://www.ndrc.gov.cn/xwdt/gdzt/ncgg/200810/t20081013_1199891_ext.html (accessed on 27 October 2024).
- China Youth Daily. Contract Breaches and Abandoned Cultivation in Land Transfers Appear in Multiple Locations in Hebei, Affecting Thousands of Acres. 2015. Available online: https://china.huanqiu.com/article/9CaKrnJK8Lr (accessed on 27 October 2024).
- Bandinelli, R.; Fani, V.; Rinaldi, R. Customer acceptance of NFC technology: An exploratory study in the wine industry. Int. J. RF Technol. Res. Appl. 2017, 8, 1–16. [Google Scholar] [CrossRef]
- Tongren Municipal Bureau of Agriculture and Rural Affairs. Agricultural Policies for the Benefit of the People. 2024. Available online: http://nw.trs.gov.cn/zfxxgk/fdzdgknr/zcwj_5765512/202307/t20230721_81123167.html (accessed on 27 October 2024).
- Sumner, D.A. Agricultural Subsidy Programs. In The Concise Encyclopedia of Economics; Liberty Fund, Inc.: Carmel, IN, USA, 2008; Available online: https://www.econlib.org/library/Enc/AgriculturalSubsidyPrograms.html (accessed on 27 October 2024).
- Pauw, K. A Review of the Ghana Planting for Food and Jobs Program: 2017–2020: Implementation, Impact, and Further Analysis; GSSP Working Paper 53; International Food Policy Research Institute (IFPRI): Washington, DC, USA, 2021. [Google Scholar] [CrossRef]
- Wuhan Economic and Technological Development Zone Bureau of Agriculture and Rural Affairs. Notice on the Issuance of the 2024 Implementation Plan for the Construction of Agricultural Product Warehousing, Preservation, and Cold Chain Logistics Facilities. 2024. Available online: https://www.whkfq.gov.cn/xxgk/fdzdgk/fzgh/guihuajihua/202405/t20240521_2404942.html (accessed on 27 October 2024).
- India Filings. Subsidy in India for Setting up Cold-Chain. 2024. Available online: https://www.indiafilings.com/learn/subsidy-india-setting-cold-chain/ (accessed on 27 October 2024).
- Yunnan Provincial Development and Reform Commission. Notice on the Application for the 2023 Provincial Special Funds for New Infrastructure Construction (Blockchain Direction). 2023. Available online: https://yndrc.yn.gov.cn/html/2023/tongzhigonggao_0928/13363.html (accessed on 27 October 2024).
- Shandong Provincial Development and Reform Commission. Notice on the Issuance of Four Implementation Rules Including the Implementation Rules for Projects Supported by the Provincial Service Industry Development Guidance Fund (Trial). 2023. Available online: http://fgw.shandong.gov.cn/art/2023/9/20/art_91673_10413803.html (accessed on 27 October 2024).
- UK Government. UK Innovation Strategy: Leading the Future by Creating It. 2023. Available online: https://www.gov.uk/government/publications/uk-innovation-strategy-leading-the-future-by-creating-it/uk-innovation-strategy-leading-the-future-by-creating-it-accessible-webpage (accessed on 27 October 2024).
- K-DISC. Accelerated Blockchain Competency Development Programme. Available online: https://kdisc.kerala.gov.in/en/project-2/accelerated-blockchain-competency-development-programme/ (accessed on 27 October 2024).
- Hoekman, B.; Ng, F.; Olarreaga, M. Agricultural tariffs or subsidies: Which are more important for developing economies? World Bank Econ. Rev. 2004, 18, 175–204. [Google Scholar] [CrossRef]
- Anderson, K.; Martin, W.; van der Mensbrugghe, D. Doha merchandise trade reform: What is at stake for developing countries? World Bank Econ. Rev. 2006, 20, 169–195. [Google Scholar] [CrossRef]
- Bekkerman, A.; Belasco, E.J.; Smith, V.H. Does Farm Size Matter? Distribution of Crop Insurance Subsidies and Government Program Payments across US Farms. Appl. Econ. Perspect. Policy 2019, 41, 498–518. [Google Scholar] [CrossRef]
- Frick, F.; Sauer, J. Deregulation and Productivity: Empirical Evidence on Dairy Production. Am. J. Agric. Econ. 2018, 100, 354–378. [Google Scholar] [CrossRef]
- Sheng, Y.; Ding, J.; Huang, J. The Relationship between Farm Size and Productivity in Agriculture: Evidence from Maize Production in Northern China. Am. J. Agric. Econ. 2019, 101, 790–806. [Google Scholar] [CrossRef]
- Cui, J.; Lapan, H.; Moschini, G.; Cooper, J. Welfare Impacts of Alternative Biofuel and Energy Policies. Am. J. Agric. Econ. 2011, 93, 1235–1256. [Google Scholar] [CrossRef]
- Taylor, T.A.; Xiao, W. Donor Product-Subsidies to Increase Consumption: Implications of Consumer Awareness and Profit-Maximizing Intermediaries. Prod. Oper. Manag. 2019, 28, 1757–1772. [Google Scholar] [CrossRef]
- Kazaz, B.; Webster, S.; Yadav, P. Interventions for an Artemisinin-based Malaria Medicine Supply Chain. Prod. Oper. Manag. 2016, 25, 1576–1600. [Google Scholar] [CrossRef]
- Hussain, J.; Lee, C.C.; Chen, Y. Optimal green technology investment and emission reduction in emissions generating companies under the support of green bond and subsidy. Technol. Forecast. Soc. Change 2022, 183, 121952. [Google Scholar] [CrossRef]
- Li, Z.; Pan, Y.; Yang, W.; Ma, J.; Zhou, M. Effects of government subsidies on green technology investment and green marketing coordination of supply chain under the cap-and-trade mechanism. Energy Econ. 2021, 101, 105426. [Google Scholar] [CrossRef]
- Yu, J.J.; Tang, C.S.; Sodhi, M.S.; Knuckles, J. Optimal Subsidies for Development Supply Chains. Manuf. Serv. Oper. Manag. 2020, 22, 1131–1147. [Google Scholar] [CrossRef]
- Wu, G.; Yang, W.; Hou, X.; Tian, Y. Agri-food supply chain under live streaming and government subsidies: Strategy selection of subsidy recipients and sales agreements. Comput. Ind. Eng. 2023, 185, 109647. [Google Scholar] [CrossRef]
- Lan, C.; Lan, Y.; Liu, S. Pricing strategy of traceable agricultural supply chain decisions considering retailer’s overconfidence with government subsidy. Alex. Eng. J. 2025, 112, 487–495. [Google Scholar] [CrossRef]
- Fan, X.; Zhang, Y.; Xue, J.; Cao, Y. Exploring the path to the sustainable development of cold chain logistics for fresh agricultural products in China. Environ. Impact Assess. Rev. 2024, 108, 107610. [Google Scholar] [CrossRef]
- Yan, B.; Chen, X.; Cai, C.; Guan, S. Supply chain coordination of fresh agricultural products based on consumer behavior. Comput. Oper. Res. 2020, 123, 105038. [Google Scholar] [CrossRef]
- Yu, L.; Tian, B. Supply chain strategic behavior and coordination with a risk-averse manufacturer under random yield and demand. Int. J. Prod. Econ. 2025, 281, 109492. [Google Scholar] [CrossRef]
- Bian, Y.; Yan, S.; Yi, Z.; Guan, X.; Chen, Y.J. Quality Certification in Agricultural Supply Chains: Implications from Government Information Provision. Prod. Oper. Manag. 2022, 31, 1456–1472. [Google Scholar] [CrossRef]
- Levi, R.; Singhvi, S.; Zheng, Y. Economically Motivated Adulteration in Farming Supply Chains. Manag. Sci. 2020, 66, 209–226. [Google Scholar] [CrossRef]
- Chintapalli, P.; Tang, C.S. The Value and Cost of Crop Minimum Support Price: Farmer and Consumer Welfare and Implementation Cost. Manag. Sci. 2021, 67, 6839–6861. [Google Scholar] [CrossRef]
- Pinghan, L.; Nan, G. Real Political Power Structure and Local Government Behavior: Theory and Empirical Study. Econ. Res. J. 2017, 52, 135–150. [Google Scholar]
- Li Feiyue, Z.D.; Mingxing, L. Distribution of De Facto Political Power and Regional Economic Growth:the Long-run Effects of China’s Revolutionary war. Econ. Res. J. 2014, 49, 45–59. [Google Scholar]
- Mengchao, Y.; Ying, Q. Government Power Delegation and the Policy Burden of State-Owned Enterprises. Econ. Anal. Policy 2025, 85, 912–927. [Google Scholar] [CrossRef]
- Feeney, M.K.; Camarena, L. Gender, Race, and Diversity Values Among Local Government Leaders. Rev. Public Pers. Adm. 2021, 41, 105–131. [Google Scholar] [CrossRef]
- Zheng, X.; Wang, Y.; Zhang, L. Coordination between Government Departments and the Allocation of Public Resources: Theory and Empirical Evidence. Econ. Res. J. 2019, 54, 24–40. [Google Scholar]
- Qian, J.; Mok, K.H. Dual Decentralization and Fragmented Authoritarianism in Governance: Crowding Out among Social Programmes in China. Public Adm. Dev. 2016, 36, 185–197. [Google Scholar] [CrossRef]
- Gilli, M.; Li, Y.; Qian, J. Logrolling under fragmented authoritarianism: Theory and evidence from China. Public Choice 2018, 175, 197–214. [Google Scholar] [CrossRef]
- Communist Party Member Network. Outline of the 14th Five-Year Plan for National Economic and Social Development and the Long-Range Objectives Through the Year 2035 of the People’s Republic of China. Available online: https://www.12371.cn/special/ssw2035/. (accessed on 27 October 2024).
- Alizamir, S.; Iravani, F.; Mamani, H. An Analysis of Price vs. Revenue Protection: Government Subsidies in the Agriculture Industry. Manag. Sci. 2019, 65, 32–49. [Google Scholar] [CrossRef]
- Arya, A.; Mittendorf, B. Supply Chain Consequences of Subsidies for Corporate Social Responsibility. Prod. Oper. Manag. 2015, 24, 1346–1357. [Google Scholar] [CrossRef]
- Cui, Y.; Hu, M.; Liu, J. Value and Design of Traceability-Driven Blockchains. Manuf. Serv. Oper. Manag. 2023, 25, 1099–1116. [Google Scholar] [CrossRef]
- Dong, L.; Jiang, P.P.; Xu, F. Impact of Traceability Technology Adoption in Food Supply Chain Networks. Manag. Sci. 2023, 69, 1518–1535. [Google Scholar] [CrossRef]
- Wu, X.Y.; Pu, X.; Fan, Z.P. Blockchain technology adoption strategies of a supply chain considering possible product defects. Int. J. Prod. Res. 2024. [CrossRef]
- Yun, J.; Wei, L. Cross-border fresh produce supply chain: Production decision-making, tax & subsidy policy, and social welfare. Syst.-Eng.-Theory Pract. 2023, 43, 3587–3607. [Google Scholar]
- Yu, Y.; Xiao, T. Analysis of cold-chain service outsourcing modes in a fresh agri-product supply chain. Transp. Res. Part E Logist. Transp. Rev. 2021, 148, 102264. [Google Scholar] [CrossRef]
- Zhongxin Online Business Channel. Meicai.com Breaks Traditional Models by Building an Efficient Cold Chain Logistics System. 2023. Available online: https://baijiahao.baidu.com/s?id=1761576665721913700&wfr=spider&for=pc (accessed on 27 October 2024).
- Cold Chain Circulation Public Information Service Platform. Total Investment of 1.5 Billion! JD.com’s First County-Level Cold Chain Warehouse Lands in Chengwu; Frozen Food Giants Eye the Tea Drink Market. 2024. Available online: https://mp.weixin.qq.com/s?__biz=MzU2NTY1MzU0OA==&mid=2247531671&idx=1&sn=73a70027a8d6f2b5a0f15c1710fc13c3 (accessed on 27 October 2024).
- Silverstein, S. Walmart to Test Refrigerated Boxes that Store Grocery Deliveries Outside Homes. 2021. Available online: https://www.supplychaindive.com/news/walmart-refrigerated-grocery-delivery-HomeValet-Arkansas/593310/ (accessed on 27 October 2024).
- Wu, Q.; Mu, Y.; Feng, Y. Coordinating contracts for fresh product outsourcing logistics channels with power structures. Int. J. Prod. Econ. 2015, 160, 94–105. [Google Scholar] [CrossRef]
- Yang, L.; Tang, R. Comparisons of sales modes for a fresh product supply chain with freshness-keeping effort. Transp. Res. Part E Logist. Transp. Rev. 2019, 125, 425–448. [Google Scholar] [CrossRef]
- U.S. Department of Agriculture. 2022 United States Department of Agriculture Annual Performance Plan. Available online: https://www.usda.gov/sites/default/files/documents/fy22-annual-performance-plan.pdf (accessed on 27 October 2024).
- Department for Environment, Food and Rural Affairs. Environmental Key Performance Indicators: Reporting Guidelines for UK Business. Available online: https://assets.publishing.service.gov.uk/media/5a797b1740f0b642860d878c/pb11321-envkpi-guidelines-060121.pdf (accessed on 27 October 2024).
- Yueyang County Bureau of Agriculture and Rural Affairs. Self-Evaluation Report on the Overall Expenditure Performance of the Yueyang County Bureau of Agriculture and Rural Affairs for 2020. 2021. Available online: https://www.yyx.gov.cn/37584/38146/38297/content_1848995.html (accessed on 27 October 2024).
- People’s Government of Jianghua Yao Autonomous County. Performance Evaluation Report on the Overall Expenditure of the County Bureau of Agriculture and Rural Affairs for 2023. 2024. Available online: http://www.jh.gov.cn/jh/caizjxpj/202407/5b9a672310c043eb9967c6548135997d.shtml (accessed on 27 October 2024).
- Wanzai County Development and Reform Commission. Performance Evaluation Report on the Overall Expenditure of the Wanzai County Development and Reform Commission for 2020. 2021. Available online: http://www.wanzai.gov.cn/wzxrmzf/ysjxfgw/202107/b549f1f6582b4fb2915121825c15ea4d.shtml (accessed on 27 October 2024).
- Linli County Development and Reform Bureau. Self-Evaluation Report on the Overall Expenditure Performance of the Linli County Development and Reform Bureau for 2023. 2024. Available online: https://www.linli.gov.cn/zwgk/public/6616604/2151641211.html (accessed on 27 October 2024).
- Ministry of Agriculture and Rural Affairs of the People’s Republic of China. Reply to Suggestion No. 3016 of the First Session of the 14th National People’s Congress. 2023. Available online: http://www.moa.gov.cn/govpublic/CWS/202307/t20230718_6432396.htm (accessed on 27 October 2024).
- Cao, Y.; Yi, C.; Wan, G.; Hu, H.; Li, Q.; Wang, S. An analysis on the role of blockchain-based platforms in agricultural supply chains. Transp. Res. Part E Logist. Transp. Rev. 2022, 163, 102731. [Google Scholar] [CrossRef]


| Subsidy Programs in This Study | Representative Policies from Different Countries | Affiliated Department |
|---|---|---|
| Production subsidies | China [6], USA [7], Ghana [8] | ARAD |
| Cold-chain logistics investment subsidies | China [9], India [10] | ARAD |
| Platform operation cost subsidies | China [11] | DRC |
| Blockchain technology subsidies | China [12], UK [13], India [14] | DRC |
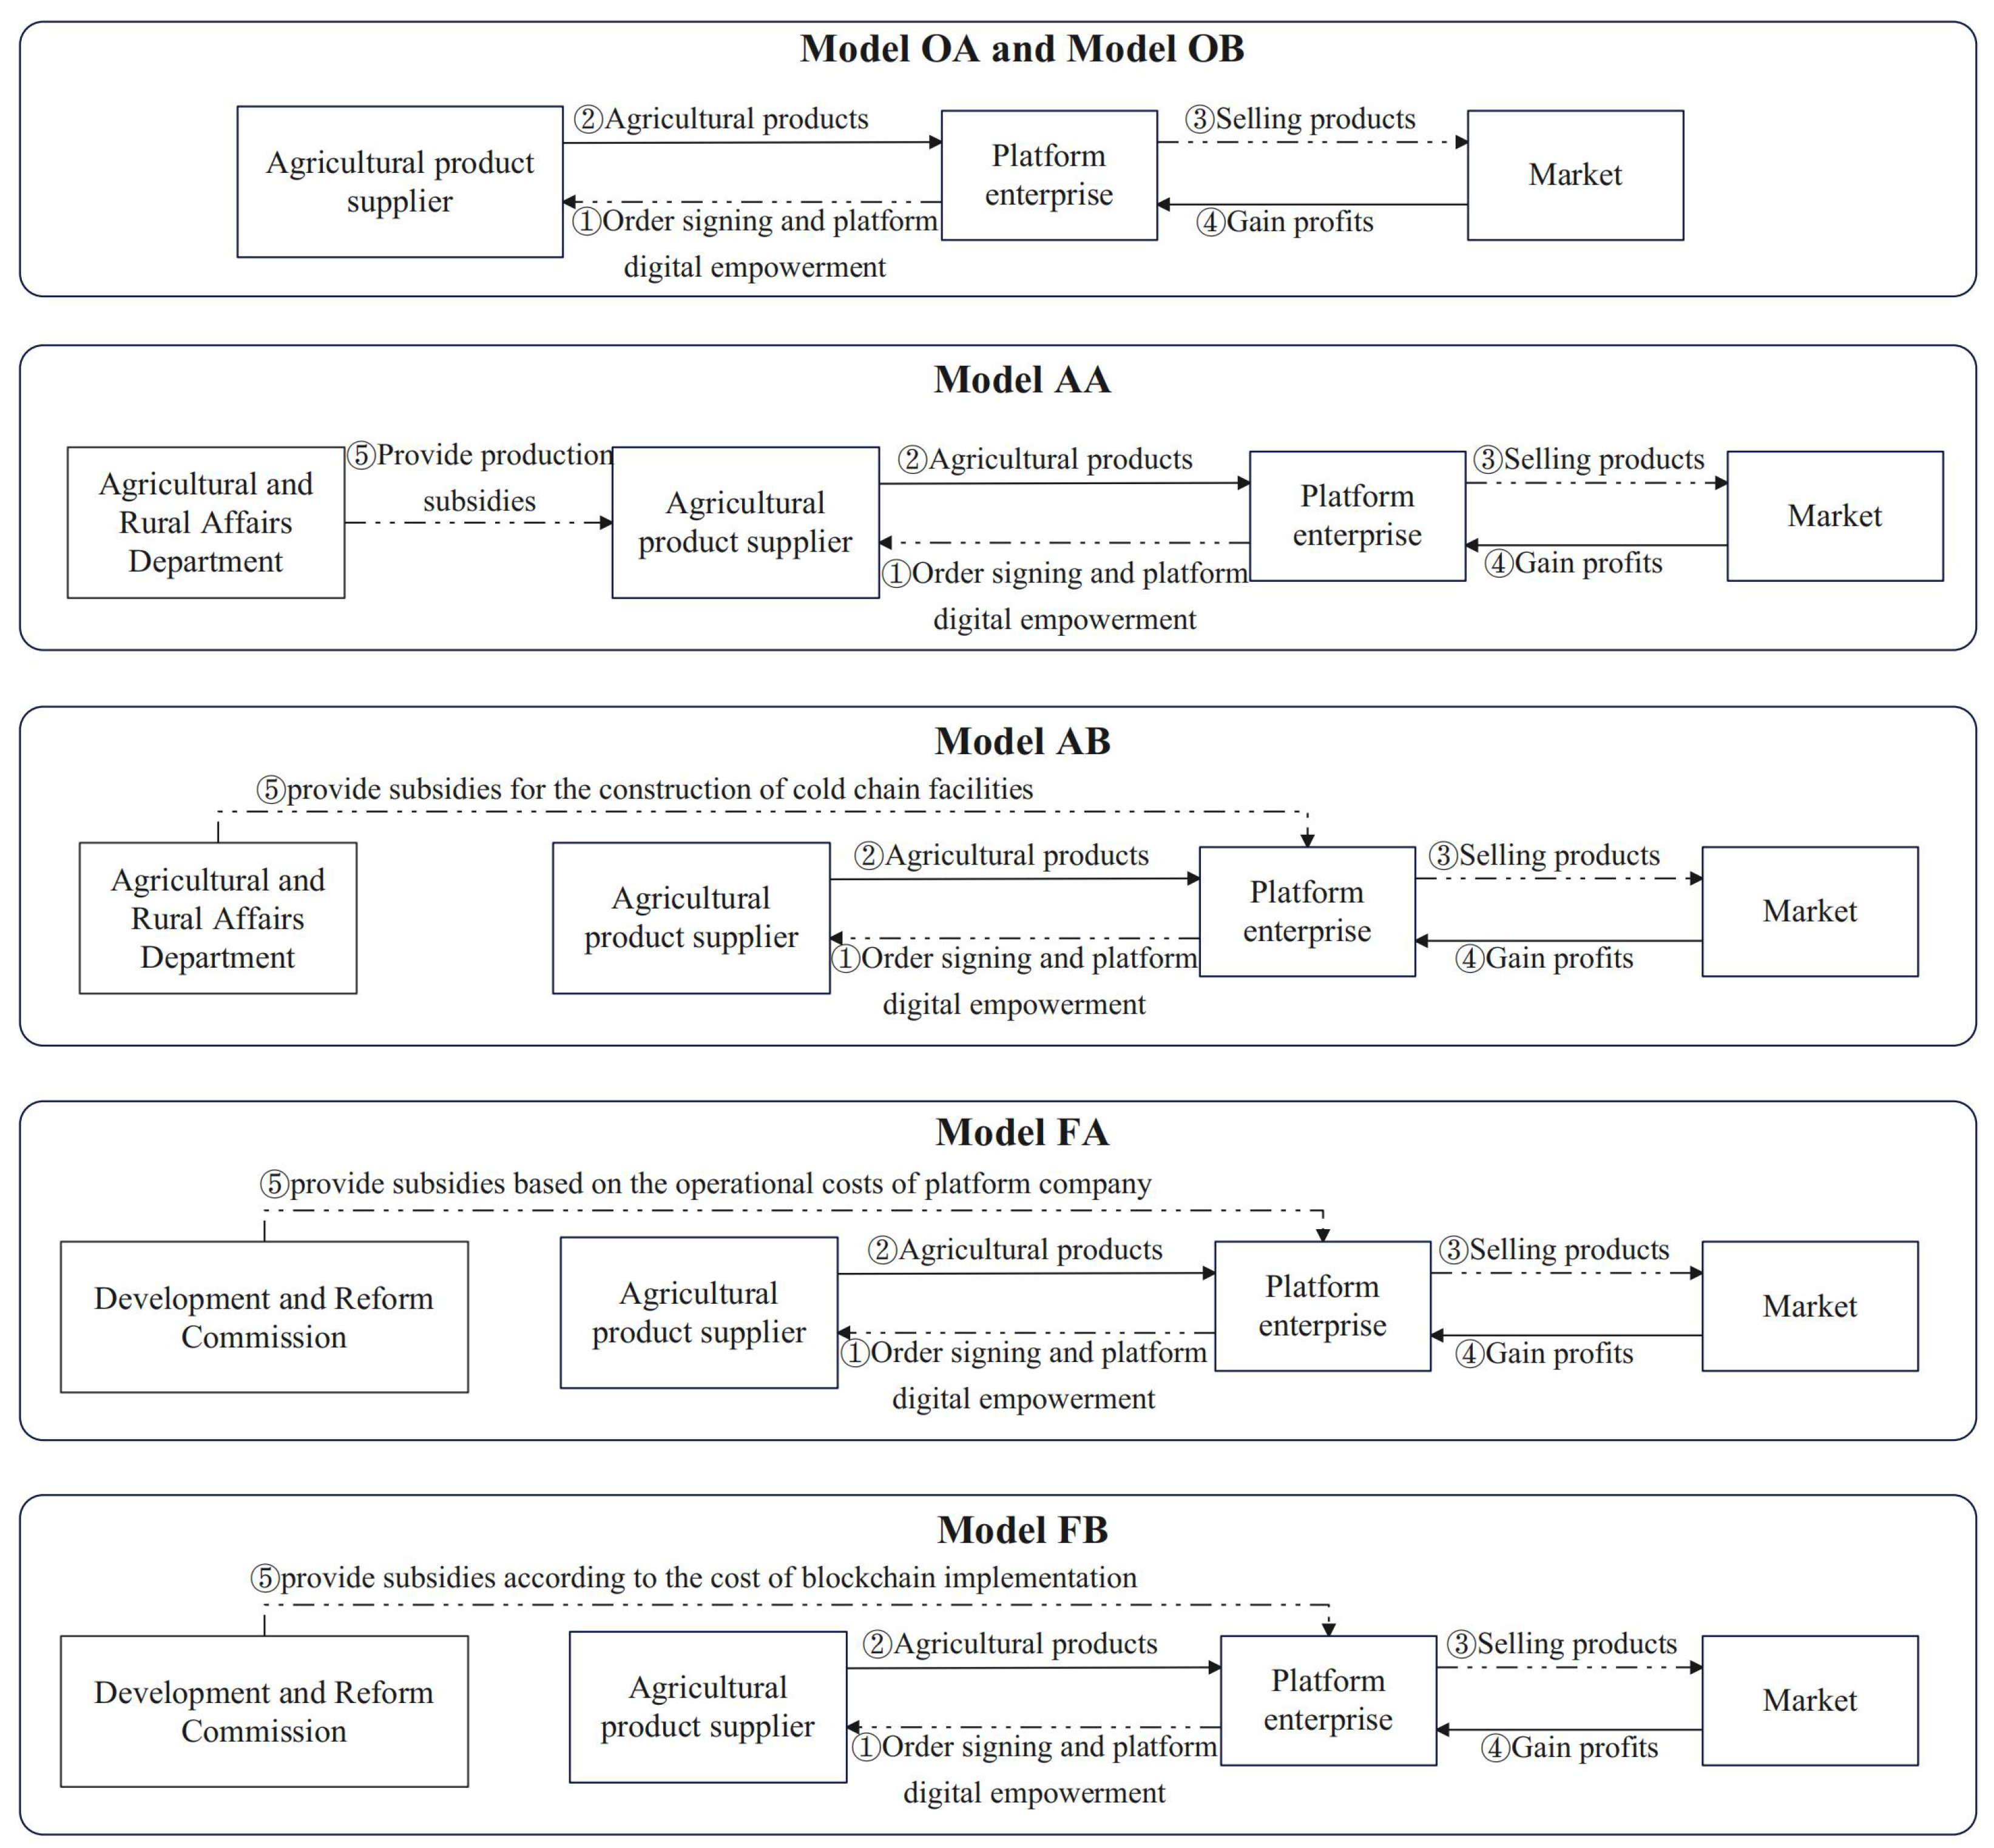
| Model Acronym | Subsidizing Department(s) | Key Characteristics |
|---|---|---|
| Section 4: Single-Department Subsidy Scenarios | ||
| OA | None (Baseline) | No blockchain, no subsidies. |
| OB | None (Baseline) | Blockchain adopted by the platform, no subsidies. |
| AA | ARAD | Production subsidy for the supplier. |
| AB | ARAD | Cold-chain investment subsidy for the platform. |
| FA | DRC | Platform operation cost subsidy. |
| FB | DRC | Blockchain technology subsidy for the platform. |
| Section 5: Interdepartmental Coordination Scenarios | ||
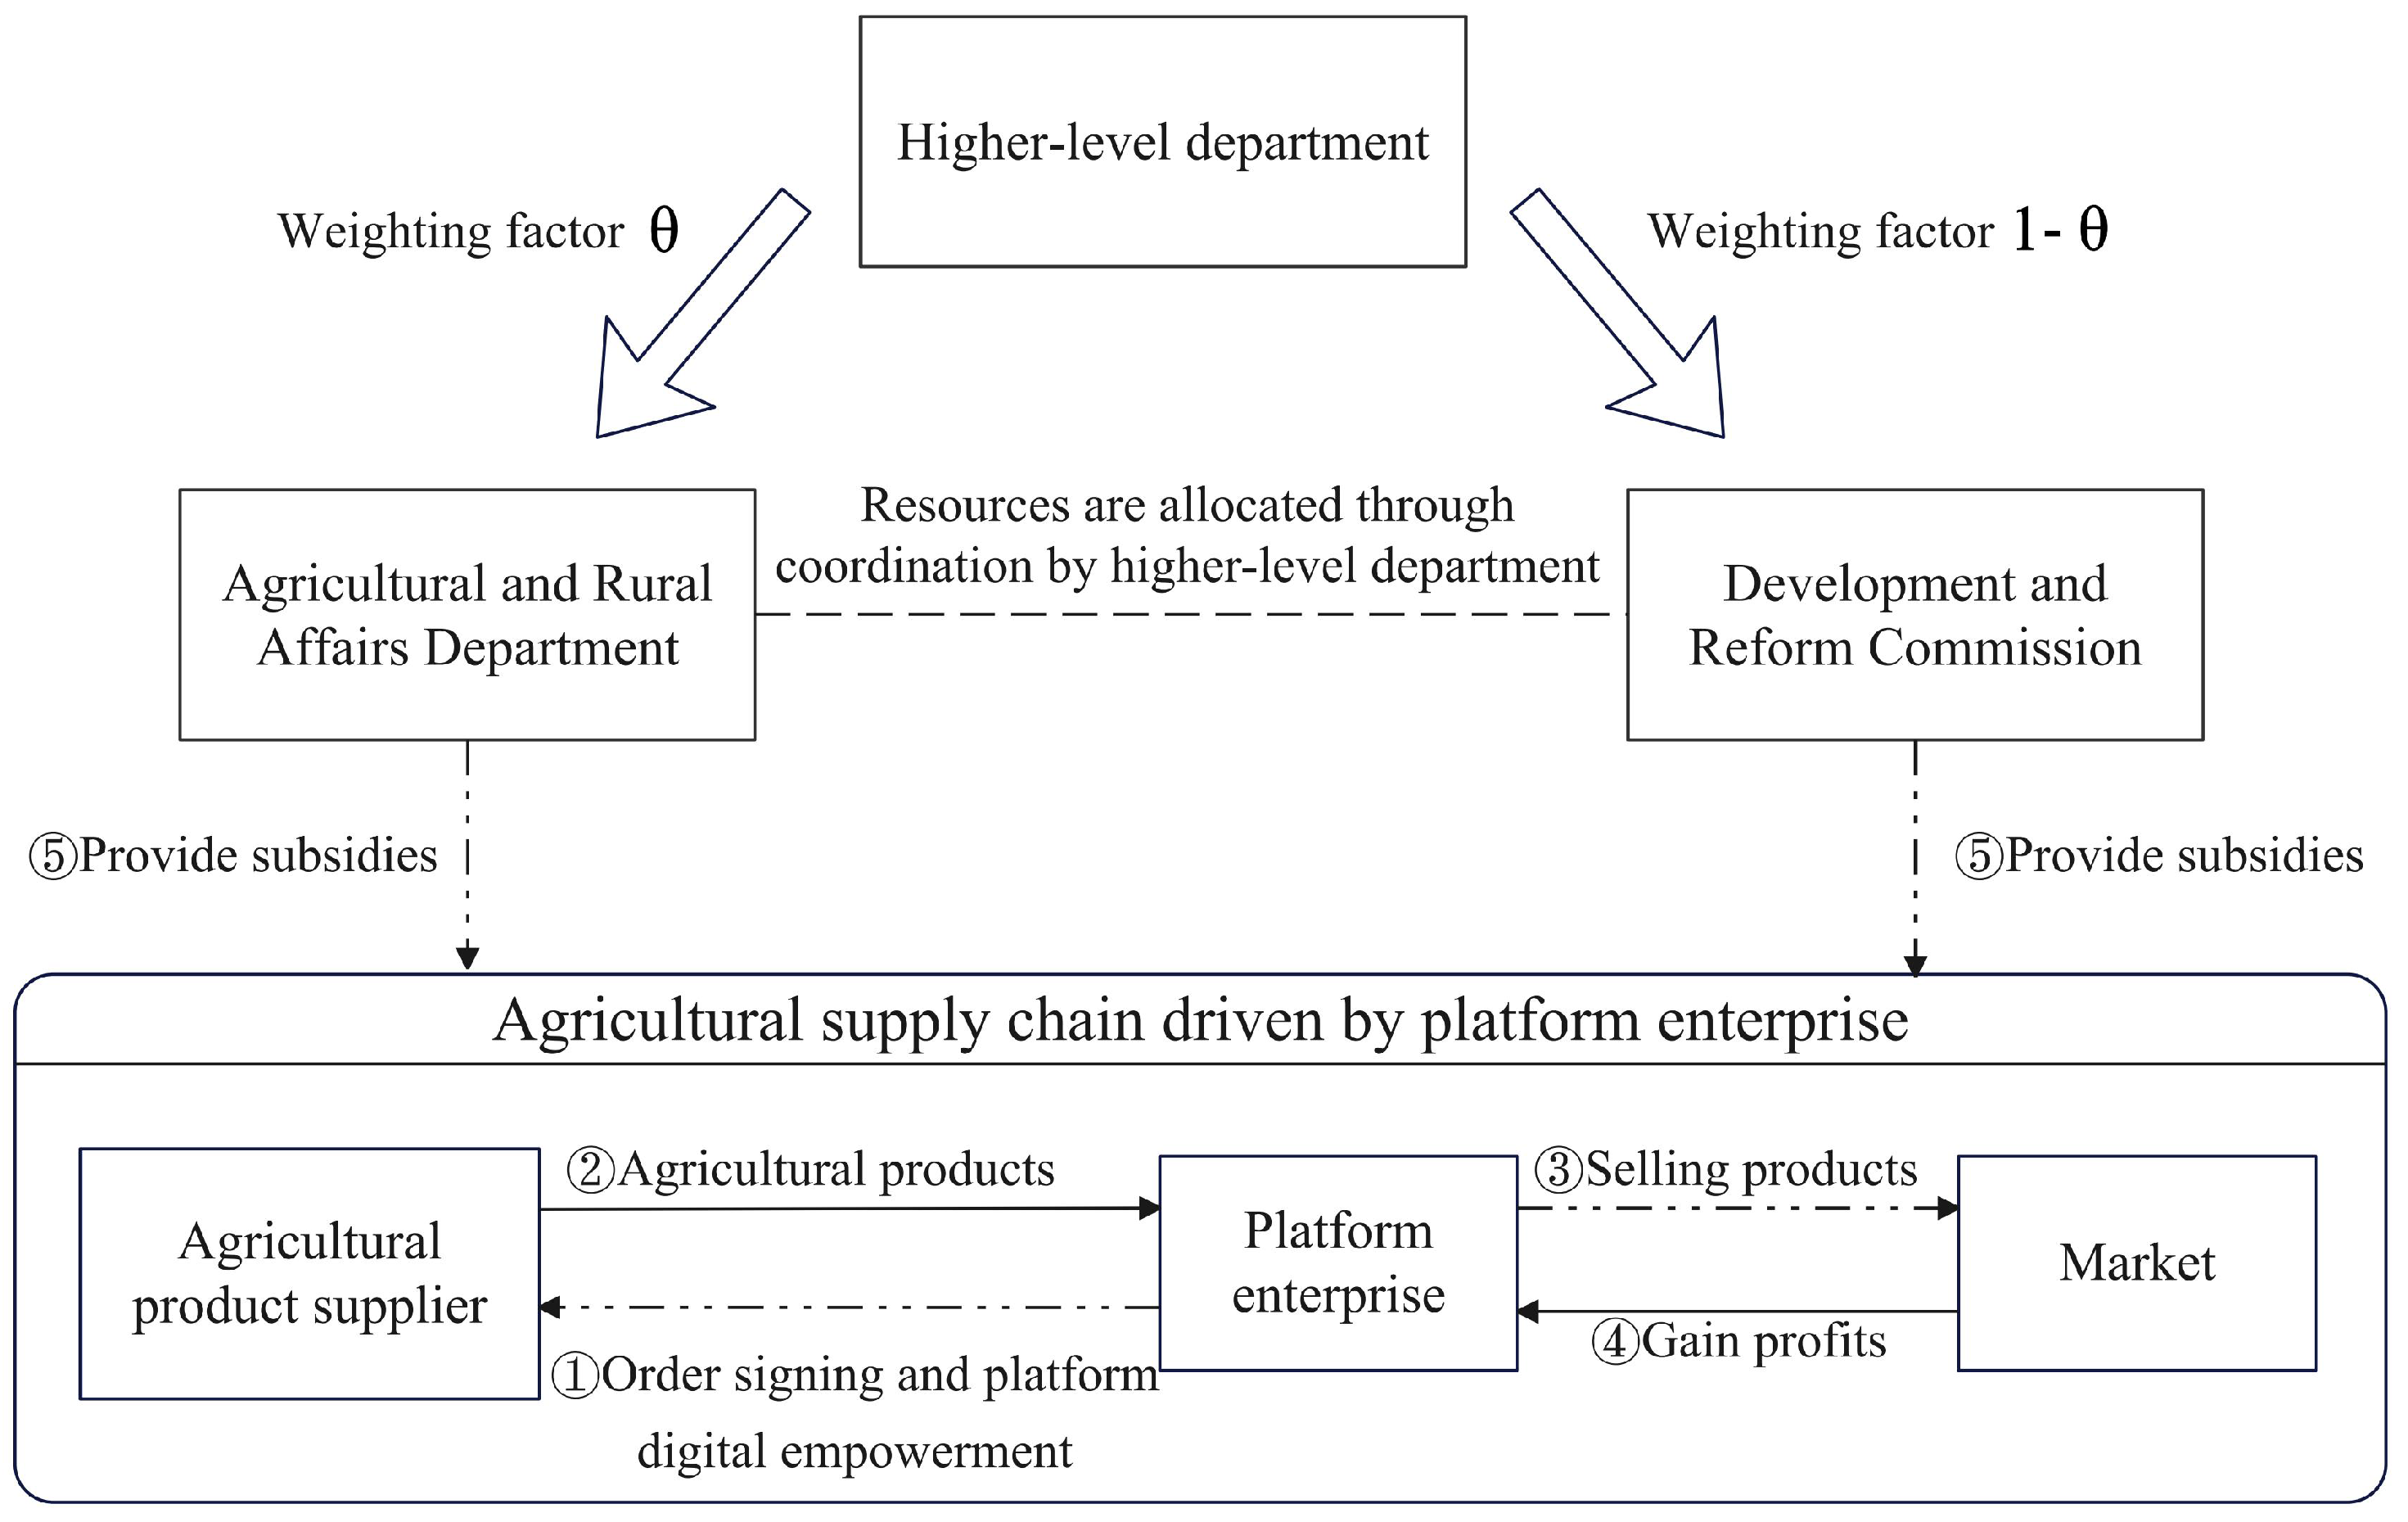
| GA | ARAD + DRC | Coordinated subsidies: Production (ARAD) + Platform Operation (DRC). |
| GB | ARAD + DRC | Coordinated subsidies: Production (ARAD) + Blockchain (DRC). |
| Models | Inverse Demand, Profit and Social Welfare Functions |
|---|---|
| OA | |
| OB | |
| AA | |
| AB | |
| FA | |
| FB | |
| Policy Comparison/Topic | Key Finding/Insight | Primary Driver/Condition |
|---|---|---|
| ARAD Subsidies (Production vs. Cold-chain) | The production subsidy (AA) is more effective for social welfare; firm profitability is contingent on the cold-chain subsidy rate (). | Greater effectiveness of direct output support for social welfare. High subsidy rates () make the cold-chain option more profitable for the platform. (See Proposition 1) |
| DRC Subsidies (Platform Operation vs. Blockchain) | The blockchain subsidy (FB) is superior for welfare and profits at high subsidy rates (); the platform operation subsidy (FA) is preferable only when is low. | Systemic benefits from blockchain investment (e.g., transparency, efficiency) are greater than benefits from simple operational cost reductions. (See Proposition 2) |
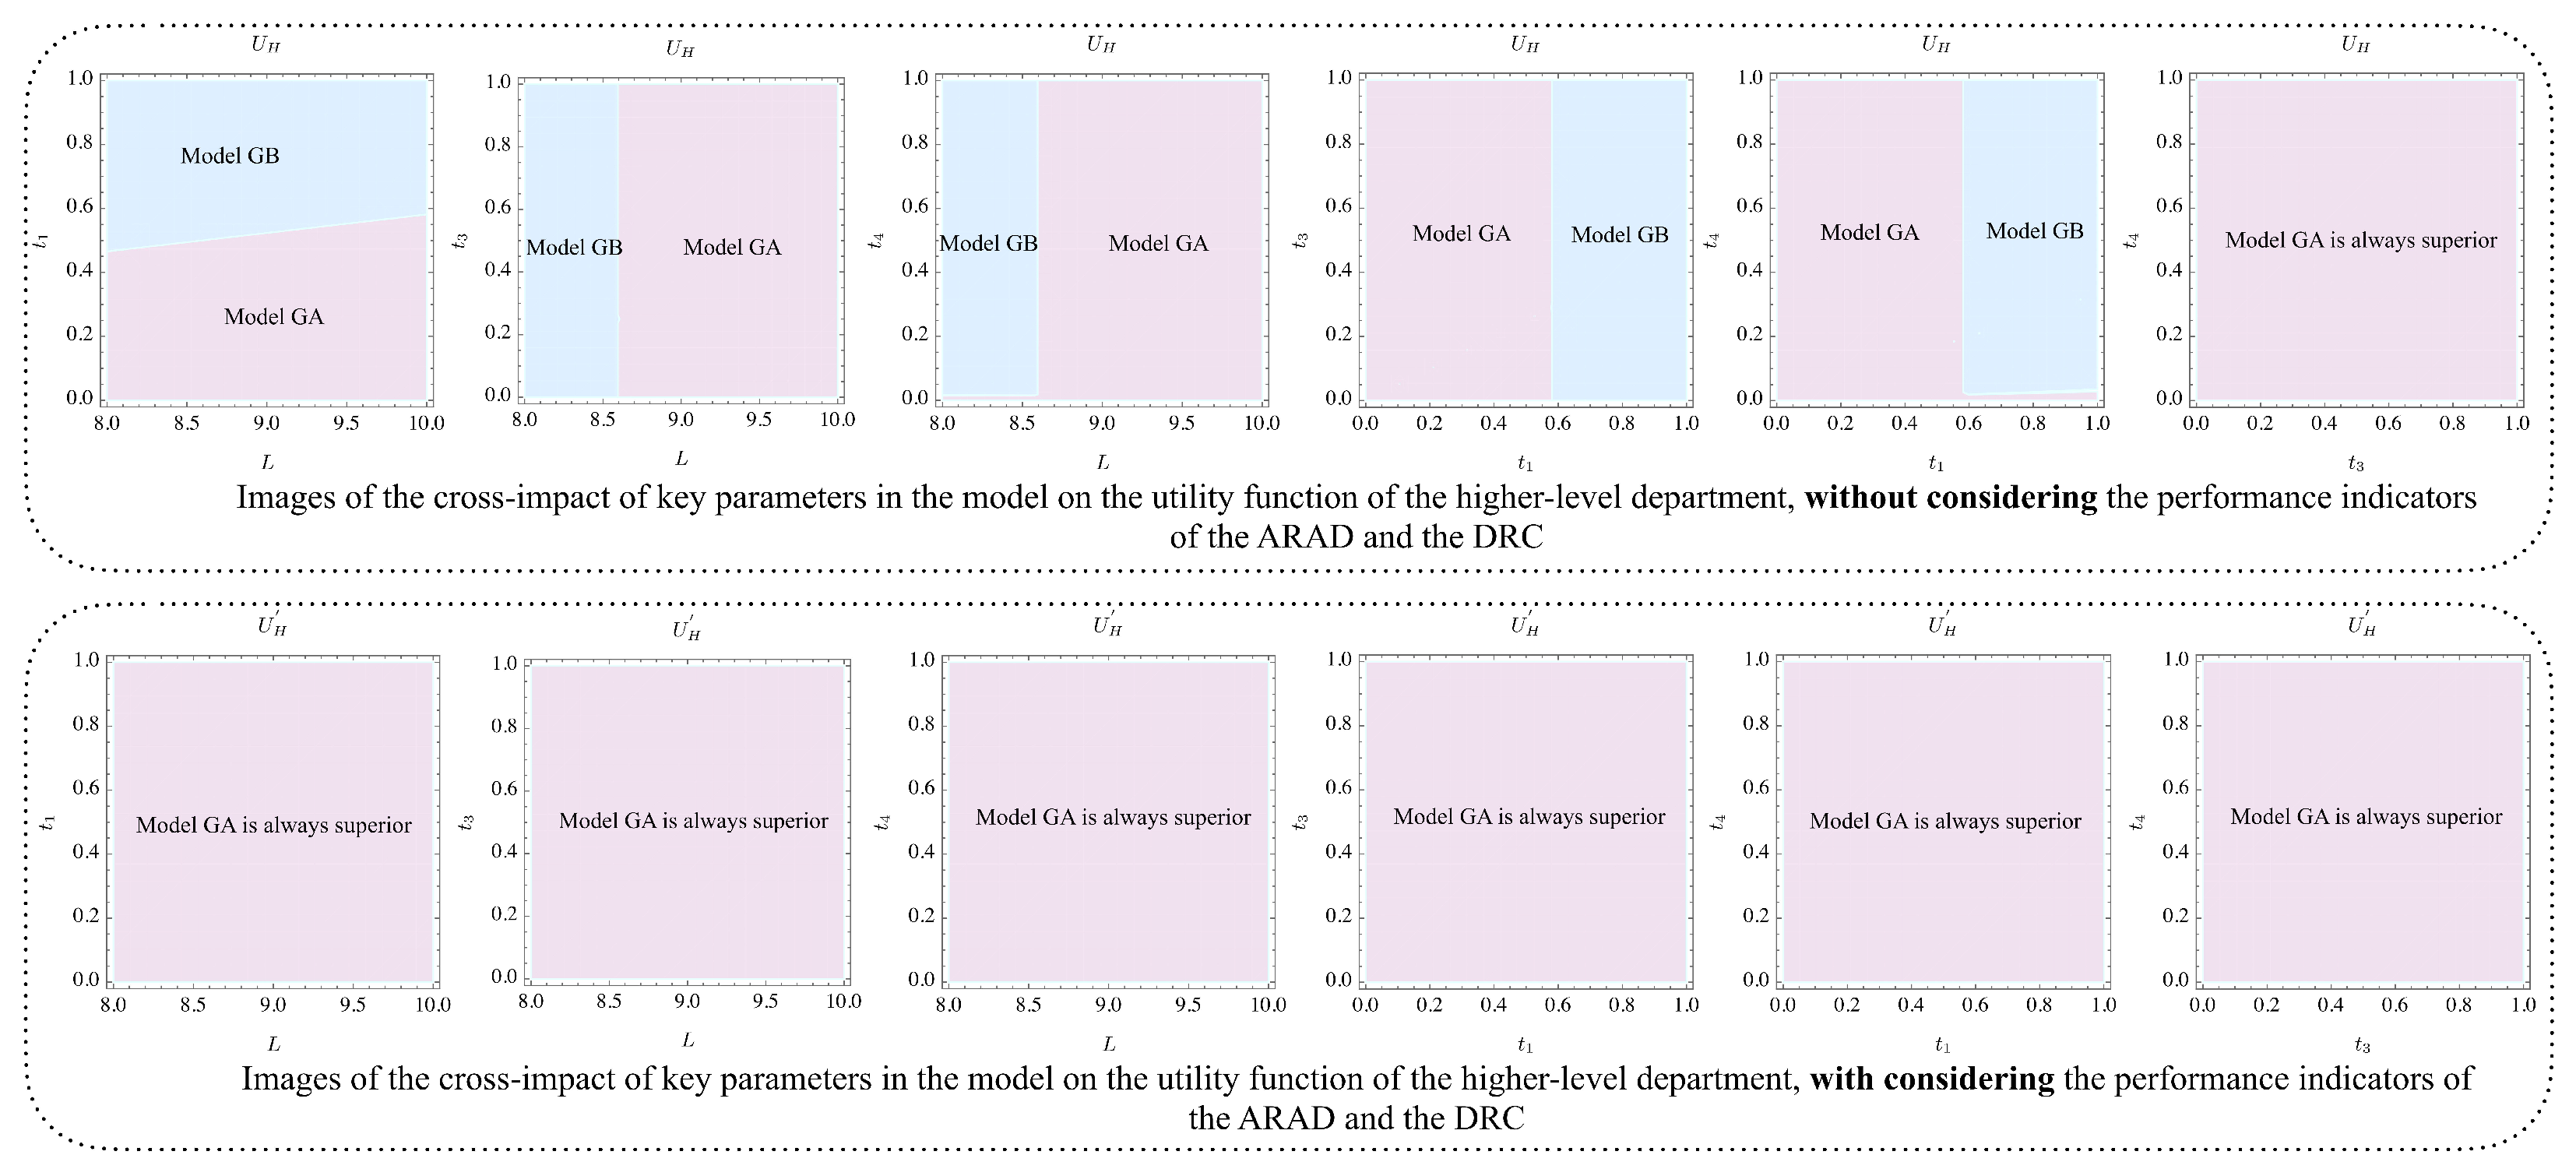
| Interdepartmental Coordination (GA vs. GB) | The Production + Platform Operation subsidy combination (GA) generates consistently higher social welfare than the Production + Blockchain combination (GB). | High fixed costs and inflexibility of blockchain investment can “crowd out” resources, leading to lower efficiency than the direct and flexible subsidies in the GA model. (See Section 5) |
| Role of Departmental Performance Indicators | The superiority of the GA subsidy combination is reinforced when departmental performance indicators are explicitly incorporated into the analysis. | Inclusion of subordinate performance indicators aligns the higher-level department’s utility more closely with overall supply chain health, thereby favoring the balanced GA model. (See Section 6.4) |
Disclaimer/Publisher’s Note: The statements, opinions and data contained in all publications are solely those of the individual author(s) and contributor(s) and not of MDPI and/or the editor(s). MDPI and/or the editor(s) disclaim responsibility for any injury to people or property resulting from any ideas, methods, instructions or products referred to in the content. |
© 2025 by the authors. Licensee MDPI, Basel, Switzerland. This article is an open access article distributed under the terms and conditions of the Creative Commons Attribution (CC BY) license (https://creativecommons.org/licenses/by/4.0/).
Share and Cite
Yao, A.; Jiang, L.; Guo, B.; Li, W. Subsidy Policy Interactions in Agricultural Supply Chains: An Interdepartmental Coordination Perspective. Agriculture 2025, 15, 1464. https://doi.org/10.3390/agriculture15141464
Yao A, Jiang L, Guo B, Li W. Subsidy Policy Interactions in Agricultural Supply Chains: An Interdepartmental Coordination Perspective. Agriculture. 2025; 15(14):1464. https://doi.org/10.3390/agriculture15141464
Chicago/Turabian StyleYao, Aibo, Lin Jiang, Bingxue Guo, and Wei Li. 2025. "Subsidy Policy Interactions in Agricultural Supply Chains: An Interdepartmental Coordination Perspective" Agriculture 15, no. 14: 1464. https://doi.org/10.3390/agriculture15141464
APA StyleYao, A., Jiang, L., Guo, B., & Li, W. (2025). Subsidy Policy Interactions in Agricultural Supply Chains: An Interdepartmental Coordination Perspective. Agriculture, 15(14), 1464. https://doi.org/10.3390/agriculture15141464