Article

Unlocking the Potential of Family Farms: Inclusion in Rural Development Program Measures in Croatia

Faculty of Agrobiotechnical Sciences Osijek, Josip Juraj Strossmayer University of Osijek, Vladimira Preloga 1, 31000 Osijek, Croatia
*
Author to whom correspondence should be addressed.
Agriculture 2025, 15(13), 1432; https://doi.org/10.3390/agriculture15131432
Submission received: 12 May 2025 / Revised: 30 June 2025 / Accepted: 30 June 2025 / Published: 3 July 2025
(This article belongs to the Section Agricultural Economics, Policies and Rural Management)

Abstract

In the context of increasing demands for sustainable natural resource management, this study analyzes the demographic and structural characteristics of family farms in Croatia and their participation in three environmental measures under the 2014–2022 Rural Development Programme. Using national administrative data and spatial analysis, the results highlight key patterns linked to age, education, gender, and ownership, as well as regional disparities in measure uptake. The findings suggest the importance of tailoring rural development policy to small farms’ specific needs to improve future CAP implementation.

1. Introduction

Today, there are more than 600 million family farms around the world, of which as many as 98% are smaller than 20 hectares. Globally, this form of agriculture employs approximately 30% of the workforce and produces more than 80% of the world’s food, in terms of value [1]. Family farms thus play a key role in ensuring food security, especially in low- and middle-income countries, where they dominate both land use and food production [2]. Within the European Union (EU), there are more than 8.4 million family farms [3], and they are the dominant model in countries such as, Lithuania, Luxembourg, Belgium, and Spain [4]. Family farms are significant not only in terms of the number of holdings but also because of the agricultural labor force they provide. They account for around 78% of the agricultural workforce and manage about 61% of the utilized agricultural area [3]. The concept of family farming encompasses much more than farm size—it reflects a way of life based on family labor, generational continuity, and strong links between production and the surrounding community [5]. In the European context, family farms are not a homogeneous group, but their common features—such as their reliance on unpaid family labor and mixed production systems—make them essential to rural vitality [6]. However, they face numerous challenges [7]. They are generally smaller compared to other agricultural holdings, with an average size of around 16 hectares, in contrast to larger industrial farms that can span hundreds of hectares. Smaller farms tend to rely more on family labor and local knowledge, which often enhances resilience and diversification capacity in the face of climate and economic shocks [8]. However, their limited scale also constrains access to capital, technology, and markets, making them more sensitive to policy design and administrative burdens [9]. At the same time, small-scale farms are increasingly recognized for their role in sustainable food systems, biodiversity preservation, and rural employment [10]. Demographic trends also pose a challenge. The aging rural population and declining interest among younger generations in agricultural work further threaten the long-term sustainability of the agricultural sector [1].

1.1. Environmental Significance of Family Farms in Rural Development Context of CAP EU

In light of the growing impacts of climate change, family farms play a vital role in food security, local food supply, and the resilience of rural communities [7]. Because of this, the Common Agricultural Policy (CAP) EU has, since its inception, implicitly supported the development and preservation of family farms as the dominant model of agricultural production [6]. Their particular value lies in their strong embeddedness in local agroecological conditions, enabling them to be more adaptable and resilient compared to larger, industrially oriented production systems. Small family farms often employ traditional agricultural practices that integrate sustainable production with the conservation of natural resources, thereby contributing to biodiversity conservation and reducing negative environmental impacts [8]. These claims are widely supported by the empirical research. Small farmers, especially in developing and transitional economies, more frequently adopt agroecological methods that maintain soil fertility, reduce reliance on external inputs, and enhance resilience to climate shocks [11]. Zimmerer et al. (2015) [12] highlight that small farms are often located in biodiversity-rich zones and operate within spatially diverse production systems that support agrobiodiversity—especially through the use of traditional knowledge and gender-specific labor practices. Ricciardi et al. (2021) [13], in a global meta-analysis, conclude that smaller farms tend to achieve higher yields per hectare and greater on-farm biodiversity compared to larger operations, which often rely on monocultures and chemical intensification.
Within the framework of the CAP, Member States are required to design and implement Rural Development Programmes (RDPs) tailored to their specific territorial, environmental, and socio-economic contexts. These programs, co-financed by the European Agricultural Fund for Rural Development (EAFRD) and national contributions, aim to enhance the competitiveness of agriculture, promote sustainable land management, and support the socio-economic vitality of rural areas. A central requirement of the 2014–2020 programming period—and carried forward into the CAP Strategic Plans post-2023—is that at least 30% of the total public expenditure within each RDP must be allocated to measures directly targeting climate action and environmental sustainability. This allocation primarily supports agri-environment-climate measures (AECMs), organic farming, payments for areas under natural constraints, and Natura 2000 compensation schemes. These interventions are typically delivered through multiannual contracts and annual payments to farmers who adopt or maintain environmentally beneficial practices, thus compensating for income forgone and additional costs incurred [14,15]. While Member States have discretion in the design of these schemes—such as the setting of payment levels and eligibility criteria—they must ensure compliance with the EU principles of additionality, cost-effectiveness, and environmental integrity [16]. Furthermore, the implementation and outcomes of RDPs are subject to rigorous evaluation mechanisms to assess their contribution to biodiversity conservation, climate mitigation, and sustainable rural development [17].
Across the EU, a growing body of literature examines the factors influencing the adoption environmental management practices like agro-environmental schemes (AESs) and the application of organic farming [18,19,20,21], consistently highlighting the importance of education, the age of the farm holder, and farm size. According to Capitanio et al. (2011), family farms are often less likely to participate, while larger, specialized, and financially stronger farms exhibit higher participation rates [19,20]. Larger farms, due to their greater resources, are better equipped to absorb transaction costs and comply with administrative requirements, creating an additional barrier for smaller farms [18]. Defrancesco et al. (2008) [22] also found that small farms in northern Italy perceive environmental measures as economically risky due to delayed payments and rigid program rules, even when they agree with environmental goals. Demographic characteristics, such as age, further shape participation patterns—older farmers tend to participate less, often due to administrative burdens and long-term commitments [21]. Similarly, several studies confirm that administrative complexity, lack of advisory services, inflexible eligibility criteria, and uncertainty regarding payment timelines disproportionately affect smaller farms. Vanslembrouck et al. (2002) [23] found that Belgian farmers’ willingness to participate was strongly influenced by perceived profitability and bureaucratic burden, while Chaplin et al. (2004) [24] emphasized that small farms in central and eastern Europe are further constrained by a lack of technical knowledge and limited institutional support.

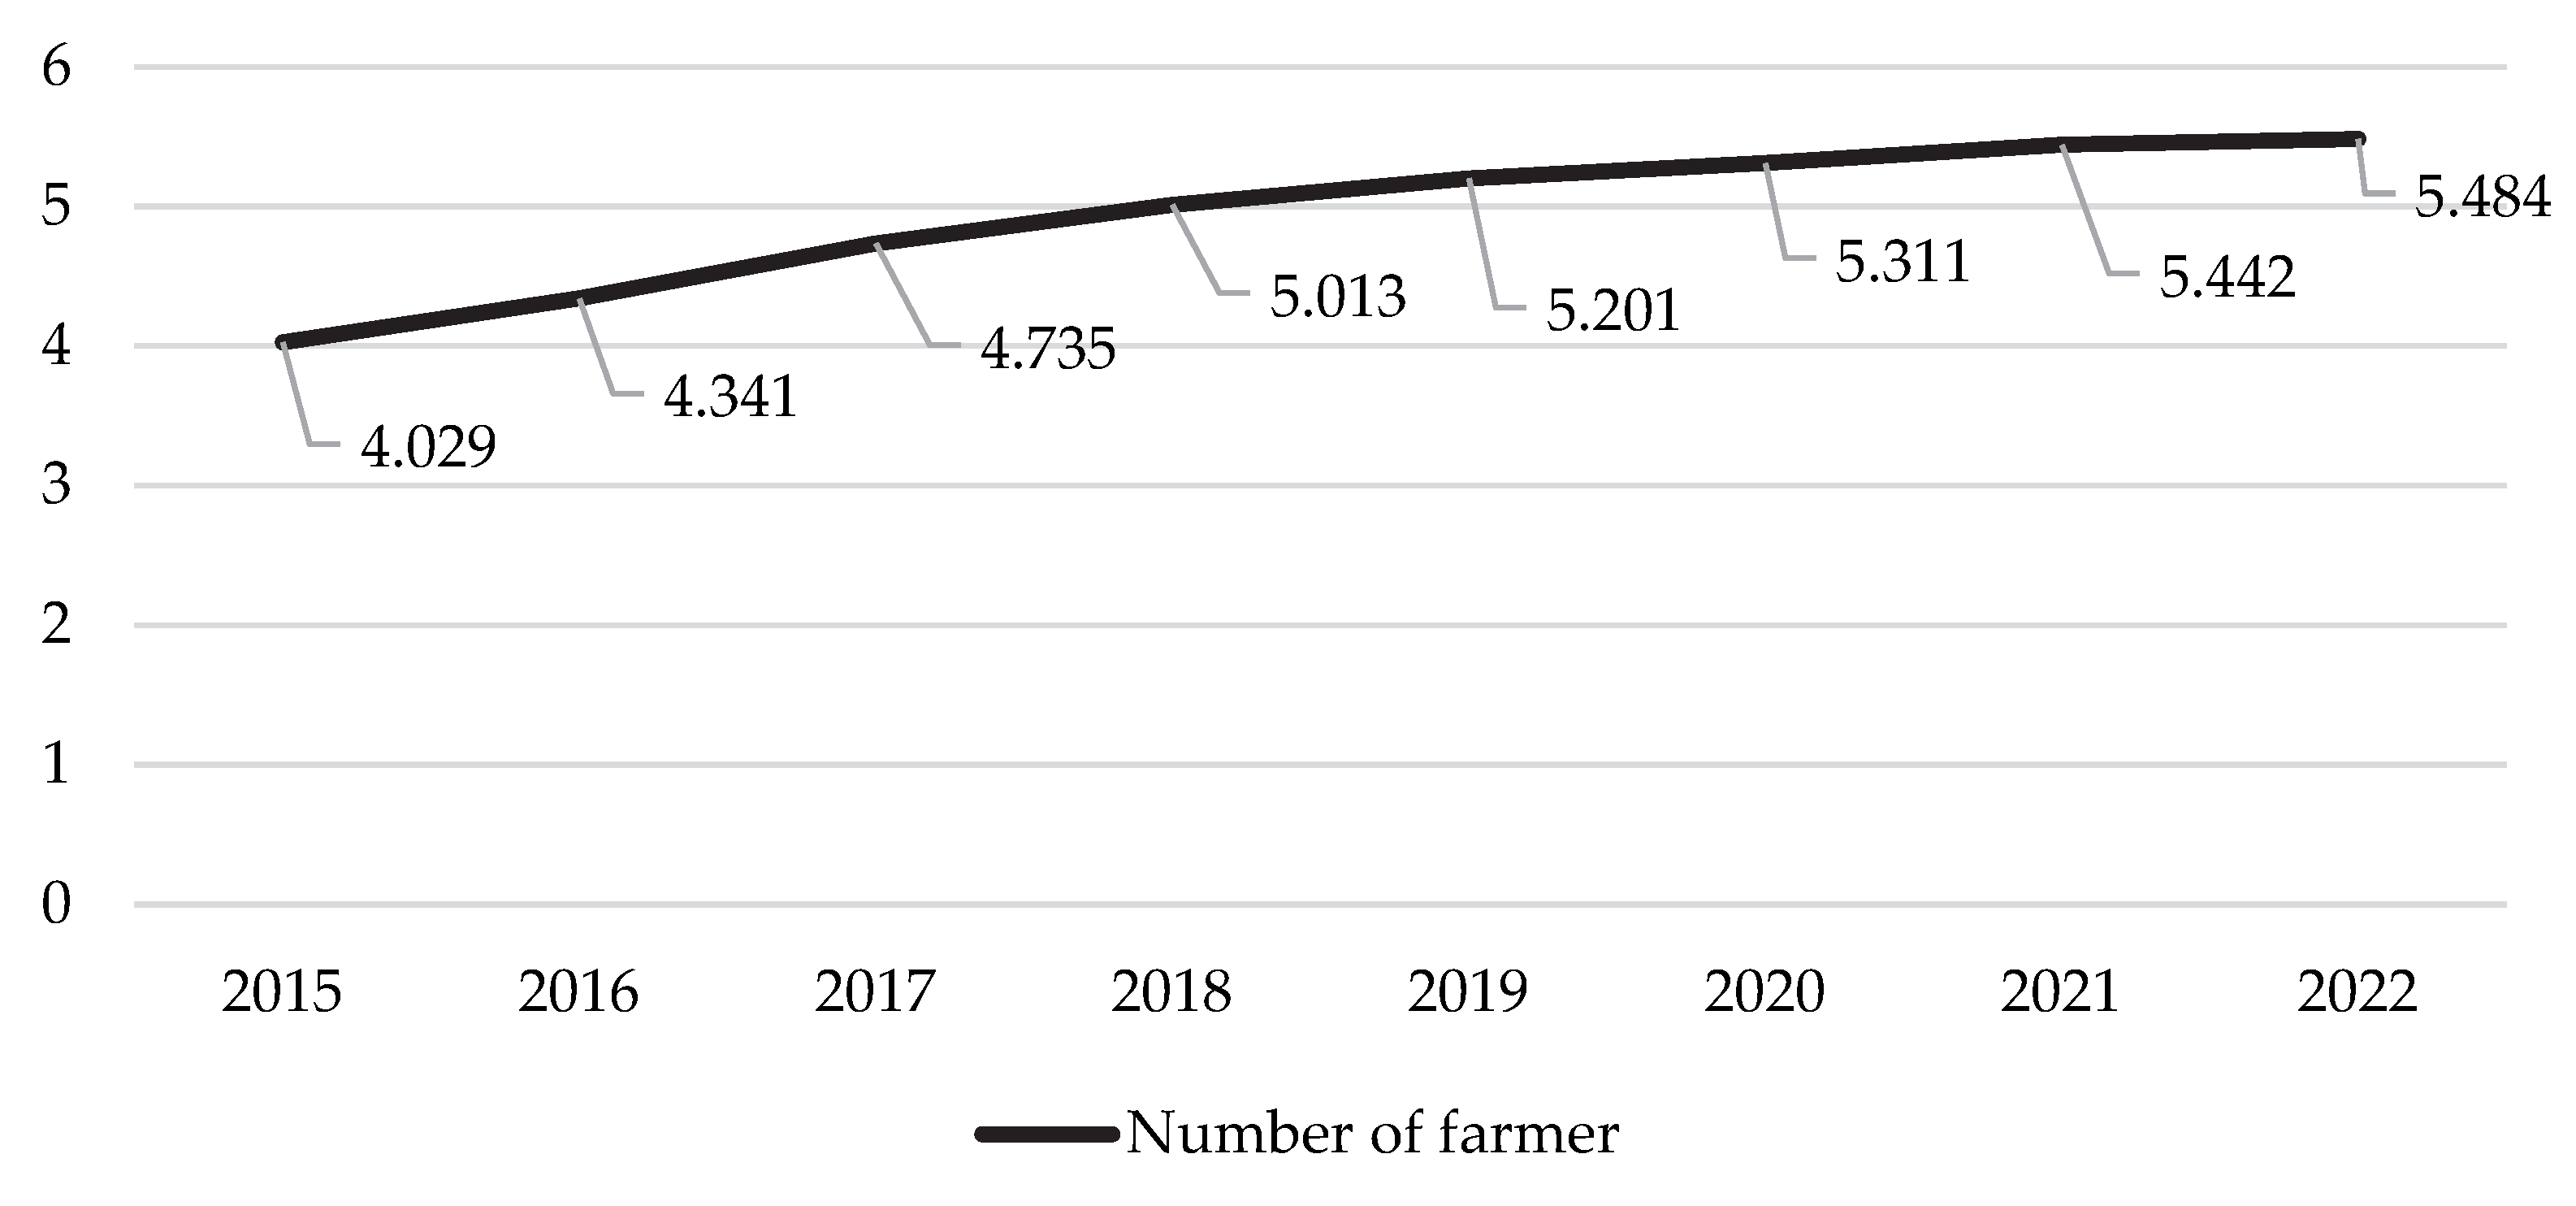
1.2. Family Farming in Croatia: History, Structure, and Trends

Croatia has a total of approximately 1.5 million hectares of utilized agricultural land, representing about 26% of the total land area, of which arable land and gardens and permanent grassland are the most common. Around 165 thousand farmers are engaged in agriculture [25]. The agricultural sector employs approximately 2.4% of the national workforce, while its contribution to national GDP in 2022 was around 3.5% [25,26]. According to the latest data, there are around 122,879 active family farms, which account for 74.6% of all farms in the country, and the heads of agricultural farms are mainly elderly people. On average, a Croatian family farm manages around 7 hectares of agricultural land and provides most of the workforce through family members. Despite their small size, family farms produce more than 80% of domestic agricultural production and play a vital role in sustaining rural populations and landscapes [25,27].
According to the Family Farms Act [28], a family farm is defined as an organizational form of agricultural business managed by a natural person who independently and permanently carries out agricultural and related supplementary activities with the aim of generating income. The Act enables individuals with appropriate resources to engage in permanent agricultural and related supplementary activities within the framework of a family farm, while ensuring social protection for the farm owner and household members and clearly defining the conditions under which the activity may cease [28,29].The origin of family farms in Croatia dates back to 1848, when the abolition of feudalism encouraged the individualization of the peasantry and the transition from household cooperatives to family farms [29,30]. This period marked the transformation of traditional peasant holdings into family-based agricultural units, characterized by the integration of household labor, land ownership, and agricultural production [31]. During the socialist period in Yugoslavia (1945–1990), collectivization was only selectively implemented in Croatia. Family farms remained dominant, retaining ownership over a substantial share of agricultural land and playing a central role in food production, particularly in less industrialized and hilly regions. Despite operating under production quotas and limited access to capital or modern inputs, these farms demonstrated resilience and continuity [31]. Throughout the 20th century, the rural economy developed through two models: traditional peasant farms focused on self-sufficiency and market-oriented agricultural enterprises. After Croatia gained independence in the 1990s, the dissolution of former agri-industrial socialist complexes and the shift to a market-based economy led to renewed emphasis on family farms. Land restitution, institutional restructuring, and privatization processes redefined ownership, yet many smallholders faced structural challenges, such as fragmented plots, legal insecurity, and insufficient state support [30]. Their importance is recognized through a legislative framework that comprehensively regulates business conditions, the rights and obligations of farm owners, and the responsibilities of the competent authorities for law enforcement.
Croatia’s accession to the European Union in 2013 brought family farms into the framework of the Common Agricultural Policy (CAP). While this opened up funding and support opportunities, it also increased bureaucratic obligations, which particularly burdened smaller, less specialized farms. Co-financing requirements, complex applications, and limited advisory services further deepened the structural divide between large and small producers [30]. This may be one of the reasons why the number of family farms has been decreasing year by year (Figure 1), specifically, from 2016 to 2022, by 36,877 farms [12]. This decline has affected both genders, with the number of female farm holders falling by 31% and male farm holders by 23%. Figure 1 also illustrates the share of family farms in relation to the total number of agricultural holdings. It is evident that the difference between the total number of holdings and the number of family farms varies over the years—that is, in some years, the total number of holdings increases while the number of family farms decreases. This indicates a slight increase in the share of other organizational forms, such as limited liability companies or cooperatives.

1.3. Alignment with the Croatian CAP, RDP, and Nature Objectives

Following Croatia’s independence in the early 1990s, agricultural policy began adjusting to new political and economic conditions, with early reforms focused on strategic goal-setting and support systems [32,33]. The 1995 Strategy for Agricultural Development marked a turning point by expanding focus from agricultural productivity alone to broader rural development objectives. Legislative efforts, such as the Law on Agricultural Land and the Agricultural Strategy and Fisheries Strategy (NN 89/02), introduced support models aligned with EU principles, including income support, investment aid, and rural development measures. Although further institutional and programmatic alignment was needed, these foundations laid the groundwork for Croatia’s integration into the EU’s Common Agricultural Policy [33]. The adaptation of Croatia to the EU CAP faced considerable challenges due to structural problems inherited from the era of a planned economy and the consequences of war damage. The national agricultural policy was primarily focused on increasing production and self-sufficiency, which proved to be misaligned with the CAP’s objectives that promote the multifunctionality of agriculture, including environmental sustainability, biodiversity protection, and rural development. The Croatian agricultural sector has been characterized by a predominant reliance on large agricultural enterprises in accessing second-pillar CAP funds, while small- and medium-sized producers have remained under-supported. Moreover, weak cooperation between academia, producers, and the public administration further hindered the effective alignment with the CAP [34]. Within the first pillar of the CAP and in the context of nature conservation requirements, they were primarily implemented through mandatory cross-compliance and greening measures, which included obligations such as maintaining permanent grassland, protecting landscape features, and ensuring crop diversification and ecologically significant areas, all of which were aligned with EU minimum requirements [35,36,37].
The second pillar, i.e., Croatia’s first Rural Development Programme (RDP) for the 2014–2020 period, was developed in the context of post-war reconstruction, rural depopulation, and low agricultural competitiveness. The program emphasized the need for technical and technological modernization of agricultural holdings to improve productivity and economic viability. Environmental protection was often framed not as an intrinsic societal goal, but as an external obligation linked to EU accession, reflecting a combination of productivist and administrative discourses [38]. This interpretation is further substantiated by the structure and priorities of the RDP [39]. The main strategic objective of the RDP was to restructure and modernize the agricultural and food sectors, with the largest share of funding allocated to physical investments in farm assets (Measure 4), development of small farms (Measure 6), and support for areas facing natural constraints (Measure 13). Although environmental goals were included—such as biodiversity protection, organic farming, and climate action—these were often integrated in support of broader economic objectives. For example, support for agri-environment–climate measures (Measure 10) covered 65,035 ha, while support for organic farming was applied to nearly 107,000 ha combined (conversion and maintenance), primarily through annual payments aimed at income compensation rather than transformative ecological transition [40].
This rationale guided the decision to analyze the implementation of three measures within Croatia’s RDP: Measure 10—Agri-environment-climate (M10), Measure 11—Organic farming (M11), and Measure 13—Payments to areas facing natural constraints (M13), the latter of which is also relevant for environmental preservation. Participation in all three is voluntary, and support is granted in the form of annual payments per hectare of agricultural land, or per livestock unit in the case of animal-related obligations. M10 and M11 require a mandatory five-year commitment period, whereas M13 is implemented on an annual basis. None of these measures apply to fallow land, and it is possible to combine Measures 10 and 11 on the same parcel, provided all eligibility conditions are met. All measures are subject to strict implementation controls, both administrative and field-based, and payments are made only after verification of compliance. Furthermore, beneficiaries must adhere to the rules of cross-compliance, which include meeting the standards for Good Agricultural and Environmental Condition (GAEC) and the Statutory Management Requirements (SMR) [37].
Given that these measures have been implemented in Croatia for more than a decade, the aim of this study is to analyze the demographic and structural characteristics of family farms in Croatia and to investigate how these factors correlate with the adoption of environmental measures under the Rural Development Programme 2014–2022. This study is particularly significant because it provides one of the most detailed analyses of the demographic and structural characteristics of family farms in Croatia, along with their participation in CAP measures. By applying statistical, spatial, and regression analyzes, this study offers a unique, data-driven perspective on the factors shaping farmers’ engagement in environmental policies, providing key insights for improving the design, targeting, and effectiveness of future rural development programs.
This study tests the following hypotheses:
H1. 
Older age and male gender are associated with a lower likelihood of participation in one of the measures (M10, M11, M13).
H2. 
Farm holders with higher levels of education are more likely to participate in one of the measures (M10, M11, M13).
H3. 
Farms engaged in livestock production are more likely to participate in one of the measures (M10, M11, M13).

2. Materials and Methods

2.1. Data Processing

For the general analysis of the state of family farms in Croatia (as presented in the introduction), data from the Paying Agency for Agriculture, Fisheries and Rural Development (APPRRR), specifically the Farmers Registry, were used, covering the period from 2015 to 2022 [41]. For a more focused investigation into the relationship between farm and demographic characteristics and the use of Rural Development Programme (RDP) measures, an updated dataset from the APPRRR was analyzed, obtained in 2023 and 2024. The dataset included various variables (Table 1), such as the agricultural holding identification number, gender, date of birth, and education level of the farm holder; livestock ownership; land parcel data (LPIS); and RDP measure usage between 2015 and 2022. For the purpose of this study, the sample was filtered to include only holdings classified as “family farms,” resulting in a final dataset of 212,910 observations. Each observation corresponds to one unique farm, regardless of the number of years it was active or participated in measures. The data are therefore cross-sectional in structure, and do not represent repeated annual entries per farm. It is important to note that over 30% of farms had missing data on education level. No imputation techniques were applied to preserve the accuracy of the administrative dataset. Since education was a key variable in our regression model, we treated the category “unknown” as a separate category. Sensitivity tests excluding these entries showed consistent results, suggesting robustness but requiring cautious interpretation.
Data processing was carried out using R statistical software (version 4.0.2), with the use of the dplyr package [42] for data manipulation and the sf package [43] for handling spatial data.

2.2. Application of Regression and Nonparametric Tests in Data Evaluation

To examine the relationship between demographic variables and the adoption of agri-environmental measures, both parametric and nonparametric statistical tests were employed. Pearson’s chi-squared test and the Mann–Whitney U test were applied to assess associations between categorical and ordinal variables. The Mann–Whitney U test was selected due to its robustness in analyzing differences between two independent groups when the dependent variable is not normally distributed. For the purpose of modeling the likelihood of participation in the “scythe scheme,” a binary logistic regression model was employed [44]. This method is appropriate as the dependent variable was binary, coded as 0 (non-user) and 1 (user of the measure). Independent variables included:
Gender (M/F);
Farm type (categories 1–3);
Education level (categories 1–4, with level 1 as the reference);
Age (continuous);
Land size (continuous).
The categorical variable “education” was included using dummy coding, with reference to the lowest education category. The regression coefficients obtained for education levels 2, 3, and 4 represent the relative effect of higher education levels compared to the base category. The choice of independent variables was primarily driven by data availability from the administrative registry of the APPRRR. Although variables such as income, capital assets, and detailed production types would be valuable, they were not part of the dataset. Nevertheless, the variables that were available—such as gender, age, education, land size, livestock ownership, and farm type—are commonly used in the literature as proxies for socio-economic status, managerial capacity, and environmental attitudes. The basic model of binary logistic regression is:
log(p/(1 − p)) = β0 + β1X1 + β2X2 + … + βkXk
where:
  • p/(1 − p)—represents the odds, or the ratio of the probability that the outcome will occur;
  • log(p/(1 − p))—is the logit function (the logarithm of the odds);
  • β0—is the intercept (constant);
  • βi: is the regression coefficient for each independent variable Xi.

2.3. Qgis for Spatial Data Analysis

To explore the spatial distribution of Measures uptake (M10, M11, and M13) during the period from 2015 to 2022, QGIS software (version 3.32.3) was used. QGIS is an open source geographic information system developed for processing and visualizing geospatial data [45]. Data on measure beneficiaries were provided by the Paying Agency for Agriculture, Fisheries and Rural Development (APPRRR) in the form of attribute tables, while spatial data, such as parcel boundaries and coordinates, were retrieved from the APPRRR’s official spatial data portal. These datasets were merged within QGIS, enabling the creation of thematic maps illustrating the geographic dispersion and density of agricultural parcels enrolled in each measure. Through this spatial visualization, regional patterns and potential spatial clusters of RDP measure utilization were identified and analyzed.

3. Results

Our sample consisted of 81,912 family farms that used at least some measure of the Croatian CAP in the period 2014–2022. Of the total sample (Table 2), men made up 73.26%, while the age group was dominated by those from 41 to 65 years old with 48.10%. The youngest farmer was 19 years old, and the oldest was 101 years old. In terms of education, the largest number of farmers were those who completed secondary school (38.97%).

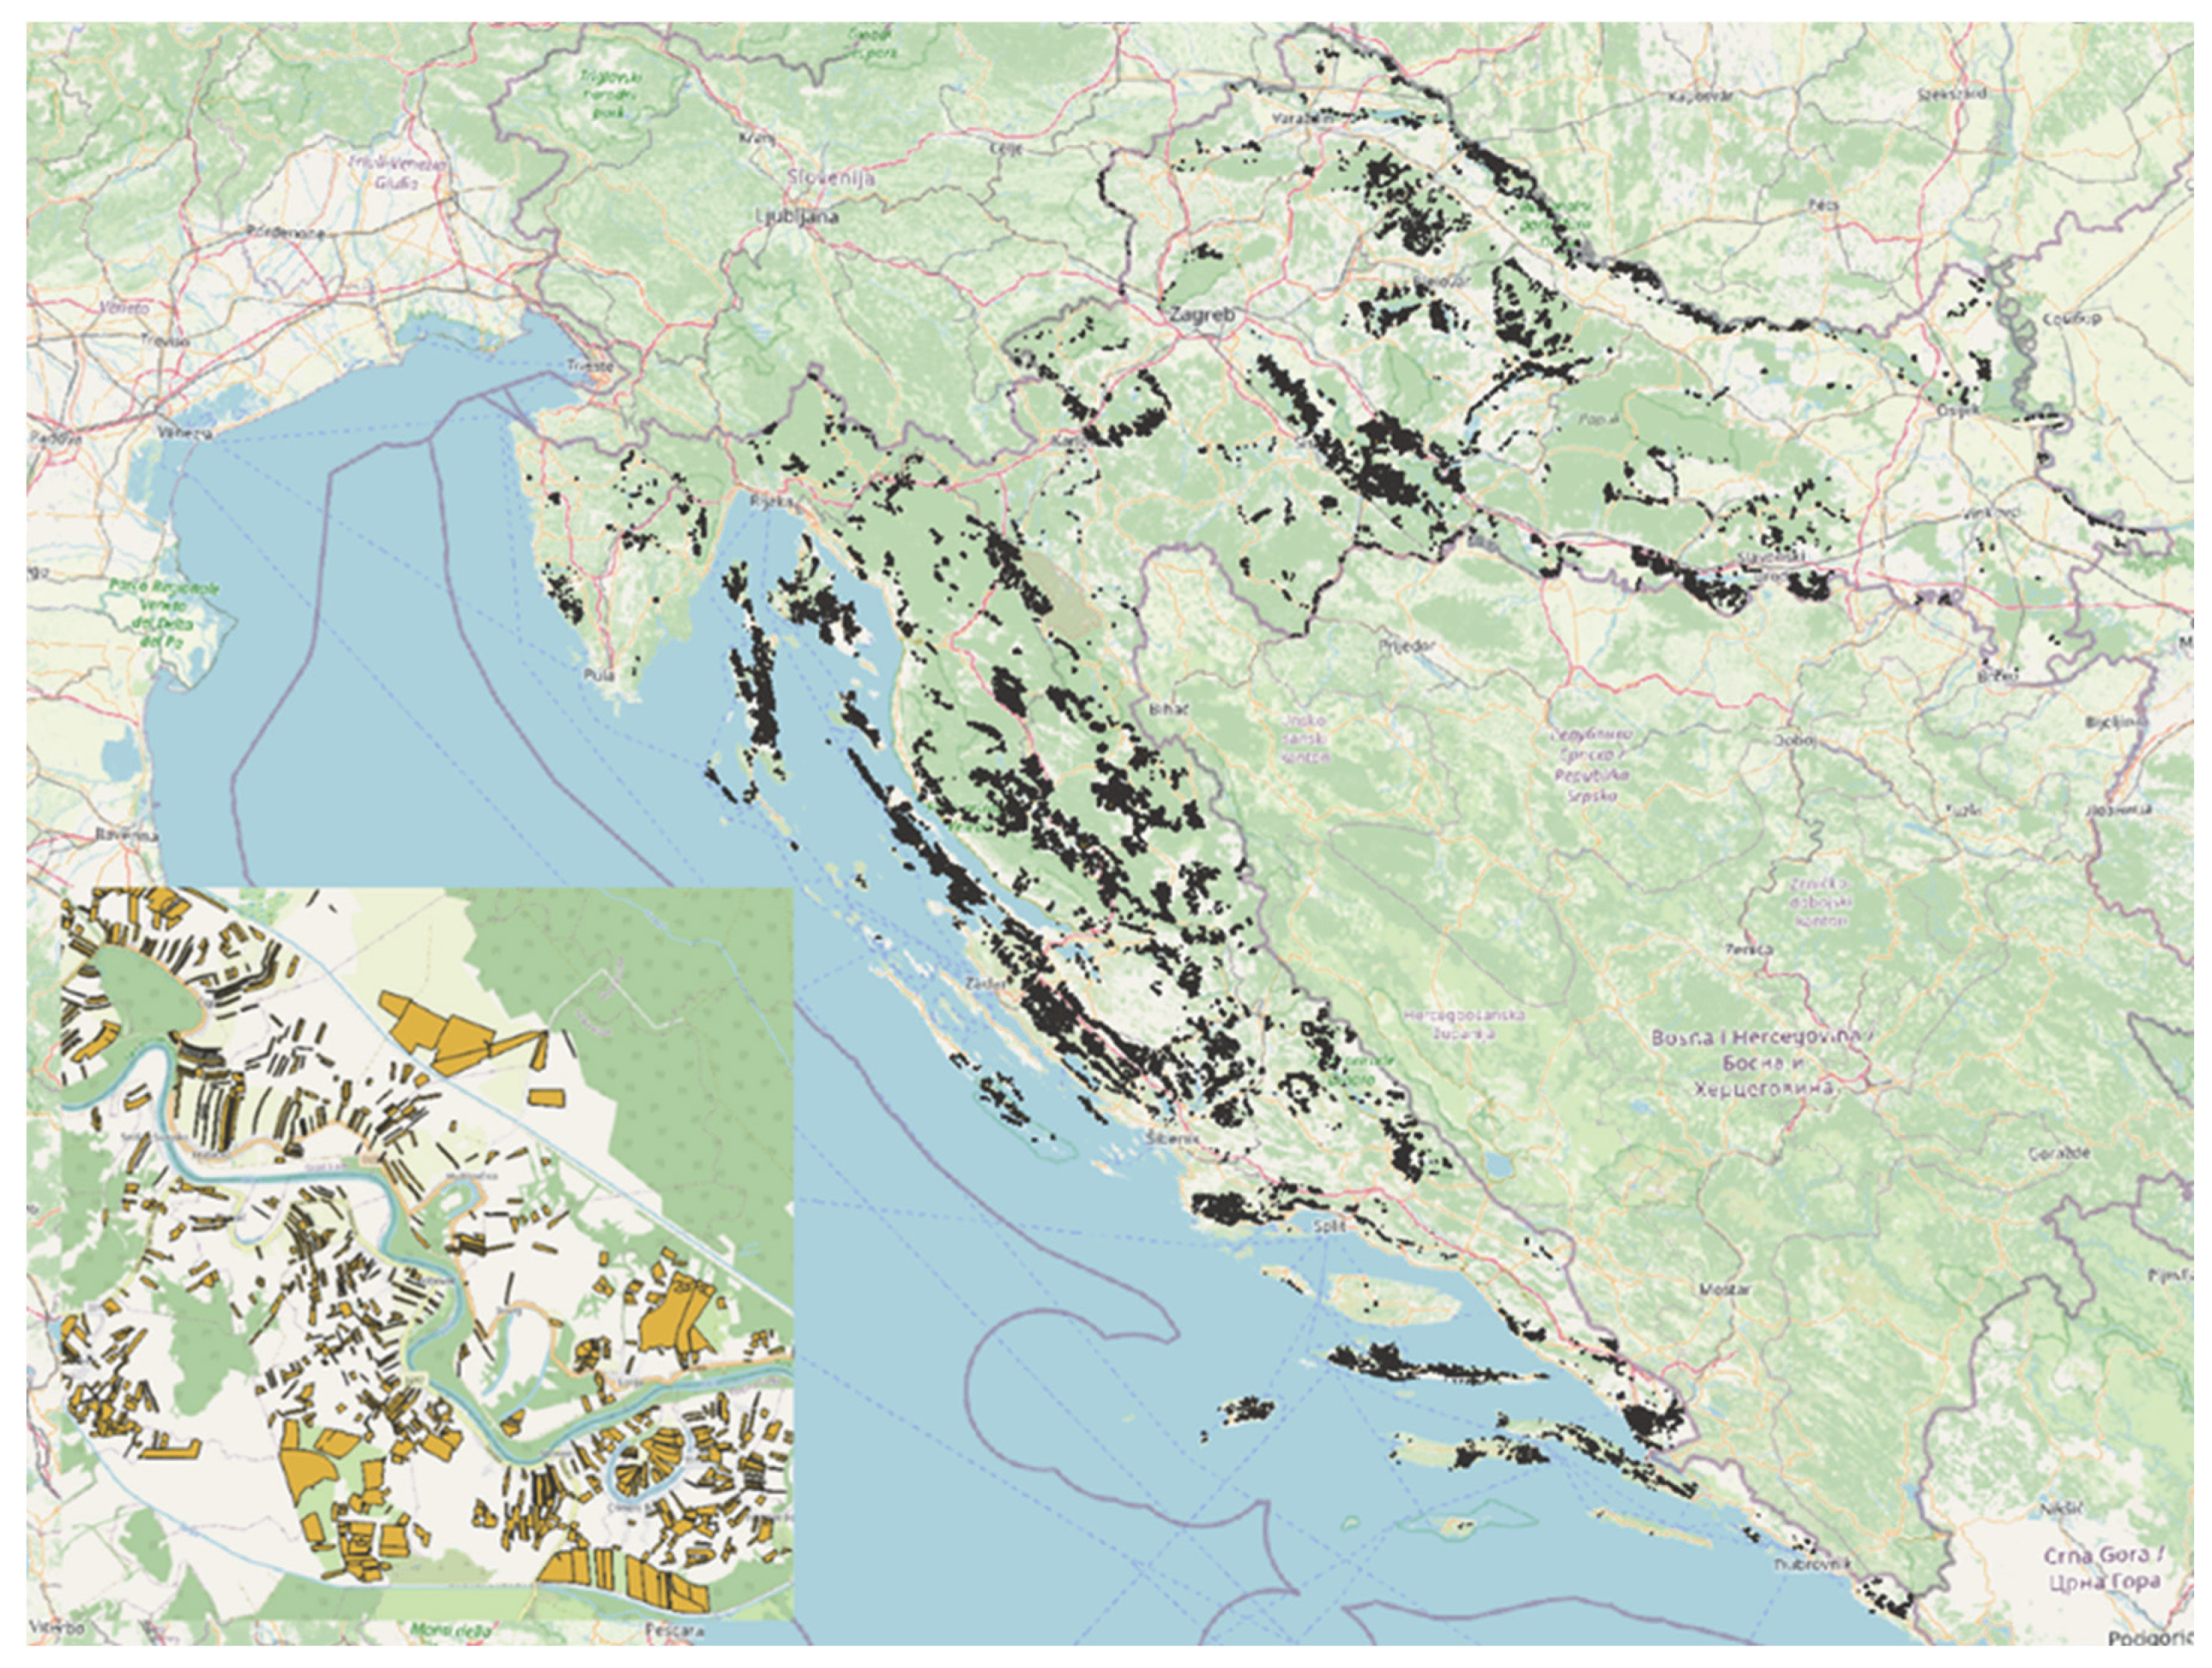
3.1. Analysis of the Use of Measure 10—Agriculture, Environment, and Climate Change

Between 2015 and 2022, M10 encompassed a range of schemes aimed at preserving biodiversity and landscape features. Farmers participating in these schemes were required to commit for a five-year period, with common conditions including annual CAP support applications, regular training, and the proper documentation of implemented practices [37]. Our analysis revealed that during this period, a total of 18,400 family farms participated in M10 (Figure 2 and Table 3), with male farm holders accounting for 75.81% of users. The youngest beneficiary was 19 years old, the oldest 110 years old, with an average age of 57.2 years. The most represented age group was 41–65 years, comprising 48.87% of participants. In terms of education, the majority held a secondary school qualification (43.11%). Additionally, 6.03% of participating family farms kept livestock. The number of M10 beneficiaries steadily increased throughout the 2015–2022 period (Figure 3). The analysis of the overview map (Figure 2) indicates that the use of Measure 10 is most prominent in the continental part of Croatia, with particularly high concentrations of farms in eastern Slavonia and Baranja, as well as in northern regions, such as Međimurje, Podravina, and parts of the Zagreb, Bjelovar-Bilogora, and Koprivnica-Križevci counties. These areas are characterized by favorable agro-ecological conditions, well-developed agricultural production, and a high level of integration into the system of rural support measures. In contrast, significantly lower participation is recorded in mountainous areas, as well as in coastal and island regions, where agricultural conditions are less favorable and farms tend to be smaller and more fragmented. The enlarged section of the same figure provides an additional insight into the spatial organization of land at the micro-level. This detailed depiction clearly reveals a high degree of land fragmentation, reflected in a large number of small, dispersed, and unconnected parcels that make up the production units of individual farms. Such a structure poses a serious challenge to economic efficiency, increases operational costs, and reduces the logistical and technical flexibility of agricultural activities. Nevertheless, the fact that even these fragmented parcels are actively included in Measure 10 highlights the strong motivation of farmers to engage in agri-environmental practices, as well as the effectiveness of advisory and institutional support in the measure’s implementation.
The chi-squared test revealed a statistically significant association between gender, education level, and livestock ownership and the use of Measure 10 (Table 4). Additionally, the Mann–Whitney U test showed a statistically significant difference in age between those who participated in M10 and those who did not (W = 2.39 × 10¹³, p < 0.001). The results from the binary logistic regression analysis indicated that gender, education level, age, and livestock ownership all had a statistically significant effect on the likelihood of participation in Measure 10. Based on the model coefficients (Table 5), we can conclude that men are more likely than women to participate, higher education levels increase the likelihood of participation, older individuals are less likely to participate, and livestock ownership increases the probability of engaging in M10 measure. Compared to the reference category, each higher level of education corresponds to a greater probability of participation, with the highest education level associated with the most significant increase. The analysis of the frequency of implementation across different operations within Measure 10 revealed notable variations in uptake. Some measures recorded high usage rates, while others were almost entirely underutilized, possibly reflecting specific needs, regional disparities, or differing priorities among agricultural producers. Among the most frequently implemented measures was mechanical weed control in the rows of perennial crops, with a total of 5829 beneficiaries.

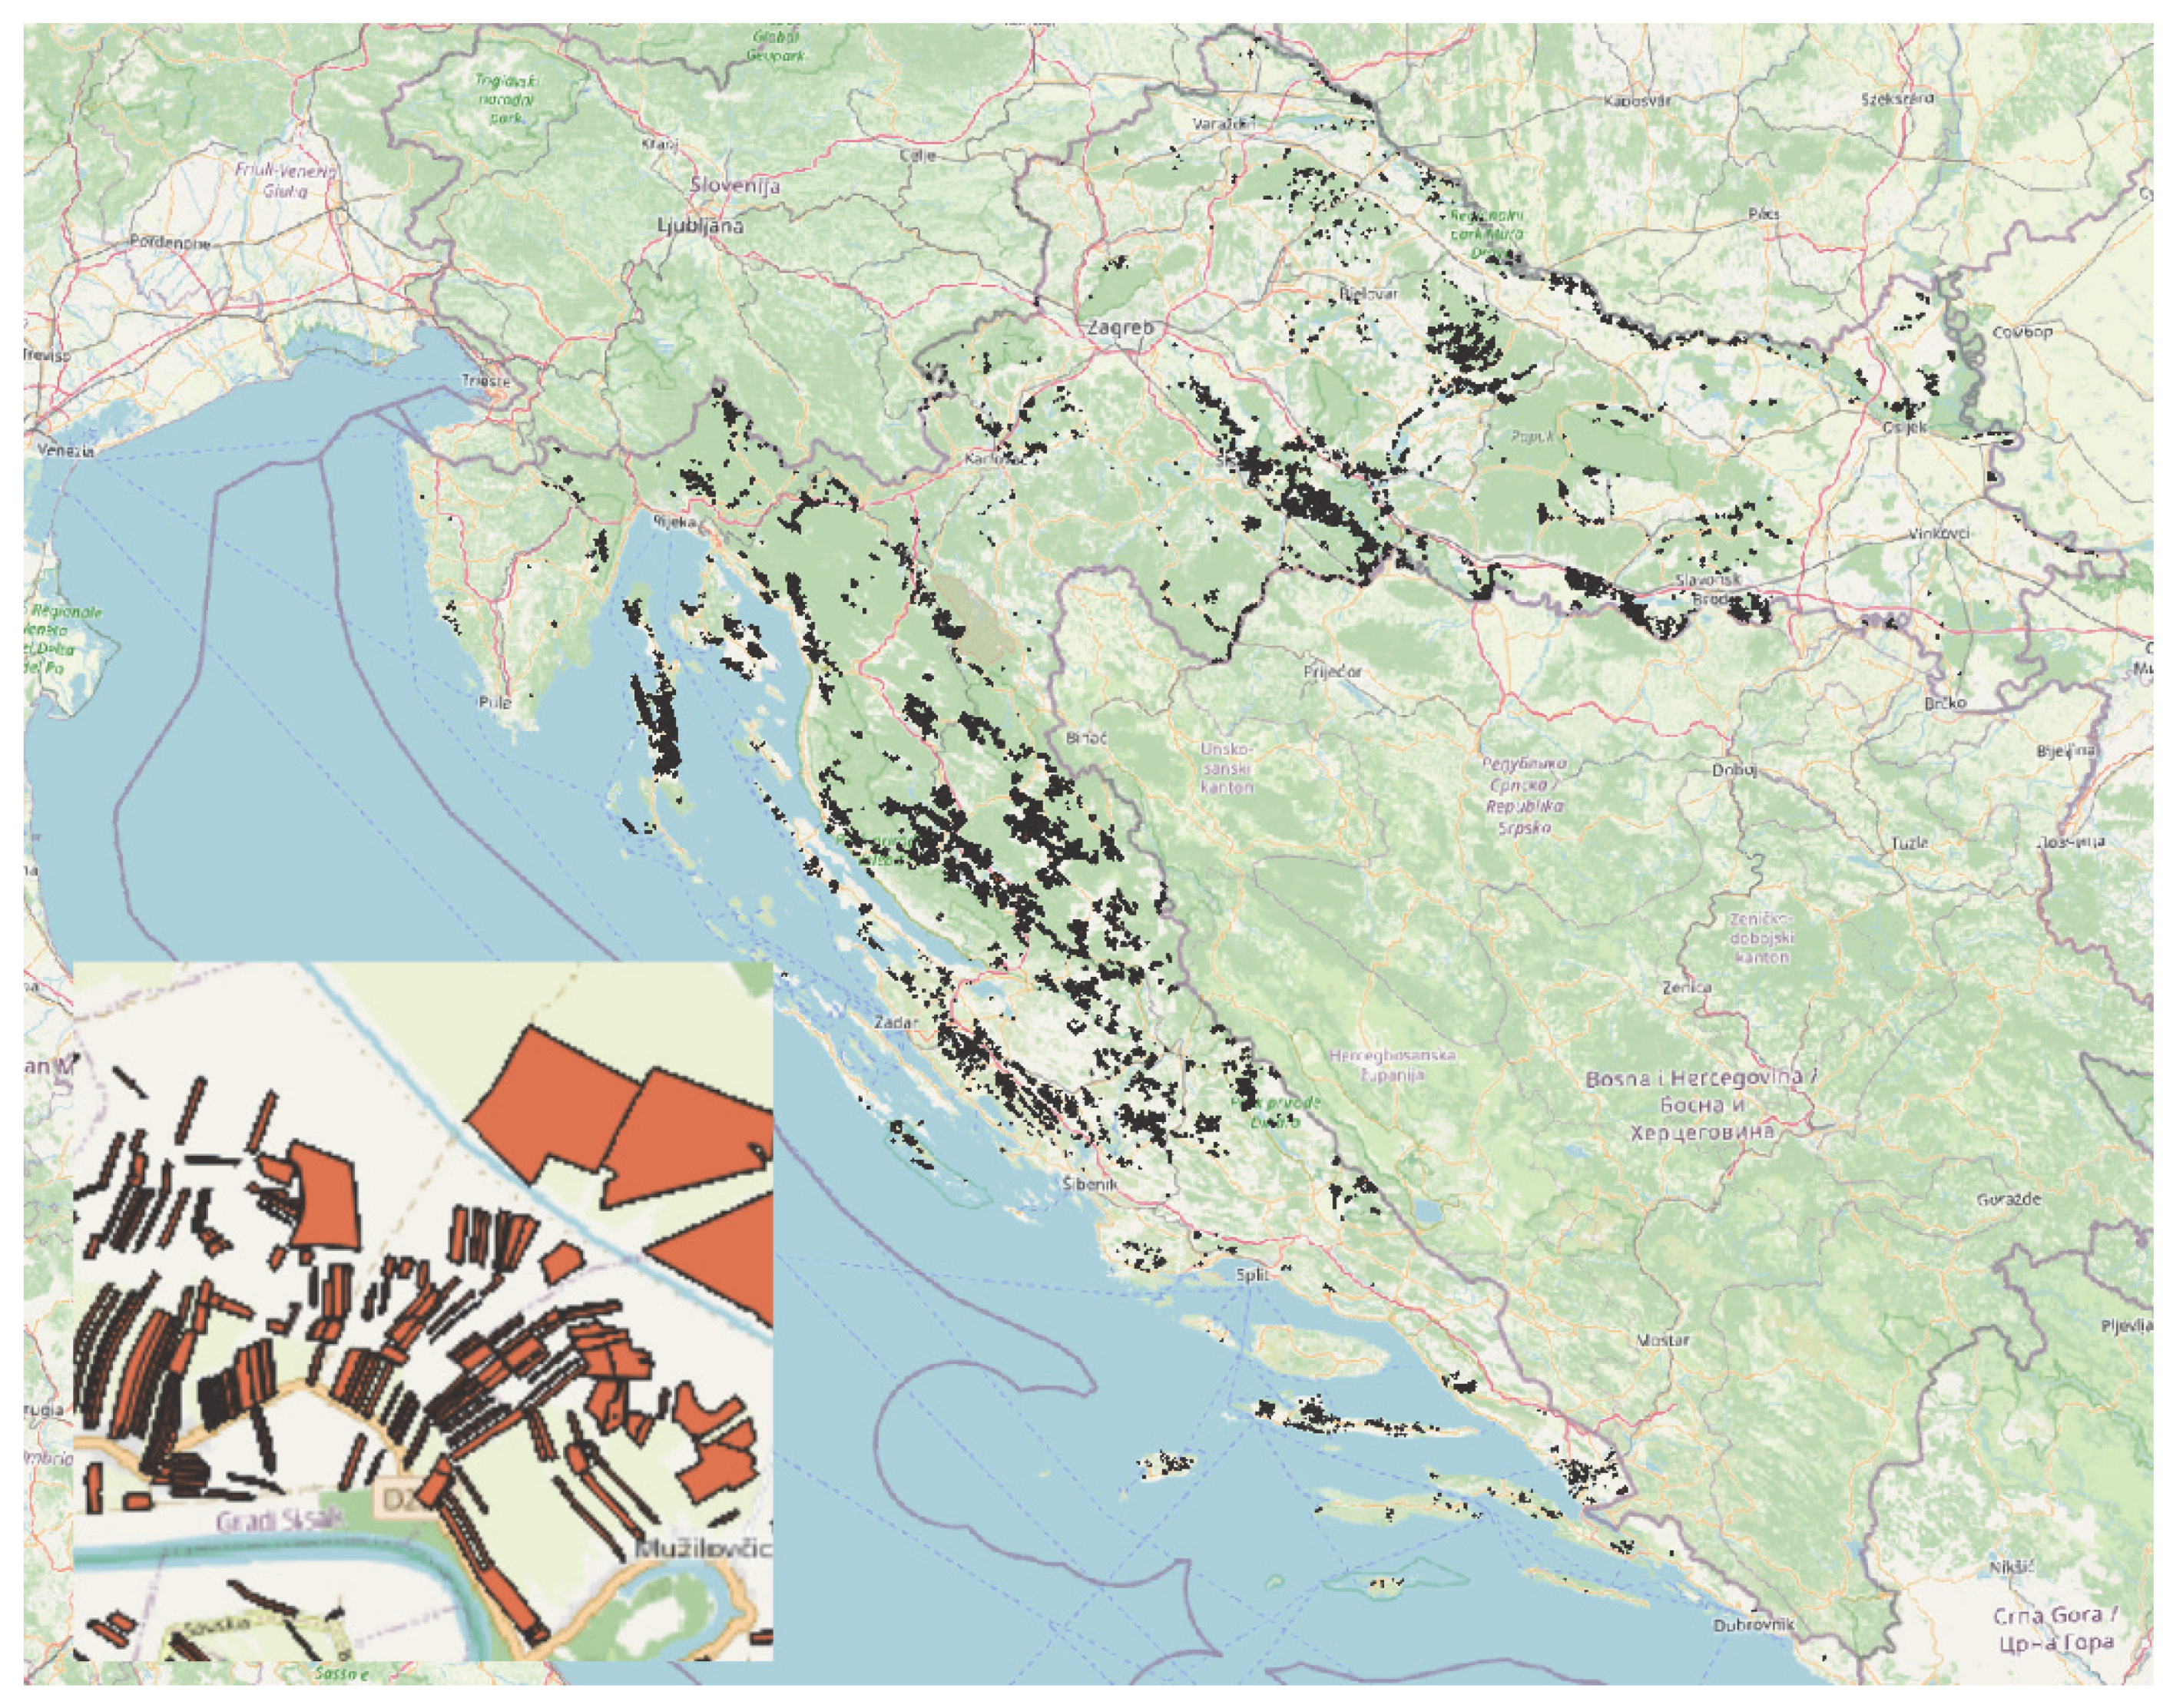
3.2. Analysis of the Use of Measure 11—Organic Farming

One of the main factors contributing to the significant increase in organically farmed land in Croatia is the implementation of Measure 11, which provides support to beneficiaries transitioning to organic farming or continuing organic agricultural practices. Particularly important is the increase in support for the conversion period, which is 20% higher than the support provided for maintaining organic production. This increased amount compensates for the reduced yields during the transition from conventional to organic farming, as well as for the inability to market products as “organic” during that period [37]. Such support measures have been crucial in promoting organic agriculture, as evidenced by the substantial increase in organically farmed land—from 2660 hectares in 2004 to 129,000 hectares in 2022—accounting for 9% of the total utilized agricultural area [25,46].
The results of our research show that between 2015 and 2022, Measure 11 (M11) was utilized by 5484 family farms (Figure 4 and Table 6), with male owners accounting for 72.48% of the total. The youngest farmer was 20 years old, the oldest was 95 years old, and the average age of M11 beneficiaries was 51.7 years. The most represented age group was 41 to 65 years, comprising 54.91% of users, while the most common education level among beneficiaries was secondary education, with 44.39% (Table 6). The results also indicate that 12.9% of all participating family farms kept livestock. From 2015 to 2022, the number of family farms using Measure 11 steadily increased (Figure 5). The spatial distribution (Figure 4) shows that Measure 11 is most prevalent in mountainous, hilly, and peripheral areas, as well as on the islands. It is evident that ecological producers are dispersed across a large number of smaller, spatially separated plots. Although the parcels appear to be less fragmented compared to those under Measure 10, a certain degree of fragmentation is still present, which is a characteristic feature of much of Croatia’s rural structure.
The chi-squared test revealed a statistically significant association between gender, level of education, and livestock ownership, and the use of Measure 11 (Table 7). Additionally, the Mann–Whitney U test indicated a statistically significant difference in age between those who participated in M11 and those who did not (W = 13.29, p < 0.001). The results of the binary logistic regression for Measure 11 show that gender, education level, age, and livestock ownership are statistically significant predictors of participation. Men are 23.6% less likely to participate in M11 compared to women; a higher level of education increases the likelihood of participation, older individuals are less likely to participate, and those who own livestock are 4.09-times more likely to be involved in Measure 11 (Table 8).

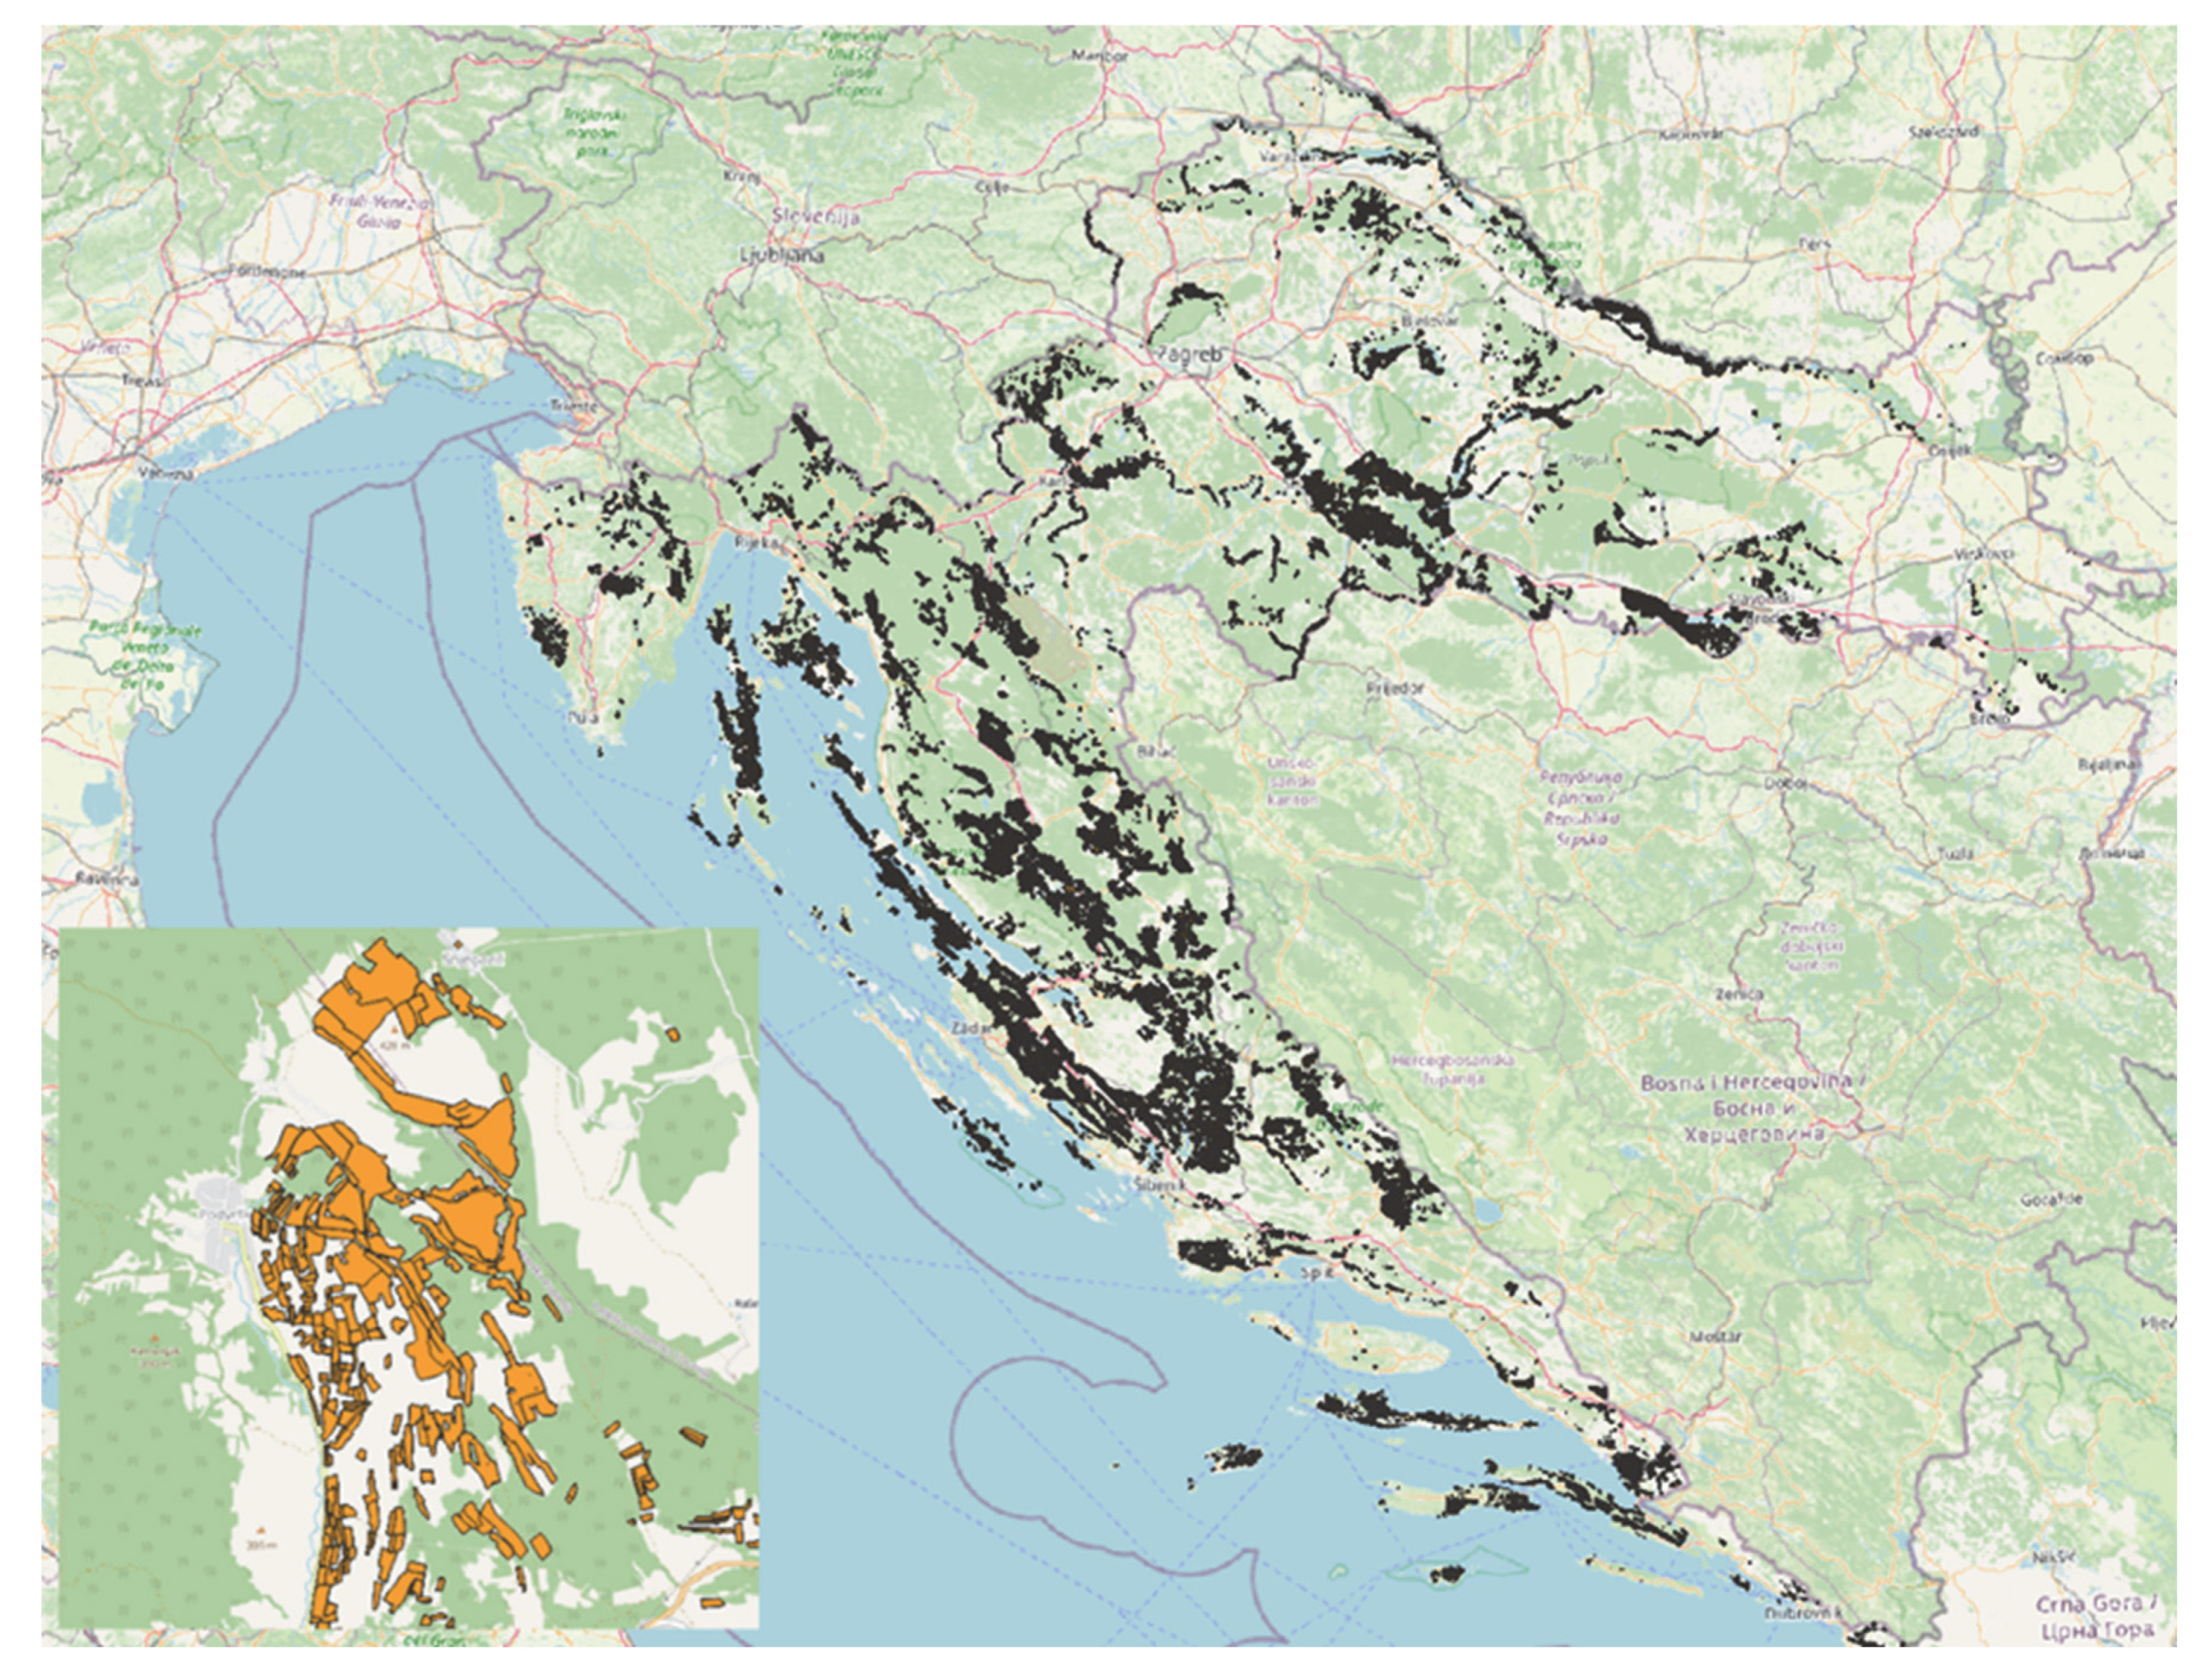
3.3. Analysis of the Use of Measure 13—Payments to Areas Facing Natural Constraints

In mountainous and other “areas with natural constraints” for agricultural production, additional income support is provided to farms through a payment instrument [37]. In Croatia, these areas cover approximately 41% of utilized agricultural land and often overlap with Natura 2000 sites and other protected areas [39]. Support can be granted to natural and legal persons registered in the Farm Register who manage land in these areas, with payments ranging from EUR 82/ha to EUR 226/ha. The aim of the measure is to preserve agricultural production, jobs, and biodiversity, as well as to reduce depopulation in rural areas [37].
The research results show that between 2015 and 2022, Measure 13 (M13) was utilized by 61,514 family farms (Figure 6 and Table 9), of which 73.23% were headed by men. The youngest farmer was 19 years old, the oldest was 110 years old, and the average age of M13 users was 61 years. The most represented age group included farmers aged 41 to 65 (43.86%) years and those over 65 years (42.99%). In terms of education level, the majority had completed secondary school (38.81%). The results also show that 5.01% of the total number were family farms that kept livestock (Table 9). From 2015 to 2022, the number of family farms using M13 steadily increased (Figure 7). The spatial distribution (Figure 6) shows a pronounced presence of Measure 13 in mountainous and hilly areas, including Lika, Gorski Kotar, the Dalmatian hinterland, Banovina, and the Adriatic islands. This reflects the primary purpose of Measure 13—to preserve agriculture in regions where natural conditions (e.g., slope, altitude, climatic factors) or structural disadvantages (e.g., poor infrastructure, depopulation) significantly reduce competitiveness. Coverage is also evident in the peripheral parts of Slavonia and central Croatia, where local natural constraints are likely present (e.g., poor soil quality, limited transport accessibility, demographic decline). The smaller map clearly shows highly fragmented and irregularly shaped parcels, scattered across the landscape. This depiction typifies the rural reality of hilly regions, where terrain configuration and historical settlement patterns have resulted in a mosaic structure of land ownership and use.
The chi-squared test revealed a statistically significant difference in gender, education level, and livestock ownership in relation to the use of Measure 13 (Table 10). Additionally, the Mann–Whitney U test showed a statistically significant difference in age between those who participated in M13 and those who did not (W = 2.26 × 10¹³, p < 0.001). The results of the binary logistic regression for M13 indicate that gender, education level (categories 3 and 4), age, and livestock ownership are statistically significant predictors of participation in the measure. Men were slightly less likely to participate in the measure compared to women. Higher levels of education significantly increased the likelihood of participation: respondents with education in category 3 had a 92.6% higher likelihood, while those in category 4 had a 106.1% higher likelihood compared to the base category. Age also had a positive effect with each additional year of age; the likelihood of participation increased by 0.9%. The strongest predictor was livestock ownership; those who owned animals were over three-times more likely to participate in the measure (Table 11).

4. Discussion

Analysis of the participation of family farms in rural development measures in the period from 2015 to 2022 provides an insight into the complex interplay of demographic, educational, and structural factors influencing farmers’ decision-making processes. These findings are situated within broader trends in European agricultural policy, which increasingly emphasize environmental sustainability, biodiversity protection, and climate adaptation [47]. Age emerges as a consistent and significant variable affecting participation. It has been shown that older farmers are less likely to engage in measures. This is consistent with previous studies showing that older farmers tend to be more risk-averse and are less likely to adopt new technologies or farming approaches that deviate from traditional practices [23,48]. While Burton et al. [48] argue that older farmers often internalize a strong “farmer identity script” centered on land stewardship, such a cultural attachment to agricultural heritage may paradoxically function both as a motivator and a barrier: encouraging landscape protection in principle, while resisting the bureaucratic and technological innovations required by modern policy instruments. Gender inequality remains another prominent dimension. Data confirm that male farmers dominate as farm holders participating in M10, M11, or M13, reinforcing the existing, gendered power dynamics. The research by Sachs et al., Genius et al. and Azam et al. [49,50,51] highlights that women, despite their significant contributions to agricultural labor, are often excluded from formal decision-making and political engagement. These gender disparities reflect deeply rooted cultural norms, limited access to land ownership and credit for women, and systemic underrepresentation within institutional structures. Consequently, efforts to improve participation in sustainability programs must go beyond gender-neutral policy design and incorporate gender-sensitive approaches, including capacity-building and empowerment strategies [22]. The level of education emerged as a key enabling factor. Farmers with higher levels of education were significantly more likely to participate in environmentally focused measures. Educated farmers generally perceive such programs not as a regulatory burden, but as an opportunity for innovation and long-term resilience. This supports the previous findings linking education with greater responsiveness to agri-environmental policy, improved access to information, and increased awareness of ecological issues [52,53,54]. Spatial analysis of Figure 2, Figure 4, and Figure 6 reveals notable regional differences in the application of rural development measures in Croatia (2015–2022). Measure 10 is most commonly applied in lowland, economically developed areas with intensive agricultural activity, while Measure 11 is more prevalent in ecologically preserved, less urbanized, and marginal regions. Measure 13 shows the broadest geographic coverage, targeting areas with natural constraints, such as mountainous and island zones. Despite these spatial differences, all three measures are frequently implemented on small, fragmented, and irregular parcels. This demonstrates a certain level of adaptability among farmers and the functionality of institutional support systems. However, structural constraints within Croatian agriculture continue to limit broader adoption. Approximately 70% of farmers manage holdings smaller than 5 hectares, with an average farm size of only 7 hectares [55]. Such fragmentation hampers modernization, the efficient application of agro-ecological practices, and integration into competitive markets. Previous studies have consistently shown that farm size plays a critical role in the adoption of agri-environmental measures. Larger farms are generally more likely to participate, owing to greater administrative capacity and the ability to absorb transaction costs [22,23,54]. In contrast, smaller or part-time farms often perceive higher economic risks and bureaucratic complexity, which reduces their willingness to participate [55].
Although this aspect was not directly investigated in our study, numerous previous studies have identified a range of economic, ecological, and institutional barriers that influence farmers’ participation in environmental management practices. Economic challenges include income insecurity, high transaction costs, delayed payments, and insufficient compensation for income forgone, which particularly affect smaller farms and those in disadvantaged areas [22,23]. From an ecological perspective, a poor alignment of measures with local agroecological conditions can reduce their relevance and effectiveness on the ground [15]. In addition, administrative complexity, a lack of advisory support, and unclear eligibility criteria further hinder access to these schemes [14,55]. These findings highlight the need for a more context-sensitive approach that accounts for local capacities and the obstacles faced by farms in order to improve the design and implementation of rural development policies.

5. Conclusions

The results confirm all three hypotheses and show a high degree of consistency with the existing literature on measure for nature conservation policy uptake. Socio-demographic variables, such as age, gender, and education, as well as structural factors, like livestock ownership, behaved in expected manner. Although no unexpected patterns emerged, the confirmation of these associations using a large, national administrative dataset strengthens the external validity of the prior findings and demonstrates their applicability in the Croatian context. These results contribute to a more nuanced understanding of how established participation drivers function within different agricultural systems and institutional environments.
The findings of this study offer several concrete implications for the design and implementation of nature conservation measures within the Croatian Rural Development Programme. Given that participation is significantly influenced by age, education, and land size, future policy design should consider more targeted outreach to older and less-educated farm holders, who may face informational or administrative barriers. In addition, support mechanisms—such as simplified application procedures, tailored advisory services, and awareness campaigns—could be instrumental in encouraging participation among smaller farms and those without livestock. Spatial disparities also suggest the need for geographically differentiated strategies, possibly involving stronger coordination with local institutions and rural development networks. By aligning measure design more closely with the structural and social realities of family farms, policy makers can enhance both the participation rates and the environmental effectiveness of these programs.
These findings suggest that improving the uptake of agri-environmental measures requires more than sector-specific adjustments. Tailored educational and training programs should be developed in cooperation with advisory services and local institutions, aimed especially at older and less-educated farmers. Gender-sensitive outreach could include targeted communication strategies, the active promotion of female farmer networks, and the integration of equity goals into national strategies. Structural land reform may involve land consolidation programs, simplified cadaster systems, and support schemes for young farmers to access land. Administrative simplification—such as streamlined digital platforms, local advisory assistance, and pre-filled applications—can lower participation barriers for small farms. These recommendations go beyond the scope of agricultural policy and should be seen as part of an integrated rural development approach that involves multiple sectors, including education, territorial planning, and social inclusion.
Although this study provides valuable insights into the demographic and structural factors influencing the adoption of agri-environmental measures, it has several limitations. The use of cross-sectional administrative data from 2015 to 2022 allows the identification of significant associations, but limits the ability to draw causal conclusions. The analysis was limited to variables available in the dataset, such as age, gender, education, and livestock ownership. Potentially influential socio-economic or psychological factors, such as income level, access to advisory services, perception of the effectiveness of measures, or attitudes toward environmental protection, were not considered. In addition, a significant proportion of missing or unreported data, particularly on education levels, may have led to distortions and affected modeling accuracy. While the spatial analysis illustrated regional patterns of uptake, this study did not fully explore local environmental or cultural contexts that might influence participation. To address these limitations, future research should include longitudinal studies to assess behavioral change over time, as well as qualitative approaches to capture farmers’ perspectives and motivations. Including a wider range of variables and conducting comparative analyses with other EU Member States could further improve our understanding and support the development of more targeted, effective, rural development interventions. At the same time, the Croatian case offers insights that may be relevant for other EU Member States—particularly those with a high share of small family farms and similar structural challenges. The patterns identified in this study, such as the influence of aging, lower education levels, and limited land resources on participation, reflect the broader dynamics present in many semi-peripheral agricultural systems within the EU. Therefore, the results contribute not only to a national-level understanding, but also to comparative rural policy debates at the European level.

Author Contributions

Conceptualization, L.P.; methodology, L.P. and S.J.M.; validation, T.S., D.K. and S.J.M.; formal analysis, L.P.; investigation, L.P.; data curation, L.P.; writing—original draft preparation, L.P. and S.J.M.; writing—review and editing, L.P., M.P. and S.J.M.; visualization, L.P. and M.P.; supervision, T.S., D.K. and S.J.M. All authors have read and agreed to the published version of the manuscript.

Funding

This research was funded by the Bioecon research team at the Faculty of Agrobiotechnical Sciences Osijek.

Data Availability Statement

The data obtained in the experiment can be retrieved from the corresponding authors upon reasonable request.

Conflicts of Interest

The authors declare no conflicts of interest.

References

  1. Lowder, S.K.; Sánchez, M.V.; Bertini, R. Farms, Family Farms, Farmland Distribution and Farm Labour: What Do We Know Today? FAO Agricultural Development Economics Working Paper. Food Security and Nutrition. 2019. Available online: https://www.fao.org/agrifood-economics/publications/detail/en/c/1252236/ (accessed on 25 February 2025).
  2. Lowder, S.K.; Sánchez, M.V.; Bertini, R. Which farms feed the world and has farmland become more concentrated? World Dev. 2021, 142, 105455. [Google Scholar] [CrossRef]
  3. Eurostat. Agriculture Statistics—Family Farming in the EU. 2023. Available online: https://ec.europa.eu/ (accessed on 25 February 2025).
  4. Klikocka, H.; Zakrzewska, A.; Chojnacki, P. Characteristics of Models of Farms in the European Union. Sustainability 2021, 13, 4772. [Google Scholar] [CrossRef]
  5. Bélières, J.; Philippe, B.; Bosc, P.; Losch, B.; Marzin, J.; Sourisseau, J.-M. Family Farming Around the World. Definitions, Contributions and Public Policies. A Savoir: AFD. Report. 2015. Available online: https://www.researchgate.net (accessed on 27 May 2025).
  6. OECD. Innovation, Productivity and Sustainability in Food and Agriculture: Main Findings from Country Reviews and Policy Lessons; OECD Food and Agricultural Reviews; OECD Publishing: Paris, France, 2019. [Google Scholar] [CrossRef]
  7. Czekaj, M.; Adamsone-Fiskovica, A.; Tyran, E.; Kilis, E. Small farms’ resilience strategies to face economic, social, and environmental disturbances in selected regions in Poland and Latvia. Glob. Food Secur. 2020, 26, 100416. [Google Scholar] [CrossRef]
  8. Dorward, A.; Hazell, P.B.R.; Poulton, C.; Wiggins, S. The Future of Small Farms for Poverty Reduction and Growth; 2020 vision discussion papers 42; International Food Policy Research Institute (IFPRI): Washington, DC, USA, 2007. [Google Scholar]
  9. Graeub Benjamin, E.; Chappell, M.J.; Wittman, H.; Ledermann, S.; Kerr, R.B.; Gemmill-Herren, B. The State of Family Farms in the World. World Dev. 2016, 87, 1–15. [Google Scholar] [CrossRef]
  10. Raney, T.; Croppenstedt, A.; Anriquez, G.; Lowder, S. The State of Food and Agriculture 2010–11: Women in Agriculture: Closing the Gender Gap for Development; Food and Agriculture Organization: Rome, Italy, 2011; Available online: https://www.fao.org/4/i2050e/i2050e.pdf (accessed on 25 February 2025).
  11. Altieri, M. Agroecology, Small Farms, and Food Sovereignty. Mon. Rev. 2009, 61, 102. [Google Scholar] [CrossRef]
  12. Zimmerer, K.; Carney, J.; Vanek, S. Sustainable Smallholder Intensification in Global Change? Pivotal Spatial Interactions, Gendered Livelihoods, and Agrobiodiversity. Curr. Opin. Environ. Sustain. 2015, 14, 49–60. [Google Scholar] [CrossRef]
  13. Ricciardi, V.; Mehrabi, Z.; Wittman, H.; James, D.; Ramankutty, N. Higher yields and more biodiversity on smaller farms. Nat. Sustain. 2021, 4, 651–657. [Google Scholar] [CrossRef]
  14. Pe’er, G.; Lakner, S.; Passoni, G.; Azam, C.; Berger, J.; Hartmann, L.; Schüler, S.; Müller, R.; von Meyer-Höfer, M.; Zinngrebe, Y. Is the CAP Fit for Purpose? An Evidence-Based, Rapid Fitness-Check Assessment—Preliminary Summary of Key Outcomes. Leipzig, June 2017. Available online: https://www.researchgate.net/publication/318361763_Is_the_CAP_Fit_for_purpose_An_evidence-based_rapid_Fitness-Check_assessment_-_Preliminary_Summary_of_key_outcomes_Leipzig_2017 (accessed on 29 June 2025).
  15. Batáry, P.; Dicks, L.V.; Kleijn, D.; Sutherland, W.J. The role of agri-environment schemes in conservation and environmental management. Conserv. Biol. 2015, 29, 1006–1016. [Google Scholar] [CrossRef]
  16. OECD. Evaluation of Agri-Environmental Policies: Selected Methodological Issues and Case Studies; OECD Publishing: Paris, France, 2015. [Google Scholar] [CrossRef]
  17. European Court of Auditors. Is Agri-Environment Support Well Designed and Managed? Special Report No 7. 2011. Available online: https://www.eca.europa.eu (accessed on 27 May 2025).
  18. Capitanio, F.; Adinolfi, F.; Malorgio, G. What explains farmers’ participation in Rural Development Policy in Italian southern region? an empirical analysis. New Medit 2011, 10, 19–24. [Google Scholar]
  19. Grammatikopoulou, I.; Pouta, E.; Myyrä, S. Exploring the determinants for adopting water conservation measures. What is the tendency of landowners when the resource is already at risk? J. Environ. Plan. Manag. 2015, 59, 993–1014. [Google Scholar] [CrossRef]
  20. Cullen, P.; Hynes, S.; Ryan, M.; O’Donoghue, C. More than two decades of Agri-Environment schemes: Has the profile of participating farms changed? J. Environ. Manag. 2021, 292, 112826. [Google Scholar] [CrossRef]
  21. Novak, A.; Šumrada, T.; Černič Istenič, M.; Erjavec, E. Farmers’ decision to participate in agri-environmental measures for the conservation of extensive grasslands in the Haloze region. Acta Agric. Slov. 2022, 118, 1–16. [Google Scholar] [CrossRef]
  22. Defrancesco, E.; Gatto, P.; Runge, F.; Trestini, S. Factors Affecting Farmers’ Participation in Agri-environmental Measures: A Northern Italian Perspective. J. Agric. Econ. 2008, 59, 114–131. [Google Scholar] [CrossRef]
  23. Vanslembrouck, I.; Van Huylenbroeck, G.; Verbeke, W. Determinants of the Willingness of Belgian Farmers to Participate in Agri-environmental Measures. J. Agric. Econ. 2002, 53, 489–511. [Google Scholar] [CrossRef]
  24. Chaplin, H.; Davidova, S.; Gorton, M. Agricultural adjustment and the diversification of farm households and corporate farms in Central Europe. J. Rural Stud. 2004, 20, 61–77. [Google Scholar] [CrossRef]
  25. Ministry of Agriculture. Annual Report on the State of Agriculture in 2022. 2023. Available online: https://poljoprivreda.gov.hr (accessed on 3 March 2025).
  26. The Croatian Bureau of Statistics (DZS). Statistical Information 2023. Available online: https://podaci.dzs.hr/media/t4jbehpz/stat-info-2023.pdf (accessed on 28 May 2025).
  27. FAO Family Farming Knowledge Platform—Croatia. 2021. Available online: https://www.fao.org/family-farming/countries/hrv/en/ (accessed on 28 May 2025).
  28. Narodne Novine. Zakon o Obiteljskom Poljoprivrednom Gospodarstvu. 2018. Available online: https://narodne-novine.nn.hr/clanci/sluzbeni/2018_03_29_585.html (accessed on 25 February 2025).
  29. Narodne Novine. Pravilnik o Upisniku Obiteljskih Poljoprivrednih Gospodarstava. 2023. Available online: https://narodne-novine.nn.hr/clanci/sluzbeni/2023_07_80_1267.html (accessed on 25 February 2025).
  30. Župančić, M. Obiteljska poljoprivredna gospodarstva i ruralni razvitak u Hrvatskoj. Sociol. Prost. 2005, 43, 171–194. [Google Scholar]
  31. Defilippis, J. Razvoj obiteljskih gospodarstava Hrvatske i zadrugarstvo. Sociol. Prost. 2005, 43, 43–59. [Google Scholar]
  32. Žimbrek, T.; Franić, R.; Juračak, J. Strateški prioriteti hrvatske poljoprivrede—ograničenja i mogućnosti. Agroecon. Croat. 2001, 1, 1–14. [Google Scholar]
  33. Franić, R.; Žimbrek, T.I.; Grgić, Z. Agrarna politika u Republici Hrvatskoj na putu od poljoprivrednoga do održivoga ruralnog razvitka. Društvena Istraživanja 2003, 12, 1027–1049. [Google Scholar]
  34. Mikuš, O.; Franić, R.; Radić, T.; Kovačićek, T. Harmonization with the Common agricultural policy for a new member state: The case of Croatia. Econ. Eng. Agric. Rural Dev. 2020, 20, 375–381. [Google Scholar]
  35. Official Journal of the EU. Regulation (EU) No 1307/2013 of the European Parliament and of the Council of 17 December 2013 Establishing Rules for Direct Payments to Farmers Under Support Schemes Within the Framework of the Common Agricultural Policy and Repealing Council Regulation (EC) No 637/2008 and Council Regulation (EC) No 73/2009. Available online: https://eur-lex.europa.eu (accessed on 29 May 2025).
  36. Narodne Novine. Pravilnik o Višestruskoj Sukladnosti [Regulation on Cross-Compliance]. NN 113/2019. 2019. Available online: https://narodne-novine.nn.hr/clanci/sluzbeni/2019_11_113_2277.html (accessed on 29 May 2025).
  37. Narodne Novine. Pravilnik o Provedbi Izravne Potpore Poljoprivredi i IAKS Mjera Ruralnog Razvoja za 2022. Godinu [Regulation on the Implementation of Direct Payments in Agriculture and IAKS Rural Development Measures in 2022]. NN 27/2022. 2022. Available online: https://narodne-novine.nn.hr/clanci/sluzbeni/2022_03_27_352.html (accessed on 29 May 2025).
  38. Rac, I.; Erjavec, K.; Erjavec, E. Agriculture and environment: Friends or foes? Conceptualising agri-environmental discourses under the European Union’s Common Agricultural Policy. Agric. Hum. Values 2024, 41, 147–166. [Google Scholar] [CrossRef]
  39. Ministry of Agriculture. Rural Development Programme of the Republic of Croatia for the Period 2014–2020. 2015. Available online: https://ruralnirazvoj.hr (accessed on 3 March 2025).
  40. European Commission. Factsheet on 2014–2020 Rural Development Programme for Croatia. 2025. Available online: https://agriculture.ec.europa.eu (accessed on 29 May 2025).
  41. The Paying Agency for Agriculture, Fisheries and Rural Development (APPRRR). Farmers’ Register. Available online: https://www.apprrr.hr/upisnik-poljoprivrednika/ (accessed on 29 May 2025).
  42. Wickham, H.; François, R.; Henry, L.; Müller, K.; Vaughan, D. dplyr: A Grammar of Data Manipulation. R Package Version 1.1.4. 2023. Available online: https://dplyr.tidyverse.org (accessed on 15 March 2025).
  43. Pebesma, E.; Bivand, R. Spatial Data Science: With Applications in R, 1st ed.; Chapman and Hall/CRC: Boca Raton, FL, USA, 2023; 314p. [Google Scholar] [CrossRef]
  44. Al Bairmani, Z.A.A.; Ismael, A.A. Using Logistic Regression Model to Study the Most Important Factors Which Affects Diabetes for The Elderly in The City of Hilla/2019. J. Phys. Conf. Ser. 2021, 1818, 012016. [Google Scholar] [CrossRef]
  45. QGIS Development Team. QGIS Geographic Information System. Open Source Geospatial Foundation Project 2024. Available online: http://qgis.org (accessed on 7 April 2025).
  46. Blaće, A.; Čuka, A.; Šiljković, Ž. How dynamic is organic? Spatial analysis of adopting new trends in Croatian agriculture. Land Use Policy 2020, 99, 105036. [Google Scholar] [CrossRef]
  47. Wilson, G.; Hart, K. Financial Imperative or Conservation Concern? EU Farmers’ Motivations for Participation in Voluntary Agri-Environmental Schemes. Environ. Plan. A 2020, 32, 2161–2185. [Google Scholar] [CrossRef]
  48. Burton, R.J.F.; Kuczera, C.; Schwarz, G. Exploring Farmers’ Cultural Resistance to Voluntary Agri-environmental Schemes. Sociol. Rural. 2008, 48, 16–37. [Google Scholar] [CrossRef]
  49. Sachs, C.E.; Barbercheck, M.E.; Brasier, K.J.; Kiernan, N.E.; Terman, A.R. The Rise of Women Farmers and Sustainable Agriculture; University of Iowa Press: Iowa City, IA, USA, 2016; 196p. [Google Scholar]
  50. Genius, M.; Pantzios, C.J.; Tzouvelekas, V. Information acquisition and adoption of organic farming practices. J. Agric. Resour. Econ. 2006, 31, 93–113. [Google Scholar] [CrossRef]
  51. Azam, M.; Banumathi, M. The Role of Demographic Factors in Adopting Organic Farming: A Logistic Model Approach. Int. J. Adv. Res. 2015, 3, 713–720. [Google Scholar]
  52. Howden, S.M.; Soussana, J.F.; Tubiello, F.N.; Chhetri, N.; Dunlop, M.; Meinke, H. Adapting agriculture to climate change. Proc. Natl. Acad. Sci. USA 2007, 104, 19691–19696. [Google Scholar] [CrossRef]
  53. European Commission. Farm to Fork Strategy: For a Fair, Healthy and Environmentally-Friendly Food System. 2020. Available online: https://food.ec.europa.eu (accessed on 15 March 2025).
  54. Zimmermann, A.; Britz, W. European farms’ participation in agri-environmental measures. Land Use Policy 2016, 50, 214–228. [Google Scholar] [CrossRef]
  55. Espinosa, M.; Barreiro-hurle, J.; Ruto, E. What Do Farmers Want From Agri-Environmental Scheme Design? A Choice Experiment Approach. J. Agric. Econ. 2010, 61, 259–273. [Google Scholar] [CrossRef]
Figure 1. Number of all agriculture holding and family farms in 2016–2022 in Croatia.
Agriculture 15 01432 g001
Figure 2. Geographical distribution of implementation of Measure 10 on agricultural land in Croatia in the period 2015–2022 (in proportions 1:2,027,990 and 1:63,375).
Agriculture 15 01432 g002
Figure 3. Number of farmers who enrolled in M10 in the period 2015–2022.
Agriculture 15 01432 g003
Figure 4. Geographical distribution of implementation of Measure 11 on agricultural land in Croatia in the period 2015–2022 (in proportions 1:2,027,990 and 1:63,375).
Agriculture 15 01432 g004
Figure 5. Number of farmers who enrolled in M11 in the period 2015–2022.
Agriculture 15 01432 g005
Figure 6. Geographical distribution of implementation of Measure 13 on agricultural land in Croatia in the period 2015–2022 (in proportions 1:2,027,990 and 1:31,687).
Agriculture 15 01432 g006
Figure 7. Number of farmers who enrolled in M13 in the period 2015–2022.
Agriculture 15 01432 g007
Table 1. Overview of variables included in the analysis.
Variable NameDescriptionMeasurement Unit/Category
Farm IDUnique farm identification numberNumber (e.g., 32,456)
Gender Male or femaleM or F
Date of BirthDate of birth of the farm holderYear (e.g., 1995)
Livestock OwnershipIndicates if the farm owns livestock1 = yes, 0 = no
Land SizeTotal agricultural land usedHectares (ha)
RDP MeasureParticipation in measures M10, M11, M130 = no, 1 = yes, per measure
Age CategoryGrouped age of farm holder1 = ≤40, 2 = 41–65, 3 = >65
Education LevelEducation of farm holder1 = no school, 2 = primary, 3 = secondary, 4 = university, 5 = unknown
Table 2. Demographic characteristics of family farm owners and farm specializations.
N%
Gender
Male60,00773.26
Female21,90026.73
Unknown50.01
Age in category
112,76015.58
239,40048.10
329,75236.32
Education in category
128193.44
215,23818.60
331,91838.97
460557.39
Unknown25,88231.60
Table 3. Demographic characteristics of family farm owners and farm specializations that used M10 in the period 2015–2022.
N%
Gender
Male13,92575.81
Female447424.18
Unknown10.01
Age in category
1330417.96
2899248.87
3610433.16
Education in category
13631.97
2208111.31
3793343.11
4236212.84
Unknown566130.77
Table 4. Chi-squared test for the use of M10 in relation to gender, level of education, and animal ownership.
χ2dfp
Gender and M1011,1641<0.001 ***
Education and M10344,3873<0.001 ***
Livestock and M10129,2751<0.001 ***
*** Statistically highly significant.
Table 5. Results of binary logistic regression for M10.
VariableBS.E.WalddfpExp(B)
Intercept0.62160.0103863.871<0.001 ***1.862
Gender
(Male (vs. Female))
0.04490.00580.711<0.001 ***1.046
Education
Cat 2. (vs. Cat 1)0.17760.006876.161<0.001 ***1.194
Cat 3 (vs. Cat 1)0.84630.00714,616.811<0.001 ***2.331
Cat 4 (vs. Cat 1)1.47200.00833,856.001<0.001 ***4.358
Age−0.00480.0002574.081<0.001 ***0.995
Animals0.69320.00613,347.951<0.001 ***2.000
Note: B: Coefficient (Estimate)—represents the log-odds for each variable; S.E.: Standard Error—a measure of the precision of the coefficient estimate; Wald: Wald Test—tests the hypothesis about the statistical significance of each coefficient; df: Degrees of Freedom—in this case, 1 for each variable; Sig.: p-value—the p-value testing the statistical significance of the coefficient. If it is less than 0.05, the variable is considered statistically significant; Exp(B): Exponentiated Coefficient (Odds Ratio)—indicates how the variable affects the likelihood of the outcome (increase in odds for a one-unit change in the variable); *** statistically highly significant.
Table 6. Demographic characteristics of family farm owners and farm specializations that used M11 in the period 2015–2022.
N%
Gender
Male397572.48
Female150927.52
Age in category
1138325.22
2301154.91
3109019.87
Education in category
1350.64
23596.55
3243544.39
498117.89
Unknown167430.53
Table 7. Chi-squared test for the use of M11 in relation to gender, level of education, and animal ownership.
χ2dfp
Gender and M11718.361<0.001 ***
Education and M11357,6203<0.001 ***
Livestock and M11564,5421<0.001 ***
*** Statistically highly significant.
Table 8. Results of binary logistic regression for M11.
VariableBS.E.WalddfpExp(B)
Intercept−0.52690.01641027.881<0.001 ***-
Gender
(Male (vs. Female))
−0.26850.00385011.521<0.001 ***0.764
Education
Cat 2. (vs. Cat 1)1.01360.01464827.431<0.001 ***2.756
Cat 3 (vs. Cat 1)1.87450.014416,976.941<0.001 ***6.511
Cat 4 (vs. Cat 1)2.76750.014934,611.671<0.001 ***15.922
Age−0.02230.000142,230.661<0.001 ***0.978
Animals1.40670.005271,801.041<0.001 ***4.085
Note: B: Coefficient (Estimate)—represents the log-odds for each variable; S.E.: Standard Error—a measure of the precision of the coefficient estimate; Wald: Wald Test—tests the hypothesis about the statistical significance of each coefficient; df: Degrees of Freedom—in this case, 1 for each variable; Sig.: p-value—the p-value testing the statistical significance of the coefficient. If it is less than 0.05, the variable is considered statistically significant; Exp(B): Exponentiated Coefficient (Odds Ratio)— indicates how the variable affects the likelihood of the outcome (increase in odds for a one-unit change in the variable); *** statistically highly significant
Table 9. Demographic characteristics of family farm owners and farm specializations that used M13 in the period 2015–2022.
N%
Gender
Male45,05273.23
Female16,450 26.73
Unknown120.02
Age in category
18088 13.15
226,984 43.86
326,44242.99
Education in category
125594.16
210,49217.05
323,87038.81
447307.69
Unknown19,86332.29
Table 10. Chi-squared test for the use of M13 in relation to gender, level of education, and animal ownership.
χ2dfp
Gender and M131109.31<0.001 ***
Education and M13114,4613<0.001 ***
Livestock and M1397,3971<0.001 ***
*** Statistically highly significant
Table 11. Results of binary logistic regression for M13.
VariableBS.E.WalddfpExp(B)
Intercept0.0870.0128845.641<0.001 ***-
Gender
(Male (vs. Female))
−0.0370.0040684.891<0.001 ***0.964
Education
Cat 2. (vs. Cat 1)−0.0030.009450.101<0.001 ***0.997
Cat 3 (vs. Cat 1)0.6550.009534719.0110.7521.926
Cat 4 (vs. Cat 1)0.7230.010344890.141<0.001 ***2.061
Age0.00880.000125505.771<0.001 ***1.009
Animals1.2200.0068531,661.471<0.001 ***3.386
Note: B: Coefficient (Estimate)—represents the log-odds for each variable; S.E.: Standard Error—a measure of the precision of the coefficient estimate; Wald: Wald Test—tests the hypothesis about the statistical significance of each coefficient; df: Degrees of Freedom—in this case, 1 for each variable; Sig.: p-value—the p-value testing the statistical significance of the coefficient. If it is less than 0.05, the variable is considered statistically significant; Exp(B): Exponentiated Coefficient (Odds Ratio)— indicates how the variable affects the likelihood of the outcome (increase in odds for a one-unit change in the variable); *** statistically highly significant
Disclaimer/Publisher’s Note: The statements, opinions and data contained in all publications are solely those of the individual author(s) and contributor(s) and not of MDPI and/or the editor(s). MDPI and/or the editor(s) disclaim responsibility for any injury to people or property resulting from any ideas, methods, instructions or products referred to in the content.

