Article

Sugarcane Feed Volume Detection in Stacked Scenarios Based on Improved YOLO-ASM

1
School of Mechanical Engineering, Guangxi University, Nanning 530004, China
2
School of Physics and Electronic Information, Guangxi Minzu University, Nanning 530006, China
*
Author to whom correspondence should be addressed.
Agriculture 2025, 15(13), 1428; https://doi.org/10.3390/agriculture15131428
Submission received: 7 June 2025 / Revised: 24 June 2025 / Accepted: 30 June 2025 / Published: 2 July 2025
(This article belongs to the Section Agricultural Technology)

Abstract

Improper regulation of sugarcane feed volume can lead to harvester inefficiency or clogging. Accurate recognition of feed volume is therefore critical. However, visual recognition is challenging due to sugarcane stacking during feeding. To address this, we propose YOLO-ASM (YOLO Accurate Stereo Matching), a novel detection method. At the target detection level, we integrate a Convolutional Block Attention Module (CBAM) into the YOLOv5s backbone network. This significantly reduces missed detections and low-confidence predictions in dense stacking scenarios, improving detection speed by 28.04% and increasing mean average precision (mAP) by 5.31%. At the stereo matching level, we enhance the SGBM (Semi-Global Block Matching) algorithm through improved cost calculation and cost aggregation, resulting in Opti-SGBM (Optimized SGBM). This double-cost fusion approach strengthens texture feature extraction in stacked sugarcane, effectively reducing noise in the generated depth maps. The optimized algorithm yields depth maps with smaller errors relative to the original images, significantly improving depth accuracy. Experimental results demonstrate that the fused YOLO-ASM algorithm reduces sugarcane volume error rates across feed volumes of one to six by 3.45%, 3.23%, 6.48%, 5.86%, 9.32%, and 11.09%, respectively, compared to the original stereo matching algorithm. It also accelerates feed volume detection by approximately 100%, providing a high-precision solution for anti-clogging control in sugarcane harvester conveyor systems.

1. Introduction

As the core component of sugarcane harvesters, the conveyor system’s continuous stable operation is crucial for ensuring workflow smoothness, directly impacting harvesting efficiency and loss rates [1]. Consequently, accurate real-time identification of sugarcane feed volume is essential for regulating harvester traveling speed and conveyor velocity [2,3,4,5], making feed volume detection critical for adaptive conveyor system stability [6]. Excessive feed volume causes sugarcane stacking, where stalks become interlocked with uneven density distribution. This leads to harvester clogging and reduced operational efficiency [7,8,9]. Effective detection of sugarcane feed volume entering the conveyance system—particularly in stacked configurations—is therefore imperative. Current sugarcane feed volume detection primarily relies on contact methods. These typically involve installing strain gauges or sensors on feed roller drive shafts to indirectly infer feed volume. However, this approach suffers from complex installation, susceptibility to damage, high costs, and vulnerability to environmental factors, causing precision degradation [5,10,11,12]. In addition, the non-contact LiDAR method is also used to measure the yield of sugarcane fields or for measuring the crown height and volume of sugarcanes. Although highly accurate, this method is prohibitively expensive and unsuitable for detecting feed volume in sugarcane harvesters [13,14].
In the early development of sugarcane visual inspection technology, methods primarily relied on manually designed features where algorithms or rules extracted specific patterns from raw data. Wang, Z. et al. [15] developed an automated machine vision system using parallel plate culture to simplify sugarcane micropropagated seedling recognition; by integrating Hough transform with robotic arm positioning, they achieved 85% separation success and 76% survival rates, demonstrating technical feasibility. Similarly, Schaufler, D.H. et al. [16] created a vision-based identification algorithm that localized shoot coordinates through arc searching and thresholding, attaining 79% identification accuracy with complete single-separation success in tests. Concurrently, Rees, S.J. et al. [17] implemented an image-analysis spot spraying system that distinguished guinea grass in sugarcane fields using color–texture differences, employing LED lighting to enhance nighttime stability; this achieved < 10% false positives at night, verifying feasibility for replacing manual operations. While these studies validate traditional feature-based detection, such methods exhibit poor generalization and limited adaptability in complex scenes. Subsequent advances leveraged deep learning for sugarcane target detection: Kai, P.M. et al. [18] classified four sugarcane varieties using Sentinel-2 satellite data with dense neural networks (DNN), achieving 99.48% accuracy through multiband/vegetation-index fusion (compared to SVM’s 99.55%). Militante et al. [19] attained 95% disease classification accuracy using CNN on 13,842 enhanced leaf images. Yu, K. et al. [20] proposed a MobileNet-YOLOv5s model for real-time stem node detection, reducing complexity by 40% and accelerating inference to 4.4 ms/frame while limiting accuracy loss to 0.8 percentage points. Finally, Kumpala et al. [21] developed a Python Flask integrated system for Red Stripe Disease detection, achieving 95.9% accuracy with 1.5 s latency using 4000 leaf images.
The above research demonstrates the application of deep learning-based object detection methods in sugarcane detection, providing a reference for sugarcane volume identification. However, sugarcane in harvesters frequently exhibits dense stacking, irregular morphology, and significant leaf occlusion, which compromises volume recognition accuracy. Additionally, overlapping leaves from adjacent stalks may cause missed detections, presenting challenges for object detection.
To address these issues, this paper proposes the YOLO-ASM algorithm for sugarcane target detection and volume recognition. This method directly detects sugarcane feed volume in stacked states by fusing target detection with stereoscopic vision, thereby completing feed volume detection. The approach avoids complex installation processes, offers cost-effectiveness, demonstrates strong environmental robustness, and ensures high reliability. Technical implementation employs the YOLOv5s detection model and SGBM algorithm. Through enhancements and fusion of these components, the accuracy and efficiency of sugarcane volume calculation are significantly improved. The YOLOv5s model enables rapid sugarcane identification, while the SGBM algorithm facilitates volume measurement, overcoming accuracy and speed limitations inherent in traditional methods. Experimental validation across varying feed volumes confirmed the method’s accuracy and effectiveness, providing reliable technical support for enhancing sugarcane harvester performance and productivity.

2. Materials and Methods

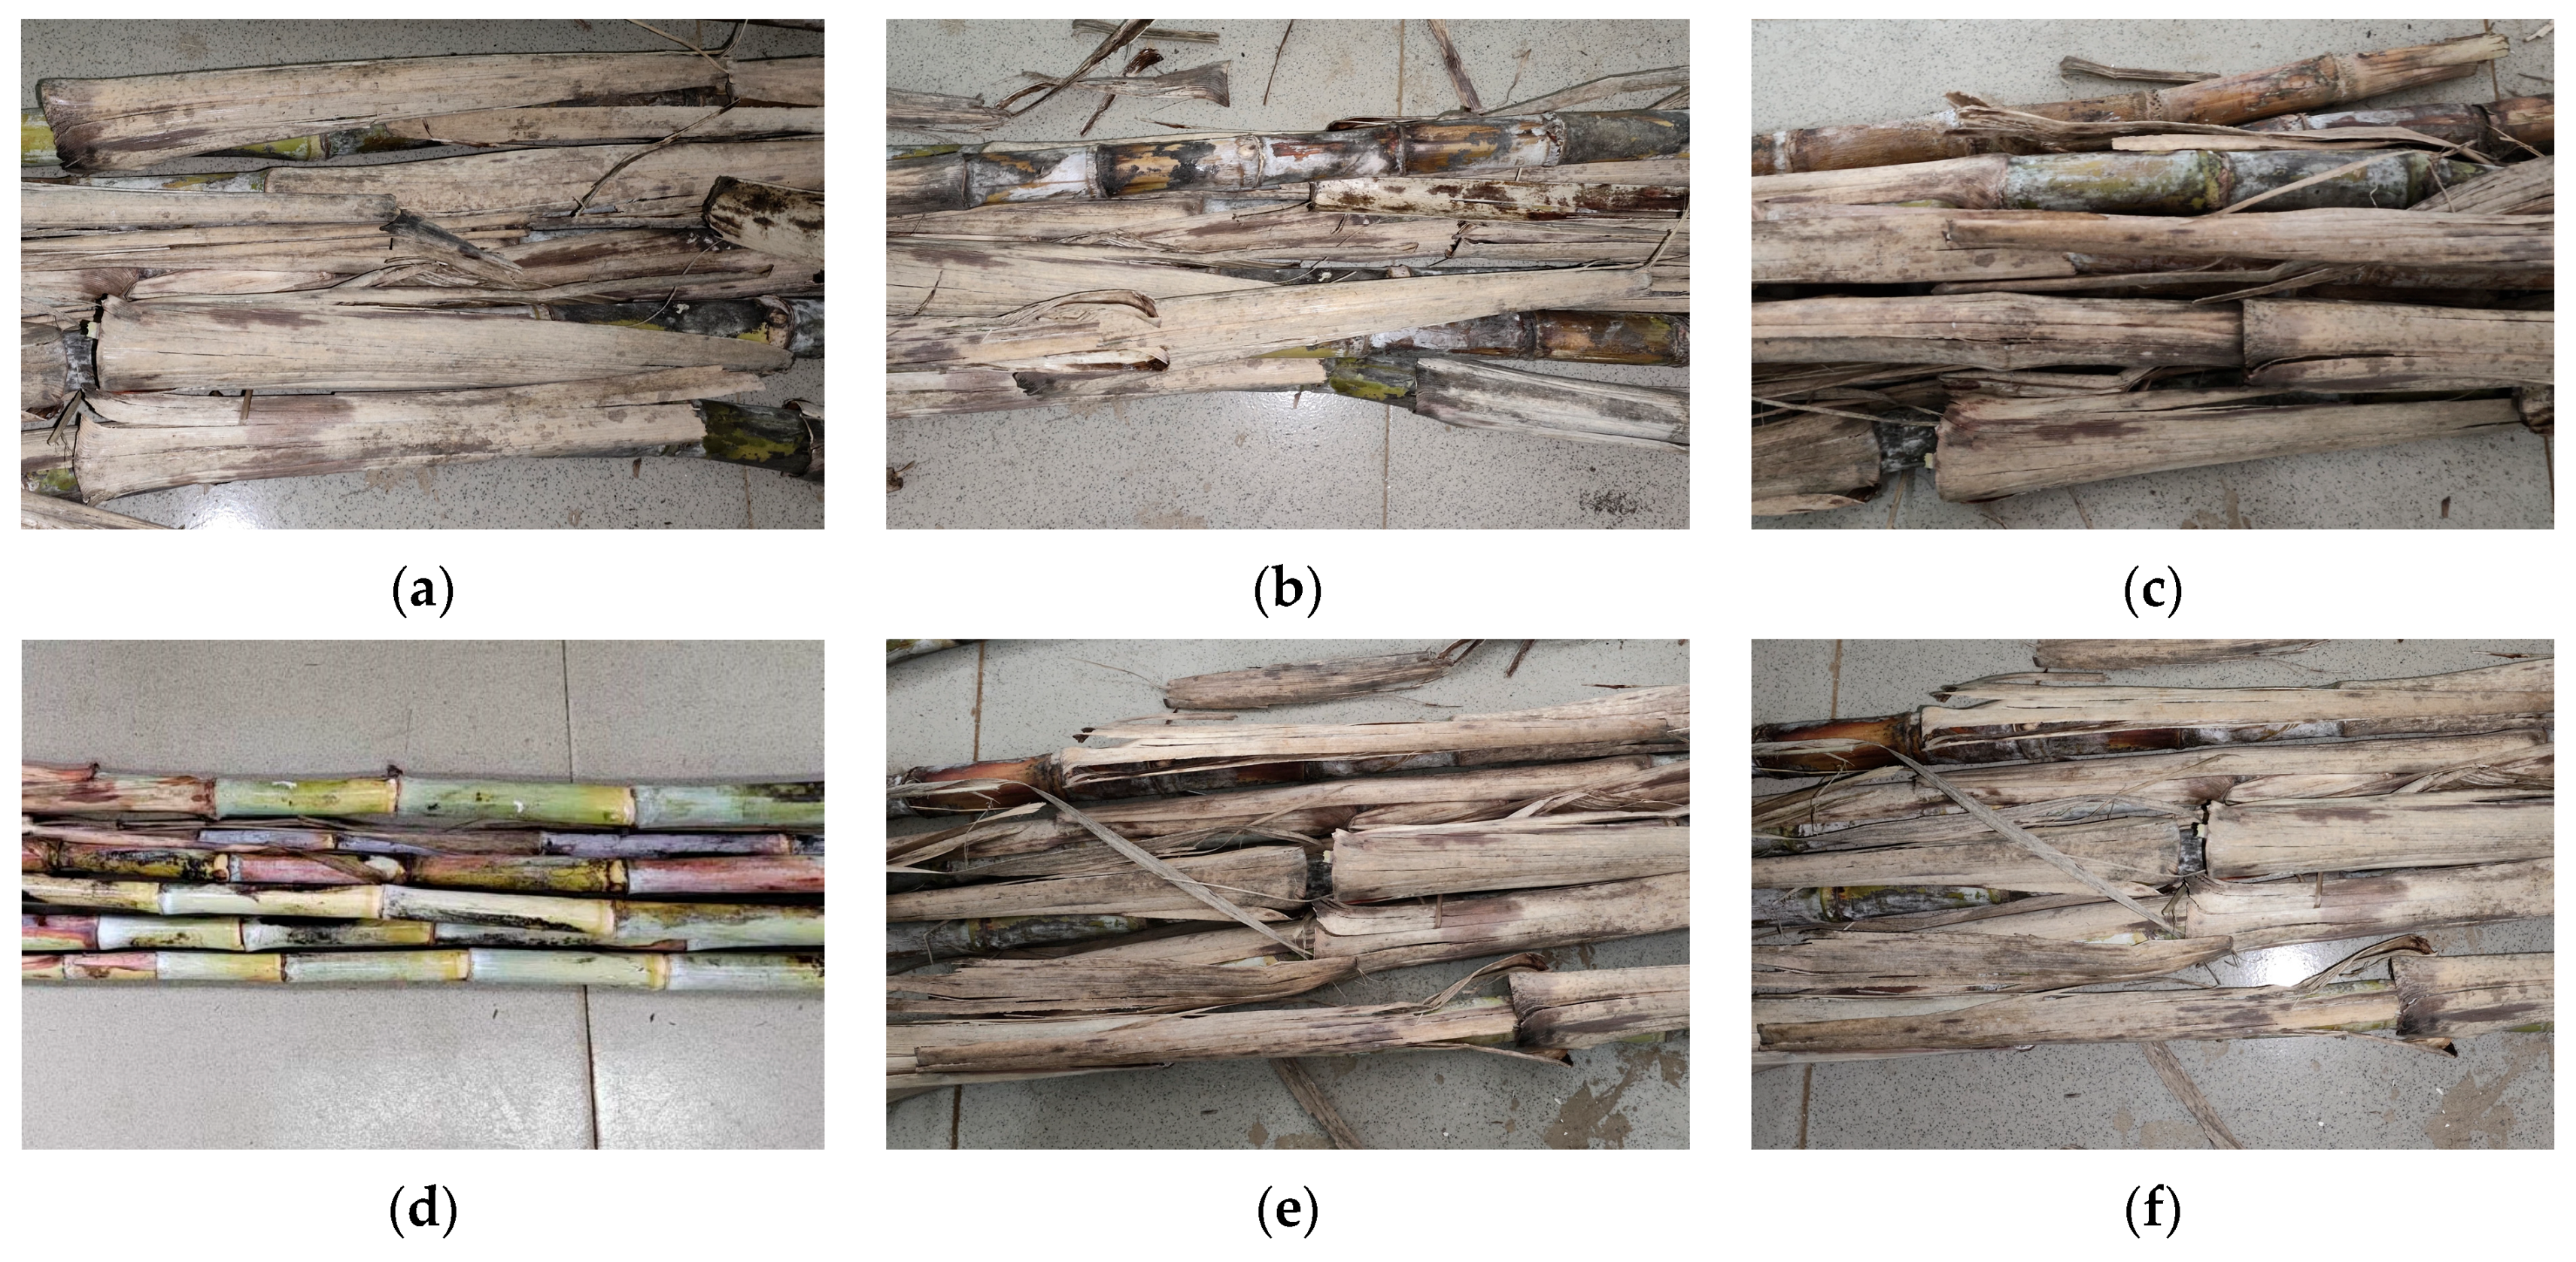
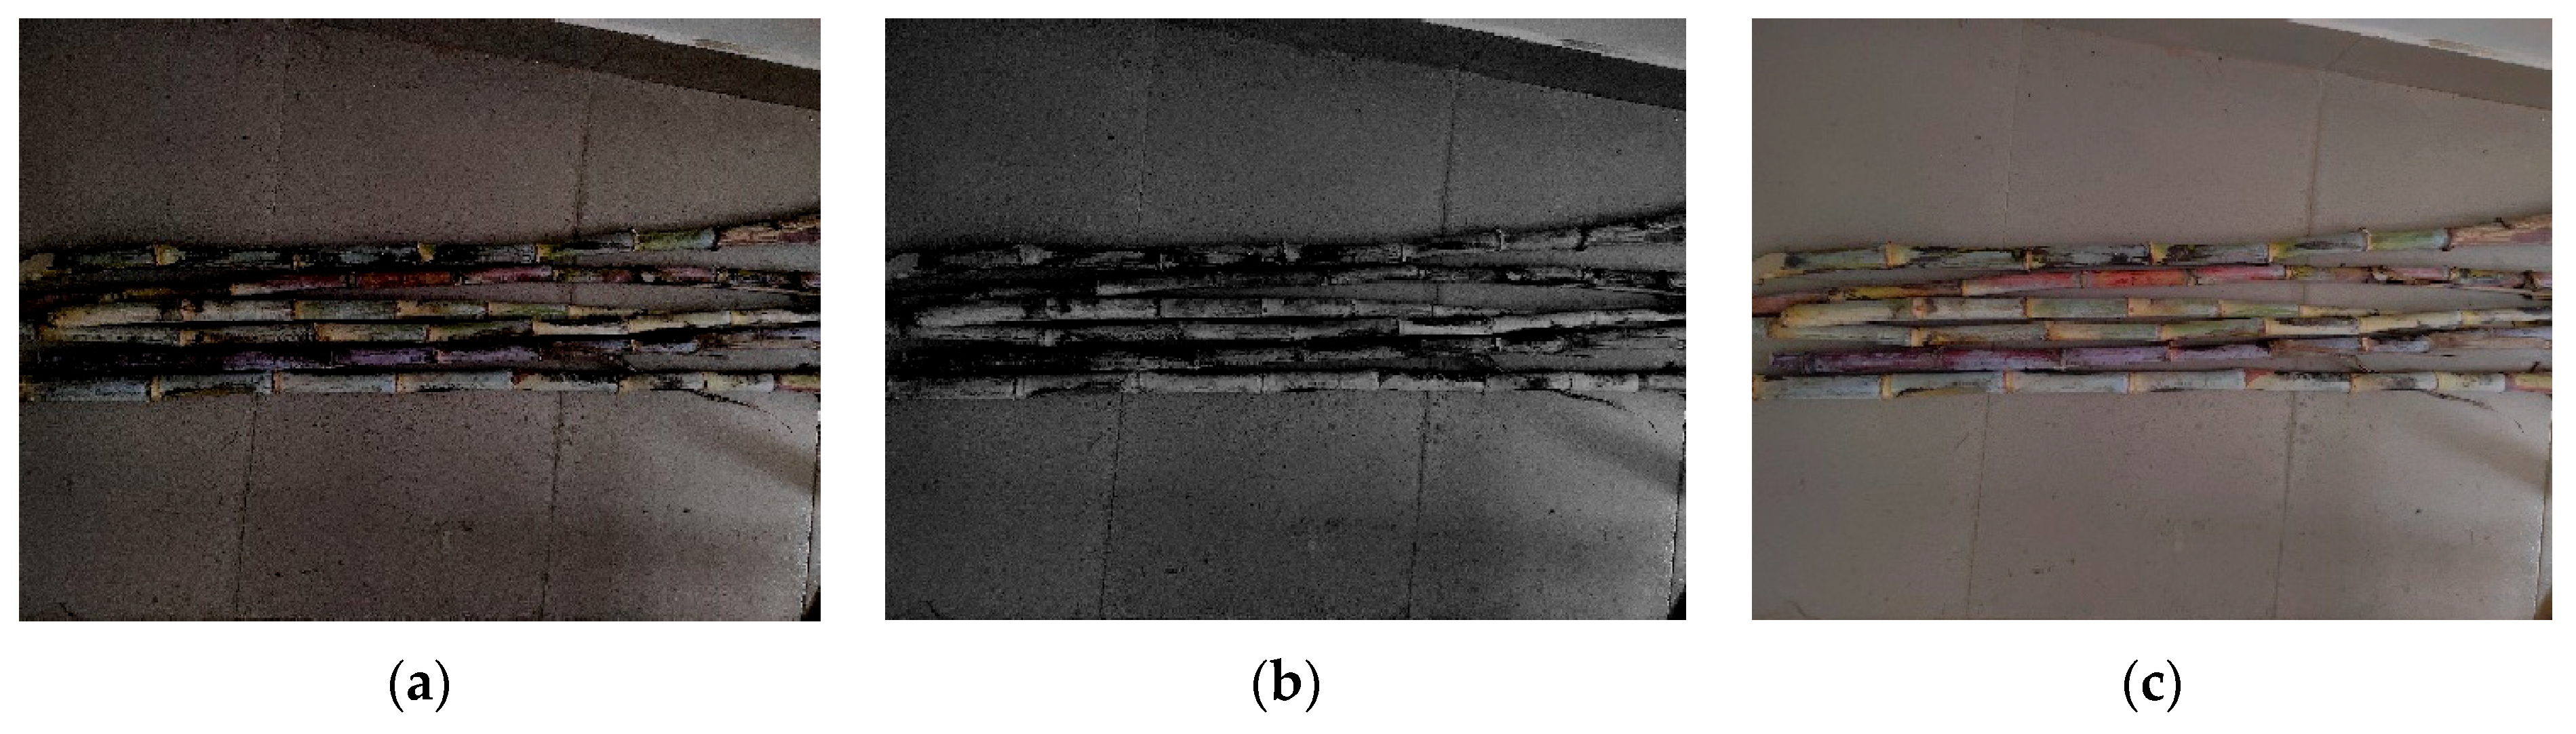
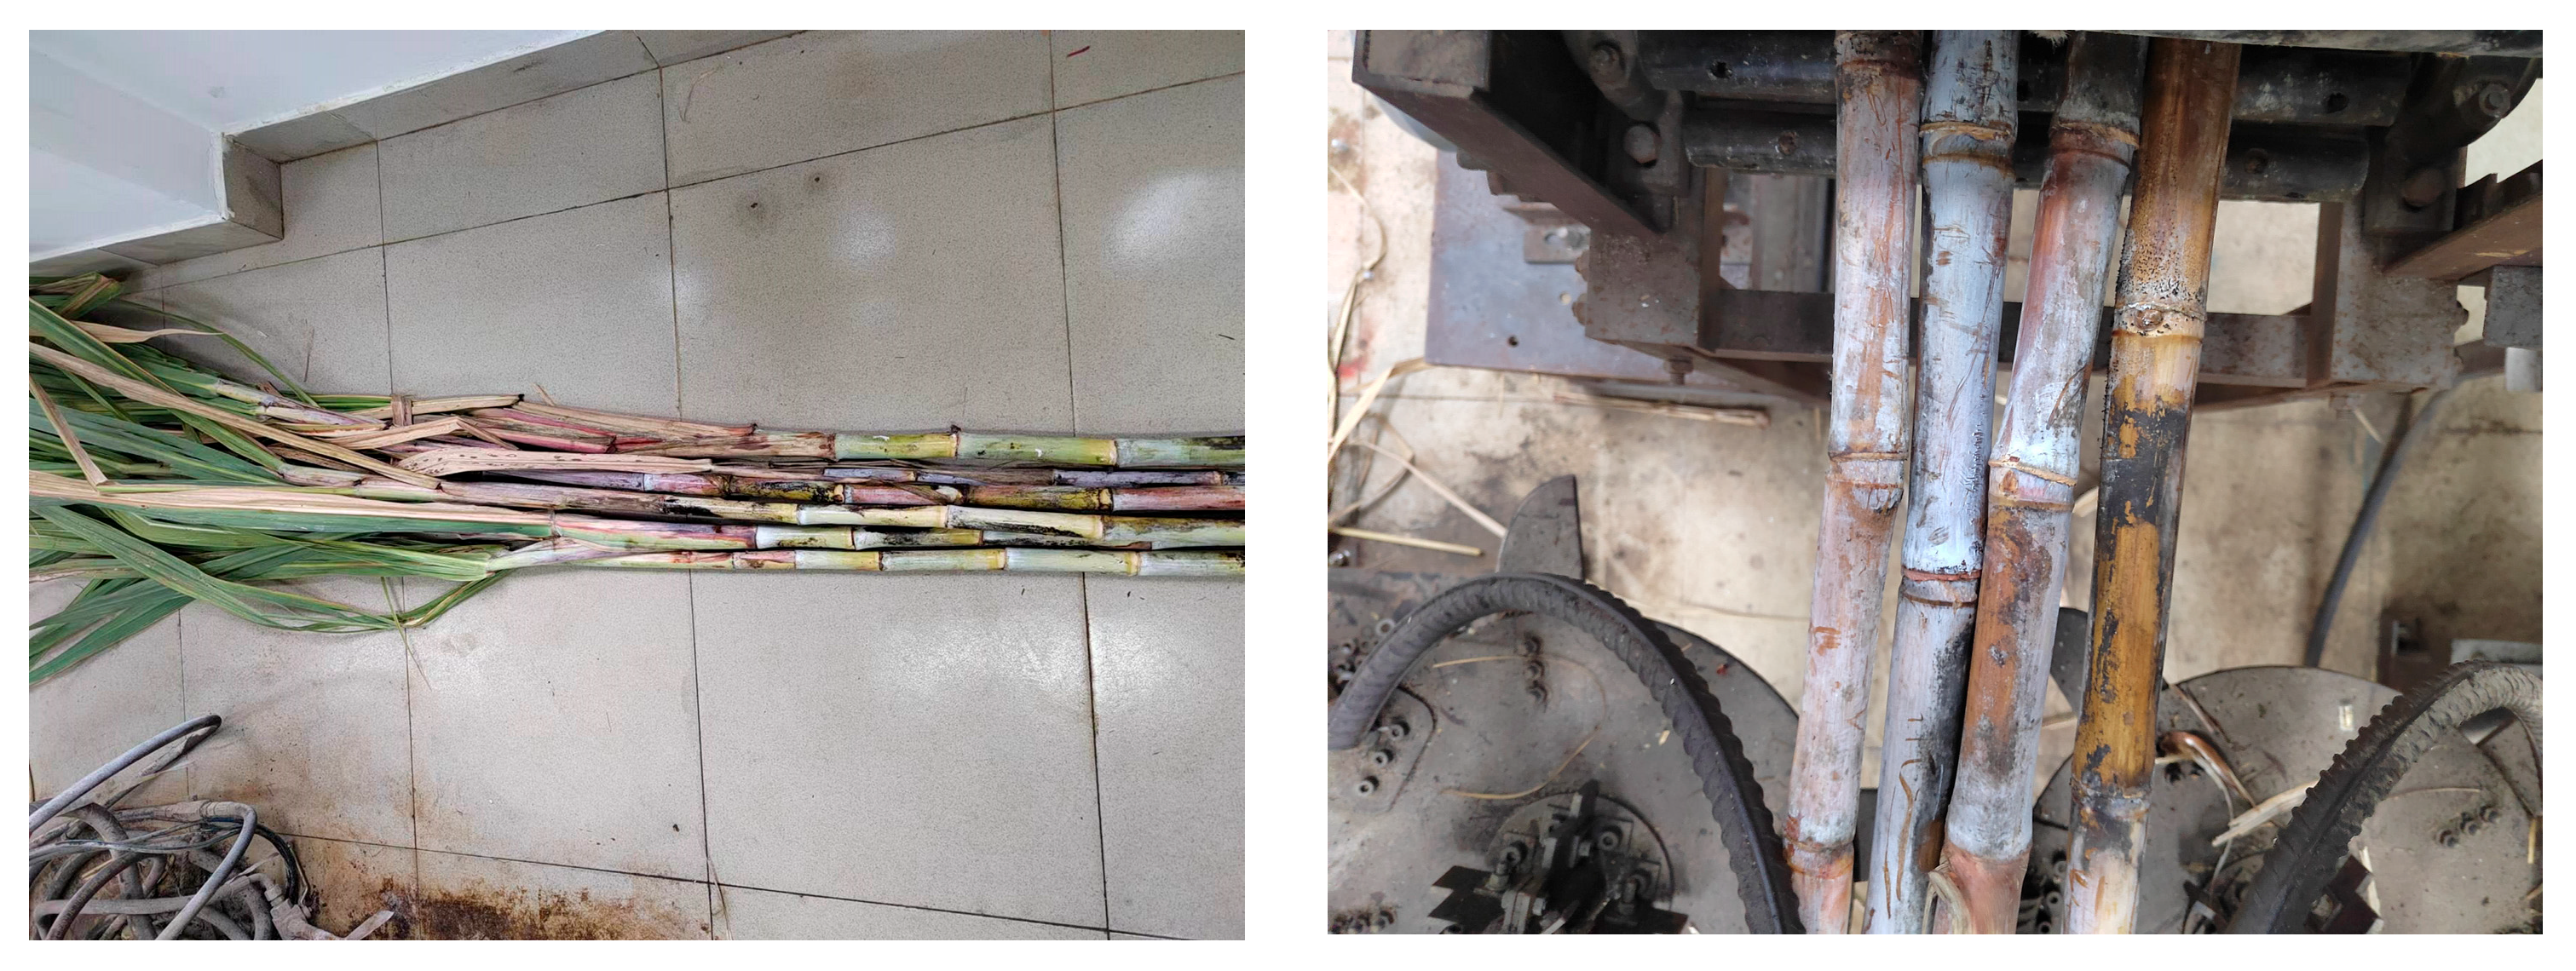
2.1. Preparation and Processing of Dataset

The experimental samples were primarily collected from the sugarcane field located in the multi-functional specimen garden of the College of Agriculture, Guangxi University, Guangxi, China. To effectively recognize the stacking problem during sugarcane feeding, the sugarcanes were positioned based on stacking status (stacked or unstacked) and varying stacking degrees during photography. Pictures and videos were captured under diverse lighting conditions. Additionally, considering cane leaf occlusion, images with and without cane leaves were acquired for each scenario. Ultimately, 1125 pictures were obtained to establish the image dataset, as illustrated in Figure 1. Since the recognition target in this study is solely sugarcane, a single-sample data enhancement method was employed to expand the training set samples. This enhancement approach primarily includes two implementation strategies: color change and position change. Color change modifies image content through techniques such as blurring, filling, noise erasing, and brightness transformation. Position change, conversely, alters the image’s position via operations like rotation, cropping, flipping, and scaling, without modifying the image content [22,23].
Among these, cropping images from the sugarcane dataset allows different local regions to be extracted from the original images as new training samples. The texture of sugarcane may vary across different parts, and cropping enables the model to learn texture features from various local regions of the sugarcane, thereby enhancing its understanding of sugarcane texture diversity. Rotating the images in the dataset enhances the model’s adaptability to textures at different angles. The rotation operation provides the model access to sugarcane texture information at various rotation angles, helping it learn the essential texture features regardless of orientation. Converting dataset images to grayscale transforms color images into grayscale images, removing color information and compelling the model to focus more on texture features. Sugarcane texture is represented in grayscale images as differences in grayscale values, which reflect texture characteristics such as depth and density.
These 1125 images underwent data expansion using random operations including cropping, Gaussian blur, rotation, mirroring, and grayscale conversion, resulting in 6750 sample images. From these, 4725 sugarcane images were selected as the training set, while the remaining 2025 images were allocated to the validation set. Manual labeling of the sugarcane data was performed using LabelImg software (https://pypi.org/project/labelImg/, accessed on 29 June 2025).

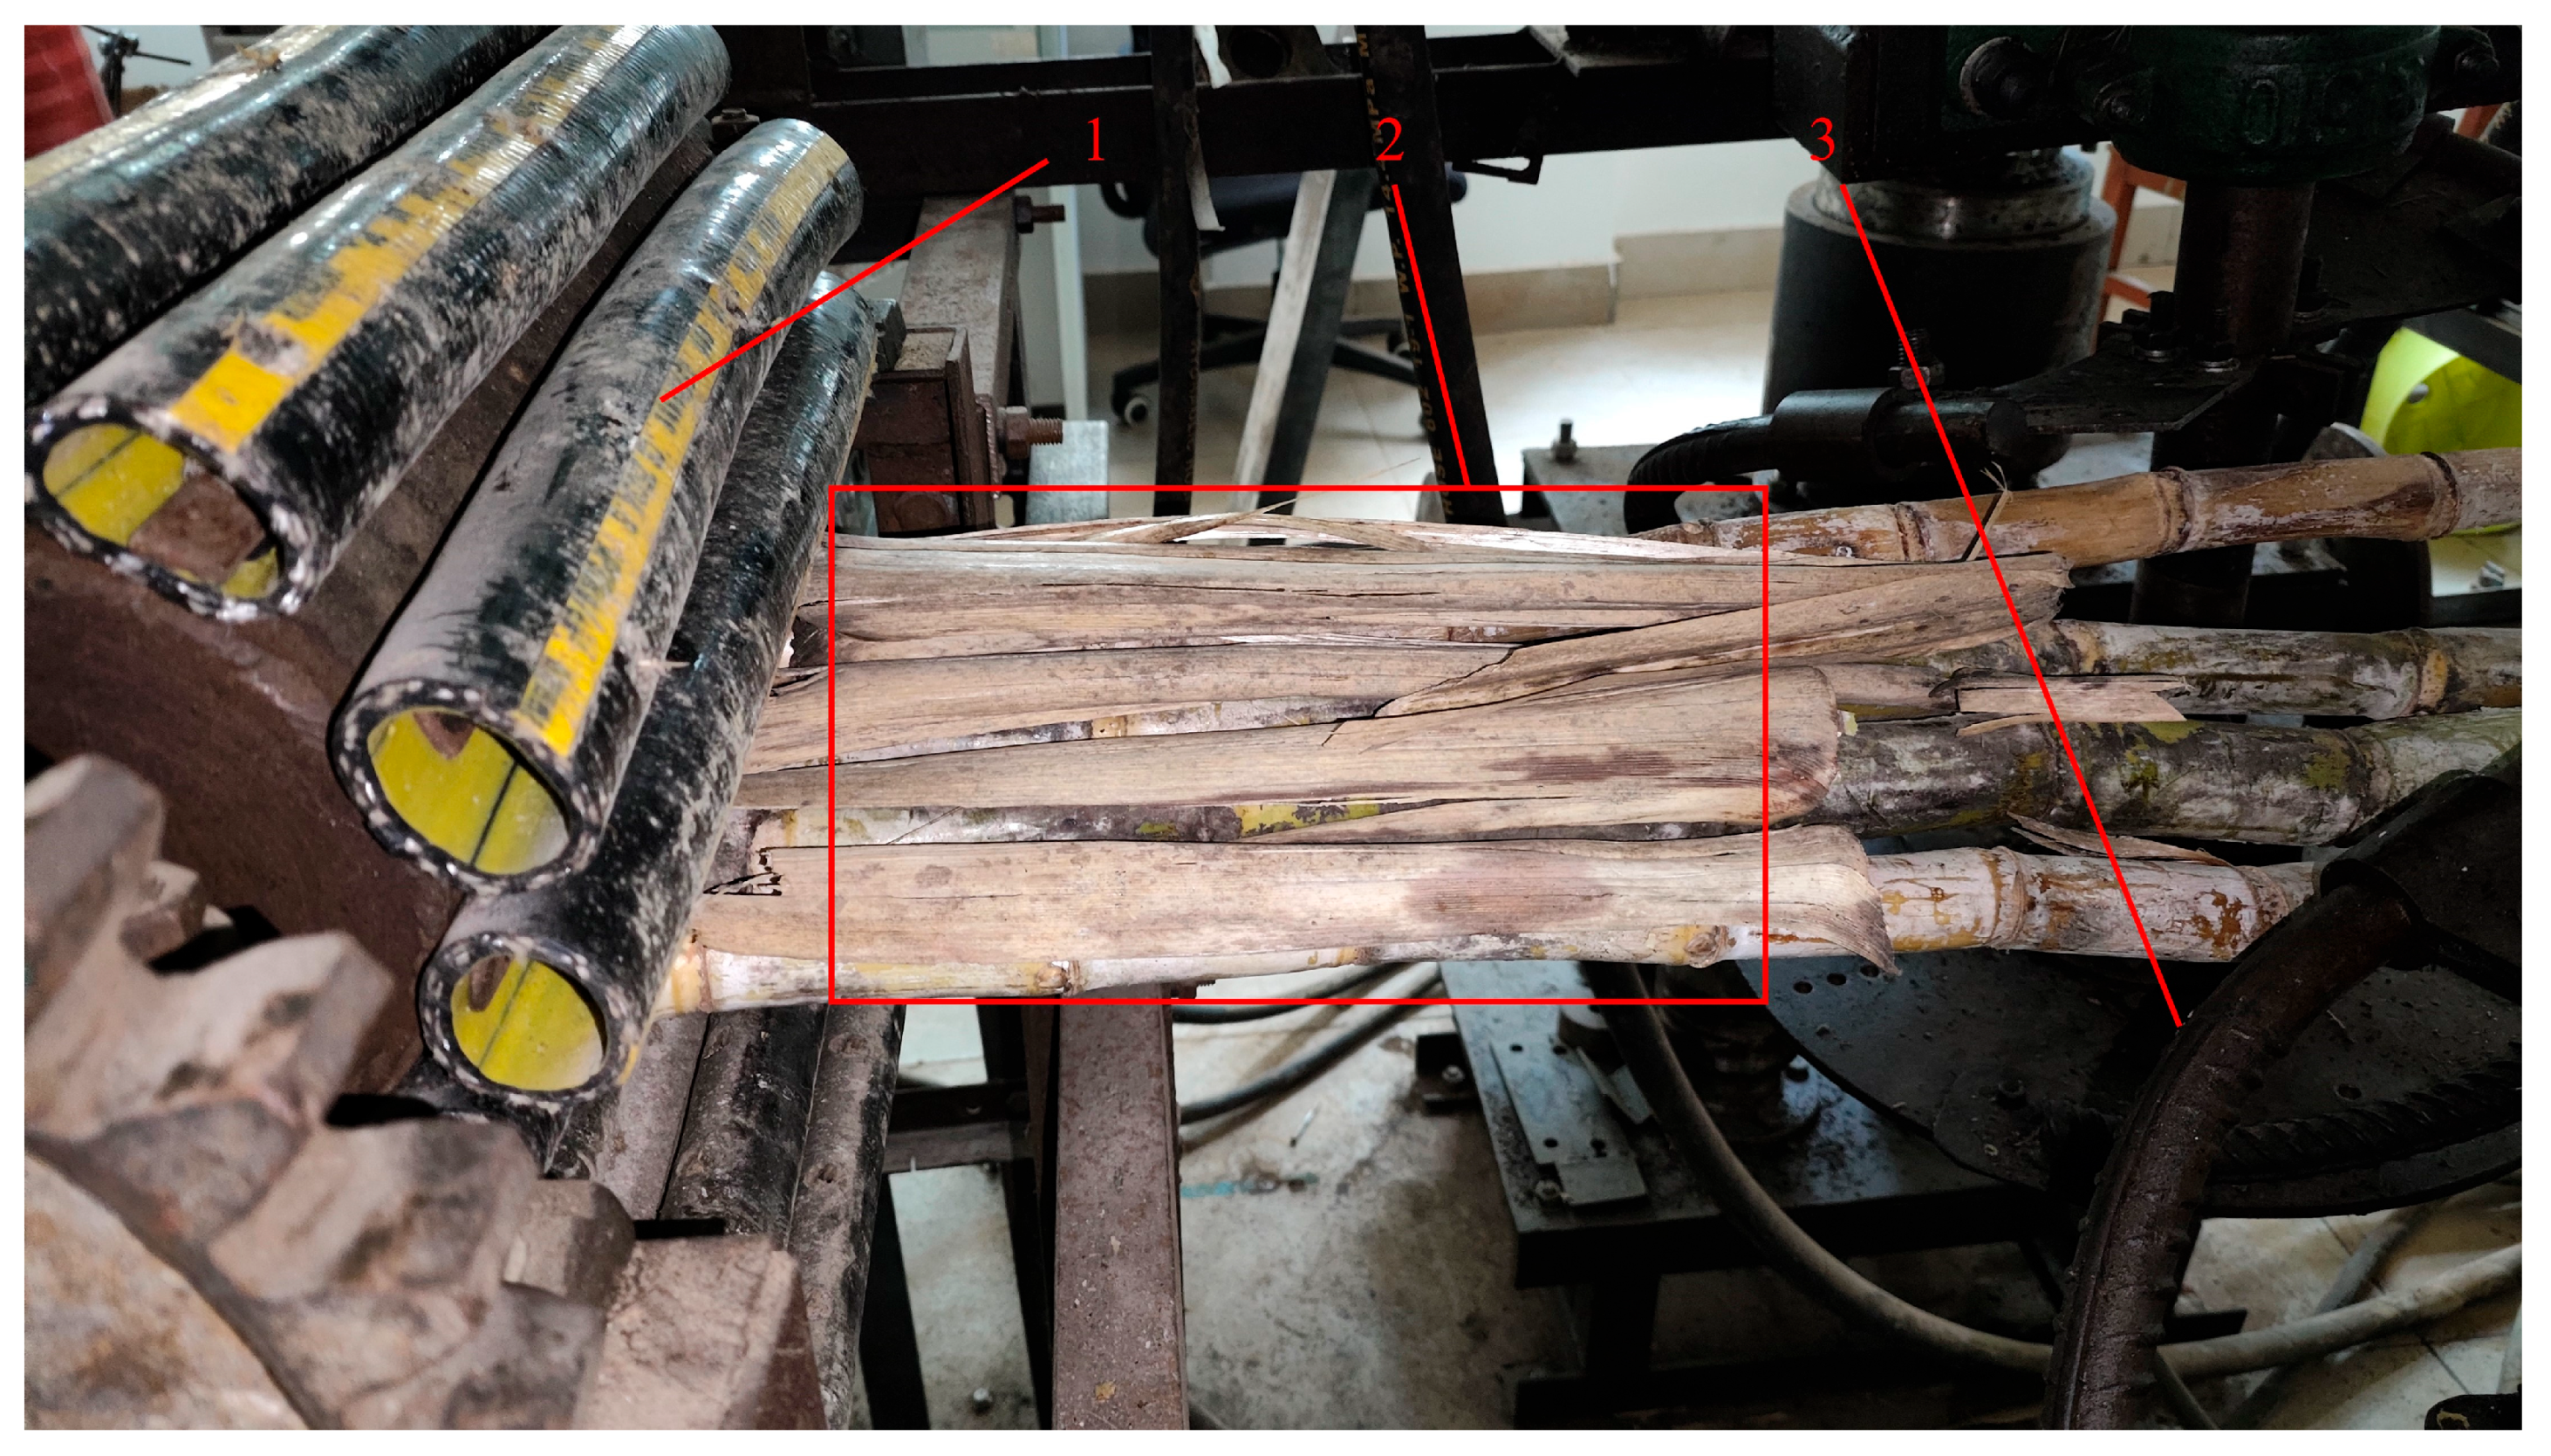
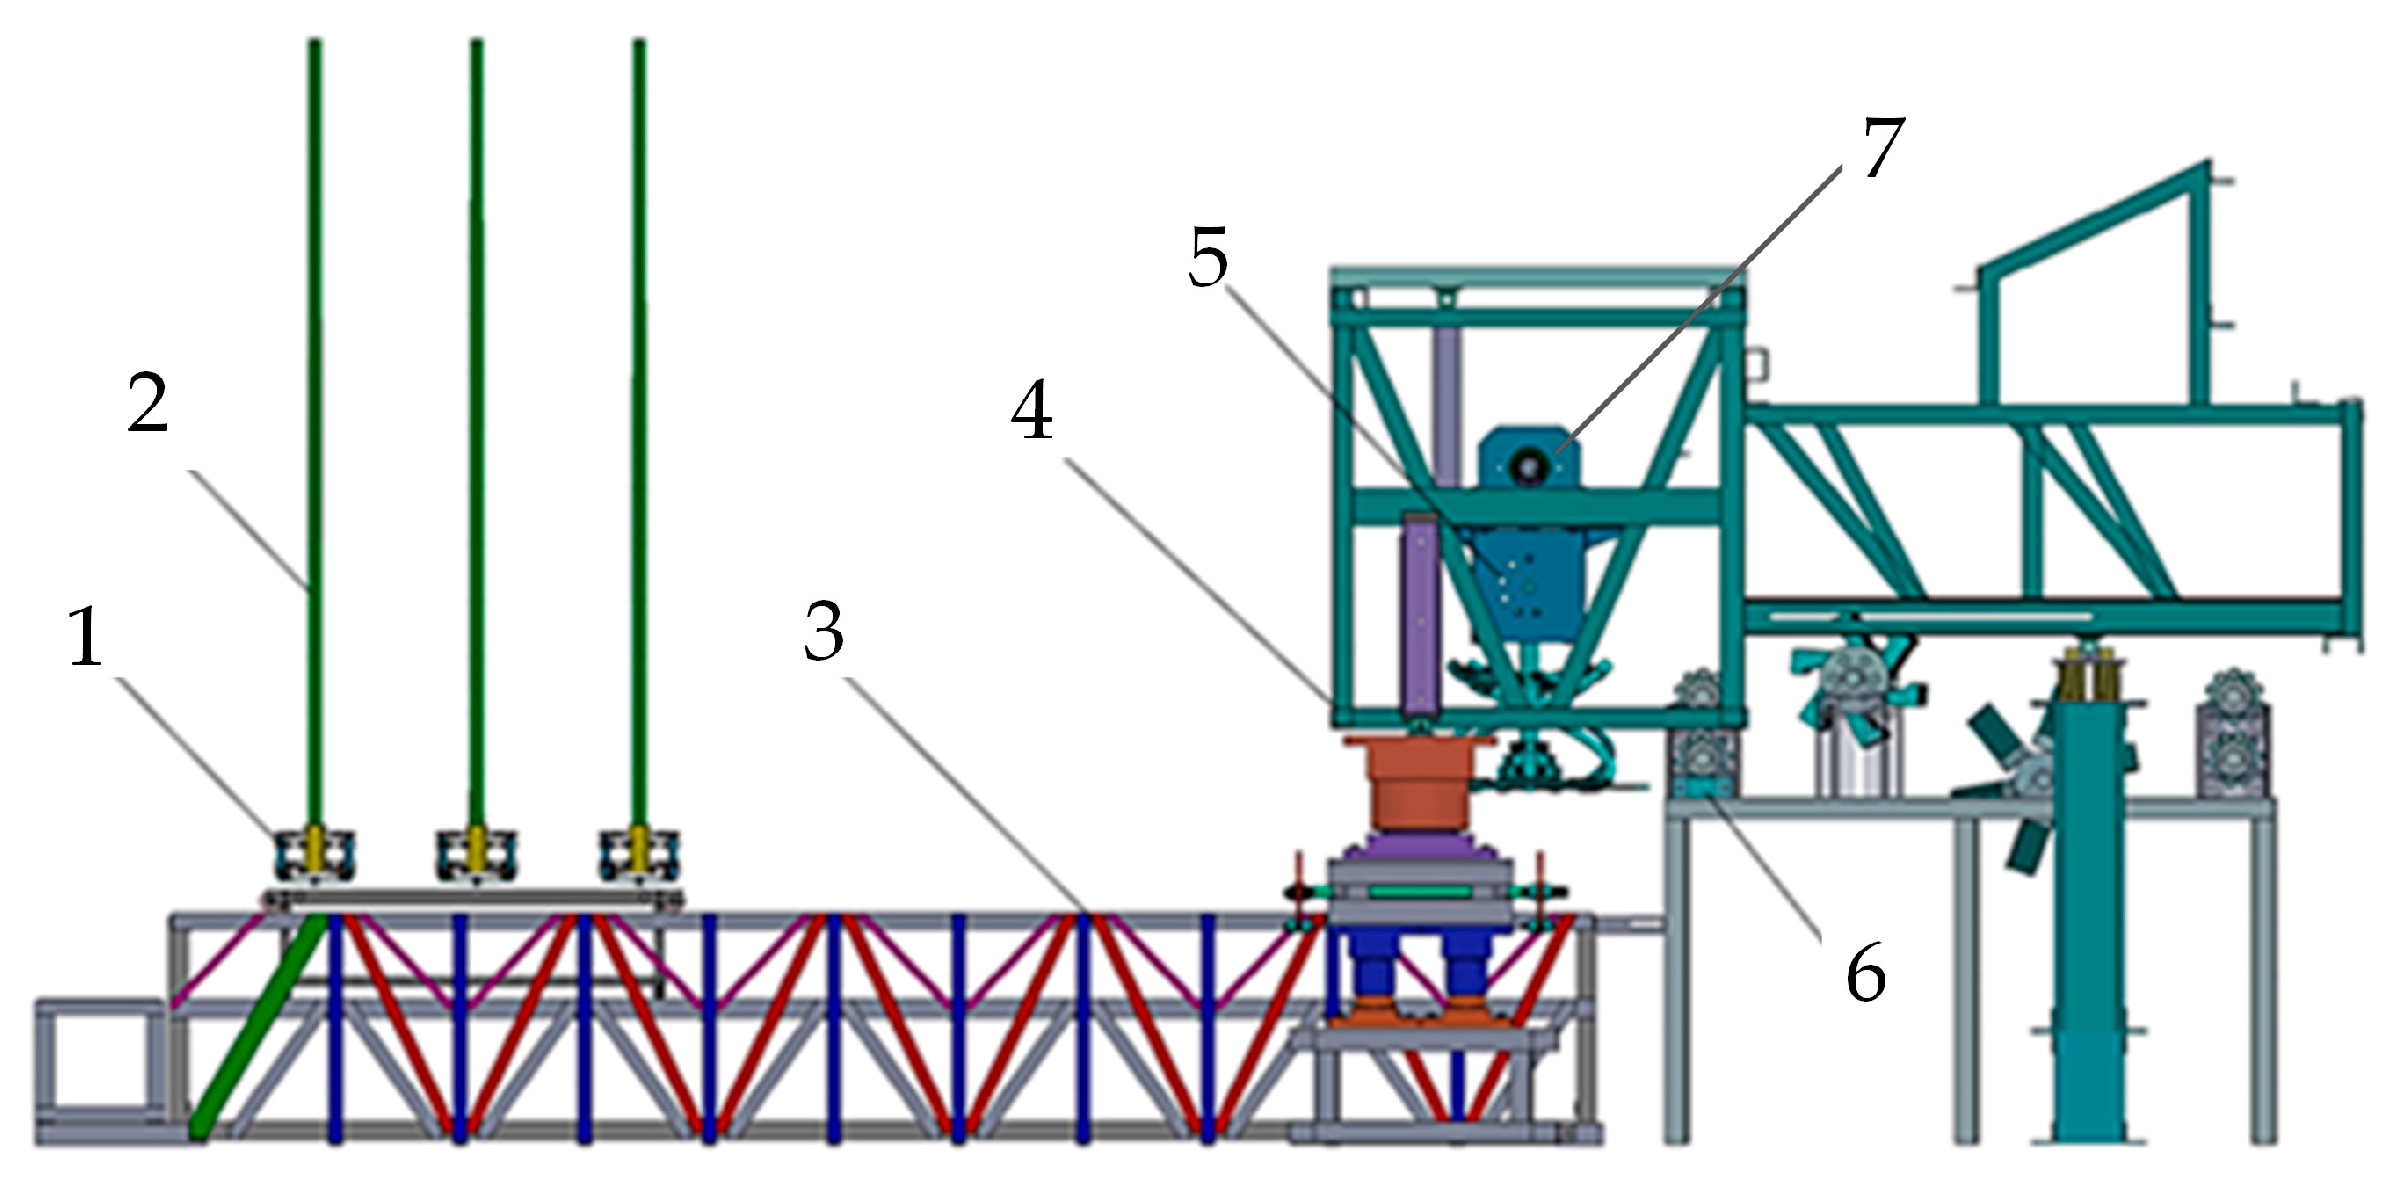
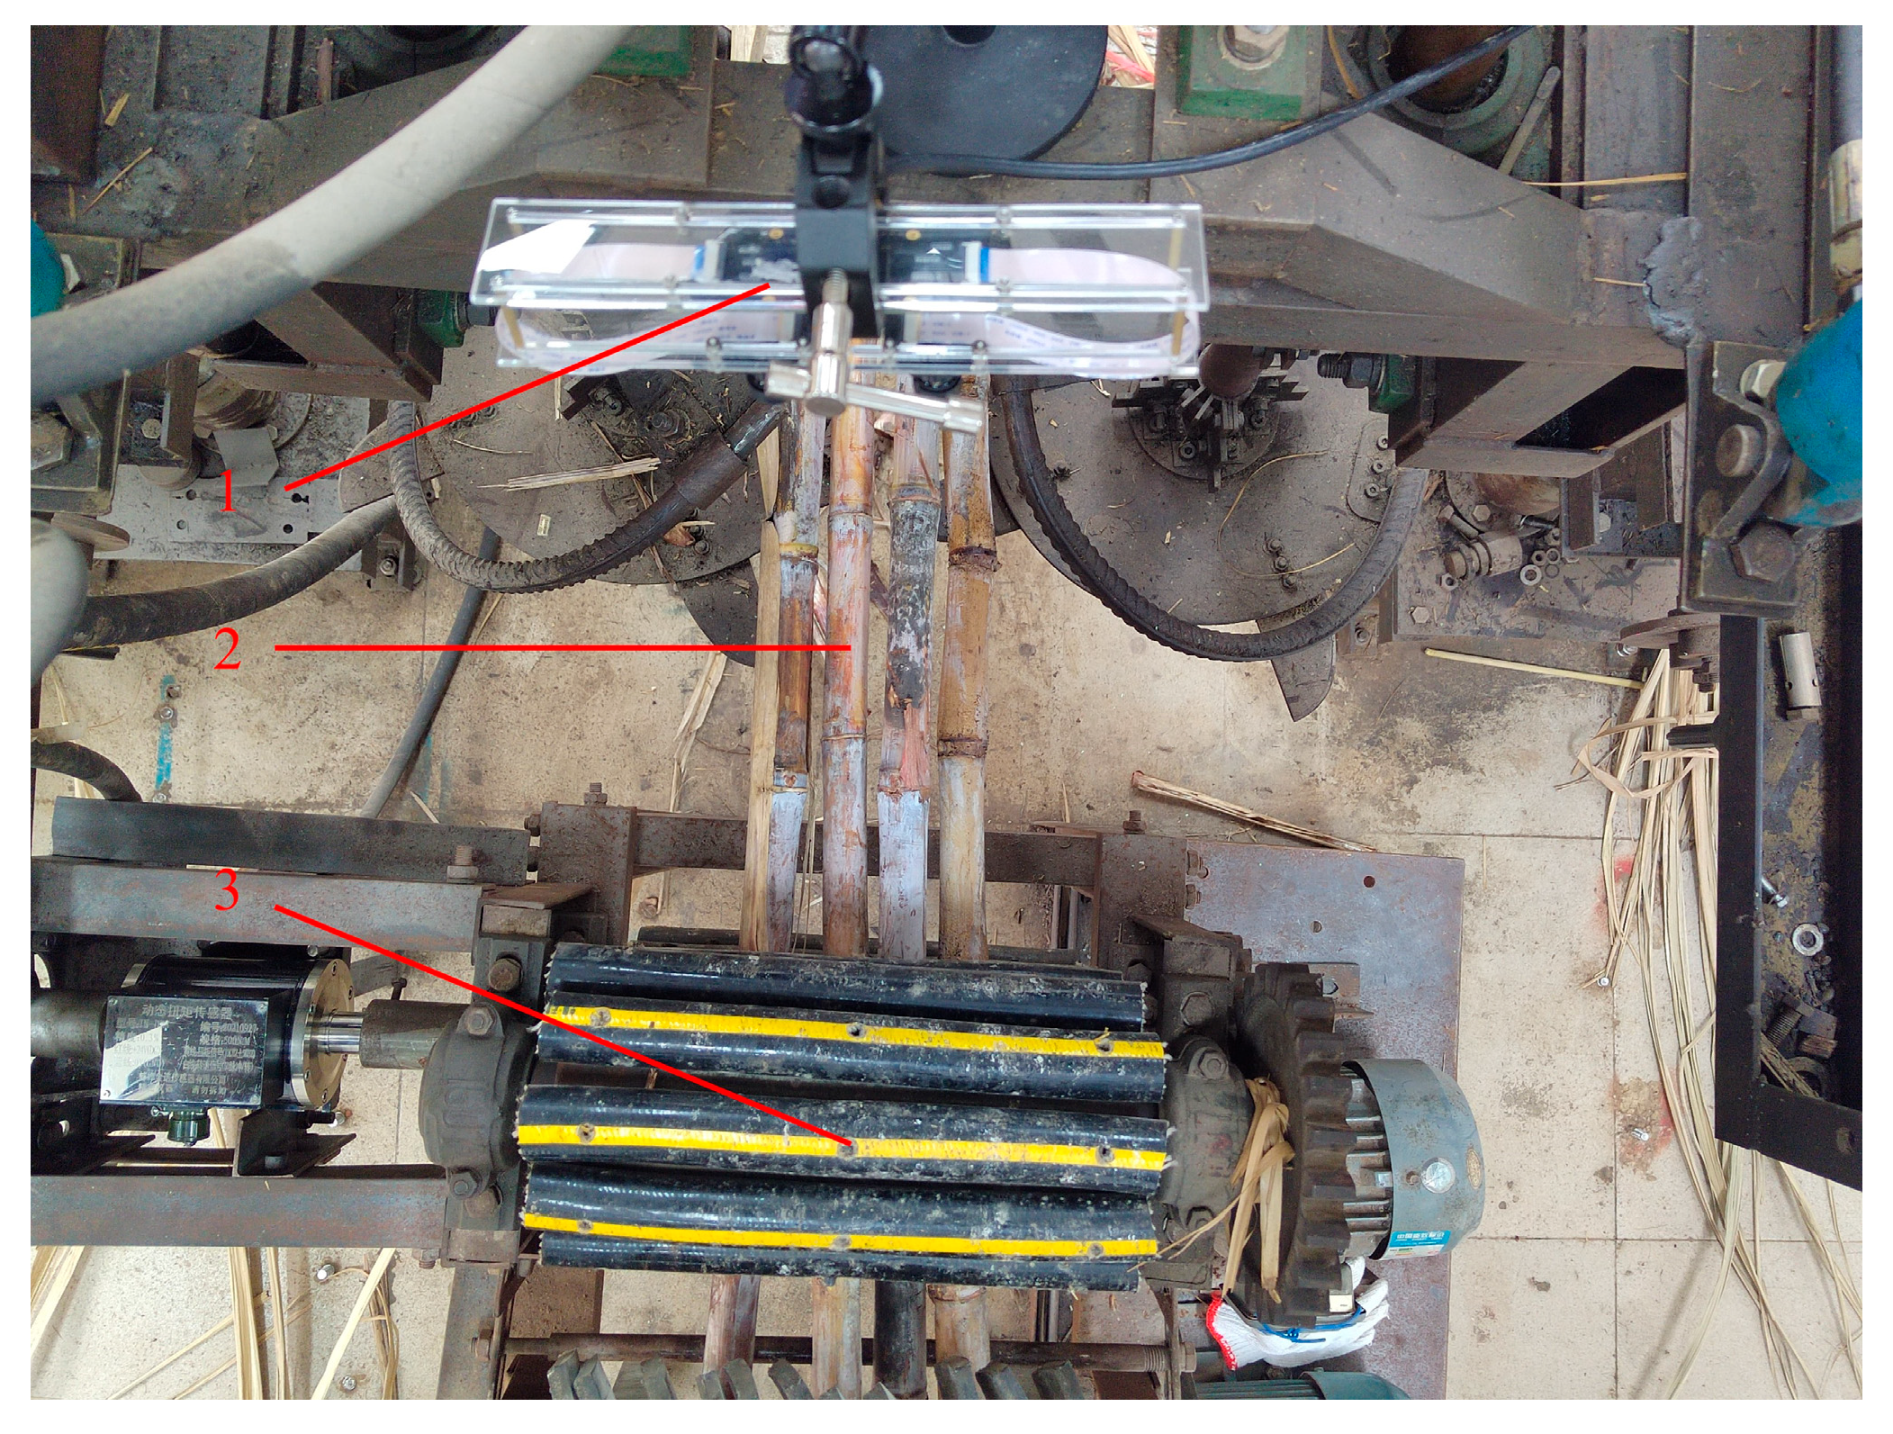
2.2. Sugarcane Feeding Volume Detection Scheme Design

After being cut by the cutting system, sugarcane is lifted by the cutter head and transported to the conveyor system via the feeding rollers. This study focuses on detecting the sugarcane feed volume between the cutting system and conveyor system, as indicated in the red box area of Figure 2. During feed volume detection, images of sugarcane within the harvester are captured by a camera and transferred to a computer for sugarcane target detection and coordinate positioning. Using the positional data from the sugarcane coordinate frames, three-dimensional matching is performed to rapidly generate a depth map. Subsequently, sugarcane volume is calculated based on depth information derived from this depth map, with final results being outputted. The detection process is illustrated in Figure 3.

2.3. YOLO-ASM Algorithm

This paper proposes a detection method based on YOLO-ASM, which is developed through improvement and fusion of the YOLOv5s target detection model and the SGBM algorithm. The algorithm leverages the precise positioning capability of the target detection model to provide accurate calculation guidance for the stereo matching algorithm, thus enhancing the accuracy and efficiency of sugarcane volume calculation. The improved algorithm achieves faster and more accurate matching computations within limited areas.

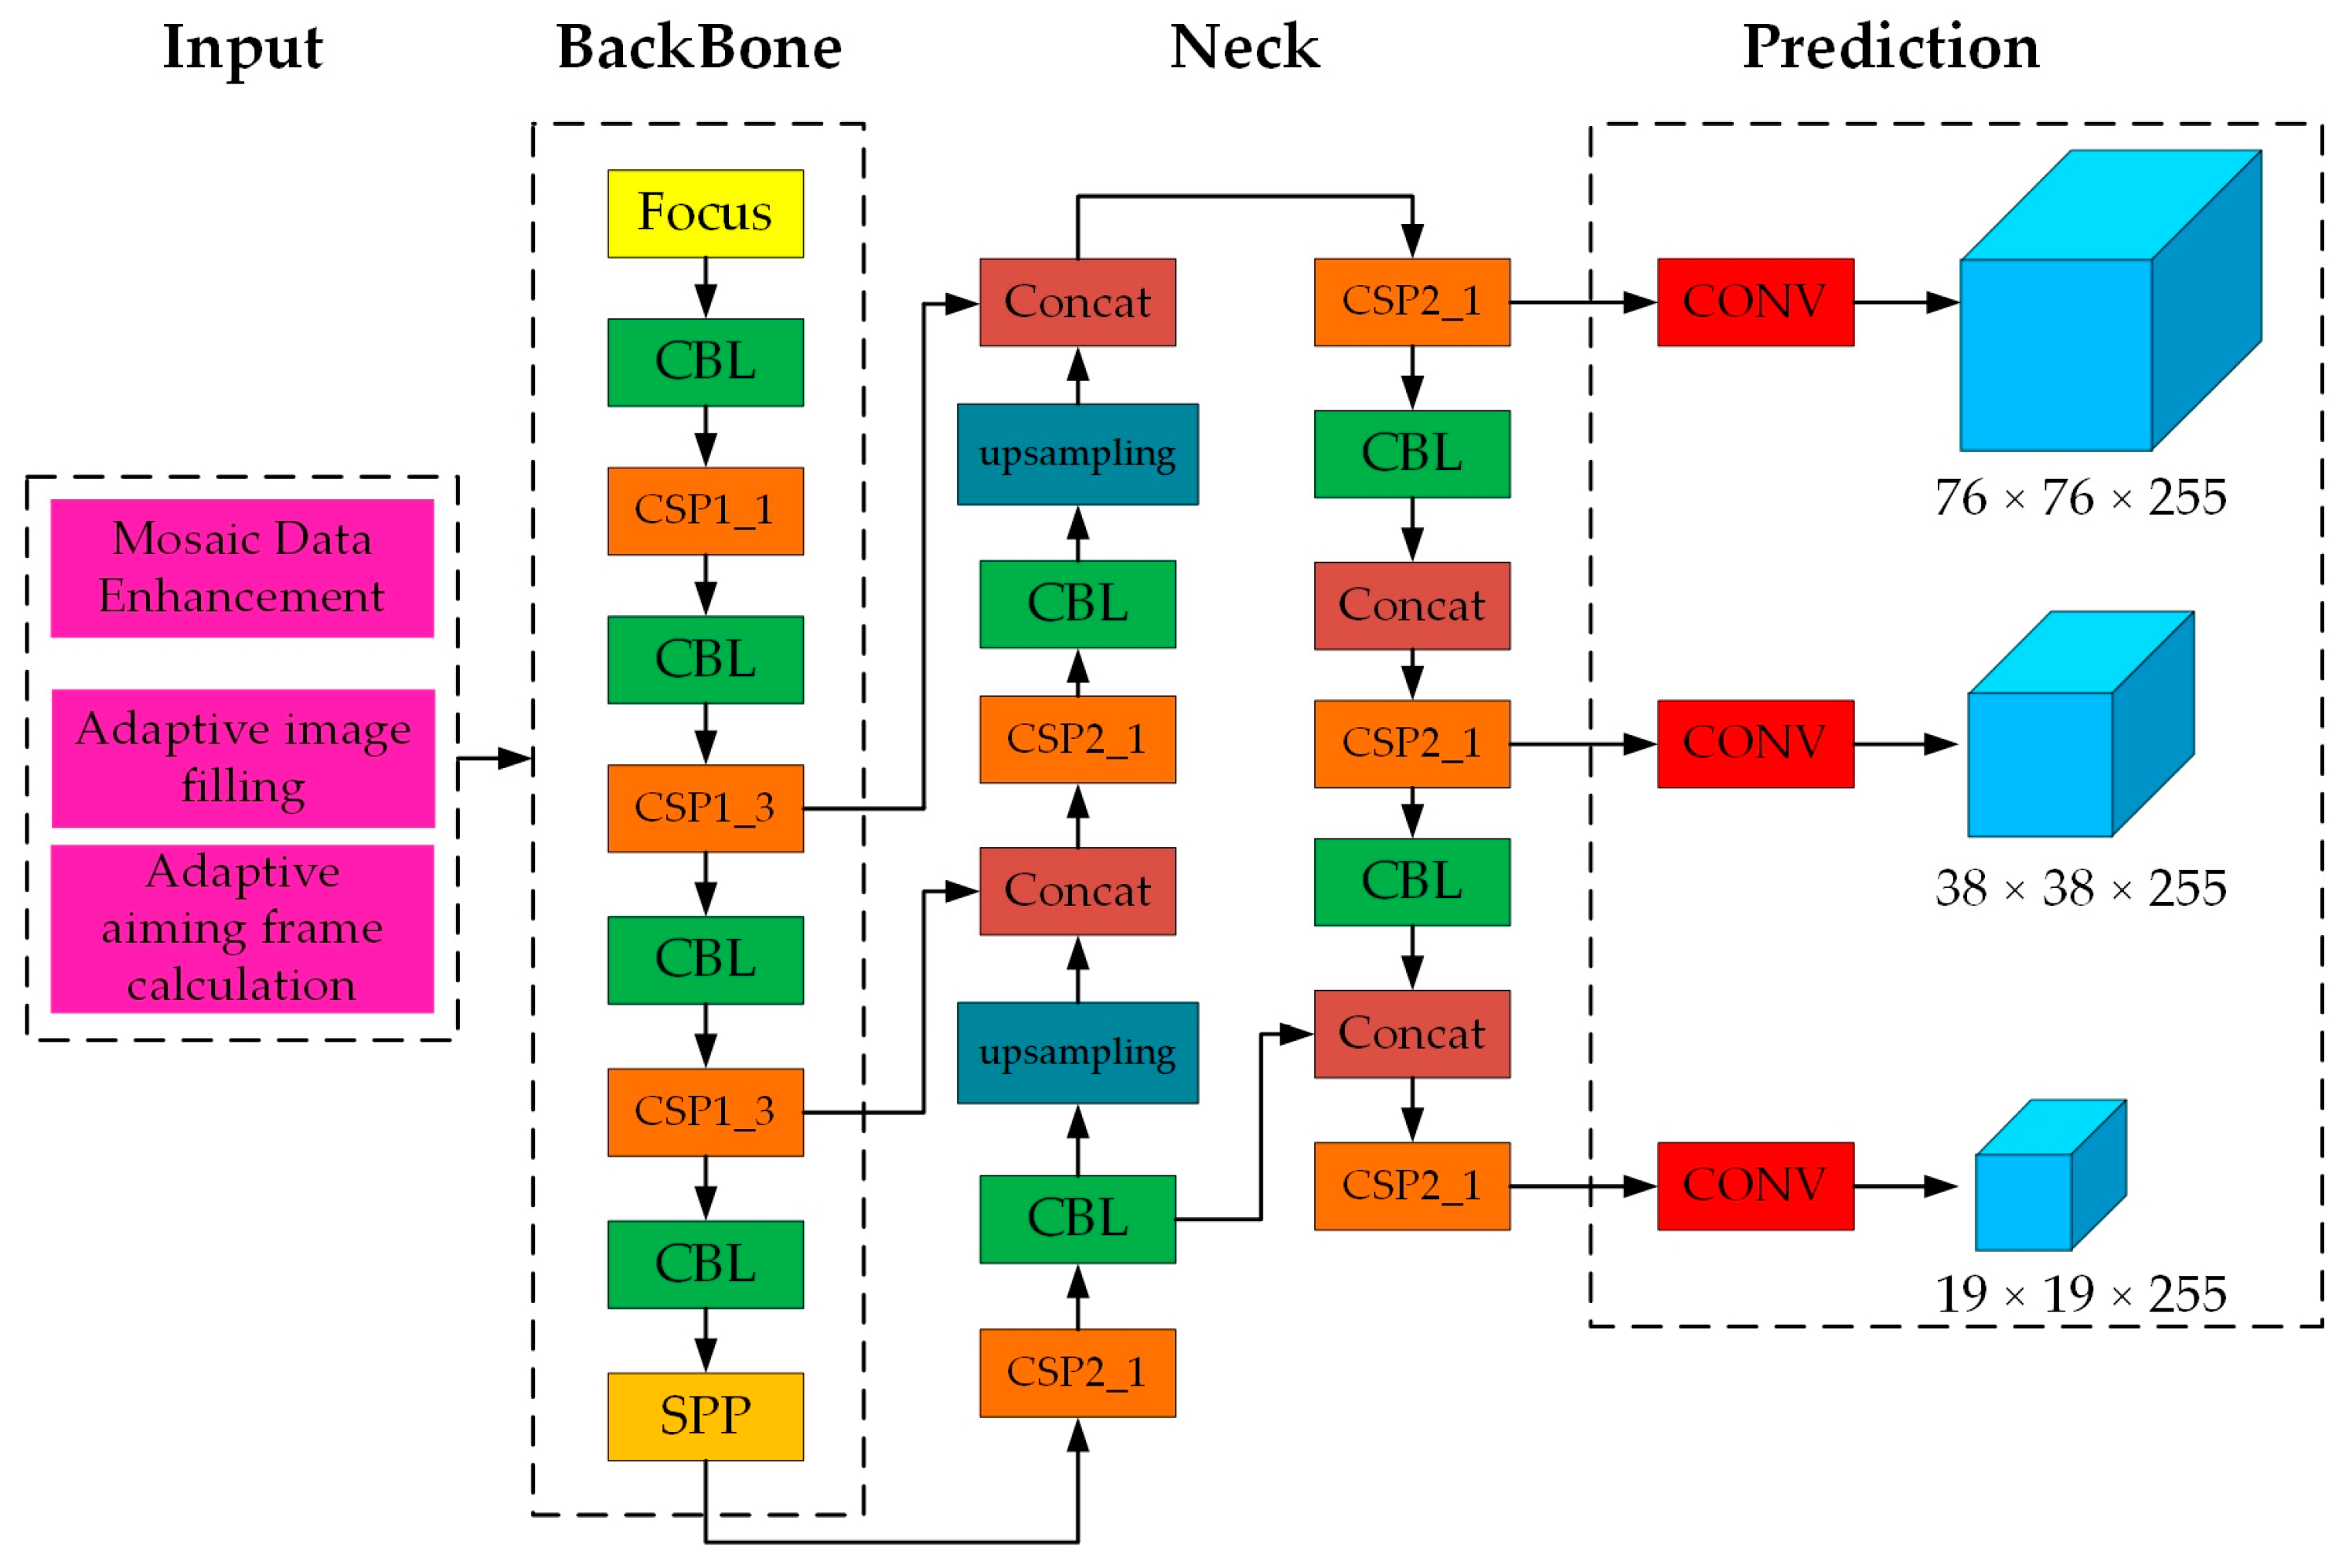
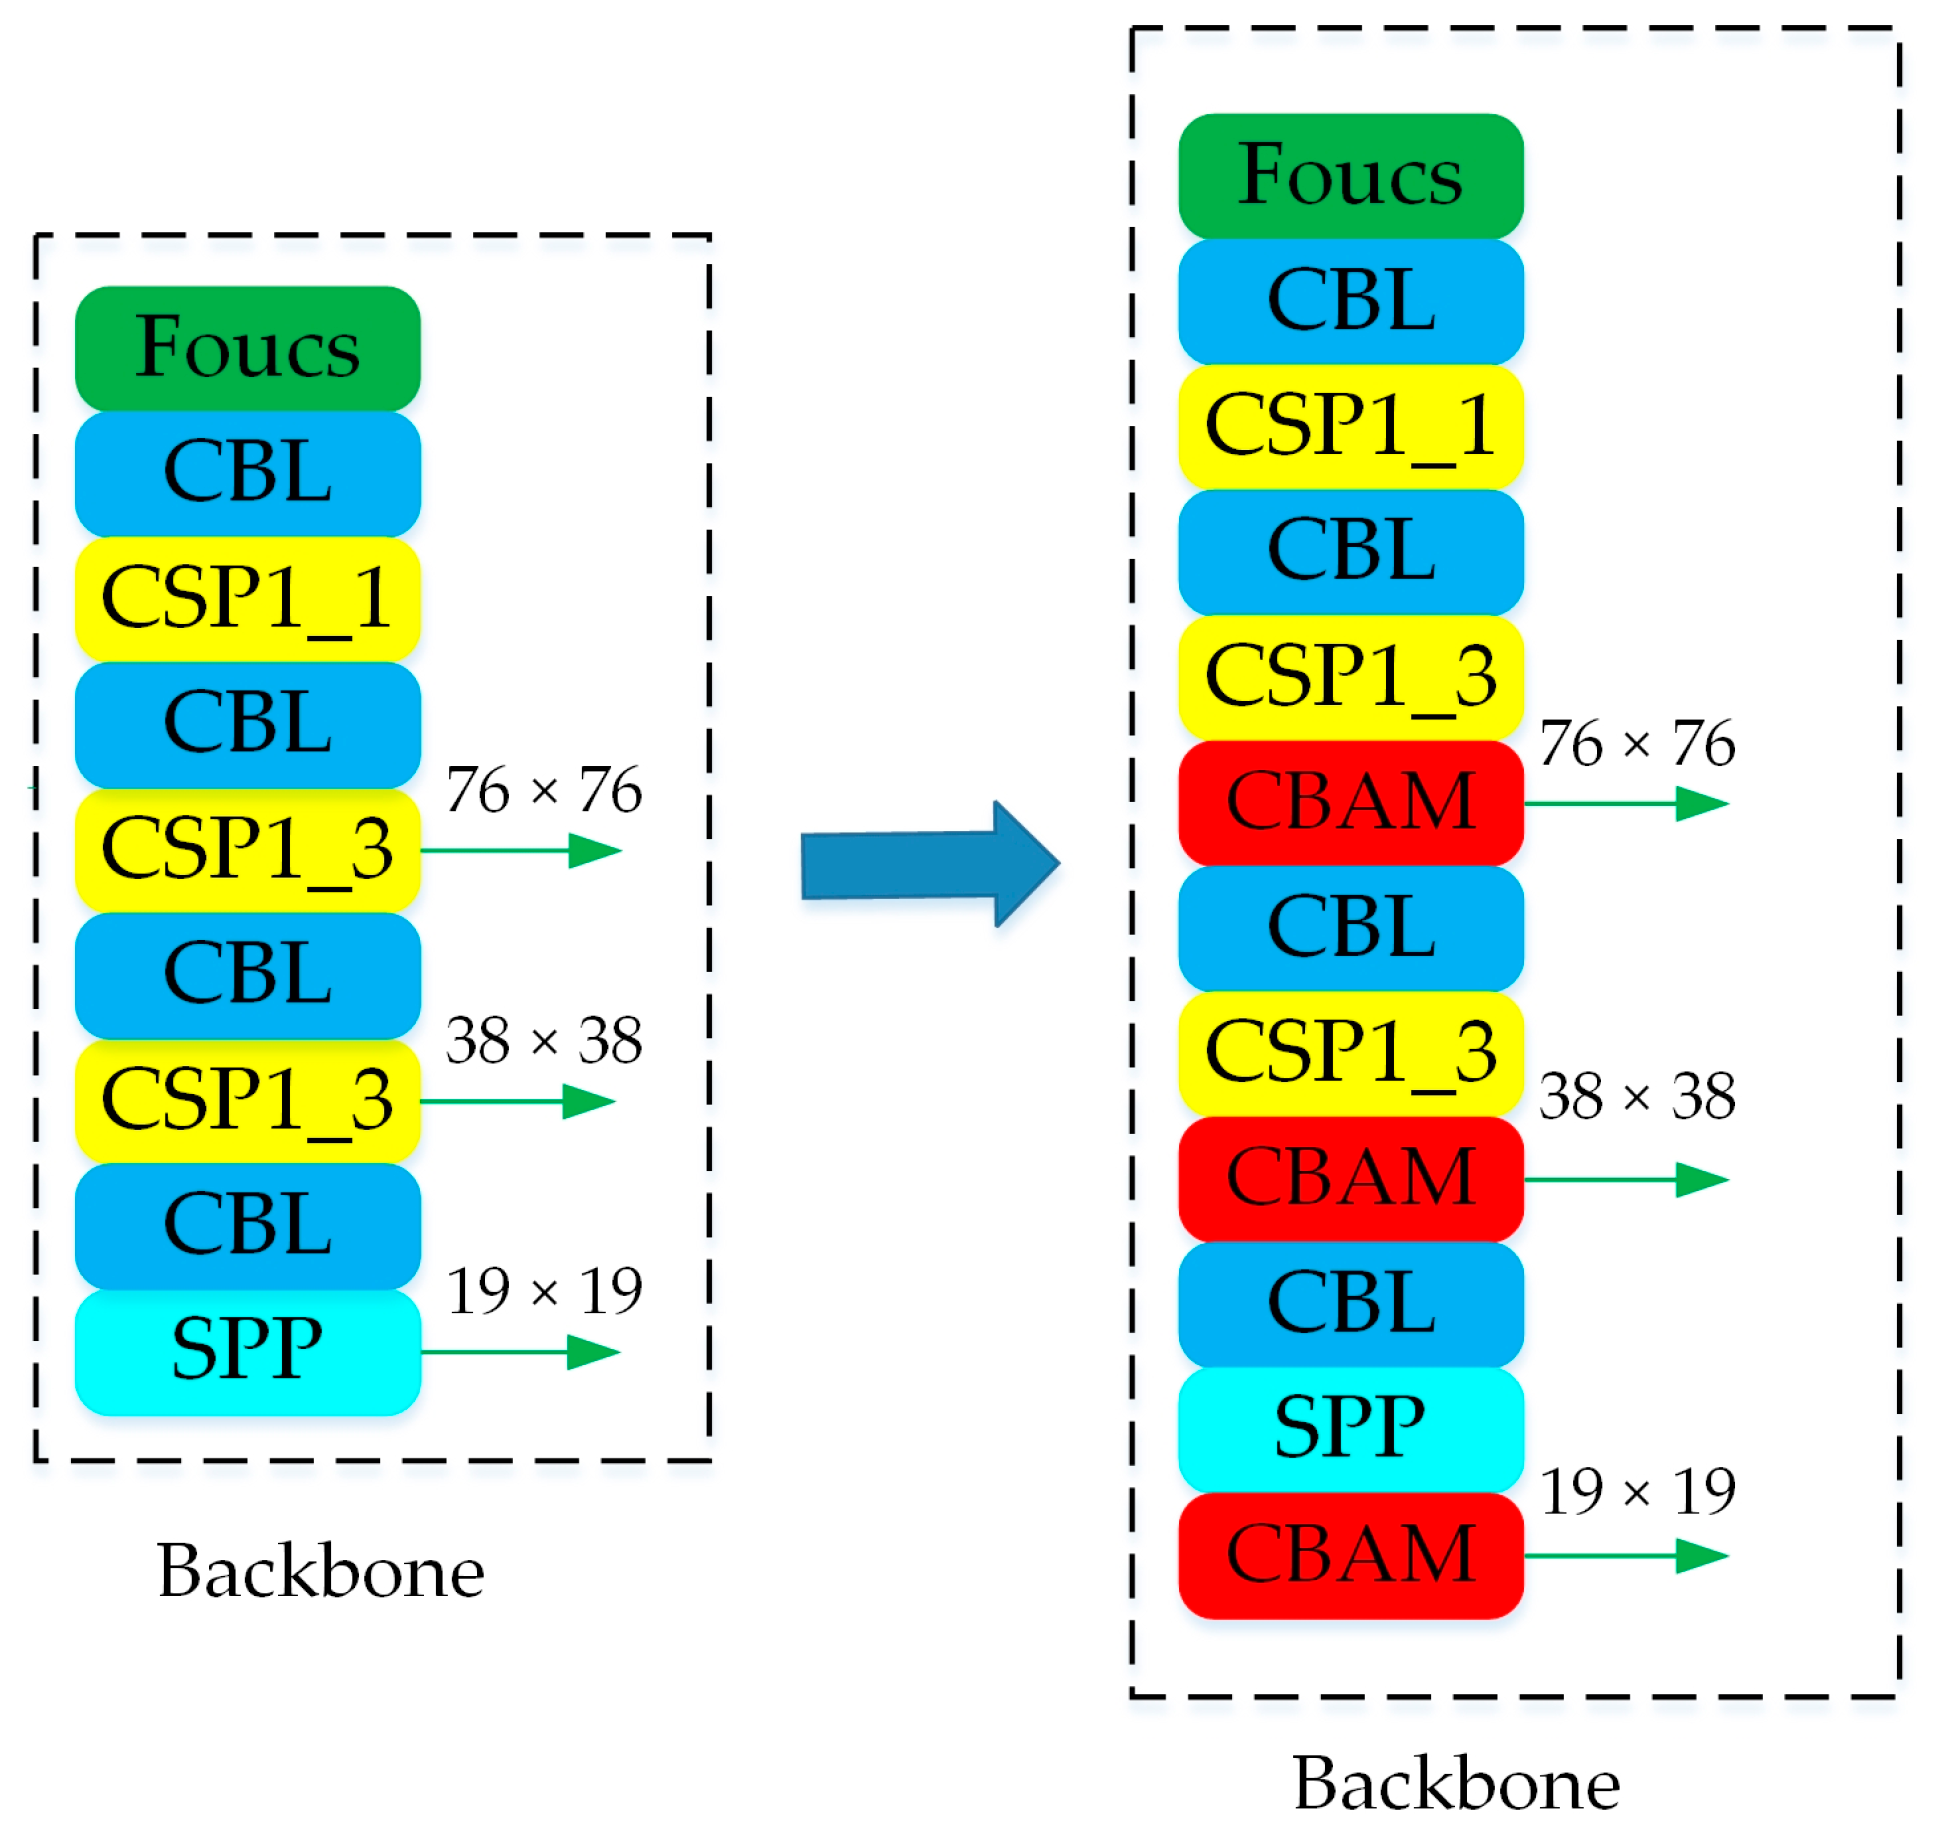
2.3.1. Sugarcane Target Recognition Algorithm Based on YOLOv5s

The YOLOv5s network structure comprises four primary components: input, backbone, neck, and prediction, as illustrated in Figure 4.
During the image preprocessing stage, the CLAHE histogram equalization algorithm is applied to address uneven pixel values caused by dim lighting conditions and camera shake. This technique restores brightness in originally low-pixel-value images to standard ranges, thereby improving sugarcane target recognition rates. As shown in Figure 5, the processed image demonstrates significantly enhanced results compared to the original, enabling increased sugarcane target recognition rates.
To address sugarcane detection difficulties caused by stacking and leaf occlusion, the CBAM mechanism was introduced and fused into the backbone area of YOLOv5s, yielding Improve-YOLOv5s. The CBAM mechanism employs global pooling to incorporate feature map positional information into channels while processing both channel and spatial data. This enhances the model’s representation and generalization capabilities without requiring additional parameters or computational overhead. Consequently, this study chooses to fuse the CBAM into the sugarcane detection model [24]. The optimized model resolves issues including missed detections, incomplete identifications, and low confidence in sugarcane stacking scenarios. The specific architecture is shown in Figure 6.
For the input feature map, the CAM learns dependencies between channels and generates weights for each channel to emphasize or suppress features across different channels. The SAM learns dependencies among spatial locations and generates weights for each spatial location to emphasize or suppress features at different spatial positions. Finally, the outputs of both attention modules are multiplied together to obtain the final optimized attention feature map [25].
In CBAM, the CAM simultaneously employs global maxpool and global avgpool algorithms. It first reduces dimensionality, then increases it, and applies the resulting outputs through multiple MLPs to two channels. Each channel’s feature map is compressed into a scalar, and the pooled vectors are subsequently fed into a fully connected layer to learn complex inter-feature relationships, outputting channel attention weights [26]. A Sigmoid activation function then normalizes outputs to [0, 1], and finally, each channel’s feature map is multiplied by its corresponding attention weight to generate the weighted feature map. The CAM structure is illustrated in Figure 7.
The SAM in CBAM primarily learns attention weights for each spatial location in the feature map. The CAM-generated feature map undergoes bidirectional spatial feature transformations through convolutional operations. Subsequently, spatial pooling operations, typically using maxpool or avgpool, are applied to the feature map, and the pooled results are fed into a fully connected layer to derive spatial attention weights across the feature map. Finally, the channel–attention–weighted feature map is further weighted by spatial attention through a method similar to CAM’s approach, yielding the final weighted feature map. The SAM structure of CBAM is illustrated in Figure 8.
Since the detection target of this study is solely sugarcane, preliminary classification is unnecessary. Therefore, the parallel method is directly selected. In YOLOv5s, the CSP structure extracts image features, enabling the fusion of the CBAM into the CSP1_1, CSP1_3, or CSP2_1 modules of the network. To identify the optimal fusion position, ablation experiments were performed on these locations. All experiments incorporated the CLAHE algorithm and utilized a test set of 100 images containing varying quantities of sugarcane within the conveyor belt. The ablation test results are presented in Table 1.
As shown in Table 1, the highest mean average precision and optimal performance are achieved when the CBAM is embedded within CSP1_3. Consequently, the CBAM is fused into CSP1_3 of the backbone. Given that YOLOv5s utilizes three feature extraction scales measuring 76 × 76, 38 × 38, and 19 × 19, the module is introduced three times in the Improve-YOLOv5s design. The corresponding structure is shown in Figure 9.
After integrating the CBAM into YOLOv5s, it first processes the feature map output from the CSP1_3 module. Within the channel attention component, global average pooling and global max pooling operations generate channel descriptors, which are fed into a multilayer perceptron (MLP). Following weight learning, a channel attention map is produced. This map is multiplied with the CSP1_3 output feature map along the channel dimension, thereby enhancing or suppressing feature responses across channels. In the spatial attention component, the channel–attention–processed feature map undergoes average pooling and max pooling along the channel dimension to create two spatial descriptors. These descriptors are concatenated and processed through a convolutional layer to generate a spatial attention map. Finally, this map is multiplied with the channel–attention–processed feature map along the spatial dimension, enabling the network to prioritize important spatial region features.
Placing the CBAM after the SPP module enables it to process the concatenated feature maps from the SPP module. Similarly, the feature maps first undergo the channel attention component, where multi-scale pooled features are weighted along the channel dimension to emphasize important channels. Subsequently, they pass through the spatial attention component, which weights the feature map along the spatial dimension to highlight critical spatial regions. Thus, CBAM further refines the SPP-enhanced feature map by focusing on key features prior to subsequent layers, enhancing the network’s ability to extract intricate target features while improving object detection accuracy.
At the output end of YOLOv5s, the localization loss function employs CIOU (Complete Intersection over Union). The CIOU loss function exhibits limitations in slow bounding box convergence and inaccurate localization during target-predicted box difference calculations. Consequently, it was modified into the EIOU (Enhanced Intersection over Union) loss function. The EIOU loss function decomposes CIOU’s aspect ratio loss term into differences between predicted width/height and minimum bounding box width/height, accelerating convergence while enhancing regression accuracy.

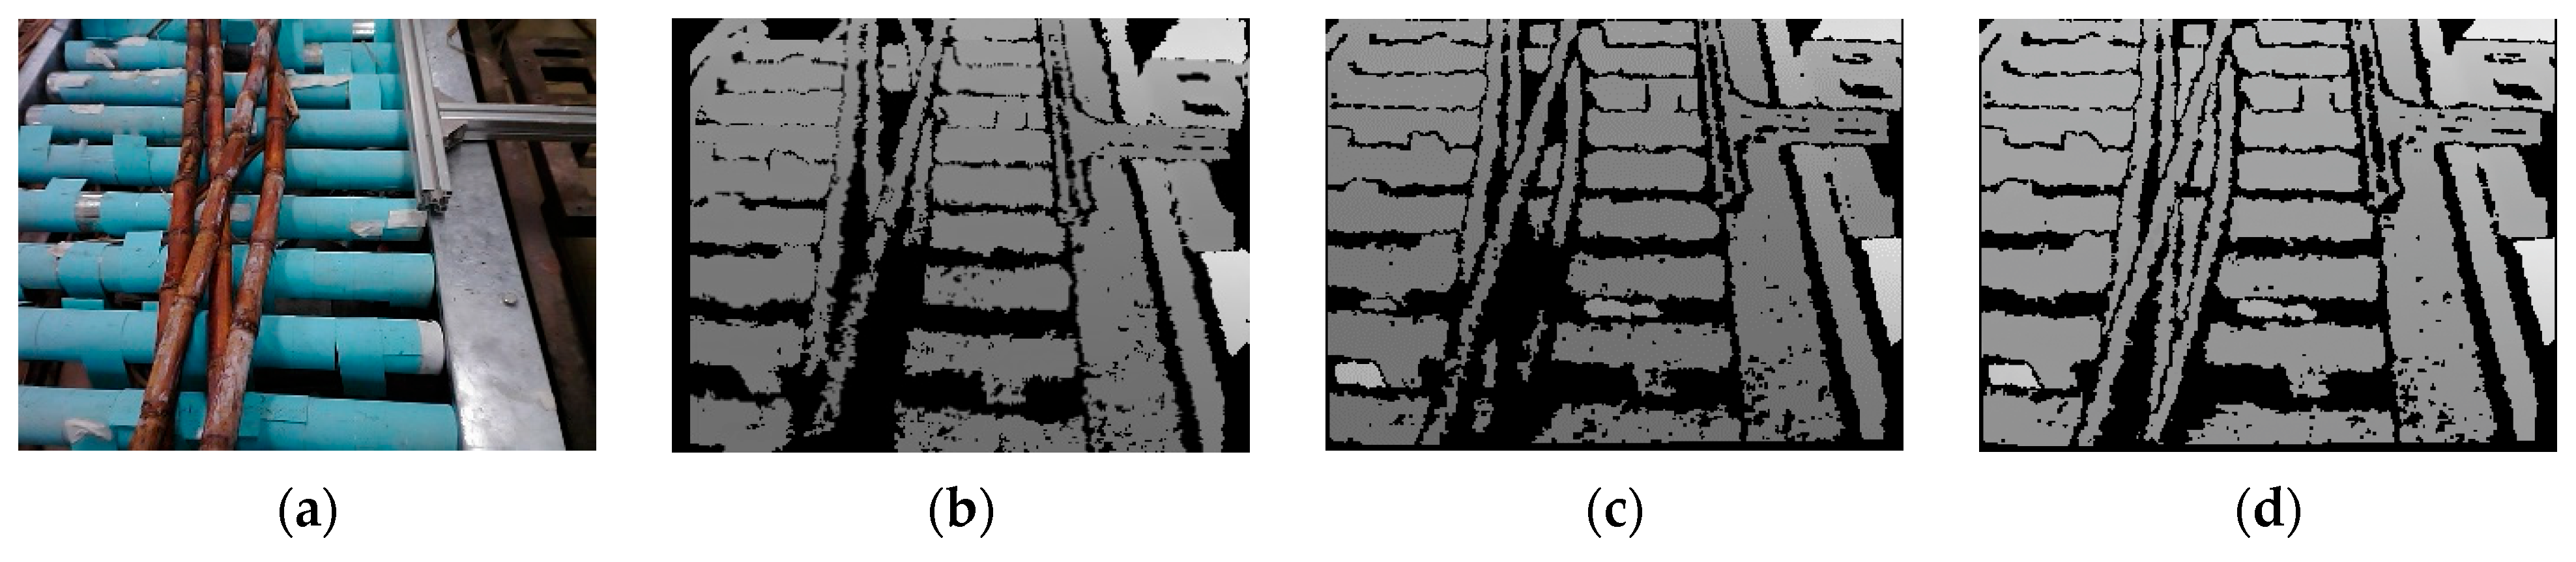
2.3.2. Opti-SGBM Algorithm Based on Double Cost Calculation

Due to the characteristics of sugarcane images featuring dense textures and extensive similar surface colors, depth maps generated by the SGBM algorithm exhibit significant errors and fail to meet volume calculation requirements [27]. Consequently, this section optimizes the algorithm within the SGBM framework. For matching cost calculation, the SAD (Sum of Absolute Differences) and Census cost calculation methods are fused [28,29,30]. We assign weights to these distinct costs based on matching region texture strength. During cost aggregation, dynamic programming enables multi-path cost aggregation, forming the Opti-SGBM algorithm. This optimized approach generates more realistic, reliable, and accurate depth maps.
The SAD cost calculation method is based on the original SGBM cost calculation method. It identifies the window with the minimal SAD by computing the sum of grayscale differences between corresponding pixels in matching local windows of the binocular camera’s left and right views, thus achieving effective pixel-level matching. The underlying principle of the census transformation involves representing encoded pixel grayscale information as a bit string using local grayscale differences within the pixel neighborhood.
Combining two cost calculation methods yields a new cost calculation approach to enhance cost calculation robustness. Additionally, to more accurately compute cost values for sugarcane repeating texture regions and weak texture regions, this study assigns distinct weights to both cost calculation methods, achieving more precise cost computation.
The SAD cost range is defined as [0, S*255], where S denotes window size. The Census cost range is [0, N], where N represents the number of bits in the bit string, determined by window size. To enable comparison of both cost methods on a unified scale, cost values are normalized to a common range using function (1).
ρ c , λ = 1 e x p c λ
where c is the value and λ is the control parameter. When both c and λ are positive numbers, the function resides within [0, 1]. The SAD algorithm and Census algorithm values undergo normalization using Equation (1) and are then summed, fusing the two cost calculation methods. The fusion cost calculation formula is shown in (2).
C n , q = ρ C c e n s u s n , q , λ c e n s u s + ρ C S A D n , q , λ S A D
where C(n,q) is the fusion cost calculation method value, n is the window center pixel point, q is the parallax value of the pixel point within the window, Ccensus(n,q) is the Census algorithm value, λcensus is the Census algorithm control parameter, CSAD(n,q) is the SAD algorithm value, and λSAD is the SAD algorithm control parameter. Weights can be assigned by adjusting the control parameter λ λ for the SAD and Census algorithms. Compared to cost calculation methods using solely SAD or Census, the fusion algorithm generates a more accurate disparity map. This occurs because the Census algorithm utilizes contrast information between neighboring and central pixels instead of original grayscale values, enhancing robustness against brightness deviations from lighting variations. The SAD algorithm achieves higher accuracy in matching pixel grayscale values within a window. By fully combining both algorithms’ advantages, the fusion method improves accuracy, reduces false match rates versus individual algorithms, and delivers superior robustness and noise resistance.
During the cost calculation process, the average grayscale value of the pixels within the matching window is calculated and compared with the maximum and minimum values within the window, as shown in Equation (3).
d = I m a x I ¯ + I m i n I ¯ 2
where I is the grayscale value of pixels within the matching window, and d is the average value of the difference between the maximum and minimum grayscale values of pixels in the matching window against the mean value. If d is less than the preset threshold k, the region covered by the window can be determined to be a weak texture region. In weak texture regions, due to the small differences between pixels, the cost calculation values are often close to each other, which increases the possibility of matching errors. Therefore, during the cost calculation process, if a window region is determined to be a weak texture region, the cost calculation values for that region are treated specially, as shown in Equation (4).
C n , q = d × ρ C c e n s u s n , q , λ c e n s u s + ρ C S A D n , q , λ S A D
If d is greater than k, the cost calculation is as shown in Equation (5).
C n , q = ρ C c e n s u s n , q , λ c e n s u s + d × ρ C S A D n , q , λ S A D
Among these, the parameter k directly influences the algorithm’s accuracy in identifying texture regions, consequently affecting depth map quality. An excessively small k may misclassify strong texture regions as weak texture, prompting unnecessary computations in non-weak texture regions. This increases computational load and risks introducing noise. Conversely, an overly large k may overlook weak texture regions, causing stacked sugarcane contours to merge or split erroneously, thereby amplifying volume calculation errors. The threshold for k can be determined experimentally by comparing depth map quality across different k values to select an appropriate value.

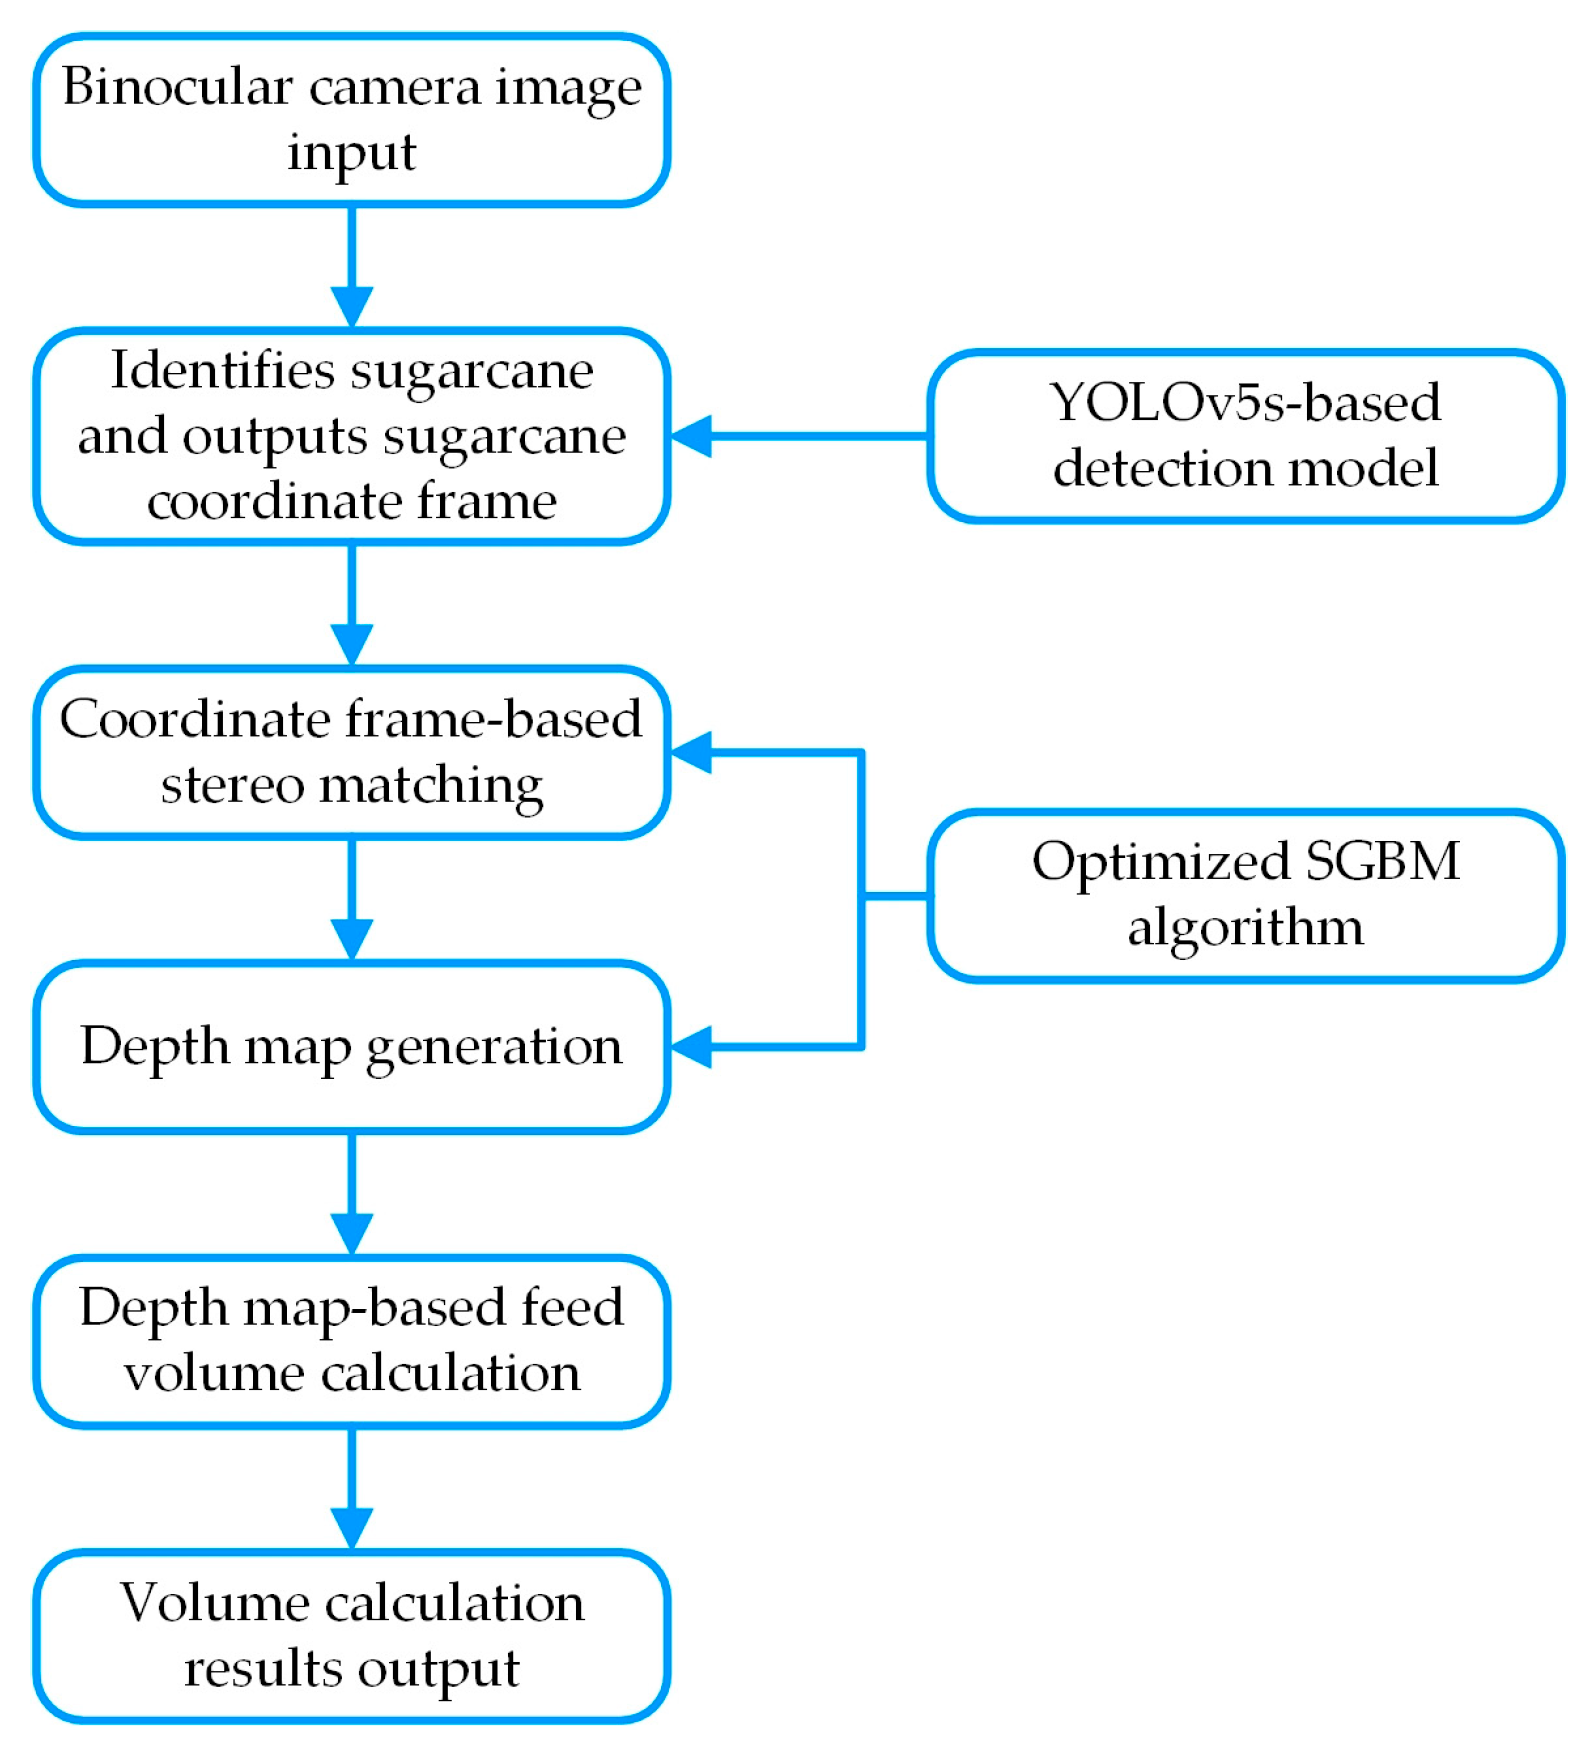
2.3.3. YOLO-ASM Algorithm Based on Improve-YOLOv5s and Opti-SGBM

During image processing in the binocular vision system, the Improve-YOLOv5s algorithm analyzes acquired images to achieve precise sugarcane detection and localization. Images from binocular cameras are processed through the Improve-YOLOv5s sugarcane detection model, generating intuitive visual outputs while marking predicted bounding box positions. Since the sugarcane recognition model has been improved in this study, sugarcane recognition confidence, recognition accuracy, and prediction bounding box precision are all high. Therefore, prediction box coordinates can be directly output as sugarcane coordinates. The upper-left corner of the left camera image is selected as the origin. Horizontal rightward and vertical downward directions from this point are defined as positive x-axis and y-axis directions, respectively. Coordinate system units are pixels. The detection model output is shown in Figure 10.
This diagram illustrates the process using one sugarcane stalk as an example. The original model outputs coordinates of the prediction box’s position, corresponding to the two intersection points of the dashed line in the figure: b1, b2, h1, and h2. Through simple output modification, these coordinates are transformed into the prediction box’s top-left and bottom-right corners: (x1, y1), (x2, y2), (x3, y3), and (x4, y4). These pixel-unit coordinate values are transmitted to the SGBM matching cost calculation module. By integrating the Improve-YOLOv5s and Opti-SGBM matching cost calculation modules, the fused YOLO-ASM algorithm achieves precise matching computations within limited areas. Specifically, matching is performed only within two predefined rectangular regions with areas (x1x2)(y1y2) and (x3x4)(y3y4), while other regions undergo direct depth zeroing processing. This strategy significantly reduces computational load, greatly shortens stereoscopic matching time, and substantially improves matching accuracy.

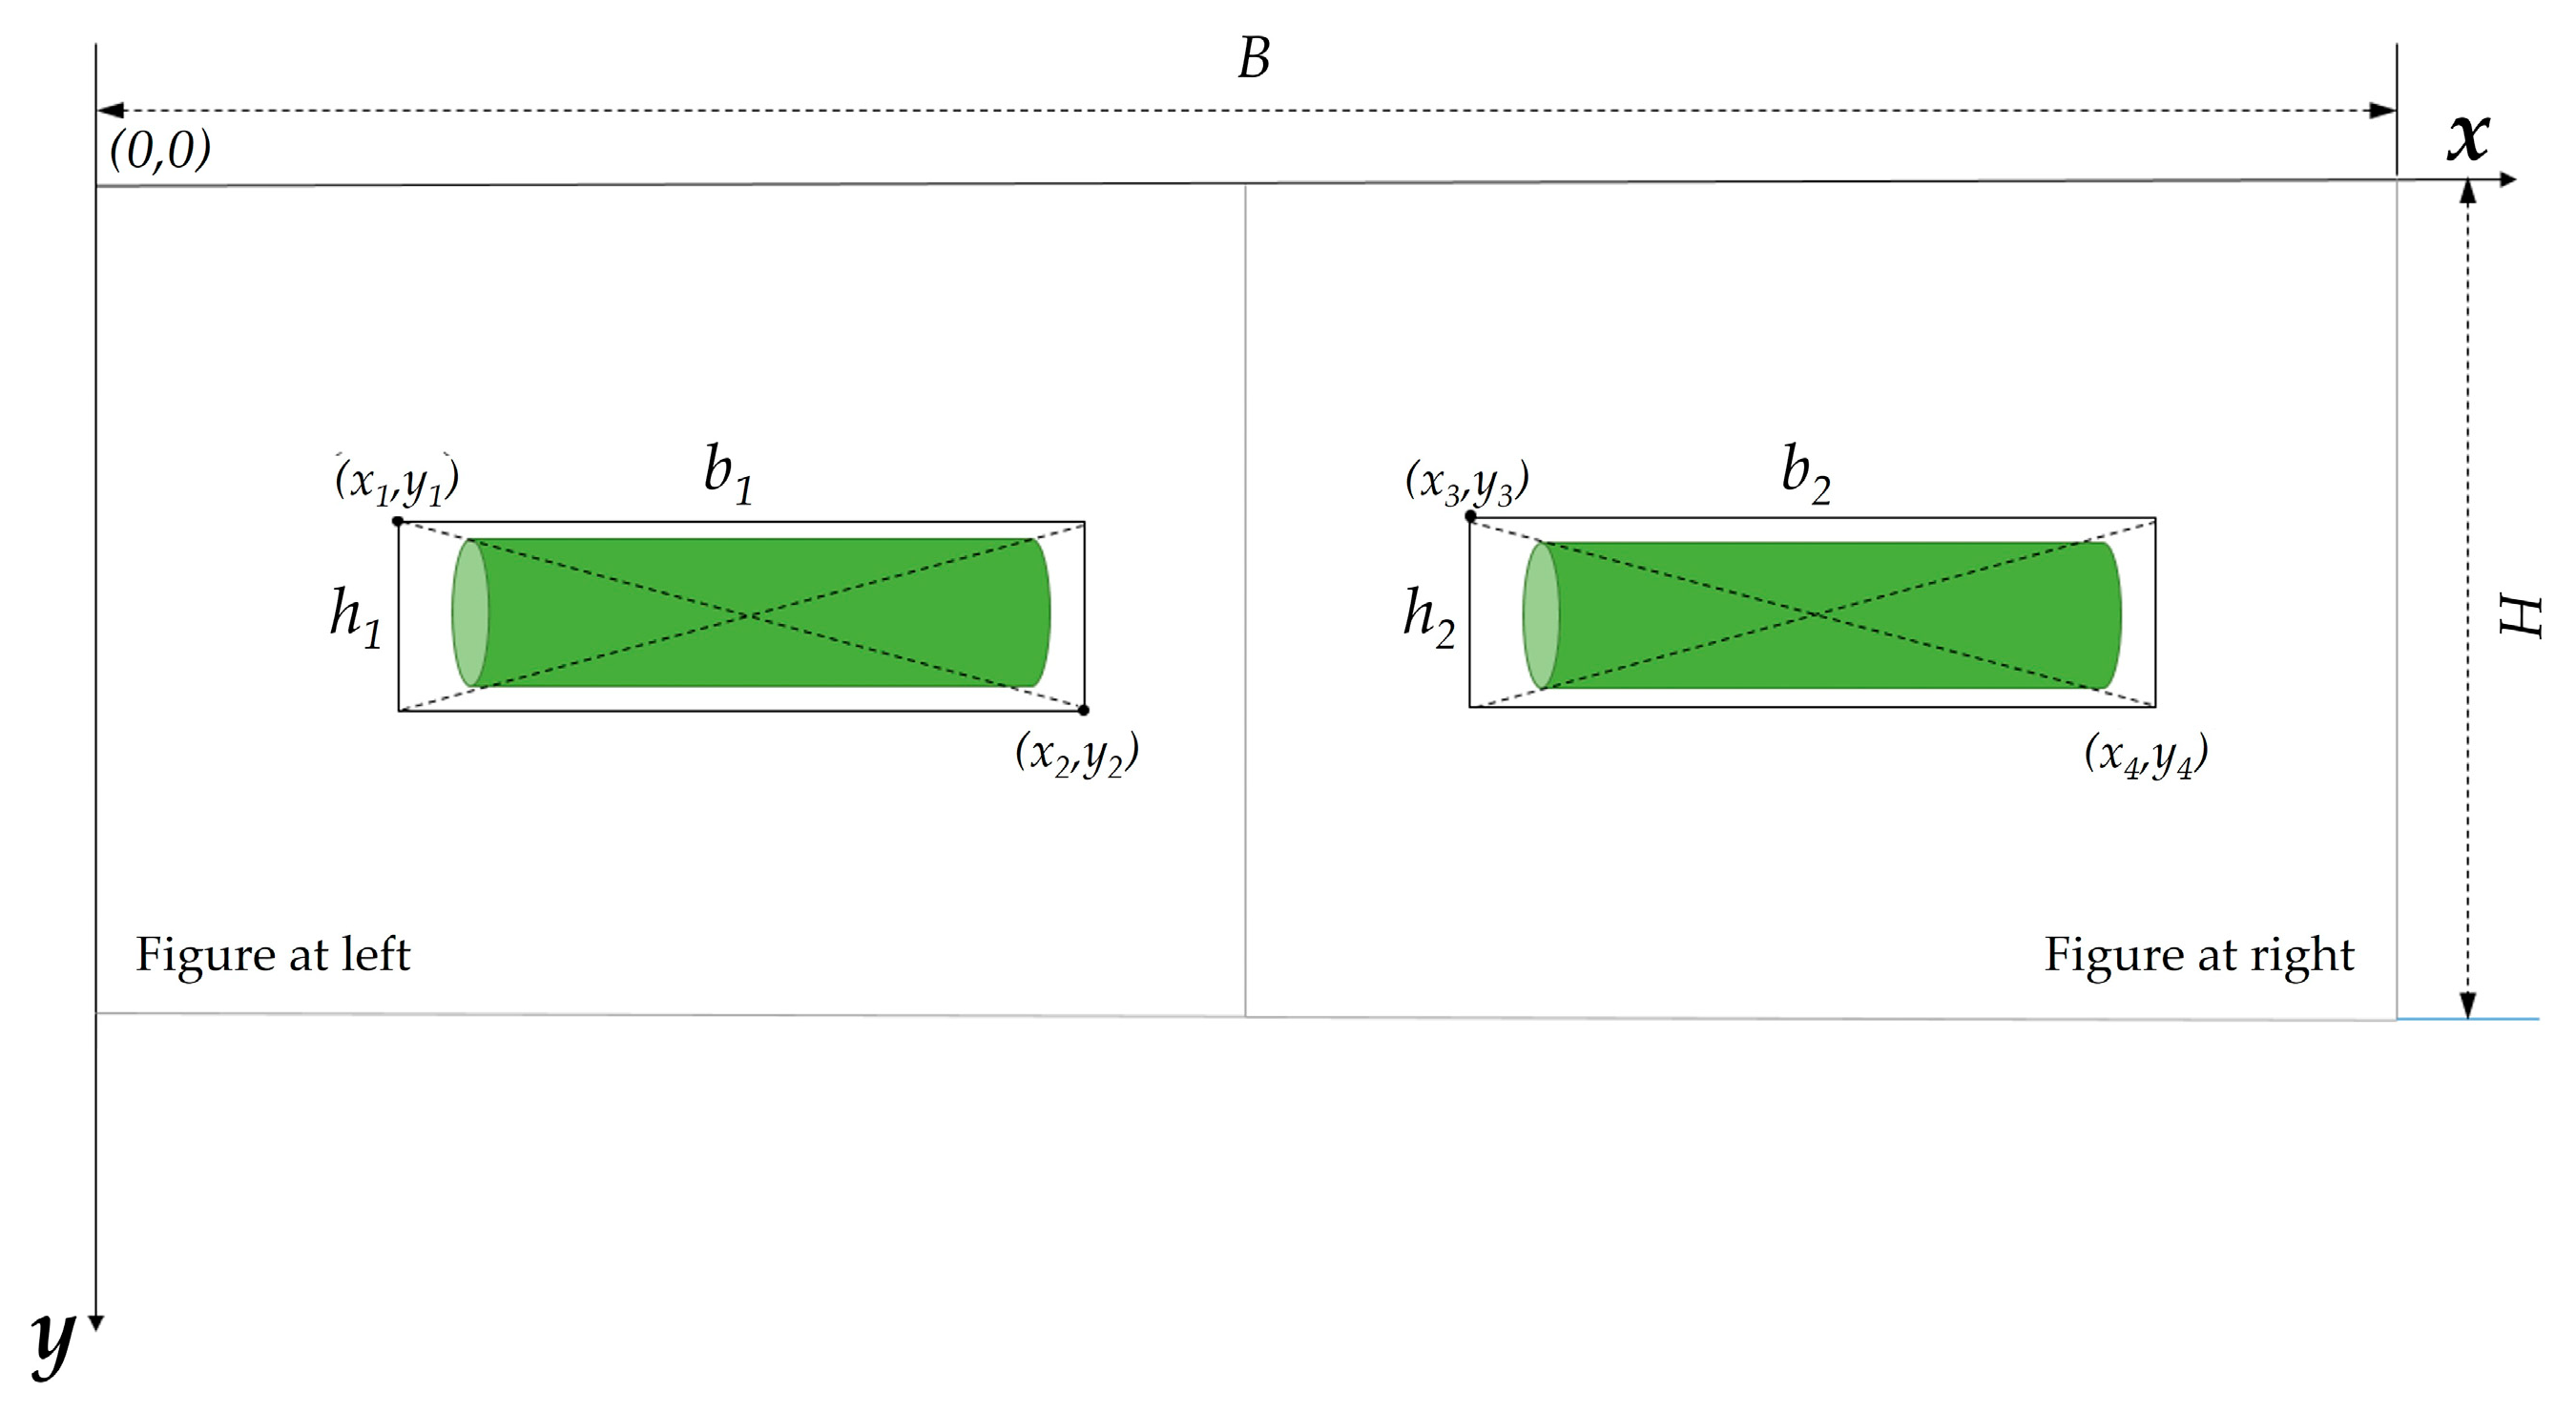
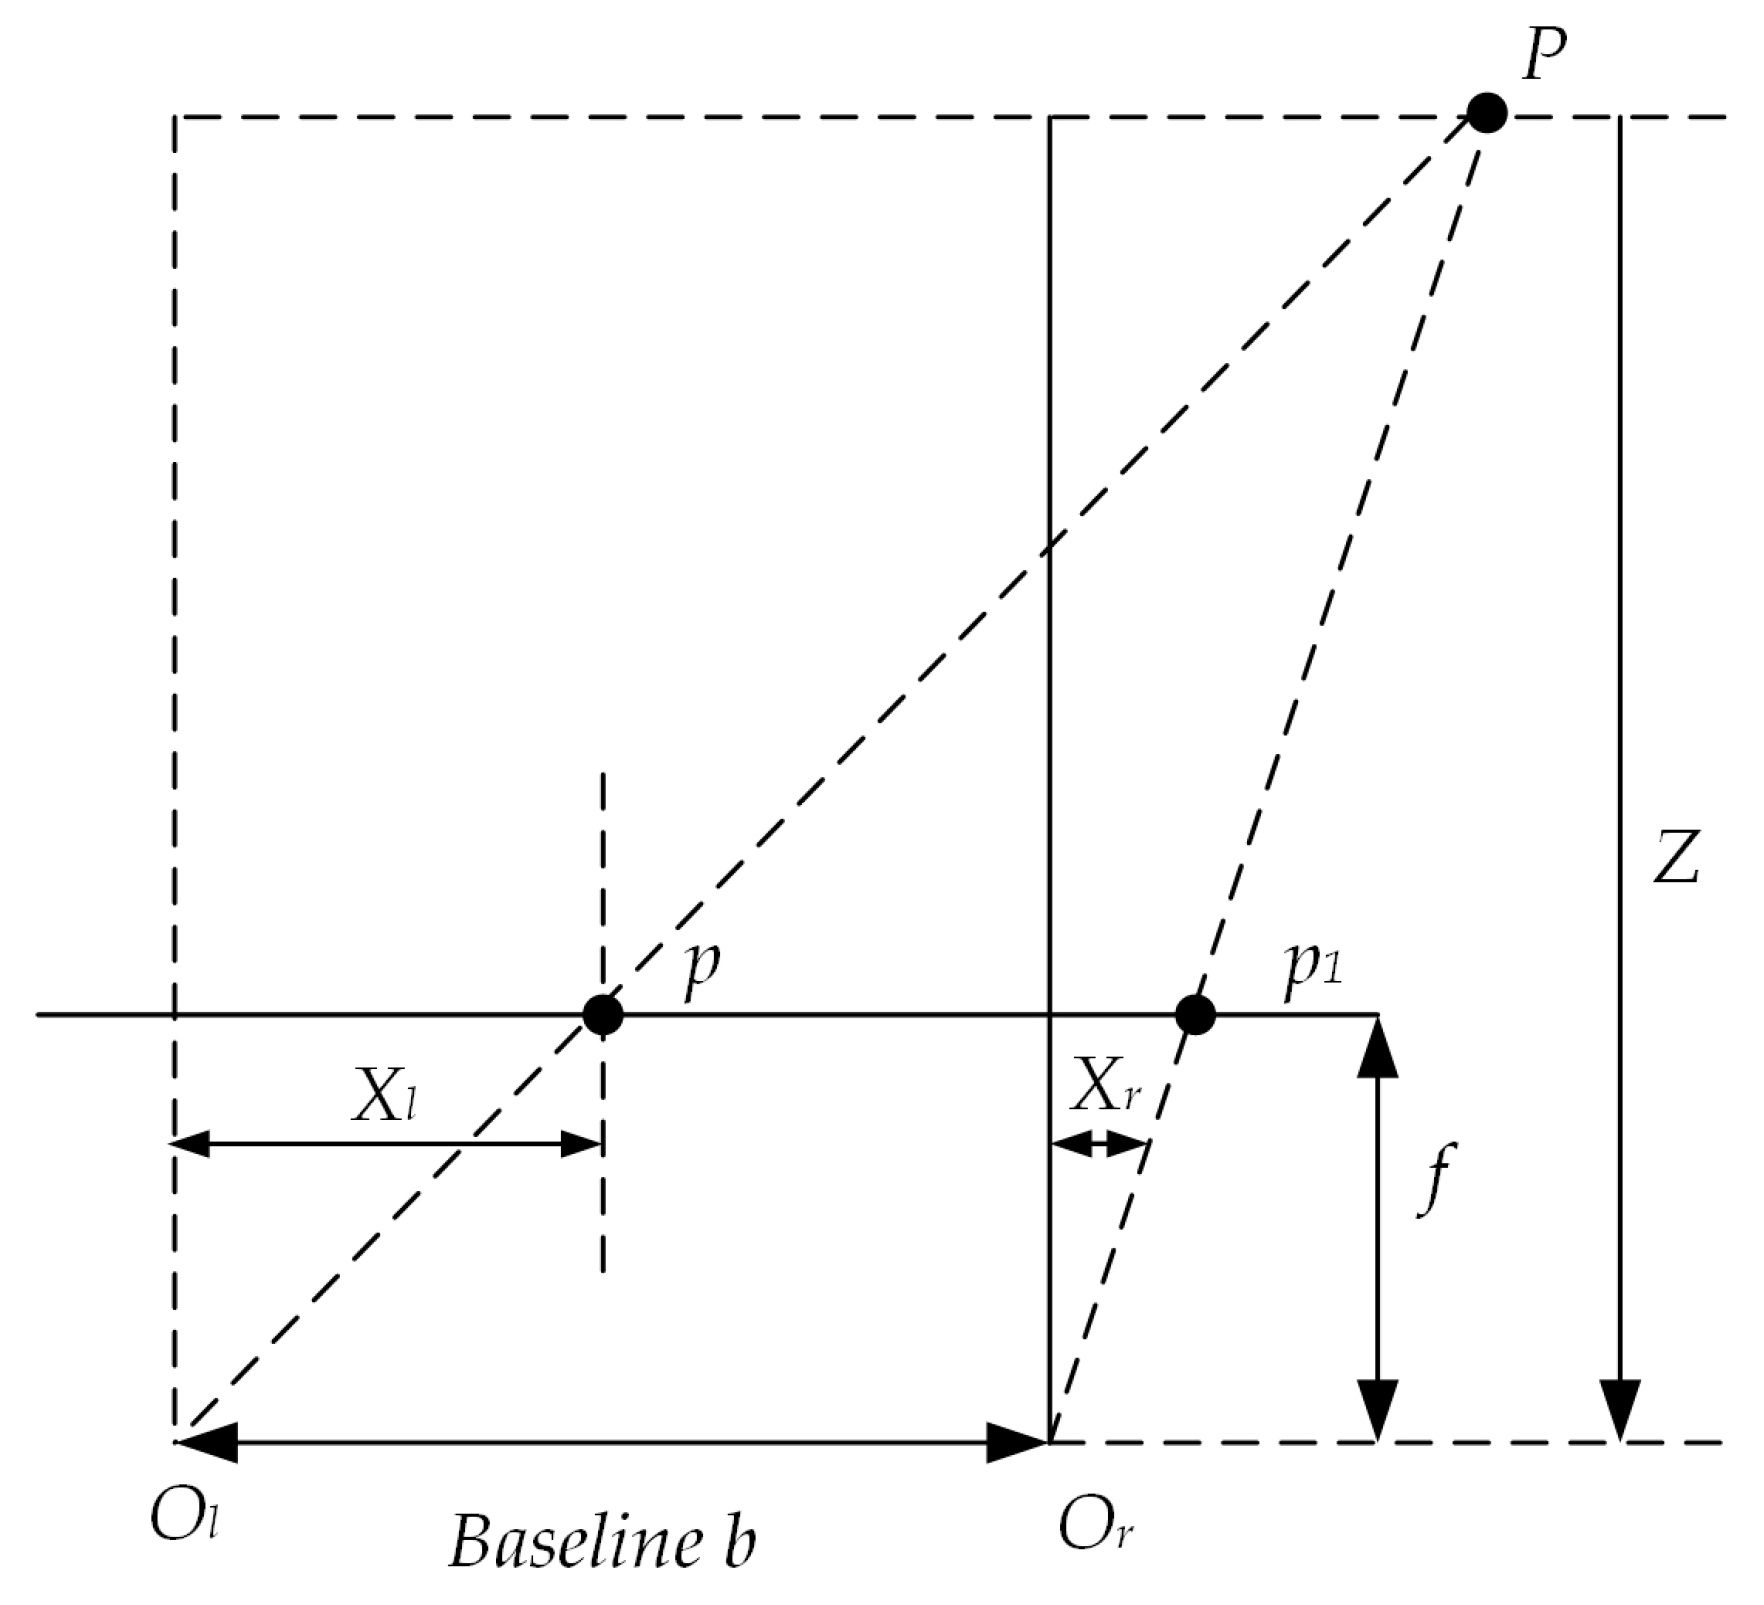
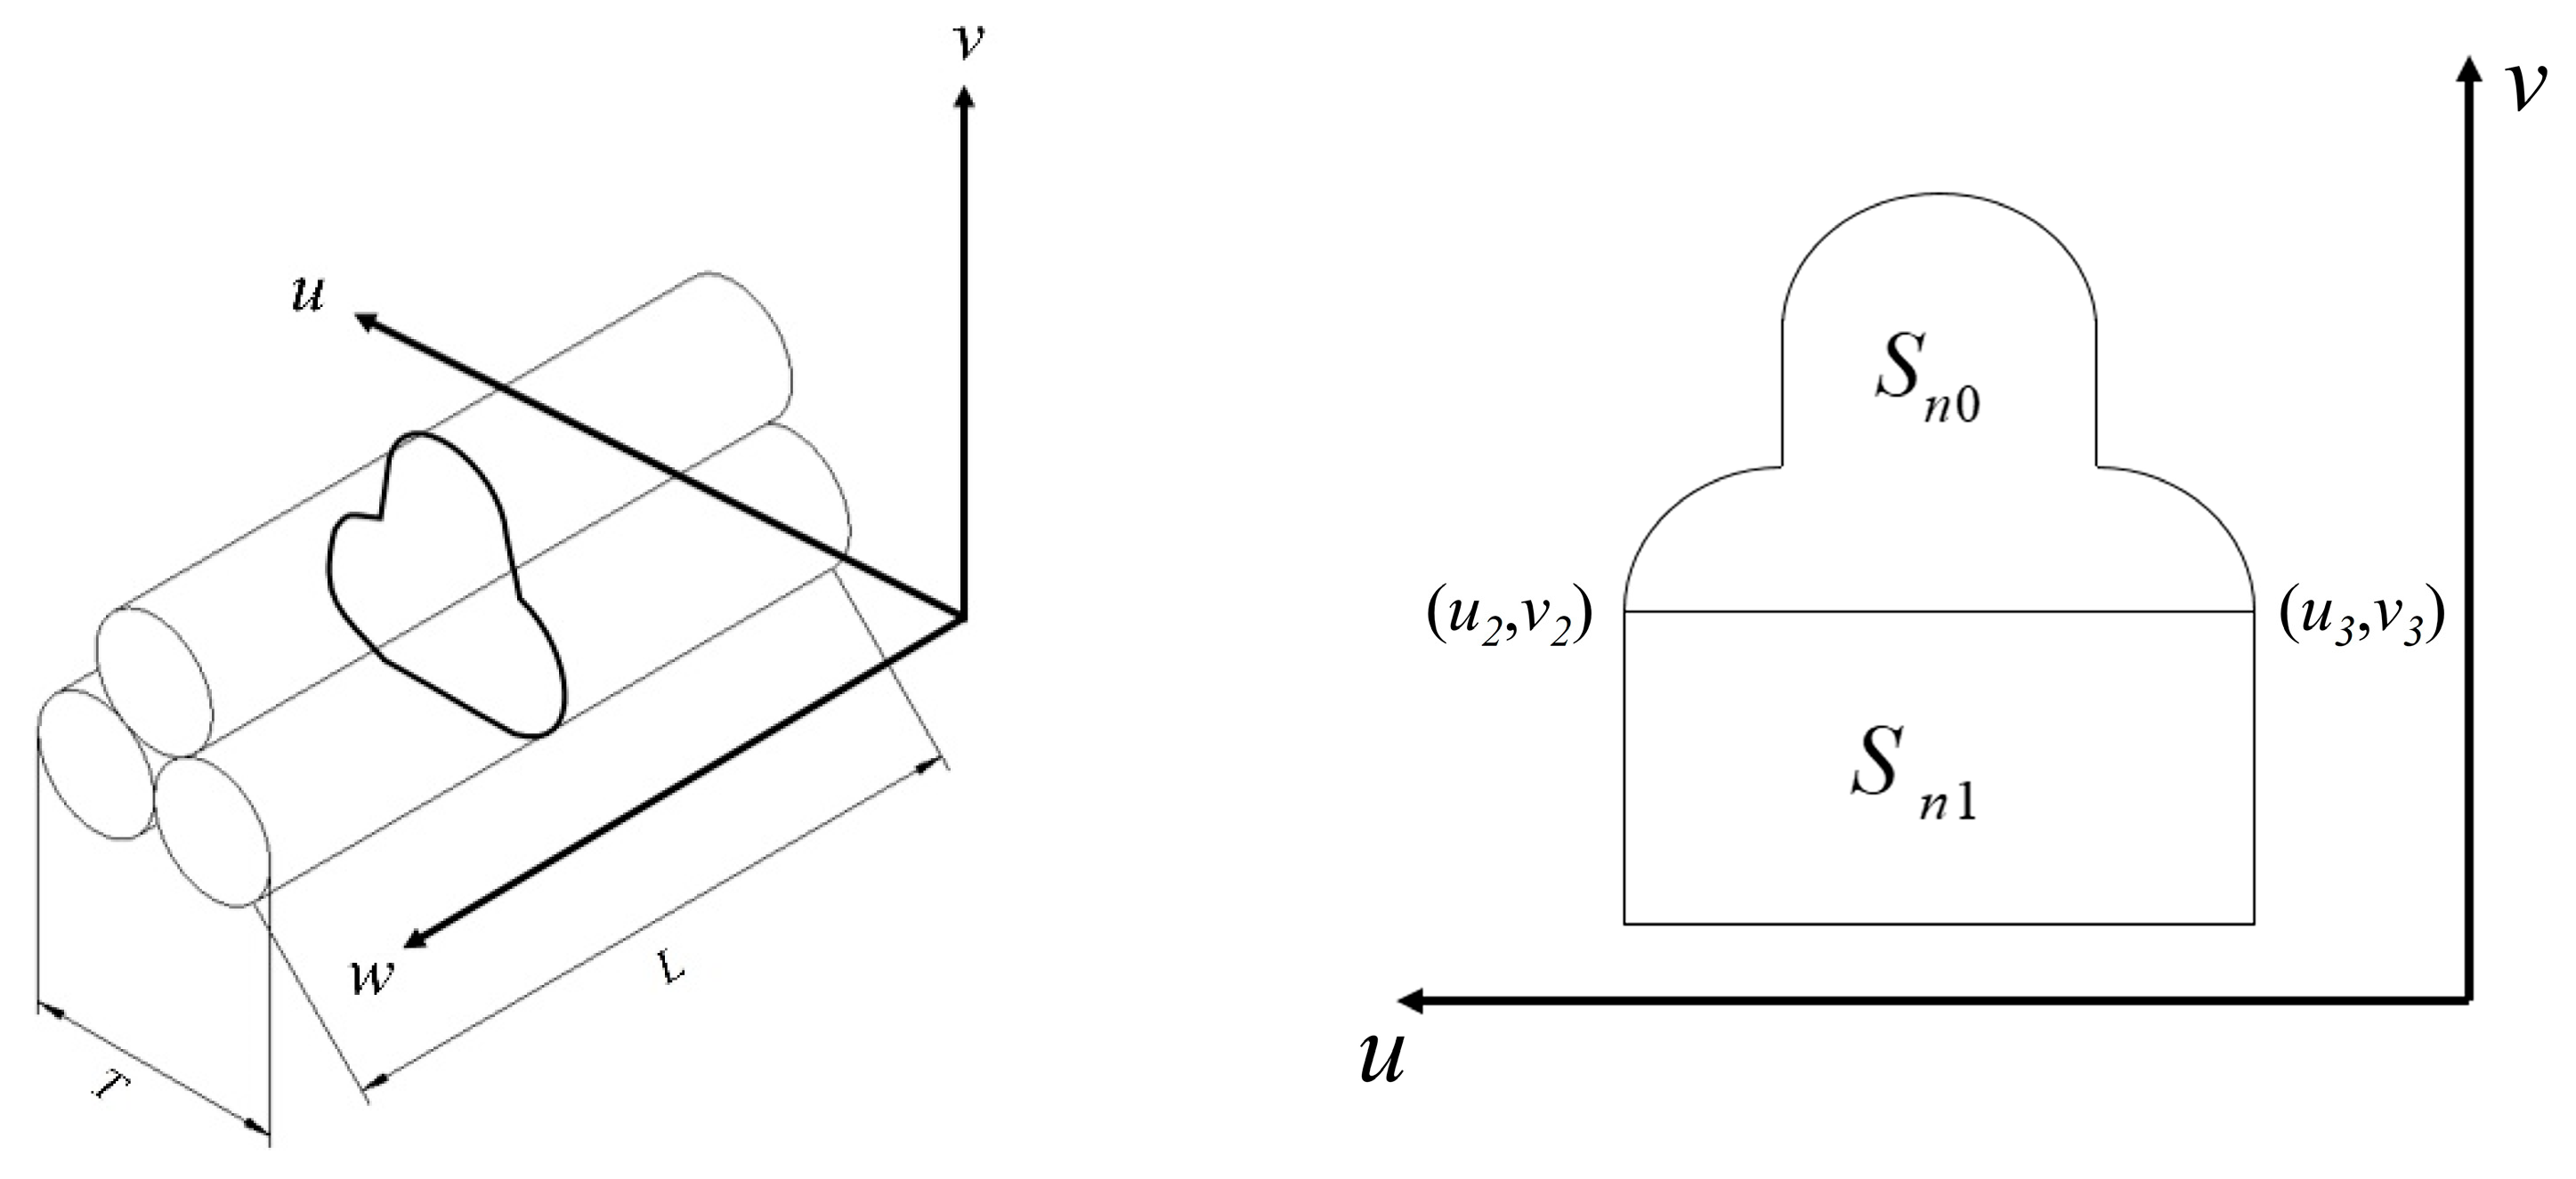
2.3.4. Theoretical Analysis of Sugarcane Feeding Volume Calculation

The stacking of sugarcane is shown in Figure 11 below. When calculating the volume, the information obtained from the depth map is processed separately using the differential method and then summed. To simplify calculations, sugarcane is approximated as a cylinder composed of multiple cylindrical units of equal length. Consequently, the depth information for each cross-section is derived from the depth map, the area of each cross-section is calculated, and the sugarcane volume is then obtained by summing these areas.
The dual-camera system is positioned over the conveyor system to capture vertical images of sugarcane. The process for acquiring depth information is shown in Figure 12.
As demonstrated in the figure above, a spatial point P(X,Y,Z) in the stereo imaging system is projected onto the left and right cameras as p(x1,y1) and p1(x2,y2), respectively. Based on the pinhole imaging principle, Equations (6) and (7) are derived from the dual-camera system.
Z f = X x 1 = Y y 1
Z f = X b x 2 = Y y 2
where f is the focal length of the stereo camera, and b is the baseline length of the stereo camera. The values of x1 and x2 are derived from Equations (6) and (7), with the disparity value d computed as d = x1x2. The three-dimensional spatial coordinates of point P are subsequently calculated using Equation (8).
X = b · x 1 d Y = b · y 1 d Z = b · f d
Following depth information acquisition for sugarcane images via this method, the coordinates (u, v, w) of sugarcane contour endpoints are acquired. For adjacent edge points, the Euclidean distance formula given in Equation (9) is applied to compute the distance between them, thereby determining the total length of the sugarcane in the current image. During the calculation, the longest edge length present in the current image serves as the basis for the total length used in the volume calculation.
L = ( u 2 u 1 ) 2 + ( v 2 v 1 ) 2 + ( w 2 w 1 ) 2
where L is the length of the sugarcane. Once the sugarcane length is determined, it is considered—based on differential calculus—that the sugarcane comprises a series of small cylinders stacked together, each with a thickness equal to the width of a single pixel, as shown in Figure 13. Each pixel value represents a different depth. By combining the obtained depth map, the basic outline of the upper semicircle of the circular cross-section can be determined. Calculating the area of all pixel points within this upper semicircle based on depth yields a structure similar to that depicted below the upper circle in Figure 13. Next, based on the pixel points (u0, v0) and (u1, v1) defining this semicircular cross-section, the area Sn1 of the underlying rectangle is determined. At this stage, only the semicircular area Sn0 remains. Assuming symmetry, Sn0 represents half of the sugarcane’s cross-sectional area at this position. Sn0 is then multiplied by 2 to obtain the full cross-sectional area of the sugarcane. Using this method, the volume of the entire sugarcane is calculated by stacking along the w-axis. The formula is given in Equation (10).
V = 0 L 2 S n 0 d p
where p is the unit length, V is the volume of a single sugarcane stalk, and Sn0 is the area of the semicircle on the cross-section of the sugarcane stalk.
Obtaining information on the sugarcane cross-section when stacked is particularly important for more accurately calculating the feed volume. However, directly analyzing the cross-section of multiple stalks of sugarcane stacked in two layers is considerably complex. To simplify this process, this paper first performs an in-depth geometric analysis using three stacked sugarcane stalks as an example, shown in Figure 14.
The camera is mounted directly above the sugarcane. In a vertically stacked configuration, since the sugarcane shape is approximated as cylinders, the cross-section when three stalks are stacked can be represented by a semicircle from the top sugarcane layer and quarter circles from the two lower layers. Subsequently, following the previously described calculation method, integration is performed downward. Based on the edge coordinates in the top-down view, the area Sn0 is obtained by subtracting the area Sn1 derived from these coordinates. At this stage, the calculation for the sugarcane area matches that for a completely flat arrangement. However, under stacking conditions, this method omits half of the cross-sectional area of the bottom two sugarcane stalks. Therefore, the distance T between the edge coordinates u2 and u3 is used to detect stacking. According to relevant research, genetics constitutes the most significant factor affecting sugarcane diameter, followed by the growing environment [31,32,33]. Consequently, we posit that sugarcane of identical variety cultivated under identical environmental conditions exhibits minimal diameter variation. The threshold value T is determined based on statistical data on target sugarcane diameter, thus enabling estimation of lower-layer sugarcane quantity within stacked sugarcane.
The diameter of the collected sugarcane was measured, with an average of approximately 28.68 mm and a maximum of approximately 32 mm. Consequently, when T ranges between 32 mm and 64 mm, the presence of two stacked sugarcane stalks is assumed. To simplify calculations, the bottom two stalks are assumed equal in size with a diameter of T/2, and the omitted area is calculated using Equation (11). Given the minimal and nearly incompressible volume of gaps between densely stacked sugarcane stalks, and considering these gaps occupy space within the conveyor system, they are incorporated into the stacked sugarcane volume to serve as a basis for conveyor speed regulation.
S n 2 = π T 4 2 = π T 2 16
where Sn2 is the omitted area of the bottom cross-section of sugarcane, T is the difference in the horizontal coordinate of the bottom edge of the sugarcane cross-section. According to the above calculation method, the sum of the areas of this cross-section when stacked is given by the following Equation (12).
S n = S n 0 + S n 2
where Sn is the total cross-sectional area of sugarcane. Subsequently, using the integral formula given in Equation (10), the total volume is obtained by summing all cross-sectional areas. When three or more sugarcane stalks are stacked, three or more stalks are present at the bottom. Similarly, Sn0 can be calculated using the method described above. The omitted area is still derived based on the edge coordinate values. When T is greater than or equal to 64 mm, three sugarcane stalks are stacked at the bottom. At this point, the omitted area is calculated using the following Equation (13).
S n 2 = 3 2 π T 6 2 = π T 2 24

3. Results

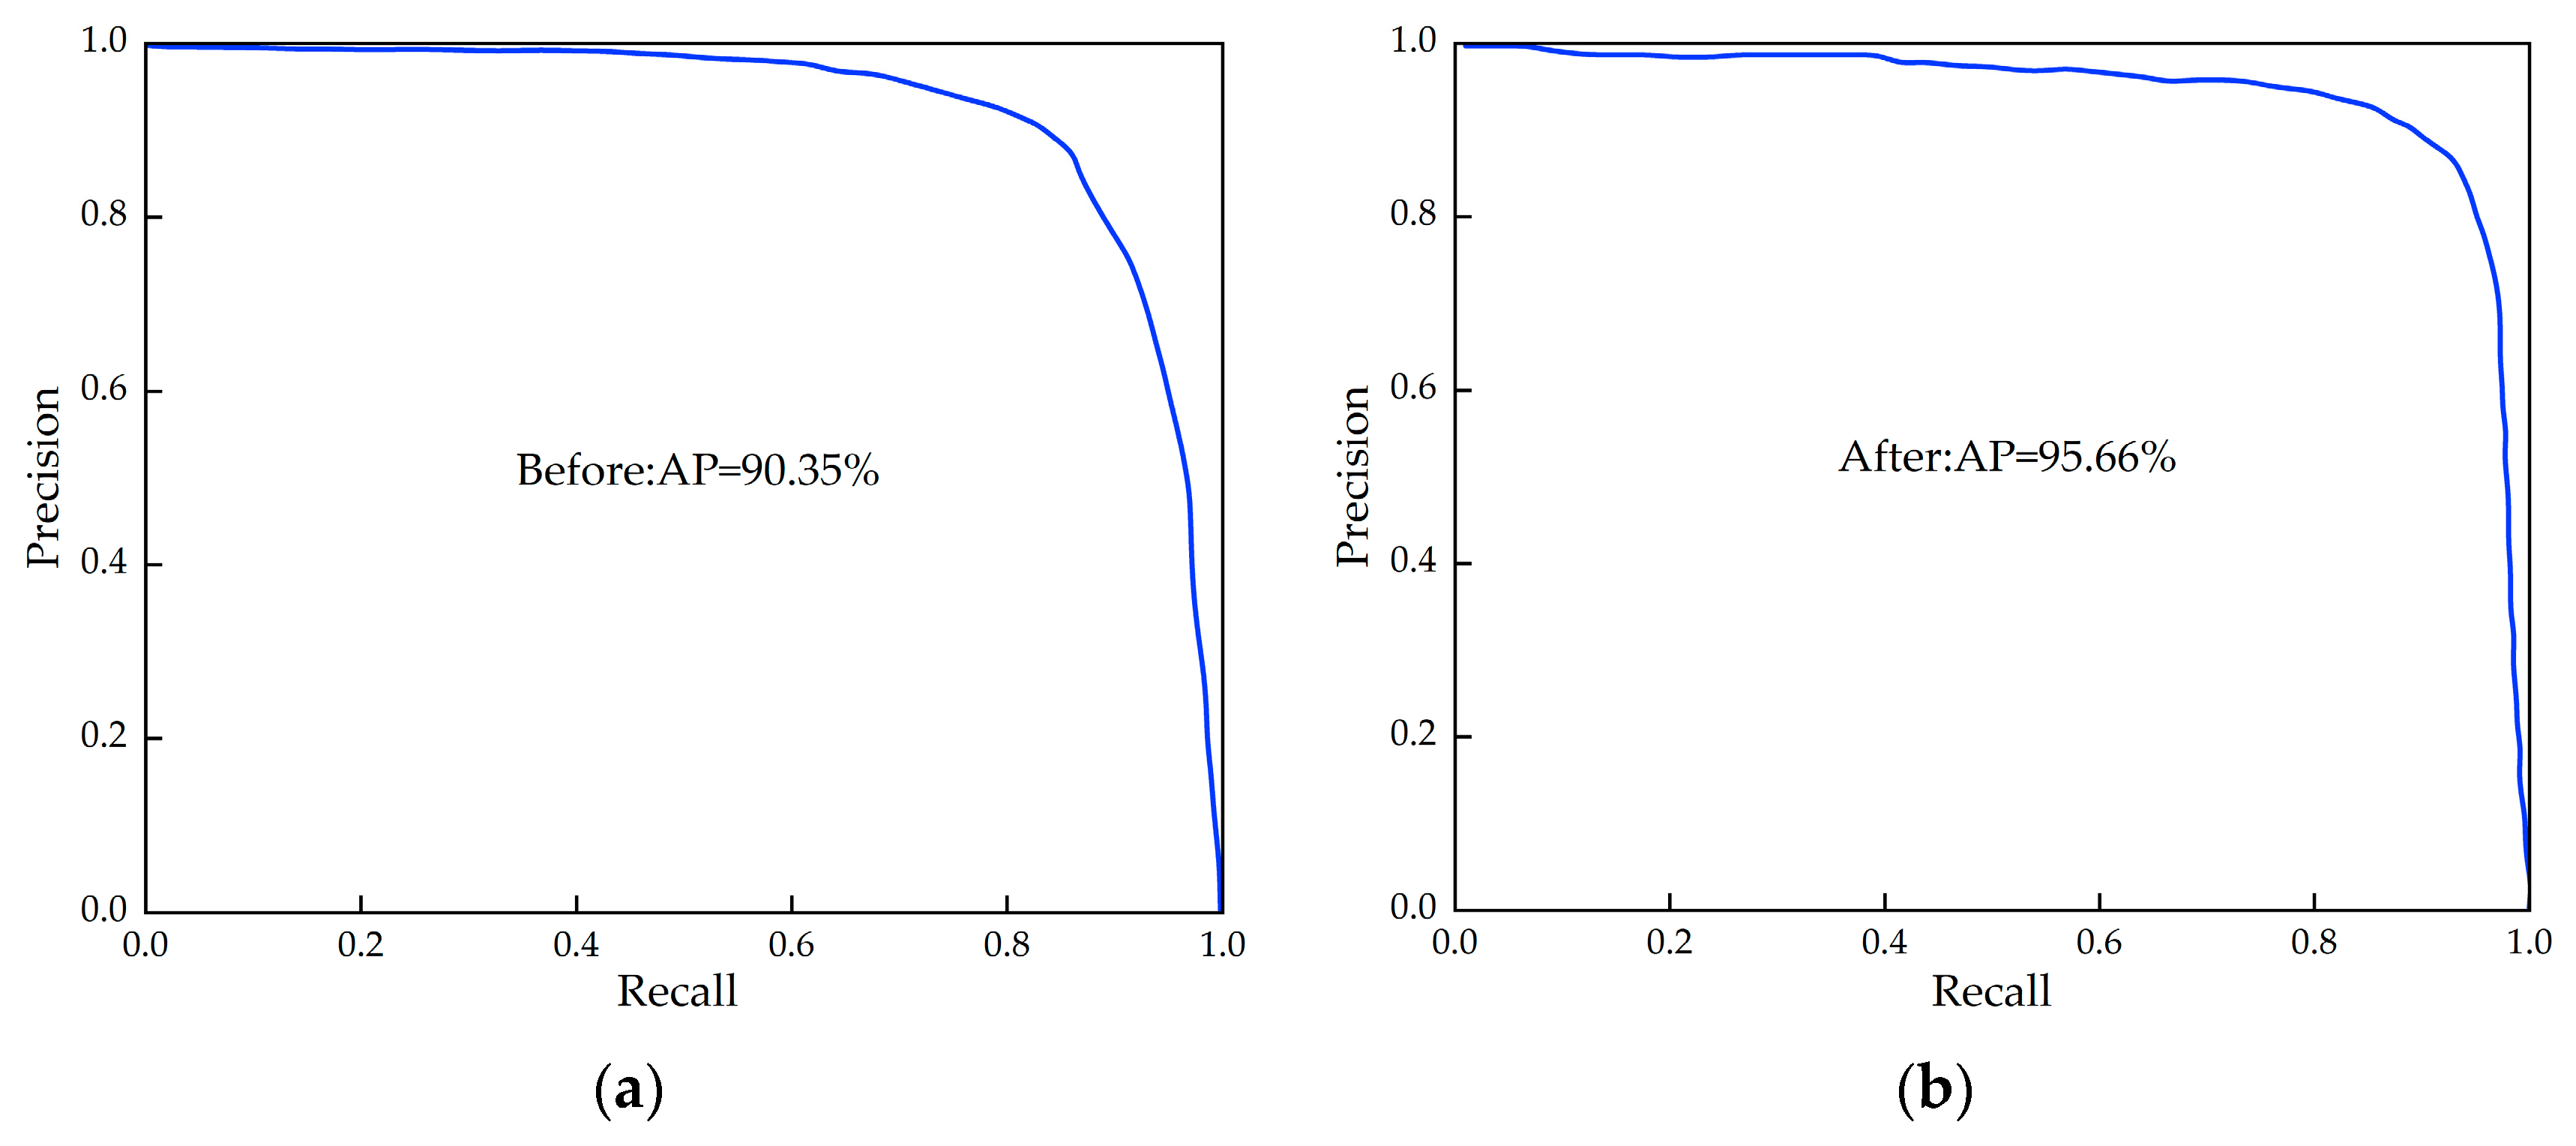
3.1. Improve-YOLOv5s Performance Experiments

3.1.1. Algorithm Performance Comparison

To validate the detection performance of the Improve-YOLOv5s algorithm, it was compared with several other object detection algorithms. All models were trained using transfer learning. The pre-training dataset employed a sugarcane dataset previously captured by the research team, containing 970 images of sugarcane arranged in varying quantities. After data augmentation, the dataset comprised 2880 images in total, with 2304 images used as the training set and 576 images as the validation set. Additionally, 100 images of different quantities of sugarcane in a conveyor channel were captured separately for use as the test set.
All models were trained using the same expanded dataset, with images adaptively cropped to meet model requirements. Testing employed the same test set, experimental environment, and conditions (GPU: NVIDIA RTX2060Ti, NVIDIA, Santa Clara, CA, USA; system: Windows; runtime environment: PyTorch+CUDA). Specific detection results are presented in Table 2, where FPS (Frames per second)—a key metric for inference speed that indicates frames processed per second—shows that higher values correspond to faster processing. The improved YOLOv5s model demonstrates a 5.31% average accuracy improvement and a 28.04% detection speed improvement over the original YOLOv5s model.

3.1.2. Ablation Studies

Experiments were performed using the research team’s sugarcane harvester experiment platform [34], shown in Figure 15. The experiment platform incorporates two simulated sugarcane field exciters (SSFE), which generate sugarcane field excitation via sugarcane field roughness signals and engine excitation through a drive engine. Given that sugarcane harvesters often perform cutting and transporting simultaneously during actual operation, the optimal parameter combination identified under cutting conditions—where the cutting disk’s axial vibration displacement is minimized—was selected for testing. Specifically, the SSFE input frequency is 22 Hz, the drive engine input frequency is 22 Hz, and the cutting disk rotational speed is 700 rpm.
Ablation studies on the Improve-YOLOv5s algorithm comprised four groups. Based on the experimental results, two representative image sets were selected for algorithm improvement effectiveness analysis, shown in Figure 16. The first set contains low-light images with darkened scenes. The second set contains well-lit images featuring higher sugarcane stalk volumes during feeding, both containing sugarcane leaves. In Group (a), the first image type shows insufficient brightness causing two stalks to be misidentified as one thicker sugarcane stalk with low confidence (0.48). In the second image type, high stalk density combined with overlapping leaves and stalks causes missed detections. In Group (b), CLAHE algorithm introduction enhances brightness in first-category images, improving detection confidence and enabling normal sugarcane identification. However, the detection model mislabels sugarcane leaves as stalks, producing false positives. Since second-category images had sufficient lighting, CLAHE-enhanced and original models show minimal differences. In Group (c), both CLAHE and CBAM mechanisms are introduced. Both image categories achieve correct sugarcane detection with high confidence and no misses or false positives. In Group (d), the Group (c) detection model incorporates improved localization loss, yielding our final sugarcane detection model. Comparing Group (d) with (c) images reveals more precise sugarcane bounding box localization without partial containment issues.
Figure 17 presents the loss function curve before and after improvement, while Figure 18 displays the precision and recall curves (P–R curves) of the sugarcane target detection model before and after improvement.
As shown in Figure 17 and Figure 18, under identical pretraining experiments with the same training set, the Improve-YOLOv5s model demonstrates superior convergence behavior and stability while achieving higher AP values. The incorporation of the CLAHE algorithm and attention mechanism substantially enhances the model’s sugarcane detection performance, effectively improving recognition accuracy across diverse environments. Compared to the original YOLOv5s model, it reduces the false negative rate and increases reliability.

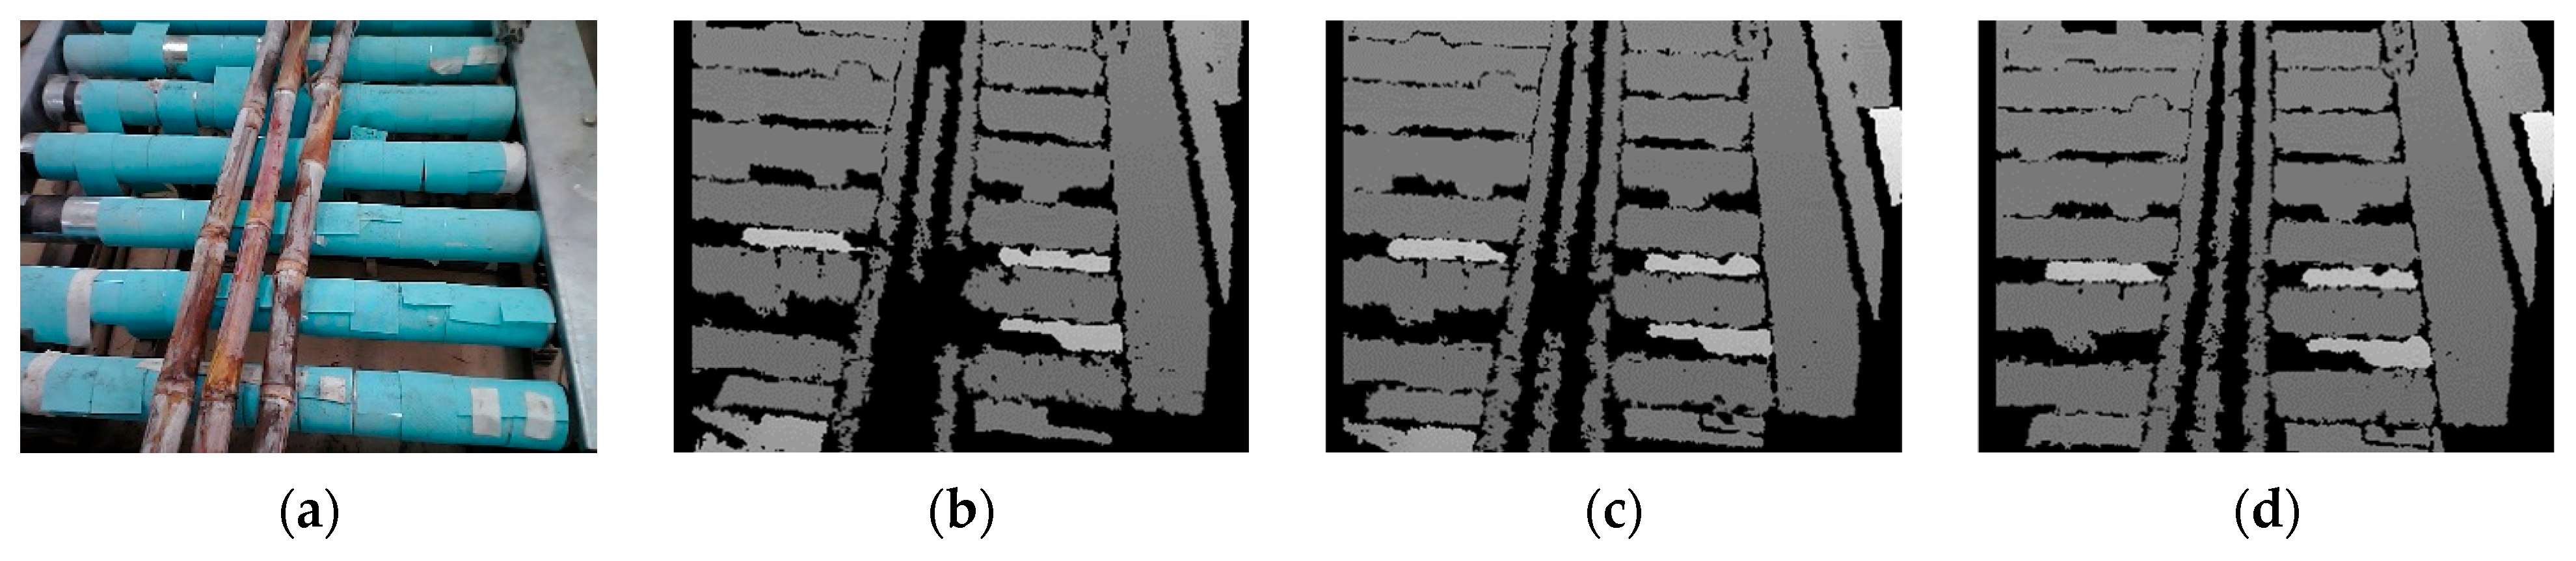
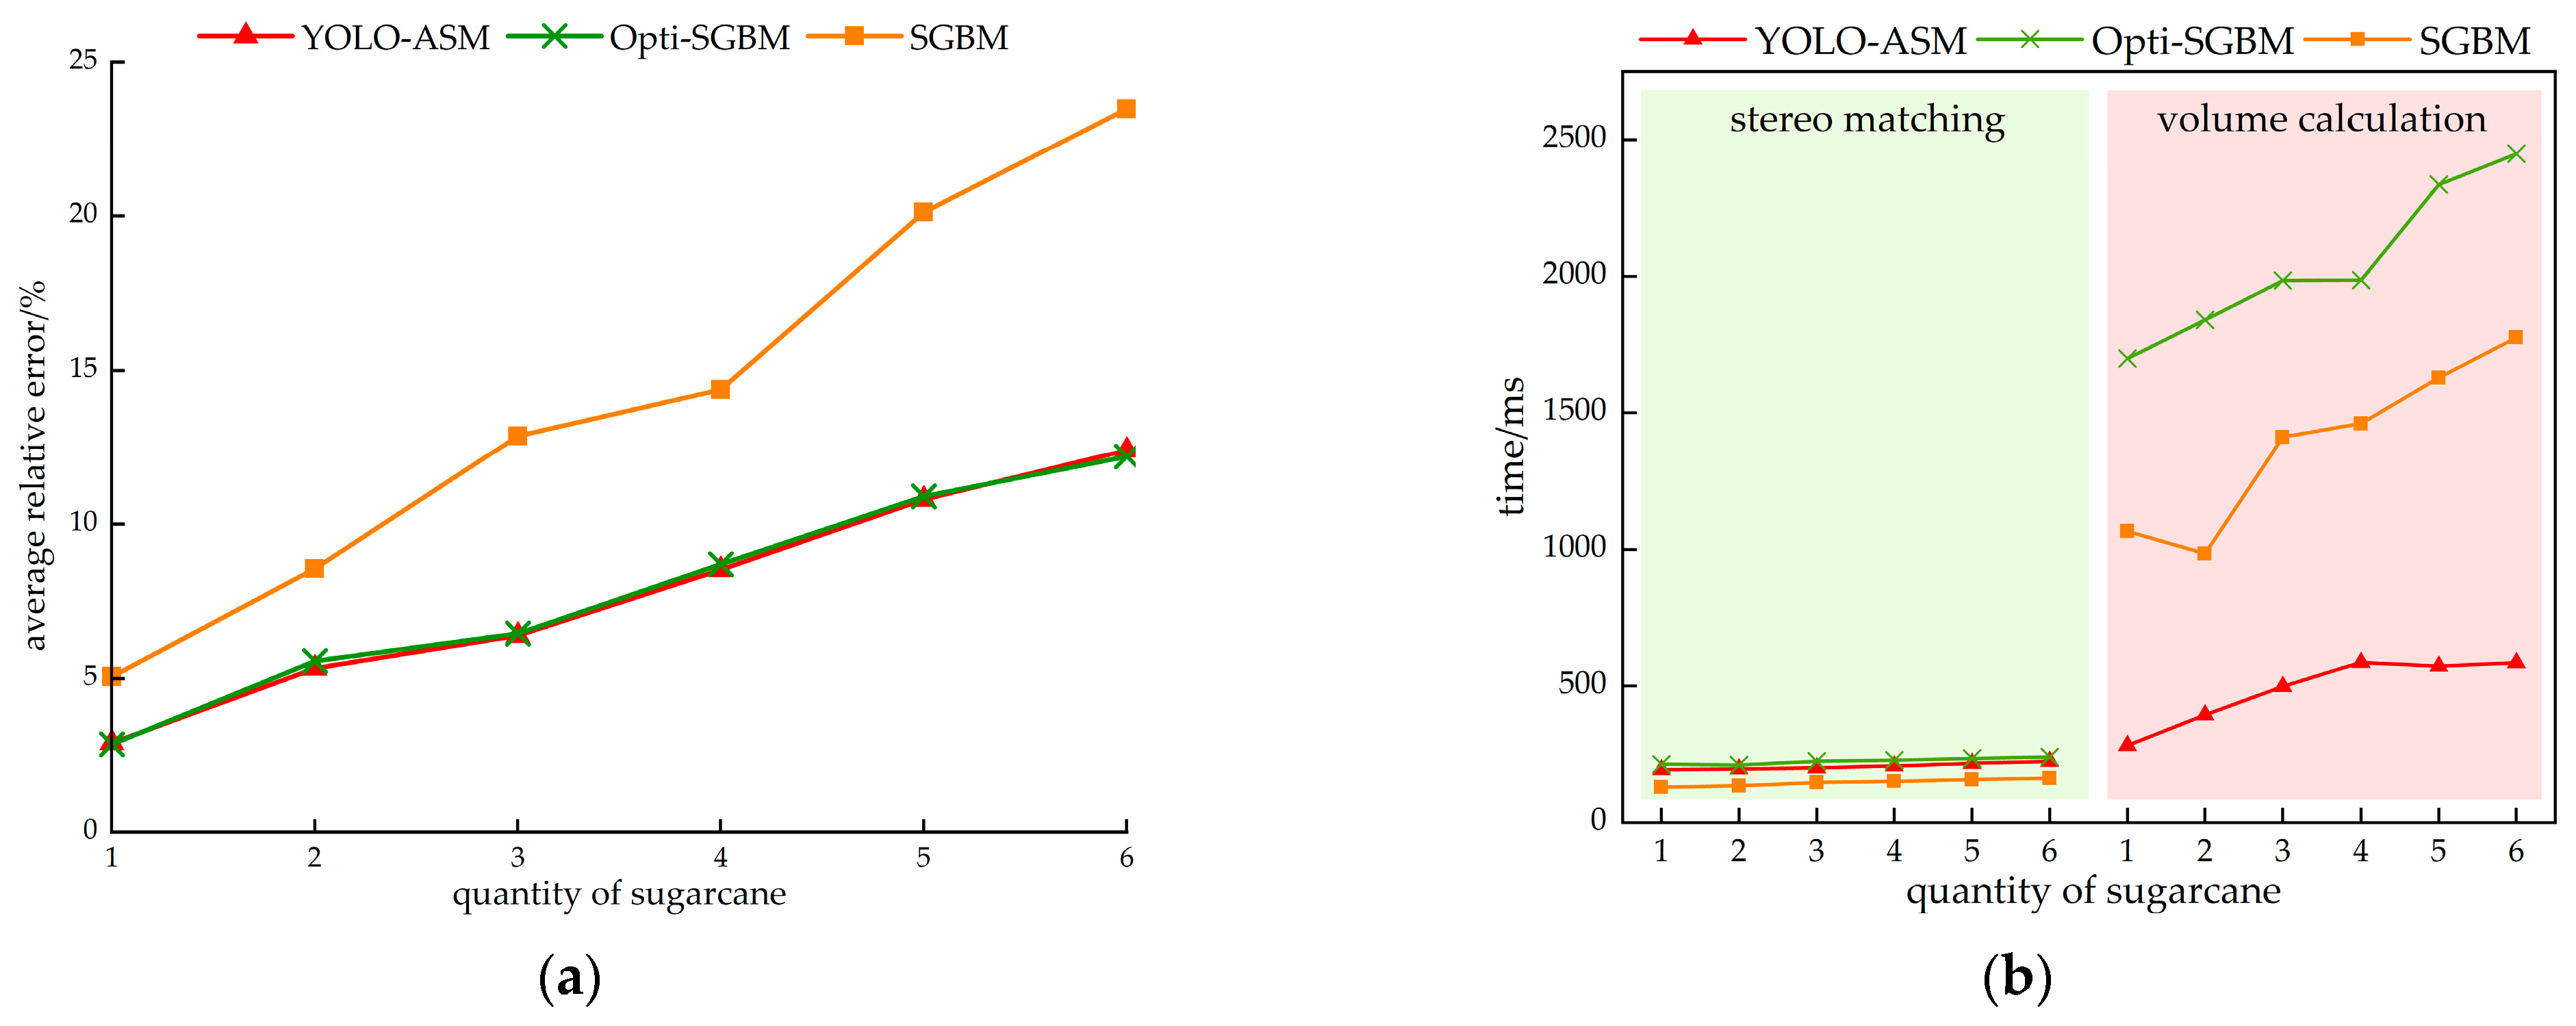
3.2. SGBM Algorithm Comparison Results

To validate Opti-SGBM algorithm superiority, comparisons were made against the BM algorithm [35] and SGBM algorithm. Authenticity was ensured through algorithm effectiveness tests on the laboratory-designed sugarcane harvester anti-stacking device. Two sugarcane image sets were analyzed, categorized by stacking presence as shown in Figure 19 and Figure 20.
As shown in Figure 19 and Figure 20, the depth map generated by the Opti-SGBM algorithm is superior to those produced by the BM and SGBM algorithms. When comparing matched depth maps of non-overlapping sugarcane, the BM algorithm exhibits significant voids where sugarcane plants are closely adjacent, as indicated by dark areas in Figure 19a. The SGBM algorithm outperforms the BM algorithm in this aspect, with gaps confined to areas of close sugarcane proximity while generally preserving visible contours. After algorithmic improvement, Figure 19d shows clear sugarcane contours with smooth edges, enabling clear differentiation of same-diameter sugarcane and demonstrating overall superiority over the other two algorithms. For stacked sugarcane, both SGBM and BM algorithms fail to capture the overall sugarcane outline in stacked regions particularly evident in the bottom areas of Figure 20b,c. Depth information is largely unavailable and inter-plant edges indistinguishable. Conversely, the Opti-SGBM algorithm provides clear distinguishable contours and extractable depth information in identical stacked regions. This comparative analysis confirms that the dual cost fusion Opti-SGBM algorithm outperforms the original algorithms regardless of the stacking state, with significantly enhanced edge distinction capability in stacked scenarios.

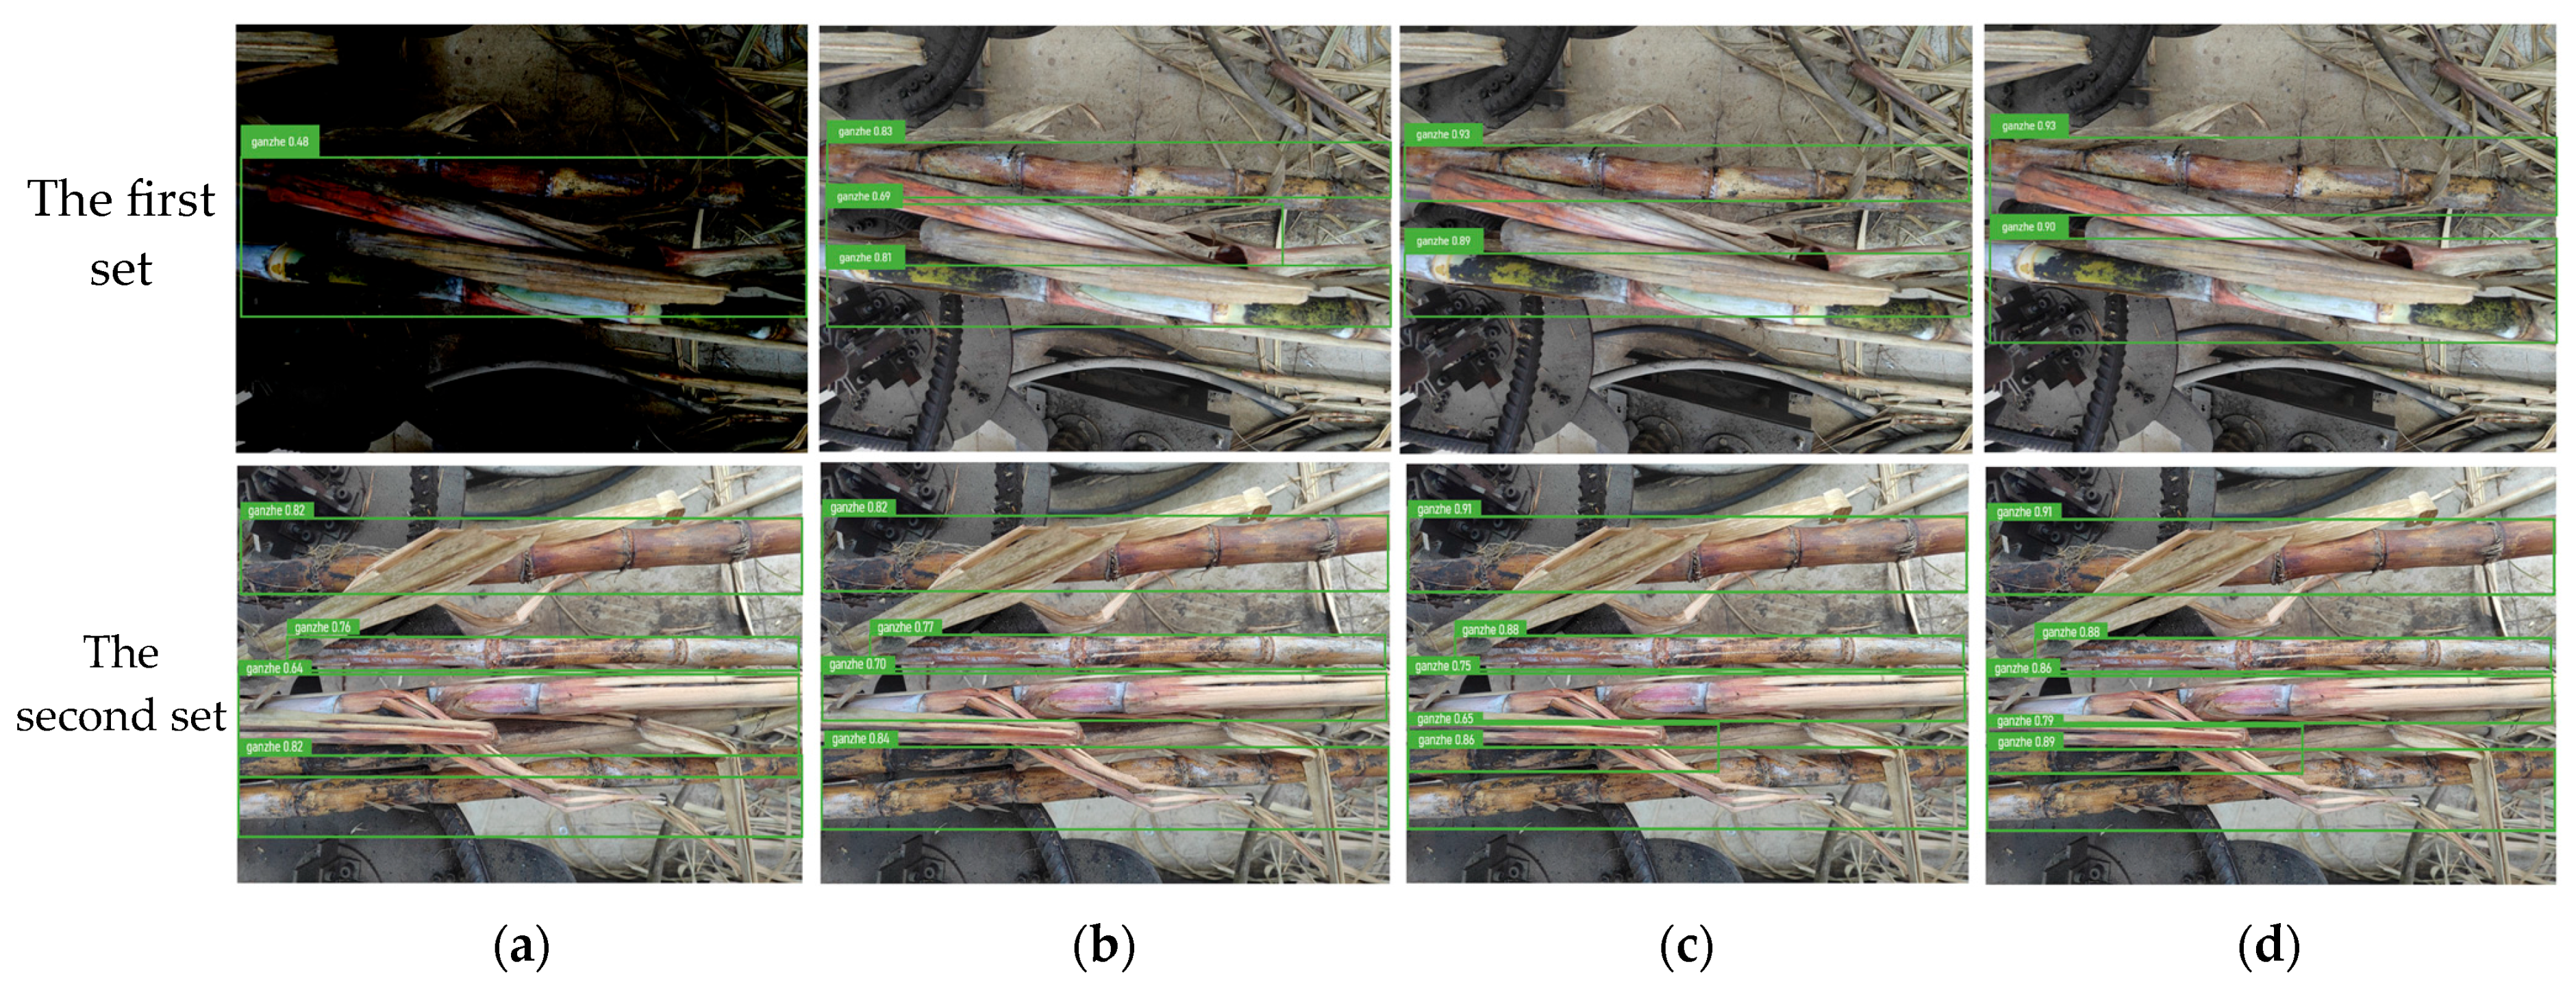
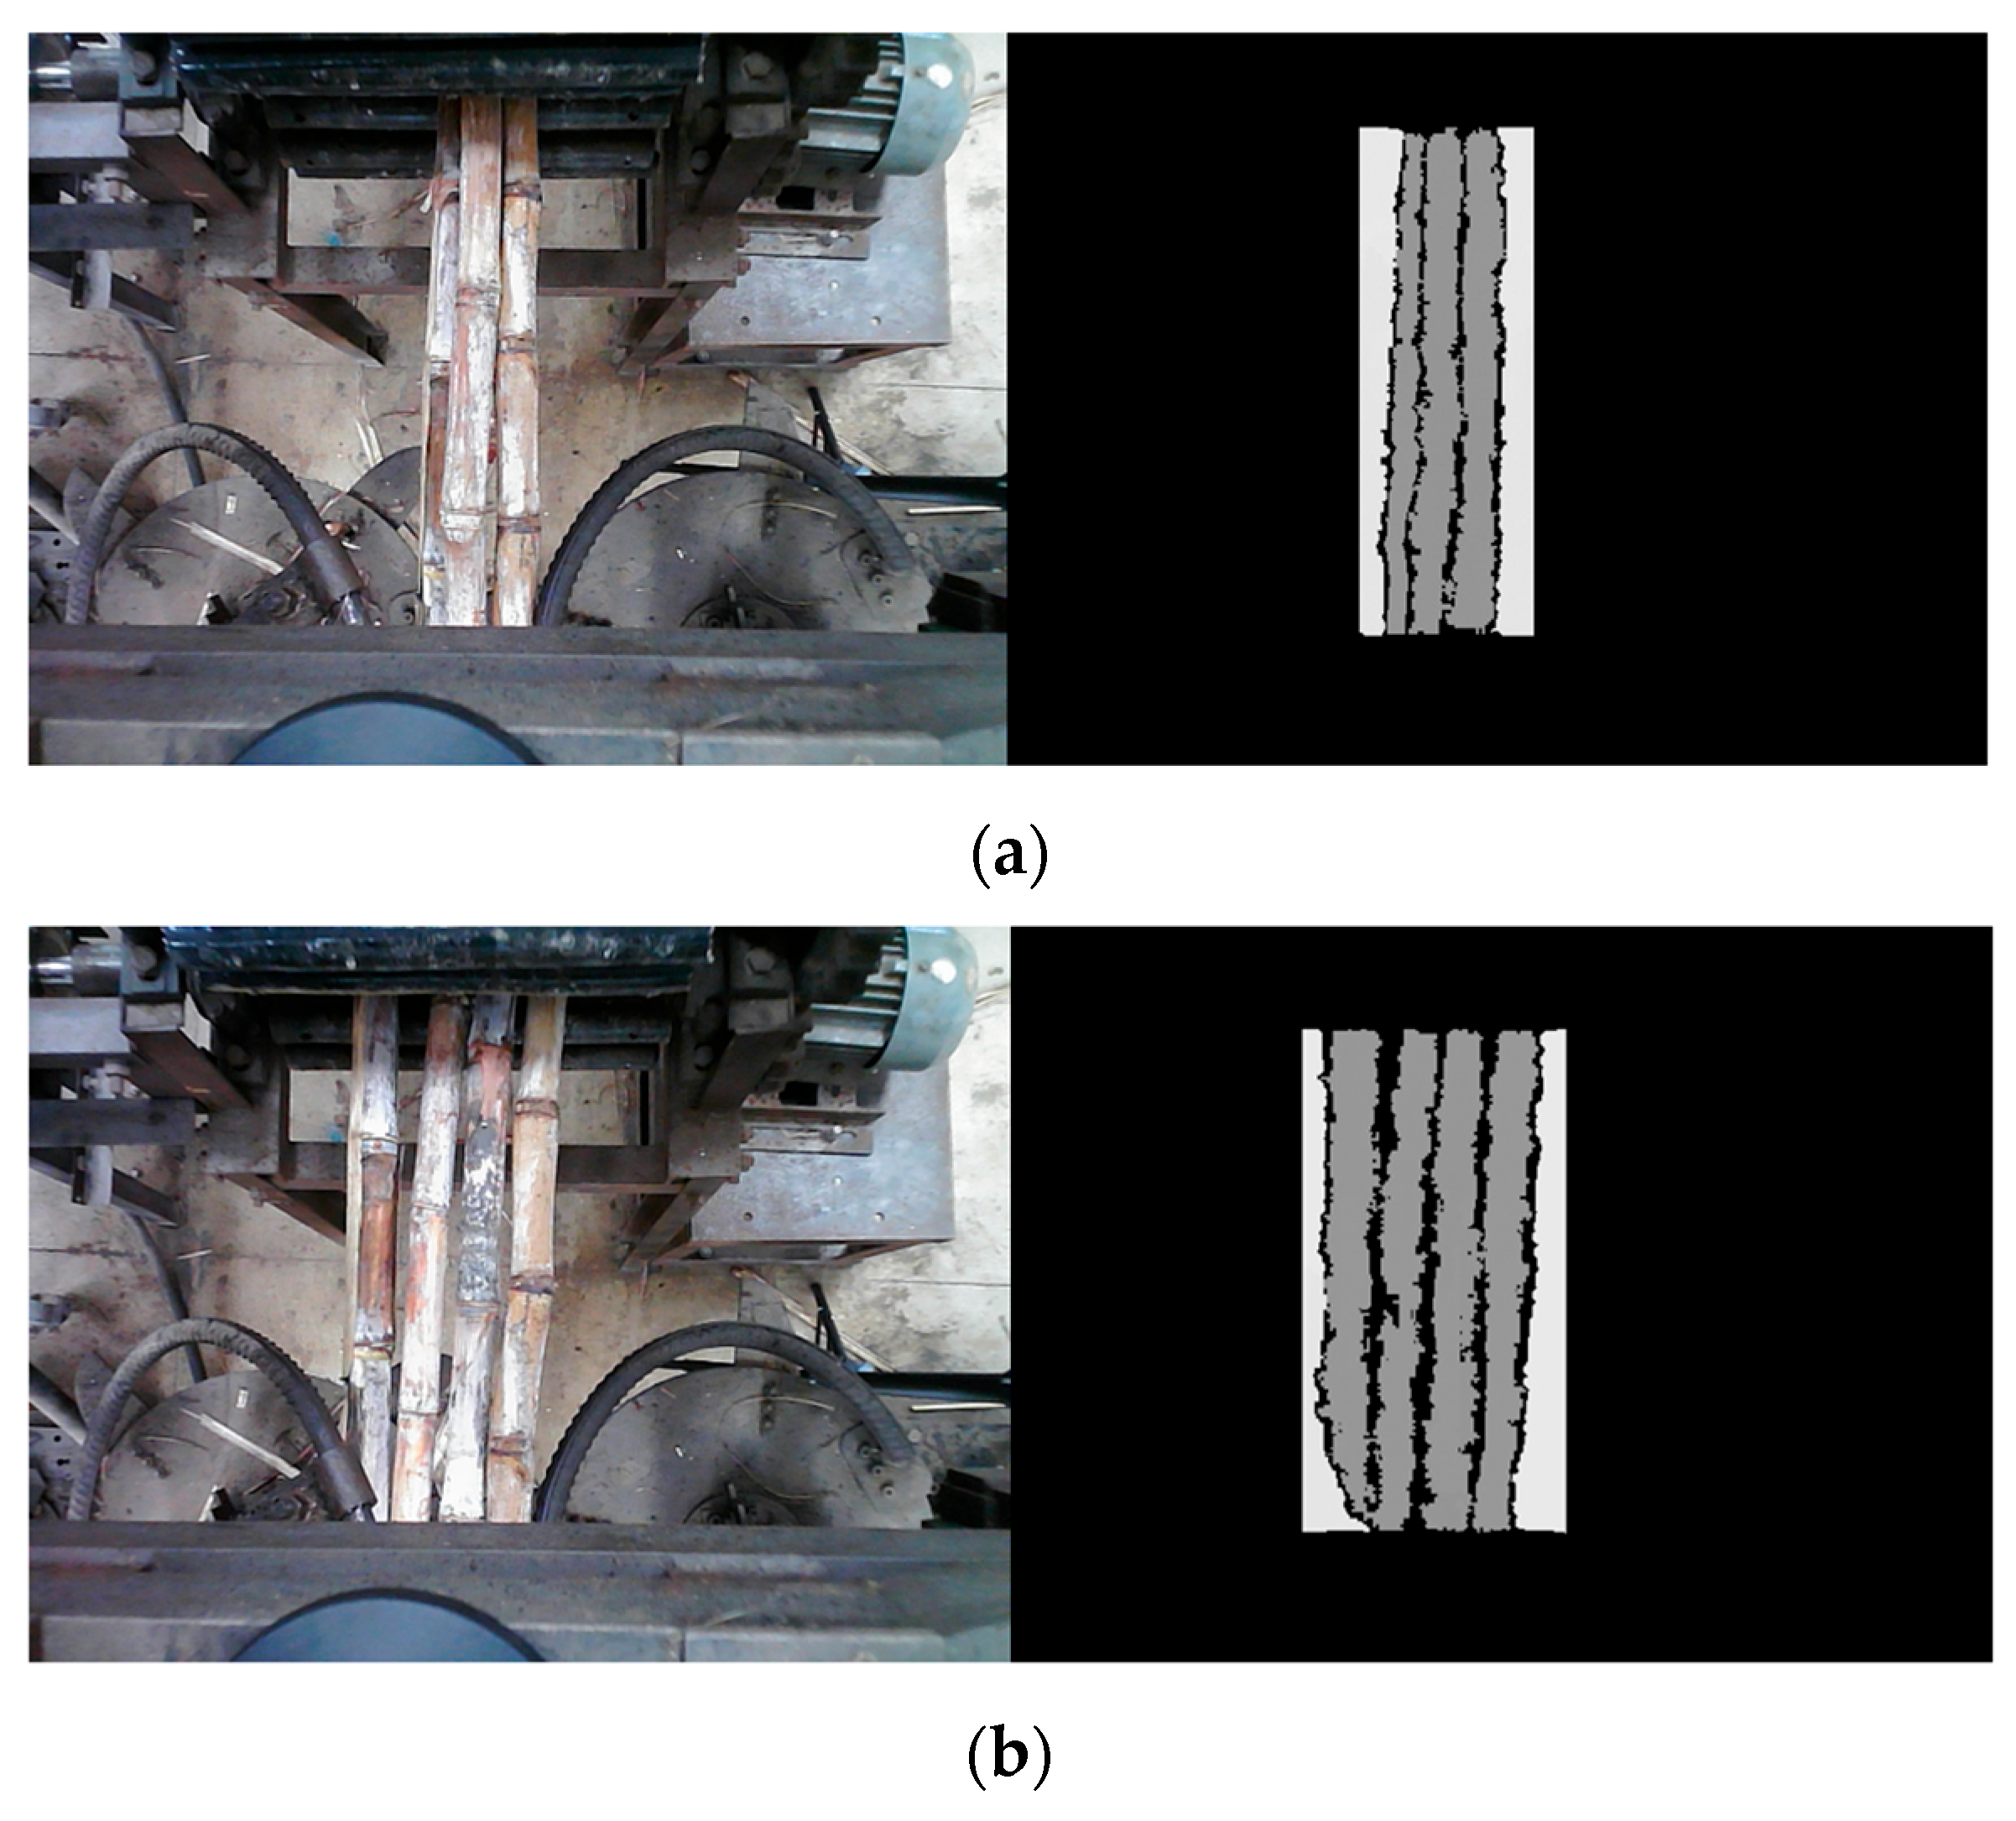
3.3. Sugarcane Feed Volume Calculation with YOLO-ASM Algorithm

Design experiments validate the effectiveness, accuracy, and speed of the sugarcane feed volume recognition method, comparing SGBM, Opti-SGBM, and YOLO-ASM algorithms. During testing, sugarcane was vertically positioned at the clamping device center, with each device accommodating up to six stalks. Random placement of varying stalk quantities simulated natural field growth patterns. Chain-driven tracks moved sugarcane toward cutting disks, replicating harvester operation. Post-cutting, a hydraulic system lifted stalks to conveyor feeding rollers. Within the conveyor system, function-specific rollers transported sugarcane backward for leaf stripping and final stalk output. This experiment specifically predicts sugarcane volume between components 5 and 6 in Figure 15 during feeding conveyance, with stereo camera placement shown in Figure 21.
Among these, the stereo camera model number is PXYZ-D415 (Pixel XYZ, Wuhan, China), and the image sensor model number is JX-H65. It outputs video at a resolution of 2560 × 720 pixels and depth maps at a resolution of 1280 × 720 pixels. The pixel size is 3.75 × 3.75 µm. The lens focal length is 2.2 mm, and the communication interface utilizes the USB3.0 MicroB protocol. It captures depth maps at 30 fps, with a depth map error rate of under 2% within the distance range of 0.5 m to 2 m.
The test indicators were sugarcane volume error and data return time, i.e., the difference between the recognized volume (V1) and the actual measured volume (V0), and the algorithm running time (t) from recognition to volume calculation. Different numbers of sugarcane stalks were selected as test variables, and six single-factor tests were designed. The feed volume of sugarcane was set from one to six pieces to more accurately evaluate the impact of varying feed volumes on the test results. Based on the combination of two factors, which are the sugarcane planting density measured in the field and the maximum capacity of the prototype machine, the experiments were grouped according to the number of stacked sugarcane stalks, ranging from one to six stalks, with each group incrementally increased by one stalk. Simultaneously, actual measurements of the corresponding test sugarcane were taken. These actual measurement values served as the control group, with a total of six groups, each repeated six times. The first three tests in each group were conducted at midday with ample sunlight, while the last three were conducted in the evening under poorer lighting conditions. Other test parameters were as follows: based on relevant parameter settings obtained from the research team’s preliminary tests, the conveyor roller speed was set at 58.8 r/min, and the no-load speeds of the feeding rollers, leaf crushing and stripping rollers, and output rollers in the conveyor system were set at 240 r/min, 870 r/min, and 690 r/min, respectively. During the shooting process, the light source was an unobstructed indoor light source.
According to the spatial layout of the experiment and test requirements, the sugarcane tips were removed to obtain samples with an average length of approximately 2 m. The sugarcane samples used in the test are shown in Figure 22. The length of sugarcane visible from the binocular perspective was measured as 0.5 m; therefore, comparative tests were calculated at 0.5 m intervals. Figure 23 shows the depth map generated by the fusion algorithm in the prototype harvester. Due to factors such as sugarcane leaf interference, stacking phenomena, and obstruction by the prototype cutting system, a positive or negative relative error exists between the recognized sugarcane volume (V1) and the actual volume (V0). To more accurately evaluate the experimental results, all relative errors referenced in this paper are expressed as absolute values and the average value is taken for the same set of tests. The calculation formula is shown in Equation (14).
W t = V 0 V 1 V 0 × 100 %
where Wt is the relative error.
The comparison results between the algorithm-calculated volume and the actual measured volume of sugarcane at different feed volumes, along with the average running time at each stage, are presented in Figure 24. Since Improve-YOLOv5s was solely employed in the YOLO-ASM algorithm and its average running time was below 20 ms, exerting minimal impact on total time consumption, the average time consumption of the target detection stage is omitted from Figure 24b.
To minimize randomness, the same algorithm was tested six times under identical sugarcane root input conditions. During data processing, both error values and volume calculation time were averaged across all six trials. As shown in the charts, regarding volume measurement error for sugarcane detection, the Opti-SGBM and YOLO-ASM algorithms demonstrate consistent performance in volume calculation error. As the number of stacked sugarcanes fed increases, the gaps between stacked stalks and the degree of obstruction increase, causing a gradual rise in calculation error. Similarly, the volume calculation error of this algorithm also increases with higher sugarcane feed volumes.
Combined with Figure 24a, it is observed that as sugarcane feed volume increases, the difference in relative volume error between the YOLO-ASM algorithm and the original SGBM algorithm progressively widens. Based on relative volume error results, the experiment demonstrates that the YOLO-ASM algorithm significantly improves sugarcane feed volume calculation accuracy and exhibits superior performance in complex multi-stalk scenarios, with more substantial accuracy enhancement.
As shown in Figure 24b, during stereo matching, YOLO-ASM and Opti-SGBM exhibit similar average runtimes when using identical algorithms. However, the improved algorithm’s increased computational load results in relatively higher time consumption compared to the SGBM algorithm. During volume calculation, both Opti-SGBM and SGBM algorithms construct cross-sections using full-depth-map information, subsequently remove cross-section data beyond the target region’s height and width ranges, and finally perform volume calculation—a process consuming significantly more time. Among these, Opti-SGBM requires longer calculation time than SGBM due to the acquiring of more precise depth information. The YOLO-ASM algorithm demonstrates the shortest runtime by constructing cross-sections and calculating volumes exclusively using depth information within sugarcane prediction boxes. At identical feed volumes of one to six, YOLO-ASM achieves total calculation speeds 146%, 86%, 120%, 100%, 102%, and 118% faster than SGBM, respectively. As shown in Figure 24a, while the Opti-SGBM algorithm significantly improves accuracy, its reduced processing speed indirectly demonstrates fusion algorithms’ necessity.
To investigate the impact of different light intensities on depth map quality and volume calculations, this paper selected experimental data from the YOLO-ASM algorithm for analysis. The average relative errors of the first three and last three sugarcane volume measurements in each group are summarized in Table 3.
As shown in Table 3, under sufficient lighting conditions, the fusion algorithm achieves better volume detection performance across different feed volumes compared to slightly poorer lighting conditions. Specifically, at feed volumes of one to six stalks, the data indicate that lighting effects on volume error are less significant than algorithmic effects when lighting is sufficient versus when slightly weaker.
As shown in Figure 24a and Table 3, the volume error increases with sugarcane stalk count. Analysis attributes this error growth to the two following factors.
Stalk gaps: During experiments, gaps between stacked sugarcane occupy space within the conveying system during actual operation. These gaps are incorporated as part of stacked sugarcane in volume calculations. However, the actual measured volume represents the sum of individual stalk volumes. Consequently, higher stalk counts yield greater volume error rates when comparing experimental results with measured values.
Sugarcane leaf obstruction: As stalk quantities increase, mutual obstruction occurs where leaves from different stalks occlude stems. This leads to inaccurate depth coordinates after identification and introduced errors.
Based on these experiments, the YOLO-ASM algorithm not only excels in sugarcane volume detection but also improves algorithmic running speed by approximately 100% through structural and computational process optimization.

4. Discussion

Research results demonstrate that YOLO-ASM achieves promising outcomes in the intended direction while retaining potential for further optimization. The volume calculation model proposed in this study assumes cylindrical sugarcane stalks, limiting its applicability for non-cylindrical, damaged, or irregularly shaped sugarcane. Since the stereo camera captures sugarcane images solely from a fixed position, it may fail to accurately compute volumes for unobserved regions when encountering abnormally shaped specimens. Additionally, severe sugarcane damage may cause depth map discontinuities, whereas irregular shapes like protruding nodes may prompt the stereo matching algorithm to misclassify textureless or damaged areas as background noise, ultimately reducing volume calculation accuracy. Therefore, future research will focus on 1. enhancing the volume calculation model to accommodate abnormally shaped sugarcane and 2. further optimizing the stereo matching algorithm to improve recognition rates for severely damaged sugarcane.
Another limitation involves restricted application scenario diversity. The current YOLO-ASM model addresses solely sugarcane harvester vibrations in sugarcane fields and basic lighting variations, without accommodating dust, rain, or fog conditions occurring during actual harvesting operations. Therefore, supplementary datasets are required to optimize the algorithm for broader field environments.
These limitations constrain machine vision applications in sugarcane harvesters, and we will prioritize them in future research.

5. Conclusions

To address issues including missed detections, incomplete detections, and low reliability in sugarcane stacking scenarios, this paper improves upon the YOLOv5s object detection model. It integrates the CBAM mechanism into the backbone module while incorporating the CLAHE algorithm and EIOU loss function into the image preprocessing and YOLO output stages, respectively, thereby establishing the Improve-YOLOv5s detection model. Experiments demonstrate that this model achieves an average accuracy improvement of 5.31% and a detection speed enhancement of 28.04% compared to the original YOLOv5s model.
To address reduced depth map accuracy caused by the SGBM algorithm’s limited capability in handling stacking and leaf occlusion issues within multi-stalk sugarcane transport mechanisms, improvements were implemented in the SGBM algorithm’s cost calculation and cost aggregation methods. This led to the proposal of the dual cost fusion-based Opti-SGBM algorithm. Comparative tests with the BM algorithm and SGBM algorithm demonstrate that the dual cost fusion Opti-SGBM algorithm outperforms the original algorithms regardless of sugarcane stacking status, with enhanced edge differentiation capability for stacked sugarcane being particularly prominent.
By fusing Improve-YOLOv5s with the Opti-SGBM algorithm to establish the novel YOLO-ASM algorithm, precise stereoscopic matching of sugarcane is achieved, enhancing overall algorithmic operational efficiency. To address diverse sugarcane states during feeding and its cylindrical structure, this paper further develops a comprehensive volume calculation scheme applicable to varied scenarios, ensuring accurate sugarcane volume measurement. Through prototype sugarcane harvester experiments, the efficiency and accuracy of the YOLO-ASM algorithm were validated. Compared to the original 3D matching algorithm, the average volume error rates for one to six fed sugarcane stalks decreased by 3.45%, 3.23%, 6.48%, 5.86%, 9.32%, and 11.09%, respectively, while sugarcane feed volume detection speed improved by approximately 100%.

Author Contributions

Conceptualization, X.L. and G.F.; methodology, G.F.; software, G.F.; validation, X.L. and G.F.; formal analysis, X.L.; investigation, G.F.; resources, X.L.; data curation, X.L.; writing—original draft preparation, G.F.; writing—review and editing, G.F.; visualization, X.L.; supervision, X.L.; project administration, G.F.; funding acquisition, X.L. All authors have read and agreed to the published version of the manuscript.

Funding

This research was funded by the Natural Science Foundation of Guangxi (Grant No. 2022GXNSFAA035549).

Institutional Review Board Statement

Not applicable.

Data Availability Statement

The data presented in this study are available on request from the corresponding author.

Conflicts of Interest

The authors declare no conflicts of interest.

References

  1. Xie, L.; Wang, J.; Cheng, S.; Zeng, B.; Yang, Z. Optimisation and dynamic simulation of a conveying and top breaking system for whole-stalk sugarcane harvesters. Biosyst. Eng. 2020, 197, 156–169. [Google Scholar] [CrossRef]
  2. Zhou, B.; Ma, S.; Li, W.; Qian, J.; Li, W.; Yang, S. Design and experiment of monitoring system for feed rate on sugarcane chopper harvester. Comput. Electron. Agric. 2025, 228, 109695. [Google Scholar] [CrossRef]
  3. Ding, Z.; Ma, S.; Zhang, X.; Liang, W.; Li, L.; Su, C. Ultrasonic Sensor-Based Basecutter Height Control System of Sugarcane Harvester. Sugar Tech 2022, 25, 453–459. [Google Scholar] [CrossRef]
  4. Peng, C.; Ma, S.; Zhang, L.; Su, C.; Li, W. Sugarcane feeding quantity detection based on depth learning. In Proceedings of the 2023 ASABE Annual International Meeting, Omaha, NB, USA, 9–12 July 2023; American Society of Agricultural and Biological Engineers: St. Joseph, MI, USA, 2023. [Google Scholar]
  5. Zhou, D.; Fan, Y.; Deng, G.; He, F.; Wang, M. A new design of sugarcane seed cutting systems based on machine vision. Comput. Electron. Agric. 2020, 175, 105611. [Google Scholar] [CrossRef]
  6. Maldaner, L.F.; Molin, J.P. Data processing within rows for sugarcane yield mapping. Sci. Agric. 2019, 77, e20180391. [Google Scholar] [CrossRef]
  7. Liang, K.; Feng, Y.; Yao, B.; Chen, H.; Pan, M.; Tang, Y.; Guan, W. A power matching control strategy for sugarcane combine harvesters. Appl. Eng. Agric. 2023, 39, 439–448. [Google Scholar] [CrossRef]
  8. Ma, J.; Ma, S.; Wang, F.; Xing, H.; Bai, J.; Ke, W.; Gao, S. Experimental Research on the Feeding Mechanism of Sugarcane Chopper Harvester. In Proceedings of the 2019 ASABE Annual International Meeting, Boston, MA, USA, 7–10 July 2019; American Society of Agricultural and Biological Engineers: St. Joseph, MI, USA, 2019. [Google Scholar]
  9. Metkar, A.R.; Valsalam, S.R.; Sivakumaran, N. A Novel Control Scheme Design and Implementation of Cane feeding System in Sugar Plant. IFAC-PapersOnLine 2018, 51, 389–394. [Google Scholar] [CrossRef]
  10. Price, R.R.; Johnson, R.M.; Viator, R.P.; Larsen, J.; Peters, A. Fiber optic yield monitor for a sugarcane harvester. Trans. ASABE 2011, 54, 31–39. [Google Scholar] [CrossRef]
  11. Lai, X.; Qin, Z.; Yang, P.; Shen, Z. Small Sugarcane Harvester Conveying Failure Analysis. In Proceedings of the 2018 3rd International Conference on Electrical, Automation and Mechanical Engineering (EAME 2018), Xi’an, China, 24–25 June 2018; Atlantis Press: Dordrecht, The Netherlands, 2018. [Google Scholar]
  12. Price, R.R.; Johnson, R.M.; Viator, R.P. An overhead optical yield monitor for a sugarcane harvester based on two optical distance sensors mounted above the loading elevator. Appl. Eng. Agric. 2017, 33, 687–693. [Google Scholar] [CrossRef]
  13. Xu, J.-X.; Ma, J.; Tang, Y.-N.; Wu, W.-X.; Shao, J.-H.; Wu, W.-B.; Wei, S.-Y.; Liu, Y.-F.; Wang, Y.-C.; Guo, H.-Q. Estimation of sugarcane yield using a machine learning approach based on uav-lidar data. Remote Sens. 2020, 12, 2823. [Google Scholar] [CrossRef]
  14. Vargas, C.M.; Heenkenda, M.K.; Romero, K.F. Estimating the aboveground fresh weight of sugarcane using multispectral images and light detection and ranging (LIDAR). Land 2024, 13, 611. [Google Scholar] [CrossRef]
  15. Wang, Z.; Heinemann, P.H.; Walker, P.N.; Heuser, C. Automated micropropagated sugarcane shoot separation by machine vision. Trans. ASAE 1999, 42, 247–254. [Google Scholar] [CrossRef]
  16. Schaufler, D.H.; Walker, P.N. Micropropagated sugarcane shoot identification using machine vision. Trans. ASAE 1995, 38, 1919–1925. [Google Scholar] [CrossRef]
  17. Rees, S.J.; McCarthy, C.L.; Baillie, C.P.; Burgos-Artizzu, X.P.; Dunn, M.T. Development and evaluation of a prototype precision spot spray system using image analysis to target Guinea Grass in sugarcane. Aust. J. Multi-Discip. Eng. 2011, 8, 97–106. [Google Scholar] [CrossRef]
  18. Kai, P.M.; de Oliveira, B.M.; da Costa, R.M. Deep learning-based method for classification of sugarcane varieties. Agronomy 2022, 12, 2722. [Google Scholar] [CrossRef]
  19. Militante, S.V.; Gerardo, B.D.; Medina, R.P. Sugarcane disease recognition using deep learning. In Proceedings of the 2019 IEEE Eurasia Conference on IOT, Communication and Engineering (ECICE), Yunlin, Taiwan, 3–6 October 2019; IEEE: New York, NY, USA, 2019. [Google Scholar]
  20. Yu, K.; Tang, G.; Chen, W.; Hu, S.; Li, Y.; Gong, H. MobileNet-YOLO v5s: An improved lightweight method for real-time detection of sugarcane stem nodes in complex natural environments. IEEE Access 2023, 11, 104070–104083. [Google Scholar] [CrossRef]
  21. Kumpala, I.; Wichapha, N.; Prasomsab, P. Sugar cane red stripe disease detection using YOLO CNN of deep learning technique. Eng. Access 2022, 8, 192–197. [Google Scholar]
  22. Simard, P.Y.; Steinkraus, D.; Platt, J.C. Best practices for convolutional neural networks applied to visual document analysis. In Proceedings of the 7th International Conference on Document Analysis and Recognition (ICDAR 2003), Edinburgh, UK, 3–6 August 2003; Volume 3. No. 2003. [Google Scholar]
  23. Saran, N.A.; Saran, M.; Nar, F. Distribution-preserving data augmentation. PeerJ Comput. Sci. 2021, 7, e571. [Google Scholar] [CrossRef]
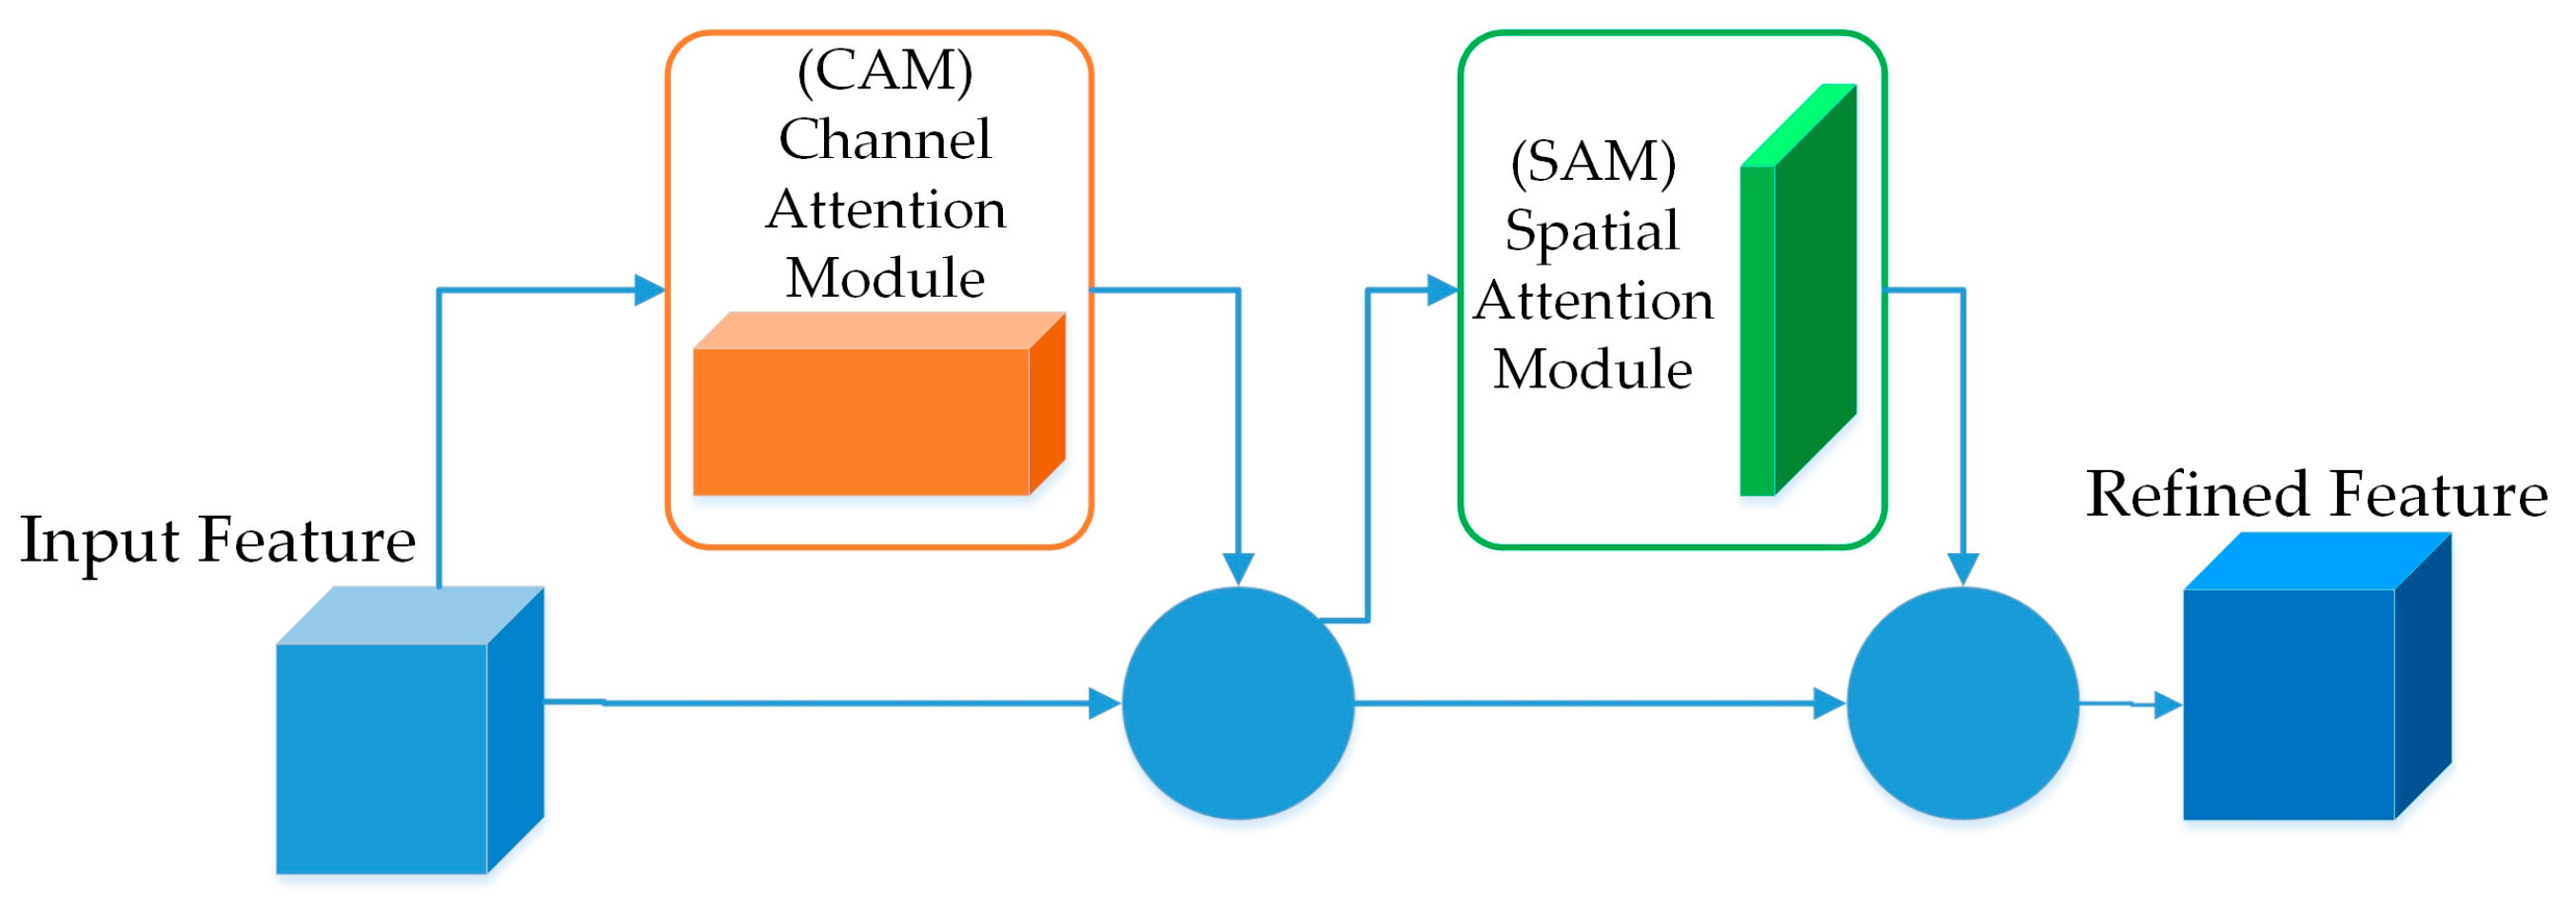
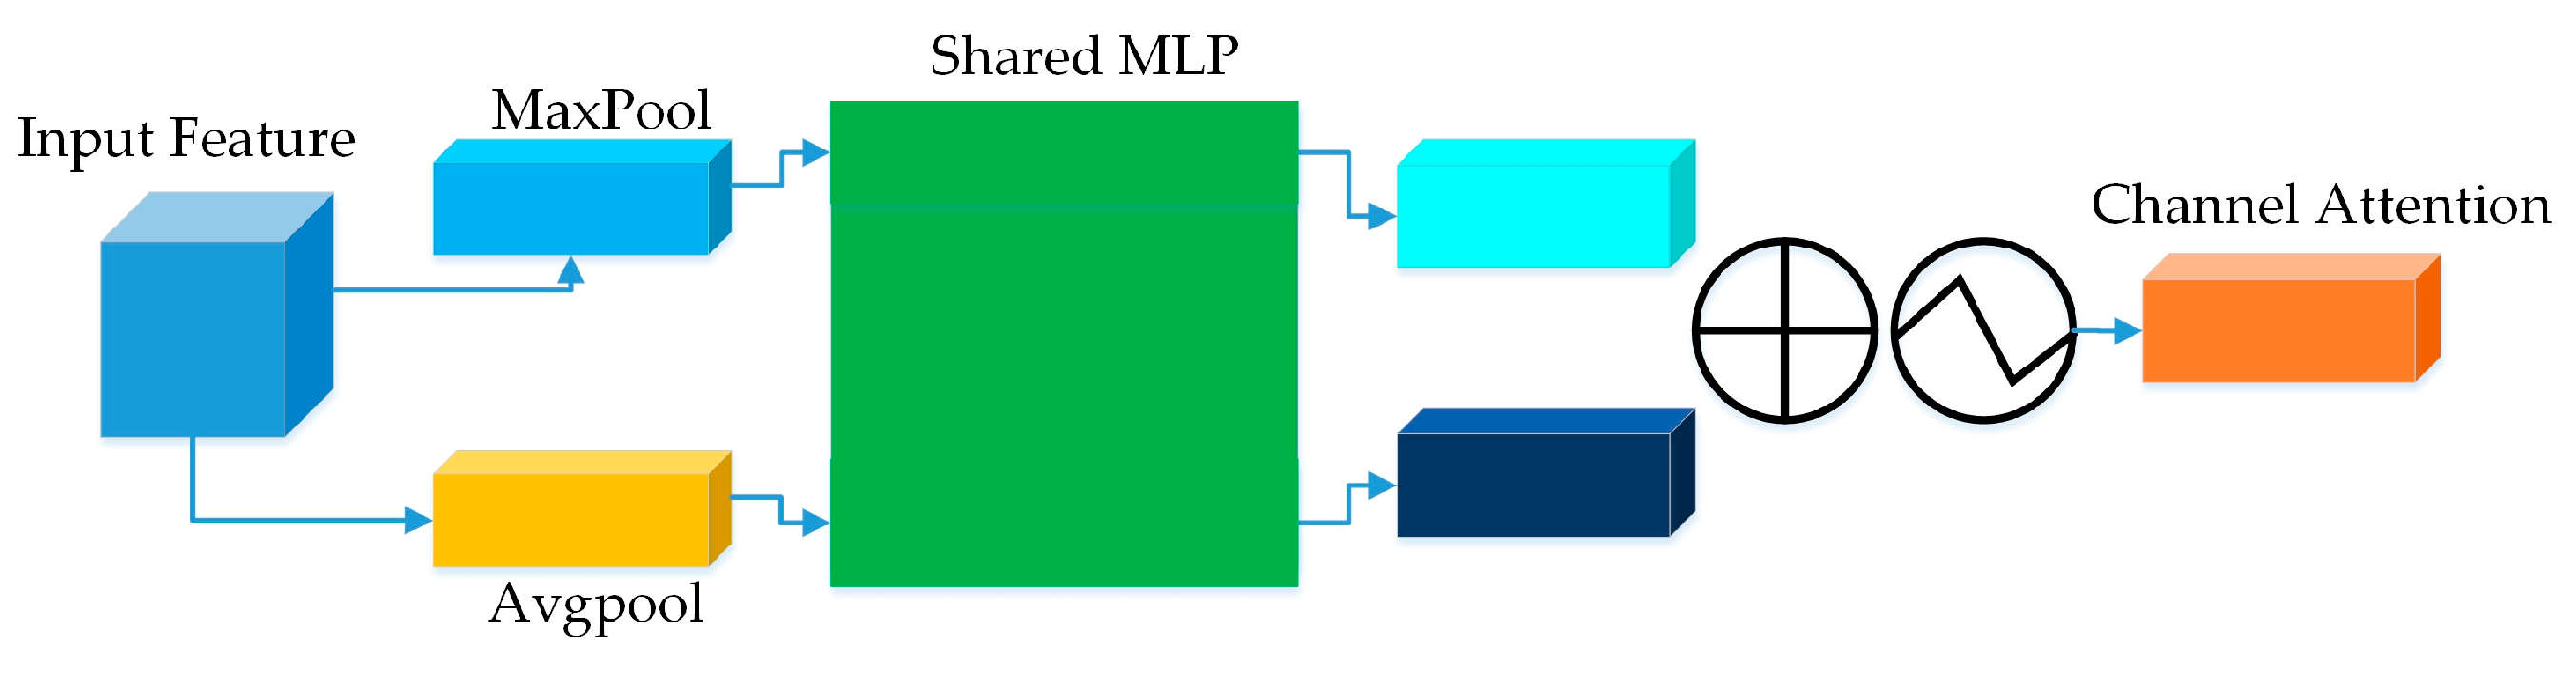
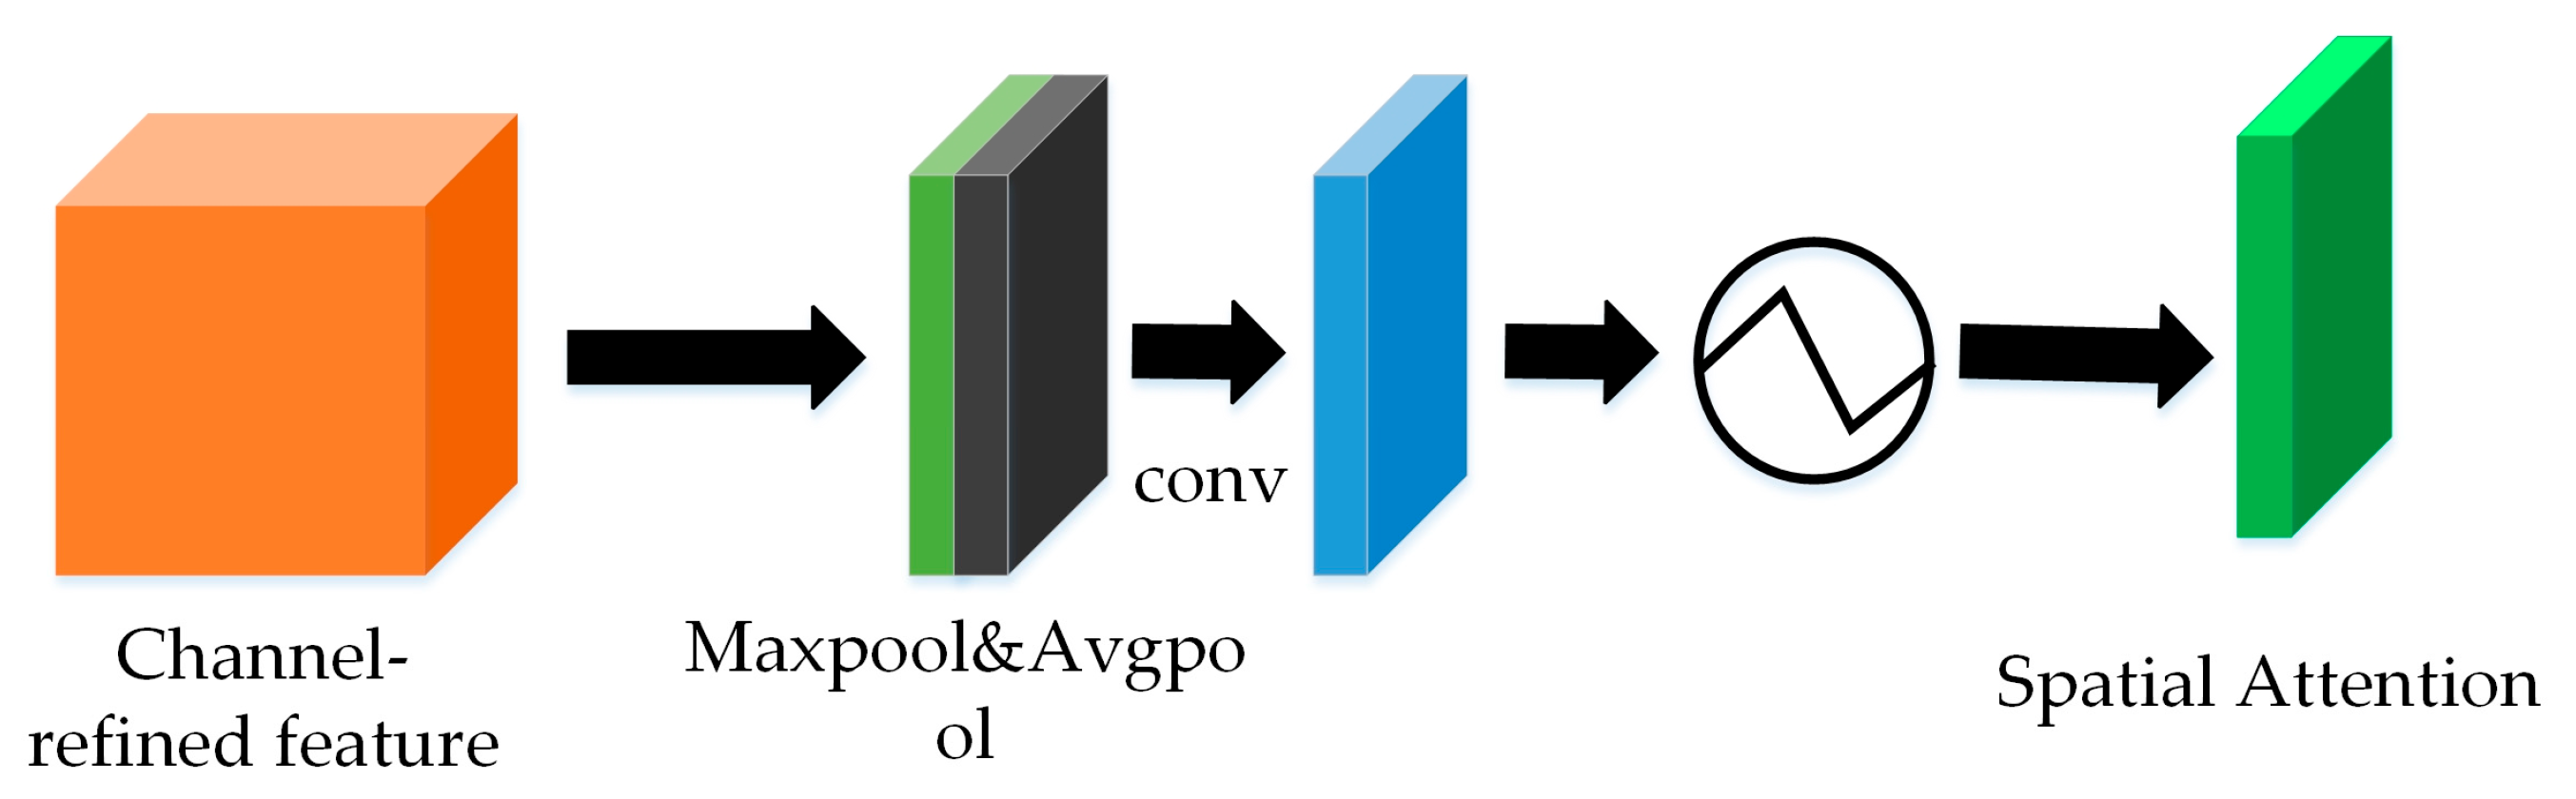
  24. Woo, S.; Park, J.; Lee, J.-Y.; Kweon, I.S. Cbam: Convolutional block attention module. In Lecture Notes in Computer Science, Proceedings of the European Conference on Computer Vision (ECCV), Munich, Germany, 8–14 September 2018; Springer: Berlin/Heidelberg, Germany, 2018. [Google Scholar]
  25. Liu, Y.; Lu, B.; Peng, J.; Zhang, Z. Research on the use of YOLOv5 object detection algorithm in mask wearing recognition. World Sci. Res. J. 2020, 6, 276–284. [Google Scholar]
  26. Lee, J.; Hwang, K. YOLO with adaptive frame control for real-time object detection applications. Multimed. Tools Appl. 2022, 81, 36375–36396. [Google Scholar] [CrossRef]
  27. Guo, W.; Zhao, L.; Li, Q.; Zhu, H. Binocular Vision Ranging Based on the SGBM Algorithm. In Proceedings of the 2024 4th International Conference on Electronic Information Engineering and Computer Science (EIECS), Yanji, China, 27–29 September 2024; IEEE: New York, NY, USA, 2024. [Google Scholar]
  28. Zhang, J.; Han, F.; Han, D.; Su, Z.; Li, H.; Zhao, W.; Yang, J. Object measurement in real underwater environments using improved stereo matching with semantic segmentation. Measurement 2023, 218, 113147. [Google Scholar] [CrossRef]
  29. Zabih, R.; Woodfill, J. Non-parametric local transforms for computing visual correspondence. In Computer Vision—ECCV’94, Proceedings of the Third European Conference on Computer Vision Stockholm, Stockholm, Sweden, 2–6 May 1994; Springer: Berlin/Heidelberg, Germany, 1994; Volume II. [Google Scholar]
  30. Rathnayaka, P.; Park, S.-Y. IGG-MBS: Iterative guided-Gaussian multi-baseline stereo matching. IEEE Access 2020, 8, 99205–99218. [Google Scholar] [CrossRef]
  31. Dawood, W.M.; Alghargan, N.Y.A. Response of Sugarcane Saccharum officinarum L. Varieties to Seedling Technique. Plant Arch. 2020, 20, 2871–2879. [Google Scholar]
  32. Alam, M.N.; Nath, U.K.; Karim, K.M.R.; Ahmed, M.M.; Mitul, R.Y. Genetic variability of exotic sugarcane genotypes. Scientifica 2017, 1, 5202913. [Google Scholar] [CrossRef] [PubMed]
  33. Zhou, M. Family evaluation for sugarcane yield using data estimated from stalk number, height, and diameter. J. Crop Improv. 2014, 28, 406–417. [Google Scholar] [CrossRef]
  34. Mo, H.; Ma, S.; Huang, Z.; Li, S.; Qiu, C. Factors influencing axial no-load cutter vibration of sugarcane harvesters. Sugar Tech 2024, 26, 668–682. [Google Scholar] [CrossRef]
  35. Boyer, R.S.; Moore, J.S. A fast string searching algorithm. Commun. ACM 1977, 20, 762–772. [Google Scholar] [CrossRef]
Figure 1. Examples of sugarcane: (a) non-stacked; (b) slight stacking; (c) heavy stacking; (d) without sugarcane leaves; (e) normal light; (f) strong light.
Agriculture 15 01428 g001
Figure 2. Schematic of the feed detection area: 1. Feeding rollers of the conveyor system; 2. Target detection area; 3. Sugarcane cutting cutterhead.
Agriculture 15 01428 g002
Figure 3. Flow chart of sugarcane volume calculation.
Agriculture 15 01428 g003
Figure 4. YOLOv5s network structure.
Agriculture 15 01428 g004
Figure 5. Comparison of CLAHE algorithm processing results: (a) original Image; (b) grayscale Image; (c) CLAHE-processed image.
Agriculture 15 01428 g005
Figure 6. CBAM structure.
Agriculture 15 01428 g006
Figure 7. CAM structure.
Agriculture 15 01428 g007
Figure 8. SAM structure.
Agriculture 15 01428 g008
Figure 9. Improve -YOLOv5s network structure.
Agriculture 15 01428 g009
Figure 10. Target detection output diagram.
Agriculture 15 01428 g010
Figure 11. Schematic of sugarcane stacking.
Agriculture 15 01428 g011
Figure 12. Schematic of binocular vision depth measurement.
Agriculture 15 01428 g012
Figure 13. Schematic of single sugarcane stalk volume calculation: The orange lines in the figure on the right depict the area corresponding to unit length of the cross section.
Agriculture 15 01428 g013
Figure 14. Schematic of three sugarcane stalk volume calculation.
Agriculture 15 01428 g014
Figure 15. Sugarcane harvester prototype: 1. Sugarcane clamping device; 2. Sugarcane; 3. Mobile guide rail; 4. Sugarcane harvester frame; 5. Cutting disk; 6. Conveyor system; 7. Camera mounting platform.
Agriculture 15 01428 g015
Figure 16. Comparison chart of ablation studies results: (a) YOLOv5s model; (b) YOLOv5s + CLAHE; (c) YOLOv5s + CLAHE + CBAM; (d) YOLOv5s + CLAHE + CBAM + EIOU_LOSS.
Agriculture 15 01428 g016
Figure 17. Loss function curves before and after improvement.
Agriculture 15 01428 g017
Figure 18. P–R curves for YOLOv5s model before and after improvement: (a) P–R curve of the YOLOv5s algorithm; (b) improved P–R curve of the YOLOv5s algorithm.
Agriculture 15 01428 g018
Figure 19. Stereo matching depth map of sugarcane without stacking: (a) left camera view; (b) BM algorithm; (c) SGBM algorithm; (d) Opti-SGBM algorithm.
Agriculture 15 01428 g019
Figure 20. Stereo matching depth map of stacked sugarcane: (a) left camera view; (b) BM algorithm; (c) SGBM algorithm; (d) Opti-SGBM algorithm.
Agriculture 15 01428 g020
Figure 21. Schematic of dual-camera placement: 1. Camera; 2. Sugarcane samples; 3. Conveyor system components.
Agriculture 15 01428 g021
Figure 22. Testing sugarcane samples.
Agriculture 15 01428 g022
Figure 23. Partial sample of conveyor channel in sugarcane harvester prototype: (a) actual images and depth maps of three sugarcane stalks inside the harvester prototype; (b) actual images and depth maps of four sugarcane stalks inside the harvester prototype.
Agriculture 15 01428 g023
Figure 24. Algorithm performance comparison: (a) average relative error of volume under different feeding quantities; (b) average runtime per stage across different feed volumes.
Agriculture 15 01428 g024
Table 1. CBAM injection performance at different locations.
Fusion PositionMean Average Precision(%)Precision(%)Recall(%)Frames Per Second
CSP1_190.3592.0088.5572
CSP1_394.5095.8093.1076
CSP2_191.6088.5086.8077
Table 2. Performance of different detection models.
ModelsAverage Precision (%)Precision (%)Recall (%)Frames Per Second
SSD30078.1986.4088.1085
Faster R-CNN82.3686.9089.0090
YOLOv388.9093.1090.70102
YOLOv5l95.8096.3093.9055
YOLOv5s90.3592.0088.5582
Improve-YOLOv5s95.6693.8092.30105
Table 3. Experimental results of YOLO-ASM algorithm under different lighting conditions.
Number of Sugarcane Stalks123456
(Adequate lighting)
Volume relative error/%
2.614.945.787.7410.1911.36
(Low lighting)
Volume relative error/%
3.215.826.668.9711.4113.43
Disclaimer/Publisher’s Note: The statements, opinions and data contained in all publications are solely those of the individual author(s) and contributor(s) and not of MDPI and/or the editor(s). MDPI and/or the editor(s) disclaim responsibility for any injury to people or property resulting from any ideas, methods, instructions or products referred to in the content.

