Abstract
China’s National Famous, Special, Excellent, and New Agricultural Products are key rural economic assets, yet their spatial patterns and sustainability drivers remain underexplored. Based on the geospatial data of 1932 National Famous, Special, Excellent and New Agricultural Products in China, this study systematically analyzes their spatial distribution pattern by using GIS spatial analysis techniques, including the standard deviation ellipse, kernel density estimation, geographic concentration index and Lorenz curve, and quantitatively explores the driving factors of sustainable development by using geographic detectors. The research results of this paper are as follows. (1) The spatial distribution shows a significant non-equilibrium characteristic of “high-density concentration in the central and eastern part of the country and low-density sparseness in the western part of the country” and the geographic concentration index (G = 22.95) and the standard deviation ellipse indicate that the center of gravity of the distribution is located in the North China Plain (115° E–35° N), and the main direction extends along the longitude of 110° E–120° E. (2) Driving factor analysis showed that railroad mileage (X10) (q = 0.5028, p = 0.0025 < 0.01), highway mileage (X11) (q = 0.4633, p = 0.0158 < 0.05), and population size (X3) (q = 0.4469, p = 0.0202 < 0.05) are the core drivers. (3) Three-dimensional kernel density mapping reveals that the eastern coast and central plains (kernel density > 0.08) form high-density clusters due to the advantages of the transportation network and market, while the western part shows a gradient decline due to the limitation of topography and transportation conditions. The study suggests that the sustainable development of National Famous, Special, Excellent, and New Agricultural Products should be promoted by strengthening transportation and digital logistics systems, enhancing cold-chain distribution for perishable goods, tailoring regional branding strategies, and improving synergy among local governments, thereby providing actionable guidance for policymakers and producers to increase market competitiveness and income stability. The study provides a quantitative, policy-oriented assessment of China’s branded agricultural resource allocation and its sustainability drivers, offering specific recommendations to guide infrastructure investment, e-commerce logistics enhancement, and targeted subsidy design for balanced regional development. The study highlights three key contributions: (1) an innovative integration of geospatial analytics and geographical detectors to reveal spatial patterns; (2) clear empirical evidence for policymakers to prioritize transport and digital logistics investments; and (3) practical guidance for producers and brand managers to enhance product market reach, optimize supply chains, and strengthen regional competitiveness in line with sustainable development goals.
1. Introduction
More and more attention has been paid to the diversity of agricultural products, sustainable agricultural production, and the brand building of agricultural products in the world [1]. The increasing demand for agricultural products with environmental sustainability certification in the global market [2] is also increasing the efficiency of the quality management of agricultural products and the level of regional food safety [3]. The popularity of green agricultural products and consumers’ willingness to purchase them have increased significantly [4], and creating incentives to ensure transparency has become an important component of agricultural policy in many countries [5]. Sustainability, as defined by the Food and Agriculture Organization of the United Nations, is a type of development in which production and consumption patterns respect natural resources, social welfare, and economic development. In this context, the 17 Sustainable Development Goals have been proposed [6] and should be understood as the global public goods that the planet needs in order to develop more equitably and sustainably, with agriculture and the food system occupying a central place in their realization [7]. The Food and Agriculture Organization of the United Nations, a specialized agency of the United Nations that supports its member countries in the sustainable use of agriculture [8], has long advocated for a system of protection of “geographical indications”. Geographical indications are recognized as intellectual property rights and are defined as “indications that a product originates from a particular place and that a particular quality, reputation or other characteristic of the product is essentially attributable to its geographical origin” [9,10].
The Lisbon Agreement was signed by the EU in 1958. The Agreement on Trade-Related Aspects of Intellectual Property Rights was signed in Marrakech, Morocco, on 15 April 1994 and entered into force in January 1995. Both further promote the study of geographical indications [11]. In Japan, the Anti-Unfair Competition Law was enacted in 1934 to emphasize the protection of GI agricultural products [12]. In the United States, the annual research and development expenditure on agricultural science and technology accounts for 5% to 15% of the total sales. The U.S. has promoted the branding of GI agricultural products through diversified management strategies [13]. On 14 September 2020, the Government of the People’s Republic of China and the European Union signed the Agreement between the Government of the People’s Republic of China and the European Union on the Protection of Geographical Indications and Cooperation, which enhanced the international influence of GI agricultural products in China and the European Union. ASEAN and 15 countries, including China, Japan, Korea, Australia, and New Zealand, announced the completion of negotiations on the Regional Comprehensive Economic Partnership, with relatively weak competition in agricultural exports and strong complementarities in trade in various types of agricultural products on 15 November 2020 [14], and emphasizing the sustainable development of geographical indications for agricultural products. Statistics from the Food and Agriculture Organization of the United Nations demonstrate that the global gross product of agriculture, forestry, and fisheries grew by 84% in real terms between 2000 and 2021, reaching 3.7 trillion US dollars in 2021. Asia, with its wide geographic area, is the main contributor to the new global value of agriculture, forestry, and fisheries, accounting for 65 percent of the total global agricultural output in 2021. Therefore, it is valuable to study the pattern and sustainable development of the country’s agricultural products (Food and Agriculture Organization of the United Nations, 2023).
National Famous, Special, Excellent, and New Agricultural Products are agricultural products that are produced in a specific region (in principle, county as a unit), have a certain scale of production and commodity volume, have significant regional characteristics and unique nutritional quality features, have a stable supply and consumer market, have a high degree of public recognition and reputation, and have been logged in the bulletin by the Center for Agricultural Product Quality and Safety of the Ministry of Agriculture and Rural Affairs [15,16]. From 2019 to 2022, China implemented a protection project for geographic indications of agricultural products, and a total of 848 products are included in the protection [17]. From 2002 to 2016, the state issued and implemented Opinions on Accelerating the Development of Characteristic Agricultural Products in Western Regions and the Regional Layout Plan for Characteristic Agricultural Products (2013–2020) and a series of other policies, which strongly drove the development of characteristic agriculture [18]. The number of National Famous, Special, Excellent, and New Agricultural Products has continued to grow since the collection and logging work was formally carried out in 2019. National Famous, Special, Excellent, and New Agricultural Products refer to those agricultural products that are produced in specific environmental conditions of origin, have stable and unique quality characteristics that are perceptible, recognizable, and quantifiable, have a certain scale of production, have a stable supply and consumer groups, apply for a county as a unit, have a county-level Famous, Special, and New Agricultural Product competent organization confirmed by the county-level people’s government as the main body of the directory registration application, and have been registered by the Center for Agricultural Product Quality and Safety of the Ministry of Agriculture and Rural Affairs. The Center registers the agricultural products, including planting and farming products and their primary processing products of origin [19]. In 2024, the State Intellectual Property Office announced the Measures for the Protection of Geo-labeled Products, which to a certain extent solved the problem of the protection of China’s famous, special, high-quality, and new products [20]. In conclusion, National Famous, Special, Excellent, and New Agricultural Products refer to agricultural products with obvious regional characteristics and special nutritional quality features within a certain region, and the Agricultural Products Quality and Safety Center of the Ministry of Agriculture and Rural Development is responsible for the directory-related collection and registration work, in order to promote the high-level development of famous, special, excellent, and new agricultural products [21].
International experience demonstrates that the development of famous, special, and new agricultural products is highly dependent on the coupling of resource endowment, industrial policy, and market mechanism. Although the cultivation of National Famous, Special, Excellent, and New Agricultural Products has demonstrated initial success in China, there are still various shortcomings and dilemmas in the process of industrialization and development [22]. China lacks a systematic study on its spatial pattern and core driving factors despite its initial success in this field. Previous studies have analyzed the spatial distribution of geographic indication agricultural products in provinces such as Yunnan and Shandong, revealing that factors like altitude, transportation density, and policy support and shape agglomeration levels. GIS and geodetectors have been used to confirm that economic openness and road mileage are decisive for distribution clusters in Yunnan. However, most studies have focused on individual provinces or specific geographical indication products rather than conducting multi-factor comparisons on a national scale. This paper studies the spatial distribution pattern of agricultural products and the driving factors of sustainable development on a national scale.
This study is based on a sample of 1932 National Famous, Special, Excellent, and New Agricultural Products from the platform of the Center for Quality and Safety of Agricultural Products (http://www.aqsc.agri.cn/ accessed on 29 August 2023) of the Ministry of Agriculture and Rural Development of the People’s Republic of China. This article innovatively combines kernel density estimation and regression analysis methods to explore the distribution patterns and driving mechanisms of nationally renowned, special, high-quality, and new agricultural products at the national scale, addressing the current lack of integrated, multi-factor spatial analysis across all provinces. Specifically, this research clarifies how diverse natural, economic, and infrastructural factors shape the spatial agglomeration and sustainability potential of these agricultural products. It reveals the impact of multiple factors such as altitude, river distribution, transportation accessibility, and population density on the distribution of agricultural products. Accordingly, the study sets out the following objectives: (1) to map and quantify the spatial distribution pattern; (2) to identify the key driving factors and their interactions; and (3) to propose actionable regional development and branding strategies based on the empirical findings. The study also proposes strategies for optimizing sustainable conservation areas in China and building agriculture oriented towards modern international markets, aiming to provide scientific evidence for the future development of regional agricultural brands and policy optimization [23].
This study innovatively combines kernel density estimation with regression analysis to systematically explore the distribution pattern and driving mechanism of famous, special, high-quality, and new agricultural products across the country from a spatial perspective. By revealing the influence of multi-dimensional factors such as altitude, river distribution, and transportation network on the spatial differentiation of agricultural products, the research systematically identified the spatial agglomeration characteristics and gradient laws of agricultural product brands, and quantified the contribution intensity of key driving factors. On this basis, strategies for optimizing the layout of sustainable protected areas for agricultural products with Chinese characteristics and constructing an agricultural industrial system oriented towards the modern international market are proposed, providing a scientific basis for the differentiated development of regional agricultural brands, precise policy regulation and control, and the enhancement of global competitiveness.
2. Materials and Methods
2.1. Study Area and Data Sources
This paper draws on the connotations and definitions of the National Famous, Special, Excellent, and New Agricultural Products by the Center for Quality and Safety of Agricultural Products of the Ministry of Agriculture and Rural Development of the People’s Republic of China. The primary dataset includes detailed records for 1932 National Famous, Special, Excellent, and New Agricultural Products, with attributes covering product type (e.g., planting or breeding), registration year, county-level location, production scale, and certification status. These records were retrieved from the Center’s official platform (http://www.aqsc.agri.cn/ accessed on 29 August 2023) China is located in the eastern part of Asia, on the west coast of the Pacific Ocean, and in the eastern part of the Asia–Europe continent, in both the Eastern and Northern Hemispheres. The total land area is about 9.6 million square kilometers, ranking 3rd in the world. The samples in this paper are data from the National List of Famous, Specialty, and New Agricultural Products, whose spatial distribution covers 22 provinces, 5 autonomous regions, and 4 municipalities directly under the central government in mainland China, totaling 1932 National Famous, Special, Excellent, and New Agricultural Products (Figure 1).

Figure 1.
Spatial distribution pattern of National Famous, Special, Excellent, and New Agricultural Products.
2.2. Research Methodology
In this paper, through ArcGIS 10.8 software tools, we use the kernel density estimation method of spatial statistical methods, geographic concentration index, and spatial cluster analysis to demonstrate the spatial distribution characteristics of National Famous, Special, Excellent, and New Agricultural Products, and analyze the spatial layout of National Famous, Special, Excellent, and New Agricultural Products [24]. Finally, using a geographical detector, we further quantitatively analyze the indicator situation and influencing factors of the distribution of National Famous, Special, Excellent, and New Agricultural Products, explore the influencing factors of the differences in the distribution of National Famous, Special, Excellent, and New Agricultural Products, and put forward feasible suggestions for National Famous, Special, Excellent, and New Agricultural Products.
2.2.1. Standard Deviation Ellipse
The standard deviation ellipse, first proposed by Lefever in 1926, is an important method to study the direction and characteristics of the distribution of spatial point elements [25], and an important tool to effectively explore the spatial characteristics of point elements. The standard deviation ellipse is a classic method to analyze the distribution and direction of data, which converts abstract point elements into figurative graphs, and the analysis process usually includes the distribution center of gravity, the standard deviation of the long axis, the standard deviation of the short axis, the azimuthal angle, etc., and it can accurately reflect the spatial distribution characteristics of the geographic elements [26]. The purpose of this paper is to reflect the spatial distribution and the center of gravity migration trend of National Famous, Special, Excellent, and New Agricultural Products by the standard deviation ellipse.
(,) denotes the coordinates of the center of gravity of the ellipse, and denote the standard deviation of the two axes, () denotes the spatial region of the National Famous, Special, Excellent, and New Agricultural Products, denotes the weights, x and y denote the relative coordinates of the points from the center of the ellipse, respectively, and denotes the angle between the ellipse’s positive north and the long axis [27].
2.2.2. Lorentz Curve
The diagonal line in the Lorenz curve represents the line of absolute equality in distribution [28]. y = x is the absolute mean and y = f(x) is the cumulative curve of different research objects. The y = x and y = f(x) distance is the degree of spatial distribution uniformity of each research object. When y = f(x) is closer to y = x, it indicates that the spatial distribution of the research object is more concentrated; when y = f(x) is further from y = x, it indicates that the spatial distribution of the research object is more scattered [29]. In the Lorenz curve, a greater degree of curvature indicates a greater difference in the spatial distribution of the National Famous, Excellent, and New Agricultural Products; a lesser degree of curvature indicates that the spatial distribution of National Famous, Excellent, and New Agricultural Products is more balanced. This can reflect the spatial consistency and balanced development of National Famous, Special, Excellent, and New Agricultural Products.
2.2.3. Geographic Concentration Index
The geographic concentration index is an important indicator of the degree of centralization of the distribution of a geographic element [30], and is calculated by the following formula:
In the above formula, G represents the geographic concentration index of National Famous, Excellent, and New Agricultural Products and represents the number of National Famous, Excellent, and New Agricultural Products owned by the i-th province or city in China. T is the total number of National Famous, Excellent, and New Agricultural Products and n represents the total number in the study area. The value of G is between 0 and 100. A higher G value indicates more concentrated National Famous, Special, Excellent, and New Agricultural Products. A lower G value indicates more dispersed National Famous, Special, Excellent, and New Agricultural Products. G0 represents the geographical concentration index when the National Famous, Excellent, and New Agricultural Products are distributed in each province or city on average. G > G0 indicates that National Famous, Excellent, and New Agricultural Products show centralized distribution, and vice versa indicates that National Famous, Excellent, and New Agricultural Products show decentralized distribution.
2.2.4. Geographical Detector
Geographical detectors are tools for the exploratory analysis of spatial data [31] that focus on spatial heterogeneity to detect whether there is consistency in the spatial distribution pattern between the dependent and independent variables. Geographical detectors can reveal the formation mechanisms of spatial phenomena and the influence of their drivers by analyzing the explanatory power of different factors on geographic phenomena [32]. Geographical detectors have the ability to mix categorical and numerical variables for analysis, and to detect true interactions between independent variables and their effects. In this study, the geographical detector is used to clarify the explanatory power of different geographic factors on the spatial variation of National Famous, Special, Excellent, and New Agricultural Products through factor detection, and the interaction detection model is applied to further analyze the changes in the explanatory power of different geographic factors after the interaction between them [33]. The formula is as follows:
In this formula, h = 1,2,… n is the stratification of Y, X; Nh and N are the number of cells in stratum h and the whole region, respectively; and are the variance of Y values in stratum h and the whole region, respectively; SSW denotes the sum of the variances within the stratum; and SST denotes the total variance of the whole region [34]. The value of q ranges from 0 to 1. A larger q indicates stronger factor drivers, but a smaller q indicates weaker factor drivers [35].
3. Spatial Distribution Characteristics of National Famous, Special, Excellent, and New Agricultural Products
3.1. Spatial Distribution Pattern
3.1.1. Distributional Analysis of Standard Deviation Ellipses
The standard deviation ellipse can be used to determine the distribution center of gravity, the main direction of distribution, and the evolutionary trend of National Famous, Special, Excellent, and New Agricultural Products [36]. Taking the center of gravity, long axis, short axis, and azimuth angle of the spatial distribution ellipse as the basic parameter distribution, it is advantageous to identify the spatial structure and represent the spatial information [37].
The National Famous, Special, Excellent, and New Agricultural Products demonstrate significant non-equilibrium characteristics, characterized by “concentration in the central and eastern parts of the country and sparseness in the western part”, with the underlying empirical indicators showing statistical significance at the 1% level (p < 0.01) for the main axes and agglomeration center parameters (Figure 2). Quantitative data demonstrate that the long axis of the standard deviation ellipse extends along 110°–120° E longitude, and the short axis is distributed over 30°–40° N latitude, covering an area of about 1.2 × 10⁶ km2, with an azimuth angle of 270° indicating that the dominant direction is the east–west axis, which is highly consistent with the spatial trajectory of the Yangtze River Economic Belt. The core agglomeration area is dominated by Sichuan, Henan, Hebei, Jiangxi, Inner Mongolia Autonomous Region, and Yunnan provinces, accounting for 46.33% of the national total, and its center of mass is located in the North China Plain (115° E–35° N), which confirms the fundamental position of the agricultural regions of the Yellow Seas and the middle and lower reaches of the Yangtze River. The dispersion of the short axis of the ellipse (D = 0.68) is significantly lower than that of the long axis (D = 1.42), reflecting that the distribution in the north–south direction is constrained by the climatic zone of the Qinling Mountains–Huaihe River Line. The east–west direction benefits from the corridor effect of the irrigation system and the transportation arteries of the Yangtze River Basin. Qualitative analysis demonstrates that the distribution of agricultural products is more in the east and less in the west, dense along the coast and sparse inland, and extends in a specific direction. This pattern provides empirical evidence for optimizing the allocation of agricultural geographic resources and formulating region-specific sustainable development strategies.
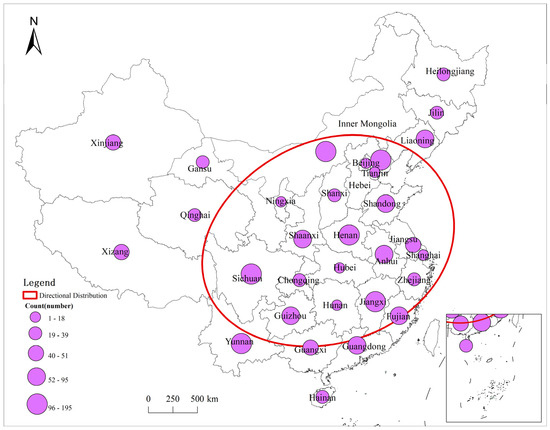
Figure 2.
Standard deviation ellipse of National Famous, Special, Excellent, and New Agricultural Products.
3.1.2. Lorentz Curve
In assessing the degree of equilibrium in the spatial distribution of National Famous, Special, Excellent, and New Agricultural Products, an imbalance index is used, in which the Lorenz curve model is an important tool in the research methodology. The Lorenz curve is a powerful intuitive tool to effectively demonstrate the degree of spatial equilibrium and concentration of National Famous, Special, Excellent, and New Agricultural Products. Through this analytical method, a comprehensive understanding of the distribution of National Famous, Special, Excellent, and New Agricultural Products can be obtained [38].
In this paper, based on Table 1, the Lorenz curve is plotted (Figure 3). On the horizontal axis, we can see 1932 National Famous, Special, Excellent, and New Agricultural Products from 22 provinces, five autonomous regions and two municipalities in mainland China. They are arranged in order from the province (city) with the largest number of National Famous, Special, Excellent, and New Agricultural Products to the province (city) with the smallest number of National Famous, Special, Excellent, and New Agricultural Products. The vertical axis indicates the cumulative proportion of these National Famous, Special, Excellent, and New Agricultural Products. The blue Lorenz curve is significantly lower than the orange uniform distribution line, indicating a significant imbalance in the distribution of agricultural products. The lower the curve bends, the higher the degree of imbalance.

Table 1.
National Famous, Special, Excellent, and New Agricultural Products in China: Lorentz curve.
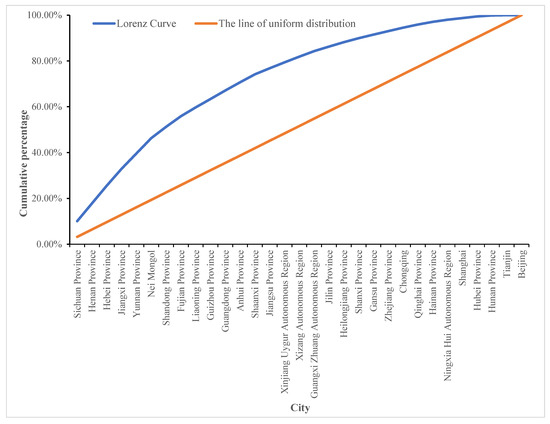
Figure 3.
Standard deviation ellipse of National Famous, Special, Excellent, and New Agricultural Products.
The analysis based on the Lorenz curve demonstrates that the top seven regions (Sichuan, Henan, Hebei, Jiangxi, Inner Mongolia Autonomous Region, and Shandong) contribute 51.24% of National Famous, Special, Excellent, and New Agricultural Products, and their actual cumulative proportion (49.1%) is significantly higher than the theoretical uniform distribution of 16.1%. Overall, the systematic deviation of the actual cumulative distribution curve (blue) from the theoretical uniform distribution curve (orange) indicates that the spatial agglomeration degree of National Famous, Special, Excellent, and New Agricultural Products is in a state of “high imbalance”, and this imbalance may be due to the differences in the natural conditions, level of economic development, policy support, and market demand of each region, which need to be considered comprehensively in order to formulate a comprehensive plan for the development of National Famous, Special, Excellent, and New Agricultural Products. It is necessary to consider these factors comprehensively in order to formulate targeted sustainable development strategies to promote the rational development and balanced utilization of agricultural resources [39]. Moreover, considering projected climate change over the next two decades, there is a high probability that shifts in temperature, precipitation patterns, and extreme weather events could modify the core suitable zones for National Famous, Special, Excellent, and New Agricultural Products. Recent studies (IPCC, 2021) have shown that agro-climatic zones in China may shift northward or to higher elevations, altering production suitability. Future spatial modelling should therefore integrate dynamic climate scenarios to anticipate these shifts, providing a proactive basis for policy makers to adjust branding strategies, support adaptive farming practices, and ensure the resilience of regional agricultural economies.
3.1.3. Geographical Concentration Index
The formula for the geographic concentration index is , which can reflect the concentration status of the research object on a certain scale [40]. In the distribution of famous, special, and new products in China, the value of G is 22.95. This indicates that National Famous, Special, Excellent, and New Agricultural Products have a certain degree of concentration within China, but not extreme concentration, and the calculated G value is statistically significant at the 1% level (p < 0.01), confirming the robustness of the concentration result (Table 2).
Table 2.
Geographic concentration index of National Famous, Special, Excellent, and New Agricultural Products.
3.2. Influencing Factors on the Distribution of National Famous, Special, Excellent, and New Agricultural Products
By analyzing natural resources such as terrain and rivers, as well as social resources such as transportation, the degree of their influence on the distribution of National Famous, Special, Excellent, and New Agricultural Products is explored.
3.2.1. Elevation
From the qualitative analysis, National Famous, Special, Excellent and New Agricultural Products demonstrate significant vertical differentiation (Figure 4). The high-altitude zone (1500–3500 m), with the Tibetan Plateau as its core, is constrained by low temperature, strong radiation, and low-oxygen environments, resulting in the formation of cold- and drought-resistant specialty varieties such as barley and yak; the ultra-high-altitude zone (>3500 m) is characterized by only extreme environmentally adapted crops. The middle- and low-altitude zones (500–1500 m) cover the core agricultural areas such as the Sichuan Basin and the Huanghuaihai Plain, where 68% of the country’s grain and economic crops (rice, wheat, and tea) are concentrated thanks to the coordination of water and heat and fertile soil. Low-elevation coastal zones (<500 m), such as Jiangsu, Zhejiang, and Shanghai, rely on alluvial soils and monsoon climates to develop high value-added aquaculture and facility-based vegetables (accounting for 52% of total production).
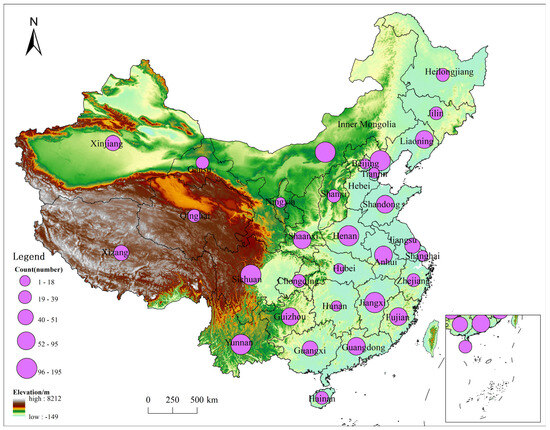
Figure 4.
Elevation distribution of National Famous, Special, Excellent, and New Agricultural Products.
From the quantitative analysis, through the analysis of the distribution density of National Famous, Special, Excellent, and New Agricultural Products (as demonstrated in the figure), it can be seen that the distribution density of the agricultural products in the high-altitude area (1500–3500 m) is low, mainly focusing on a few characteristic varieties; the distribution density of the ultra-high-altitude area (3500–5500 m) is further decreased, with only a small number of extreme cold-tolerant crops. The distribution density in the middle- and low-altitude areas (500–1500 m) is significantly higher than that in the high-altitude areas. Combined with the relevant data, a significant negative correlation can be found between altitude and the distribution density of agricultural products, which further verifies the important influence of altitude.
3.2.2. Rivers
Among the factors influencing the distribution pattern of National Famous, Special, Excellent, and New Agricultural Products, there is an important natural driving factor. From the qualitative analysis, the distribution of National Famous, Special, Excellent, and New Agricultural Products demonstrates a significant correlation with the distribution of major rivers. Large rivers and their tributaries provide abundant water resources for agriculture, shape a suitable environment, and promote the diversification and high yield of agricultural products. For example, the Yangtze River Basin and its tributaries (such as the Sichuan Basin, Hubei, Hunan, etc.) are rich in water resources, have a humid climate and fertile soil, and are the main distribution areas of National Famous, Special, Excellent, and New Agricultural Products, such as rice, tea, and citrus. The Yellow River Basin and its tributary areas (such as Shaanxi, Henan, Shandong, etc.), on the other hand, are dominated by grain crops such as wheat and corn, and the rivers in these areas not only provide irrigation water, but also form fertile plains through alluvial action. In addition, the Pearl River Basin and its tributary regions (such as Guangdong, Guangxi, etc.) have a warm and humid climate, which is suitable for the growth of a variety of tropical and subtropical crops, such as sugarcane and litchi.
An analysis of the distribution density of National Famous, Special, Excellent, and New Agricultural Products reveals that the distribution density of agricultural products near major rivers is significantly higher than that in areas far from rivers. In addition, the effect of rivers on the distribution of agricultural products is indirectly reflected through mediating variables such as soil fertility and climatic conditions. For example, soil fertility in the plains formed by river alluvium is high, which is suitable for the growth of a variety of crops, while the wet climate brought by rivers promotes the cultivation of moisture-loving crops. Combined with the relevant data, it can be found that there is a significant positive correlation between the density of rivers and the distribution density of agricultural products, which further verifies the important influence of rivers on the distribution of National Famous, Special, Excellent, and New Agricultural Products (Figure 5).
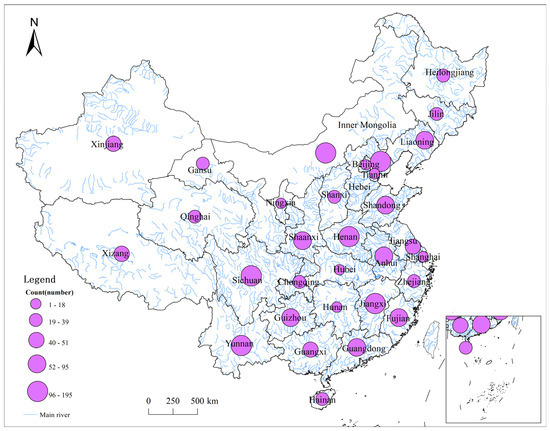
Figure 5.
Distribution of rivers of National Famous, Special, Excellent, and New Agricultural Products.
3.2.3. Transportation
The distribution pattern of the National Famous, Special, Excellent, and New Agricultural Products is influenced by a variety of factors, among which transportation is an important driver, demonstrating the convenience of external activities near the distribution of the National Famous, Special, Excellent, and New Agricultural Products [41]. From the qualitative analysis, the density and quality of the transportation network significantly affect the circulation efficiency and market accessibility of agricultural products. Conveniently located areas, such as the eastern coast and the central plains, usually have a more developed network of highways, national highways and provincial highways, which provide good conditions for the transportation and marketing of agricultural products. For example, eastern coastal provinces such as Shandong, Jiangsu, and Zhejiang, with their dense transportation networks, allow agricultural products to enter the market quickly, thus facilitating the diversification and high productivity of agricultural products. In contrast, western mountainous areas such as Tibet and Qinghai have relatively weak transportation networks, which limit the circulation of agricultural products, resulting in relatively fewer types and quantities of agricultural products in these areas.
Through the analysis of the distribution density of National Famous, Special, Excellent, and New Agricultural Products, it can be found that the distribution density of agricultural products near transportation trunk lines is significantly higher than that in areas far away from transportation trunk lines. In addition, the effect of transportation on the distribution of agricultural products is indirectly reflected through mediating variables such as market accessibility and technology diffusion. For example, areas with good transportation access have easier access to markets for agricultural products, which stimulates the production and diversification of agricultural products. At the same time, transportation also promotes the spread of agricultural technology, which improves the yield and quality of agricultural products. Combined with the relevant data, a significant positive correlation (p < 0.01) can be found between the density of transportation arteries and the density of the distribution of agricultural products, which further validates the important influence of transportation on the distribution of nationally renowned, high-quality, and new agricultural products (Figure 6). In addition, the perishability of certain agricultural products, such as fresh fruits, vegetables, and aquaculture products, intensifies their dependence on an efficient transportation infrastructure, as timely delivery is crucial to maintaining product quality and market competitiveness.
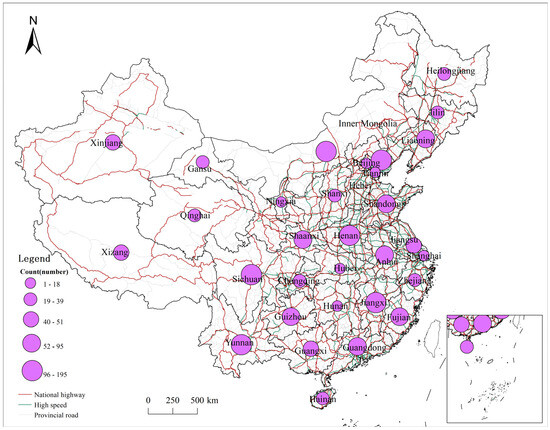
Figure 6.
Distribution of transportation of National Famous, Special, Excellent, and New Agricultural Products.
4. Influencing Factors of Distribution Characteristics of National Famous, Special, Excellent, and New Agricultural Products
4.1. Selection of Impact Factors
In this paper, to explore the spatial distribution driving mechanism of the National Famous, Special, Excellent, and New Agricultural Products [42], we selected 11 representative variables based on theoretical relevance and empirical applicability. These variables are categorized into three major groups (natural resources, economic consumption capacity, and infrastructure) for geodetector analysis, with selection informed by literature benchmarks.
In terms of natural resource endowment, the total water resources (X1) affects the basic conditions for agricultural production, while the water resources per capita (X2) affect the sustainable development of agriculture. In terms of economic and consumption capacity, population size (X3) affects the consumer market and labor supply. Gross domestic product per capita (X4), gross domestic product (X5), and disposable income per capita (X6) reflect the consumption capacity and living standard of the population, and are closely related to the market demand for agricultural products. Consumption expenditure per inhabitant (X7) reflects residents’ consumption ability and consumption tendency. Total exports and imports of goods (X8) and total retail sales of consumer goods in society (X9) reflect the degree of openness and market vitality of the regional economy. In terms of infrastructure, railroad mileage (X10) and highway mileage (X11) are important guarantees for the transportation of agricultural products, which directly affect the distribution efficiency and market coverage of agricultural products (Table 3). This reflects e-commerce logistics (such as the last-mile delivery capacity) and their impact on reducing corruption rates and expanding market access for geographically dispersed agricultural products. They reflect the rising role of digital logistics in shortening the distance between production bases and consumers, which is increasingly critical for the agglomeration and timely distribution of high-value, perishable agricultural products. In terms of policy support, we additionally consider policy incentives such as rural revitalization strategies, regional agri-branding plans, and financial subsidies as important institutional drivers, which shape the production environment and market access for National Famous, Special, Excellent, and New Agricultural Products.
Table 3.
Results of single-factor detection of National Famous, Special, Excellent, and New Agricultural Products.
Although climate and environmental parameters such as average annual temperature, precipitation, and humidity are theoretically relevant to agricultural production, they were not included in the final model due to the following reasons: (1) many national-level agricultural product brands are characterized by strong anthropogenic and industrial influences that override pure climatic constraints; (2) multicollinearity tests revealed that climatic variables were strongly correlated with elevation and hydrological features already included in the model, such as total water resources and river proximity; and (3) pilot regression tests showed that these climatic variables exhibited low explanatory power and non-significant Q statistics within the geodetector framework. Moreover, high-resolution climatic data often do not align with the statistical scale of prefecture-level spatial units used in the analysis. Future research may expand to incorporate time-series climatic indices if higher-resolution spatiotemporal datasets become available.
Geographical detectors can calculate the Q statistic of the spatial distribution [43] by using a factor detector for these variables. The Q statistic is a measure of the explanatory power of a certain factor on the spatial differentiation of a phenomenon, i.e., what proportion of spatial variation can be explained by the factor, and it takes a value ranging from zero to one. The greater the Q statistic is, the stronger the explanatory power is. This helps to reveal the multidimensional driving mechanisms of the spatial agglomeration of national famous and new agricultural products. In addition to resource endowment and infrastructure, national policies such as the Regional Layout Plan for Characteristic Agricultural Products (2013–2020), the Geographical Indication Agricultural Product Protection Project (2019–2022), and the recent Measures for the Protection of Geo-labeled Products (2024) have significantly promoted the spatial agglomeration of National Famous, Special, Excellent, and New Agricultural Products by guiding resource allocation, market access, and branding direction.
The Spatial Durbin Model is used for spatial data econometric analysis, and indicates significant at 1%, 5%, and 10% statistical levels, respectively. The analysis of the factors influencing the spatial distribution of National Famous, Special, Excellent, and New Agricultural Products based on the geodetic detector model demonstrated that there are significant differences in the explanatory power (Q statistic) and statistical significance (p value) of the driving factors (Table 3). The values of the Q statistic and p value are ranked in ascending order, respectively. The results of the study demonstrate that according to the results of the geographical detector model, transportation infrastructure and population factors are the significant driving factors affecting the spatial distribution pattern of Chinese famous, special, and new agricultural products. Among them, the Q statistic of railroad mileage (X10) is 0.5028, which is significant at a 1% significance level (p = 0.0025), indicating that areas with strong railroad transportation capacity are more conducive to the circulation of agricultural products, brand dissemination, and market penetration, and become an important spatial support for the agglomeration of famous, special, and new agricultural products. Similarly, the Q value of highway mileage (X11) is 0.4633, which also demonstrates strong explanatory power at the 5% significance level. The Q value of population size (X3) is 0.4469 (p = 0.0202), indicating that the capacity of the consumer market directly affects the brand building and market demand feedback of agricultural products, and the distribution of famous, special, new, and high-quality agricultural products in densely populated areas is more concentrated. In addition, the Q values of regional gross domestic product (X5) and total retail sales of consumer goods in society (X9) are 0.3680 and 0.3332, respectively, which are only at the marginally significant level of about 10% (p values of 0.0570 and 0.0849, respectively), but still reflect a certain supportive role for branded agricultural products in economic development.
In contrast, the Q statistic of total water resources (X1) is 0.3192, and its p value is 0.0986, which is only marginally significant at the 10% level. However, the Q statistic of water resources per capita (X2) is only 0.1007, with a p value of 0.6416, which is not significant. This indicates that the explanatory power of water resource factors on the spatial distribution of National Famous, Special, Excellent, and New Agricultural Products is limited. Due to the large differences in the dependence of different products on water resources, it is difficult to explain uniformly. Similarly, the variables of gross domestic product per capita (X4), disposable income per capita (X6), and total exports and imports of goods (X8) did not pass the significance test of 5%, which demonstrates that there are regional differences in their influence or the paths of their effects are indirect, and it is difficult to determine a direct driver.
In conclusion, the core driving factor of the distribution pattern of famous, special, and new agricultural products lies in the spatial overlap between “transportation accessibility” and “population density”, which provides theoretical support for the synergistic optimization of the strategic deployment of agricultural brands and infrastructure construction.
4.2. Two-Factor Interaction Detection Results
This study explored the driving force mechanism of the distribution of National Famous, Special, Excellent, and New Agricultural Products with the help of a geographical detector and analyzed the degree of explanation of the distribution of National Famous, Special, Excellent, and New Agricultural Products by the interaction of two influencing factors [44]. The two-factor geographical detector constructed is used for interaction detection to reveal the synergistic mechanism of driving factors for the spatial differentiation of National Famous, Special, Excellent, and New Agricultural Products. It centers on quantifying the strength of the intersection effect of the two factors.
- (1)
- Nonlinear-weaken is when the effect of two factors acting together is less than the minimum value when acting alone, indicating that they inhibit each other.
- (2)
- Uni-weaken is where the effect of two factors acting together is between the minimum and maximum of the separate effects, indicating that one factor has an inhibitory effect on the other.
- (3)
- Bivariate-enhance is the maximization of the effect of the two factors together over the effect of them alone, indicating that they reinforce each other.
- (4)
- Independent is the sum of the effects of two factors, indicating that they are independent of each other without interaction.
- (5)
- Nonlinear-enhance is the sum of the effects of the joint action over and above their respective independent effects, indicating significant synergistic effects (Table 4).
Table 4. The interactive effect between two factors.
The figure demonstrates the interactions among the drivers of the spatial distribution of famous, special, and new agricultural products in China. The horizontal and vertical axes represent different drivers (X1 to X11). The color shades and column heights reflect the Q statistics of the factor combinations and the explanatory power for the spatial distribution. Red and high columns represent strong explanatory power, while blue and low columns represent weak explanatory power. Geographical detectors classify interaction types based on Q statistics (Table 4).
The 11 × 11-order interaction heat map constructed based on the geographical detector method systematically reveals the driving mechanism of the spatial distribution of national famous and new agricultural products. The diagonal values characterize the single-factor independent explanatory power (Q statistic). The map demonstrates that transportation infrastructure has the most significant independent driving effect on the distribution of agricultural products. The non-diagonal area demonstrates the two-factor interaction enhancement effect, and the synergistic effect of economic factors is especially prominent, such as the interaction results of regional gross domestic product (X5) and total retail sales of consumer goods in society (X9), which reveals that the deep integration of the economic scale and the consumer market has a decisive influence on the layout of agricultural products. The color scale distribution of the heat map demonstrates significant spatial heterogeneity: the high-value area (red, q > 0.8) is concentrated in the interaction area of economic (X5, X6, and X9) and transportation (X10 and X11) factors, which indicates that the dual driving force of economic vitality and logistics network is the core driving force; the medium-value area is dominated by the resource-based factors (X1 and X2), reflecting the local supportive role of water resource endowment; and the low-value zone is distributed among ecologically related factors, implying that the pure ecological factors have limited ability to regulate the macro pattern (Figure 7).
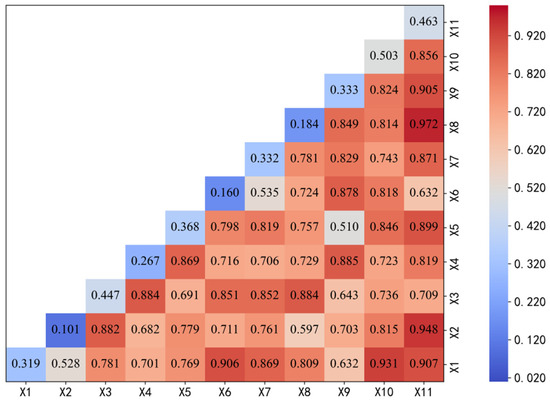
Figure 7.
Heat map of interactive detection of National Famous, Special, Excellent, and New Agricultural Products. Notes: X1: total water resources; X2: water resources per capita; X3: population size; X4: gross domestic product per capita; X5: gross domestic product; X6: disposable income per capita; X7: consumption expenditure per inhabitant; X8: total exports and imports of goods; X9: total retail sales of consumer goods in society; X10: railroad mileage; and X11: highway mileage.
4.3. Three-Dimensional Kernel Density
This paper constructs a three-dimensional coordinate system combining region, quantity, and kernel density to further investigate the nationwide distribution of famous, special, high-quality, and new agricultural products. The X-axis represents the area, the Y-axis represents the number, and the Z-axis represents the nuclear density. The spatial probability surface formed by the purple base and the multicolored density peaks reveals the three-dimensional distribution of the number of National Famous, Special, Excellent, and New Agricultural Products in different regions, including the spatial clustering characteristics and regional differences.
The color pattern of nuclear density peaks is geographically indicative, with a yellow main peak (nuclear density > 0.08) and a cyan secondary peak (nuclear density in the range of 0.05–0.07). The southeast of China has more concentrated famous and special agricultural products, while the northwest has more dispersed famous and special agricultural products [45]. The three-dimensional structure further exposes the density attenuation gradient in the northwest–southeast axial direction, suggesting that transportation accessibility has a basal regulating effect on the nuclear density pattern. This study provides a spatial measurement basis for analyzing the core–periphery structure of famous and high-quality agricultural products and formulating differentiated development strategies (Figure 8).
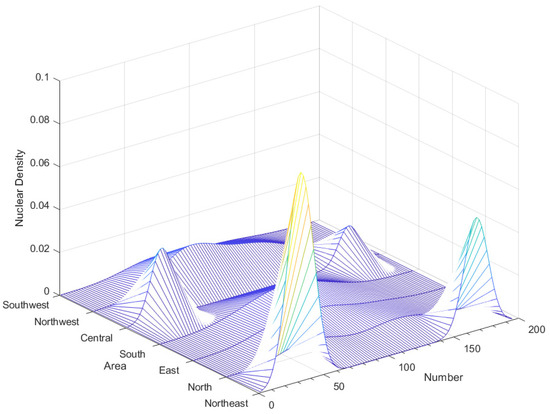
Figure 8.
Three-dimensional kernel density of National Famous, Special, Excellent, and New Agricultural Products.
5. Discussion
- (1)
- Characteristics of the spatial distribution of National Famous, Special, Excellent, and New Agricultural Products
This study provides new evidence by systematically quantifying the multi-scale spatial clustering of National Famous, Special, Excellent, and New Agricultural Products at the national level, which complements prior local or single-factor studies [30,34]. Unlike previous literature focusing mainly on single provinces or limited factors, this work integrates GIS kernel density, the standard deviation ellipse, the Lorenz curve, and geographic detectors to reveal complex interaction effects and gradient patterns, thus offering a more holistic understanding of how transportation, economic scale, and policy incentives jointly drive spatial agglomeration. The standard deviation ellipse, geographic concentration index (=22.95), and Lorenz curve illustrate the uneven spatial distribution of National Famous, Special, Excellent, and New Agricultural Products, reflecting that the spatial distribution of National Famous, Special, Excellent, and New Agricultural Products demonstrates significant regional imbalance [46]. This is consistent with the research results for Yunnan’s GI crops [30] and Tian et al. for Shandong Province’s GI products [34]. These regional studies found comparable east–west corridor effects and coastal clustering, supporting our national-level conclusion that the eastern coastal and central plains maintain high brand concentration due to historical trade routes and modern logistics infrastructure. This consistency reinforces the robustness of our national pattern and highlights the need for differentiated policy interventions across regions.
The standard deviation ellipse analysis demonstrates that the main spatial direction extends along 110° E~120° E, and the standard deviation of the long axis (1.42) is significantly higher than that of the short axis (0.68), indicating that the east–west distribution is driven by the corridor effect of the irrigation system and the transportation arteries of the Yangtze River Basin, whereas the north–south direction is blocked by the climate zone of the Qinling-Huaihe River. The Lorenz curve demonstrates that the top eight regions (Sichuan, Henan, Hebei, Jiangxi, Yunnan, Inner Mongolia Autonomous Region, Shandong, and Fujian) contribute 55.85% of the nation’s agricultural products, corroborating the non-equilibrium between resource endowment and market demand [47].
- (2)
- Effect of altitude
Altitude creates a vertical zonal pattern in the distribution of agricultural products by changing light and heat resources and farming conditions. This altitude-driven pattern suggests that in mountainous rural revitalization zones, policy-makers should promote eco-agriculture models suited to local microclimates and elevation-specific crops, ensuring both biodiversity conservation and income diversification. Quantitative analysis demonstrated that the density of agricultural products decreased by 30% (p < 0.01) for every 1000 m of elevation. In the low-altitude plains (<500 m), the warm temperate climate with an annual mean temperature of 12~18 °C and cumulative temperature of 4000~5500 °C promotes the cultivation of high value-added crops such as rice and vegetables. The mid-altitude hilly area (500~1500 m) has become a high-quality production area for tea and Chinese herbs due to the large temperature difference between day and night and few pests and diseases. High-altitude areas (>1500 m) are limited by the low cumulative temperature and the risk of freezing, and only support the development of barley, yak, and other cold-tolerant species, but their unique habitat provides a competitive advantage in the form of an ecological niche. Famous agricultural products at altitudes of 0–500 m and 800–1500 m are more concentrated; the former are found in East China, South China coastal plains, and hilly areas, such as the Yangtze River Delta and the Pearl River Delta region, and the latter are mainly distributed in the Yunnan-Guizhou Plateau, the edge of the Sichuan Basin, and other places. This bimodal distribution pattern reflects that the advantages of heat resources in low-altitude areas and the ecological diversity of middle- and high-altitude areas have jointly shaped the diversified types of agricultural products, thus giving rise to a regional system of famous and high-quality agricultural products at different altitude gradients [41].
- (3)
- Impact of river distribution
The distribution of rivers has a significant impact on the distribution pattern of National Famous, Special, Excellent, and New Agricultural Products. There is a significant correlation between the distribution of National Famous, Special, Excellent, and New Agricultural Products and the distribution of major rivers. Large rivers and their tributaries provide abundant water resources for agriculture, shape a suitable environment, and promote the diversification and high yield of agricultural products. For example, the Yangtze River Basin and its tributaries (such as the Sichuan Basin, Hubei, Hunan, etc.) are rich in water resources, have a humid climate and fertile soil, and are the main distribution areas of National Famous, Special, Excellent, and New Agricultural Products, such as rice, tea, and citrus. The rivers of the Yellow River Basin and its tributary regions (e.g., Shaanxi, Henan, Shandong, etc.) not only provide irrigation water for areas dominated by food crops such as wheat and corn, but also form fertile plains through alluvial action [48]. In addition, the warm and humid climate of the Pearl River Basin and its tributary regions (e.g., Guangdong, Guangxi, etc.) is suitable for the growth of a variety of tropical and subtropical crops, such as sugarcane and litchi.
- (4)
- Impact of traffic distribution
Transportation distribution is an important driving factor influencing the spatial distribution pattern of National Famous, Special, Excellent, and New Agricultural Products. From a qualitative analysis, the density and quality of transportation networks significantly affect the distribution efficiency and market accessibility of agricultural products [49]. Conveniently located areas, such as the eastern coast and the central plains, usually have a more developed network of highways, national highways and provincial highways, which provide good conditions for the transportation and marketing of agricultural products. Crucially, the inherent fragility of this product, especially its perishable nature, further intensifies the reliance on transportation. In nuclear density analysis, the correlation between highly perishable products (such as lychees, leafy vegetables, and aquatic products) and transportation infrastructure is stronger than that between less perishable products (such as grains and tea). This connection between perishability and transportation explains the distribution gap between the eastern coastal areas and the western regions, as the cold chain defect in the western provinces restricts market access for perishable specialties, despite suitable growth conditions.
- (5)
- Effects on the spatial distribution based on the geographical detector
The factor analysis based on the geographical detector demonstrates that transportation infrastructure (X10 and X11) and population size (X9) constitute the primary drivers (q > 0.4), economic volume (X5) and consumption capacity (X9) are the secondary drivers (0.3 < q < 0.4), and the natural resources (X1 and X2) have a weak explanatory power (q < 0.32). The interaction probe finds that the synergistic effect of railroads and GDP (q = 0.905) far exceeds the sum of the independent effects, which confirms the multiplier effect of the “transportation–economy” coupling on the branding of agricultural products. It is worth noting that the interaction between per capita water resources (X2) and highway mileage is nonlinear-weaken, reflecting that transportation investment in arid areas needs to be accompanied by water-saving technologies to release the benefits. This paper uses these indicators to explore the correlation between the number of National Famous, Special, Excellent, and New Agricultural Products and the level of regional economic development [50].
- (6)
- Three-dimensional kernel density
The three-dimensional kernel density map visualizes the spatial distribution density characteristics of National Famous, Special, Excellent, and New Agricultural Products in different regions through spatial analysis methods. It can be seen from the map that the kernel density value is higher in the eastern coastal and central plain areas, such as Shandong, Jiangsu, Zhejiang, and other provinces, which indicates that the distribution of famous, special, and new agricultural products in these areas is more concentrated and more numerous. The western provinces such as Tibet and Qinghai have lower kernel density values, indicating that the distribution there is sparser and the number of agricultural products is relatively small. The three-dimensional kernel density map can also provide an important reference for the formulation of agricultural policies and resource allocation [51], which can help decision makers better understand the spatial distribution characteristics of National Famous, Special, Excellent, and New Agricultural Products, so as to formulate a more scientific and reasonable agricultural development strategy, and to promote the rational development and balanced utilization of agricultural resources.
- (7)
- The rural revitalization strategy, agricultural branding, and subsidy policies
Furthermore, it has been found that policy support is playing an increasingly important role. Under the background of China’s rural revitalization strategy and regional brand building, local governments have directly stimulated the production and market competitiveness of national famous, special, high-quality, and new agricultural products through various forms of subsidies, technical assistance, brand certification, etc. Regional policies can significantly change the spatial pattern of brand agriculture.
6. Conclusions
In this study, we explore the complex dynamic relationships of National Famous, Special, Excellent, and New Agricultural Products. In this paper, spatial distribution characteristics and optimization strategies of National Famous, Special, Excellent, and New Agricultural Products are analyzed through space. This work’s scientific contribution lies in clarifying not only the pattern but also quantifying the dominant driving mechanisms behind the observed agglomeration. The combined use of multi-method spatial analysis and geographical detectors, along with interaction detection, enables us to identify non-linear enhancement among economic, transport and demographic factors, which has rarely been addressed in previous studies at this scale. This comprehensive framework provides a robust reference for future regional agricultural planning and brand policy design.
(1) Based on the above conclusions, this study proposes the following targeted development measures and policy recommendations: (1) Prioritize the expansion of integrated transportation and cold-chain logistics corridors in high-density but logistically underserved areas, ensuring that perishable branded agricultural products maintain quality during transit. (2) Develop e-commerce-enabled supply chain hubs and last-mile delivery services specifically tailored to remote production bases, leveraging digital platforms to connect small producers with urban consumers more efficiently. (3) Encourage local governments to design region-specific brand certification and storytelling programs that emphasize unique agro-ecological and cultural attributes, differentiating local products in both domestic and export markets. (4) Promote precision agriculture and smart farming technologies by providing targeted subsidies and training, focusing on improving yield stability and environmental sustainability in core production zones. (5) Strengthen cross-regional cooperative alliances and joint marketing campaigns to expand the scale effect of branded agricultural clusters and reduce redundant competition. (6) Revise existing subsidy and tax incentive structures to favor producers who adopt traceable quality standards, carbon-neutral practices, and integrated logistics solutions. (7) Establish a dynamic monitoring and evaluation system using big data analytics to adjust branding strategies and resource allocation in response to market and climate variability.
(2) Development measures
Based on the above conclusions, this study proposes the following development measures and policy recommendations: First, strengthen the construction of transportation infrastructure, especially to enhance the density and quality of the transportation network in remote areas, in order to reduce the cost of transporting agricultural products, improve the efficiency of circulation, and promote the market expansion of agricultural products. The second is to enhance the capacity of agricultural science and technology innovation, increase investment in agricultural science and technology research and development, promote the innovation and application of agricultural technology, improve the yield and quality of agricultural products, and enhance their market competitiveness. Third, optimize the structure of the agricultural industry, rationally adjust the structure of the agricultural industry according to the resource endowment and market demand of each place, develop characteristic agriculture and high value-added agricultural products, and improve the overall efficiency of agriculture. Fourth, strengthen the brand building and market promotion of agricultural products, promote the market through a variety of channels, expand sales channels, and increase the market share of agricultural products. Fifth, increase policy support, formulate and improve relevant policies, and increase support for agriculture, including financial subsidies, tax incentives, and financial support, so as to create a favorable policy environment for the development of agriculture. Sixth, strengthening policy measures, such as optimizing subsidy schemes and branding programs, is recommended as an effective approach to further refine the spatial structure and ensure the sustainable development of National Famous, Special, Excellent, and New Agricultural Products.
From a theoretical perspective, this study expands the application of spatial analytical methods and geodetector interaction models in agricultural branding research, offering new empirical evidence for understanding how physical geography and socio-economic factors interact to shape agglomeration phenomena. From a managerial perspective, our findings provide clear guidelines for local governments and agricultural managers to prioritize transport and digital logistics investments, implement region-specific branding strategies, and design adaptive policies to reinforce sustainable agricultural competitiveness across diverse geographies.
(3) Future Research Directions
This study reveals the key influence of explicit drivers such as transportation and population on the spatial distribution pattern of National Famous, Special, Excellent, and New Agricultural Products, but there is still room for further research. The current study mainly focuses on explicit natural and economic variables, and in the future, the integration of comparative analysis and spatial econometric modeling can be adopted to determine the nonlinear driving mechanisms of multivariate coupling factors on the spatial agglomeration of branded agriculture. It is suggested to expand the international comparative research horizon, with a focus on the spatial competition and complementary relationship between National Famous, Special, Excellent, and New Agricultural Products and the characteristic agricultural products of the Association of Southeast Asian Nations (ASEAN) and the characteristic agricultural products under the framework of Regional Comprehensive Economic Partnership (RCEP) regional economic cooperation, and to further analyze the potential impact of the mutual recognition system of geographical indications on the reconstruction of cross-border agricultural value chains. This not only helps to identify the strategic positioning of Chinese agricultural products in the international market, but also provides a theoretical basis and policy reference for the construction of an agricultural brand development strategy for the global market. Regional synergy and diversified development are key paths to sustainable development in the future. Future work should also incorporate panel data to track dynamic shifts over time and validate the robustness of spatial patterns under changing policy and market conditions.
Additionally, future research could apply experimental and field-based methods to collect micro-level evidence on how farmers and local stakeholders adapt to branding and logistics innovations, enriching the theoretical framework with empirical case studies. This extended approach will allow other researchers to test the applicability of the current results in diverse ecological and socio-economic settings, fostering broader comparative understanding and policy relevance. The development of National Famous, Special, Excellent, and New Agricultural Products should give full play to regional comparative advantages and synergistic and complementary effects, so as to promote a national coordinated development pattern. For regions with better resource endowment, the extension of the industrial chain and branding should be promoted to realize the upgrading of the value chain; for ecologically fragile or geographically remote regions, green, organic, and geographical indication agricultural products with special characteristics should be developed under the premise of protecting the ecology, and take the path of differentiation and high value-added development. The development of National Famous, Special, Excellent, and New Agricultural Products can make use of modern information technologies such as big data, remote sensing monitoring, and geographic information systems to dynamically manage and optimize the spatial distribution of agricultural products, suitability zones, and supply chain nodes, which will also become important supports for the realization of sustainable development.
Author Contributions
S.O.: Conceptualization; Data curation; Formal analysis; Resources; Software; Validation; Visualization; Review; Editing; Original draft. J.W.: Funding acquisition; Methodology; Supervision; Validation. All authors have read and agreed to the published version of the manuscript.
Funding
General Report on the Preliminary Research of the 15th Five-Year Plan for Agricultural and Rural Development in Guangxi (Grant NO: GXZC2024-C3-005884-JZZB), Research on Rural Construction and Governance and the Construction of Target index System for Rural Development during the 15th Five-Year Plan Period (Grant NO: GXZC2024-C3-005884-JZZB).
Institutional Review Board Statement
Not applicable.
Data Availability Statement
Data are contained within the article.
Conflicts of Interest
The authors declare no conflicts of interest.
References
- Amanuel, H.; Tewodros, T.; Bereket, G.; Tesfay, G.; Zewold, W. The Impact of Tenure Security and Agricultural Diversity on Food Security. Agrekon 2024, 63, 240–256. [Google Scholar]
- Deuss, A.; Watson, A.; Bois, D.O. Environmental Sustainability Initiatives Related to Highly Traded Agricultural Commodities; OECD Food, Agriculture and Fisheries Papers 220; OECD Publishing: Paris, France, 2025. [Google Scholar]
- Shikhova, O.; Selina, M.; Barinova, O. Experience in Branding Producers-Processors of Agricultural Products to Ensure Food Security in the Region. BIO Web Conf. 2020, 27, 00031. [Google Scholar] [CrossRef]
- Kumar, A.; Prakash, G.; Kumar, G. Does Environmentally Responsible Purchase Intention Matter for Consumers? A Predictive Sustainable Model Developed Through an Empirical Study. J. Retail. Consum. Serv. 2021, 58, 102270. [Google Scholar] [CrossRef]
- Fu, S.; Hu, X.; Zhang, C.; Li, Z. A Study on the Influence of Production and Environmental Information Transparency on Online Consumers’ Purchase Intention of Green Agricultural Products. Br. Food J. 2025, 127, 1461–1479. [Google Scholar] [CrossRef]
- Colglazier, W. Sustainable Development Agenda: 2030. Science 2015, 349, 1048–1050. [Google Scholar] [CrossRef]
- Guggisberg, S. Transparency in the Activities of the Food and Agriculture Organization for Sustainable Fisheries. Mar. Policy 2022, 136, 104498. [Google Scholar] [CrossRef]
- Guareschi, M.; Mancini, M.C.; Arfini, F. Geographical Indications, Public Goods and Sustainable Development Goals: A Methodological Proposal. J. Rural Stud. 2023, 103, 103122. [Google Scholar] [CrossRef]
- TRIPS. Agreement on Trade-Related Aspects of Intellectual Property Rights. In Marrakesh Agreement Establishing the World Trade Organization; World Trade Organization: Geneva, Switzerland, 1994; pp. 1–73. [Google Scholar]
- Rackl, J.; Menapace, L. Coordination in Agri-Food Supply Chains: The Role of Geographical Indication Certification. Int. J. Prod. Econ. 2025, 280, 109494. [Google Scholar] [CrossRef]
- Čagalj, M.; Grgić, I.; Paštar, M. Potential of Agricultural and Food Products of Bosnia and Herzegovina for Protection with EU Quality Labels. MESO Prvi Hrvatski Časopis o Mesu 2021, 23, 329–335. [Google Scholar]
- Zou, J. Introduction to Japan’s Geographical Indication Protection System. Chin. Trademark 2022, 58–63. [Google Scholar]
- Chen, R.N.; Yang, T. Practices of U.S. Agricultural Landmark Protection and Implications for China. Anhui Agric. Sci. 2017, 45, 200–203. [Google Scholar]
- Lin, Q.C.; Zheng, Y.; Yu, J.H. A Study on the Competitiveness and Complementarity of China’s Agricultural Trade with Other RCEP Member Countries. Asia-Pac. Econ. 2021, 75–81+151. [Google Scholar]
- Huang, Y.P.; Zhang, F.; Xie, X.X.; Lei, Q.Y.; Yao, W.Y. Discussion on the Development Effectiveness and Path of National Famous, Special, Excellent and New Agricultural Products. Agric. Prod. Qual. Saf. 2021, 14–17. [Google Scholar]
- Yang, Y. Hulin Linden Honey Is Included in the “National List of Famous, Specialty and New Agricultural Products”. Bee J. 2024, 44, 63. [Google Scholar]
- Wang, S.; Liang, Y.; Yang, S.; Xiang, C.; Wang, G. Research on the Protection of Geographical Indication Agricultural Products at Home and Abroad. Qual. Saf. Agric. Prod. 2025, 26–29. [Google Scholar]
- Zhang, N.F. Henan Experience and Suggestions for High Quality Development of National Famous, Special, Excellent and New Agricultural Products. China Compr. Agric. Dev. 2024, 54–55. [Google Scholar]
- Yang, E.; Yang, F.; Li, S.; Li, D. Development Status and Prospect of “National Famous, Specialty, Excellent and New Agricultural Products” in Wenshan Prefecture. Qual. Agric. Prod. 2025, 84–86. [Google Scholar]
- Wang, X. On the Protection Mode of Geographical Indications in China. Intellect. Prop. 2019, 59–68. [Google Scholar]
- Xiang, Y.; Yue, B.; Wang, C.; Wang, Q.; Sun, Y.; Zhang, H.; Xu, X. Discussion on the Development Practice and Strategy of Famous, Specialty and New Agricultural Products in Jilin Province. China Agric. Technol. Ext. 2024, 40, 5–7. [Google Scholar]
- Chen, Y.; Lai, L.; Wang, H.; Qin, G.; Wei, Y.; He, J. Constraints and Promotion Strategies of Industrialization Development of National Famous, Special, Excellent and New Agricultural Products—Taking the Example of Muge White Jade Cane Industry. Anhui Agric. Sci. 2025, 53, 196–199+226. [Google Scholar]
- Shi, H. Agricultural Industrialization and the Development of Characteristic Agriculture—Taking the Development of Anxi Tea Industry as an Example. Probl. Agric. Econ. 2007, 30–33. [Google Scholar]
- García Vega, D.; Dumas, P.; Prudhomme, R.; Kremen, C.; Aubert, P.M. A Safe Agricultural Space for Biodiversity. Front. Sustain. Food Syst. 2024, 8, 1328800. [Google Scholar] [CrossRef]
- Mao, Z.; Li, L. Measurement of Spatial Patterns and Its Applications; Science Press: Beijing, China, 2004. [Google Scholar]
- Han, Z.; Tong, Y.; Wang, G. Spatial-Temporal Differentiation and Evolution Trend of Marine Ecological Security in China. Sci. Geogr. Sin. 2022, 42. [Google Scholar]
- Zhu, X.; Liu, K. Spatio-Temporal Characteristics and Influencing Factors of Green Technology Innovation in Chinese Agriculture. J. Xi’an Univ. Technol. 2025, 1–12. [Google Scholar]
- Lorenz, M.O. Methods of Measuring the Concentration of Wealth. Publ. Am. Stat. Assoc. 1905, 9, 209–219. [Google Scholar] [CrossRef]
- Jiang, Y.; Li, H.Y.; Jiao, H.B. Evolutionary Characteristics and Spatial Distribution Pattern of Water Use Structure in the Yellow River Basin of Shandong Province. People’s Yellow River 2025, 47, 81–86. [Google Scholar]
- Lin, J.; Dong, L.; Feng, J. Spatial Distribution and Influencing Factors of Geographical Indication Agricultural Products in Yunnan Province. Yunnan Geo-Environ. Res. 2024, 36, 1–11. [Google Scholar]
- Huang, L.; Chen, Q.; Feng, J. Spatial-Temporal Characteristics and Driving Mechanisms Analysis of Habitat Quality in Shenfu Mining Area Based on Geographical Detector. J. Xi’an Univ. Technol. 2023, 39, 451–460. [Google Scholar]
- Wang, J.; Xu, C. Geographical Detector: Principle and Prospective. Acta Geogr. Sin. 2017, 72, 116–134. [Google Scholar]
- Yang, R.; Yang, H.; Yang, K. Spatio-Temporal Evolution Characteristics and Influence Mechanism of High Quality Agricultural Development in the Yellow River Basin of Shaanxi Province. J. China Agric. Univ. 2021, 26, 141–152. [Google Scholar]
- Tian, Y.; Zhang, K. Analysis of Spatial Distribution and Influencing Factors of Geographical Indications of Agricultural Products in Shandong Province. Sci. Ind. 2023, 23, 8–14. [Google Scholar]
- Ye, M.; Li, X. Chinese-Style Agricultural and Rural Modernization as One-Research on Theoretical Mechanism, Level of Synergistic Development and Its Driving Factors. J. Sichuan Agric. Univ. 2025, 1–16. [Google Scholar]
- Gao, Q.; Chen, S.; Wang, H. A Study on the Spatio-Temporal Evolution and Driving Factors of Smart Farms in China. China Agric. Resour. Reg. 2024, 1–13. [Google Scholar]
- Zhao, Z.; Zhao, Z.; Zhang, P. A New Method for Identifying Industrial Clustering Using the Standard Deviational Ellipse. Sci. Rep. 2023, 13, 578. [Google Scholar] [CrossRef] [PubMed]
- Pauliuk, S. Decent Living Standards, Prosperity, and Excessive Consumption in the Lorenz Curve. Ecol. Econ. 2024, 220, 108161. [Google Scholar] [CrossRef]
- Shi, P.; Deng, L.; Niklas, K.J. Rotated Lorenz Curves of Biological Size Distributions Follow Two Performance Equations. Symmetry 2024, 16, 565. [Google Scholar] [CrossRef]
- Luo, W.B.; Jiang, L.; Lei, J.Q.; Xie, H.L. Distribution Pattern and Influencing Factors of National Forest Villages in Hunan Province. China Agric. Resour. Reg. 2022, 43, 33–42. [Google Scholar]
- Zhang, C.; Du, Z.; Zhang, S.; Yan, X. Spatial Differentiation of National Geographic Indication Agricultural Products in Liaoning Province Based on ArcGIS and GD. China Agric. Resour. Reg. 2023, 44, 253–264. [Google Scholar]
- Xu, X.; Dong, Y.; Wang, Y.; Yang, Y.; Yang, N.; Xu, C.D. Exploration of the Northern Boundary of China’s Terrestrial Tropics Based on Geographical Detector. J. Geogr. Sci. 2018, 28, 31–45. [Google Scholar] [CrossRef]
- Wang, H.; Gao, J.; Hou, W. Quantitative Attribution of Soil Erosion in Different Geomorphic Pattern Type Areas of Karst Based on Geoprobe. J. Geogr. Sci. 2019, 29, 271–286. [Google Scholar] [CrossRef]
- He, W.Q.; Ma, D.; Liu, X.J. Analysis of Land Use Change and Its Driving Force Mechanism in the Coastal Zone of Haikou City. Geogr. Sci. 2025, 45, 675–685. [Google Scholar]
- Fan, L.H.; Wang, P.F.; Zhang, G.H. Characteristics of Spatial and Temporal Distribution of Geographic Indication Agricultural Products and Its Influencing Factors. World Agric. 2020, 120–127. [Google Scholar]
- Xia, L.; Jiang, D.; Sui, W. Spatial Distribution and Income-Enhancing Effects of Geographic Indications of Agricultural Products in China. Ind. Econ. Rev. 2015, 6, 78–91. [Google Scholar]
- Yi, S.H.; Nie, X.W. Analysis of Regional Distribution Status of Agricultural Products Wholesale Market in China and Its Improvement—Based on Population Density Perspective. Bus. Econ. Manag. 2016, 17–24+45. [Google Scholar]
- Zheng, L.; Ma, Q.; Jiang, T.; Liu, X.; Mou, J.; Wang, C.; Lan, Y. Analysis of Spatio-Temporal Evolution Pattern of Grain Production and Influencing Factors in Sichuan Province. Smart Agric. 2025, 7, 13–25. [Google Scholar]
- Zhan, S.W.; Song, X. Research on the Development Mode and Spatial Distribution Characteristics of Characteristic Towns in Shaanxi Province. China Agric. Resour. Reg. 2021, 42, 16–22. [Google Scholar]
- Liu, J.; Huang, Y.K.; Wang, Y.H.; Wu, M. Spatial and Temporal Distribution Characteristics and Human Causes of Geographical Indication Agricultural Products in Hunan Province. Econ. Geogr. 2022, 42, 169–176+215. [Google Scholar]
- Liu, D.W.; Huang, W.F. Typhoon Starting Point Simulation Based on Three-Dimensional Kernel Density Function. J. Hefei Univ. Technol. 2020, 43, 103–107. [Google Scholar]
Disclaimer/Publisher’s Note: The statements, opinions and data contained in all publications are solely those of the individual author(s) and contributor(s) and not of MDPI and/or the editor(s). MDPI and/or the editor(s) disclaim responsibility for any injury to people or property resulting from any ideas, methods, instructions or products referred to in the content. |
© 2025 by the authors. Licensee MDPI, Basel, Switzerland. This article is an open access article distributed under the terms and conditions of the Creative Commons Attribution (CC BY) license (https://creativecommons.org/licenses/by/4.0/).