Article

Determination of Soft Partitioning Thresholds for Reservoir Drought Warning Levels Under Socio-Hydrological Drought

1
Jiangxi Academy of Water Science and Engineering, Nanchang 330029, China
2
Jiangxi Province Key Laboratory of Flood and Drought Disaster Prevention, Nanchang 330029, China
3
Jiangxi Provincial Technology Innovation Center for Ecological Water Engineering in Poyang Lake Basin, Nanchang 330029, China
4
The National Key Laboratory of Water Disaster Prevention, Hohai University, Nanjing 210098, China
*
Author to whom correspondence should be addressed.
Agriculture 2025, 15(13), 1408; https://doi.org/10.3390/agriculture15131408
Submission received: 6 May 2025 / Revised: 19 June 2025 / Accepted: 26 June 2025 / Published: 30 June 2025
(This article belongs to the Section Digital Agriculture)

Abstract

The failure of traditional drought indices to capture the dynamic supply–demand imbalance in socio-hydrological systems hinders proactive water management and necessitates novel assessment frameworks. The reservoir drought warning water level, serving as a dynamic threshold indicating supply–demand imbalance, provides a critical basis for drought early warning. From a socio-hydrological drought perspective, this study develops a framework for determining staged and graded soft partition thresholds for reservoir drought warning water levels, encompassing three key stages: water stress analysis, phase classification, and threshold determination. First, water demands for the ecological, agricultural, and domestic sectors were quantified based on hydrological analysis and official operational rules. Second, an optimized KPCA-Fisher model delineated the intra-annual supply–demand dynamics into distinct periods. Thirdly, the soft partition thresholds were formulated by coupling these multi-sectoral demands with water deficit rates using a triangular membership function. Applied to the Xianan Reservoir, the framework yielded distinct drought warning thresholds for the identified main flood, critical demand, and dry seasons. Validation against historical droughts (2019 and 2022) confirmed that these soft thresholds more accurately tracked the drought evolution process compared to traditional hard partitions. Furthermore, a sensitivity analysis identified the ecological water demand methodology as a key factor influencing the thresholds, particularly during the critical demand period. The proposed framework for determining staged and graded reservoir drought warning water levels better reflects the complexity of socio-hydrological systems and provides a scientific basis for refined reservoir drought early warnings and management under changing environments.

1. Introduction

In recent years, the dual effects of global climate change and high-intensity human activities have significantly altered the spatiotemporal characteristics of the hydrological cycle [1,2,3]. Globally, drought events are exhibiting an increasing trend in frequency, intensity, and duration [4,5,6], posing severe challenges to regional water resource management and ecological security [7], with particular prominence in monsoon regions. For instance, the extreme drought in the Yangtze River Basin in 2022 caused the minimum water surface area of Poyang Lake connected to the river to shrink to 19.5% of its multi-year average [8]. Reservoirs, as crucial infrastructure for regulating runoff [9], face greater uncertainties in drought management under such changing environments.
The reservoir drought warning water level serves as a fundamental parameter for reservoir drought early warning [10,11]. It is typically defined as a critical threshold of the reservoir storage level; when the actual water level falls to or below this value, it indicates that the reservoir has entered a drought state or faces potential water scarcity risk, necessitating response measures. Drought warning thresholds are commonly determined using methods such as the constant threshold and variable threshold approaches [10,12]. However, most existing methods remain unidimensional, often neglecting the influence of human activities and multi-dimensional water demands on threshold determination [13,14]. Consequently, current methods for establishing drought warning water levels fail to adequately account for the complexity and multiple driving factors of socio-hydrological drought, particularly the interactions between human activities and hydrological processes. Socio-hydrology focuses on the dynamic interactions between human societies and water systems [15,16], analyzing hydrological cycle processes influenced by human activities [17,18] and emphasizing the profound impacts of anthropogenic drivers such as land-use change, water conservancy projects, and urbanization on hydrological processes [19]. Socio-hydrological drought is considered a state of water scarcity exacerbated by the coupling of human activities and hydrological processes [20]. For example, increased agricultural water demand, land-use changes, and water resource management measures can significantly influence drought occurrence and development through feedback mechanisms [17]. Research by Rachunok and Fletcher [20] showed that urban drought can increase water affordability burdens through an “infrastructure lock-in” effect, causing socio-economic imbalance; Liu et al. [21], through a case study of the Shimen Reservoir basin in Taiwan, demonstrated how human activities can intensify drought risk via the over-exploitation of water resources. This study defines socio-hydrological drought as a state of water scarcity exacerbated by the coupling of human activities and hydrological processes, characterized by a dynamic imbalance among ecological, agricultural, and socio-economic water demands. The reservoir drought warning water level threshold, a critical value for drought warning based on reservoir storage indicators, is influenced by both natural water supply and human water use. Examining the reservoir drought warning water level threshold from a socio-hydrological perspective allows for a more comprehensive understanding of how human activities exacerbate drought risk by altering the water supply–demand balance, thereby laying the foundation for constructing more adaptive and practical early warning systems.
The determination of reservoir drought warning water levels necessitates comprehensive consideration of the reservoir’s operational constraints and multi-dimensional downstream water demands, including ecological baseflow, agricultural irrigation, industrial water intake, and domestic water supply. These demands exhibit significant temporal dynamics, and the structure and magnitude of demand vary considerably across different regions and seasons. Taking Jiangxi Province in the hilly region of Southern China as an example, ecological water demand may relatively increase during the main flood season (April–June), whereas during the hot and less rainy months of July and August, agricultural irrigation demand rises sharply, reaching its annual peak. Such drastic intra-annual fluctuations in water demand structure render the traditional, fixed, annual drought warning water level threshold approach prone to systematic bias, making it difficult to accurately reflect the actual supply–demand pressure faced by the reservoir in different periods, potentially leading to false alarms or missed warnings. To address this, China promulgated the “Methods for Determining Drought Warning Water Levels and Flow Rates” [22] in 2011, promoting the standardization process for reservoir drought early warning. Within this framework, Chinese scholars have enhanced the adaptability of reservoir drought warning indicators through methods such as multi-objective optimization [23,24,25] and risk analysis [26,27,28]. The international academic community also pays close attention to the role of reservoirs in drought monitoring and management. Authoritative bodies like the World Meteorological Organization (WMO) and the Global Water Partnership (GWP), in their “Handbook of Drought Indicators and Indices”, have listed reservoir storage as one of the key drought monitoring indicators [29]. Research teams have proposed the Integrated Reservoir Drought Index (IRDI), based on reservoir storage and evaporation rates, to assess hydrological drought in global reservoirs [30], while other studies utilize the Reservoir Area Drought Index (RADI), based on changes in reservoir surface area, for global hydrological drought monitoring [31]. However, existing methods for determining reservoir drought warning water levels still suffer from the following shortcomings: (1) Most studies employ relatively simple and fixed methods for intra-annual partition, failing to adequately capture the dynamic changes in annual water demand, resulting in partition outcomes that do not sufficiently reflect the actual supply–demand situation with necessary refinement [10,32,33]. (2) Traditional hard partition (fixed periods) leads to abrupt threshold changes at the boundaries between adjacent periods, which contradicts the gradual response patterns inherent in socio-hydrological systems [34]; (3) there is a lack of a unified framework capable of systematically integrating multi-source water demand information, scientifically optimizing partition, and achieving smooth threshold transitions. Therefore, there is an urgent need to develop a method for determining reservoir drought warning water levels that can accommodate intra-annual water demand dynamics, scientifically delineate periods, and implement smooth threshold transitions.
To overcome these specific limitations, this study develops and validates an integrated framework for determining staged and graded soft partition thresholds for reservoir drought warning water levels. This framework is designed to directly address the aforementioned gaps: (1) It employs a semi-supervised Kernel Principal Component Analysis (KPCA) [35,36] and Fisher optimal segmentation [37] (hereafter referred to as KPCA-Fisher) model to replace simplistic, fixed partitioning with a data-driven, scientific delineation of intra-annual periods. (2) It utilizes a triangular membership function to formulate “soft” thresholds, effectively solving the problem of abrupt changes at partition boundaries inherent in traditional “hard” partitions; and (3) it cohesively integrates multi-source water demand analysis, optimized partitioning, and smooth threshold transitions into the unified methodology that is currently lacking. The framework’s effectiveness and precision are demonstrated through a case study of the Xianan Reservoir in Southern China, providing robust scientific support for refined reservoir drought early warning and management.
The remainder of this paper is structured as follows: Section 2 introduces the study area, materials, and methods. Section 3 presents the results, including monthly water stress analysis (Section 3.1), drought warning water level phase classification (Section 3.2), threshold determination (Section 3.3), and validation (Section 3.4); Section 4 discusses the impact of threshold smoothing on drought process characterization and the sensitivity of drought warning water level thresholds to ecological water demand; Section 5 provides the conclusions.

2. Materials and Methodology

2.1. Study Area

The Xianan Reservoir is located in Yihuang County, Jiangxi Province, China, at coordinates 116°20′15″ E and 27°22′37″ N. The dam site is situated on the Yi River, an upstream section of the Yihuang River, which is a tributary of the Lin River within the Fu River system. The catchment area controlled by the dam site is 166 km2. With a total storage capacity of 39.02 million m3, it is a medium-sized reservoir providing comprehensive benefits including flood control, power generation, irrigation, and water supply. Downstream, the reservoir protects a population of 118,000 people and 40.7 million m2 of cultivated land, as well as critical infrastructure such as a provincial highway, high-voltage power transmission lines, and communication optical cables. The geographical location and river system distribution of the reservoir were mapped using ArcGIS (Version 10.2, Esri, Redlands, CA, USA) and are shown in Figure 1. The normal storage level of the reservoir is 195.0 m, corresponding to a storage capacity of 27.80 million m3; the dead water level is 182.0 m, corresponding to a storage capacity of 5.70 million m3. The designated flood season for the reservoir spans from 1 April to 30 September each year. This is further divided into the main flood season (1 April to 30 June) and the post-flood season (1 July to 30 September). The flood limit water level is set at 193 m during the main flood season and 195 m during the post-flood season. Currently, the Xianan Reservoir does not have explicitly defined drought warning water levels.

2.2. Data

This study is based on a comprehensive set of hydrological, meteorological, and water demand datasets. Key observational data, including historical streamflow, precipitation, and reservoir water levels, were obtained from the Jiangxi Provincial Hydrological Monitoring Center through a formal application process. Publicly available potential evapotranspiration (PET) data were also incorporated [34]. A detailed summary of all datasets, including station names, data types, and periods of record, is presented in Table 1.

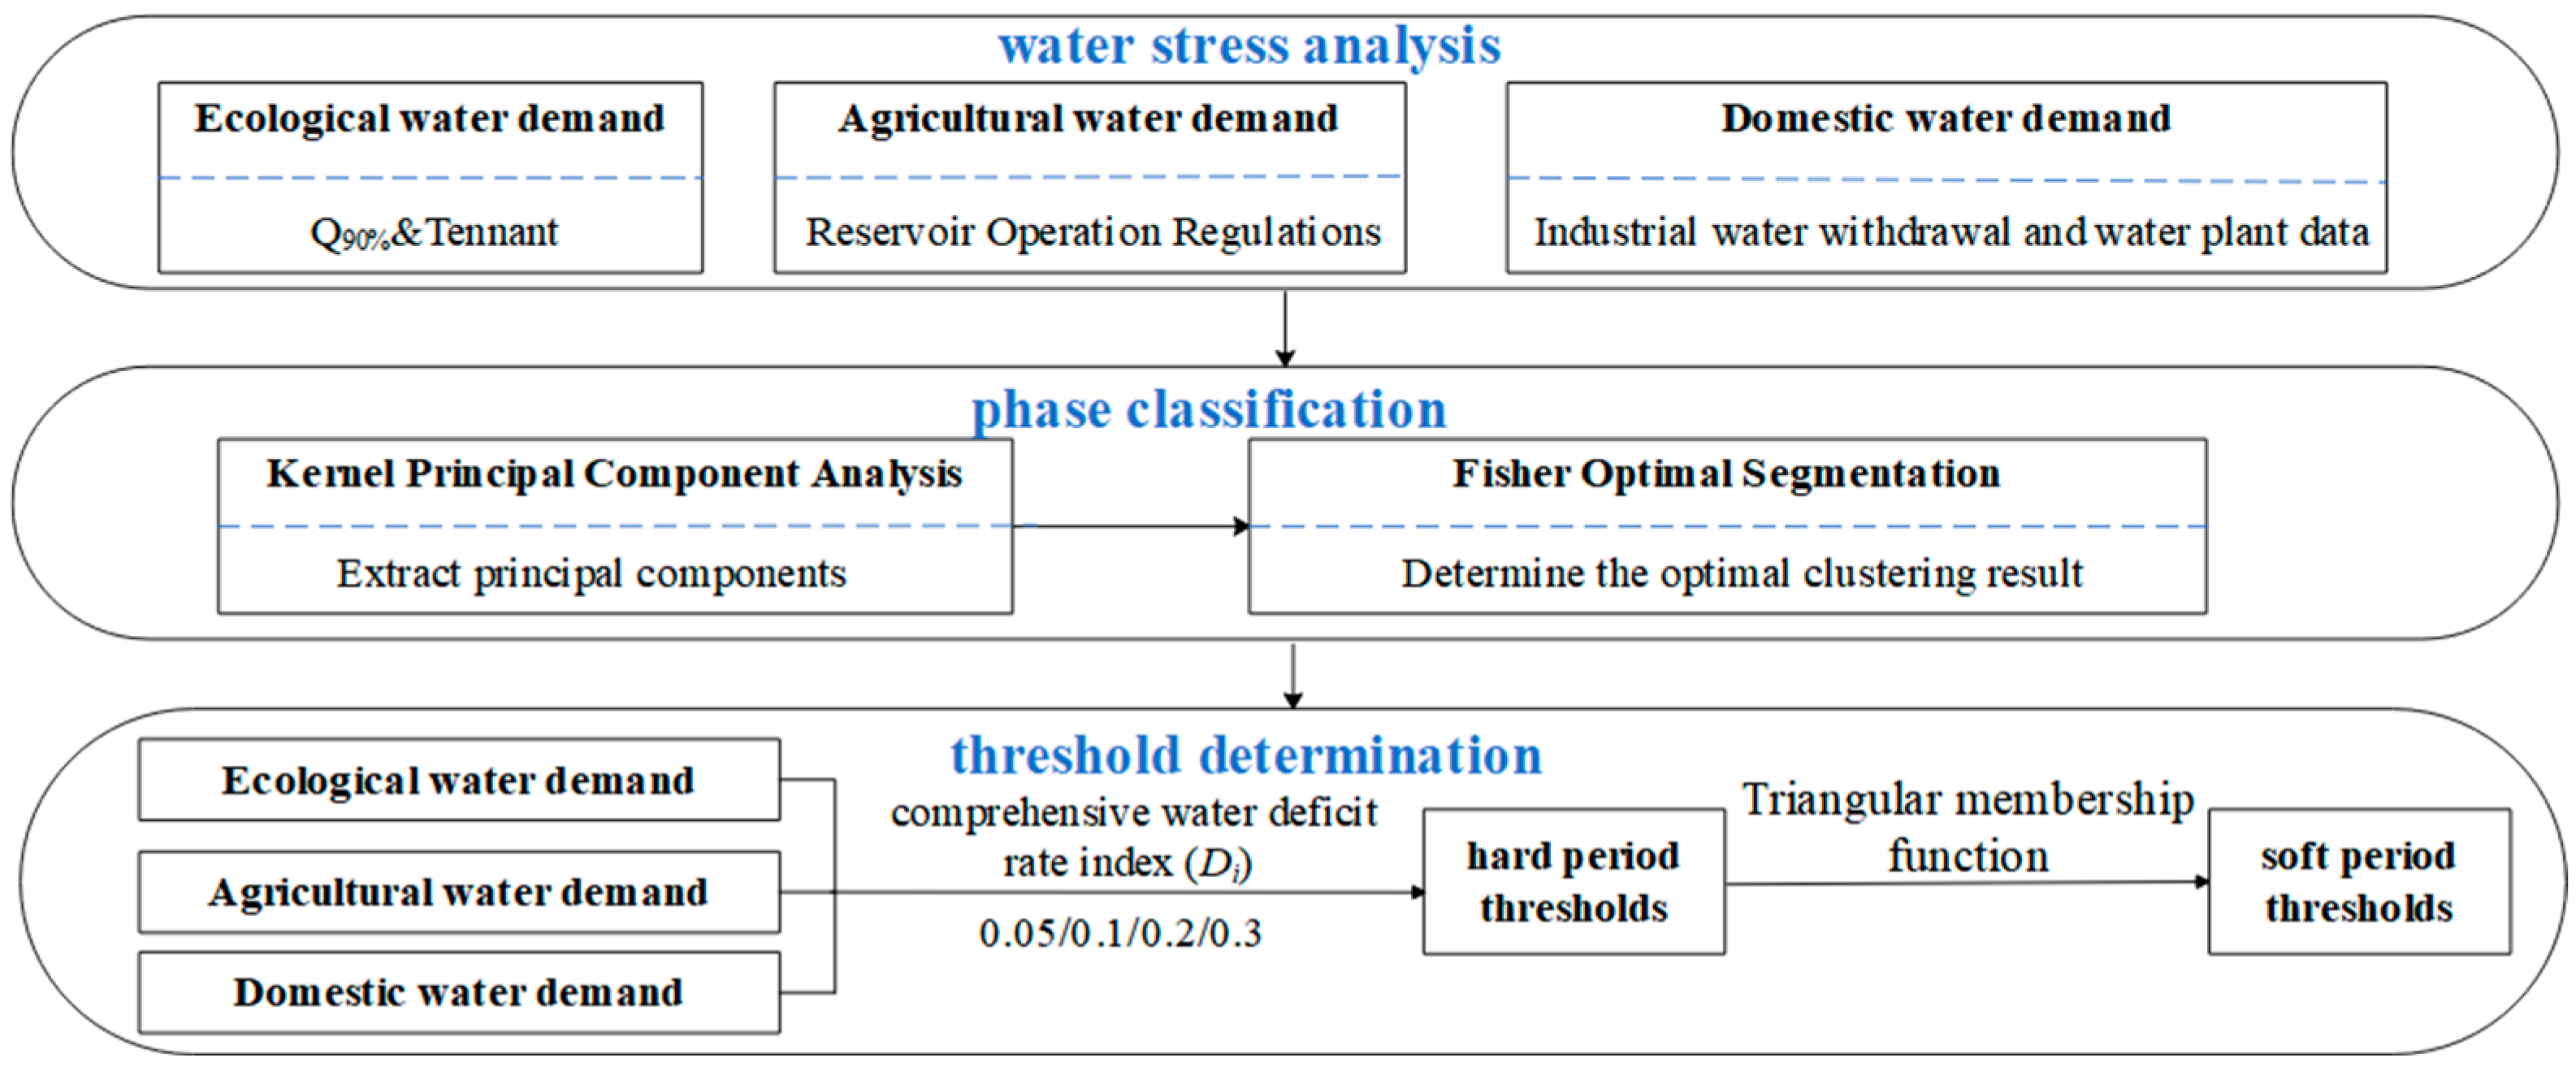
2.3. Method for Determining Staged and Graded Reservoir Drought Warning Water Levels

From a socio-hydrological drought perspective, this study proposes a framework for determining staged and graded soft partition thresholds for reservoir drought warning water levels. This framework comprises three key stages: water stress analysis, phase classification, and threshold determination (Figure 2):
(1) Determine the monthly water demands for three primary sectors, which are calculated as follows:
a. Ecological water demand: Determined by comprehensively comparing methods such as the frequency curve method (Q90%) and the Tennant method [38].
b. Agricultural water demand: Determined based on reservoir operation rules.
c. Domestic water demand: Determined based on field surveys.
(2) Using the month as the minimum unit for classification, a semi-supervised phase classification model based on Kernel Principal Component Analysis (KPCA) and Fisher’s optimal partitioning (abbreviated as KPCA-Fisher) is constructed. The optimal intra-annual classification is determined through optimization of the Gaussian Radial Basis Function (RBF) kernel parameter σ and evaluation using the Calinski–Harabasz index (CH) [39].
(3) Staged and graded drought warning water level thresholds are determined by coupling multi-objective water demands with the downstream comprehensive water deficit rate index (Di). This process first yields “hard partition” thresholds, defined as discrete water levels for distinct drought grades. To achieve a more realistic, smooth transition, these are then converted into “soft partition” thresholds, which represent gradual transitional zones, by introducing a triangular membership function.

2.3.1. Water Stress Analysis

This study analyzes the primary downstream water demands on a monthly time scale. A key operational context, stipulated in the “Xianan Reservoir Operation Rules”, is that tailwater released after power generation can be subsequently utilized for both agricultural and ecological purposes. This study therefore quantifies the specific demands for these two sectors, alongside domestic water demand.
The ecological water demand was determined in accordance with China’s national standard (SL/T 712-2021) [40], with the final value established through a comparative analysis of standard methodologies to ensure its suitability for the local context. Specifically, both the Q90% frequency method, which identifies the flow exceeded 90% of the time, and the Tennant method [38], which recommends specific percentages of the mean monthly flow, were evaluated. Following the comparison, the results derived from the Tennant method’s “poor” condition recommendation were adopted. The agricultural water demand, corresponding to an 85% irrigation guarantee rate, was sourced directly from the official “Xianan Reservoir Operation Rules”. Lastly, the domestic water demand was quantified based on recent (2020–2024) actual water use data, which were obtained from field surveys involving household interviews and analysis of water supply statistical reports.

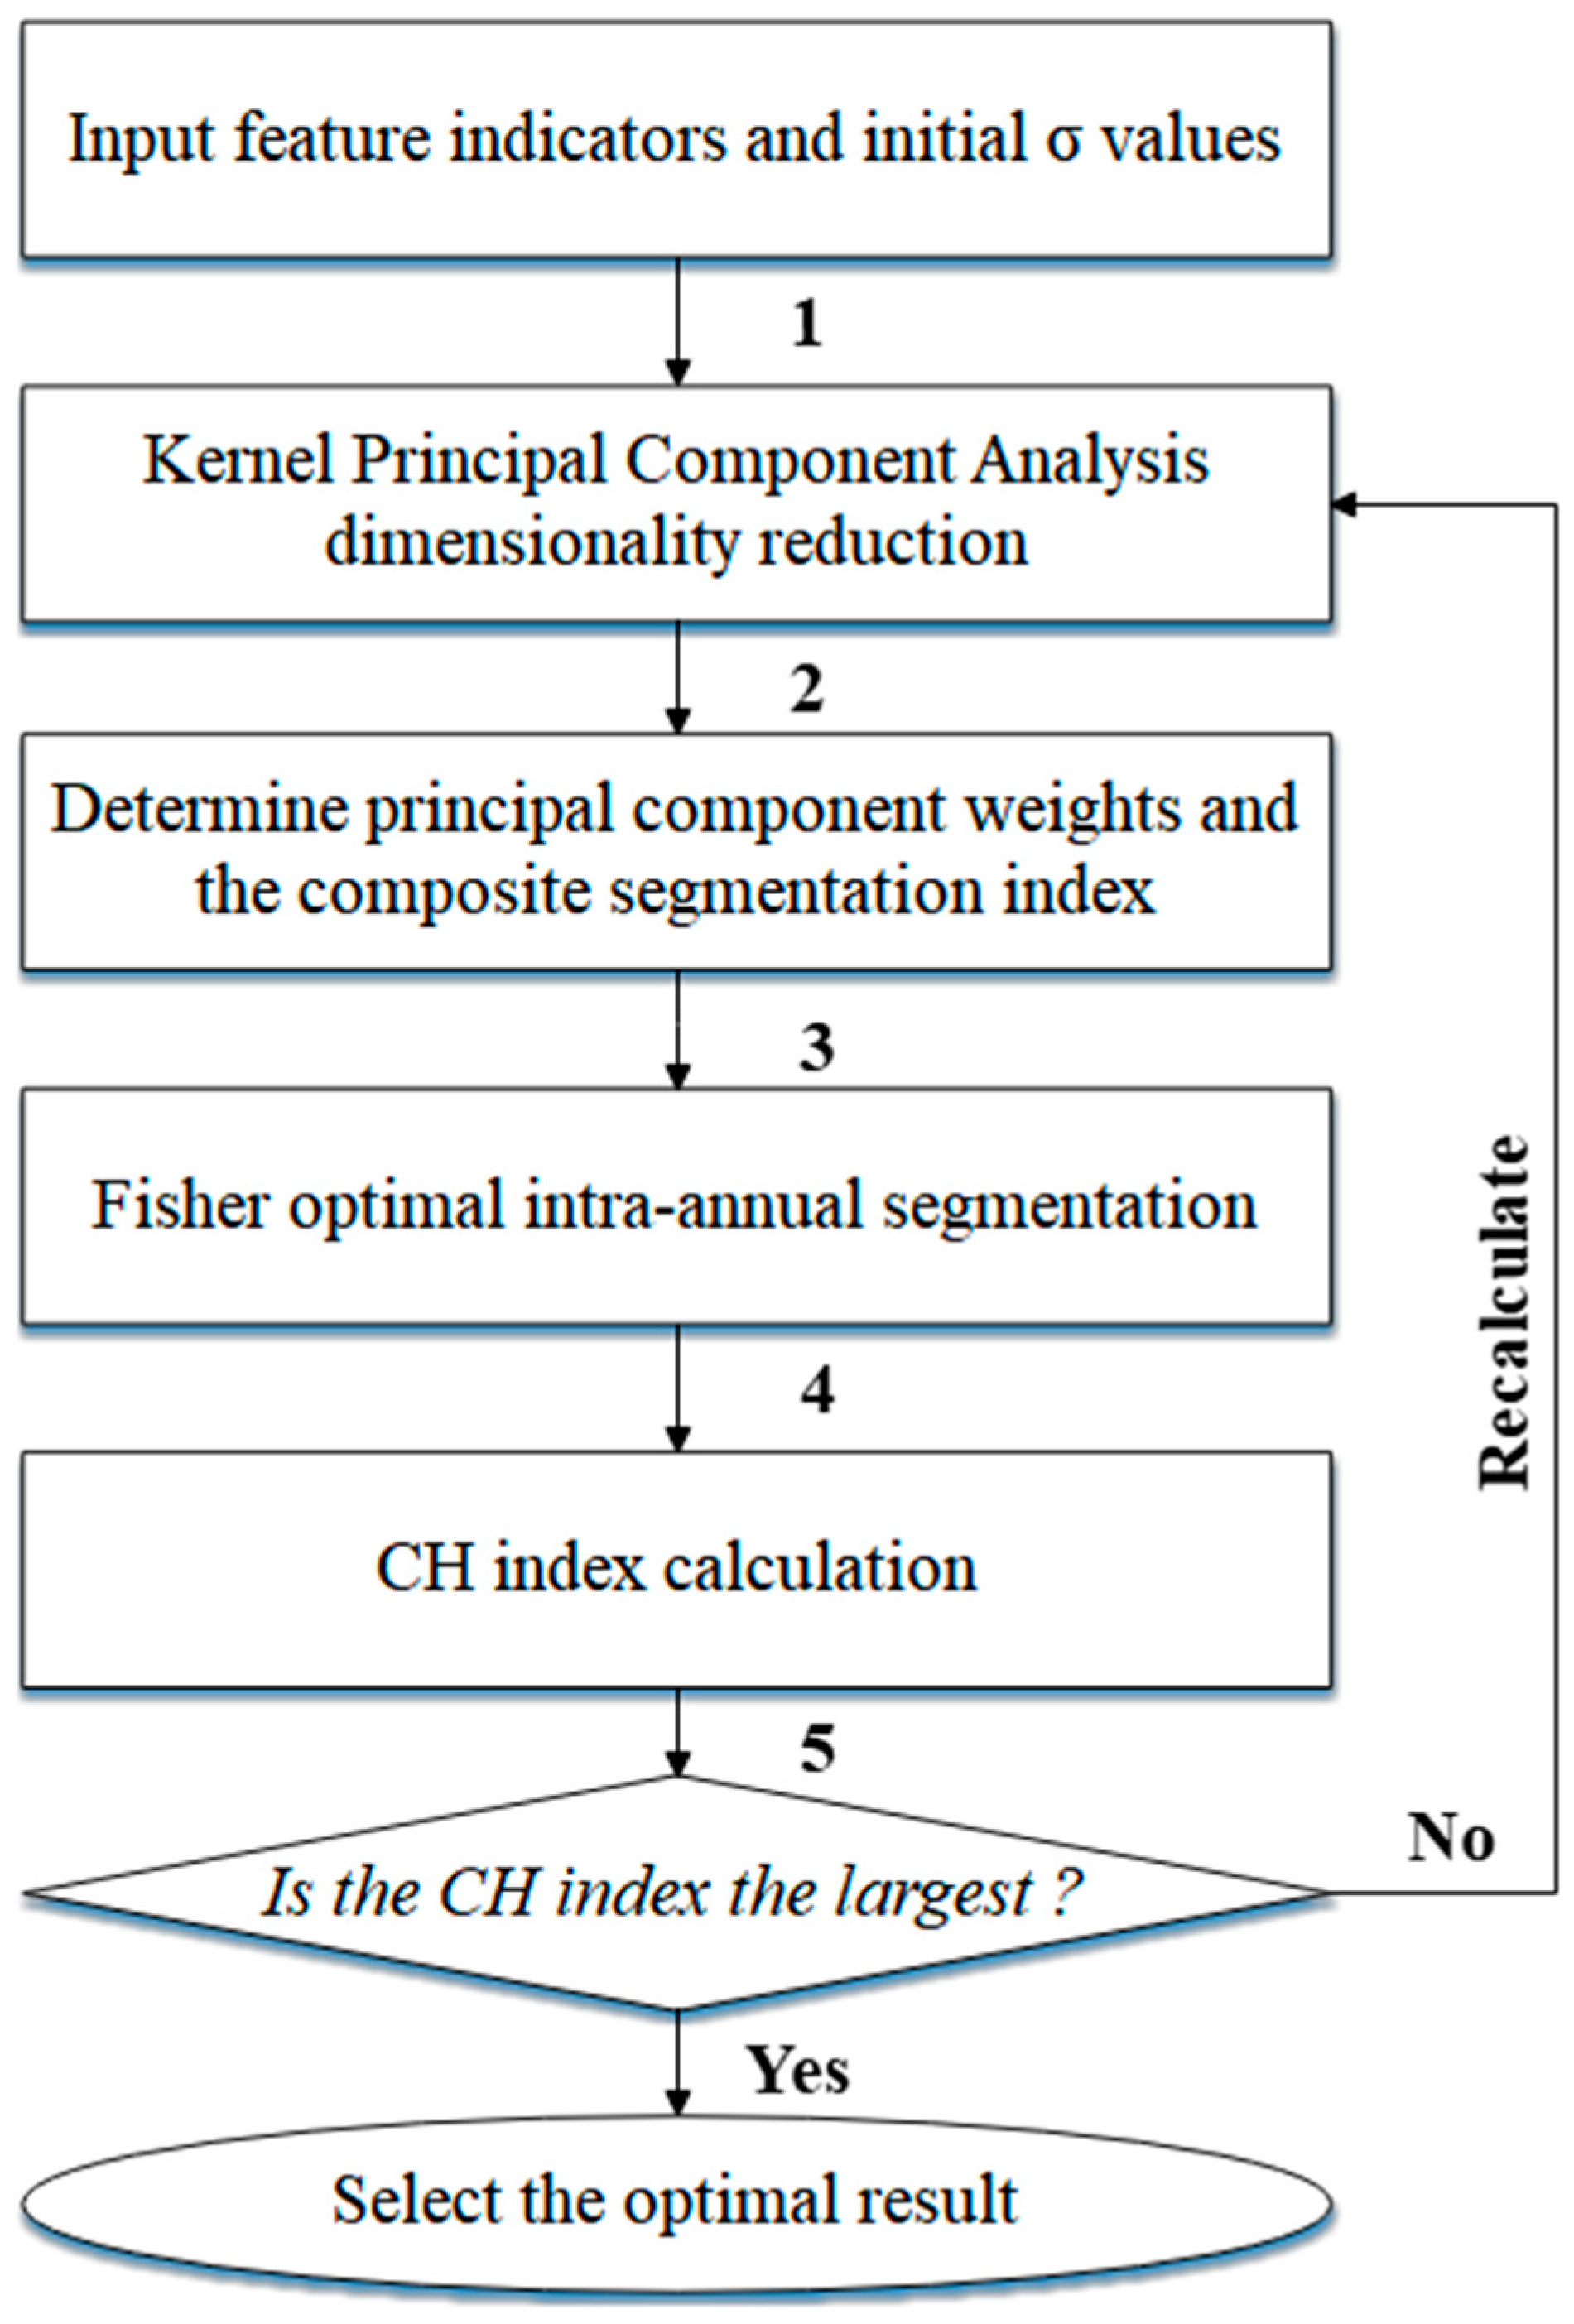
2.3.2. Semi-Supervised Phase Classification Based on KPCA-Fisher

To adequately capture the dynamic variations in water supply and demand across different intra-annual periods under socio-hydrological drought, this study proposes a semi-supervised phase classification model based on KPCA-Fisher. This model performs intra-annual classification with the month as the minimum unit. Given the pronounced non-linear dynamics inherent in socio-hydrological systems, conventional linear methods such as PCA [41] are inadequate for accurately classifying drought stages. To overcome this limitation, this study employs the KPCA-Fisher approach, which excels at handling non-linear data [42]. This method allows for a more robust analysis of intra-annual water supply–demand dynamics, accommodating the system’s intrinsic hydrological and social complexity.
The quality of this process hinges on the optimal selection of KPCA parameters. Therefore, the Calinski–Harabasz (CH) index [39] is used to objectively evaluate and select the best parameters, refining the approach into a semi-supervised algorithm. This data-driven “supervision” by the CH index avoids the subjective bias of pre-labeled data. The CH index evaluates clustering quality by measuring the ratio of between-cluster to within-cluster variance; thus, a maximum CH value identifies the optimal classification, defined by periods (clusters) that are both maximally separated and internally compact. The formula is as follows:
B k = i = 1 k n i μ i μ 2
W k = i = 1 k x j C i x j μ i 2 .
C H k = B k k 1 / W k n k
where B k is the between-cluster dispersion (sum of squares), representing the weighted sum of squared distances from each cluster centroid to the global centroid; W k is the within-cluster dispersion (sum of squares), k representing the sum of squared distances from each data point within a cluster to that cluster’s centroid, summed over all clusters; n is the number of clusters; n is the total number of samples (data points); n i is the number of samples in the ith cluster; μ i is the global centroid (center) of all samples; x j represents an individual sample belonging to the ith cluster; and C i is the set of samples in the i-th cluster.
In this study, five characteristic indicators for the Xianan Reservoir—monthly reservoir inflow, precipitation, PET, agricultural water demand, and initial monthly water storage level—were selected as input features for the phase classification calculations performed using the KPCA-Fisher model. Within this model, KPCA employs the Gaussian RBF kernel [43,44] for data mapping. Its mathematical expression is as follows:
K x , y = e x p x y 2 2 σ 2
where x and y represent characteristic index data points, ||x − y||2 is the squared Euclidean distance between two points, and σ is the kernel width parameter controlling the similarity calculation range between data points.
The main process of this period calculation model (Figure 3) was as follows:
(1) Input feature indicators and initial σ values
a. Feature indicators: Collect and organize the feature indicator data designated for phase classification.
b. Initial kernel parameters (σ): Initialize candidate values for the kernel parameter σ within a selected effective range (e.g., 0.01 to 10) to serve as input for the subsequent steps.
(2) KPCA dimensionality reduction
For each candidate σ value, perform KPCA using the RBF kernel function to map the high-dimensional feature data into a lower-dimensional space. Calculate the cumulative contribution rate of the principal components (PCs), and select PCs that retain a specified threshold of information content (e.g., >90%) to reduce data dimensionality while preserving the essential structural information.
(3) Determine principal component weights and the composite segmentation index
To objectively determine the importance of each selected principal component, the Entropy Weight Method [45] was employed. This method assigns weights based on the degree of dispersion in each component’s data; greater variance indicates more information content and thus a higher weight. Subsequently, compute a monthly composite segmentation index by calculating the weighted sum of these principal components for each month.
(4) Fisher optimal intra-annual segmentation
Apply Fisher’s optimal segmentation to the comprehensive phase index series to determine the optimal number and boundaries of intra-annual segments for the evaluated σ.
(5) CH calculation and optimal phase selection
Iterate the calculations across the defined effective range of σ. For each evaluated σ value, compute the corresponding CH for the resulting partition. From all the tested σ values, select the one that yields the maximum CH. The phase classification (clustering result) associated with this optimal σ value is determined to be the final optimal phase classification scheme.

2.3.3. Classification of Drought Warning Water Levels Based on Water Deficit Rate

The drought warning water levels of the Xianan Reservoir are comprehensively influenced by multiple natural and societal factors, including downstream water demand, reservoir inflow, evapotranspiration, and reservoir seepage. Consequently, determining these levels inevitably faces the challenge of managing numerous variable factors that are difficult to standardize or unify. Therefore, grounded in the principle of water balance and considering monthly water supply and demand conditions, this study proposes a downstream comprehensive water deficit rate index (Di) to quantify the overall water shortage and drought severity downstream of the reservoir. Di is defined as the ratio of the water supply deficit (the difference between water demand and the reservoir’s available water supply) to the total water demand. Essentially, factors such as reservoir storage volume, dead storage capacity, reservoir inflow, downstream water demand, reservoir surface evaporation, and reservoir seepage are integrated to calculate the Di, thereby providing a composite standard for assessing water deficit.
D i = 1 W h j , i W d e a d + W p , i W l o s s , i W r , i
W r , i = W a r g i , i + W e c o , i + W d o m , i
where Di represents the comprehensive water shortage rate downstream of the reservoir in month i; W h j , i represents reservoir storage volume corresponding to the drought warning water level for month i (104 m3); W d e a d represents reservoir dead storage capacity (104 m3); W p , i represents reservoir inflow during month i (104 m3); W r , i represents total downstream water demand during month i(unit: 104 m3); W l o s s , i represents reservoir water loss due to evaporation and seepage during month i (104 m3); W a r g i , i represents downstream agricultural water demand for month i (104 m3); W e c o , i represents downstream river channel ecological water demand for month i (104 m3); and W d o m , i represents downstream domestic water demand for month i (104 m3).
The reservoir storage threshold W h j , i for a specific drought level Di is derived from the previous equation. W h j , i is calculated as follows:
W h j , i = 1 D i × W r , i W p , i + W l o s s , i + W d e a d
It should be noted that the calculated reservoir drought warning storage volume W h j , i in this study should generally not be less than the dead storage volume ( W d e a d = 570 × 104 m3 for the Xianan Reservoir). If the calculated W h j , i falls below this value, the drought warning water level is set to the dead water level of 182.0 m.
The classification standards for water deficit rates presented in Table 2 are established based on a combination of national standards and the peer-reviewed literature. The specific basis for each category is as follows:
(1) The thresholds for agricultural and urban drought are adopted directly from China’s national standard, “Regional Drought Grade: GB/T 32135-2015” [46]. The standard specifies the following critical deficit rates for mild, moderate, severe, and extreme drought:
a. Agricultural drought: {0.05, 0.2, 0.35, 0.5}
b. Urban drought: {0.05, 0.1, 0.2, 0.3}.
(2) The thresholds for ecological water demand deficit—{0.2, 0.4, 0.6, 0.8}—are based on the findings from studies by Yan et al. [47,48].
(3) The thresholds for the composite deficit index, Di, are derived using a principle of conservativeness, by selecting the minimum corresponding deficit rate across the agricultural, urban, and ecological demands for each drought level. This results in the established Di thresholds of {0.05, 0.1, 0.2, 0.3}.
Based on the monthly drought warning water level thresholds for different drought levels and the phase classification results, a preliminary warning threshold for each phase and drought level is established by taking the maximum monthly threshold within that phase.
However, while this intra-annual phasing captures seasonality, the traditional hard partitioning can cause abrupt threshold changes at phase boundaries [49]. For instance, near the transitions (e.g., March/April, June/July, and October/November), minor water level fluctuations could trigger sudden shifts in drought classification, contradicting the typically gradual response of socio-hydrological systems. To address this, this study employs a triangular membership function to achieve a smooth transition of warning thresholds across phase boundaries. Specifically, a 31-day transition period is defined, centered on the inter-phase boundary and extending approximately 15 days into the preceding and succeeding months. For the transition period from day tstart to day tend, the membership degrees of day t to adjacent periods µm and µn are defined as follows:
μ m t = t e n d t t e n d t s t a r t
μ n t = t t s t a r t t e n d t s t a r t
where µm(t) denotes the degree of membership of day t to the previous period and µn(t) represents the membership degree of day t to the next period, with the sum of both always equaling 1, ensuring continuity and normalization of the membership functions.
The calculation formulas for extending the original phase-based warning thresholds into daily dynamic thresholds within the transition periods are given by Equations (10)–(13):
h M D t = μ m t H M D , m + μ n t H M D , n
h M O D t = μ m t H M O D , m + μ n t H M O D , n
h S D t = μ m t H S D , m + μ G n t H S D , n
h E D t = μ m t H E D , m + μ n t H E D , n
where H M D , m , H M O D , m , H S D , m , and H E D , m are the upper thresholds of drought flow for mild, moderate, severe, and extremely severe drought within period µm, respectively; H M D , n , H M O D , n , H S D , n and H E D , n are the corresponding drought streamflow thresholds for the respective grades within period μ n ; and h M D , h M O D , h S D and h E D are the upper thresholds of drought flow for mild, moderate, severe, and extremely severe drought, respectively, on day t within the transition period.
Therefore, the drought water level threshold ranges for mild, moderate, severe, and extremely severe drought in each period were the following: ( H MOD, H MD], ( H SD, H MOD], ( H ED, H SD], (0, H ED] and the daily drought streamflow threshold ranges during the transition period, ( h MOD, h MD], ( h SD, h MOD], ( h ED, h SD], (0, h ED].
In this study, the above drought water level threshold considering fuzzy processing during transition periods were referred to as “soft period thresholds”, and the corresponding thresholds without considering period threshold mutations were referred to as “hard period thresholds”. Through these improvements, smooth transitions between periods were achieved, ensuring both the smoothness of soft period thresholds and the timeliness of early identification.

3. Results

3.1. Agricultural, Ecological, and Domestic Water Demand Analysis

According to Section 2.3.1, this study focuses on analyzing the monthly downstream agricultural, ecological, and domestic water demands for the Xianan Reservoir. Specifically, the agricultural water demand is based on the monthly water supply schedule for a design drought year (85% irrigation guarantee rate), as stipulated in the most recent “Xianan Reservoir Dispatching Regulations of Yihuang County, Jiangxi Province” [50]. These regulations were officially issued in 2023, and their calculations reflect a full accounting of current agricultural water needs. The monthly domestic water demand was determined using actual domestic water use data from 2020 to 2024 obtained through field surveys, considering its intra-annual distribution. The resulting monthly agricultural and domestic water demands for the Xianan Reservoir are presented in Figure 4.
For ecological water demand, this study determined appropriate monthly values by comparing results from the Q90% and the Tennant method. Due to the lack of long-term observed flow data at the downstream Tangyin hydrological station, the Q90% flow for the Xianan Reservoir’s downstream reach was estimated by analogy using data from the Taobei hydrological station. Specifically, the P-III distribution was fitted to 65 years (June 1958–December 2022) of monthly average flows from Taobei to determine the flow corresponding to 90% frequency for each month. These values were then multiplied by an appropriate analogy coefficient to obtain the monthly Q90% ecological flow estimates for the study site. Concurrently, the Tennant method was applied, calculating monthly ecological water requirements as specific percentages of the long-term monthly average flow at the Tangyin station: 10%, 30%, and 40% for poor, fair, and good ecological conditions during the flood season (April–September) and 10%, 10%, and 20%, respectively, during the non-flood season (October–March). The monthly ecological flow results obtained from both methods are presented in Figure 5. It is noted that the currently adopted ecological flow standard for the Xianan Reservoir is a constant value of 1.11 m3/s throughout the year.
A comparison of the aforementioned ecological flow calculation results and the current standard (1.11 m3/s) indicates that the flows estimated by the Tennant method (“fair” and “good” statuses) and the Q90% are significantly overestimated, particularly during the main flood season, exceeding both the actual downstream flow conditions and the reservoir’s supply capacity. Conversely, the monthly ecological flow values derived from the Tennant method under the “poor” status (based on 10% of the long-term average flow at Tangyin station) appear more realistic. This 10% threshold is often considered the minimum required to sustain basic riverine ecological functions and prevent intermittency. Furthermore, these “poor” status results, especially during the dry season, align better with the observed low-flow conditions downstream and are relatively consistent with the currently adopted multi-objective standard of 1.11 m3/s. Therefore, the ecological flow values calculated using the Tennant method for the “poor” status are adopted for the downstream reach of the Xianan Reservoir in this study.
As depicted in Figure 4, the three types of downstream water demand for the Xianan Reservoir show significant intra-annual dynamic variations. These seasonal differences in demand structure and magnitude are particularly pronounced under socio-hydrological drought conditions. Agricultural water demand exhibits strong seasonality, concentrated in the crop growing season (e.g., demands in July, August, and October are considerably higher than in other months), reflecting intensive irrigation requirements. Domestic water demand is relatively stable, with only a mild increase during the hot summer months (July and August). Ecological water demand follows a seasonal pattern akin to natural runoff, being higher during the flood season and lower during the dry season (October to March), closely correlating with the seasonal distribution of natural river inflow. In summary, the downstream water demand structure is complex and highly seasonal: agricultural demand drives the main fluctuations, domestic demand remains relatively constant, and ecological demand varies with natural inflow seasonality. Accurately understanding these dynamics is crucial for establishing reservoir drought warning water levels, especially under socio-hydrological drought conditions.

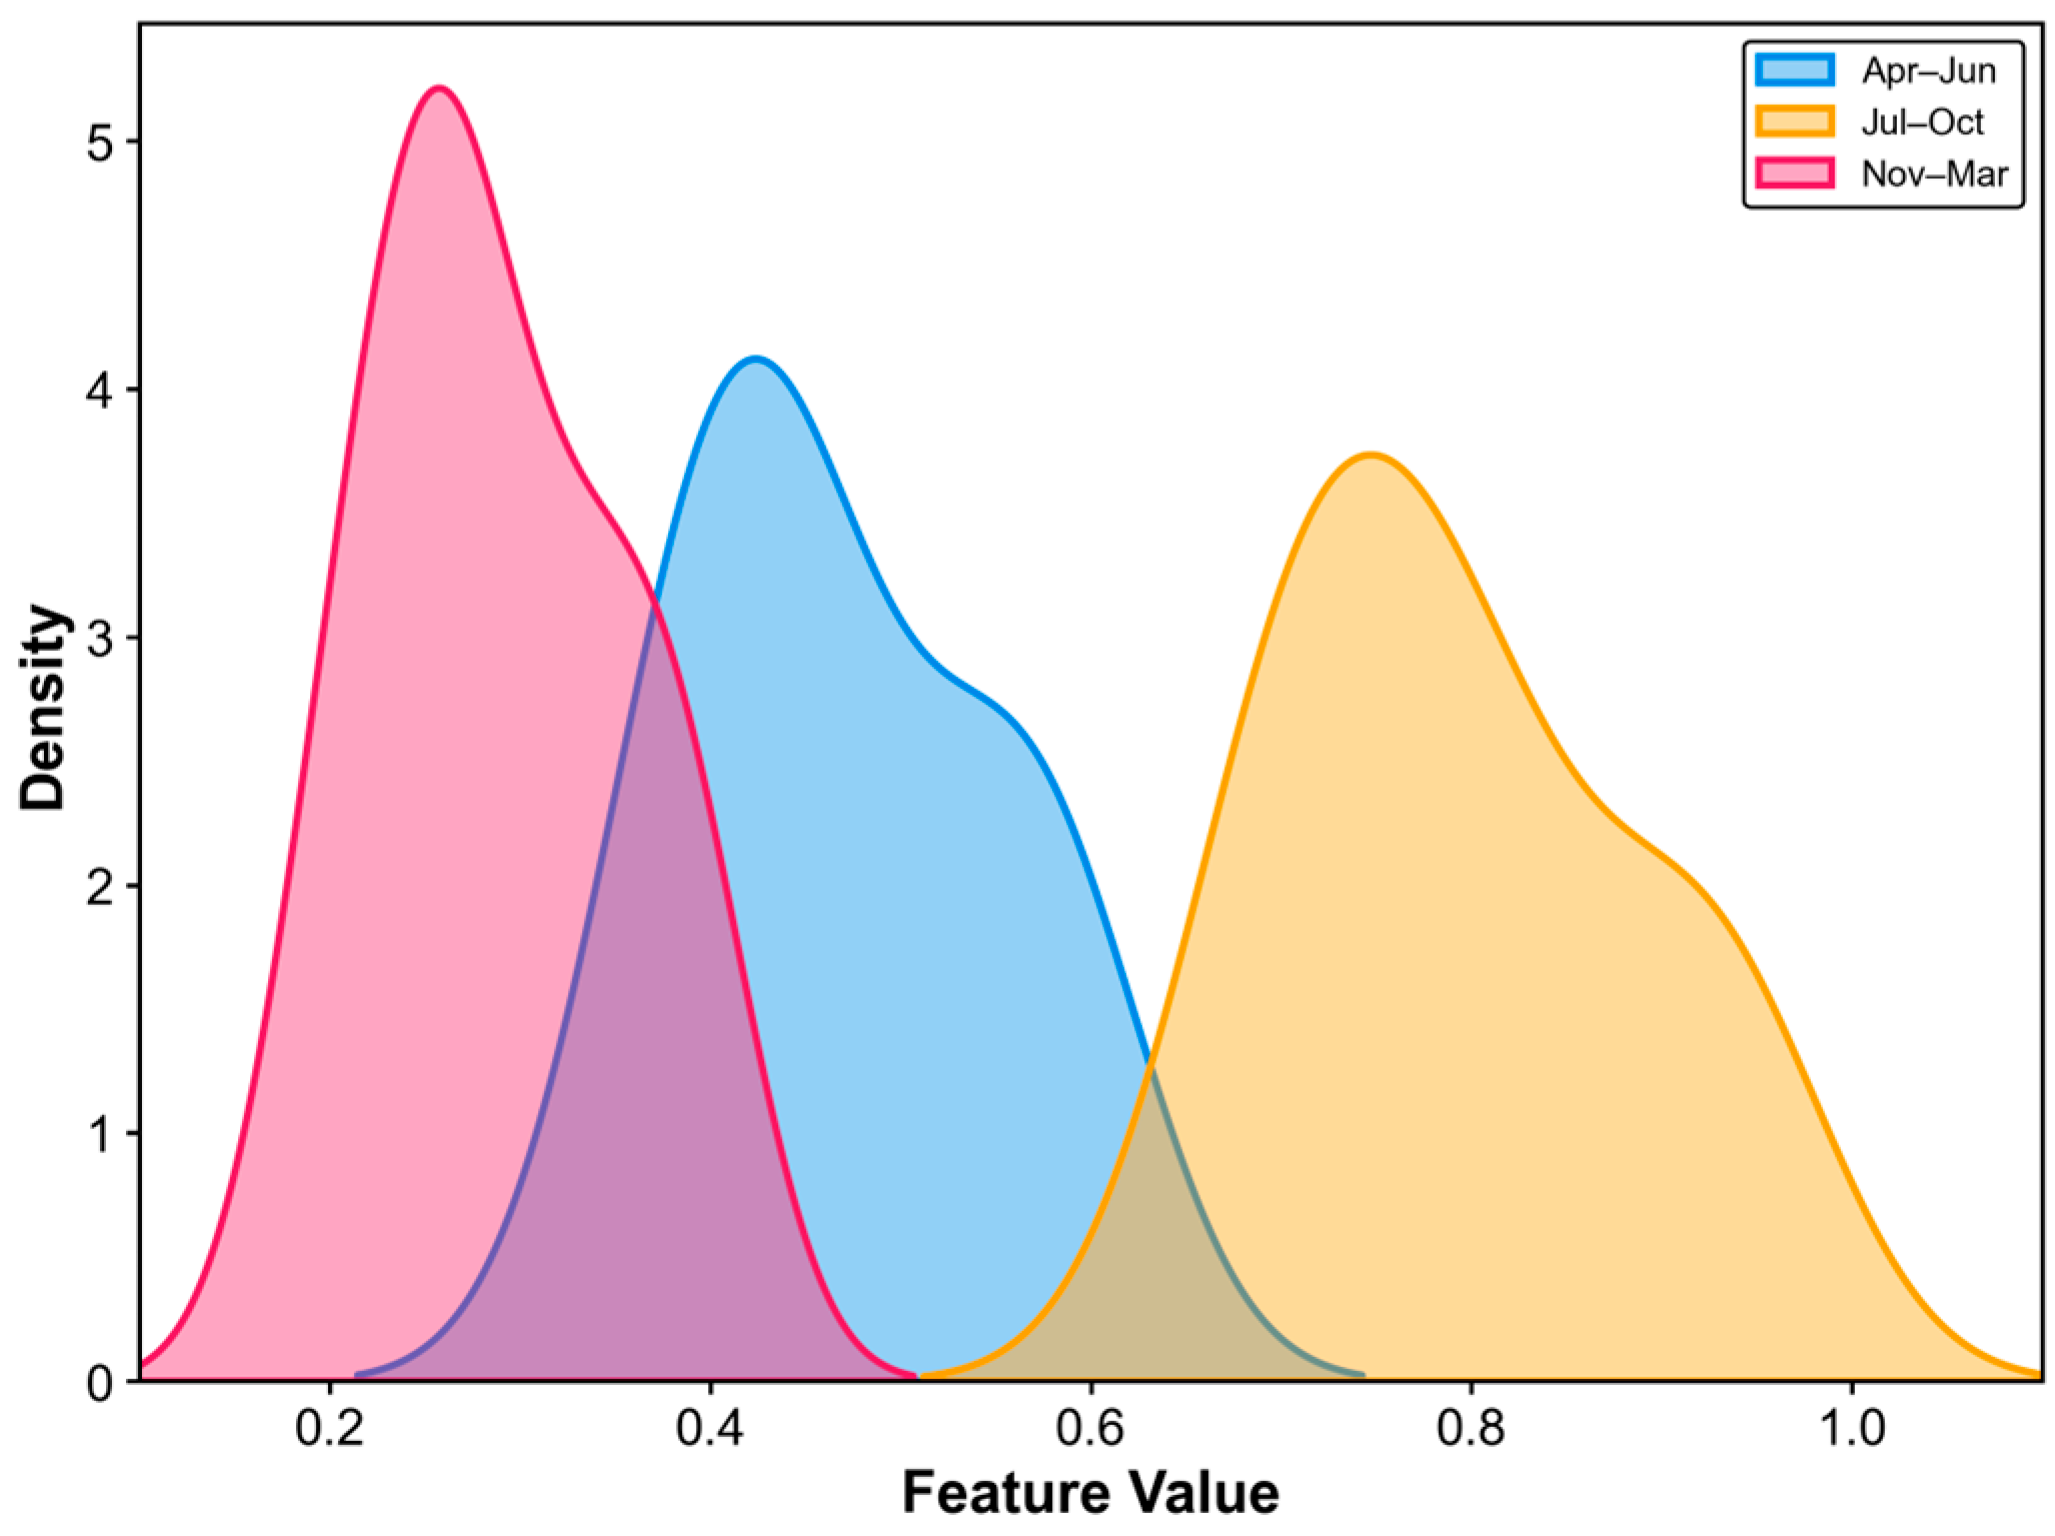
3.2. Phasing of Drought Warning Water Level Thresholds

As specified in Section 2.3.2, this study adopts the month as the minimum temporal unit for phase classification. Five characteristic indicators were selected for phasing the drought warning water levels of the Xianan Reservoir (Table 3): monthly reservoir inflow, precipitation, PET, agricultural water demand, and initial monthly water storage level.
Specifically, the long-term (1958–2022) average monthly inflow was used. Due to the lack of long-term observed inflow data for the Xianan Reservoir, it was estimated by converting the long-term average monthly flows from the Taobei hydrological station (within the same basin) using the ratio of their respective upstream catchment areas raised to the power of 0.945 [51]; this conversion was validated with recent partial observed inflow data. Average monthly precipitation was calculated using the Thiessen polygon method based on observed data (2015–2024) from the Xuxi and Yingfang stations. Average monthly PET was extracted from the 1 km monthly China dataset (1990–2022) [34]. Agricultural water demand data were obtained as described in Section 3.1. The initial monthly water storage level represents the monthly average calculated from observed reservoir data (2000–2022). The specific values of these monthly phasing characteristic indicators are presented in Table 3.
According to Section 2.3.2, for the constructed KPCA-Fisher-based phasing model, the Gaussian RBF kernel parameter σ was optimized by iterating through the range [0.01, 10] with a step size of 0.01 (1000 iterations total). The parameter optimization yielded an optimal σ value of 7.58, resulting in the maximum CH of 42.9390 for the phase classification. For this optimal σ, the contribution rates of the first five PCs were 46.65%, 43.36%, 5.64%, 2.28%, and 0.97%. As the cumulative contribution rate of the first two PCs reached approximately 90%, these two PCs were selected.
The objective weights assigned to the two selected principal components were 0.548 and 0.452, and a comprehensive index for the Xianan Reservoir drought warning water level phasing was calculated as their weighted sum. Considering that the main flood season in the study area begins in April, the comprehensive index sequence was reordered accordingly, starting with April. The resulting adjusted comprehensive index sequence was [0.339, 0.389, 0.493, 0.926, 0.810, 0.694, 0.744, 0.385, 0.330, 0.260, 0.206, 0.263]. This yielded the optimal phase classification: Phase 1 (G1) = {April–June}; Phase 2 (G2) = {July–October}; and Phase 3 (G3) = {November–March}. Figure 6, presenting the kernel density estimation plot of the clustering results, illustrates the effectiveness of this phasing algorithm.
The obtained phasing results are generally consistent with the hydrological characteristics of the study area: April–June constitutes the main flood season, characterized by concentrated rainfall and rapidly increasing agricultural water demand. July–October is the critical water demand period, featuring high temperatures, high evaporation, and peak agricultural irrigation demand; November to March is the dry season, with relatively low rainfall and water demand. Therefore, this study divides the drought warning water level thresholds for the Xianan Reservoir into these three periods: the main flood season (April–June), the critical water demand period (July–October), and the dry season (November–March).

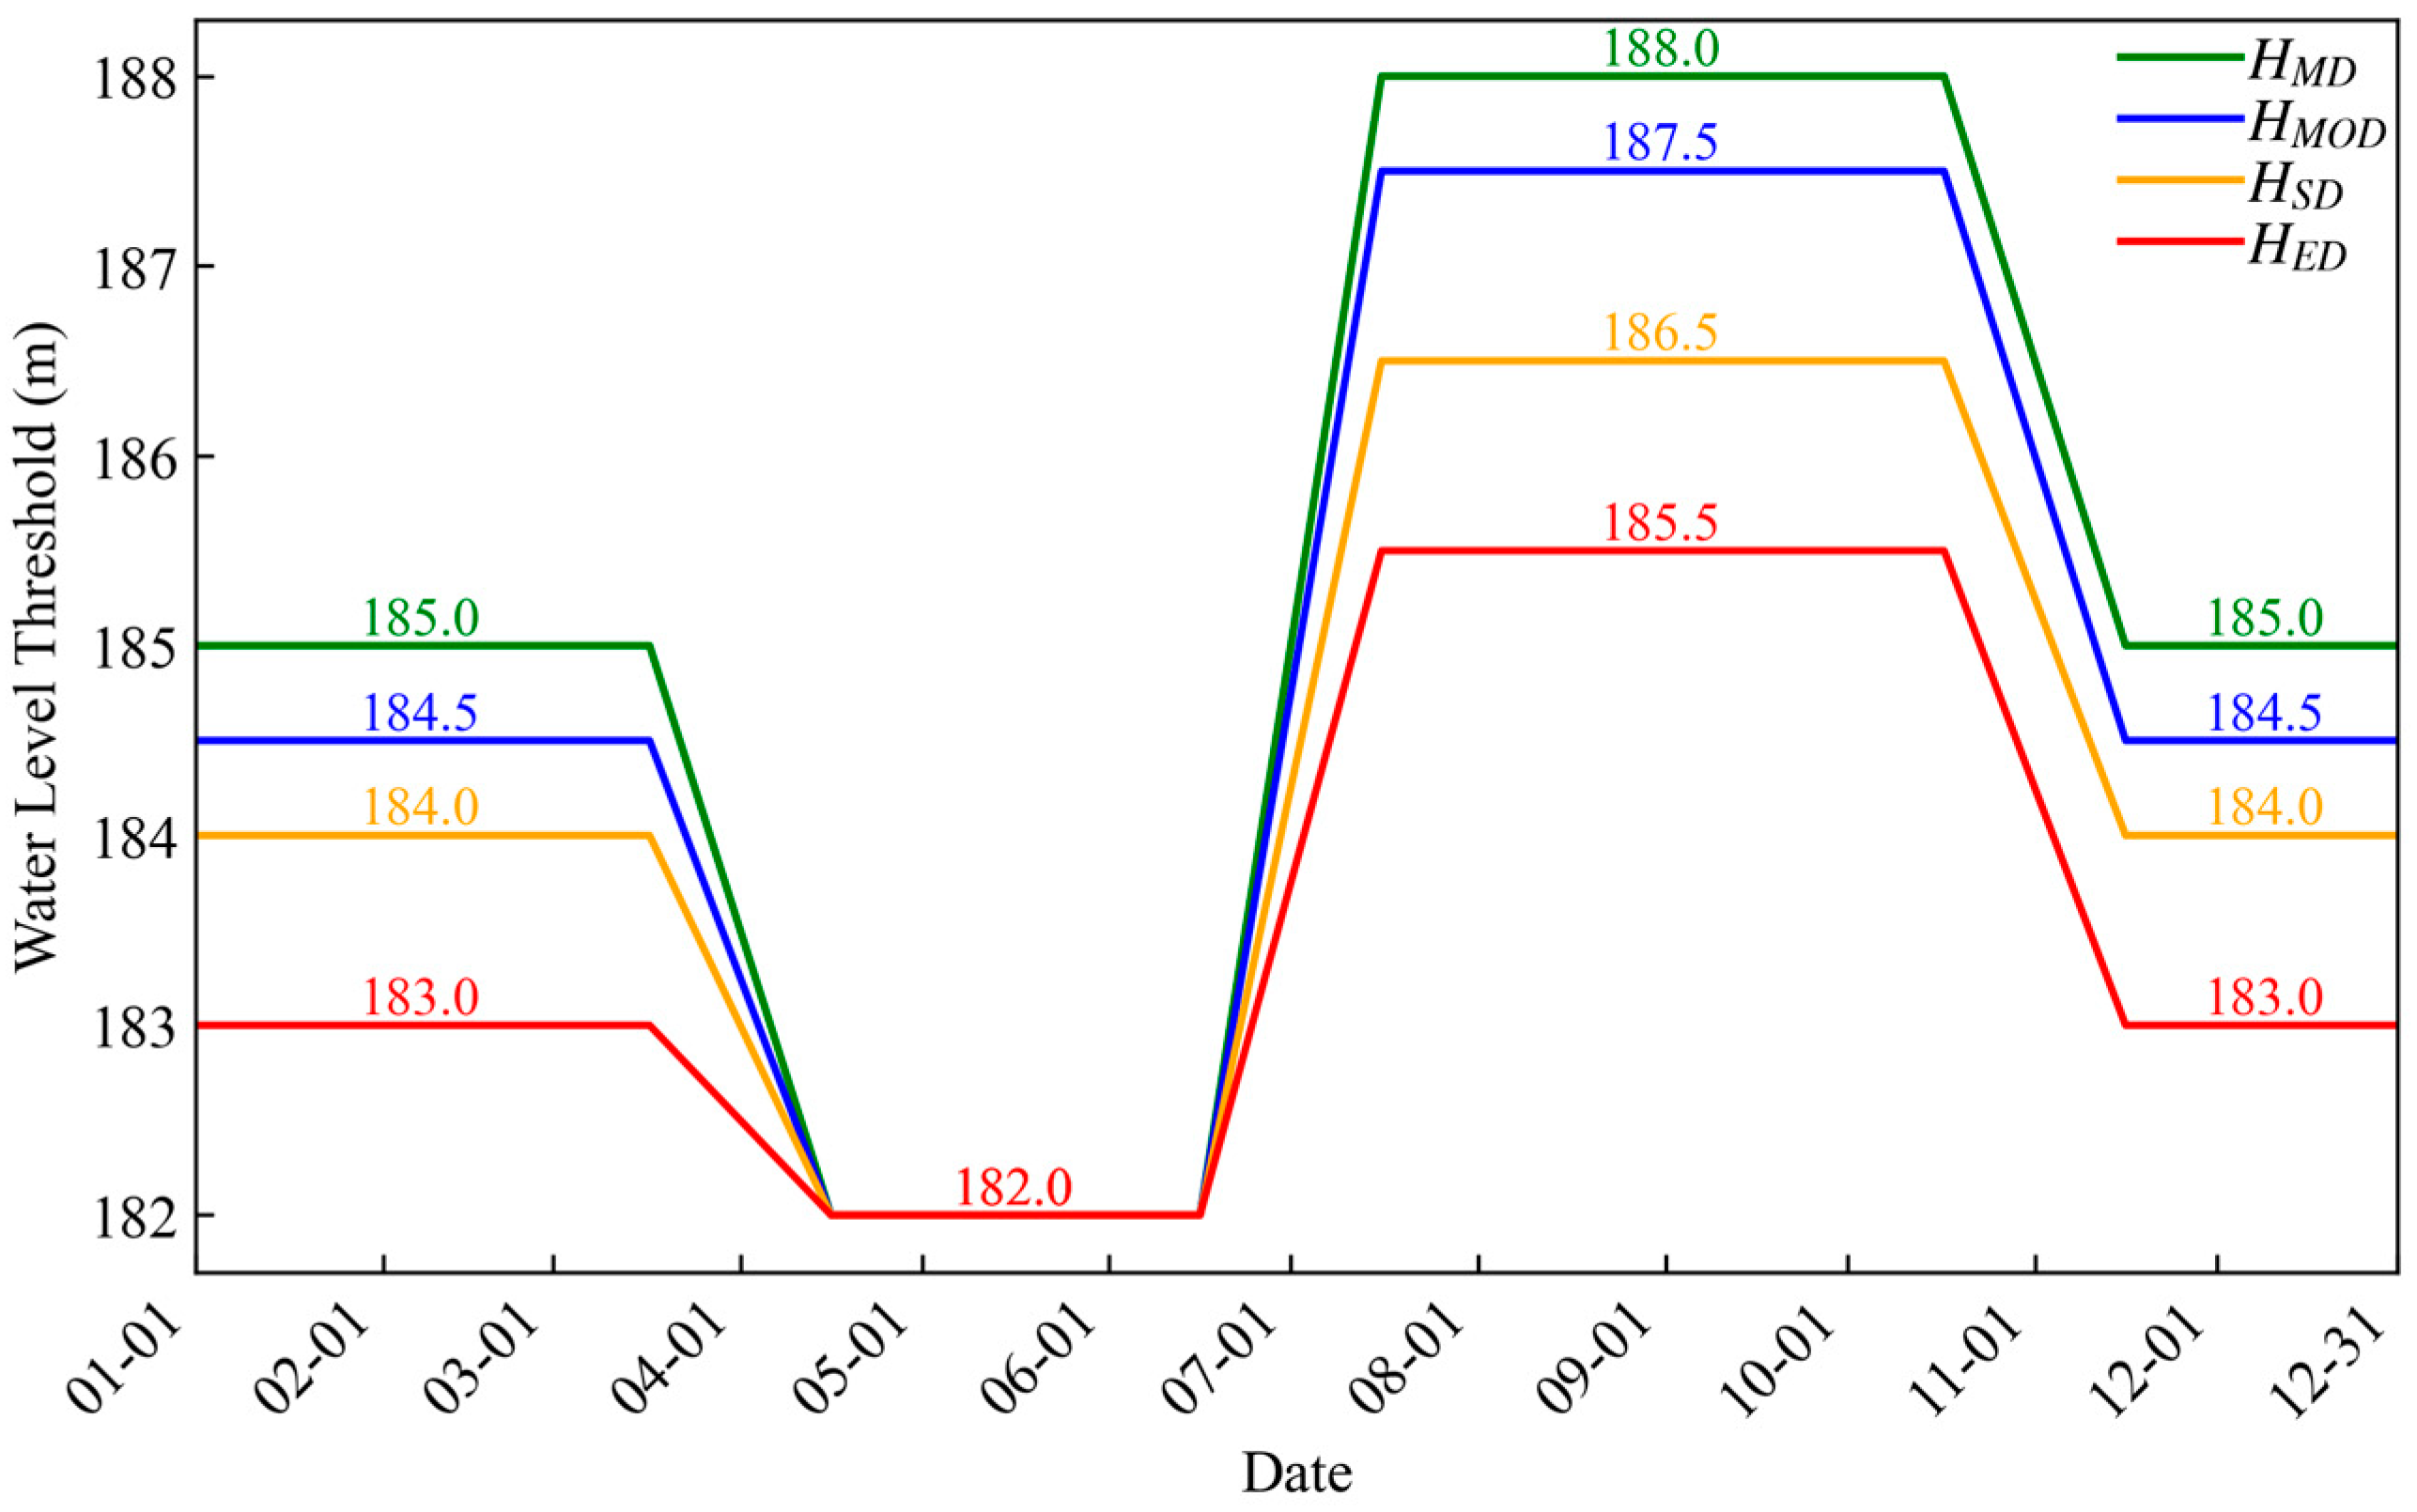
3.3. Determination of Drought Warning Water Level Thresholds

According to Section 2.3.3, determining the drought warning storage volumes corresponding to different drought levels necessitates the quantification of key factors, including water losses, design inflows and downstream water demands. This study first establishes the “hard partition” drought warning thresholds for the Xianan Reservoir based on the defined phases. Subsequently, Equations (8)–(12) are applied to calculate the daily warning thresholds during the transition periods. This process yields the final year-round daily, phased, and graded drought warning water level thresholds.
Regarding reservoir water losses, seepage is considered negligible for the Xianan Reservoir, given its completion of reinforcement and safety assessments and observed operational conditions. Therefore, this study only calculates reservoir surface evaporation, ignoring seepage losses. Monthly reservoir surface evaporation (Table 4) was estimated by first converting the long-term average initial monthly water level to the average monthly surface area using the reservoir’s stage-area curve and then multiplying this area by the corresponding long-term average monthly potential evapotranspiration (Table 1).
For the design inflow of the Xianan Reservoir, the hydrological analogy method was again employed, referencing the frequency analysis results of flow data from the downstream Taobei hydrological station. A design frequency corresponding to 75% exceedance probability (representing moderately dry conditions) was selected. Specifically, monthly hydrological frequency curves were constructed using Taobei’s monthly average flow data (1958–2022). The flow value corresponding to the 75% frequency for each month was then multiplied by the analogy coefficient to obtain the monthly design inflow for the Xianan Reservoir. The total monthly downstream water demand for the Xianan Reservoir, comprising domestic, agricultural, and ecological components, was calculated by summing the monthly values for each demand type obtained from the analysis in Section 3.1. The results of the monthly water supply (design inflow) and demand analysis for the Xianan Reservoir are detailed in Table 4.
Based on the selected critical downstream comprehensive water deficit rates (0.05, 0.1, 0.2, and 0.3 for mild, moderate, severe, and extreme drought, respectively), combined with the monthly water supply and demand data from Table 4 and Equation (7), the preliminary “hard partition” drought warning water level thresholds for the Xianan Reservoir were determined. For practical operational convenience, these thresholds were subsequently adjusted to one decimal place, rounding to the nearest 0.0 or 0.5. The final adjusted thresholds are presented in Table 5.
Notably, the warning water levels for the main flood season in Table 5 are all 182.0 m, coinciding with the reservoir’s dead water level. This indicates sufficient water supply and low drought risk for the Xianan Reservoir during this period.
Building upon these “hard partition” thresholds, a triangular membership function was employed to smooth the thresholds across the phase boundaries. The three transition periods were defined as 17 March–16 April, 16 June–16 July, and 17 October–16 November. Daily warning water level thresholds were calculated for these transition periods. Combining these daily transition thresholds with the original hard partition thresholds yielded the final year-round daily drought warning water level thresholds (referred to as “soft partition” thresholds) for the Xianan Reservoir, as illustrated in Figure 7.
As illustrated in Figure 7, the drought warning water level thresholds for different drought levels exhibit distinct intra-annual patterns, reflecting water scarcity arising from the interplay between human activities (demand) and natural processes (supply). These characteristics are jointly driven by seasonal variations in both water supply and demand. For example, during the critical water demand period (July–October), a surge in agricultural irrigation requirements leads to significantly higher warning water levels compared to other periods. Conversely, in the dry season, although total demand decreases, reduced natural inflow makes maintaining higher storage levels more difficult, necessitating dynamic adjustments of the warning levels based on the supply–demand balance.

3.4. Rationality Analysis

Assuming a relatively stable recent water supply–demand structure for the Xianan Reservoir, this study selected typical drought events from 2019 and 2022 to validate the reasonableness of the derived “soft partition” drought warning water level thresholds (Figure 7). The thresholds were used to diagnose these historical drought events based on the daily observed reservoir water levels. The diagnosis of drought events during 2019 and 2022, based on the observed daily water levels and the “soft partition” thresholds, is illustrated in Figure 8. Specifically, Figure 8a shows the complete daily diagnosis for both years, while Figure 8b presents a detailed view of the drought process from 25 June to 20 November for both 2019 and 2022.
As shown in Figure 8, the determined “soft partition” drought warning water level thresholds for the Xianan Reservoir effectively delineate the drought evolution process during these two typical drought years. They successfully identify the specific timing and duration of the reservoir entering and exiting different drought levels, thus capturing the occurrence and development of historical drought events. For instance, during the 2019 drought, the Xianan Reservoir entered a mild drought state in early September. The water level further declined below the upper limit of the moderate drought threshold in mid-to-late September, a state that persisted until mid-October before gradually alleviating, with the drought receding by the end of October. The year 2022 exhibited an earlier and more severe drought: the reservoir entered a mild drought state in mid-July, reached the moderate drought threshold (187.5 m) on 11 August, transitioned into a severe drought state by the end of August, and experienced continuously declining water levels throughout September and October until late October. Subsequently, the water level gradually recovered, and the drought conditions subsided around 5 November. These identification results, based on the daily dynamic (“soft partition”) thresholds, align closely with descriptions of the regional drought processes in 2019 and 2022 found in known historical records, indicating the good indicative capability and responsiveness of the constructed warning thresholds to actual drought conditions.
Particularly, Figure 8b reveals a more complex and detailed relationship between the actual water level fluctuations and the different threshold lines during the period of higher water supply pressure (25 June to 20 November). This further validates that the daily dynamic thresholds can more accurately reflect the reservoir’s true status under varying seasonal conditions and drought severities. This capability to capture subtle variations effectively embodies the core characteristic of socio-hydrological drought—complex interplay between changes in natural supply and human-activity-induced water demand—a complexity that traditional fixed thresholds often fail to fully grasp.

4. Discussion

4.1. Impact Analysis of Threshold Smoothing on Drought Process Characterization

As established in Section 3.4, the smoothed “soft partition” drought warning water level thresholds effectively delineate the drought evolution process during typical historical drought years, notably enhancing the capability to capture subtle changes in drought conditions. For comparison, the same historical drought events of 2019 and 2022 were diagnosed using the “hard partition” thresholds (Table 5), with the results presented in Figure 9. Figure 9a shows the complete daily diagnosis for both years, while Figure 9b provides a detailed view of the drought process from 1 July to 31 October for both years. A comparison between Figure 8 (soft thresholds) and Figure 9 (hard thresholds) reveals distinct “abrupt jumps” in drought levels at the phase boundaries when using hard partition thresholds. In contrast, the soft partition thresholds, with their dynamic changes, represent a more continuous and gradual drought evolution, better reflecting the cumulative and progressive nature of drought. For example, using hard thresholds, October 31 was identified as moderate drought in 2019 and severe drought in 2022. However, on November 1, entering the dry season, the threshold drops sharply, causing the diagnosed status to abruptly jump to “no drought”. Conversely, the soft thresholds facilitate a smooth transition, identifying gradual changes from moderate to mild to no drought (in 2019) and from severe to moderate to mild to no drought (in 2022) spanning late October to early November. This smoothing objectively captures the gradual recession of the 2022 drought in early November; using hard thresholds might fail to detect this residual drought, potentially leading to premature cancellation of warnings or missed alerts.
This phenomenon of “abrupt jumps” at phase boundaries is particularly pronounced with hard partition thresholds (Figure 9). The underlying reason is the assumption of an instantaneous change in the warning threshold at the boundary point, which contradicts the physical gradualness of drought processes and the actual response patterns of socio-economic systems. Soft partition thresholds, smoothed over transition periods, yield a more continuous and gradual representation of drought evolution. This better reflects the gradual changes in water supply and demand within socio-hydrological systems and captures the cumulative and progressive nature of drought, thus allowing for a more detailed characterization of its evolution. This finding is consistent with research on dynamic thresholds by Wanders et al. [14] and time-varying thresholds by Wang et al. [52].
From a socio-hydrological drought perspective, threshold smoothing not only mathematically avoids abrupt changes but, more importantly, better simulates the gradual characteristics of supply–demand interactions within the system. The “soft partition” thresholds determined in this study align with recent research trends emphasizing dynamism, non-linearity, and adaptability in drought management [53,54,55]. In summary, employing fuzzy membership functions for smoothing yields “soft partition” thresholds that effectively overcome the issue of abrupt warning level changes associated with hard partitioning. This approach provides a more realistic and refined depiction of socio-hydrological drought evolution, thereby enhancing the practicality and scientific soundness of the warning system.

4.2. Sensitivity Analysis of Drought Warning Water Level Thresholds to Ecological Water Demand

Ecological water demand is a key component of the total downstream water demand for the Xianan Reservoir, accounting for a significantly fluctuating proportion throughout the year (approximately 27–55.8%), even exceeding half of the total demand from February to June. Diverse methods exist for calculating ecological water demand, potentially leading to substantial discrepancies in results. Consequently, the choice of method has a non-negligible influence on the final determination of drought warning water level thresholds. To investigate this influence, this study compared the extent to which the “hard partition” drought warning water level thresholds are affected by ecological water demands calculated using four different approaches: the Q90% and the Tennant method (under “poor”, “fair”, and “good” conditions) (Figure 10). The results indicate that the drought warning water level thresholds exhibit high sensitivity to the chosen method for calculating ecological water demand.
Figure 10 visually illustrates the differences in thresholds resulting from the various ecological water demand calculation methods. Thresholds calculated using the Tennant method under “fair” and “good” conditions, which represent higher ecological protection targets, are systematically higher than those derived using the Tennant method (“poor” status, which was ultimately adopted in this study) and the Q90%. This discrepancy is particularly pronounced during the critical water demand period (July–October). For instance, the upper threshold for mild drought (198.0 m) calculated using the Tennant (“good”) method even exceeds the reservoir’s flood limit water level. This not only highlights the substantial impact of method selection but also suggests potential operational conflicts arising from setting high ecological targets. This sensitivity also exhibits a distinct seasonal pattern: during the critical water demand period (July–October), when supply–demand tensions are most acute, the differences in thresholds among all methods are most significant, underscoring the decisive role of determining ecological water requirements during this phase for drought risk assessment. Subsequently, moving into the dry season (November–March), the threshold differences among the remaining methods tend to narrow, with the exception of the Tennant (“good”) method which represents the highest ecological standard.
The aforementioned sensitivity analysis reveals the importance of determining ecological water demand in socio-hydrological drought management and the inherent trade-offs involved. Higher drought warning water level thresholds imply earlier and more frequent triggering of drought warnings. While enhancing ecosystem protection, this also potentially increases the frequency of restrictions on socio-economic water use and elevates water supply pressure. Conversely, lower thresholds, while better aligned with the reservoir’s current operational capacity and downstream low-flow conditions, prioritize safeguarding basic ecological functions and human water security, but the level of ecological protection they afford is relatively fundamental. Therefore, the determination of ecological water demand is not merely a hydrological calculation but rather a complex decision-making process involving multiple factors, including ecological protection goals, basin water resource availability, and socio-economic development requirements [56,57]. The selection of the Tennant (“poor”) level in this study was based on a comprehensive assessment of the specific conditions of the Xianan Reservoir (Section 3.1), aiming to establish a realistic and feasible baseline.
In summary, the high sensitivity of reservoir drought warning water level thresholds to the ecological water demand calculation method necessitates careful selection and clear justification of the chosen method during the design and application of practical warning systems, with full recognition of its profound implications for drought risk assessment and water resource management decisions.

5. Conclusions

This study developed a socio-hydrological framework to establish phased and graded “soft partition” thresholds for reservoir drought warning, leading to the following main conclusions:
(1) The proposed framework successfully established phased and graded drought warning levels by:
a. Objectively identifying three distinct, hydrologically consistent operational periods (main flood season, critical water demand period, and dry season) using a parameter-optimized KPCA-Fisher model.
b. Deriving specific “hard partition” warning levels for each period based on critical deficit rates from 0.05 to 0.3 (e.g., 185.5 m–188.0 m for the critical water demand period), thereby quantitatively reflecting the coupled effects of human activities and natural hydrology.
(2) The introduction of a triangular membership function to create “soft partition” thresholds overcomes the abrupt jumps of traditional discrete warnings. Application of these thresholds to the typical drought processes of 2019 and 2022 confirmed that they provide a more continuous and realistic diagnosis of drought evolution, significantly enhancing the warning system’s practicality and scientific soundness.
(3) The framework’s outputs are highly sensitive to the choice of ecological water demand calculation method, particularly during the critical water demand period (July–October). This finding highlights the critical trade-off between safeguarding ecological needs and ensuring socio-economic water security, a central challenge in real-world drought management.
Despite these contributions, the framework’s limitations must be acknowledged. Firstly, the warning thresholds are derived from historical data under an assumption of stationarity, which may not hold true under accelerating climate change and intense human activities. Secondly, while framed from a socio-hydrological perspective, the study does not delve deeply into the complex feedbacks and distinctions between socio-hydrological, hydrological, and socio-economic drought.
In summary, the proposed framework offers a practical and scientifically sound tool for adaptive reservoir drought management. Future research should focus directly on overcoming the identified limitations: namely, by developing dynamic adjustment mechanisms for the warning thresholds to account for non-stationarity and by conducting a more profound analysis of the drought-type interrelationships to further enhance the model’s explanatory power and applicability.

Author Contributions

Methodology, Y.L.; data processing, S.L. and H.W.; data analysis and validation, Y.L. and W.Y.; funding acquisition, X.X.; project administration, P.Y. and X.X.; proofreading, S.L. and W.Y.; review and editing, R.L. All authors have read and agreed to the published version of the manuscript.

Funding

This research was funded by the Key Research and Development Program of Jiangxi Province (20232BBG70029 and S20252022) and the Technology Innovation Guidance Program of Jiangxi Province (2022KSG01002, 2023KSG01005, and 20223AEI91008).

Institutional Review Board Statement

Not applicable.

Informed Consent Statement

Not applicable.

Data Availability Statement

The original contributions presented in this study are included in the article. Further inquiries can be directed to the corresponding author.

Conflicts of Interest

The authors declare no conflicts of interest.

References

  1. Min, S.-K.; Zhang, X.; Zwiers, F.W.; Hegerl, G.C. Human Contribution to More-Intense Precipitation Extremes. Nature 2011, 470, 378–381. [Google Scholar] [CrossRef]
  2. Sheffield, J.; Wood, E.F.; Roderick, M.L. Little Change in Global Drought over the Past 60 Years. Nature 2012, 491, 435–438. [Google Scholar] [CrossRef] [PubMed]
  3. Gu, X.; Zhang, Q.; Singh, V.P.; Shi, P. Changes in Magnitude and Frequency of Heavy Precipitation across China and Its Potential Links to Summer Temperature. J. Hydrol. 2017, 547, 718–731. [Google Scholar] [CrossRef]
  4. Cook, B.I.; Mankin, J.S.; Anchukaitis, K.J. Climate Change and Drought: From Past to Future. Curr. Clim. Change Rep. 2018, 4, 164–179. [Google Scholar] [CrossRef]
  5. Dai, A.; Zhao, T.; Chen, J. Climate Change and Drought: A Precipitation and Evaporation Perspective. Curr. Clim. Change Rep. 2018, 4, 301–312. [Google Scholar] [CrossRef]
  6. IPCC. Climate Change 2021: The Physical Science Basis. Contribution of Working Group I to the Sixth Assessment Report of the Intergovernmental Panel on Climate Change; Cambridge University Press: Cambridge, UK; New York, NY, USA, 2021. [Google Scholar]
  7. Vicente-Serrano, S.M.; Domínguez-Castro, F.; Murphy, C.; Hannaford, J.; Reig, F.; Peña-Angulo, D.; Tramblay, Y.; Trigo, R.M.; Donald, N.M.; Luna, M.Y.; et al. Long-Term Variability and Trends in Meteorological Droughts in Western Europe (1851–2018). Int. J. Climatol. 2020, 41, E690–E717. [Google Scholar] [CrossRef]
  8. Lei, S.; Shi, S.; Qu, Y.P.; Liu, Y.W.; Liao, J.Y.; Zhang, Y.; Zhang, Y.; Li, S.Y.; Dong, G.X. Characteristics of extreme drought in the Poyang Lake Basin in 2022 and implications for future response. J. Hydraul. Eng. 2023, 54, 333–346. (In Chinese) [Google Scholar] [CrossRef]
  9. He, S.; Guo, S.; Zhang, J.; Liu, Z.; Cui, Z.; Zhang, Y.; Zheng, Y. Multi-Objective Operation of Cascade Reservoirs Based on Short-Term Ensemble Streamflow Prediction. J. Hydrol. 2022, 610, 127936. [Google Scholar] [CrossRef]
  10. Van Loon, A.F. Hydrological Drought Explained. WIREs Water 2015, 2, 359–392. [Google Scholar] [CrossRef]
  11. Mishra, A.K.; Singh, V.P. A Review of Drought Concepts. J. Hydrol. 2010, 391, 202–216. [Google Scholar] [CrossRef]
  12. Tallaksen, L.; van Lanen, H.A.J. Hydrological Drought. Processes and Estimation Methods for Streamflow and Groundwater; Developments in Water Science; Elsevier: Amsterdam, The Netherlands, 2004; Volume 48, ISBN 978-0-444-51688-6. [Google Scholar]
  13. Van Loon, A.F.; Gleeson, T.; Clark, J.; Van Dijk, A.I.J.M.; Stahl, K.; Hannaford, J.; Di Baldassarre, G.; Teuling, A.J.; Tallaksen, L.M.; Uijlenhoet, R. Drought in the Anthropocene|Nature Geoscience. Nat. Geosci. 2016, 9, 89–91. [Google Scholar] [CrossRef]
  14. Wanders, N.; Wada, Y.; Van Lanen, H.A.J. Global Hydrological Droughts in the 21st Century under a Changing Hydrological Regime. Earth Syst. Dyn. 2015, 6, 1–15. [Google Scholar] [CrossRef]
  15. Sivapalan, M.; Konar, M.; Srinivasan, V.; Chhatre, A.; Wutich, A.; Scott, C.A.; Wescoat, J.L.; Rodríguez-Iturbe, I. Socio-Hydrology: Use-Inspired Water Sustainability Science for the Anthropocene. Earth’s Future 2014, 2, 225–230. [Google Scholar] [CrossRef]
  16. Sivapalan, M.; Savenije, H.H.G.; Blöschl, G. Socio-Hydrology: A New Science of People and Water. Hydrol. Process. 2012, 26, 1270–1276. [Google Scholar] [CrossRef]
  17. Di Baldassarre, G.; Sivapalan, M.; Rusca, M.; Cudennec, C.; Garcia, M.; Kreibich, H.; Konar, M.; Mondino, E.; Mård, J.; Pande, S.; et al. Sociohydrology: Scientific Challenges in Addressing the Sustainable Development Goals. Water Resour. Res. 2019, 55, 6327–6355. [Google Scholar] [CrossRef] [PubMed]
  18. Sun, J.; Sun, S.; Yin, Y.; Wang, Y.; Zhao, X.; Wu, P. Evaluating Grain Virtual Water Flow in China: Patterns and Drivers from a Socio-Hydrology Perspective. J. Hydrol. 2022, 606, 127412. [Google Scholar] [CrossRef]
  19. Wada, Y.; Bierkens, M.F.P.; de Roo, A.; Dirmeyer, P.A.; Famiglietti, J.S.; Hanasaki, N.; Konar, M.; Liu, J.; Müller Schmied, H.; Oki, T.; et al. Human–Water Interface in Hydrological Modelling: Current Status and Future Directions. Hydrol. Earth Syst. Sci. 2017, 21, 4169–4193. [Google Scholar] [CrossRef]
  20. Rachunok, B.; Fletcher, S. Socio-Hydrological Drought Impacts on Urban Water Affordability. Nat. Water 2023, 1, 83–94. [Google Scholar] [CrossRef]
  21. Liu, C.-Y.; Huang, P.-Y.; Hsu, S.-Y.; Tung, C.-P.; Liao, K.-W. Anthropogenic Drought Monitoring Using Socio-Hydrological Modeling for Surface Water Deficit: Lessons from Northern Taiwan. J. Hydrol. 2025, 647, 132298. [Google Scholar] [CrossRef]
  22. Ministry of Water Resources of the People’s Republic of China. Methods for Determining Drought Warning Water Levels and Flow Rates; Ministry of Water Resources of the People’s Republic of China: Beijing, China, 2011.
  23. He, S.; Wang, D.; Sang, X.; Niu, G. Water Resource Regulation and Evaluation Method Based on Optimization of Drought-Limited Water Level in Reservoir Group. Sustainability 2024, 16, 7015. [Google Scholar] [CrossRef]
  24. Luo, C.; Xu, B.; Ding, W.; Zhang, C.; Du, E. Characteristics of Reservoirs to Mitigate Drought Effects with a Hedging Rule Triggered by Drought Limited Water Level. J. Hydrol. 2023, 617, 129106. [Google Scholar] [CrossRef]
  25. Wang, K.; Yan, Z.Q.; Chen, G.; Jiang, Y.; Zhou, Z.; Yan, D. Study on Multi-Level Optimization of Reservoir Drought-Limit Water Levels for Extreme Drought. J. Hydraul. Eng. 2024, 55, 1528–1538. (In Chinese) [Google Scholar] [CrossRef]
  26. Peng, Z.W.; Guo, A.J.; Chang, J.X.; Yan, D.H.; Yan, Z.Q.; Zhao, Z. Q Connotation and determination method of graded and staged drought warning water level for reservoir considering drought risks. J. Hydraul. Eng. 2024, 55, 1260–1269. (In Chinese) [Google Scholar] [CrossRef]
  27. Zhang, L.B.; Bai, Y.C.; Jin, J.L.; Yue, H.; Zhou, Y.; Zhou, T. Optimization of Reservoir Drought-Limited Water Level and Water Supply Strategy in an Irrigation District Based on Fuzzy Set-Pair Analysis. J. Hydraul. Eng. 2022, 53, 1154–1167. (In Chinese) [Google Scholar] [CrossRef]
  28. Zhang, L.; Kang, C.; Wu, C.; Yu, H.; Jin, J.; Zhou, Y.; Zhou, T. Optimization of Drought Limited Water Level and Operation Benefit Analysis of Large Reservoir. Water Resour. Manag. 2022, 36, 4677–4696. [Google Scholar] [CrossRef]
  29. World Meteorological Organization (WMO); Global Water Partnership (GWP). Handbook of Drought Indicators and Indices; World Meteorological Organization: Geneva, Switzerland, 2016. [Google Scholar]
  30. Shah, D.; Zhao, G.; Li, Y.; Singh, V.P.; Gao, H. Assessing Global Reservoir-Based Hydrological Droughts by Fusing Storage and Evaporation. Geophys. Res. Lett. 2024, 51, e2023GL106159. [Google Scholar] [CrossRef]
  31. Zhao, G.; Gao, H. Towards Global Hydrological Drought Monitoring Using Remotely Sensed Reservoir Surface Area. Geophys. Res. Lett. 2019, 46, 13027–13035. [Google Scholar] [CrossRef]
  32. Fung, K.F.; Huang, Y.F.; Koo, C.H. Investigation of Streamflow as a Seasonal Hydrological Drought Indicator for a Tropical Region. Water Supply 2020, 20, 609–620. [Google Scholar] [CrossRef]
  33. Yan, Z.Q.; Zhou, Z.H.; Yan, D.H.; Wei, R.S. An algorithm for grading and staged drought- limited water level (flow) of river sections. Adv. Water Sci. 2023, 34, 53–62. (In Chinese) [Google Scholar] [CrossRef]
  34. Peng, S.; Ding, Y.; Wen, Z.; Chen, Y.; Cao, Y.; Ren, J. Spatiotemporal Change and Trend Analysis of Potential Evapotranspiration over the Loess Plateau of China during 2011–2100. Agric. For. Meteorol. 2017, 233, 183–194. [Google Scholar] [CrossRef]
  35. Schölkopf, B.; Smola, A.; Müller, K.-R. Nonlinear Component Analysis as a Kernel Eigenvalue Problem. Neural Comput. 1998, 10, 1299–1319. [Google Scholar] [CrossRef]
  36. Schölkopf, B.; Smola, A.; Müller, K.-R. Kernel Principal Component Analysis. In Proceedings of the Artificial Neural Networks—ICANN’97; Gerstner, W., Germond, A., Hasler, M., Nicoud, J.-D., Eds.; Springer: Berlin/Heidelberg, Germany, 1997; pp. 583–588. [Google Scholar]
  37. Fisher, W.D. On Grouping for Maximum Homogeneity. J. Am. Stat. Assoc. 1958, 53, 789–798. [Google Scholar] [CrossRef]
  38. Tennant, D.L. Instream Flow Regimens for Fish, Wildlife, Recreation and Related Environmental Resources. Fisheries 1976, 1, 6–10. [Google Scholar] [CrossRef]
  39. A Dendrite Method for Cluster Analysis. Commun. Stat.-Theory Methods 1974, 3, 1–27. [CrossRef]
  40. Ministry of Water Resources of the People’s Republic of China. Technical Specification for Calculation of Ecological Environmental Water Requirements in Rivers and Lakes (SL/T712-2021); Ministry of Water Resources of the People’s Republic of China: Beijing, China, 2021.
  41. Hotelling, H. Analysis of a Complex of Statistical Variables into Principal Components. J. Educ. Psychol. 1933, 24, 417–441. [Google Scholar] [CrossRef]
  42. Mika, S.; Schölkopf, B.; Smola, A.; Müller, K.-R.; Scholz, M.; Rätsch, G. Kernel PCA and De-Noising in Feature Spaces. In Proceedings of the 12th International Conference on Neural Information Processing Systems, Denver, CO, USA, 1 December 1998; MIT Press: Cambridge, MA, USA; pp. 536–542. [Google Scholar]
  43. Chen, W.; Wang, H.; Qin, Q.H. Kernel Radial Basis Functions. In Proceedings of the Computational Mechanics; Yao, Z.H., Yuan, M.W., Eds.; Springer: Berlin/Heidelberg, Germany, 2009; p. 347. [Google Scholar]
  44. Chudzian, P. Radial Basis Function Kernel Optimization for Pattern Classification. In Proceedings of the Computer Recognition Systems 4; Burduk, R., Kurzyński, M., Woźniak, M., Żołnierek, A., Eds.; Springer: Berlin/Heidelberg, Germany, 2011; pp. 99–108. [Google Scholar]
  45. Shannon, C.E. A Mathematical Theory of Communication. Bell Syst. Tech. J. 1948, 27, 379–423. [Google Scholar] [CrossRef]
  46. GB/T 32135-2015; Regional Drought Classification. China Standards Press: Beijing, China, 2015.
  47. Yan, Z.; Zhou, Z.; Liu, J.; Wen, T.; Sang, X.; Zhang, F. Multiobjective Optimal Operation of Reservoirs Based on Water Supply, Power Generation, and River Ecosystem with a New Water Resource Allocation Model. J. Water Resour. Plan. Manag. 2020, 146, 05020024. [Google Scholar] [CrossRef]
  48. Yan, Z.; Zhou, Z.; Sang, X.; Wang, H. Water Replenishment for Ecological Flow with an Improved Water Resources Allocation Model. Sci. Total Environ. 2018, 643, 1152–1165. [Google Scholar] [CrossRef]
  49. Wang, W.; Van Gelder, P.H.; Vrijling, J.K.; Ma, J. Forecasting Daily Streamflow Using Hybrid ANN Models. J. Hydrol. 2006, 324, 383–399. [Google Scholar] [CrossRef]
  50. Yihuang County Water Bureau. Operation Regulation of Xianan Reservoir in Yihuang County, Jiangxi Province; Yihuang County Water Bureau: Fuzhou, China, 2023.
  51. Yihuang County Water Bureau. Jiangxi Province Yihuang County Xianan Reservoir Flood Control Emergency Plan; Yihuang County Water Bureau: Fuzhou, China, 2022.
  52. Wang, M.; Jiang, S.; Ren, L.; Xu, J.; Yuan, S.; Xu, C.-Y. An Integrated Framework for Non-Stationary Hydrological Drought Assessment Using Time-Varying Parameter Standardized Streamflow Index and Time-Varying Threshold Level Method. J. Hydrol. Reg. Stud. 2025, 59, 102329. [Google Scholar] [CrossRef]
  53. Milly, P.C.; Betancourt, J.; Falkenmark, M.; Hirsch, R.M.; Kundzewicz, Z.W.; Lettenmaier, D.P.; Stouffer, R.J. Stationarity Is Dead: Whither Water Management? Science 2008, 319, 573–574. [Google Scholar] [CrossRef] [PubMed]
  54. Wang, Y.; Duan, L.; Liu, T.; Li, J.; Feng, P. A Non-Stationary Standardized Streamflow Index for Hydrological Drought Using Climate and Human-Induced Indices as Covariates. Sci. Total Environ. 2020, 699, 134278. [Google Scholar] [CrossRef] [PubMed]
  55. Zhang, T.; Su, X.; Wu, L.; Chu, J. Identification of Dynamic Drought Propagation from a Nonstationary Perspective and Its Application to Drought Warnings. J. Hydrol. 2023, 626, 130372. [Google Scholar] [CrossRef]
  56. Pastor, A.V.; Ludwig, F.; Biemans, H.; Hoff, H.; Kabat, P. Accounting for Environmental Flow Requirements in Global Water Assessments. Hydrol. Earth Syst. Sci. 2014, 18, 5041–5059. [Google Scholar] [CrossRef]
  57. Smakhtin, V.; Revenga, C.; Doell, P. A Pilot Global Assessment of Environmental Water Requirements and Scarcity. Water Int. 2004, 29, 307–317. [Google Scholar] [CrossRef]
Figure 1. Schematic map of the study area: (a) map of China; (b) location map of the Xianan Reservoir.
Agriculture 15 01408 g001
Figure 2. Methodological framework for determining staged and graded reservoir drought warning water levels. The framework uses a comprehensive water deficit index (Di) to derive “hard thresholds” (discrete levels) and “soft thresholds” (transitional zones) following a KPCA-Fisher-based phase classification.
Agriculture 15 01408 g002
Figure 3. The classification calculation model of the drought warning water level phase.
Agriculture 15 01408 g003
Figure 4. Monthly water demand distribution for the Xianan Reservoir.
Agriculture 15 01408 g004
Figure 5. Comparison of monthly ecological water demand results for the Xianan Reservoir.
Agriculture 15 01408 g005
Figure 6. Kernel density estimation (KDE) plot visualizing the clustering results for the annual operational phases of the Xianan Reservoir. The x-axis “Feature Value” represents the comprehensive index derived from the Kernel Principal Component Analysis (KPCA). The three distinct density distributions correspond to the three periods identified by the clustering algorithm: the main flood season (Apr–Jun), the critical water demand period (Jul–Oct), and the dry season (Nov–Mar). The clear separation between the curves demonstrates the effectiveness of the phasing methodology.
Agriculture 15 01408 g006
Figure 7. Dynamic curves of soft partition thresholds for drought warning water levels of the Xianan Reservoir.
Agriculture 15 01408 g007
Figure 8. Diagnosis process for the Xianan Reservoir using soft partition thresholds of drought warning water levels during the typical drought years of 2019 and 2022: (a) the complete daily diagnosis for the full annual cycle of both years; (b) a focused view of the critical drought evolution from 25 June to 20 November.
Agriculture 15 01408 g008
Figure 9. Diagnosis process for the Xianan Reservoir using hard partition thresholds of drought warning water levels during the typical drought years of 2019 and 2022: (a) the complete daily diagnosis for the full annual cycle of both years; (b) a detailed analysis of the critical drought period from 1 July to 31 October.
Agriculture 15 01408 g009
Figure 10. Comparison of hard partition drought warning water level thresholds using different ecological water demand calculation methods.
Agriculture 15 01408 g010
Table 1. Data sources and details.
Data TypesTime PeriodSources
Monthly streamflow and Taopi Hydrological Station January 1958 to December 2022Data provided by the Jiangxi Provincial Hydrological Monitoring Center.
Monthly precipitation and Xuxi and Yingfang Rain Gauge StationsJanuary 2015 to December 2024
Monthly initial water storage level and Xianan ReservoirJanuary 2000 to December 2022
Monthly potential evapotranspirationJanuary 1990 to December 2022[34]
Table 2. Grading standards for water deficit rates based on different water demand types.
CategoriesMild DroughtModerate DroughtSevere DroughtExtremely Severe
Drought
Agricultural Irrigation Deficit Rate[0.05, 0.20)[0.20, 0.35)[0.35, 0.50)[0.50, 1)
Urban Drought Deficit Rat[0.05, 0.10)[0.10, 0.20)[0.20, 0.30)[0.30, 1)
Ecological Water Demand Deficit Rate[0.20, 0.40)[0.40, 0.60)[0.60, 0.80)[0.80, 1)
Di[0.05, 0.10)[0.10, 0.20)[0.20, 0.30)[0.30, 1)
Table 3. Characteristic indicators for phasing drought warning water levels of the Xianan Reservoir.
MonthInflow (m3/s)Precipitation (mm)Evaporation (mm)Agricultural Demand (104 m3)Initial Water Level (m)
Jan2.9388.339.124.5188.04
Feb4.25121.249.024.5186.92
Mar6.85201.376.322.4187.12
Apr10.2218.398.2113.1186.92
May11.3346.8119.295.8187.27
Jun14.5354.4122.0104.1188.82
Jul7.69199.2159.8487191.04
Aug4.89137.7147.2388.2190.17
Sep4.44143.1121.7250.8190.29
Oct3.4672.894.1532.9189.68
Nov3.46140.562.624.5189.34
Dec2.9169.546.724.5188.89
Table 4. Monthly water supply and demand analysis for the Xianan Reservoir (104 m3).
MonthDomestic DemandAgricultural DemandEcological DemandTotal DemandDesign Inflow
(p = 75%)
Evaporation
Jan350.4 24.5 372.3 747.2 448.8 6.6
Feb350.4 24.5 411.3 786.2 593.2 7.5
Mar408.8 22.4 527.6 958.8 1249.7 11.9
Apr467.2 113.1 616.9 1197.2 1684.5 15.0
May584.0 95.8 859.8 1539.6 1919.6 18.8
Jun584.0 104.1 845.0 1533.1 2400.3 21.7
Jul700.8 487.0 752.6 1940.4 1033.9 32.9
Aug700.8 388.2 492.8 1581.8 819.7 28.7
Sep525.6 250.8 422.5 1198.9 620.4 23.9
Oct408.8 532.9 348.2 1289.9 584.8 17.8
Nov408.824.5 349.9 783.2 472.1 11.5
Dec350.424.5 342.8 717.7 406.9 8.3
Table 5. Hard partition thresholds for drought warning water levels of the Xianan Reservoir.
PhaseMonthsDrought Warning Water Level (m)
Mild DroughtModerate DroughtSevere DroughtExtremely Severe
Drought
Main Flood SeasonApr–Jun182.0182.0182.0182.0
Critical Water Demand PeriodJul–Oct188.0187.5186.5185.5
Dry SeasonNov–Mar185.0184.5184.0183.0
Disclaimer/Publisher’s Note: The statements, opinions and data contained in all publications are solely those of the individual author(s) and contributor(s) and not of MDPI and/or the editor(s). MDPI and/or the editor(s) disclaim responsibility for any injury to people or property resulting from any ideas, methods, instructions or products referred to in the content.

