Article

Application of Vis/NIR Spectroscopy in the Rapid and Non-Destructive Prediction of Soluble Solid Content in Milk Jujubes

1
School of Intelligent Manufacturing and Electrical Engineering, Nanyang Normal University, Nanyang 473061, China
2
National Institute on Drug Dependence and Beijing Key Laboratory of Drug Dependence, Peking University, Beijing 100191, China
*
Author to whom correspondence should be addressed.
Agriculture 2025, 15(13), 1382; https://doi.org/10.3390/agriculture15131382
Submission received: 30 May 2025 / Revised: 17 June 2025 / Accepted: 26 June 2025 / Published: 27 June 2025
(This article belongs to the Section Agricultural Product Quality and Safety)

Abstract

Milk jujube has become an increasingly popular tropical fruit. The sugar content, which is commonly represented by the soluble solid content (SSC), is a key indicator of the flavor, internal quality, and market value of milk jujubes. Traditional methods for assessing SSC are time-consuming, labor-intensive, and destructive. These methods fail to meet the practical demands of the fruit market. A rapid, stable, and effective non-destructive detection method based on visible/near-infrared (Vis/NIR) spectroscopy is proposed here. A Vis/NIR reflectance spectroscopy system covering 340–1031 nm was constructed to detect SSC in milk jujubes. A structured spectral modeling framework was adopted, consisting of outlier elimination, dataset partitioning, spectral preprocessing, feature selection, and model construction. Comparative experiments were conducted at each step of the framework. Special emphasis was placed on the impact of outlier detection and dataset partitioning strategies on modeling accuracy. A data-augmentation-based unsupervised anomaly sample elimination (DAUASE) strategy was proposed to enhance the data validity. Multiple data partitioning strategies were evaluated, including random selection (RS), Kennard–Stone (KS), and SPXY methods. The KS method achieved the best preservation of the original data distribution, improving the model generalization. Several spectral preprocessing and feature selection methods were used to enhance the modeling performance. Regression models, including support vector regression (SVR), partial least squares regression (PLSR), multiple linear regression (MLR), and backpropagation neural network (BP), were compared. Based on a comprehensive analysis of the above results, the DAUASE + KS + SG + SNV + CARS + SVR model exhibited the highest prediction performance. Specifically, it achieved an average precision (APp) of 99.042% on the prediction set, a high coefficient of determination (RP2) of 0.976, and a low root-mean-square error of prediction (RMSEP) of 0.153. These results indicate that Vis/NIR spectroscopy is highly effective and reliable for the rapid and non-destructive detection of SSC in milk jujubes, and it may also provide a theoretical basis for the practical application of rapid and non-destructive detection in milk jujubes and other jujube varieties.

1. Introduction

Milk jujube, also known as apple jujube, hairy-leaved jujube, and Indian jujube, belongs to the genus Ziziphus in the family Rhamnaceae. It is a popular tropical and subtropical fruit in Asia, Africa, and South America, due to its crispy texture, juiciness, high sweetness, excellent flavor, and rich nutrients [1]. Its soluble solids content (SSC) typically ranges from 11 to 18 °Brix [2]; as a result, its cultivation has rapidly expanded worldwide. Since its introduction to mainland China in the mid-to-late 1990s, the milk jujube has been widely cultivated in Guangdong, Fujian, Guangxi, and other southern provinces due to its sweet flavor and commercial appeal. According to agricultural statistics, the total cultivation area of milk jujube in China is currently estimated at 15,000 hectares, with an annual yield of approximately 200,000 to 300,000 tons. The major production areas include Fujian, Guangxi, and Guangdong, where the cumulative planting area has exceeded 10,000 hectares, based on data from local agricultural authorities. Owing to its nutritional, medicinal, and ecological values [3,4,5,6], it has become one of the most promising tropical fruits in China, widely favored by consumers [7,8]. Milk jujubes typically have smooth and glossy green skin, a regular shape, crisp and juicy flesh, and a pleasantly sweet taste; their SSC is normally higher than 11 °Brix. In contrast, unripe or inferior fruits often exhibit a deep green or uneven skin color, firm or hard texture, low sugar content, and a bland or even astringent flavor. Fraudulent or improperly handled fruits may lack a natural aroma, display artificial gloss due to waxing, or show inconsistent sugar levels resulting from premature harvesting. The sugar content, typically represented by the soluble solids content (SSC) and expressed in °Brix, will be referred to as SSC throughout this paper, which is closely linked to the flavor of agricultural products and serves as a key indicator of internal fruit quality. The SSC directly affects sweetness and taste; fruits with a higher SSC are more desirable to consumers [9]. Accurate measurement of SSC provides valuable guidance for decision-making during fruit harvesting, storage, and marketing [10]. With economic development and increasing consumer expectations, higher quality standards have been placed on fruit products. According to a report from the United States Department of Agriculture (USDA), most Chinese consumers prefer fruits that are sweet, juicy, and crisp in texture. This consumption trend has driven growing demand for high-quality fruits. Data from the China Agricultural Yearbook indicate that, in 2023, the import volume of premium fruits increased by 18% year-on-year, reflecting rising consumer expectations for fruit quality and taste. The growing yield and demand for quality necessitate the use of rapid and non-destructive methods for fruit grading [11]. Conventional methods for measuring soluble solids content (SSC) primarily include handheld or benchtop refractometry and laboratory-based chemical analysis. Refractometers estimate sugar concentrations by measuring the refractive index of extracted fruit juice and are commonly used in SSC testing. However, these methods have significant limitations. First, they are destructive, requiring the fruit to be cut open to obtain the juice, which makes them unsuitable for commercial grading or large-scale field testing. Second, the sample representativeness is limited, as only a specific part or a small number of samples are tested, making it difficult to reflect the overall quality of the entire batch. Furthermore, manual operation is prone to subjective bias, which limits repeatability and accuracy [12,13,14]. Chemical analysis methods, such as high-performance liquid chromatography (HPLC), offer high precision but are time-consuming, expensive, and involve complex procedures. They are not suitable for rapid or on-site applications. These limitations hinder their practicality in fruit grading, postharvest processing, and market circulation. Therefore, it is essential to develop a fast and non-destructive method for measuring SSC in milk jujube.
Vis/NIR spectroscopy is an efficient and eco-friendly technique for rapid quantitative analysis [15]. This method irradiates the sample with visible and near-infrared light and captures reflected, transmitted, scattered, and absorbed spectra using spectrometers. When combined with chemometric techniques and mathematical models, Vis/NIRS enables both qualitative and quantitative analysis. The wavelengths used correspond to the overtone and combination bands of vibrational frequencies of hydrogen-containing groups (O–H, N–H, C–H) in organic molecules [16]. By analyzing spectral absorption characteristics, Vis/NIR spectroscopy can accurately detect the internal and external quality, defects, and nutrient composition of fruits and vegetables. This technique enables rapid, non-destructive detection. In recent years, Vis/NIR spectroscopy has been widely applied in agriculture [17,18], food processing [19], petrochemicals [20], and pharmaceuticals [21]. Significant achievements have been made in the non-destructive analysis of SSC and moisture content in fruits. For instance, Hao et al. [22] applied Vis/NIR spectroscopy combined with various spectral preprocessing methods and partial least squares (PLS) regression to quantitatively analyze the soluble solid content (SSC) of jujubes with different colors. Their results showed that, using mixed-color jujube samples for model construction, the calibration set correlation coefficient (Rc2) reached up to 0.884, the prediction set correlation coefficient (Rp2) was up to 0.922, and the root-mean-square error of prediction (RMSEP) decreased to 0.721, indicating high predictive accuracy and good model generalizability. Additionally, Wang et al. [23] developed a self-built online Vis/NIR system to non-destructively detect the SSC of fresh jujubes. Using orthogonal signal correction (OSC) preprocessing and characteristic wavelength selection, the optimal PLS regression model achieved Rc2 and Rp2 values of 0.846 and 0.782, respectively, with an RMSEP of about 2.25, further demonstrating the potential of Vis/NIR for rapid SSC detection in fresh jujubes. However, research on SSC prediction for milk jujubes using this technology remains limited. Therefore, this study aims to investigate the rapid and non-destructive detection of SSC in milk jujube using Vis/NIR spectroscopy.
To improve the predictive performance of Vis/NIR spectroscopy in agricultural applications, researchers have extensively explored data processing methods. Current research focuses on optimizing spectral preprocessing algorithms, selecting characteristic wavelengths, and developing novel modeling strategies [24]. Common preprocessing methods include standard normal variate (SNV), Savitzky–Golay smoothing (SG), multiplicative scatter correction (MSC), and first derivative (FD). These techniques help reduce noise, correct linearity, and improve spectral matching [25,26]. Studies have shown that the combination of SG and SNV often yields favorable results. Widely accepted wavelength selection methods include uninformative variable elimination (UVE) [27] and competitive adaptive reweighted sampling (CARS) [28]. Based on selected wavelengths, deep learning or transfer learning models are typically developed. The general modeling framework includes preprocessing, feature extraction, and model building. However, insufficient attention has been paid to outlier detection and data partitioning, which are critical to model stability and generalization. Numerous studies have demonstrated that removing outliers significantly improves the processing difficulty and model performance. For instance, Zhang et al. [29] proposed a dual verification approach using Monte Carlo cross-validation [30] and Mahalanobis distance. Compared to conventional 3σ- or Mahalanobis-based methods, this approach accounts for data heterogeneity in agricultural samples. The final partial least squares (PLS) model achieved a 15.12% improvement in regression coefficients and a 14.42% reduction in root-mean-square error. However, due to high labeling costs and the rarity of certain fruit defects, such as mold [31], small sample sizes are common, which reduces the stability of Monte Carlo-based methods. To address this, data augmentation offers an effective solution by generating more training samples to enhance generalization and robustness.
This study proposes a data-augmentation-based unsupervised anomaly sample elimination (DAUASE) strategy [32]. First, one-hot encoding and linear interpolation are used to generate synthetic samples for data augmentation. These augmented samples are used to train an SVR model to predict SSC values. Original samples with prediction errors consistently exceeding a set threshold (below 95% accuracy) are identified as outliers.
In addition, dataset partitioning directly influences model performance and generalization. Zhu et al. [33] showed that different partitioning algorithms led to PLS models with performance improvements of up to 25%. However, most Vis/NIRS studies still adopt a single partitioning method, without validating statistical significance [34].
To address these issues, this study develops a rapid and non-destructive SSC detection method for milk jujube using Vis/NIR spectroscopy. The main contributions are as follows:
(1)
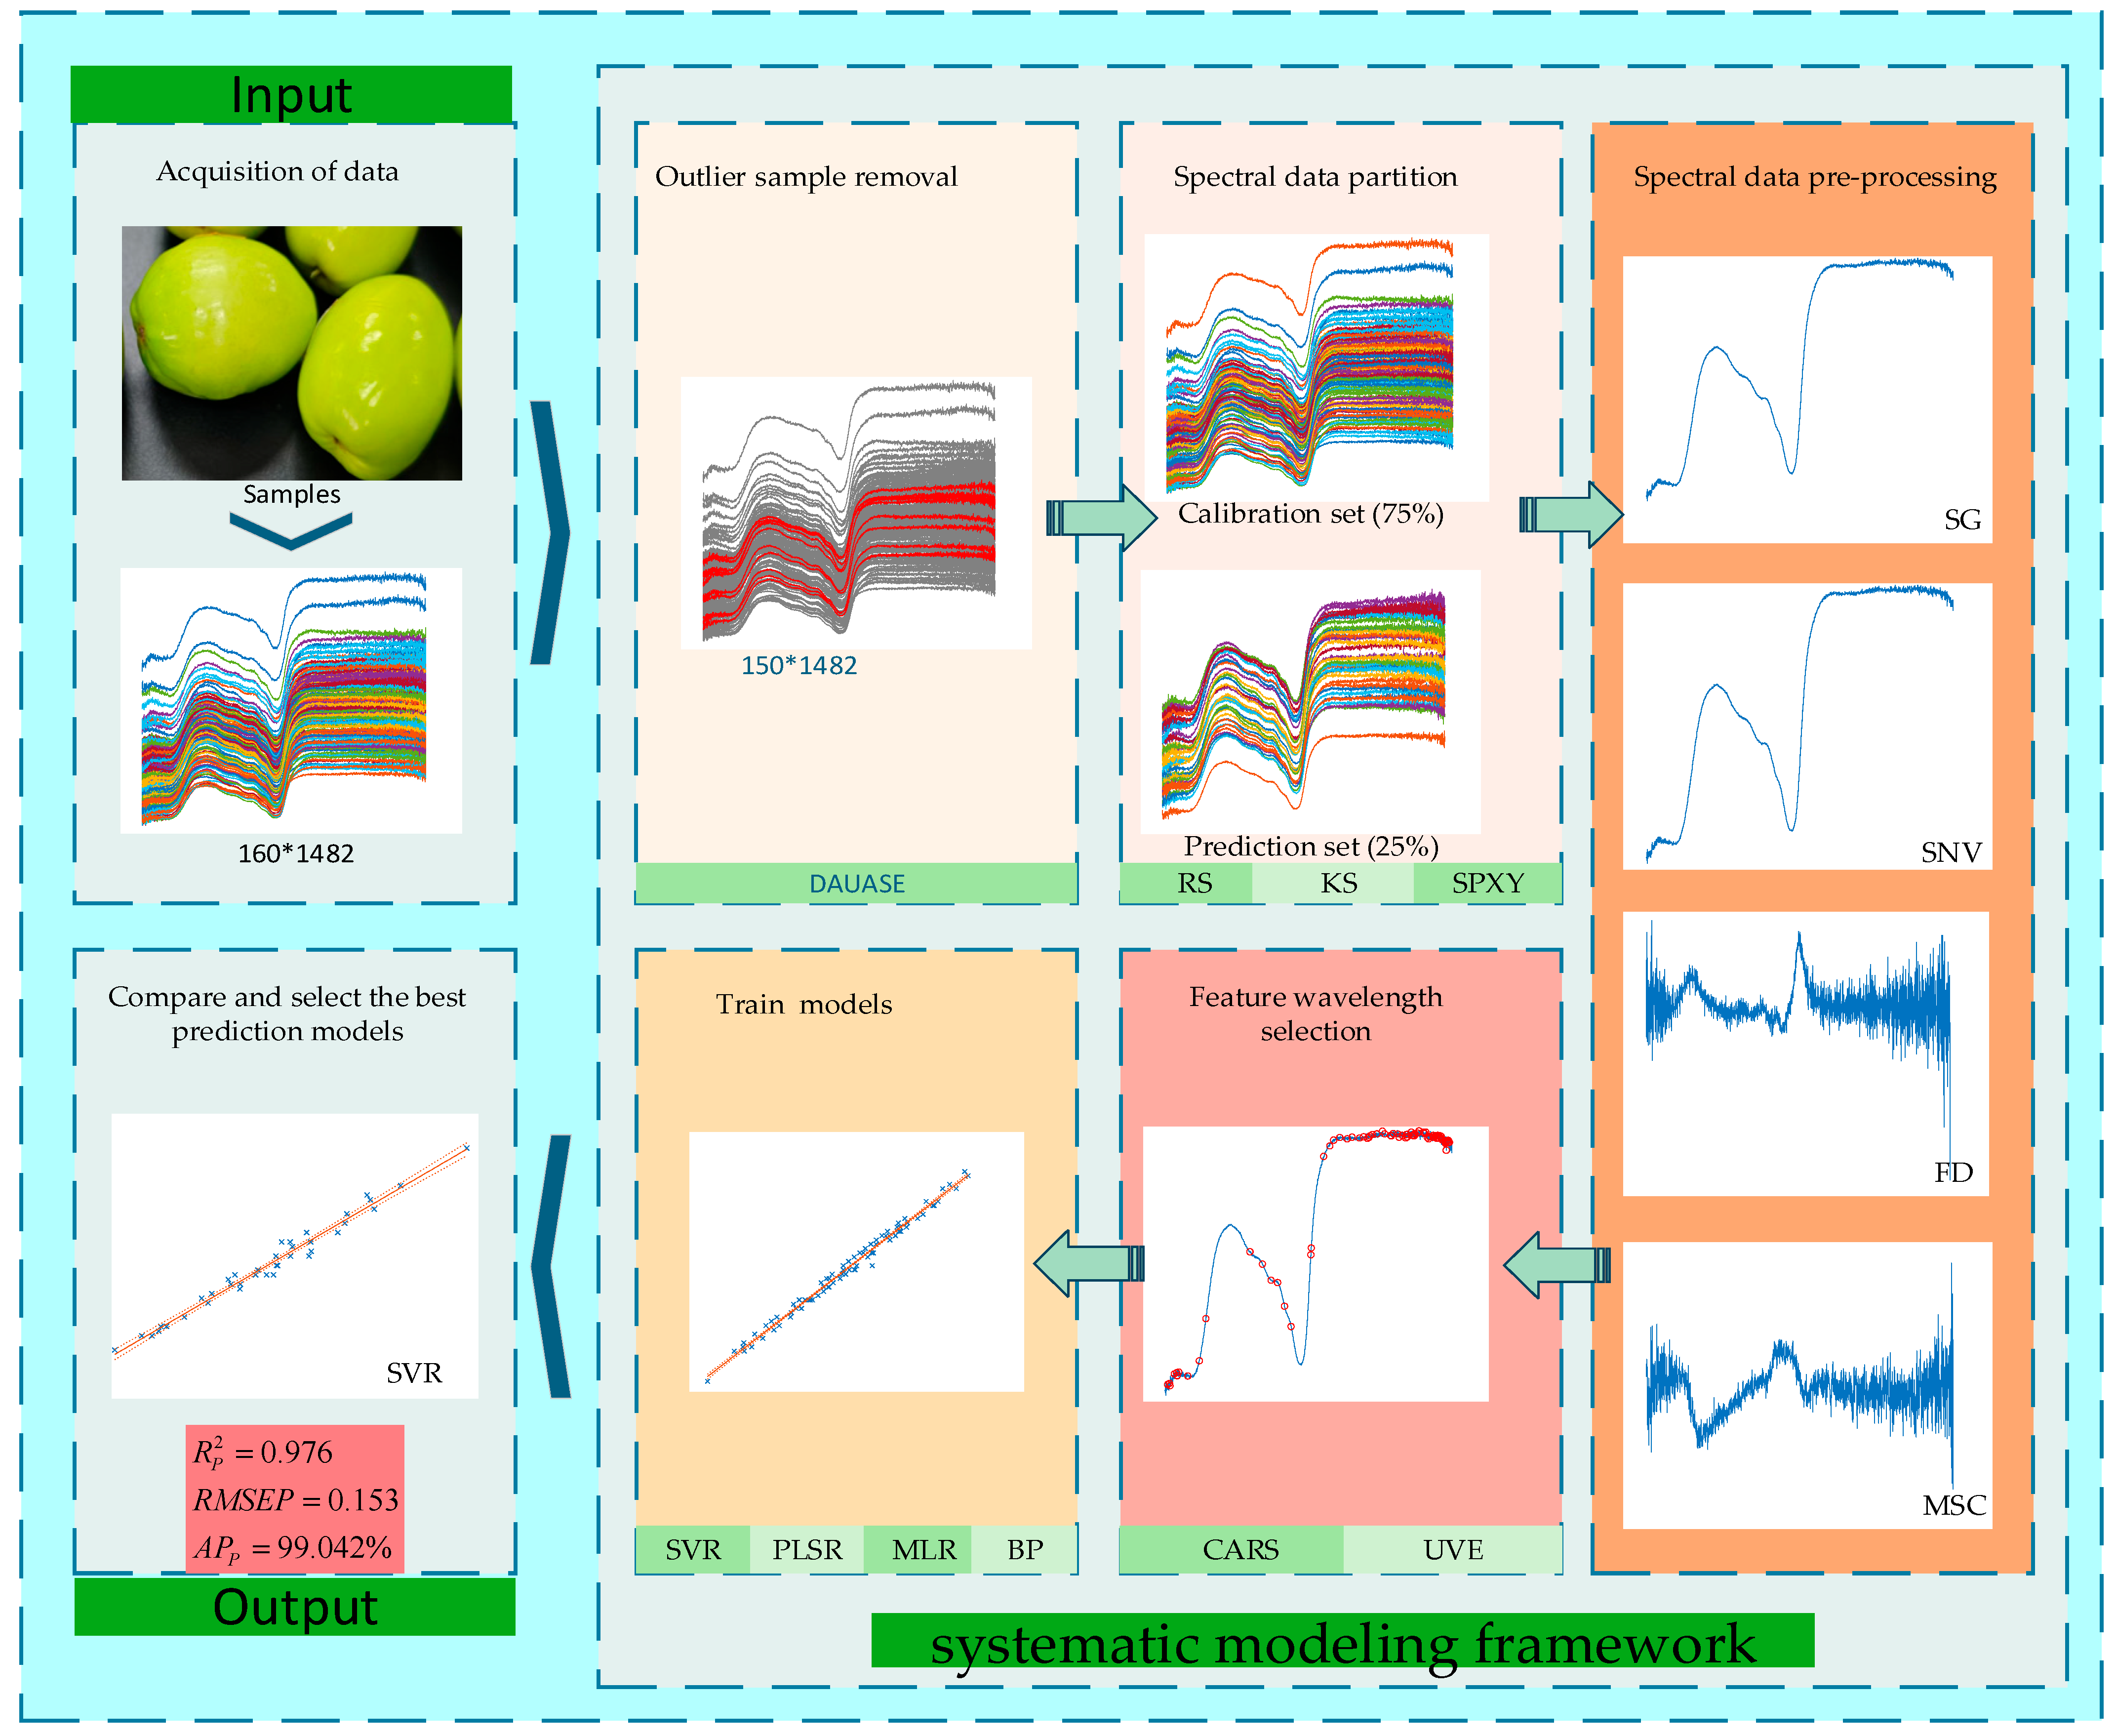
A systematic modeling framework is established, incorporating outlier removal, dataset partitioning, preprocessing, wavelength selection, and model construction. The impact of outlier detection and partitioning strategies on model performance is analyzed.
(2)
A new anomaly sample elimination strategy (DAUASE) is proposed. This approach improves data interpretability and model accuracy.
(3)
Three common dataset partitioning strategies are compared by building identical models on each dataset to evaluate their impact on predictive performance. The optimal partitioning method is identified.
(4)
The influence of various preprocessing techniques (SG, SNV, MSC, FD, and their combinations) on model performance is evaluated to determine the best approach.
(5)
CARS and UVE are employed to select informative wavelengths.
(6)
Several prediction models are compared to identify the most accurate SSC prediction model for milk jujube.
The proposed method provides a theoretical foundation for rapid, non-destructive SSC detection. A complete technical workflow is illustrated in Figure 1.

2. Materials and Methods

2.1. Sample Preparation

Milk jujube samples were purchased from a supermarket in Wolong District, Nanyang City, China. These samples were sourced from Yunnan Province, China. At the time of sampling, the fruits were at the mature stage (light green peel, SSC ≥ 11%). After manual grading, the individual fruit weight ranged from 65 to 150 g, the longitudinal diameter ranged from 5.5 to 7.2 cm, and the transverse diameter ranged from 4.0 to 5.8 cm. To minimize the influence of irrelevant external factors during the experiment, each sample surface was wiped clean before analysis. Only samples with clean and dry surfaces were retained. Obvious defective samples were manually removed. A total of 160 samples were selected and labeled accordingly. The labeled samples are displayed in Figure 2.

2.2. Data Acquisition

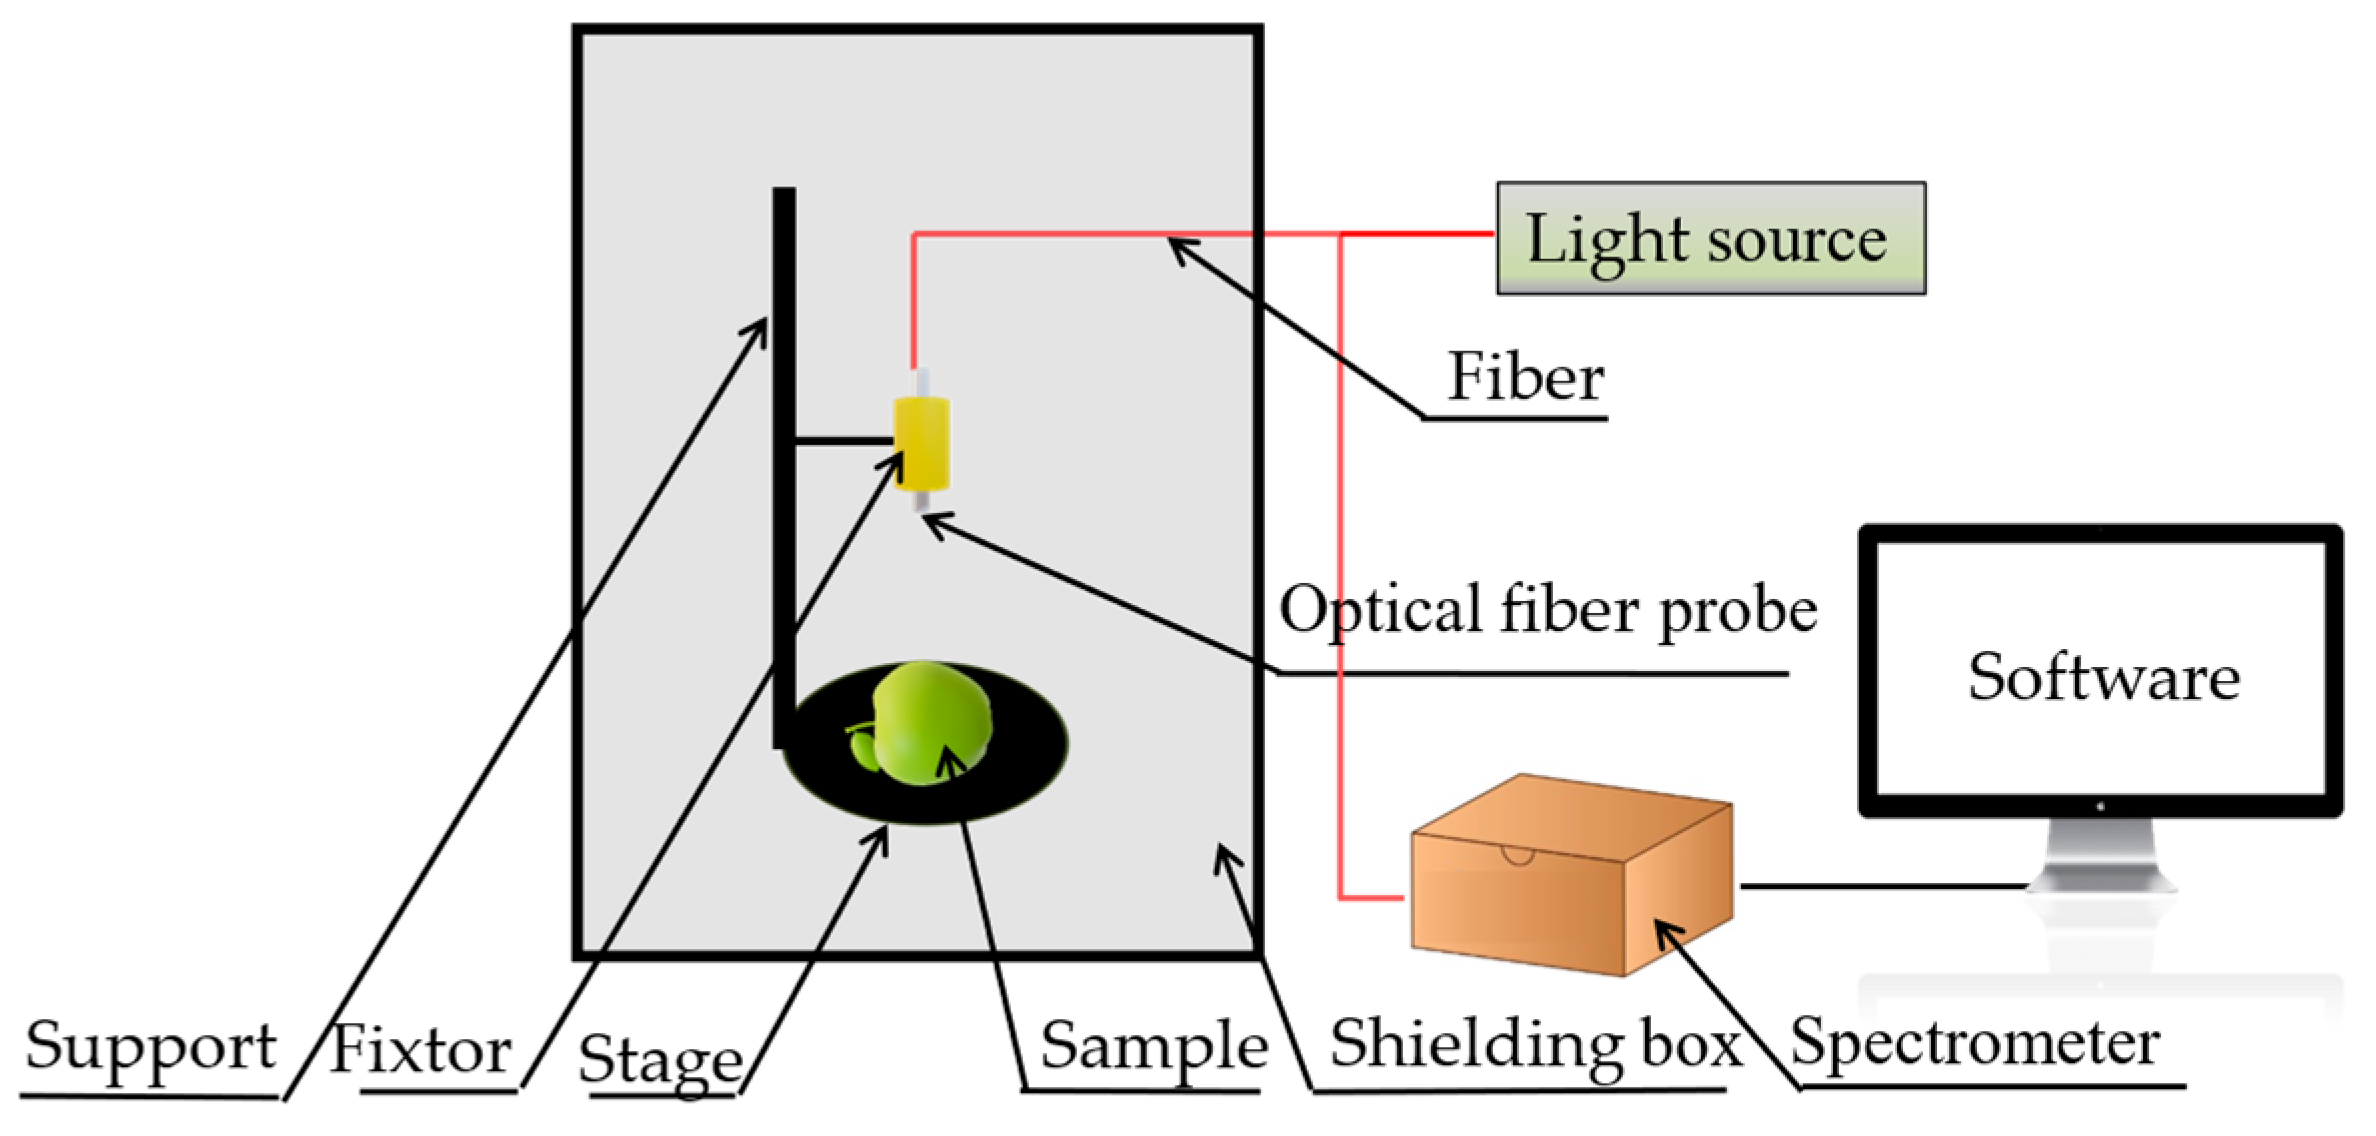
2.2.1. Spectral Data Acquisition

A Vis/NIR spectral detection system was constructed to collect spectral reflectance data of milk jujubes more effectively. The system consisted of a shielding box, a computer, a spectrometer (Ocean Optics, Orlando, FL, USA, USB2000+), a light source (HL-2000-HP-FH, 20.0 W), an optical fiber probe, spectral acquisition software, and so on. The spectral range extended from 340 nm to 1031 nm, covering 2048 wavelength features. Environmental light was effectively blocked by the shielding box, which substantially reduced interference in reflectance data acquisition. A schematic of the detection system is shown in Figure 3.

2.2.2. Measurement of SSC

After spectral acquisition, the SSC of each milk jujube sample was measured using a conventional method. To minimize the influence of uneven internal sugar distribution, fruit pulp from no less than three-quarters of each fruit, including the stem, equator, and calyx ends, was used for testing. Each fruit was cut longitudinally to expose the pulp. Juice was extracted using a manual juicer and dropped onto the prism surface of a digital refractometer (ATAGO PAL-1, ATAGO Co., Ltd., Tokyo, Japan; measuring range: 0–53 °Brix; accuracy: ±0.2 °Brix). The prism was cleaned with distilled water and dried with soft paper before each measurement to prevent cross-contamination. Each sample was measured three times, and the average value was recorded as the final SSC reference.

2.3. Spectral Data Processing Methods

2.3.1. Outlier Elimination

In Vis/NIR spectroscopy-based non-destructive detection, outliers are inevitably present in the raw dataset. Such anomalies may arise due to sample preparation errors, spectral measurement interference, or inaccurate labeling of physicochemical parameters. These samples often exhibit significant deviations in the relationship between spectral features and physicochemical properties compared to the majority. If not removed, these samples can mislead the training of regression models, degrade prediction accuracy, and potentially lead to overfitting.
To address this issue, a data-augmentation-based unsupervised anomaly sample elimination strategy, termed DAUASE, is proposed here. This approach integrates data augmentation with support vector regression (SVR) to identify and eliminate anomalies through statistical analysis of modeling and prediction performance over multiple iterations. Without relying on external labels or discriminative models, this method defines anomalies solely based on prediction error, offering strong generalizability and adaptability. The procedure is outlined as follows:
(1)
Data Augmentation: The input variable matrix X = x 1 , x 2 , x n Τ n × b and output variable matrix Y = y 1 , y 2 , y n Τ n × 1 of the original samples are randomly paired to generate the augmented input matrix X ˜ = x ˜ 1 , x ˜ 2 , x ˜ n Τ n × b and output matrix Y ˜ = y ˜ 1 , y ˜ 2 , y ˜ n Τ n × 1 . The augmentation is governed by the following formulation:
x k ˜ = λ x i + ( 1 λ ) x j
y ˜ k = λ y i + ( 1 λ ) y j
where (xi, yi) and (xj, yj) are two samples randomly selected from the original dataset. The mixing weight λ is drawn from a beta distribution controlled by the parameter γ. In this study, a beta (1, 1) distribution was selected (i.e., γ = 1), which ensures equal probability distribution between two samples. This configuration achieves a balance between preserving original characteristics and introducing diversity, avoids extreme bias in λ, enhances the representativeness of the generated samples, and improves model stability. Furthermore, this strategy introduces no subjective bias, making it neutral and suitable for unsupervised outlier identification.
(2)
Model Construction: In each iteration, a subset of augmented samples is randomly selected as a calibration set to build an SVR model.
(3)
Prediction and Accuracy Recording: The constructed model is used to predict all original samples. Prediction accuracy is recorded for each sample.
(4)
Preliminary Outlier Detection: Samples with prediction accuracy below a predefined threshold (e.g., 95%) are preliminarily labeled as outliers.
(5)
Repetition and Statistical Evaluation: The above process is repeated multiple times. Samples frequently identified as outliers (e.g., more than 10% of iterations) are finally determined as anomalous.
(6)
Outlier Removal: All samples identified as final outliers are removed from the original dataset.

2.3.2. Dataset Partitioning

Three algorithms were employed to divide the dataset into calibration (75%) and prediction (25%) sets: random selection (RS), Kennard–Stone (KS), and sample set partitioning based on joint X-Y distances (SPXY) [35]. RS performs fully random selection, representing the baseline of random partitioning. To minimize stochastic variance, the RS results presented are based on the top five subsets from multiple iterations. The KS method maximizes the Euclidean distance in spectral space, effectively ensuring boundary coverage and validating spectral uniformity. In contrast, SPXY innovatively considers both spectral (X) and physicochemical (Y) distances, highlighting the impact of Y-distribution on model generalization. The use of these three partitioning methods allows not only for the identification of the most representative calibration samples and optimal partitioning strategy but also for the mitigation of limitations inherent to any single partitioning approach. This provides theoretical support for selecting optimal partitioning strategies under varying data characteristics.

2.3.3. Data Preprocessing

To attenuate environmental noise and baseline drift, several preprocessing techniques were applied. These included SG, SNV, FD, and MSC. Combinations of these methods were also considered to identify the optimal preprocessing strategy.
SG smoothing, introduced by Savitzky and Golay in 1964, performs denoising via least squares polynomial fitting [36]. It utilizes a moving-window polynomial to suppress high-frequency noise while retaining low-frequency signals, thereby improving the signal-to-noise ratio. Based on spectral resolution and prior experience, a five-point smoothing window was adopted. The smoothing formula at wavelength k is given by
x k , s m o o t h = 1 H i = w + w x k + i h i
where hi are smoothing coefficients, and H is a normalization factor.
SNV normalizes and mean-centers each individual spectrum to reduce baseline shifts caused by surface scattering [37]. It transforms raw reflectance into a standard normal distribution, which mitigates non-chemical variations such as peel thickness in milk jujubes. This method enhances contrast in sugar-related spectral features, improving chemical specificity. The transformation is given by
x S N V = x i μ σ
where xi is the spectrum of the i sample, μ is the mean, and σ is the standard deviation.
FD is commonly used for baseline correction and resolving overlapping peaks. It calculates reflectance differences between adjacent wavelengths to highlight slope changes in absorption features, suppressing background noise and enhancing spectral clarity. For a wavelength k and gap size g, the first derivative is computed as follows:
x k , F D = x k + g x k g g
MSC, similar to SNV, removes nonlinear scattering effects by performing linear regression of each spectrum against the mean spectrum [38]. It minimizes variability induced by surface roughness and improves spectral consistency. The MSC transformation is expressed as follows:
x M S C = x i b 0 b
where xi is the original spectrum of the i sample, while b0 and b are regression coefficients.

2.3.4. Feature Wavelength Selection

In Vis/NIR spectroscopy analysis, the raw spectral data are typically characterized by high dimensionality, substantial inter-variable redundancy, and significant noise interference. In this study, each milk jujube sample was recorded across the 340–1100 nm wavelength range, yielding a total of 1482 wavelength points per sample. This high-dimensional feature space may result in the so-called “curse of dimensionality”, increasing model complexity, elevating the risk of overfitting, and impairing prediction performance. Therefore, effective feature wavelength selection is essential prior to model development to enhance the modeling efficiency and improve the generalization capability. To address this, two mainstream spectral feature selection algorithms were employed (CARS and UVE), aiming to identify key wavelengths most relevant to SSC in milk jujubes.
CARS is a variable selection algorithm inspired by the principle of survival of the fittest, well suited for high-dimensional spectral datasets [39]. It utilizes Monte Carlo sampling to generate multiple subsets and, in each iteration, computes regression coefficients using PLS regression. Variables are then progressively eliminated via an exponentially decreasing function. By evaluating the magnitude of regression coefficients, CARS assigns weights and retains the variables most strongly correlated with the target variable, such as SSC. Finally, cross-validation is employed to select the subset of variables yielding the lowest prediction error as the optimal feature set. CARS effectively removes redundant and irrelevant information, improving modeling efficiency and predictive accuracy, making it especially advantageous when the number of variables far exceeds the number of samples.
UVE evaluates the stability of each variable by constructing a set of random variables and assessing all variables using PLS regression [40]. Stability is measured based on the confidence intervals of the regression coefficients. Variables with stability lower than that of pseudo-variables are deemed uninformative and eliminated. UVE is logically straightforward, easy to implement, and suitable for initial screening and rapid noise reduction in spectral variables.

2.3.5. Prediction Model Development

In Vis/NIR spectral analysis, the construction of an accurate prediction model is the final and most critical step in the analytical workflow. To comprehensively evaluate the performance of selected feature wavelengths under various modeling approaches and identify the most effective strategy for non-destructive SSC prediction in milk jujubes, four representative predictive models were employed for comparative analysis: support vector regression (SVR), partial least squares regression (PLSR), Extreme Learning Machine (ELM), and backpropagation neural network (BP). These models span linear and nonlinear paradigms, encompassing both classical statistical and machine learning methodologies, enabling a multidimensional evaluation of model suitability and stability for high-dimensional spectral data.
SVR is a nonlinear regression method grounded in statistical learning theory [41]. It maps input data into a higher-dimensional space using kernel functions, thereby capturing complex nonlinear relationships while maintaining the model generalization ability. SVR is particularly effective for small-sample, high-dimensional scenarios, and it has demonstrated strong performance in spectral modeling tasks. PLSR, a classical linear method, projects high-dimensional data into a low-dimensional latent space, effectively addressing multicollinearity among variables. Its modeling stability and computational efficiency have made it one of the most widely used techniques in spectral analysis. ELM [42] is a single-hidden-layer feedforward neural network characterized by randomly generated input weights and biases. The output weights are analytically determined via least squares, resulting in high training speed and a simplified architecture, making it suitable for large-scale, rapid spectral modeling. BP neural network [43] is a typical multilayer feedforward neural network with strong nonlinear fitting capability. It optimizes network weights through error backpropagation. However, BP is sensitive to initial weight settings, prone to local optima, and typically requires a longer training time. Careful network architecture design and parameter tuning are necessary to achieve optimal performance.
Each of the above models was trained and evaluated on the same dataset. In the support vector regression (SVR) model, a linear kernel function was used, and the input data were standardized before modeling to improve the model’s stability and generalization. In the partial least squares regression (PLSR) model, the number of retained latent variables was set to 60, based on cumulative explained variance and model performance evaluation. For the backpropagation (BP) neural network, an adaptive architecture optimization strategy was adopted to automatically search for the optimal number of hidden neurons, in the range of 1 to 20. The network had a single hidden layer, with “logsig” used as the activation function in the hidden layer and “purelin” in the output layer. The initial learning rate was set to 0.01 and was adaptively adjusted during training. The maximum number of training iterations was 400, and the validation set allowed a maximum of 5 failures. The minimum mean squared error (MSE) on the test set was used as the criterion for selecting the optimal model. Their performance was compared using unified evaluation metrics, assessing the models’ fitting ability, predictive accuracy, and robustness. The optimal model was ultimately selected to enable efficient, non-destructive quantitative SSC prediction in milk jujubes.

2.4. Model Evaluation Index

To comprehensively evaluate the models’ performance, the following metrics were employed: the average precision of the calibration set (APc), average precision of the prediction set (APp), calibration set coefficient of determination (RC2), root-mean-square error of calibration (RMSEC), prediction set coefficient of determination (RP2), and root-mean-square error of prediction (RMSEP). Average accuracy measures the proportion of correct predictions among all predictions; it can reflect model performance when regression outputs are discretized for practical classification-related analysis. Root-mean-square error quantifies the absolute differences between predicted and actual values. It is sensitive to larger errors, making it suitable for tasks where high prediction precision is critical. The coefficient of determination assesses the goodness of fit by evaluating how well the model explains the variance in the observed data. Each metric reflects model performance from a different perspective, ensuring a more holistic assessment. By combining these metrics, the model’s predictive capability can be comprehensively examined from both accuracy and stability perspectives, facilitating a clearer comparison between different feature selection strategies or modeling approaches. The evaluation metric formulae for the prediction set are shown below:
A P p = i = 1 n 1 R i P i R i × 100 % n
R p 2 = 1 ( R i P i ) 2 ( R i m ) 2
R M S E p = ( P i R i ) 2 n
where Pi is the actual value of the i sample, Ri is the predicted value of the i sample, n is the number of samples in the dataset, and m is the mean of the actual values. The AP result is expressed as a percentage. The corresponding formulae for the calibration set are identical, with only the dataset being replaced accordingly.

3. Results and Discussion

3.1. Analysis of Outlier Elimination Results

In this study, outlier samples were eliminated using the DAUASE algorithm. The calibration set was set to 5% of the augmented dataset. The threshold for outlier determination was set at 95% prediction accuracy. The maximum number of iterations was limited to 20. The final threshold was adjusted to 10% of the maximum iteration count. The elimination results are illustrated in Figure 4.
As shown in Figure 4, a total of 10 samples were ultimately identified as outliers. To evaluate the effectiveness and necessity of outlier elimination, as well as its influence on model performance, the dataset was divided into a calibration set and a prediction set at a 3:1 ratio before and after outlier removal. After SG convolutional smoothing and standard normal variate (SG + SNV) preprocessing, a CARS-SVR model was constructed. The prediction results were compared across different dataset versions. For each dataset, 400 iterations were conducted, and the optimal result was selected. In the CARS algorithm, the number of Monte Carlo samplings was set to 500, and the cross-validation was repeated 20 times. A detailed comparison of the SVR model built from datasets with different splitting methods is presented in Table 1.
As observed in Table 1, the datasets processed with DAUASE outlier elimination achieved superior performance in all metrics. After removing outliers, models built on differently partitioned datasets demonstrated higher average accuracy and determination coefficients, along with lower standard deviations. For instance, using the RS algorithm, the prediction accuracy of the prediction set improved from 97.683–98.115% to 98.610–98.834%, the determination coefficient rose from 0.922–0.969 to 0.956–0.971, and the standard deviation declined from 0.258–0.330 to 0.184–0.209. These improvements significantly enhanced the model fitting and prediction accuracy. The results indicate that outliers increased the data variability and uncertainty, thus impairing the model stability and reliability. Therefore, the elimination of outliers not only enhanced the data quality and model performance but also improved the prediction accuracy, generalization capability, and output stability [44]. Additionally, DAUASE facilitated more robust outlier detection by integrating multiple predictions rather than relying on a single assessment. This makes it particularly suitable for spectral modeling tasks involving small sample sizes or label noise. Table 1 also reveals that datasets split using the KS algorithm produced the best SVR model predictions.

3.2. Data Splitting Method

Although the RS algorithm yielded higher accuracy on the calibration set, its performance on the prediction set was inferior to that of the KS algorithm. Moreover, the SPXY algorithm performed worse than both RS and KS on both sets. This may be attributed to the KS algorithm’s focus on spectral data alone, avoiding the interference and noise that can result from the inclusion of physicochemical values. While SPXY aims to enhance generalization through multidimensional information, the inclusion of physicochemical data may reduce stability and predictive power under certain conditions. Although RS offers convenience and intuitive simplicity, its inherent randomness leads to high variability, resulting in time-, labor-, and computation-intensive experiments. In contrast, the KS algorithm effectively captures spectral features during sample splitting, thereby improving the model’s accuracy and robustness. Consequently, KS is considered to be a more effective method for sample partitioning [45,46]. The distribution of the SSC values of the dataset partitioned by different algorithms is shown in Figure 5.
As shown in Figure 5, for all of the data partitioning strategies used, both the maximum and minimum values of the calibration and prediction sets successfully covered the range of the original data, ensuring the representation of extreme values. The mean values of the subsets were also close to those of the original dataset. More specifically, the standard deviations of the KS-partitioned calibration and prediction sets were 1.018 and 0.980, respectively, closely matching the original dataset’s standard deviation of 1.008. This demonstrates the KS algorithm’s excellent performance in preserving the distributional characteristics of the data. In contrast, RS performed slightly worse, while SPXY showed substantial variation in standard deviation, indicating a limited capacity to represent the dataset comprehensively. Taken together, the analysis of physicochemical variables’ Y-distributions confirms the superior performance of KS in terms of both mean and standard deviation similarity. Therefore, the KS algorithm was selected for dataset partitioning in subsequent experiments to improve model stability, prediction accuracy, and representativeness.

3.3. Optimal Preprocessing Methods

Under the condition of feature wavelength selection by the CARS algorithm, the impact of different preprocessing methods on the SVR model predictions is summarized in Table 2. The table presents the predictive performance metrics of SVR models developed under different preprocessing methods on both the calibration and prediction sets, providing a comprehensive evaluation of the impact of each preprocessing strategy on the model performance.
A comprehensive analysis of Table 2 reveals that preprocessing had a substantial impact on the prediction accuracy of SSC in jujube fruit. The performance varied significantly across different methods, highlighting the importance of selecting an appropriate preprocessing strategy prior to model construction. Among all methods, the SG + SNV combination yielded the best overall results. This superiority is likely due to the complementary effects of SG smoothing, which effectively reduces high-frequency noise, and standard normal variate (SNV), which corrects for scatter effects and normalizes differences among samples [47,48]. Additionally, this combination reduced both random noise and systematic errors caused by physical variations, as well as improving the signal clarity by eliminating irrelevant spectral information [49]. With SG + SNV, the average prediction accuracy reached 99.042%, the coefficient of determination was 0.976, and the RMSEP was as low as 0.153 °Brix, indicating excellent generalization ability and robustness. As such, this method was selected for subsequent modeling.
Several other methods also performed well. For instance, FD + SG and SNV + FD achieved similarly high predictive accuracies (98.499% and 98.529%, respectively), with RP2 values above 0.95 and RMSEP values close to 0.2 °Brix. These methods benefited from the use of FD preprocessing, which enhances spectral resolution by emphasizing subtle changes and correcting baseline drift. When combined with SG or SNV, FD further improved the signal-to-noise ratio. The FD + SG combination attained the highest calibration performance, with an average precision of 99.195%, RP2 of 0.992, and a remarkably low RMSEC of 0.094 °Brix, suggesting that this method is particularly effective in model training. However, its prediction performance slightly lagged behind SG + SNV, indicating potential overfitting or reduced robustness on unseen data. In contrast, preprocessing methods involving MSC, such as SG + MSC or SNV + MSC, generally yielded moderate performance. For example, SG + MSC achieved an RP2 of only 0.368 on the prediction set, along with a relatively high RMSEP of 0.790 °Brix, suggesting limited ability to correct complex variations in sample matrices in this study. The raw spectra yielded the poorest results, with an RP2 of 0.439 and RMSEP of 0.744 °Brix on the prediction set, highlighting the necessity of preprocessing to remove noise, correct scattering, and enhance spectral interpretability.
It is noteworthy that the number of features extracted by CARS varies considerably depending on the preprocessing method used, and this variation exhibits a nonlinear relationship with the final model performance. For example, the SG preprocessing method selected only four features, and the corresponding model showed low coefficients of determination on both the calibration and prediction sets. This indicates that SG preprocessing failed to effectively retain spectral information relevant to SSC. Although SG has a smoothing effect, it may also attenuate important absorption bands while removing noise. In contrast, the SG + SNV preprocessing combination yielded 81 selected features and achieved the best model performance. This suggests that SG + SNV not only improves the signal-to-noise ratio and reduces scattering effects but also better preserves key spectral variables associated with SSC. These features are likely to represent important spectral regions that reflect changes in fruit’s sugar content. Compared with other preprocessing strategies, this feature subset is moderate in size, information-rich, and closely related to the chemical essence of SSC, making it the most representative set of variables in this study. However, when the number of selected features continued to increase—for instance, SG + MSC resulted in as many as 266 features—the model performance declined. This indicates that a larger number of features does not necessarily lead to better performance. An excessive number of redundant or irrelevant features may introduce noise, increase multicollinearity among variables, and cause model overfitting, ultimately weakening its generalization capability.
In summary, appropriate combinations of preprocessing techniques—especially SG + SNV—can significantly enhance the accuracy and stability of the model. Their ability to suppress noise and correct spectral distortion helps in identifying a moderate, information-dense, and strongly relevant feature subset, which supports the development of more robust and accurate predictive models. This is particularly valuable for constructing reliable SSC prediction models for jujubes. These insights also provide meaningful guidance for preprocessing selection in future studies on other jujube varieties or similar agricultural products.

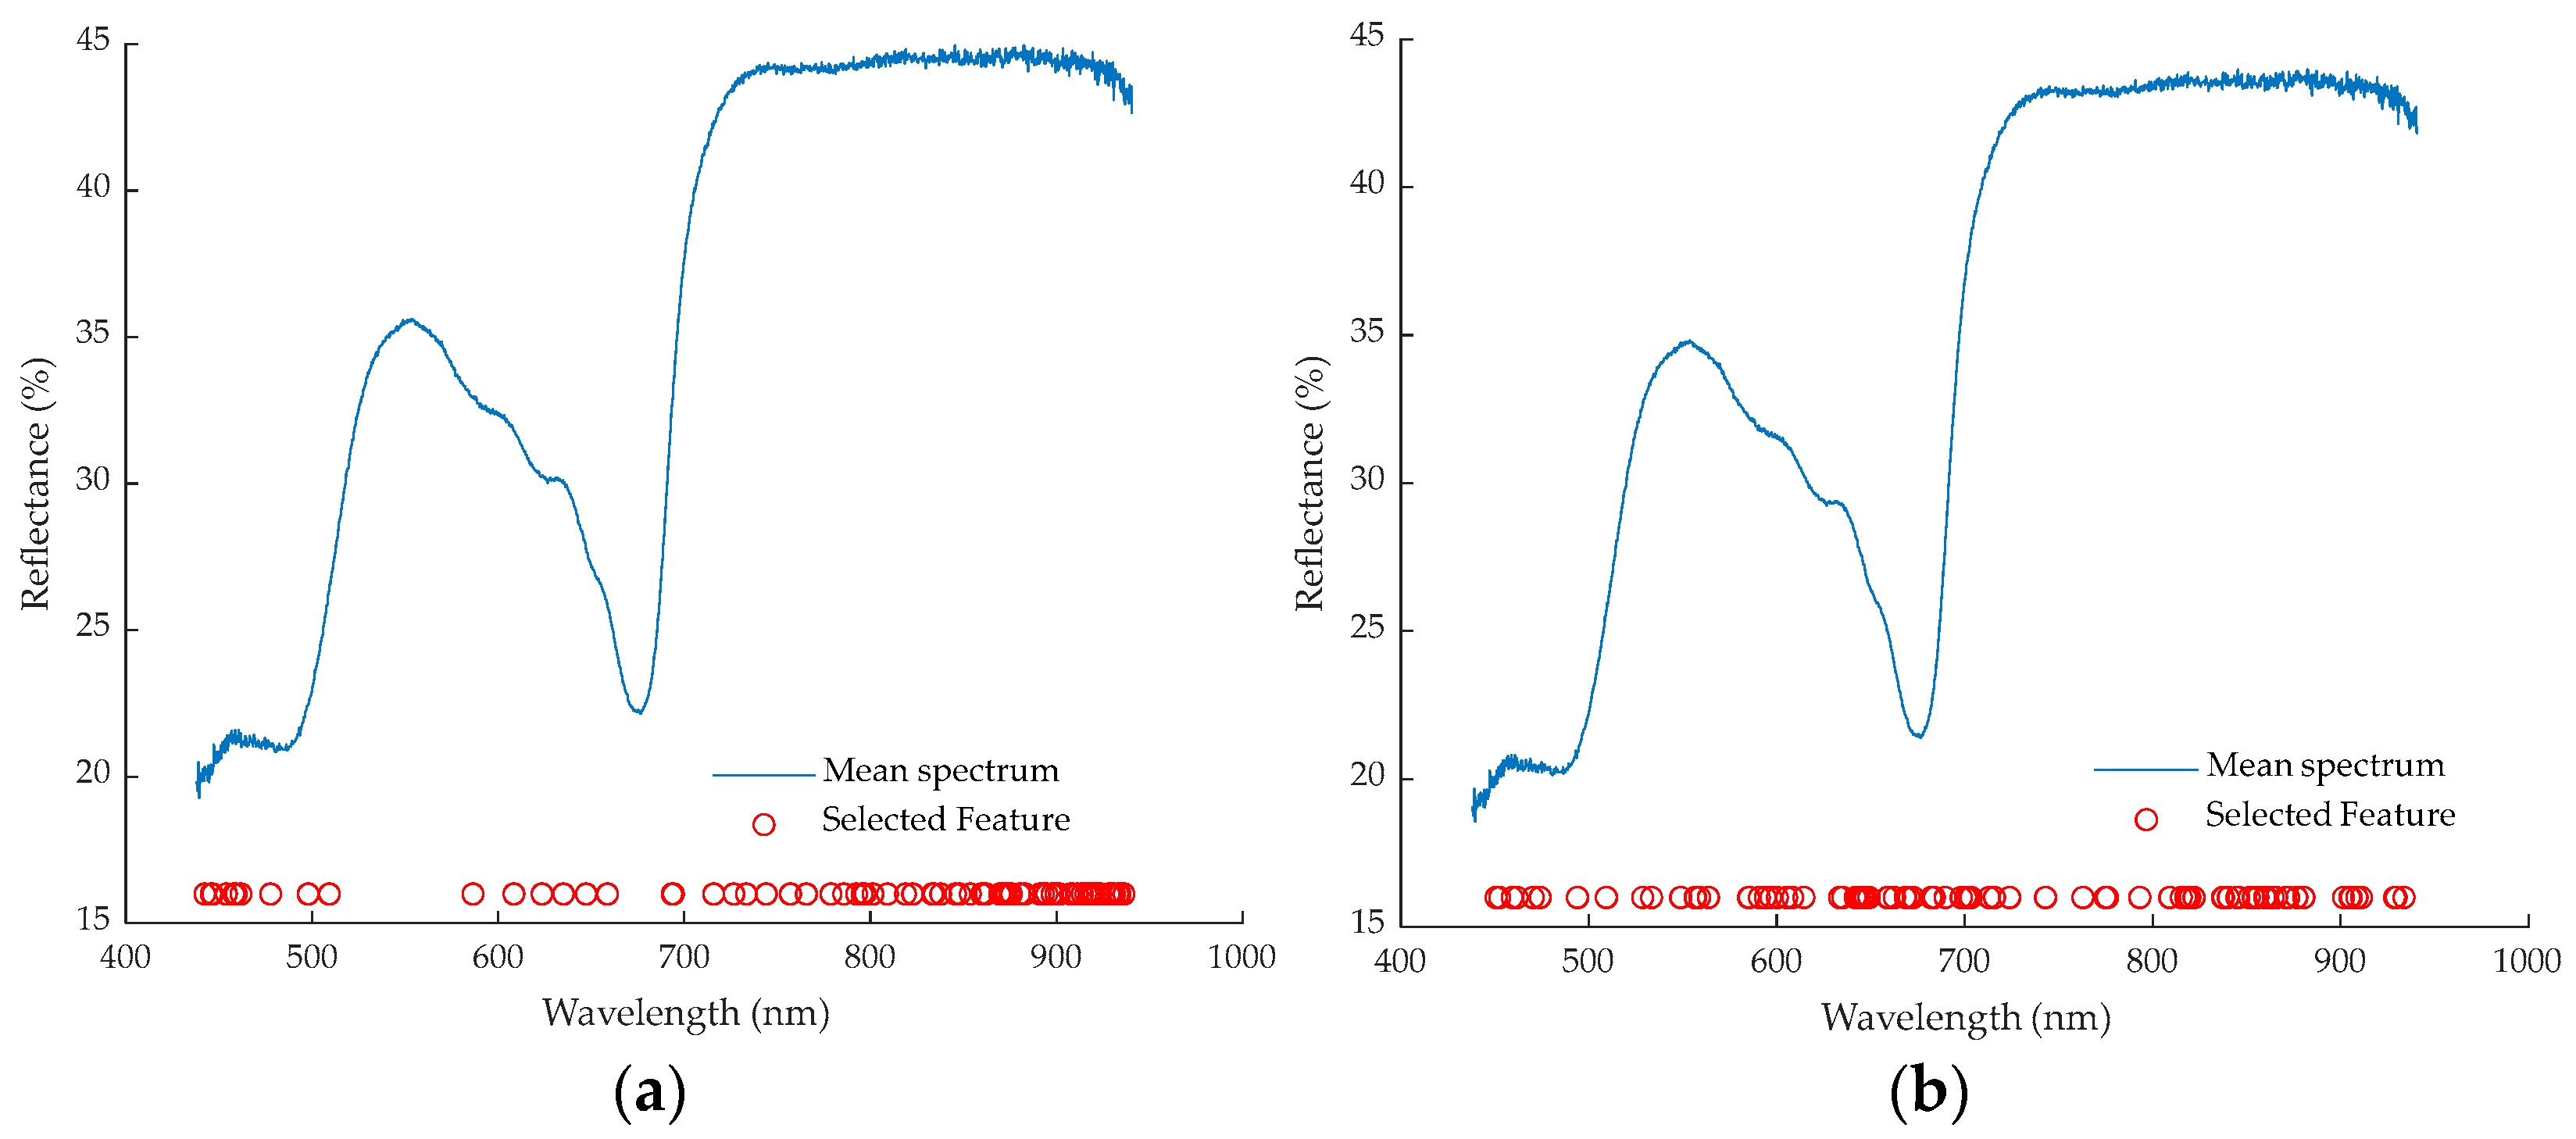
3.4. Feature Wavelength Selection Methods

To identify the optimal strategy for feature wavelength selection and reduce data dimensionality, the preprocessed dataset (SG + SNV) was subjected to CARS and UVE algorithms. Their effectiveness in wavelength selection and SVR modeling performance was evaluated. The predictive performance comparison of SVR models based on selected wavelengths is illustrated in Figure 6.
The results show that the CARS-SVR model outperformed the UVE-SVR model on the prediction set. CARS selected 81 optimal variables, fewer than UVE’s 89, demonstrating greater precision. This can be explained by the small sample size (n = 160) relative to the number of spectral bands, making it a typical high-dimensional, small-sample problem. Under such conditions, UVE showed sensitivity to noise and sample distribution, resulting in unstable wavelength selection across training sets. Moreover, UVE did not account for inter-variable redundancy, often retaining overlapping wavelengths that degraded the generalization ability. In contrast, CARS used iterative elimination and model feedback to identify variables with high predictive value. The selected wavelengths were concentrated in key near-infrared absorption regions, such as around 970 nm, enabling the construction of a more accurate and generalizable model. Especially under the current high-redundancy conditions, CARS demonstrated better adaptability and robustness [50,51]. These findings highlight that the variable selection performance depends not only on algorithmic design but also on dataset structure, noise level, and target variable characteristics. Therefore, dimensionality reduction strategies should be problem-specific rather than universally applied.
After 400 iterations, the CARS algorithm’s optimal wavelength selection process was as depicted in Figure 7.
In Figure 7a, the number of variables steadily decreased with the sampling iterations, especially during the first five iterations. As shown in Figure 7b, RMSECV reached its lowest point at iteration 165, indicating that most irrelevant variables were eliminated prior to this iteration. Beyond this point, useful variables may have been mistakenly discarded, leading to performance degradation. Figure 7c illustrates the regression coefficient changes, with a vertical blue line marking iteration 165—indicating the optimal variable subset, consisting of 81 wavelengths. The feature distribution selected by both algorithms is displayed in Figure 8.
Figure 8a shows that CARS selected wavelengths concentrated in two regions: 440–465 nm and 780–940 nm. These regions are likely associated with SSC-related spectral features. Compounds containing C–H and O–H functional groups in jujube cause reflectance variations in these bands [52], particularly in the 780–940 nm near-infrared region, which is sensitive to sugar molecular vibrations. This is because the 760–940 nm region corresponds to the first or second overtone absorption bands of O–H groups, which respond strongly to sugars and water. Meanwhile, the 800–900 nm region corresponds to the second or third overtone, or to combination bands of C–H groups, which are closely related to organic molecules and sugars. In particular, the 830–940 nm band has been repeatedly confirmed in the detection of soluble solids content (SSC) in various fruits such as citrus [23] and fresh jujubes [53], showing significant predictive relevance for sugar content. This indicates the importance of these bands for identifying key chemical and physical traits in the samples. Figure 8b shows that the UVE-selected wavelengths were mainly in the 580–620 nm, 630–720 nm, and 810–880 nm regions. Compared with CARS, UVE emphasized the relationship between variable stability and regression coefficient significance, effectively eliminating irrelevant and redundant bands. The 580–720 nm visible range typically contains information on surface color, chlorophyll, and some sugar metabolites [54]. The 810–880 nm range overlaps with the CARS selections, suggesting that the selected wavelengths may be related to the second or third harmonic absorptions of O–H and C–H groups in sugar molecules [55]. Although UVE selected slightly fewer variables, the chosen regions were more concentrated, potentially simplifying model construction. However, UVE’s strict redundancy elimination may have excluded weakly correlated but valuable wavelengths, reducing generalization.
In summary, the CARS algorithm selected fewer wavelengths, reduced the data size and computational load, improved the processing speed, and maintained high prediction accuracy. UVE exhibited strong capabilities in information compression and dimensionality reduction during feature wavelength selection. However, it was slightly inferior to CARS in terms of prediction accuracy. This further highlights the trade-off between different feature selection strategies during model construction, indicating that an appropriate method should be selected based on specific research objectives and comprehensive model performance evaluations. Given that the CARS algorithm achieved a favorable balance between feature selection efficiency and prediction accuracy, it was employed in all subsequent experiments for feature wavelength selection in this study.

3.5. Conventional Regression Methods

In summary, this study adopted the KS algorithm for dataset partitioning, the SG + SNV method for spectral preprocessing, and the CARS algorithm for feature selection. Based on these settings, four predictive models—SVR, PLSR, MLR, and BP neural networks—were constructed and compared. The scatter plots of predicted versus actual SSC for these models are shown in Figure 9.
As depicted in Figure 9, the SVR model achieved an average prediction accuracy of 99.132% (calibration) and 99.042% (prediction), with coefficients of determination of Rc2 = 0.987 and Rp2 = 0.976, alongside RMSEC and RMSEP values of 0.118 and 0.153, respectively. These results indicate that, under the same dataset, preprocessing, and feature selection conditions, the SVR model outperformed the other three models in terms of prediction accuracy. Both the calibration and prediction datasets exhibited a close alignment of the actual SSC values with the predicted values along the regression line, demonstrating a strong linear correlation. This high consistency suggests that the SVR model effectively captured the variation trend of SSC and provided reliable prediction results. In contrast, the modeling performance of PLSR and MLR was constrained by their linear assumptions, limiting their ability to capture potential nonlinear relationships between input features and target variables. Although the BP neural network possesses nonlinear modeling capabilities, its performance was somewhat unstable due to its sensitivity to the initial weight settings. Furthermore, the tight clustering of data points in the SVR scatter plots reflects its superior predictive precision, which can be attributed to its use of kernel functions and regularization parameters to capture nonlinear characteristics and prevent overfitting, thereby enhancing the model’s generalization and prediction ability. Overall, SVR exhibited superior performance in nonlinear modeling, overfitting control, high-dimensional data handling, and error minimization [56]. These findings underscore the superiority of the SVR model under the specific conditions of this study and suggest that it serves as an effective and accurate tool for the rapid, non-destructive detection of SSC in milk jujubes.

3.6. Discussion

Non-destructive detection of soluble solids content (SSC) in jujube varieties using Vis/NIR spectroscopy has been extensively explored in previous studies. For example, Hao et al. [22] developed a Vis/NIR model for different-colored winter jujubes and achieved a prediction Rp2 of 0.922 and RMSEP of 0.721, demonstrating the feasibility of this technology in SSC prediction for jujubes.
Building upon this foundation, the present study proposes a more systematic modeling framework tailored for milk jujube SSC prediction, incorporating key steps such as outlier removal, dataset partitioning, spectral preprocessing, wavelength selection, and model construction. By introducing a novel unsupervised outlier detection method based on data augmentation (DAUASE) and utilizing CARS for effective feature selection, our final model achieved a significantly improved performance, with a prediction R2P of 0.976 and RMSEP of 0.153. These results highlight the effectiveness and advancement of the proposed methodology for rapid, non-destructive SSC assessment in milk jujubes.
Nevertheless, several limitations should be acknowledged. Both the DAUASE and CARS algorithms inherently involve stochastic processes and require repeated runs to achieve optimal results, which may increase computational cost and reduce deployment efficiency. Moreover, due to the relatively small sample size (n = 150) and the absence of an independent validation set or cross-validation, the generalization ability of the model under broader or more diverse datasets remains uncertain. Real-world factors such as sample acquisition time, lighting conditions, and batch variability were not fully investigated, which could affect model stability in practical applications.
Despite these limitations, the proposed Vis/NIR-based SSC prediction model offers high adaptability and strong potential for practical implementation. It provides a solid foundation for developing portable or embedded devices for the rapid quality assessment of milk jujubes, particularly suitable for postharvest grading, origin acquisition, and on-site quality control. In the broader supply chain context, this approach could enhance efficiency, reduce subjective errors, and build consumer trust. Future work may focus on integrating this model with miniaturized, low-power spectral hardware to enable real-world deployment, from laboratory research to field-ready solutions.

4. Conclusions

This study established a systematic modeling framework for predicting the soluble solids content of milk jujubes using visible/near-infrared spectroscopy. The DAUASE algorithm was employed to eliminate outlier samples, significantly improving model stability and predictive accuracy. This demonstrates the algorithm’s ability to effectively identify anomalous samples in spectral data, thereby enhancing dataset reliability and minimizing the negative impact of outliers on model performance. Among various dataset partitioning methods, the KS algorithm exhibited superior performance over RS and SPXY, as it better represented the overall sample distribution and led to models with higher predictive accuracy and stronger generalizability. The SG + SNV combination was verified as the optimal preprocessing method, yielding notably improved prediction results compared to raw spectra without preprocessing. In feature wavelength selection, the CARS algorithm showed outstanding performance by minimizing the number of selected variables while maximizing retained information, which facilitated the construction of robust prediction models.
Among all of the models developed, the DAUASE + KS + SG + SNV + CARS + SVR model demonstrated the best overall prediction performance. This superiority can be attributed to SVR’s powerful nonlinear modeling capability, which utilizes kernel functions to map data into a high-dimensional space, thereby capturing complex nonlinear relationships. The prediction set achieved an RP2 of 0.976, an RMSEP of 0.153, and APP of 99.042%, all surpassing those of other models. This confirms the suitability of this modeling approach for the quantitative, non-destructive detection of SSC in milk jujubes.
In conclusion, the proposed model significantly enhances the accuracy of SSC detection in milk jujubes, verifying the feasibility and effectiveness of visible/near-infrared spectroscopy for non-destructive quality assessment. Moreover, it provides a theoretical and technical foundation for similar research on the non-destructive determination of SSC or other soluble solids in other jujube varieties.

Author Contributions

Conceptualization, Y.Y., S.M. and H.X.; methodology, Y.Y., S.M. and H.X.; software, Y.Y.; validation, Y.Y., F.Q. and F.W.; investigation, F.Q. and F.W.; writing—original draft preparation, Y.Y.; writing—review and editing, Y.Y. and S.M.; visualization, Y.Y. and S.M.; funding acquisition, S.M. All authors have read and agreed to the published version of the manuscript.

Funding

This study was supported by the Science and Technology Research Project of Henan Province (Project No. 192102110200).

Institutional Review Board Statement

Not applicable.

Data Availability Statement

The original contributions presented in this study are included in the article. Further inquiries can be directed to the corresponding author.

Conflicts of Interest

The authors declare no conflicts of interest.

References

  1. Chen, S.-F. High Yield and High Quality Cultivation Techniques of Indian Jujube. Southeast Hortic. 2015, 47, 12–15. [Google Scholar]
  2. Xue, P. Influence of different soil moisture conditions in the dry-hot valley of Jinsha River on the fruit quality and yield of Ziziphus mauritiana Lam. Zhejiang Agric. Sci. 2008, 2, 144–148. [Google Scholar]
  3. Anjum, M.A.; Haram, A.; Ahmad, R.; Bashir, M.A. Physico-chemical attributes of fresh and dried Indian jujube (Zizyphus mauritiana) fruits. Pak. J. Agric. Sci. 2020, 57, 165–176. [Google Scholar]
  4. Anjum, M.A.; Rauf, A.; Bashir, M.A.; Ahmad, R. The evaluation of biodiversity in some indigenous Indian jujube (Zizyphus mauritiana) germplasm through physico-chemical analysis. Acta Sci. Pol. Hortorum Cultus 2018, 17, 39–52. [Google Scholar] [CrossRef]
  5. Hussain, S.Z.; Naseer, B.; Qadri, T.; Fatima, T.; Bhat, T.A. Ber/Jujube (Ziziphus mauritiana): Morphology, taxonomy, composition and health benefits. In Fruits Grown in Highland Regions of the Himalayas; Springer: Cham, Switzerland, 2021; pp. 157–168. [Google Scholar]
  6. Guo, M.; Bi, G.; Wang, H.; Ren, H.; Chen, J.; Lian, Q.; Wang, X.; Fang, W.; Zhang, J.; Dong, Z.; et al. Genomes of autotetraploid wild and cultivated Ziziphus mauritiana reveal polyploid evolution and crop domestication. Plant Physiol. 2024, 196, 2701–2720. [Google Scholar] [CrossRef]
  7. Liang, T.; Sun, W.; Ren, H.; Ahmad, I.; Vu, N.; Maryam; Huang, J. Genetic diversity of Ziziphus mauritiana germplasm based on SSR markers and ploidy level estimation. Planta 2019, 249, 1875–1887. [Google Scholar] [CrossRef] [PubMed]
  8. Liu, P.; Zheng, Y.; Tian, H.; Xu, H.; Xie, L. Enhancing fruit SSC detection accuracy via a light attenuation theory-based correction method to mitigate measurement orientation variability. Food Res. Int. 2024, 196, 115024. [Google Scholar] [CrossRef]
  9. Zhao, Y.; Zhou, L.; Wang, W.; Zhang, X.; Gu, Q.; Zhu, Y.; Chen, R.; Zhang, C. Visible/near-infrared spectroscopy and hyperspectral imaging facilitate the rapid determination of soluble solids content in fruits. Food Eng. Rev. 2024, 16, 470. [Google Scholar] [CrossRef]
  10. Liu, Y.; Zhou, X.; Yu, X.; Li, Y.; Han, S. Research progress of nondestructive testing techniques for fruit and vegetable quality. J. Zhejiang Univ. Agric. Life Sci. 2020, 46, 27–37. [Google Scholar] [CrossRef]
  11. Cheng, L.; Liu, G.; Wan, G.; He, J. Non-destructive detection of glucose content in Lingwu jujube by visible/near-infrared hyperspectral imaging. Chin. J. Luminesc. 2019, 40, 1055–1063. [Google Scholar] [CrossRef]
  12. Ma, J.; Wang, K. Research Progress of Optical Nondestructive Testing Technology for Fruit Quality. Food Ind. Sci. Technol. 2021, 42, 427–437. [Google Scholar]
  13. Chen, B.; Wu, Z.; Li, H.; Wang, J. Research of machine vision technology in agricultural application: Today and the future. Sci. Technol. Rev. 2018, 36, 54–65. [Google Scholar] [CrossRef]
  14. Liu, J.X.; Yin, X.H.; Han, S.H.; Li, X.; Xu, B.C.; Li, P.Y.; Luo, D.L. Review of Portable Near-infrared Spectrometers. J. Henan Agric. Univ. 2022, 56, 102–110. [Google Scholar]
  15. Guo, Y.; Zhang, L.; Li, Z.; He, Y.; Lv, C.; Chen, Y.; Lv, H.; Du, Z. Online Detection of Dry Matter in Potatoes Based on Visible Near-Infrared Transmission Spectroscopy Combined with 1D-CNN. Agriculture 2024, 14, 787. [Google Scholar] [CrossRef]
  16. Yakubu, A.B.; Shaibu, A.S.; Mohammed, S.G.; Ibrahim, H.; Mohammed, I.B. NIRS-based prediction for protein, oil, and fatty acids in soybean (Glycine max (L.) Merrill) seeds. Food Anal. Methods 2024, 17, 1592–1600. [Google Scholar]
  17. Mundi, H.K.; Sharma, S.; Kaur, H.; Devi, J.; Atri, C.; Gupta, M. Using near-infrared reflectance spectroscopy (NIRS) and chemometrics for non-destructive estimation of the amount and composition of seed tocopherols in Brassica juncea (Indian mustard). J. Food Sci. Technol. 2025, in press. [Google Scholar] [CrossRef]
  18. Zaukuu, J.-L.Z.; Attipoe, N.Q.; Korneh, P.B.; Mensah, E.T.; Bimpong, D.; Amponsah, L.A. Detection of bissap calyces and bissap juices adulteration with sorghum leaves using NIR spectroscopy and VIS/NIR spectroscopy. J. Food Compos. Anal. 2025, 141, 107358. [Google Scholar] [CrossRef]
  19. Zhao, X.; Zheng, N.; Wang, J.; Zhang, Y. Application of Near-Infrared Spectroscopy in Quality Detection of Milk and Dairy Products. Anim. Nutr. J. 2024, 36, 5451–5459. [Google Scholar]
  20. Bao, L.; Du, B.; Liu, F.; Ding, C.; Li, Q.; Shi, Y.; Huang, X.; Li, K. Development of near-infrared spectroscopy and its application in petrochemical industry. China Metrol. 2024, 7, 69–73. [Google Scholar]
  21. Yan, Y.; Liang, X.; Qin, B.; Zhuang, Y.; Chen, J.; Yin, G. Nondestructive identification and content prediction of anticancer active ingredient in sorafenib tosylate tablets based on near-infrared spectroscopy. Guangzhou Chem. 2022, 50, 45–52. [Google Scholar]
  22. Hao, Y.; Du, J.; Zhang, S.; Wang, Q. Research on construction of visible-near infrared spectroscopy analysis model for soluble solid content in different colors of jujube. Spectrosc. Spectr. Anal. 2021, 41, 3385–3391. [Google Scholar]
  23. Wang, B.; Li, L. Online detection of soluble solid content in fresh jujube based on visible/near-infrared spectroscopy. INMATEH Agric. Eng. 2024, 72, 291–298. [Google Scholar] [CrossRef]
  24. Fan, C.; Liu, Y.; Cui, T.; Qiao, M.; Yu, Y.; Xie, W.; Huang, Y. Quantitative prediction of protein content in corn kernel based on near-infrared spectroscopy. Foods 2024, 13, 4173. [Google Scholar] [CrossRef] [PubMed]
  25. Ji, Q.; Li, C.; Fu, X.; Liao, J.; Hong, X.; Yu, X.; Ye, Z.; Zhang, M.; Qiu, Y. Protected geographical indication discrimination of Zhejiang and non-Zhejiang Ophiopogonis japonicus by near-infrared (NIR) spectroscopy combined with chemometrics: The influence of different stoichiometric and spectrogram pretreatment methods. Molecules 2023, 28, 2803. [Google Scholar] [CrossRef]
  26. Höpker, C.; Dittert, K.; Olfs, H.-W. On-Farm Application of Near-Infrared Spectroscopy for the Determination of Nutrients in Liquid Organic Manures: Challenges and Opportunities. Agriculture 2025, 15, 185. [Google Scholar] [CrossRef]
  27. Bian, X.; Zhang, R.; Liu, P.; Xiang, Y.; Wang, S.; Tan, X. Near infrared spectroscopic variable selection by a novel swarm intelligence algorithm for rapid quantification of high order edible blend oil. Spectrochim. Acta A Mol. Biomol. Spectrosc. 2023, 284, 121788. [Google Scholar] [CrossRef]
  28. Li, H.; Li, M.; Tang, H.; Li, H.; Zhang, T.; Yang, X.F. Quantitative analysis of phenanthrene in soil by fluorescence spectroscopy coupled with the CARS-PLS model. RSC Adv. 2023, 13, 9353–9360. [Google Scholar] [CrossRef]
  29. Zhang, Z.S.; Zhang, R.J.; Gu, H.W.; Xie, Q.; Zhang, X.; Sa, J.; Liu, Y. Research on the twin check abnormal sample detection method of mid-infrared spectroscopy. Spectrosc. Spectr. Anal. 2024, 44, 1546–1552. [Google Scholar]
  30. Liu, Z.; Cai, W.; Shao, X. Outlier detection in near-infrared spectroscopic analysis by using Monte Carlo cross-validation. Sci. China Ser. B Chem. 2008, 51, 751–759. [Google Scholar] [CrossRef]
  31. Liu, J.; Fan, S.; Cheng, W.; Yang, Y.; Li, X.; Wang, Q.; Liu, B.; Xu, Z.; Wu, Y. Non-destructive discrimination of sunflower seeds with different internal mildew grades by fusion of near-infrared diffuse reflectance and transmittance spectra combined with 1D-CNN. Foods 2023, 12, 295. [Google Scholar] [CrossRef]
  32. Wang, C.; Zhang, L.; Wei, W.; Zhang, Y. Hyperspectral image classification with data augmentation and classifier fusion. IEEE Geosci. Remote Sens. Lett. 2020, 17, 1420–1424. [Google Scholar] [CrossRef]
  33. Zhu, S.; Gao, X.; Zhang, Z.; Cao, H.; Zheng, D.; Zhang, L.; Xie, Q.; Sa, J. Partitioning proportion and pretreatment method of infrared spectral dataset. Chin. J. Anal. Chem. 2022, 50, 1415–1429. [Google Scholar] [CrossRef]
  34. She, X.; Huang, J.; Cao, X.; Wu, M.; Yang, Y. Rapid measurement of total saponins, mannitol, and naringenin in Dendrobium officinale by near-infrared spectroscopy and chemometrics. Foods 2024, 13, 1199. [Google Scholar] [CrossRef] [PubMed]
  35. Wang, S.; Han, P.; Cui, G.; Wang, D.; Liu, S.; Zhao, Y. The NIR detection research of soluble Solid contentin watermelon based on SPXY algorithm. Spectrosc. Spect. Anal. 2019, 39, 738–742. [Google Scholar] [CrossRef]
  36. Araújo dos Santos, J.V.; Lopes, H. Savitzky-Golay smoothing and differentiation filters for damage identification in plates. Procedia Struct. Integr. 2024, 54, 575–584. [Google Scholar] [CrossRef]
  37. Mishra, P.; Biancolillo, A.; Roger, J.M.; Marini, F.; Rutledge, D.N. New data preprocessing trends based on ensemble of multiple preprocessing techniques. TrAC Trends Anal. Chem. 2020, 132, 116045. [Google Scholar] [CrossRef]
  38. Mishra, P.; Lohumi, S. Improved prediction of protein content in wheat kernels with a fusion of scatter correction methods in NIR data modelling. Biosyst. Eng. 2021, 23, 93–97. [Google Scholar] [CrossRef]
  39. Zhang, Z.; Wang, S.; Zhang, Y. Non-Destructive Detection of Water Content in Pork Based on NIR Spatially Resolved Spectroscopy. Agriculture 2023, 13, 2114. [Google Scholar] [CrossRef]
  40. Lotfi, M.; Arab Chamjangali, M.; Mozafari, Z. Ridge regression coupled with a new uninformative variable elimination algorithm as a new descriptor screening method: Application of data reduction in QSAR study of some sulfonated derivatives as c-Met inhibitors. Chemom. Intell. Lab. Syst. 2023, 232, 104714. [Google Scholar] [CrossRef]
  41. Han, J.; Guo, J.; Zhang, Z.; Yang, X.; Shi, Y.; Zhou, J. The Rapid Detection of Trash Content in Seed Cotton Using Near-Infrared Spectroscopy Combined with Characteristic Wavelength Selection. Agriculture 2023, 13, 1928. [Google Scholar] [CrossRef]
  42. Wang, J.; Lu, S.; Wang, S.H.; Zhang, Y.D. A review on extreme learning machine. Multimed Tools Appl. 2022, 81, 41611–41660. [Google Scholar] [CrossRef]
  43. Ma, J.; Sun, D.-W.; Pu, H.; Wei, Q.; Wang, X. Protein content evaluation of processed pork meats based on a novel single shot (snapshot) hyperspectral imaging sensor. J. Food Eng. 2019, 240, 207–213. [Google Scholar] [CrossRef]
  44. Peña, D.; Yohai, V.J. A review of outlier detection and robust estimation methods for high dimensional time series data. Econom. Stat. 2023, in press. [Google Scholar] [CrossRef]
  45. Andries, J.P.M.; Vander Heyden, Y. Calibration set reduction by the selection of a subset containing the best fitting samples showing optimally predictive ability. Talanta 2024, 266, 124943. [Google Scholar] [CrossRef] [PubMed]
  46. Zhou, W.; Yan, Z.; Zhang, L. A comparative study of 11 non-linear regression models highlighting autoencoder, DBN, and SVR, enhanced by SHAP importance analysis in soybean branching prediction. Sci. Rep. 2024, 14, 5905. [Google Scholar] [CrossRef]
  47. Jiao, Y.; Li, Z.; Chen, X.; Fei, S. Preprocessing methods for near-infrared spectrum calibration. J. Chemom. 2020, 34, e3306. [Google Scholar] [CrossRef]
  48. Robert, G.; Gosselin, R. Evaluating the impact of NIR pre-processing methods via multiblock partial least-squares. Anal. Chim. Acta 2022, 1189, 339255. [Google Scholar] [CrossRef]
  49. Wang, H.; Huang, W.; Cai, Z.; Yan, Z.; Li, S.; Li, J. Online detection of soluble solid content in watermelon based on full-transmission visible and near-infrared spectroscopy. Spectrosc. Spect. Anal. 2024, 44, 1710–1717. [Google Scholar]
  50. Li, X.; Fu, X.; Li, H. A CARS-SPA-GA feature wavelength selection method based on hyperspectral imaging with potato leaf disease classification. Sensors 2024, 24, 6566. [Google Scholar] [CrossRef]
  51. Cui, T.; Lu, Z.; Xue, L.; Wan, S.; Zhao, X.; Wang, H. Research on Research on the rapid detection model of tomato sugar based on near-infrared reflectance spectroscopy. Spectrosc. Spect. Anal. 2023, 43, 1218–1224. [Google Scholar]
  52. Fu, G.; Gao, Z.; Yang, J.; Li, H.; Luo, F.; Liang, Y.; Yan, D.; Wei, F.; Chang, J.; Ji, X. NIR-based identification of flue-cured tobacco oil grades. J. Henan Agric. Univ. 2024, 58, 583–591. [Google Scholar]
  53. Sun, H.; Zhang, S.; Ren, R.; Xue, J.; Zhao, H. Detection of soluble solids content in different cultivated fresh jujubes based on variable optimization and model update. Foods 2022, 11, 2522. [Google Scholar] [CrossRef] [PubMed]
  54. Lin, J.; Meng, Q.; Wu, Z.; Chang, H.; Ni, C.; Qiu, Z.; Li, H.; Huang, Y. Fruit soluble solids content non-destructive detection based on visible/near-infrared hyperspectral imaging in mango. J. Fruit Sci. 2024, 41, 122–132. [Google Scholar]
  55. Su, Y.; He, K.; Liu, W.; Li, J.; Hou, K.; Lv, S.; He, X. Detection of soluble solid content in table grapes during storage based on visible-near-infrared spectroscopy. Food Innov. Adv. 2025, 4, 10–18. [Google Scholar] [CrossRef]
  56. Hina, A.; Saadeh, W. Noninvasive blood glucose monitoring systems using near-infrared technology—A review. Sensors 2022, 22, 4855. [Google Scholar] [CrossRef]
Figure 1. Schematic diagram of the overall technical process for rapid and non-destructive detection of SSC in milk jujube based on Vis/NIR spectrometry.
Agriculture 15 01382 g001
Figure 2. Samples of milk jujube.
Agriculture 15 01382 g002
Figure 3. Schematic of the milk jujube Vis/NIR spectroscopy collection system.
Agriculture 15 01382 g003
Figure 4. Abnormal sample elimination by DAUASE method.
Agriculture 15 01382 g004
Figure 5. The distribution of SSC values of the dataset partitioned by different algorithms.
Agriculture 15 01382 g005
Figure 6. Comparison of SVR prediction performance using feature wavelengths selected by CARS and UVE algorithms.
Agriculture 15 01382 g006
Figure 7. Feature wavelength extraction based on the CARS algorithm: (a) path of regression coefficients; (b) RMSECV; (c) number of sampling variables. Note: In (c), the colored lines represent the regression coefficient trajectories of each variable across Monte Carlo sampling iterations. Each line shows how the coefficient of a specific variable changes during the selection process. The blue vertical line indicates the sampling point corresponding to the minimum RMSECV value, where the selected variable subset is considered optimal.
Agriculture 15 01382 g007
Figure 8. Distribution of feature wavelengths select: (a) CARS; (b) UVE. Note: the mean spectrum in the figure represents the mean spectral reflectance of the calibration set.
Agriculture 15 01382 g008
Figure 9. Distribution of feature wavelengths selected: (a) SVR model; (b) PLSR model; (c) MLR model; (d) BP model.
Agriculture 15 01382 g009
Table 1. Comparison of the SVR prediction model results before and after different methods of dataset partitioning.
Partitioning MethodSample SizeAPC(%)RC2RMSEC
(°Brix)
APP(%)RP2RMSEP
(°Brix)
RS15099.2390.9900.10198.7160.9570.209
15099.2840.9900.09898.8340.9710.184
15099.3160.9920.08798.6540.9710.200
15099.2430.9910.09598.7270.9670.192
15099.3080.9920.09198.6100.9560.201
16098.9450.9850.17097.9990.9220.258
16099.2000.9920.10798.1150.9600.289
16099.0680.9890.13497.6830.9270.330
16099.2460.9940.10297.9310.9260.311
16099.2070.9890.10998.0110.9690.319
KS15099.1960.9890.10698.6120.9530.215
15099.1320.9870.11899.0420.9760.153
16099.1990.9930.10898.1510.9480.288
16099.2050.9930.10698.4480.9590.257
SPXY15099.1290.9890.11198.6600.8880.198
15099.1140.9880.12498.4960.8760.208
16099.0850.9930.12298.2600.8570.259
16099.1090.9930.12098.2320.8640.253
Table 2. Prediction results of SVR models established with different preprocessing methods.
PreprocessingNumber of FeaturesAPC(%)RC2RMSEC
(°Brix)
APP(%)RP2RMSEP
(°Brix)
Raw14695.6630.5190.71095.4720.4390.744
SG493.4950.0141.02094.1430.1450.918
FD8799.1800.990.10198.6320.9530.216
MSC16995.8010.5670.67395.6100.3310.812
SNV8299.1410.9870.11698.5980.9500.221
SG + SNV8199.1320.9870.11899.0420.9760.153
FD + SG9699.1950.9920.09498.4990.9580.203
SG + MSC26696.1550.6750.58395.7140.3680.790
SNV + FD11299.1620.9910.09998.5290.9520.217
FD + SNV12299.1130.9890.10898.6680.9610.195
FD + MSC7098.9520.9730.16797.6900.9180.285
SNV + MSC6298.9930.9770.15698.2420.9410.242
SG + SNV + FD8399.1530.9890.11098.5690.9550.211
SG + SNV + MSC7699.1980.9890.10897.7120.8800.344
SG + FD + MSC21499.1130.9920.09397.5880.8980.317
SNV + FD + MSC14699.1100.9900.10398.1710.9370.249
Disclaimer/Publisher’s Note: The statements, opinions and data contained in all publications are solely those of the individual author(s) and contributor(s) and not of MDPI and/or the editor(s). MDPI and/or the editor(s) disclaim responsibility for any injury to people or property resulting from any ideas, methods, instructions or products referred to in the content.

