Article

Effects of Different Excitation Parameters on Mechanized Harvesting Performance and Postharvest Quality of First-Crop Organic Goji Berries in Saline–Alkali Land

1
School of Technology, Beijing Forestry University, Beijing 100083, China
2
Key Lab of State Forestry Administration on Forestry Equipment and Automation, Beijing Forestry University, Beijing 100083, China
3
State Key Laboratory of Efficient Production of Forest Resources, Beijing 100083, China
*
Author to whom correspondence should be addressed.
Agriculture 2025, 15(13), 1377; https://doi.org/10.3390/agriculture15131377 (registering DOI)
Submission received: 3 June 2025 / Revised: 22 June 2025 / Accepted: 25 June 2025 / Published: 27 June 2025
(This article belongs to the Special Issue Intelligent Agricultural Equipment in Saline Alkali Land)

Abstract

Efficient and low-loss harvesting methods are crucial for preserving the postharvest quality of the first crop of goji berries grown in saline–alkali soils. However, as a brittle horticultural fruit rich in diverse bioactive compounds, goji berries are highly vulnerable to mechanical damage during harvesting, which adversely affects their storability and subsequent processing. To address this challenge, a multi-degree-of-freedom vibration model was developed based on the growth characteristics of first-crop organic goji berry fruit-bearing branches in the Qinghai region. The dynamic response of the branches under various excitation conditions was simulated, and the effects of excitation position, frequency, force amplitude, and phase angle on the fruit detachment rate, impurity rate, and breakage rate were systematically analyzed. Based on both the simulation and experimental results, a response surface methodology (RSM) was employed to optimize the picking parameters. The results of the field experiment showed that under the optimal conditions of vibration excitation in the ripe fruit area, a frequency of 5.7 Hz, an amplitude of excitation force of 0.27 N, a phase angle of 135°, a fruit picking rate of 97.58%, a miscellaneous content rate of 5.12%, and a breakage rate of 7.66% could be realized. The results of this study help to maintain the postharvest quality of first-crop goji berry fruits in saline–alkali land, and also provide a theoretical basis and practical reference for the optimization of first-crop goji berry harvesting equipment.

1. Introduction

Organic goji berries (Lycium barbarum L.), primarily cultivated in China’s Qinghai Province, have high nutritional and medicinal value, a unique quality thanks to the saline soil environment, which is very favorable to the development of goji berry fruit. With outstanding health value and market competitiveness, goji berry has become the main pillar industry in the local community [1,2,3,4,5]. Because it belongs to the “flowers and fruits at the same time” category of fruit, the harvest period is divided into three crops, mainly concentrated in July to September of each year. Among them, the first crop of goji berries is the most valuable, with a greater market demand and relatively higher prices [6]. However, current harvesting practices still rely heavily on manual labor, with annual labor costs accounting for approximately 40–50% of the total production expenses. Moreover, existing mechanized methods often result in high fruit damage and impurity rates—shown in [7]—seriously affecting the quality of goji berries after harvesting. Therefore, it is important for the first crop of goji berries in Qinghai to have high efficiency and low-loss mechanized harvesting, without delay.
At present, vibration-based harvesting is considered one of the most effective approaches for mechanizing the picking of goji berries and other agroforestry fruits, and several related theoretical and equipment studies have been conducted [8,9]. Thus, [10,11] designed a vibratory harvesting device for goji berries, which is 4.2 times more efficient than manual harvesting; however, the device was designed according to the biomechanical properties of Korean goji berries and is not suitable for the mechanized harvesting of goji berries in other countries. Jinpeng et al. [12] conducted comparative tests on the vibration-, shear-, and airflow-type goji berry harvesting methods and analyzed the experimental data, concluding that the harvesting rate of the designed vibration-type device can reach 85%, and the damage rate of the ripe fruits can be controlled within 10%, which is relatively good for the harvesting effect, but the overall harvesting quality needs to be further improved. Tang et al. [13] used finite element analysis to study the vibration characteristics of goji berry plants. Their modal and harmonic response analysis showed that applying a 33 N vibration force to the side branches achieved better fruit detachment with minimal tree damage. However, the postharvest impurity rate still required further reduction. Zhao et al. [14] created a three-dimensional model of the goji berry plant by measuring the goji berry plant, performed a modal analysis of the goji berry plant based on FEM, and carried out a modal test based on acceleration sensors and gravity hammers to obtain the optimal resonance frequency. Chen et al. [15] developed a three-dimensional model of goji berry branches under gravity-free conditions and used the finite element method to predict the bending behavior of fruit-bearing branches. This work offers a rapid approach for constructing a full 3D model of the entire goji berry plant. Mei et al. [16] developed a vibration harvesting model and a critical fruit abscission model based on a simplified cantilever beam representation of goji branches. They derived theoretical response and inertia forces and validated optimal working parameters through simulation and experiments, though the model still requires further refinement.
In addition, vibration harvesting has been explored for various fruit crops. Zhuo et al. [17] experimentally investigated the vibration response of densely planted jujube branches and identified optimal excitation frequencies. Zhou et al. [18] combined finite element explicit dynamics simulation with modal analysis to study the forced vibration response of Cygnus date branches, accurately simulating fruit detachment under complex conditions. Hu et al. [19] proposed a low-cost 3D reconstruction method to construct a date palm model, and combined the finite element method and vibration test to analyze the vibration response characteristics of date palm and determine the optimal range of vibration parameters, which provides a certain reference for the development of date palm harvesting machinery. Cao et al. [20,21] examined vibration transmission laws in walnut trees via experiments and developed local vibration models of stalk-branch and stalk-fruit structures to guide low-frequency harvesting equipment design. Wang et al. [22] used a high-speed camera to study the motion patterns during vibratory harvesting of lychee fruits to determine the optimal combination of operating parameters. Du et al. [23] designed a handheld harvester with a variable-pitch comb, using ADAMS simulation and field tests to achieve 80% harvesting efficiency with minimal flower shedding at 480 r/min. Lyu et al. [24] investigated transmission gap parameters in blueberry harvesters and proposed an optimized configuration based on force and load analyses, validated by field experiments.
In summary, although extensive research has been conducted on the methods and equipment for harvesting goji berries and other forest fruits, studies on the vibration mechanism remain largely focused on the entire plant. There is a lack of in-depth investigation into the optimal excitation point and its dynamic behavior specifically for the vibration harvesting of first-crop goji berries grown in saline–alkali soils. Therefore, studying the vibration response characteristics of fruit-bearing branches of first-crop goji berries in Qinghai, and identifying the optimal excitation locations and operating parameters, is essential for enhancing the performance of mechanized harvesting and ensuring postharvest fruit quality.

2. Vibration Model

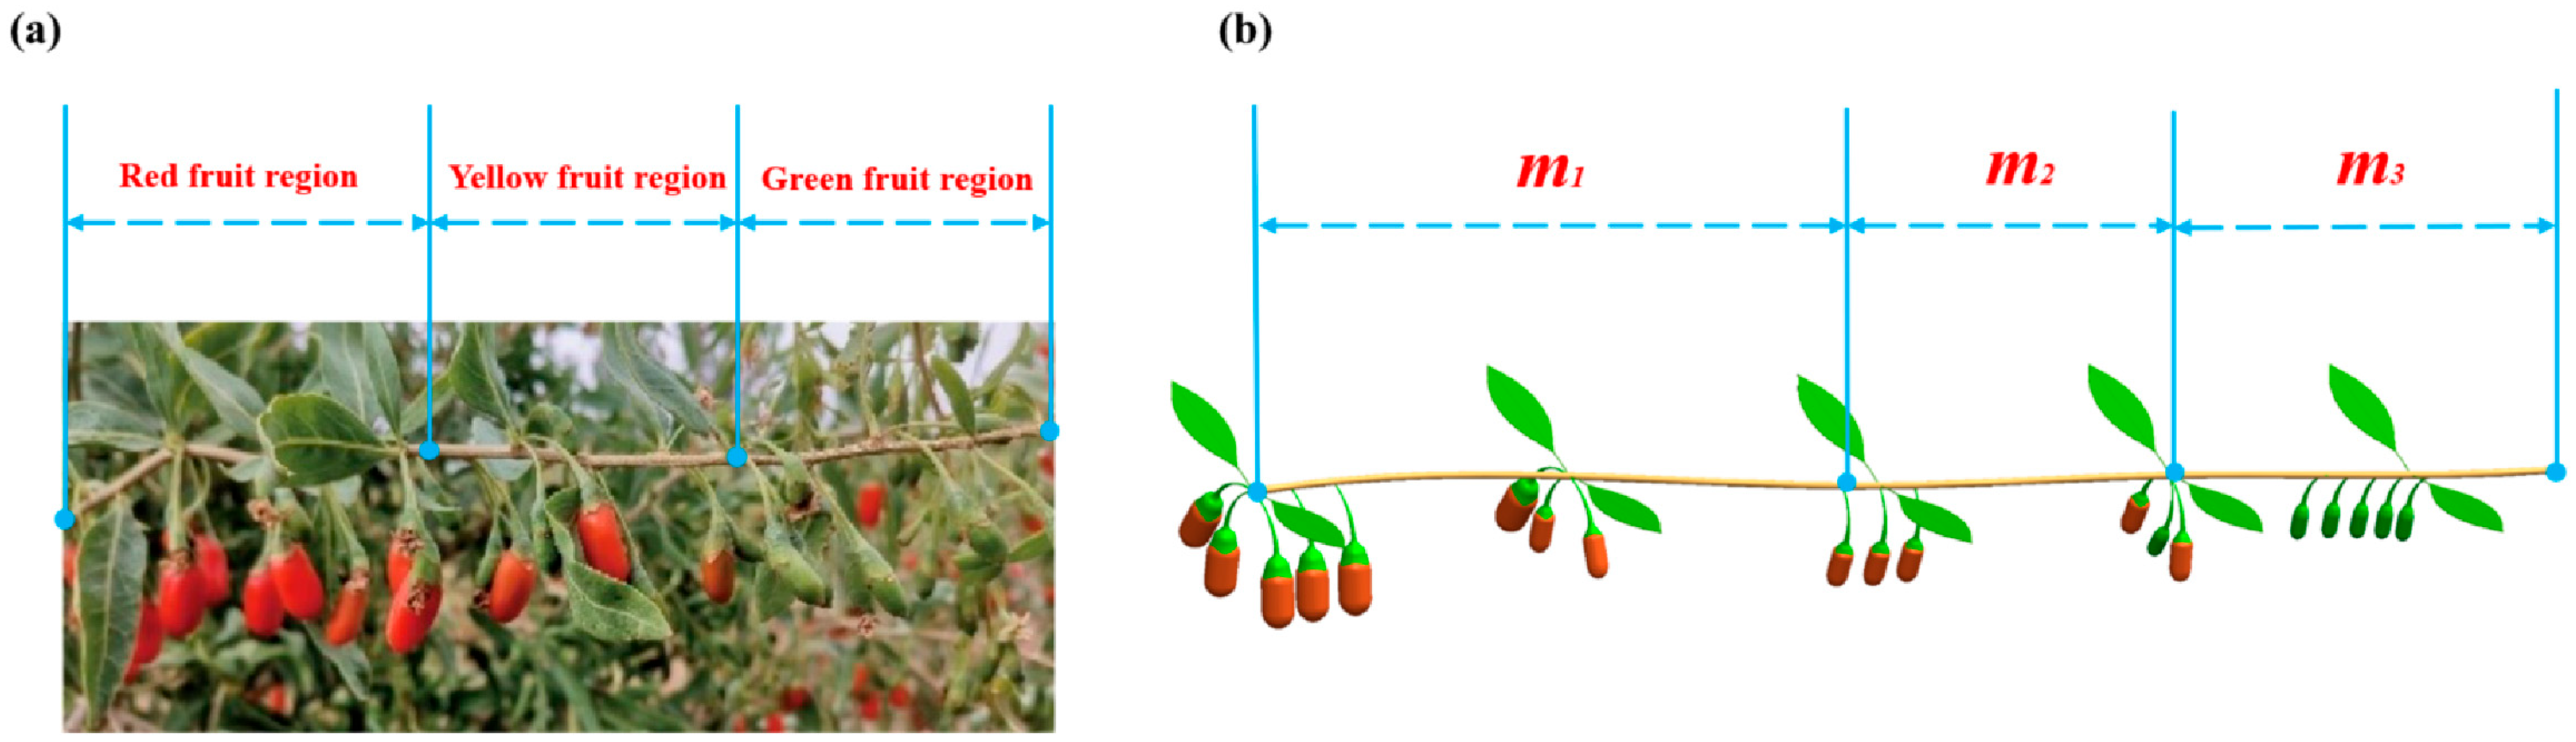
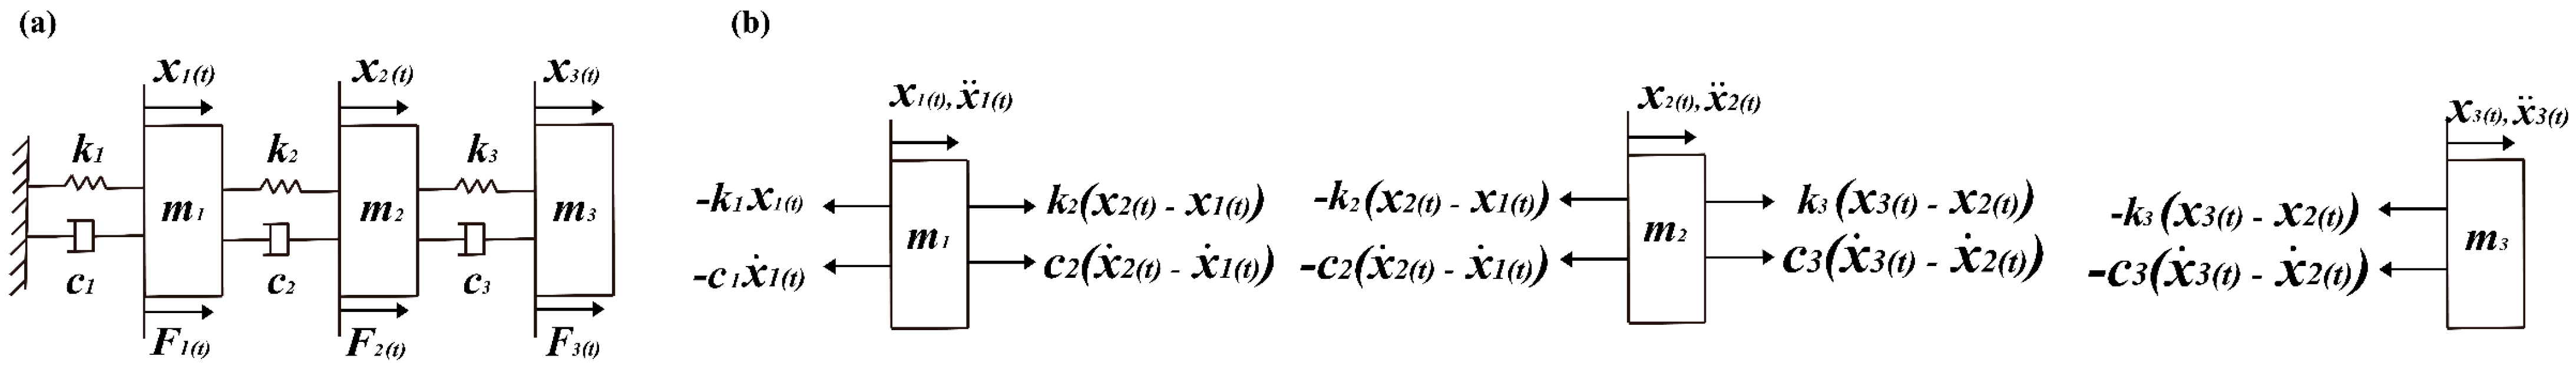
2.1. Modeling the Vibration of Fruit-Bearing Branches of Goji Berry

The vibration harvesting of wolfberry mainly occurs through the excitation device to produce a certain excitation frequency to hit the fruiting branches of goji berry. When hitting the fruiting branches of goji berry, the inertia force generated is greater than the combination of goji berry fruit and fruiting, which occurs when the goji berry fruit is vibrated off [25,26,27,28]. Figure 1 is the Qinghai Ningqi No. 7 first crop of goji berries’ hanging fruit branches and its schematic diagram.
In order to study the vibration response characteristics of first-crop goji berry fruit-bearing branches at different vibration points in Qinghai saline–alkali land we referenced [29]; furthermore, in this paper, according to the growth characteristics of goji berry “flowering and fruiting at the same time”, and based on the vibration theory, a mass-stiffness-damping multi-degree-of-freedom forced vibration model was established, as shown in Figure 2. The key parameters of the model are shown in Table 1.
When the external excitation force is free vibration, the excitation force is 0. Through the established vibration model of the Ningqi No. 7 first crop of goji berries and the force analysis diagram, the vibration differential equation set can be obtained as Equation (1), which is as follows:
m 1 x ¨ 1 ( t ) + ( c 1 + c 2 ) x ˙ 1 ( t ) + ( k 1 + k 2 ) x 1 ( t ) k 2 x 2 ( t ) c 2 x ˙ 2 ( t ) = 0 m 2 x ¨ 2 ( t ) + ( c 2 + c 3 ) x ˙ 2 ( t ) + ( k 2 + k 3 ) x 2 ( t ) k 3 x 3 ( t ) c 3 x ˙ 3 ( t ) k 2 x 1 ( t ) c 2 x ˙ 1 ( t ) = 0 m 3 x ¨ 3 ( t ) + c 3 x ˙ 3 ( t ) + k 3 x 3 ( t ) k 3 x 2 ( t ) c 3 x ˙ 2 ( t ) = 0

2.2. Determination of Vibration Model Parameters

In order to obtain the change rule of the vibration response of the hanging branches of the first crop of goji berry and realize the excellent vibration effect, it is necessary to determine the key parameters in the vibration model, which are as follows: mass m, damping c, and stiffness k. In this study, these parameters were obtained through experimental testing, and the first three natural frequencies of the system were determined by solving the model’s eigenvalues.
Referring to the method in [30], the mass m was determined using the weighing method, and 20 groups of hanging branches of goji berries with different maturity segments were selected for weighing and were averaged, respectively; the damping c was obtained by the free decay method; the stiffness k was obtained by the dynamic test method; and the relevant parameters obtained are shown in Table 2.

3. Simulation Analysis

3.1. Simulation Parameters

To analyze the variation patterns in the vibration response of hanging fruit-bearing branches of goji berries, the vibration model and key parameters obtained in the previous section were used. The intrinsic (natural) frequencies under undamped free vibration conditions were calculated, and the external excitation force was defined using the following formula:
F ( t ) = ϕ e i ω t
where ϕ is the vibration vector and ω is the angular frequency.
Bringing the relevant parameters into Equation (2) to be solved, the first three orders of the intrinsic frequency are obtained as follows: f1 = 5.692 Hz; f2 = 13.029 Hz; f3 = 23.130 Hz.
From the literature [31,32], it is known that in the vibratory harvesting process, when the excitation frequency is close to the first two orders of the intrinsic frequency of the system, it can effectively stimulate the fruit to fall off, and significantly improve the harvesting efficiency. Considering that the first-order mode usually corresponds to the overall low-frequency large-scale vibration mode of the branch, which has a higher response amplitude, lower energy consumption, and is easier to realize in the actual mechanical excitation, this paper selects the first-order intrinsic frequency of the system as the base value of the excitation frequency. To systematically investigate the influence of excitation frequency on harvesting performance while ensuring sufficient frequency coverage, a frequency sequence was designed, starting from the first-order natural frequency. The frequencies were incrementally increased at equal intervals and set as follows: f1 = 2.1 Hz; f2 = 3.00 Hz; f3 = 3.90 Hz; f4 = 4.80 Hz; and f5 = 5.7 Hz. This frequency value can not only cover the low-order modal influence, but can also analyze the response change in the system under different vibration energy excitation, and provide basic data support for optimizing the recovery parameters.
To obtain the optimal vibration response of the hanging goji berry branches in the simulation, the form of external excitation force was first defined. In this study, the excitation force is specified as follows:
F = A × cos ( ω t + ϕ )
where A is the amplitude of excitation force, N; ω is the angular frequency, rad/s; ϕ is the phase angle, °.
Among them,
A = m a
where m is the mass of the stinger, kg; a is the acceleration of the stinger, m/s2.
Through the relevant technical parameters of the stinger and the above equation, we can deduce that m is 0.053 kg, A = m B ω 2 , where B is the distance between the two stingers, taking the value of 24 mm. Then, the relationship equation between the external excitation force and the excitation frequency, the amplitude of the excitation force and the phase angle, is F = m B ω 2 × cos ( ω t + ϕ ) . To investigate the effects of different excitation phases on the vibration response and fruit abscission characteristics, this paper refers to the relevant research on typical phase difference angles being applied in the excitation system [32,33], and the phase angles ϕ are selected as follows: 0°, 90°, 180°, and 270°.

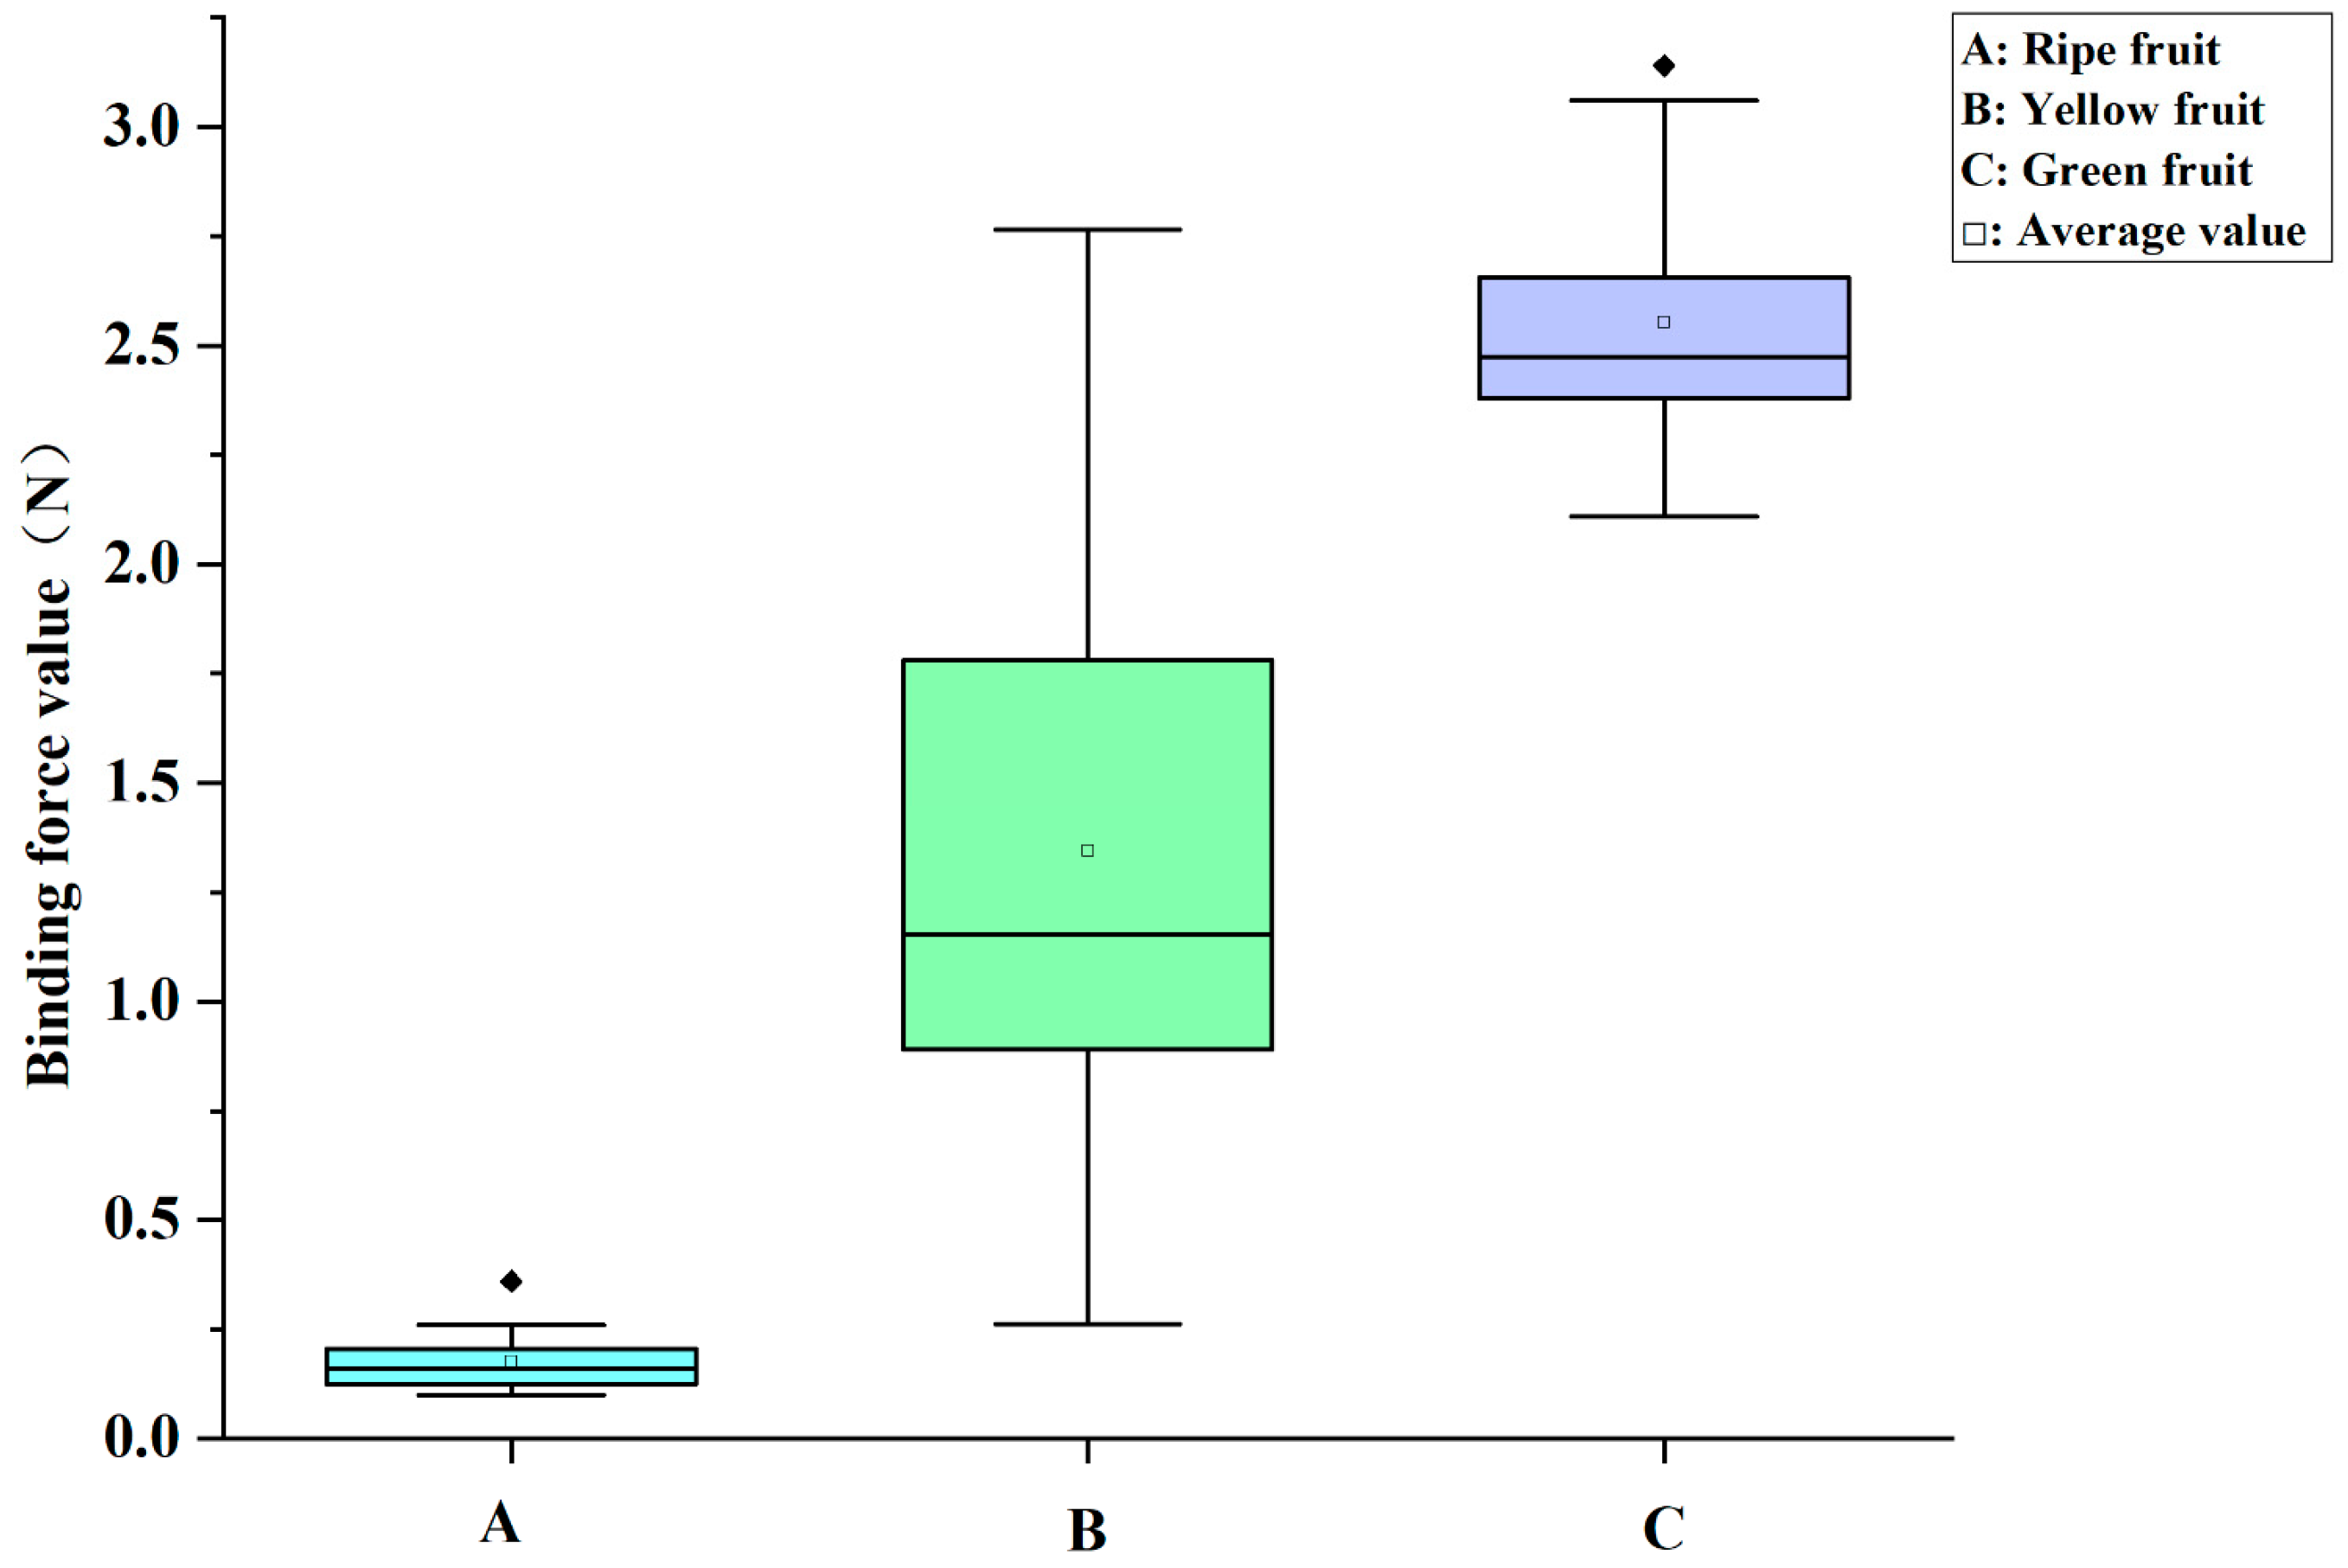
3.2. Determination of the Binding Capacity of Goji Berry

Through preliminary vibration experiments, it was observed that goji berry fruits exhibited distinct detachment characteristics. Most fruits detached from the junction between the fruit and the fruit stalk, while the connection between the fruit stalk and the fruit-bearing branch remained intact. This indicates that the bonding force between the fruit stalk and the branch is significantly greater than that between the fruit and the fruit stalk.
Therefore, in order to realize the final “ripe and green” picking effect, the main planting variety of the Qinghai Nuomuhong Farm, Ningqi No. 7 first crop of goji berries was selected as the research object, and the bonding force between fruits and fruit stalks was determined. The methods used are as follows: arbitrarily select the growth state of the better fruiting branches of goji berry; select the red ripe fruit, yellow half ripe fruit, and green unripe fruit, with 20 of each, together with the fruit stalk and the picking down, with a fresh bag to bring to the laboratory, and with a push–pull meter (ALGOL, ZP-1000) to measure the combination of the fruit and the stalk of the fruit and record. Then, we measured the combination of the force of the data in Figure 3, and the results of the combination of the force of the different maturity of the fruit and the stalk of the fruit between it demonstrated that the relationship between the binding force between the fruit and the stalk at different maturity levels was in the following order: the binding force of the green fruit stalk > the binding force of the yellow fruit stalk > the binding force of the ripe fruit stalk. The average values of the binding force were 0.176 N for ripe fruit, 1.345 N for yellow fruit, and 2.553 N for green fruit.

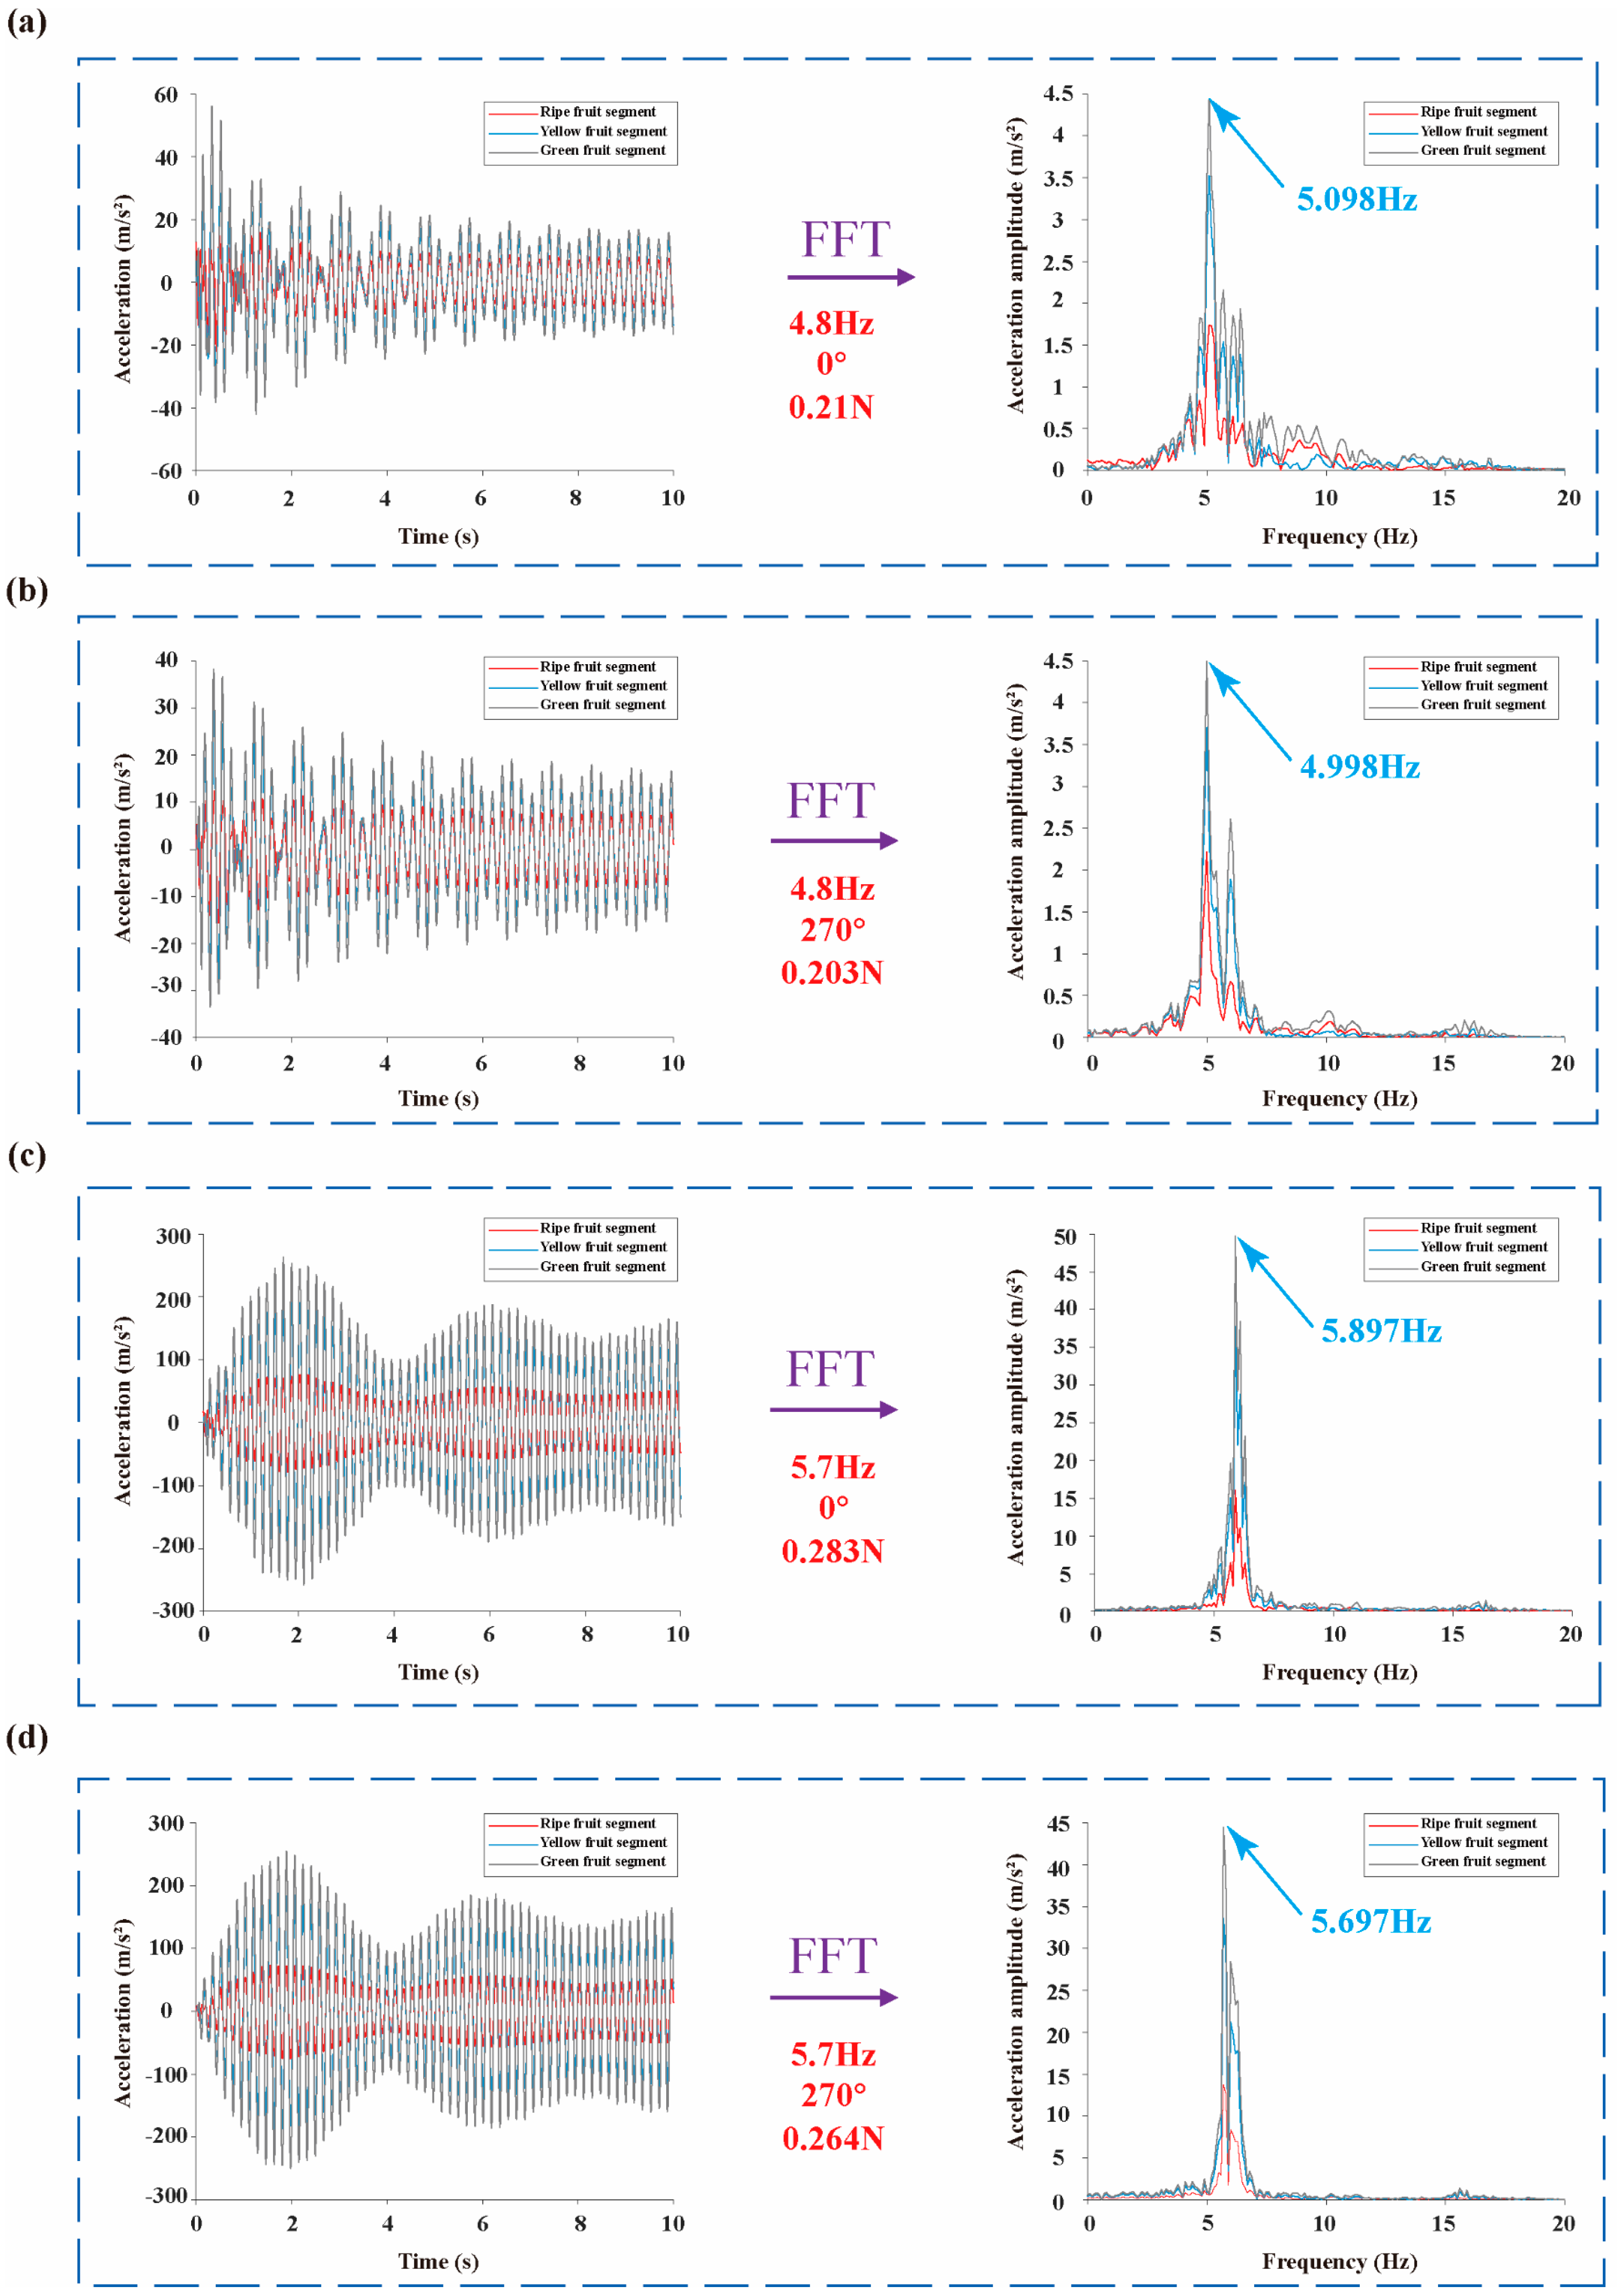
3.3. Analysis of Vibration Response Simulation Results

The parameters obtained in Section 3.1. were sequentially substituted into Matlab R2020a for the vibration response simulation and solving, and all of the amplitudes of the excitation force were statistically greater than the bonding force of the ripe goji berry fruit tip under different excitation points, different excitation frequencies, and different phase angles. As shown in Table 3, when the excitation point and the excitation frequency are certain, and the phase angle differs by 180°, the amplitude of the obtained excitation force is equal, and the amplitude of the obtained excitation force is greater than the ripe goji berry fruit tip bonding force under different excitation points, while it is smaller than the yellow fruit and green fruit tip bonding force, meaning that it will not cause mispicking of immature fruits during vibration picking. In contrast, when excitation is applied to the ripe fruit section, the amplitude of the resulting force is close to the bonding force at the tip of the ripe goji berry, making it more likely to induce resonance. As a result, the vibration effect is optimal, and the picking quality is the highest. Therefore, the ripe fruit section is the best excitation point for vibration response simulation, and the corresponding vibration response and frequency spectrum curves of each section are shown in Figure 4 when excited in this section.
Figure 4a shows the vibration acceleration simulation curve of the ripe fruit section when the external excitation force is 4.8 Hz, the phase angle is 0°, and the amplitude of the excitation force is 0.21 N. After the Fourier transform, the main peak frequency of 5.098 Hz can be obtained from the spectrogram, which has a certain deviation from the system’s first-order intrinsic frequency of 5.692 Hz, so it is not easy for the system to produce resonance, and the effect of excitation after the deviation. Figure 4b shows the vibration acceleration simulation curve of the ripe fruit section when the external excitation force is 4.8 Hz, the phase angle is 270°, and the amplitude of excitation force is 0.203 N. After the Fourier transform, the main peak frequency of 4.998 Hz can be obtained from the spectrogram, which differs from the first-order intrinsic frequency of the system of 5.692 Hz, therefore, it is not easy for the system to produce resonance, and the excitation effect is deviated.
Figure 4c shows the vibration acceleration simulation curve of the ripe fruit section when the external excitation force is 5.7 Hz, the phase angle is 0°, and the amplitude of the excitation force is 0.283 N. After Fourier transform, the peak frequency of 5.897 Hz can be obtained from the spectrogram, which has a smaller deviation from the first-order intrinsic frequency of 5.692 Hz of the system, and may produce a resonance effect, and the excitation effect is better than the first two cases. Figure 4d shows the vibration acceleration simulation curve of the ripe fruit section when the external excitation force is 5.7 Hz, the phase angle is 270°, and the amplitude of the excitation force is 0.264 N. After the Fourier transform, the peak frequency of 5.697 Hz can be obtained from the spectrogram, which is close to the first-order intrinsic frequency of the system, 5.692 Hz, therefore the system is very easy to resonate, and the excitation effect is relatively good.
In summary, in the vibration response simulation, the excitation effect obtained when the excitation frequency is 5.7 Hz is better than that when the excitation frequency is 4.8 Hz, which indicates that the magnitude of the excitation frequency is positively correlated with the final excitation effect, and the magnitude of the phase angle also has a certain effect on the final excitation effect. Therefore, it is feasible to analyze the effects of excitation frequency, phase angle, and excitation force amplitude on the final picking quality. This also confirms the accuracy of the previously established mathematical relationship between the intrinsic frequency and the periodic excitation force.

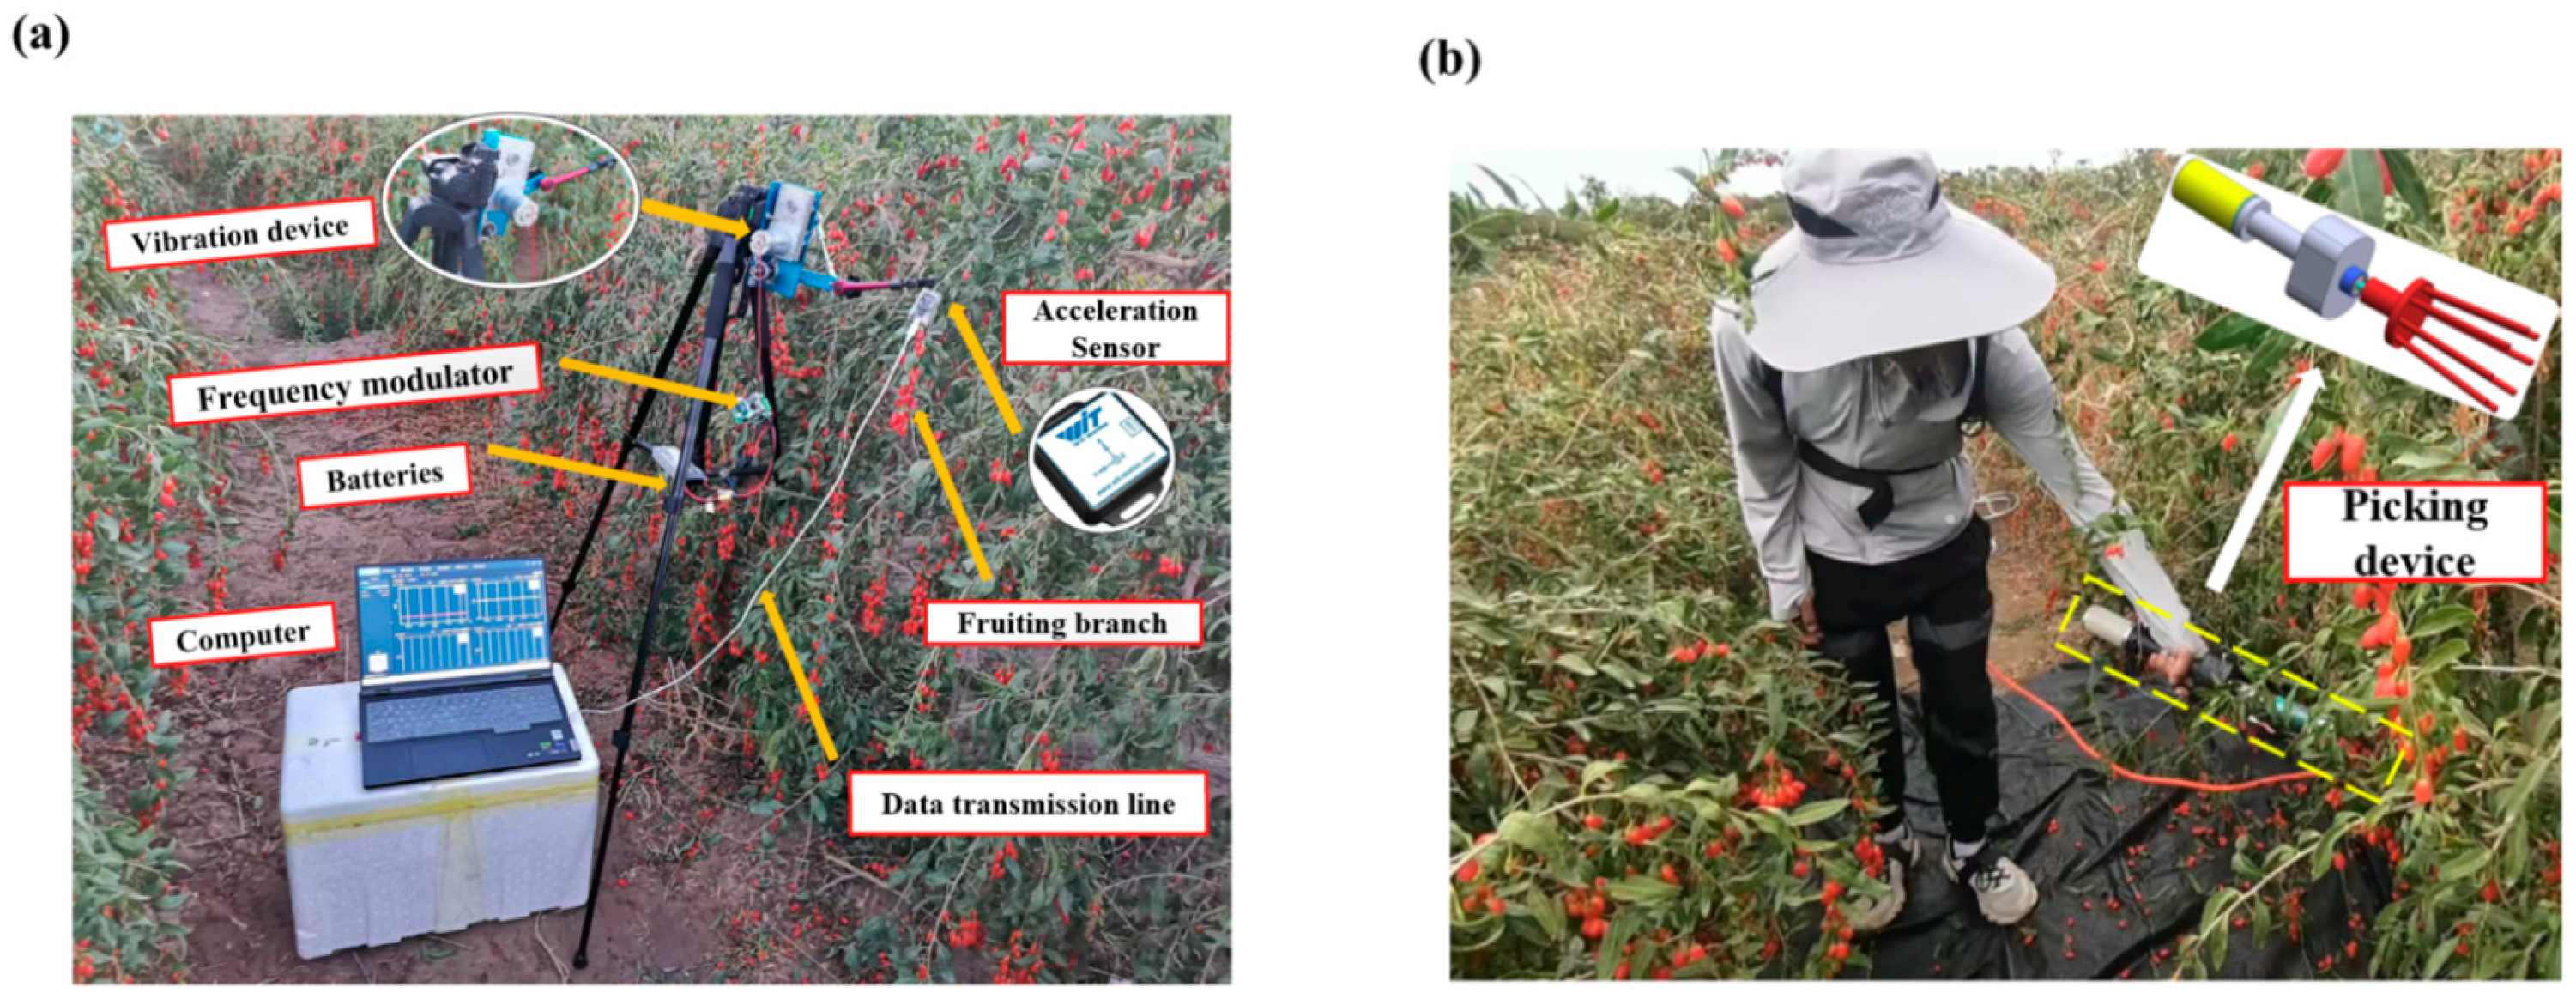
4. Vibration Experiment

4.1. Design of the Experiment

To verify whether the ripe fruit section identified in the simulation is indeed the optimal excitation location, vibration tests were conducted under various excitation conditions. On 29 July 2024, the weather was sunny, with a southeasterly wind of grade 2, and the temperature was 20~23 °C. As shown in Figure 5a, 10 goji berry trees were selected from the Goji Berry Science and Technology Park in Nuomuhong farm, Qinghai Province (96° east longitude, 36° north latitude), and 10 Ningqi No. 7 goji berry trees with standard overall growth, aged more than 5 years, with complete fruit branch structure and no obvious mechanical damage or pests, full fruits, uniform size, and firm connections between branches, fruit stalks, and fruits were selected for the experiment. Before the experiment, the vibration device, frequency converter, and acceleration sensor were calibrated to ensure the smooth progression of the experiment.
Three-factor, three-level orthogonal experiments were designed using Design-expert10 software, with excitation frequency, excitation force amplitude, and phase angle as the influencing factors, and picking rate, impurity rate, and breakage rate as the final evaluation indexes. Furthermore, polynomial regression equations between the influencing factors and the evaluation indexes were derived through ANOVA. The experimental design and results are presented in Table 4. A total of seventeen groups of experiments were conducted, with each group repeated five times. Each excitation lasted for 10 s, and the average of the five trials was used as the final result for that group. The three main evaluation indexes chosen in this study are as follows: recovery rate Y 1 , impurity rate Y 2 , and breakage rate Y 3 , which are calculated in Equation (5),
Y 1 = N 1 N × 100 % Y 2 = W 1 W × 100 % Y 3 = M 1 M × 100 %
where N 1 is the number of ripe fruits obtained after vibration picking; N is the total number of ripe fruits on the hanging branches of goji berries before vibration picking; W 1 is the weight, g, which is the weight of other debris except ripe fruits picked after vibration picking; W is the total mass of ripe fruits, including ripened fruits and other detritus after vibration picking; M 1 is the number of broken ripe fruits after vibration picking; and M is the total number of ripe fruits after vibration picking.
As shown in Table 4, although the breakage rate in some experimental groups exceeded 7%, it remained within acceptable limits defined by regional standards and did not significantly impact subsequent processing, transportation, or marketing. Additionally, the net picking rate consistently exceeded 90%, contributing to reduced labor costs and improved operational efficiency. The postharvest impurity rate, around 5%, can be effectively managed with conventional sorting equipment, requiring no additional manual intervention and posing no substantial challenge to practical production.

4.2. Analysis of Regression Variance

To assess the influence of the three factors on the evaluation indicators, regression analysis of variance (ANOVA) was performed on the experimental results in Table 4 using Design-Expert 10 software. The ANOVA results for the net harvesting rate were obtained as shown in Table 5.
As shown in the table, the overall regression model is statistically significant (p = 0.0003 < 0.05), indicating that it effectively explains the variation in the recovery rate. Meanwhile, the lack-of-fit term has a p-value of 0.7536 (>0.05), suggesting that the model fits the data well, and that most of the residual errors stem from random variability. Among the three factors, only factor A (excitation frequency) has a p-value less than 0.05, with an F-value of 38.32, indicating a significant effect on the recovery rate. In contrast, the p-values for factors B (excitation force amplitude) and C (phase angle) are 0.5302 and 0.8994, respectively, both being greater than 0.1, indicating that they are not statistically significant in the current model. It is worth noting that although B and C are not statistically significant, they were retained in the response surface model for optimization analysis. This is because they may interact with factor A or contribute to the nonlinear fitting of the model during response surface construction.
Based on the results of multiple regression analysis, the following regression equation was established to describe the relationship between the recovery rate Y1 and the three factors, fitted using Design-Expert 10 software with coded variables:
Y 1 = 27.28707 + 13.33333 A 17.12329 B 9.25926 × 10 4 C
Polynomial regression Equation (6) reveals a linear relationship between the recovery rate Y1 and the three factors, as follows: excitation frequency (A), excitation force amplitude (B), and phase angle (C). The regression coefficient of excitation frequency A is positive (+13.33334), indicating that an increase in frequency significantly enhances the recovery rate. It is the only main effect term that is statistically significant (p < 0.05) in the model. The coefficient for excitation force amplitude B is −17.12329, which, although not statistically significant (p = 0.5302), suggests that the excessive force amplitude may negatively affect fruit detachment within the tested range, potentially causing unstable branch motion or an abnormal fruit response. The regression coefficient of phase angle C is extremely small in absolute value (−9.25926 × 10⁻⁴), with a p-value of 0.8994, indicating that it has a negligible impact on the recovery rate within the current design space.
In summary, Equation (6) highlights that improving the recovery rate primarily depends on the optimization of excitation frequency, while excitation force and phase angle should be properly controlled to avoid operational fluctuations caused by non-significant factors.
To analyze the effects of excitation parameters on the impurity rate, regression analysis of variance (ANOVA) was performed using Design-Expert 10 software based on the experimental results, as shown in Table 6.
As shown in Table 6, the overall p-value of the regression model is 0.0317, which is less than 0.05, indicating that the model is statistically significant. Meanwhile, the p-value of the lack-of-fit term is 0.7847, which is not significant, suggesting a good model fit and that the residual error mainly stems from random variation.
In the analysis of individual factors affecting the impurity rate, only factor B (excitation force amplitude) and the quadratic term A2 (excitation frequency squared) had p-values less than 0.1, specifically 0.0451 and 0.0017, respectively, indicating statistical significance at the 90% confidence level. Other factors, including A, C, and the interaction terms AB, AC, BC, as well as the quadratic terms B2 and C2, had p-values greater than 0.1 and were not statistically significant.
Therefore, in constructing the final polynomial regression model for quality control purposes, only the factors with practical significance and statistical relevance were selected as key regression terms. The polynomial regression equation describing the relationship between the impurity rate and excitation parameters was fitted using coded variables in the Design-Expert 10 software, as follows:
Y 2 = 40.00319 + 21.27315 A 96.8809 B + 4.01399 × 10 3 C + 11.11111 A B 1.893 × 10 3 A C + 0.023846 B C 2.24691 A 2 + 80.69056 B 2 8.23045 × 10 7 C 2
Polynomial regression Equation (7) reveals a complex nonlinear relationship between impurity rate Y2 and the three excitation parameters, as follows: A (frequency), B (amplitude of excitation force), and C (phase angle). Specifically, the linear coefficient of A is +21.27, indicating that increasing frequency tends to increase the impurity rate within the tested range. However, the coefficient of A2 is −2.25, showing a strong negative correlation, which suggests a parabolic trend—impurity rate first increases then decreases—implying an optimal frequency range corresponding to minimal impurity. The coefficient of B is −96.88, indicating that a larger excitation force helps reduce impurities, likely due to the more complete detachment of mature fruits. Nevertheless, the quadratic term B2 has a large positive coefficient of +80.69, suggesting that excessive excitation may result in the detachment of unwanted parts like leaves or unripe fruits, thereby increasing impurities. The linear coefficient of phase angle C is very small and statistically insignificant; however, its interaction terms with A and B (e.g., AB, AC, BC) are present in the model, indicating that C may exert an indirect influence on the impurity rate under specific parameter combinations.
In summary, both excitation frequency and excitation force amplitude exhibit nonlinear effects on the impurity rate, and a moderate combination of these parameters is more favorable for reducing impurities. This regression equation provides a theoretical basis for parameter calibration and adjustment of field harvesting equipment.
To analyze the effects of excitation parameters on the breakage rate, regression ANOVA was performed on the experimental data using Design-Expert 10 software. The results are shown in Table 7.
As shown in the table, the overall regression model has a p-value of 0.0285, which is less than 0.05, indicating that the model is statistically significant and can effectively explain the variation in breakage rate. Additionally, the lack of fit p-value is 0.8029, greater than 0.05, suggesting a good model fit and that the residuals are mainly due to a random error. Among the three influencing factors, only factor A (excitation frequency) has a p-value less than 0.01 (0.0057), indicating a statistically significant effect. The p-values for factors B (excitation force amplitude) and C (phase angle) are 0.2761 and 0.5984, respectively, both greater than 0.1, implying that their effects on the breakage rate are not statistically significant.
Based on the regression analysis results, the polynomial regression equation between the breakage rate Y3 and the three excitation parameters was fitted using coded variables in Design-Expert 10, as follows:
Y 3 = 0.60282 + 1.44444 A 6.13014 B 7.87037 × 10 4 C
Polynomial regression Equation (8) reveals a linear relationship between the breakage rate and the three excitation parameters. The coefficient of A (excitation frequency) is +1.44444, indicating that higher frequencies lead to greater breakage rates within the experimental range. This factor is the only statistically significant variable, and should therefore be considered the key parameter in controlling fruit damage. Although the coefficient of B (excitation force amplitude) is negative (−6.13014), its large p-value suggests a weak effect on the breakage rate under the current conditions, though it may have potential for optimization. The coefficient of C (phase angle) is nearly zero (−7.87 × 10⁻⁴), indicating a minimal influence on breakage rate in the current setting, and it can be treated as a secondary control factor in practical applications. Therefore, during harvesting, excitation frequency should be prioritized to minimize breakage, while amplitude and phase angle can be adjusted within acceptable ranges as auxiliary parameters.
Therefore, during the harvesting process, excitation frequency should be prioritized to reduce fruit breakage, while the excitation force amplitude and phase angle can be adjusted within their permissible ranges as auxiliary control parameters.

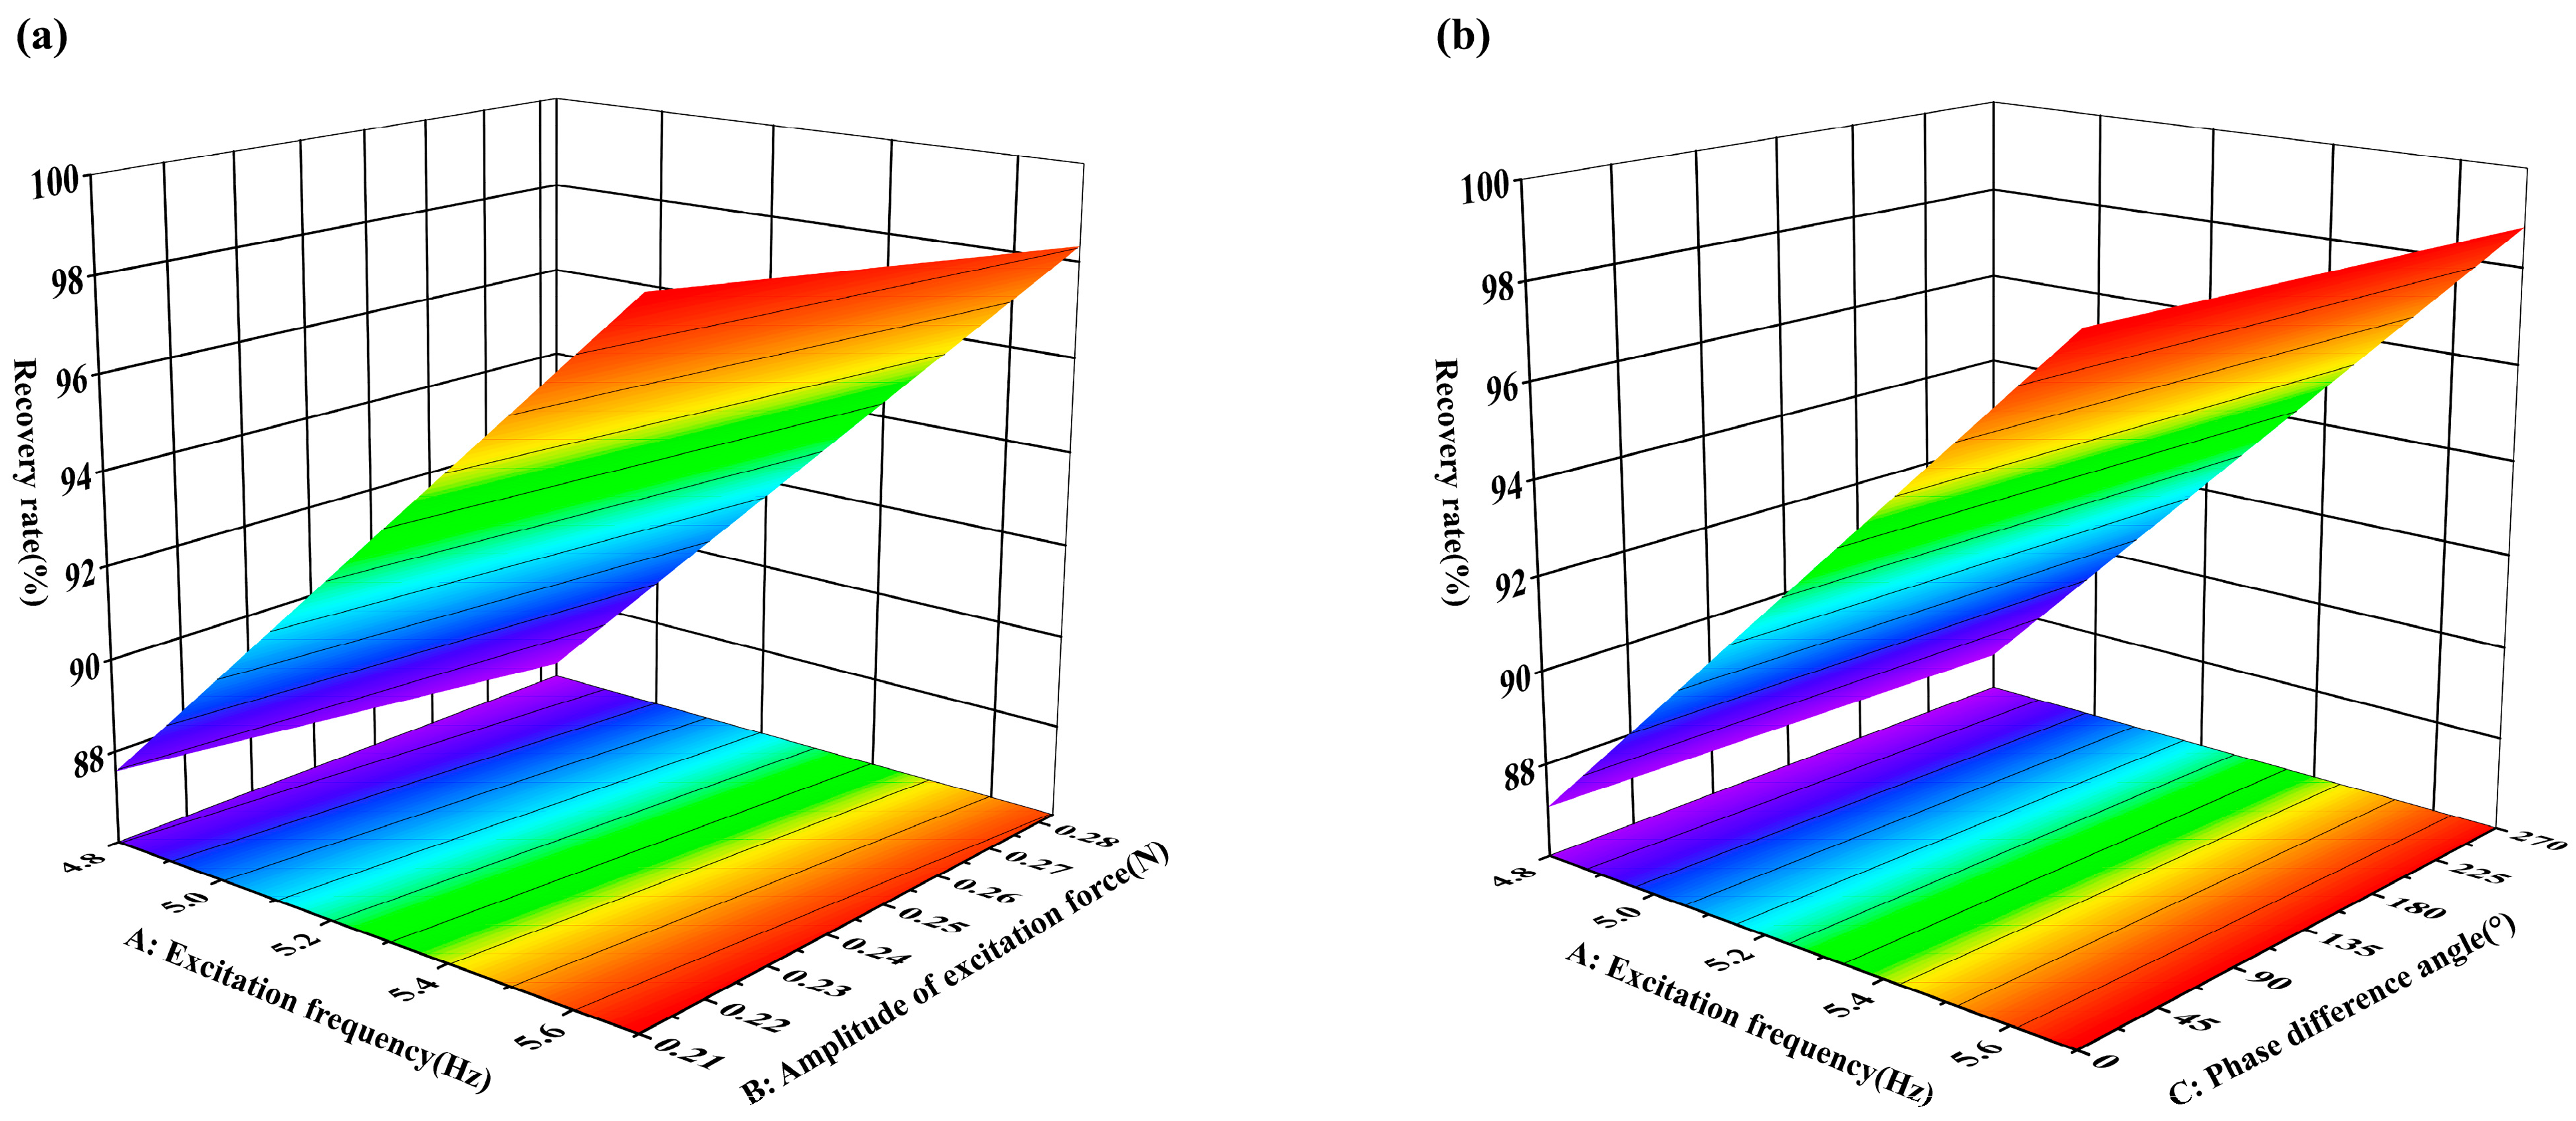
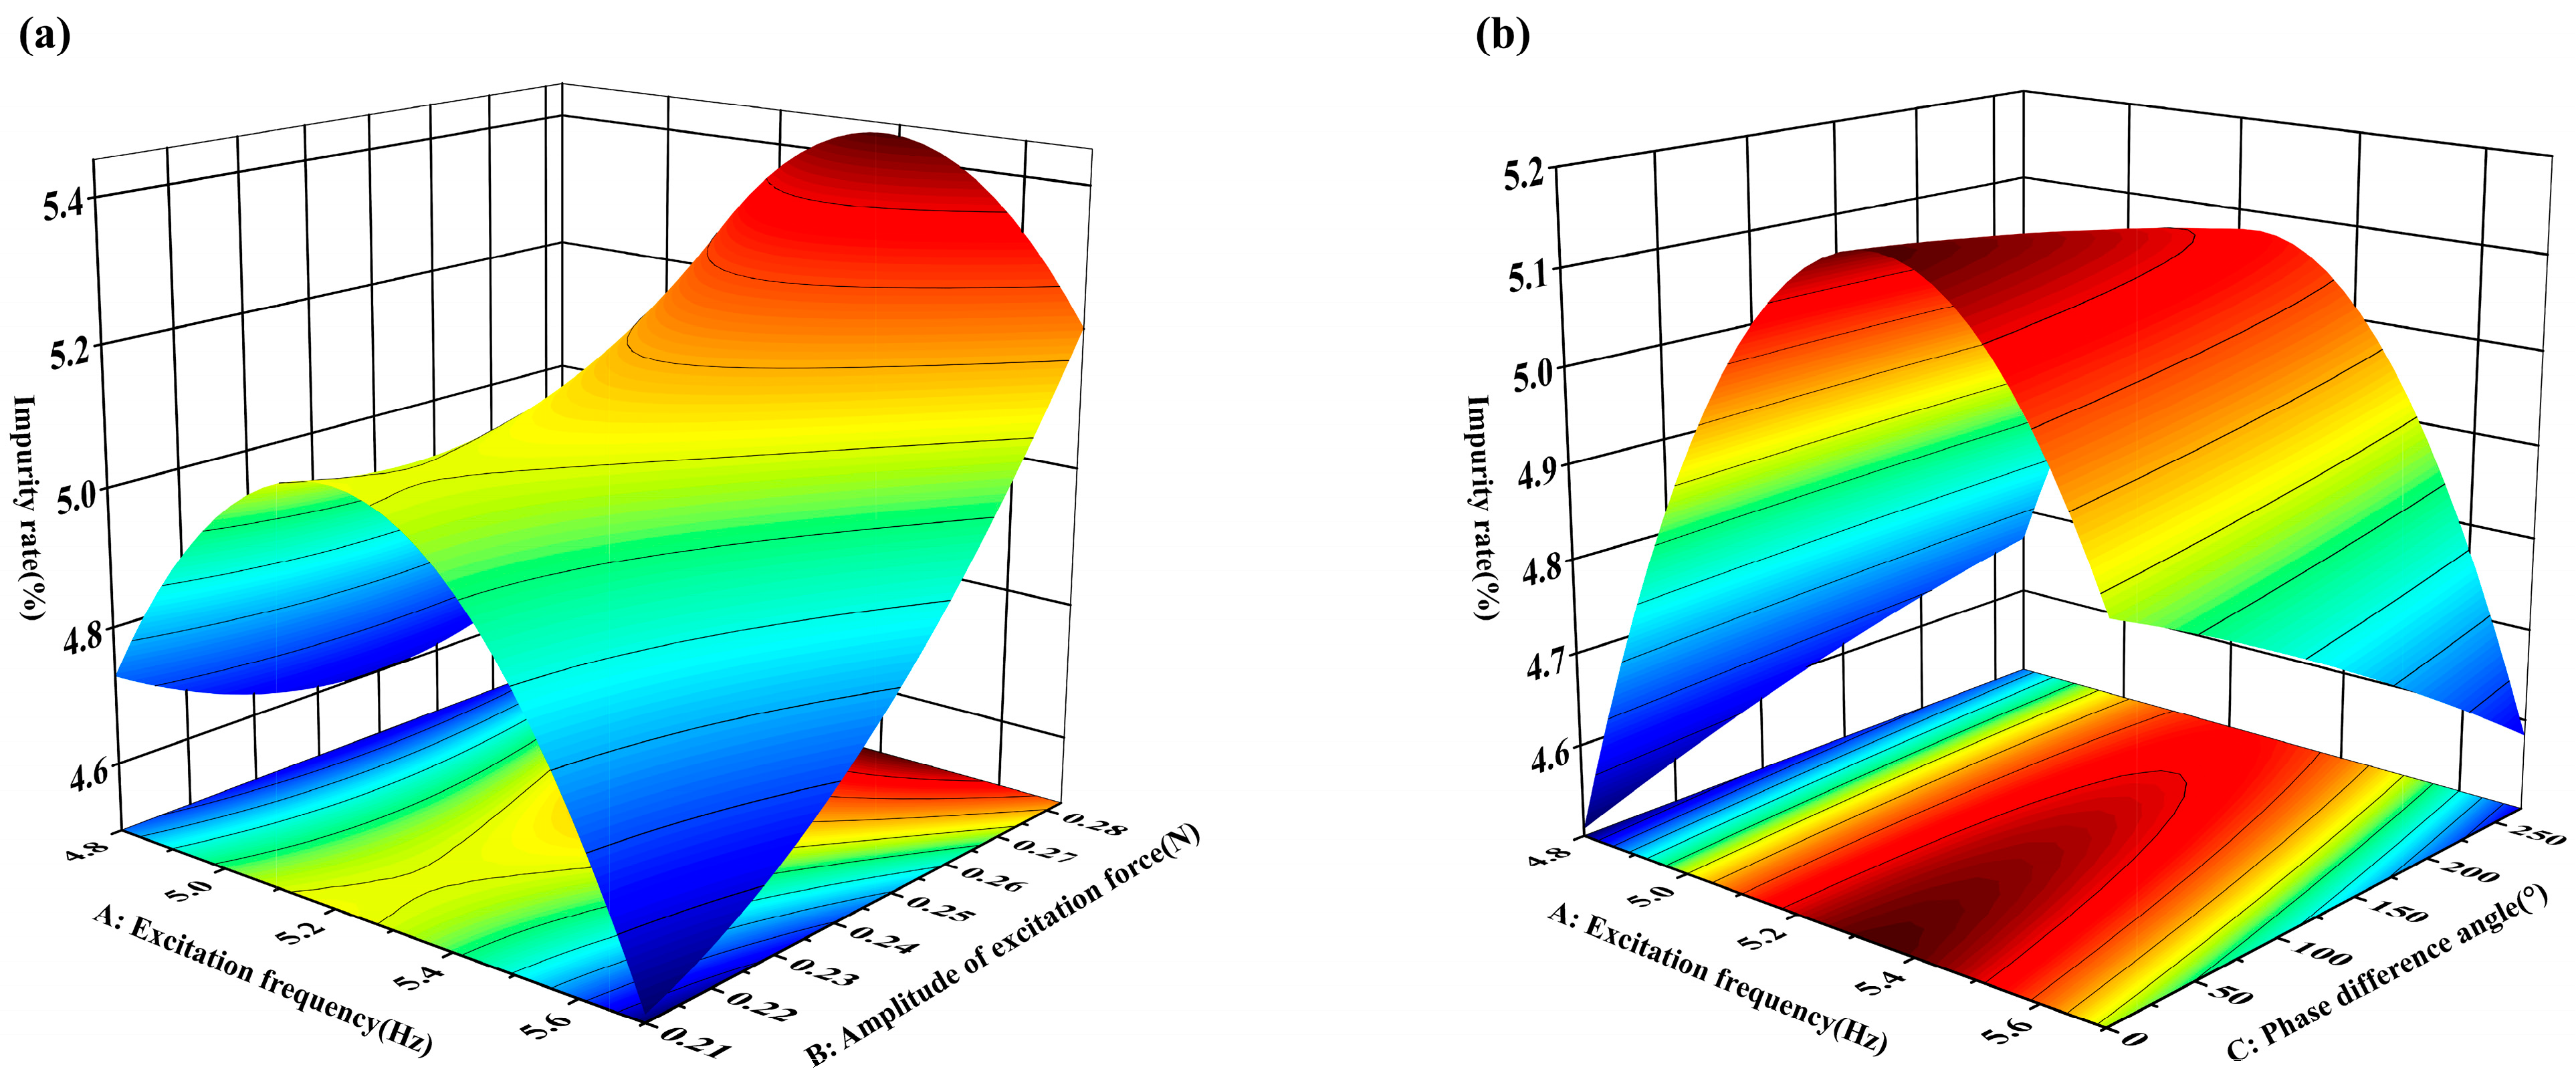
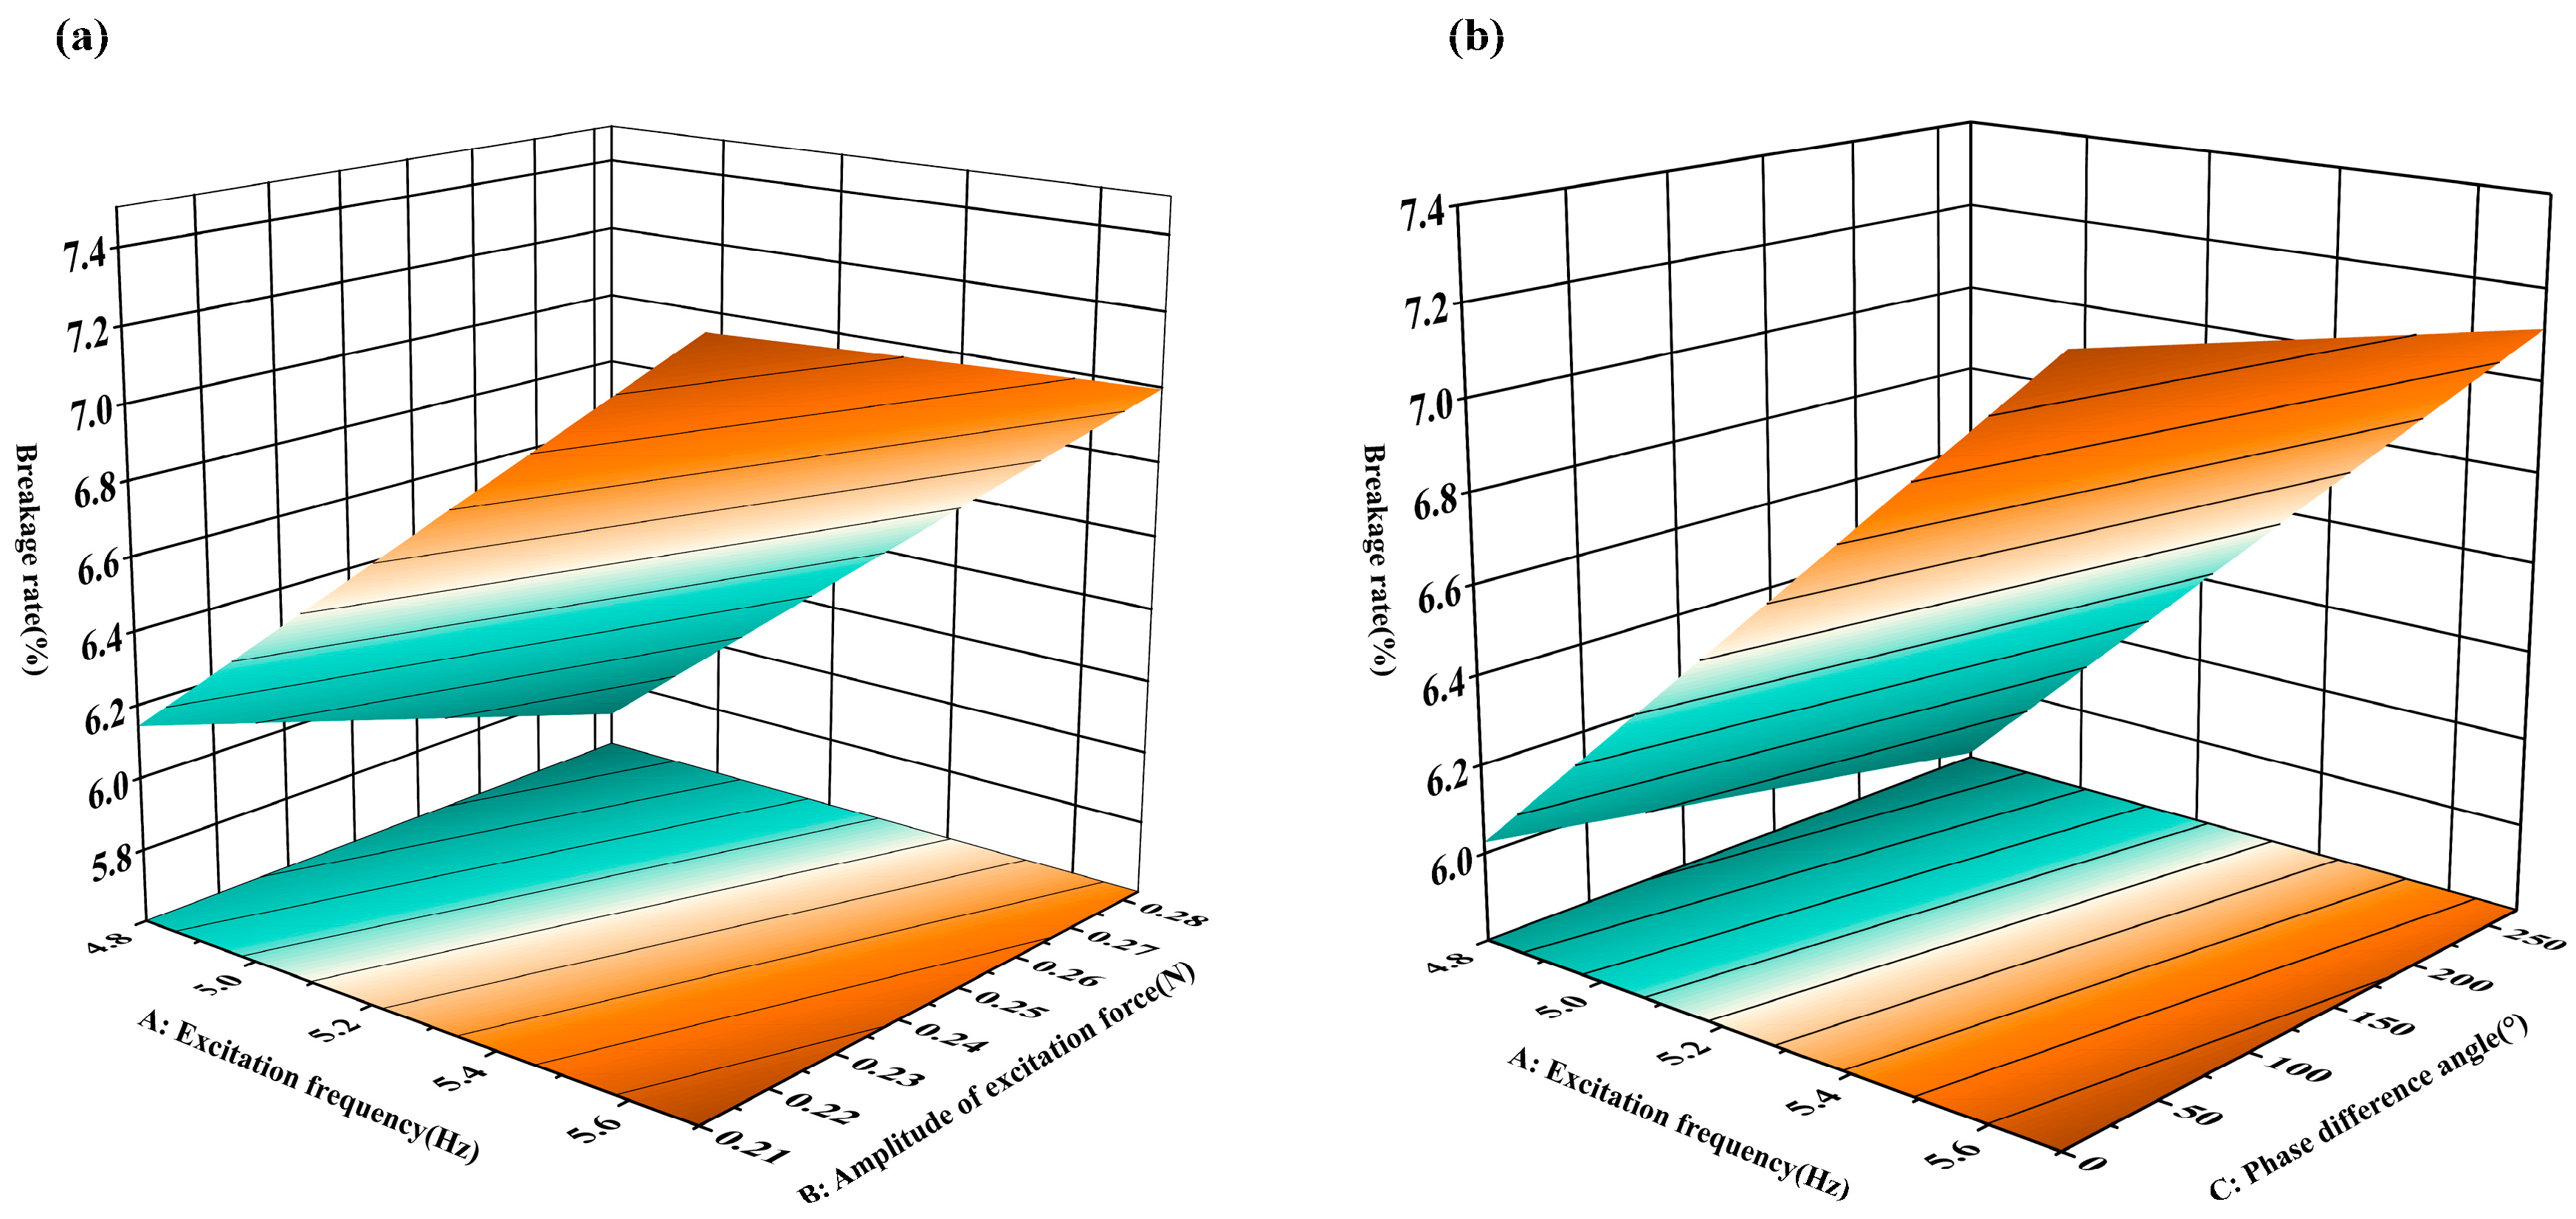
4.3. Response Surface Analysis

In order to obtain the degree of influence of each factor on the evaluation index, a response surface analysis was carried out. The influence of each influencing factor on the net extraction rate is shown in Figure 6a, which shows that when the phase angle is at the level of 0 (C = 135°), the net extraction rate increases with the increase in the excitation frequency and the amplitude of the excitation force, respectively; the response curve varies faster along the direction of A, while it varies slower along the direction of B; and the influence of the excitation frequency on the net extraction rate is more significant than that of the amplitude of the excitation force at the test level.
From Figure 6b, it can be seen that when the amplitude of excitation force is at the level of 0 (B = 0.2465 N), the recovery rate increases with the increase in excitation frequency and decreases with the increase in phase angle; the response curve varies faster along the direction of A and slower along the direction of C; the effect of excitation frequency on the recovery rate at the experimental level is more significant than the effect of the phase angle.
We then analyzed the effect of each influencing factor on the impurity rate. From Figure 7a, it can be seen that when the phase angle is at the level of 0 (C = 135°), the impurity rate also increases with the increase in the excitation frequency and the amplitude of the excitation force, respectively; the response curve changes faster along the direction of A and slower along the direction of B; the effect of the amplitude of the excitation force on the impurity rate is not as significant as that of the excitation frequency under the experimental level.
From Figure 7b, it can be seen that when the amplitude of the excitation force is at the level of 0 (B = 0.2465 N), the impurity rate increases with the increase in the excitation frequency, and decreases with the increase in the phase angle; the response curve changes faster along the direction of A, and slower along the direction of C; the effect of the excitation frequency on the impurity rate is more significant than that of the phase angle under the experimental level.
We then analyzed the effect of each influencing factor on the breakage rate. From Figure 8a, it can be seen that when the phase angle is at the 0 level (C = 135°), the breakage rate increases with the increase in the excitation frequency and the amplitude of the excitation force, respectively; the response curve varies faster along the A direction and slower along the B direction; and the effect of the amplitude of the excitation force on the breakage rate is not as significant as that of the excitation frequency under the experimental level.
From Figure 8b, it can be seen that when the amplitude of the excitation force is at the 0 level (B = 0.2465 N), the breakage rate increases with the increase in the excitation frequency, and changes slowly with the increase in the phase angle; the response curve changes faster along the direction of A, and slower along the direction of C; and the effect of the phase angle on the breakage rate is not as significant as that of the excitation frequency at the experimental level.
The experimental design, regression ANOVA, and response surface analysis showed that the excitation frequency, phase angle, and amplitude of the excitation force had an effect on the final picking quality. When the phase angle is at the 0 test level, the effect of excitation frequency on the net extraction rate is more significant than the effect of excitation force amplitude, and when the excitation force amplitude is at the 0 test level, the effect of excitation frequency on the net extraction rate is more significant than the effect of phase angle; when the phase angle is at the 0 test level, the effect of excitation force amplitude on the impurity rate is not as significant as that of the excitation frequency, and when the excitation force amplitude is at the 0 level, the effect of excitation frequency on the impurity rate is more significant than that of the phase angle; when the phase angle is at the 0 test level, the effect of excitation force amplitude on breakage rate is not as significant as the excitation frequency, when the excitation force amplitude is at the 0 level, the effect of phase angle on breakage rate is not as significant as the excitation frequency; and the primary and secondary order of the influence of each influencing factor on the final response indexes is as follows: excitation frequency > excitation force amplitude > phase angle.

4.4. Optimization of Optimal Working Parameters

To further improve the harvesting quality of the first crop of goji berries, we make reference to the “DB63/T 1420-2020” technical regulations for the construction of an organic cultivation base of goji berries in Qinghai Province and the “DB63/T 1133-2023”specification for the quality control of green goji berries production in Qaidam. For the control specification, the application of Design-expert10 software was optimized for the following response indexes: picking net rate, impurity rate, breakage rate, and the maximum value of picking net rate of wolfberry fruit. The minimum value of the impurity rate of wolfberry fruit and the minimum value of the breakage rate were taken as the optimization goals, and the objective function of performance indexes was established and solved. The performance index objective function is
f m a x ( x ) = Y 1 ( A , B , C ) f m i n ( x ) = Y 2 ( A , B , C ) f m i n ( x ) = Y 3 ( A , B , C ) 4.8   Hz A 5.7   Hz 0.21   N B 0.28   N 0 ° C 270 °
The optimal combination of operating parameters for each influencing factor was finally solved as follows: the best picking quality was achieved at an excitation frequency of 5.7 Hz, an excitation force amplitude of 0.27 N, and a phase angle of 135°.

5. Field Trial Validation

To verify the accuracy of the optimized work parameter combinations, field validation tests were conducted. On 4 August 2024, the weather was sunny; the northwest wind was 1.5 grade; and the temperature was 23~25 °C, in the direction of east–west, north–south, and in the middle of the ground in the arbitrary wolfberry land in the farm of Nuomuhong in Qinghai. Each of the trees were selected without disease and damage, and the fruits had good growth for the Ningqi No. 7 goji berry tree; furthermore, in the direction of southeast, northwest, and east of each tree, one goji berry fruiting branch was selected as the test object for each tree, and a total of twenty groups of tests were carried out, of which the excitation time of each excitation was 10 s. A total of 20 groups of tests, each with an excitation time of 10 s, take the average value for the final test results. A grass-proof cloth was laid to catch the fallen fruits, the developed “portable handheld vibrating goji berry picking device” was used to carry out practical tests, and the working parameters were set as the optimized parameter combinations, as shown in Figure 5b. The experimental statistical results of the field test verification are shown in Table 8, and the effects of some fruit-bearing branches of goji berries before and after picking are shown in Figure 9.
As shown in Table 8, the final average values of the field test for the recovery rate, impurity rate, and breakage rate were 97.58%, 5.12%, and 7.66%, respectively. These results meet the relevant standard requirements and are consistent with the vibration simulation outcomes, thereby validating the effectiveness of the optimized parameter combination and further confirming the reliability of the constructed vibration picking model and simulation analysis. Furthermore, compared to studies on other fruit crops, this research shows good consistency in the selection of excitation parameters and harvesting performance, indicating the broader applicability of vibration-based harvesting techniques. However, considering the unique biomechanical characteristics of first-crop goji berries grown in saline–alkali soils, the optimized parameters proposed in this study are more targeted and provide a representative theoretical basis for the development and adjustment of relevant harvesting equipment.

6. Conclusions

In this paper, the first crop of organic goji berry in saline–alkali land in the Qinghai area, Ningqi No. 7, was taken as the research object, and relevant theoretical and experimental analyses were carried out based on the vibration under vibration picking to explore the response of the first crop of goji berry in the process of mechanized vibration picking. Combined with the first goji berry fruiting branch growth cycle law, the establishment of the mass–damping–stiffness multi-degree-of-freedom vibration model occurred through the simulation analysis and test, and other methods of the main factors affecting the quality of the first crop of goji berry picking analysis, which resulted in the main and secondary order of the impact of each influencing factor on the final response index, which is as follows: excitation frequency > amplitude of the excitation force > phase angle; the optimal excitation point and the work of parameter optimization were obtained through the response surface method. The optimal combination of the excitation point and working parameters is obtained after the optimization of response surface method, which is as follows: the excitation point is at the ripe fruit section, the excitation frequency is 5.7 Hz, the amplitude of excitation force is 0.27 N, and the phase angle is 135°. The actual field test results showed a net picking rate of 97.58%, an impurity rate of 5.12%, and a breakage rate of 7.66%, meeting the relevant quality standards for harvesting. These results not only verify the optimal combination of working parameters and the reliability of the constructed vibration model, but also help preserve the postharvest quality of goji berries. Furthermore, they provide a solid theoretical foundation for future improvements and upgrades to first-crop goji berry harvesting equipment, as well as for the optimization of multi-point vibration harvesting models, with trends in optimized excitation parameters aligning with findings from other fruit crops, such as jujube, blueberry, and camellia, thereby underscoring the adaptability and reference value of the proposed modeling and optimization approach.

Author Contributions

Conceptualization, Y.L.; methodology, J.L. (Jiahui Liu); software, Y.L.; formal analysis, J.Z.; validation, F.W.; investigation, H.Z.; resources, X.S. and Y.S.; data curation, Y.L.; writing—original draft preparation, Y.L.; writing—review and editing, J.L. (Jiahui Liu); visualization, Y.L.; supervision, D.Z.; funding acquisition, J.L. (Jia Liu) and H.Z. All authors have read and agreed to the published version of the manuscript.

Funding

This work is supported by the Qinghai Provincial Key R&D and Transformation-“Horse Racing System” Project(Grant Number: 2024-NK-141S-2) and the Fundamental Research Funds for the Central Universities(Grant Number: 2024-XY-G003).

Institutional Review Board Statement

Not applicable.

Data Availability Statement

The data presented in this study are available on request from the corresponding author. The data are not publicly available due to research data protection and proprietary restrictions.

Conflicts of Interest

The authors declare no conflicts of interest.

References

  1. He, J.W.; Wang, T.S.; Yan, H.; Guo, S.; Hu, K.F.; Yang, X.C.; Ma, C.L.; Duan, J.A. Intelligent Identification Method of Geographic Origin for Chinese Wolfberries Based on Color Space Transformation and Texture Morphological Features. Foods 2023, 12, 2541. [Google Scholar] [CrossRef] [PubMed]
  2. Li, W.; Wang, X.; Kong, H.; Zhang, D. Characterizing Aqueous Cd2+ Removal by Plant Biochars from Qinghai–Tibet Plateau. Water 2022, 14, 4085. [Google Scholar] [CrossRef]
  3. Peng, Q.; Huang, J.; Li, S.; Massou, B.B.; Chen, Z.; Zhu, Q.; Xie, G. Comprehensive origin authentication of wolfberry pulp (Lycium barbarum L.) using multimodal sensory analysis and chemometrics. Ind. Crops Prod. 2024, 219, 119023. [Google Scholar] [CrossRef]
  4. Wang, Y.J.; Liang, X.J.; Guo, S.J.; Li, Y.K.; Zhang, B.; Yin, Y.; An, W.; Cao, Y.L.; Zhao, J.H. Evaluation of nutrients and related environmental factors for wolfberry (Lycium barbarum L.) fruits grown in the different areas of China. Biochem. Syst. Ecol. 2019, 86, 103916. [Google Scholar] [CrossRef]
  5. Yin, W.X.; Zhang, C.; Zhu, H.Y.; Zhao, Y.R.; He, Y. Application of near-infrared hyperspectral imaging to discriminate different geographical origins of Chinese wolfberries. PLoS ONE 2017, 12, e0180534. [Google Scholar] [CrossRef]
  6. Yang, T.; Zhou, S.X.; Fang, S.T.; Qin, W.Y.; Inman, D.J. Nonlinear vibration energy harvesting and vibration suppression technologies: Designs, analysis, and applications. Appl. Phys. Rev. 2021, 8, 031317. [Google Scholar] [CrossRef]
  7. Polat, M.; Mertoglu, K.; Eskimez, I.; Okatan, V. Effects of the fruiting period and growing seasons on market quality in goji berry (Lycium barbarum L.). Folia Hortic. 2020, 32, 229–239. [Google Scholar] [CrossRef]
  8. Bolat, F.C.; Sugec, A.; Ozdemir, A. Design, numerical analysis and experiments of different types auxetic beams for vibration based energy harvester. Mech. Syst. Signal. Process. 2024, 210, 111170. [Google Scholar] [CrossRef]
  9. Chen, Y.; Zhao, J.; Hu, G.; Chen, J. Design and testing of a pneumatic oscillating Chinese wolfberry harvester. Horticulturae 2021, 7, 214. [Google Scholar] [CrossRef]
  10. So, J. Vibration characteristics of boxthorn (Lycium chinense Mill) branches. Appl. Eng. Agric. 2001, 17, 755. [Google Scholar] [CrossRef]
  11. So, J. Vibratory harvesting machine for boxthorn (Lycium chinense Mill) berries. Trans. ASAE 2003, 46, 211. [Google Scholar] [CrossRef]
  12. Jinpeng, W.; Song, M.; Hongru, X.; Ying, Z.; Hongping, Z. Research on mechanized harvesting methods of Lycium barbarum fruit. IFAC-Pap. 2018, 51, 223–226. [Google Scholar] [CrossRef]
  13. Tang, X.; Ren, J.; Liu, C.; Xiao, D. Simulation of vibration harvesting mechanism for wolfberry. Am. Soc. Agric. Biol. Eng. 2011, 1. [Google Scholar] [CrossRef]
  14. Zhao, J.; Tsuchikawa, S.; Ma, T.; Hu, G.; Chen, Y.; Wang, Z.; Chen, Q.; Gao, Z.; Chen, J. Modal analysis and experiment of a Lycium barbarum L. Shrub for efficient vibration harvesting of fruit. Agriculture 2021, 11, 519. [Google Scholar] [CrossRef]
  15. Chen, Y.; Zhao, J.; Chen, Q.Y.; Chen, J. Simulation for Fitting the Bending Shape of Fruit Branches of Based on the Finite Element Method. Horticulturae 2021, 7, 434. [Google Scholar] [CrossRef]
  16. Mei, S.; Wang, J.P.; Song, Z.Y.; Tang, D.B.; Shen, C. Mechanism and experimental study on the fruit detachment of Chinese wolfberry through reciprocating vibration. Int. J. Agr. Biol. Eng. 2024, 17, 47–58. [Google Scholar] [CrossRef]
  17. Zhuo, P.; Li, Y.X.; Jiao, H.B.; Wang, P.; Li, C.S.; Niu, Q.; Wang, L.H. Analysis and experimental study on vibration response characteristics of mechanical harvesting of jujube. Comput. Electron. Agr. 2022, 203, 107446. [Google Scholar] [CrossRef]
  18. Zhou, J.; Xu, L.Y.; Zhang, A.Q.; Hang, X.C. Finite element explicit dynamics simulation of motion and shedding of jujube fruits under forced vibration. Comput. Electron. Agr. 2022, 198, 107009. [Google Scholar] [CrossRef]
  19. Hu, Y.; Zheng, Z.; Yu, C.; Feng, J.; Qiao, Y. Vibration response characteristics of Jujube trees based on finite element method and structure-from-motion. Sci. Hortic. 2024, 331, 113125. [Google Scholar] [CrossRef]
  20. Cao, J.; An, J.; Xu, D.; Bai, X.; Li, W.; Chen, C. Test and analysis of walnut (Juglans regia L.) tree vibration transfer based on a low-frequency shaking table. Ind. Crops Prod. 2024, 216, 118797. [Google Scholar] [CrossRef]
  21. Cao, J.; Bai, X.; Xu, D.; Li, W.; Chen, C. Experiment and analysis on walnut (Juglans regia L.) Shedding force based on low-frequency vibration response. Ind. Crops Prod. 2023, 204, 117242. [Google Scholar] [CrossRef]
  22. Wang, Y.F.; Wang, W.Z.; Fu, H.; Yang, Z.; Lu, H.Z. Detachment patterns and impact characteristics of litchi fruit during vibrational harvesting. Sci. Hortic. 2022, 295, 110836. [Google Scholar] [CrossRef]
  23. Du, X.; Shen, T.; Zhao, L.; Zhang, G.; Hu, A.; Fang, S.; Cao, Y.; Yao, X. Design and experiment of the comb-brush harvesting machine with variable spacing for oil-tea camellia fruit. Int. J. Agr. Biol. Eng. 2021, 14, 172–177. [Google Scholar] [CrossRef]
  24. Lyu, X.; Wang, H.; Xu, G.; Chu, C. Research on fruit picking test of blueberry harvesting machinery under transmission clearance. Heliyon 2024, 10, e34740. [Google Scholar] [CrossRef] [PubMed]
  25. Hou, J.M.; Hu, W.X.; Wang, W.; Zhu, H.J.; Zhi, R.D. Fruit Vibration Harvesting Technology and Its Damage. A Review. Inmateh-Agric. Eng. 2021, 63, 155–168. [Google Scholar] [CrossRef]
  26. Jin, Y.; Hou, S.A.; Yang, T.Z. Cascaded essential nonlinearities for enhanced vibration suppression and energy harvesting. Nonlinear. Dynam. 2021, 103, 1427–1438. [Google Scholar] [CrossRef]
  27. Liu, C.Y.; Xu, D.C.; Cao, J.L. Vibration Response of Walnuts under Vibration Harvesting. Agronomy 2023, 13, 461. [Google Scholar] [CrossRef]
  28. Sun, X.D.; Wu, W.D.; Cao, C.M.; Xu, L.Y.; Jiang, R.; Fang, L.F.; Sheng, Z.L.; Lu, X.Y. Research on vibration response characteristics and separation deformation law of fruit-branch system. Aip. Adv. 2023, 13, 065306. [Google Scholar] [CrossRef]
  29. Ferreira, L.D.; da Silva, F.M.; Ferreira, D.D.; de Souza, C.E.P.; Pinto, A.W.M.; Borges, F.E.D. Dynamic behavior of coffee tree branches during mechanical harvest. Comput. Electron. Agr. 2020, 173, 105415. [Google Scholar] [CrossRef]
  30. Delin, W.; Enlong, Z.; Shan, J.; Weiwei, W.; Jiahao, Y.; Kui, W. Optimization and Experiment of Canopy Vibration Parameters of Camellia oleifera Based on Energy Transfer Characteristics. Nongye Jixie Xuebao/Trans. Chin. Soc. Agric. Mach. 2022, 53, 23–33. [Google Scholar] [CrossRef]
  31. Wang, Y.; Xu, L.; Zhang, Y.; Zhu, Y.; Zhou, H.; Cui, W.; Zhang, A. Study of vibration patterns and response transfer relationships in walnut tree trunks. Sci. Hortic. 2024, 337, 113567. [Google Scholar] [CrossRef]
  32. Xuan, Y.; Xu, L.; Liu, G.; Zhou, J. The vibrational response of simulated Ginkgo biloba fruit based on their frequency spectrum characteristics. PLoS ONE 2020, 15, e0235494. [Google Scholar] [CrossRef] [PubMed]
  33. Li, L.; Chen, X. The Phenomenon of Bistable Phase Difference Intervals in the Times-Frequency Vibration Synchronization System Driven by Two Homodromy Exciters. Math. Probl. Eng. 2020, 2020, 1430531. [Google Scholar] [CrossRef]
Figure 1. Fruiting branches of the first crop of goji berries and schematic diagrams; (a) fruiting branches of the first crop of goji berries; (b) schematic diagram of fruiting branches of the first crop of goji berries.
Agriculture 15 01377 g001
Figure 2. Vibration model construction and force analysis of the hanging branches of the first crop of goji berries in Qinghai. (a) Vibration model construction; (b) vibration model force analysis.
Agriculture 15 01377 g002
Figure 3. Binding force statistics.
Agriculture 15 01377 g003
Figure 4. Simulation results of vibration response under different excitation conditions during the excitation of ripe fruit section. (a) Simulation results when the excitation force is 4.8 Hz, the phase angle is 0°, and the excitation force amplitude is 0.21 N; (b) Simulation results when the excitation force is 4.8 Hz, the phase angle is 270°, and the excitation force amplitude is 0.203 N; (c) Simulation results when the excitation force is 5.7 Hz, the phase angle is 0, and the excitation force amplitude is 0.283 N; (d) Simulation results when the excitation force is 5.7 Hz, the phase angle is 270°, and the excitation force amplitude is 0.264 N.
Agriculture 15 01377 g004
Figure 5. Vibratory harvesting characterization and validation in field practical experiments; (a) vibratory harvesting characterization experiment; (b) practical field experiment validation.
Agriculture 15 01377 g005
Figure 6. Influence of each influencing factor on recovery rate. (a) Effect of excitation frequency and amplitude of excitation force on recovery rate; (b) effect of excitation frequency and phase angle on recovery rate.
Agriculture 15 01377 g006
Figure 7. Influence of each influencing factor on the impurity rate. (a) Effect of excitation frequency and amplitude of excitation force on impurity rate; (b) effect of excitation frequency and phase angle on impurity rate.
Agriculture 15 01377 g007
Figure 8. Influence of each influencing factor on breakage rate. (a) Effect of excitation frequency and excitation force amplitude on breakage rate; (b) effect of excitation frequency and phase angle on breakage rate.
Agriculture 15 01377 g008
Figure 9. Effect of vibration of fruit-hanging branches of goji berries before and after vibration picking. (a) Distribution of fruits before picking of the first crop of goji berries; (b) distribution of fruits after picking of the first crop of goji berries; (c) mature fruits of the first crop of goji berries under vibration picking.
Agriculture 15 01377 g009
Table 1. Key parameters of the vibration model.
NameRipe Fruit SegmentYellow Fruit SegmentGreen Fruit Segment
Mass m 1 m 2 m 3
Damping c 1 c 2 c 3
Stiffness k 1 k 2 k 3
Displacement x 1 ( t ) x 2 ( t ) x 3 ( t )
Excitation force F 1 ( t ) F 2 ( t ) F 3 ( t )
Table 2. Equivalent parameters of the segments in the vibration model of fruit-bearing branches in goji berries.
Excitation PointEquivalent Mass
(Kg)
Equivalent Damping
(Ns/m)
Equivalent Stiffness
(N/m)
Ripe fruit segment0.0930.2284.03
Yellow fruit segment0.0250.0187
Green fruit segment0.0110.0158
Table 3. Simulated response values under different excitation conditions.
Excitation PointExcitation Frequency
(Hz)
Phase Angle
(°)
Amplitude of
Excitation Force (N)
Ripe fruit segment4.800.21
4.8900.203
4.81800.21
4.82700.203
5.700.283
5.7900.264
5.71800.283
5.72700.264
Yellow fruit segment4.800.23
4.8900.21
4.81800.23
4.82700.21
5.700.3
5.7900.27
5.71800.3
5.72700.27
Green fruit segment4.800.67
4.8900.64
4.81800.67
4.82700.64
5.700.67
5.7900.64
5.71800.67
5.72700.64
Table 4. Three-factor three-level orthogonal combination experimental program and results.
Experiment No.Influencing FactorEvaluation Indicators
Excitation Frequency A (Hz)Amplitude of Excitation Force B (N)Phase
Angle
C (°)
Recovery Rate
Y1 (%)
Impurity Rate
Y2 (%)
Breakage Rate
Y3 (%)
15.250.283270895.475.84
25.250.2465135905.395.73
34.80.21135834.665.67
45.250.2465135915.136.69
55.250.210945.216.98
65.250.2830925.196.91
74.80.283135874.735.73
84.80.2465270894.625.81
95.70.2831351005.277.12
104.80.24650904.586.67
115.250.2465135955.036.72
125.70.24650984.936.59
135.250.21270965.027.01
145.250.2465135974.825.64
155.70.211351004.477.73
165.70.2465270994.517.64
175.250.2465135905.287.19
Table 5. Analysis of variance (ANOVA) for the effect of each factor on the recovery rate.
SourceSquare SumDegrees of
Freedom
Mean SquareF-Valuep-Value
Mold291.25397.0812.920.0003
A288.001288.0038.32<0.0001
(significant)
B3.1313.130.420.5302
C0.1310.130.0170.8994
Residual97.69137.51
Lack of Fit56.4996.280.610.7536
(not significant)
Pure Error41.2410.30
Cor Total388.9416
Table 6. Analysis of variance (ANOVA) of each influencing factor on impurity rate.
SourceSquare SumDegrees of
Freedom
Mean SquareF-Valuep-Value
Mold1.4190.164.40.0317 (significant)
A0.04410.0441.220.3058
B0.2110.215.930.0451
C0.01110.0110.290.6039
AB0.1310.133.740.0945
AC0.05310.0531.480.2626
BC0.05510.0551.550.2533
A20.8710.8724.450.0017
B20.04910.0491.370.2809
C20.000947410.00094740.0270.8751
Residual0.2570.036
Lack of Fit0.05330.0180.360.7847 (not significant)
Pure Error0.240.049
Cor Total1.6616
Table 7. Analysis of variance of each influencing factor on breakage rate.
SourceSquare SumDegrees of
Freedom
Mean SquareF-Valuep-Value
Mold3.8731.294.160.0285 (significant)
A3.3813.3810.910.0057
B0.4010.401.290.2761
C0.09010.0900.290.5984
Residual4.03130.31
Lack of Fit2.1990.240.530.8029 (not significant)
Pure Error1.8440.46
Cor Total7.916
Table 8. Statistics of field experimental results.
Number of GroupsRecovery Rate (%)Impurity Rate (%)Breakage Rate (%)
192.865.177.69
298.416.449.68
397.064.8310.61
41005.306.58
598.044.848
694.594.958.57
798.284.037.02
891.534.657.41
91006.176.76
1098.614.798.45
1198.555.335.88
121004.875.77
1397.144.968.82
1496.724.126.78
1597.264.587.04
1696.774.606.67
171004.418.77
1898.534.9010.45
1998.636.308.33
2098.537.205.97
Average value (%)97.585.127.66
Disclaimer/Publisher’s Note: The statements, opinions and data contained in all publications are solely those of the individual author(s) and contributor(s) and not of MDPI and/or the editor(s). MDPI and/or the editor(s) disclaim responsibility for any injury to people or property resulting from any ideas, methods, instructions or products referred to in the content.

