Abstract
Soil salinization poses a significant threat to agricultural productivity, food security, and ecological sustainability in arid and semi-arid regions. Effectively and timely mapping of different degrees of salinized soils is essential for sustainable land management and ecological restoration. Although deep learning (DL) methods have been widely employed for soil salinization extraction from remote sensing (RS) data, the integration of multi-source RS data with DL methods remains challenging due to issues such as limited data availability, speckle noise, geometric distortions, and suboptimal data fusion strategies. This study focuses on the Keriya Oasis, Xinjiang, China, utilizing RS data, including Sentinel-2 multispectral and GF-3 full-polarimetric SAR (PolSAR) images, to conduct soil salinization classification. We propose a Dual-Modal deep learning network for Soil Salinization named DMSSNet, which aims to improve the mapping accuracy of salinization soils by effectively fusing spectral and polarimetric features. DMSSNet incorporates self-attention mechanisms and a Convolutional Block Attention Module (CBAM) within a hierarchical fusion framework, enabling the model to capture both intra-modal and cross-modal dependencies and to improve spatial feature representation. Polarimetric decomposition features and spectral indices are jointly exploited to characterize diverse land surface conditions. Comprehensive field surveys and expert interpretation were employed to construct a high-quality training and validation dataset. Experimental results indicate that DMSSNet achieves an overall accuracy of 92.94%, a Kappa coefficient of 79.12%, and a macro F1-score of 86.52%, positively outperforming conventional DL models (ResUNet, SegNet, DeepLabv3+). The results confirm the superiority of attention-guided dual-branch fusion networks for distinguishing varying degrees of soil salinization across heterogeneous landscapes and highlight the value of integrating Sentinel-2 optical and GF-3 PolSAR data for complex land surface classification tasks.
1. Introduction
Soil salinization, which significantly accelerates land degradation and declining soil productivity, has become one of the most critical threats to agriculture and food security [1,2]. Owing to factors including dry climate, low precipitation, and high evaporation, excessive salt accumulation degrades soil structure, fertility, plant growth, crop yields, and microbial activity [3]. It has affected over 8.31 × 10⁸ ha of soil worldwide, and the salt-affected area continues to increase [4,5]. China is recognized as a country significantly affected by salinization, with a total area of saline soil of 3.6 × 10⁷ ha [6]. In China, Xinjiang represents a major region impacted by saline soils, comprising nearly 20% of the nation’s total saline land area, hindering the sustainable development of local agriculture [7,8,9]. Therefore, timely and effective monitoring of the spatiotemporal distribution of soil salinization is vital for ensuring sustainable agricultural development and safeguarding food security [2].
Traditional studies have primarily relied on in-situ sampling and laboratory measurement, which are both labor- and time-intensive [10]. These methods are often limited by sparse sampling points, small spatial coverage, and high uncertainty, resulting in limited representativeness of the results [11,12]. With its wide coverage, short acquisition cycle, and fast processing speed, RS has emerged as a key approach for monitoring soil salinization [13]. Optical remote sensing has been extensively utilized for regional and global-scale monitoring, mapping, and control of soil salinization, and remains the most widely adopted multi-temporal dynamic soil monitoring technology [14]. However, optical remote sensing is limited by its sensitivity to atmospheric conditions and lack of surface penetration capability, which constrains its effectiveness in monitoring soil salinity under unfavorable weather or surface cover conditions [15,16].
Synthetic Aperture Radar (SAR) provides continuous earth observation capabilities, unaffected by weather conditions or cloud cover, enabling day-and-night monitoring [17]. Moreover, SAR backscatter is highly sensitive to soil electrical conductivity (EC), which is strongly influenced by salinity levels [18,19,20]. Consequently, SAR has the potential for effective application in soil salinity monitoring [18]. Polarimetric Synthetic Aperture Radar (PolSAR) is an advanced imaging radar system characterized by its multi-channel and multi-parameter capabilities [21]. It acquires information from electromagnetic waves that are transmitted toward target objects and subsequently reflected to the sensor. The received signals provide rich target-specific scattering characteristics [22]. By using PolSAR, we can obtain more complete polarimetric scattering characteristics of targets than using single-polarization radar, making PolSAR a significant part in obtaining a variety of details such as physical dielectric characteristics, geometric shapes, and target directions of ground objects [23]. It enhances the radar’s capability to obtain target information [23,24,25]. At the same time, polarization decomposition is utilized to extract target features from the polarimetric SAR data that meet the classification criteria, thereby enabling more accurate target classification and recognition [26]. It has found extensive application in land cover monitoring [27,28,29], target detection [30,31,32], and terrain classification [33,34,35,36].
In the past decade, there has been an increasing application of deep learning-based classifiers in PolSAR image classification [33,37,38,39,40]. As a branch of machine learning, deep learning efficiently handles complex data and is highly capable of feature extraction. Owing to these strengths, it has demonstrated superior performance in PolSAR data interpretation, often outperforming traditional classification methods [39]. However, recent studies have highlighted several persistent challenges, including the limited availability of labeled samples, the complicated scattering mechanisms inherent in PolSAR data, and the difficulty of effectively integrating global and local features across multiple data sources [41,42].
With the continuous development of computer vision, the attention mechanism has been improved and applied to image semantic segmentation [43,44]. The attention mechanism dynamically highlights key features while filtering out less relevant information, thereby improving model performance [45]. It is primarily categorized into spatial attention [46], channel attention [47], self-attention [48], and cross-attention [49], among others. Spatial and channel attention are often combined into the CBAM module for multi-source feature fusion [47]. These attention mechanisms comprehensively scan the input image, allocating attention resources to different regions, selecting key areas to gather more detailed information, and suppressing attention to non-essential regions [41]. In the field of RS, attention mechanisms have been widely applied to semantic segmentation, particularly for the multi-scale, multi-source feature fusion of optical and radar images, addressing challenges related to scale variation and feature integration [50]. Gao et al. proposed a dual-encoder network with a detail attention module (DAM) and composite loss to enhance SAR-optical image fusion and classification [51]. Yu et al. proposed a dual-attention fusion network (DAOSNet), which enhances SAR-optical image classification by balancing cross-modal semantics and spatial detail through attention-based fusion and a semantic balance loss [52]. Both self-attention and cross-attention mechanisms have been employed in RS, where self-attention enhances feature interactions within the image and strengthens global dependencies, while cross-attention improves feature fusion by facilitating information exchange between different features [53]. The coupling of them has been proposed to deal with difficulties in scale variation and feature fusion. Li et al. introduced the multimodal-cross attention network (MCANet), which fully leveraged both self-attention and cross-attention to independently extract and fuse features, demonstrating exceptional performance in fusing these two modalities [54]. However, current research is more focused on feature fusion between SAR and optical images within the domain of computer vision and pattern recognition [55,56]. Due to limitations in the dataset and factors such as spatial heterogeneity in geographical environments, studies embedding attention mechanisms into deep learning algorithms for RS applications in environmental monitoring remain relatively few. Furthermore, the existing studies mainly focus on the feature fusion of raw optical and radar images, with limited attention given to the deep fusion of optical spectral information and the backscattering physical information from radar images.
To address the aforementioned challenges, this study focused on the Keriya Oasis in Xinjiang, China, utilizing Gaofen-3 full-polarization radar images and Sentinel-2 multi-spectral images with a 10 m resolution as input data. Spectral indices and radar full-polarization parameters were extracted and subjected to feature selection to identify key features. Additionally, a Dual-Modal Deep Learning Network for Soil Salinization (DMSSNet) mapping was proposed in this study. The encoder of DMSSNet employed a Dual-Branch structure to refine features separately for optical and radar data. The fusion module integrated self-attention and CBAM mechanisms, while the decoder, inspired by the UNet architecture, used an upsampling process with skip connections. This framework was designed to enhance the accuracy of soil salinization mapping through effective multi-modal data fusion.
2. Study Area and Data
2.1. Study Area
The Keriya Oasis (36°47′–37°06′ N, 81°08′–81°45′ E) is situated in Yutian County, Xinjiang, China [57]. The southern region is mountainous, the central area is a plain oasis, and the northern part is dominated by a vast desert. The elevation difference between the north and south is 3500 m [23] (Figure 1). The climate is typical of an inland warm temperate arid desert, characterized by abundant heat and sunshine, significant diurnal temperature variation, low annual precipitation of approximately 44.7 mm, and high annual evapotranspiration reaching about 2498 mm [23]. Natural vegetation is mostly drought-tolerant and salt-tolerant, which adapts to the extremely arid climate [58]. The Keriya River is the main water source, fed by glacial meltwater, snowmelt, and precipitation from the Kunlun Mountains [59,60]. Intense evaporation, shallow groundwater, and topographic conditions drive the upward migration of dissolved salts, resulting in widespread soil salinization and desertification, particularly in the oasis–desert ecotone [60]. Therefore, rapid and precise monitoring of soil salinity distribution is fundamental for ensuring agricultural sustainability and maintaining regional ecological stability.
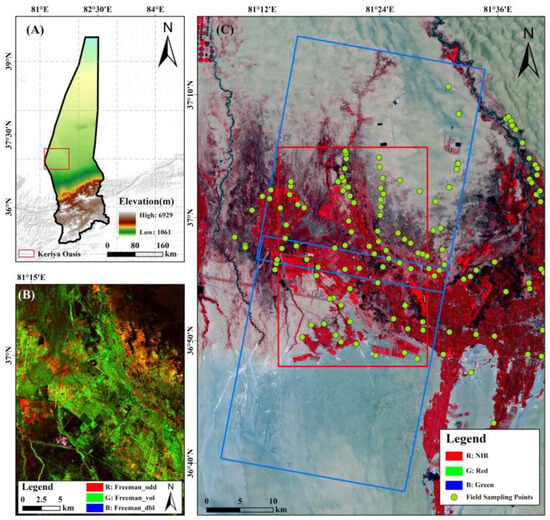
Figure 1.
Location map of the study area. (A) DEM data of the Keriya Oasis; (B) Subset images in Freeman decomposition; (C) Sentinel-2 false-color optical imagery and field sampling sites.
2.2. Data Acquisition and Pre-Processing
The Gaofen-3 (GF-3) satellite is the pioneering satellite from China that utilizes a quad-polarized C-band SAR system. It features 12 distinct imaging modes, offering spatial resolutions ranging from 1 to 500 m and swath widths between 5 and 650 km [61]. It offers several advantages, including high resolution, wide coverage, multi-polarization, and high-quality imaging, enabling crucial technological support for ocean exploration [62], land resource monitoring [63], and disaster prevention [64]. The GF-3 data employed in this research were acquired from the study area on 9 June 2023. These specific parameters are provided in Table 1.

Table 1.
Main parameters of GF-3 data.
The GF-3 data were pre-processed using the software SNAP® 7.0. The procedures for processing PolSAR data were as follows: (1) generating a single look complex (SLC) image; (2) radiometric calibration; (3) multi-looking; (4) speckle filtering; (5) terrain correction, correction of PolSAR geometric distortion using digital elevation model (DEM) to address geometric distortion; (6) geocoding; (7) data resampling, image resizing to achieve an optimal resolution of 10 m × 10 m; (8) spatial subsetting; (9) mosaicing.
For this study, the Sentinel-2 L1A products, including Band 2 (blue), Band 3 (green), Band 4 (red), and Band 8 (NIR) with 10 m resolution, were collected on 9 June 2023. The pre-processing of the Sentinel-2 data includes radiation correction and atmospheric correction, resampling, and clipping. Finally, the registration of GF-3 images was conducted by aligning them with the Sentinel-2 imagery.
2.3. Field Data Acquisition
Field sampling was carried out between 22 May 2023 and 9 June 2023. A total of 79 sample sites were distributed throughout the study region (Figure 2A), which almost covered most of the types of ground objects. During the sampling process, the coordinate information of the sample sites, sampling time, soil properties, and types were recorded in detail. Based on the findings of previous studies [65], a classification standard for soil salinization degree has been established, and land cover is categorized into six types: water body, vegetation, barren land, slightly salinized soil, moderately salinized soil, and strongly salinized soil, as demonstrated in Table 2.
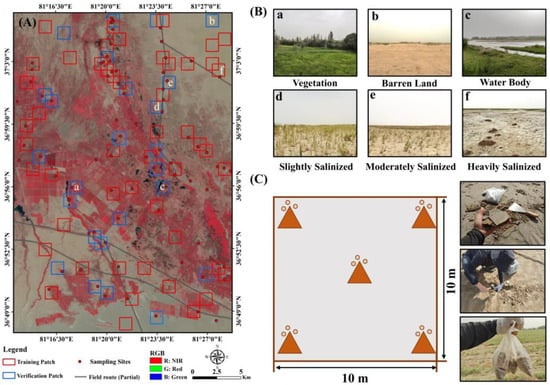
Figure 2.
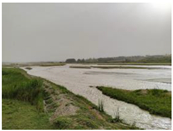
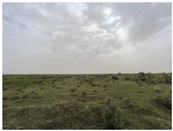
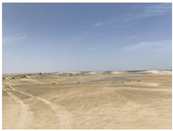
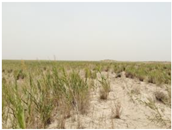
(A) Locations of field plots and selected patches for training and validation; (B) landscape photos of in-field sites; (C) sampling quadrat and field site photos.

Table 2.
Grading of soil salinization.
Considering the unity of pixels and vegetation types, the same feature, about 100 m2 of flat sample patches, was selected for sampling, with five sampling points in each patch. In each sampling area, three soil samples were obtained, resulting in a total of 15 soil samples per patch (Figure 2C). Soil salinity and other physicochemical characteristics were measured under laboratory conditions after sampling from the soil surface (0–10 cm). After air-drying and passing through a 1 mm sieve, the soil samples were mixed with distilled water at a 1:5 ratio in a flask. The flask was shaken by hand for 3 min to allow complete penetration of the soil. The well-mixed solution was then allowed to stand for 30 min. The supernatant was subsequently used to measure electrical conductivity (EC) with a calibrated conductivity meter (Multi 3420 Set B, WTW GmbH, Munich, Germany), following standard procedures [66]. The EC value for each sampling area was obtained by averaging the EC values of the 15 soil samples, and different degrees of salinization were determined according to the surface soil salt concentration and vegetation cover.
2.4. Deep Learning Dataset Construction
DL methods have been widely applied within the scope of RS. However, the amount of RS data is often limited. In specific applications, such as semantic segmentation, it is crucial to generate task-specific training samples [67]. The production of representative training samples is important for building a high-quality dataset [68]. However, existing open-source datasets often do not meet the task requirements for salinized soil classification based on radar images. Therefore, it is necessary to manually establish labeled datasets to fulfill these requirements [69].
In this study, a high-quality land cover and soil salinization classification dataset of the Keriya Oasis was constructed to support the training and validation of various deep learning models. During the field investigation, soil samples were collected along the edge of the roads at the oasis boundary. These field measurements were accompanied by georeferenced ground photography to establish a spatially explicit visual reference archive. In addition to the field survey data, high-resolution imagery from Ovital Map, color composites derived from different Sentinel-2 band combinations, and field photographs were used as complementary reference data. Vegetation and salinization indices were also incorporated to assist in visual interpretation. To delineate land cover categories, existing classification results from laboratory analysis were refined with support from both ground truth and reference data. Using ArcGIS® 10.6.1, the research team manually digitized the contours of different land cover types and clipped the imagery for further processing. Image patches were generated with a tile size of 128 × 128 pixels and a sampling stride of 64 pixels. The final dataset includes labeled samples for six categories: vegetation, water bodies, barren land, slightly salinized soil, moderately salinized soil, and highly salinized soil (Figure 3). The dataset statistics are presented in Table 3.
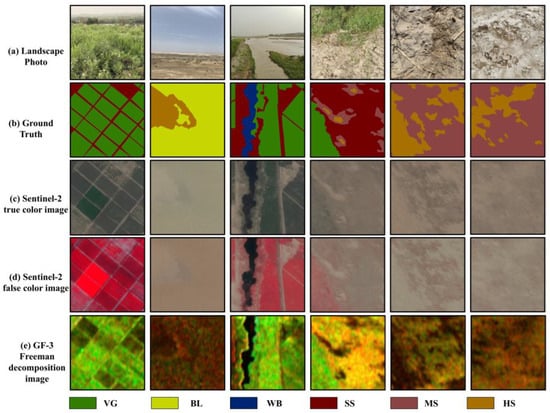
Figure 3.
Examples of some training patches of our dataset. (a) Field photographs; (b) label; (c) original image patches of Sentinel-2; (d) false-color composite image patches of Sentinel-2; (e) RGB composite images from Freeman decomposition.

Table 3.
The number of training and validation patches for deep learning.
3. Methods
The overall workflow of the research is depicted in Figure 4 and will be discussed in the subsequent sections.
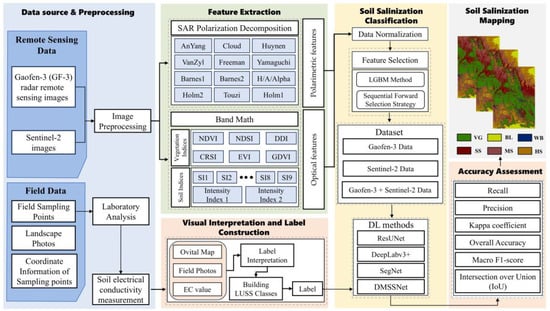
Figure 4.
The overall workflow.
3.1. Extraction of Spectral Indices
This study focuses on the classification of saline-affected soils within the study area to effectively extract soil salinization information. Spectral information derived from RS images has been extensively utilized to extract and evaluate soil salinity levels [70,71]. Certain spectral bands exhibit distinct responses to surface salt crusts [72,73], while soil salinity also influences vegetation growth, which in turn alters spectral reflectance patterns [74]. Several studies have demonstrated the use of vegetation indices derived from reflectance characteristics for assessing soil salinity [75,76]. Some vegetation indices and salinity indices have been validated as effective in detecting and characterizing soil salinization [77]. In this study, six vegetation indices and eleven salinity indices were selected as optical features for the deep-learning classification task (Table 4). These indices were chosen based on their relevance in capturing key biophysical and biochemical responses associated with salinity stress, as well as their established effectiveness in previous RS studies on soil salinity monitoring [78,79].

Table 4.
Spectral index.
3.2. Polarimetric Decomposition
Polarimetric decomposition is a key technique in PolSAR image analysis, allowing the complex scattering process to be separated into distinct components represented by corresponding scattering matrices [84]. This enables the extraction of polarization scattering characteristics and the accurate retrieval of surface physical properties, thereby improving image interpretation and classification accuracy [85]. SAR scattering mechanisms are generally categorized into three types: surface scattering, double-bounce scattering, and volume scattering [86]. Surface scattering is generally linked to smooth or barren soil; double-bounce scattering occurs in areas with vertical structures such as urban environments or tree trunks, whereas volume scattering is dominant in vegetated regions due to canopy complexity [87]. These distinct scattering behaviors, illustrated in Figure 5, reflect the interaction between SAR signals and various land surface targets. Understanding these scattering mechanisms is essential for extracting polarization-based features, improving the discrimination of salinized soils and land cover types, and enhancing the accuracy of multi-source data fusion in soil salinization and land use classification tasks.

Figure 5.
Scattering characteristics of SAR signals.
In this study, the coherence matrix T and the backscatter coefficients of the PolSAR data are calculated. To make better use of the polarization characteristics of GF-3 data, AnYang [88], Huynen [89], Vanzyl [90], Cloude [91], Freeman [92], Yamaguchi [93], Holm1 [94], Holm2 [94], Barnes1 [94], Barnes2 [94], Touzi [94], and H/A/Alpha [95] polarization decomposition methods are applied.
3.3. Feature Selection Method
Feature subset selection helps reduce the dimensionality of the data, improving algorithm efficiency while also enhancing classification accuracy by selecting the most relevant feature subset for a specific classifier from the original dataset [96,97].
In this study, multidimensional features were extracted to enhance classification performance. However, certain features may exhibit redundancy and strong correlations, which affect the efficiency and effectiveness of the classification process [83]. Additionally, despite filtering and denoising the GF-3 data, some features still retain speckle noise, which directly impacts classification results and increases processing time [97]. This paper proposes a hybrid feature selection technique by combining the LightGBM (LGBM) classifier and Sequential Forward Selection (SFS). Ref. [98], leveraging their complementary strengths. LGBM, a gradient-boosting framework, is commonly employed in feature selection because of its efficiency and excellent predictive performance [99,100]. The extracted features were divided into two independent datasets: optical indices and radar polarimetric parameters. Gradient-boosted decision tree models were constructed separately for each dataset using LGBM. Feature importance scores were calculated based on information gained and ranked to complete the initial screening. From the initial ranking, the features were ranked for further analysis. SFS was then applied to these candidates, with model performance assessed at each step. The selection process continued until the optimal subset of features was identified, resulting in a compact and highly informative feature set suitable for subsequent modeling.
This approach is based on the need to preserve the independence of optical and radar data while maximizing the complementarity of their features. Given that the model processes different inputs separately before the fusion stage, each modality must preserve its most representative features. This ensures that critical information from both data sources is retained and effectively contributes to the final fused representation. Furthermore, it also reduces the risk of one modality dominating, preventing the potential loss of valuable information from the other source.
3.4. Deep Learning Approaches for Classification
3.4.1. SegNet
SegNet is a fully convolutional deep neural network specifically designed for pixel-wise semantic segmentation [101] (Figure 6). The encoder captures multi-level features, while the decoder restores spatial resolution using the max-pooling indices from the encoder, thereby preserving boundary information and reducing detail loss. This structure makes SegNet particularly effective in RS applications, including building extraction [102], water body segmentation [103], and land use and land cover classification [104].
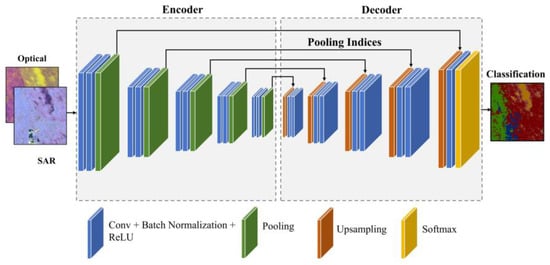
Figure 6.
SegNet network structure diagram.
3.4.2. ResUNet
UNet employs a fully convolutional network for semantic segmentation [85]. Through skip connections, it propagates low-level features to higher layers, which supports better gradient flow during training and preserves spatial details [86,87]. However, conventional convolutional models may struggle to capture complex image structures, often leading to detail loss, especially in small study areas with limited training data [105]. To address this, we adopted UNet as the base framework and employed ResNet18 as its encoder (Figure 7). The residual structure of ResNet18 alleviates vanishing gradients and enhances feature extraction, making it suitable for small-sample scenarios and preserving fine-grained information during segmentation [106].
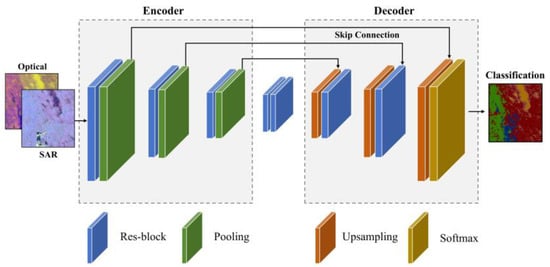
Figure 7.
ResUNet network structure diagram.
3.4.3. DeepLabv3+
DeepLabv3+ is a state-of-the-art deep learning model for semantic segmentation, integrating multi-scale feature extraction and precise boundary recovery [107]. In this study, we customize DeepLabV3+ with a ResNet18 backbone to efficiently extract hierarchical features (Figure 8). The Atrous Spatial Pyramid Pooling (ASPP) module enhances multi-scale context learning by employing 1 × 1 and 3 × 3 dilated convolutions, capturing both fine details and broad contextual information. The decoder module refines segmentation maps using a 3 × 3 convolution, followed by bilinear upsampling to restore spatial resolution. This architecture effectively balances computational efficiency with segmentation accuracy, making it well-suited for soil salinization and land use classification.
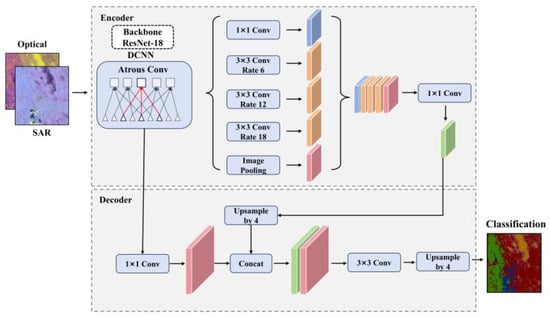
Figure 8.
Deeplabv3+ network structure diagram.
3.4.4. DMSSNet
To fully exploit and extract the physical scattering information and the spectral characteristics, while effectively integrating these two independent RS modalities, the DMSSNet network was constructed and shown in Figure 9. Most conventional attention mechanisms cannot generate high-dimensional joint representations that effectively capture both intra-modal spatial relationships and inter-modal complementary information. In this study, the DMSSNet integrated both broad contextual context and detailed features, leading to improved segmentation performance.
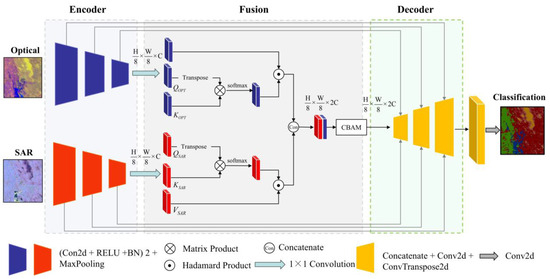
Figure 9.
DMSS network structure diagram.
The encoder of DMSSNet follows the convolutional and max-pooling downsampling strategy of the UNet architecture. Specifically, max-pooling operations are employed to reduce the spatial dimensions by half, while successive convolutional layers double the number of feature maps, thereby preserving critical spatial information while enhancing feature representations. Given the limited amount of training data and the relatively small spatial extent of the study area, a deeper network could lead to overfitting. To mitigate this risk, the encoder structure is designed with only three downsampling stages, balancing feature extraction capability with model complexity. This ensures an optimal trade-off between representational power and generalization ability in soil salinization segmentation tasks. Ultimately, this process results in two distinct encoded feature representations: ConvSAR and ConvOPT.
The fusion module in DMSSNet consists of two key components: a self-attention mechanism and a convolutional block attention module. When the feature maps enter the fusion layer, a 1 × 1 convolution is first applied to transform the optical and SAR feature representations into three corresponding feature maps, denoted as key (KSAR/OPT), query (QSAR/OPT), and value (VSAR/OPT). To capture intra-source feature dependencies, the self-attention mechanism computes the internal correlation of each data source separately. Specifically, Q is transposed and multiplied by K using matrix multiplication, allowing the network to model long-range dependencies and contextual relationships within the feature space. The resulting attention maps are activated using a softmax function to generate weight-adjusted feature maps for each modality. The self-attention weight maps SSAR/OPT for the radar and optical patches are computed as formulated in Equation (1).
where denotes matrix multiplication.
These attention-weighted feature representations are then element-wise multiplied with V, effectively enhancing important features while suppressing less relevant ones. The self-attention maps AttSAR/OPT for the radar and optical patches are computed as presented in Equation (2).
where ⊙ denotes element-wise multiplication.
Finally, the weighted optical and PolSAR feature maps are aggregated to form the fused representation. At this stage, the spatial dimensions of the fused feature map remain the same as the input, while the number of channels is doubled due to the concatenation of modality-specific representations. The joint self-attention map AttSAR/OPT for the radar and optical patches is computed as depicted in Equation (3).
This multimodal fusion approach enables a more comprehensive extraction of information from both data sources, leveraging complementary spectral and scattering characteristics to enhance segmentation performance.
After the self-attention extraction and fusion stage, the dual-modal self-attention weighted feature aggregation map obtained, denoted as AttSAR/OPT, serves as the input. The CBAM, consisting of a 1D channel attention module and a 2D spatial attention module [47], is applied, as illustrated in Figure 10. The primary function of CBAM is to refine intermediate feature representations by inferring attention weights along both the channel and spatial dimensions. Subsequently, the attention maps are adaptively integrated with feature representations to enhance discriminative learning. The channel attention mechanism assesses the significance of each channel and assigns appropriate weights. To achieve this, global average pooling aggregates spatial information, while global max pooling captures essential object-specific details. The pooled features are then simultaneously fed into a shared multi-layer perceptron (MLP) to generate refined channel-wise attention scores. These scores are then fused via element-wise summation before being applied to the feature maps. The entire process is formulated in Equation (4).
where W1 and W2 are the fully connected layers, and σ denotes the sigmoid activation function.
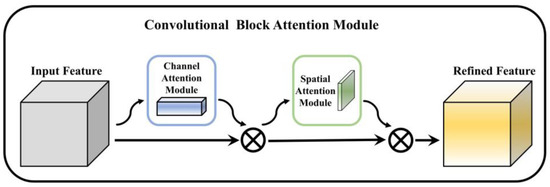
Figure 10.
CBAM module structure diagram.
The spatial attention mechanism identifies key spatial regions by analyzing the feature distribution in the spatial domain. Specifically, the average-pooled and max-pooled feature maps from the channel attention output are concatenated along the channel axis and processed through a convolutional layer to generate a spatial attention feature map. This module effectively enhances the representation of salient spatial structures while suppressing less informative regions. The entire process is shown in Equation (5).
The decoder of the DMSSNet model is designed to reconstruct high-resolution segmentation maps from the feature representations provided by the encoder and fusion stages. Adopting a UNet-inspired architecture, the decoder leverages skip connections between the encoder and decoder, allowing it to integrate fine-grained spatial details that may have been lost during the downsampling process. The decoder utilizes transposed convolutions for upsampling, which effectively recovers the spatial resolution of the input image while learning the optimal upsampling filters. This approach ensures that crucial spatial features, such as land boundaries and soil salinization gradients, are preserved and accurately reflected in the final segmentation output. The concatenation of encoder features at each decoder stage enhances the model’s ability to capture multiscale contextual information, while the final 1 × 1 convolution produces pixel-wise predictions corresponding to different soil salinization classes. This structure is particularly effective in maintaining both local texture and spatial coherence, which are essential for accurately delineating complex regions in RS imagery.
3.5. Loss Function
A weighted cross-entropy loss function is proposed in our work to handle the imbalance between salted and background pixels. Cross-entropy calculates the loss by comparing predicted and actual pixel values, with increased weight for the salted regions to reduce misclassification of salted soil as background. However, if the weight for the salted region is too high, background pixels may be misclassified as salted soil, negatively affecting the salinity extraction performance. Therefore, selecting the appropriate weight for the loss function is essential for optimal results. The cross-entropy function is calculated as
where c represents the class category, wc adjusts the global cross-entropy value, ytrue denotes the true label, and ypred is the predicted probability.
3.6. Performance Assessment
The effectiveness of the proposed networks was assessed using standard evaluation metrics, including precision, recall, Overall Accuracy (OA), kappa coefficient, mean Intersection over Union (mIoU), and Macro F1-score. For all these metrics, higher values indicate better classification performance.
Precision, corresponding to the category pixel accuracy of semantic segmentation, can be expressed as follows:
Recall is no corresponding relationship in the common indicators of semantic segmentation, and can be formulated as follows:
where TPc, FPc, and FNc denote the number of true positives, false positives, and false negatives for class c, respectively.
Overall Accuracy is widely employed to evaluate the effectiveness of classification models. It is calculated as the ratio of correctly classified samples to the total number of samples:
where N is the total number of samples in the dataset.
The Kappa coefficient (κ) measures the agreement between the predicted and actual classifications while accounting for random chance. It is defined as:
where OA is the overall accuracy, and PE (Expected Accuracy) is the probability of agreement by chance.
mIoU calculates for each category the ratio of the intersection and concatenation of the predicted segmentation results to the true segmentation results and averages the ratios across all target categories. The formula is as follows:
The Macro F1-score measures the average F1-score across all classes, giving equal weight to each class regardless of its size, and is defined as:
3.7. Training Strategy and Experimental Setting
To increase training data diversity and mitigate overfitting, data augmentation was applied to the original dataset. As shown in Table 3, the initial dataset comprised 199 labeled image patches, including 145 for training and 54 for validation. The training set was augmented using random directional translation, contrast adjustment, gamma correction, and minor geometric transformations, resulting in a total of 375 training patches. The validation set remained unchanged to ensure consistent evaluation. Model training was conducted with a batch size of 6, 100 steps per epoch, and up to 300 epochs. Early stopping was applied if the validation loss did not improve over 10 consecutive epochs. The Adam optimizer was employed with an initial learning rate of 0.0001.
Experiments were performed on a workstation with an Intel Core i9-13900 CPU (5.6 GHz) (Intel Corporation, Santa Clara, CA, USA) and an NVIDIA GeForce GTX 4060 GPU (NVIDIA Corporation, Santa Clara, CA, USA). The software environment included Python 3.11.8, PyTorch 2.3.0, CUDA 12.1, and OpenCV 4.10.0 for data preprocessing and augmentation.
4. Results
4.1. Polarimetric Features Extracted from the GF-3 Data
Firstly, the coherency matrix and backscatter coefficients were extracted. Subsequently, a series of polarimetric decomposition methods were applied to the GF-3 imagery. In total, 38 types of polarimetric features were obtained. The characteristics are summarized in Table 5, and the RGB composite image derived from polarimetric decomposition is illustrated in Figure 11.

Table 5.
Polarimetric features.
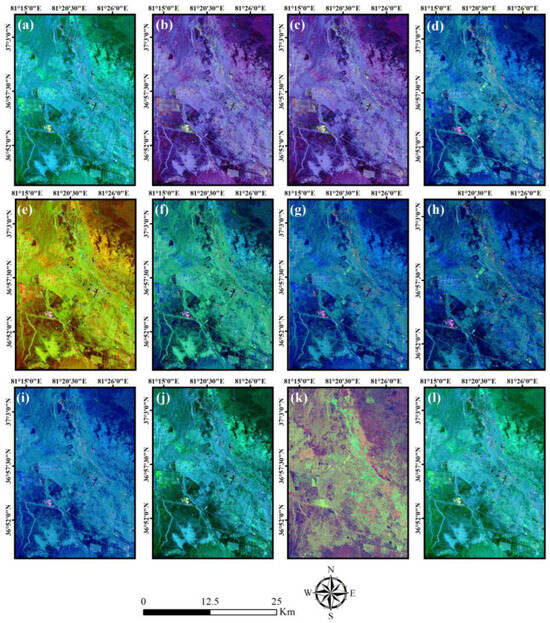
Figure 11.
The polarization decomposition results. (a) AnYang; (b) Barnes1; (c) Barnes2; (d) Cloude; (e) Freeman; (f) H/A/Alpha; (g) Holm1; (h) Holm2; (i) Huynen; (j) Van_Zyl (k) Touzi; (l) Yamaguchi decomposition methods.
4.2. Optimal Feature Selection
Before feature selection, a normalization procedure was applied to ensure consistency across different feature scales. Specifically, the Sentinel-2 and Gaofen-3 were pre-processed using a linear min-max scaling approach, which linearly transforms the raw feature values into the range of [0, 1] [65].
To enhance the robustness and generalizability of feature importance evaluation, we conducted 300 randomized experiments, each with a different random seed for data partitioning and model initialization. In each iteration, feature importance scores were calculated using the LightGBM framework. The average importance was computed to reduce the influence of stochastic variability and to ensure the stability of the selected features. As shown in Figure 12A,B, 38 SAR polarimetric features and 17 optical spectral indices were evaluated independently. Based on mean importance scores, features were ranked, and the two resulting sets were trained and evaluated separately.
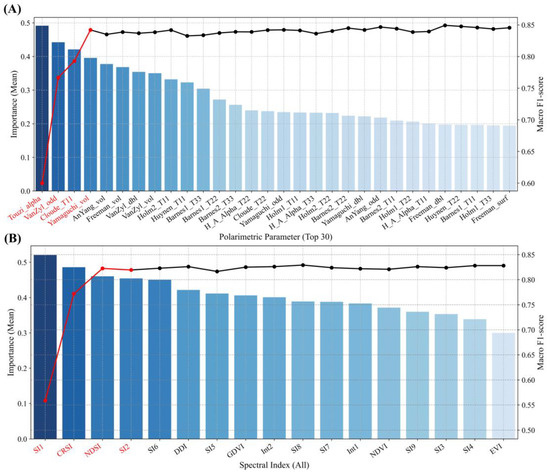
Figure 12.
Feature selection results based on LightGBM and Sequential Forward Selection. (A) and (B) display the polarimetric parameters and spectral indices, respectively, ranked by their mean importance scores across 300 randomized iterations. Bar charts represent the average feature importance (left axis), while line plots indicate the corresponding macro F1-score (right axis) at each step of feature inclusion. Features highlighted in red denote the top four selected from each modality that collectively achieved a macro F1-score greater than 0.80 and were retained for classification.
The bar chart illustrates the mean importance across 300 runs, while the black lines indicate the corresponding macro F1-score achieved during the processing of SFS. An inflection point is observed after the top four or five features, beyond which performance gains become negligible. Consequently, we selected the top four features from each dataset, with the model trained on these features achieving a macro F1-score exceeding 0.80, thus providing a suitable balance between predictive precision and model complexity. Finally, these variables, including SI1, CRSI, NDSI, SI2, Touzi_alpha, VanZyl_odd, Cloude_T11, and Yamaguchi_vol, were subsequently selected for the classification model.
4.3. Comparisons of DMSSNet Among Different Methods
This section presents a comparison between DMSSNet and three conventional semantic segmentation models: SegNet, ResUNet, and DeepLabv3+. From Table 6, DMSSNet outperformed all models regarding OA, Kappa, and class-wise metrics. Specifically, DMSSNet achieved an OA of 92.94%, surpassing ResUNet, SegNet, and DeepLabv3+ by 5.26%, 2.90%, and 11.31%, respectively. Similarly, the Kappa of DMSSNet reached 0.9077, which was 0.07, 0.0384, and 0.1507 higher than those of ResUNet, SegNet, and DeepLabV3+, respectively. DMSSNet also demonstrated superior precision and recall in distinguishing difficult categories like MS and HS soils, with precision values of 0.9375 and 0.9333, and recall values of 0.9233 and 0.8940. The enhanced performance might be attributed to its dual-branch architecture and hierarchical attention fusion strategy, which effectively integrates complementary information from optical and PolSAR modalities. These results highlight DMSSNet’s effectiveness in capturing subtle salinity differences.

Table 6.
Performance comparison of SegNet, ResUNet, DeepLabv3+, and DMSSNet models for Precision, Recall, OA, and Kappa across classes.
4.4. Comparisons of Classification Results Under Different Input Data
To comprehensively evaluate the performance of all models across various data sources (Sentinel-2, Gaofen-3, and Gaofen-3 + Sentinel-2), we conducted classification experiments using SegNet, ResUNet, DeepLabv3+, and the proposed DMSSNet. For each model, we computed the Kappa, macro F1-score, mIOU, and OA. The results are summarized in Table 7.

Table 7.
Classification accuracy of SegNet, ResUNet, Deeplabv3+, and DMSSNet models in three input scenarios.
When combining the optical indices with the radar polarimetric parameters into a fused dataset, the classification performance of all models improved remarkably. As shown in Table 7, models that utilized both Sentinel-2 and Gaofen-3 data outperformed those using only single-source inputs. Compared with using only Sentinel-2 or Gaofen-3 data, the OA of ResUNet, SegNet, DeepLabv3+, and DMSSNet increased to 90.04%, 87.68%, 81.63%, and 92.94%, respectively. This demonstrates that multi-source fusion can effectively leverage the complementary advantages.
To visually compare the classification performance of each model for salinization, a comparison was conducted. The classification results and the confusion matrices are shown in Figure 13 and Figure 14.
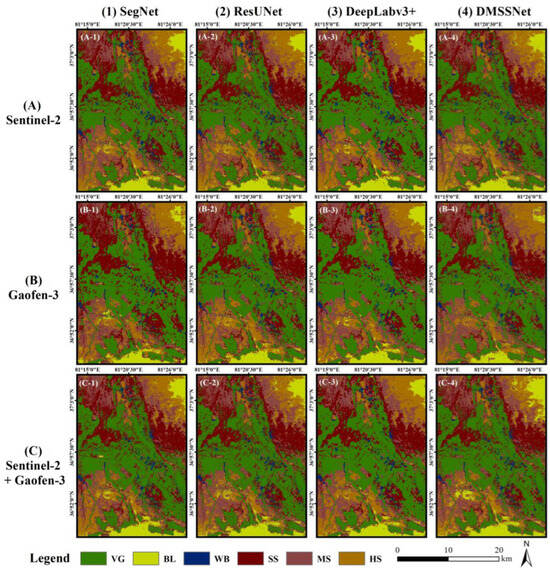
Figure 13.
Comparison of classification results using different data sources. (A–C) represent Sentinel-2 data, Gaofen-3 data and Sentinel-2 + Gaofen-3 data; (A-1–C-1) SegNet classification; (A-2–C-2) ResUNet classification; (A-3–C-3) DeepLabv3+ classification; (A-4–C-4) DMSSNet classification; VG, BL, WB, HS, SS and MS represent the vegetation, barren land, water body, heavily salinized soil, slightly salinized soil, and moderately salinized soil respectively.
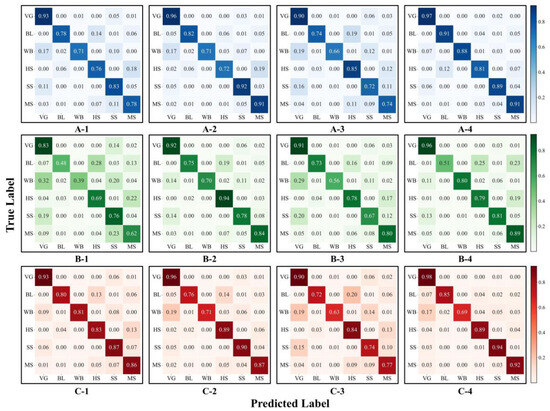
Figure 14.
Confusion matrices corresponding to classification results are shown in Figure 13. (A–C) represent Sentinel-2 data, Gaofen-3 data and Sentinel-2 + Gaofen-3 data; (A-1–C-1) SegNet classification; (A-2–C-2) ResUNet classification; (A-3–C-3) DeepLabv3+ classification; (A-4–C-4) DMSSNet classification.
As illustrated in Figure 13, the classification results varied noticeably depending on the input data. When only Sentinel-2 data was used (Figure 13A), SegNet and DeepLabv3+ generated relatively coarse segmentation, particularly at the boundaries between vegetated and salinized areas. SegNet yielded fragmented classification outputs, while DeepLabv3+ exhibited discontinuous mapping in regions with moderate and heavy salinization. ResUNet demonstrated improved boundary delineation and inter-class separation, yet was still prone to noise in smaller patches. In contrast, DMSSNet delivered more refined and continuous segmentation results with clearer class boundaries and reduced noise, particularly in heterogeneous landscapes. Figure 14(A-1–A-4) further shows that both ResUNet and DMSSNet performed well in overall salinization classification, with DeepLabv3+ excelling in the detection of heavily salinized (HS) soils. Notably, DMSSNet outperformed the other models in accurately identifying vegetation (VG), bare land (BL), and water bodies (WB). When only Gaofen-3 data were used (Figure 13B), classification accuracy declined across all models. SegNet’s performance in detecting BL and WB decreased substantially; ResUNet was most effective in identifying HS soils, while DMSSNet achieved superior results for moderately and slightly salinized (MS and SS) soils. SegNet and DeepLabv3+ struggled in distinguishing different salinity levels, whereas ResUNet improved the discrimination of BL and WB categories. The highest performance was observed with the multi-modal input (Figure 13C), where the fusion of spectral and radar data improved the performance of all models. DMSSNet demonstrated the most noticeable improvement, achieving nearly 90% accuracy across all salinization classes, reducing salt-and-pepper noise, and yielding more precise delineation of small and irregular regions. These results confirm the effectiveness of DMSSNet in integrating multi-source information and enhancing soil salinization classification.
4.5. Model Complexity and Inference Time Comparison
To assess the practical deployment potential of the studied models, we conducted a representative comparison of model complexity, computational efficiency, and segmentation performance. Table 8 reports the number of trainable parameters, FLOPs, model size in megabytes (MB), average inference time per image patch, and the corresponding mIoU. These metrics collectively evaluate model efficiency and deployment cost from multiple perspectives. All models were evaluated using the same input image size of 128 × 128 pixels.

Table 8.
Efficiency analysis of each method.
Among the tested models, SegNet has the largest memory usage of 117.75 MB and 29.40 M parameters, achieving a mIoU of 72.10% but with a relatively high computational cost and an inference time of 31.36 ms. ResUNet offers the fastest inference at 19.90 ms and a compact size of 57.33 MB, suitable for real-time and low-power applications. Although DeepLabv3+ has the fewest parameters of 3.91 M, its complex ASPP module results in the highest FLOPs and an inference time of 37.33 ms. Our proposed DMSSNet combines a dual-branch encoder with attention-based fusion and achieves superior accuracy with a mean IoU of 79.12%. It has moderate complexity with 42.25 GFLOPs, a lightweight model size of 46.39 MB, and an inference time of 31.16 ms, which is comparable to SegNet.
4.6. Ablation Experiment
To assess the contribution of DMSSNet’s dual-branch encoder and the fusion strategy integrating self-attention and CBAM, two ablation experiments were performed. First, the dual-branch architecture was compared to a single-branch variant that processes all input modalities jointly, thereby evaluating the effect of separating modality-specific features on representation quality and segmentation performance. Second, three fusion strategies—self-attention only, CBAM only, and the combination of both—were systematically tested on both architectural variants under the same training conditions. This approach enables a detailed analysis of the individual and synergistic contributions of the attention mechanisms.
All ablation models were trained under identical hyperparameter settings, loss functions, and datasets to ensure fair comparison. Segmentation performance was evaluated using quantitative metrics, including overall accuracy (OA) and class-specific accuracies for slightly salinized (SS), moderately salinized (MS), and heavily salinized (HS) soils. The results, presented in Table 9, highlight the relative influence of architectural design and attention modules on DMSSNet’s performance.

Table 9.
The comparison of the different encoder and fusion strategies.
The results clearly demonstrate that the dual-branch encoder consistently achieves higher accuracies for SS, MS, and HS as well as OA across all fusion strategies. Specifically, the dual-branch encoder structure improves SS accuracy by approximately 2.30–3.57%, MS accuracy by 0.62–4.51%, HS accuracy by 3.36–5.92%, and OA by 1.46–2.25% when compared to the single-branch design. These findings highlight the advantage of separately extracting modality-specific features prior to feature fusion. The dual-branch structure more effectively preserves distinct spectral and backscattering information, thereby enhancing segmentation performance across all salinization categories.
Additionally, an analysis of Table 9 indicates that self-attention and the convolutional block attention model (CBAM) serve complementary roles. The combination of self-attention’s global context modeling with CBAM’s spatial-channel recalibration enables the network to effectively emphasize subtle indicators of salinity within both optical and PolSAR feature spaces. In the one-branch architecture, the joint use of both attention mechanisms attains the highest segmentation accuracy (SA) of 90.69%, representing improvements of 0.69% and 0.66% over the use of self-attention and CBAM alone, respectively. While CBAM alone increases MS soil accuracy by 1.79% compared to self-attention, its performance on HS soils is comparatively lower. In the dual-branch configuration, integrating both attention mechanisms yields a maximum mean segmentation accuracy (MSA) of 93.49%, representing gains of 1.99% and 2.41% over using self-attention and CBAM individually. The accuracies for all salinized soil types consistently remain around 93%, exceeding the OA, which further highlights the effectiveness of dual-branch encoding with hybrid attention fusion in recognizing and distinguishing varying degrees of soil salinization.
5. Discussion
5.1. Structural Advantages of DMSSNet
The DMSSNet adopts a dual-branch architecture, in which optical and PolSAR data are independently encoded through two parallel pathways, enabling the network to fully exploit the complementary information from spectral and polarimetric domains. Through a hybrid attention-guided fusion mechanism, DMSSNet effectively enhances inter-modal synergy and achieves superior classification performance. As presented in Table 7 and Figure 14, the dual-branch strategy empowers DMSSNet to learn discriminative features from both modalities, yielding improved results over classical models, including ResUNet, SegNet, and DeepLabv3+. Specifically, on the combined Gaofen-3 and Sentinel-2 datasets, DMSSNet achieved a mIoU of 79.12% and an OA of 92.94%. These results demonstrate the effectiveness of the dual-input and attention-based fusion design.
In DMSSNet, the fusion of multi-source features might contribute to improved performance through both shallow and deep levels of attention-based interaction. At the intra-modal level, self-attention mechanisms are employed within each encoder branch, which could capture long-range contextual dependencies and promote semantic consistency. At the cross-modal level, the CBAM adaptively integrates spatial and channel-wise information, potentially enabling more accurate feature alignment and saliency enhancement. In addition, the incorporation of polarization decomposition parameters provides structural and scattering information, particularly in barren and salinized areas. Meanwhile, spectral indices could serve as important indicators of vegetation health and surface salinity. The complementary properties of multi-source data may explain the model’s enhanced capability to distinguish different degrees of soil salinization. Overall, the attention-guided fusion appears to offer a promising approach for improving classification performance in complex oasis environments.
5.2. Comparative Analysis of Classification Results from Different Inputs
As illustrated in Figure 13 and Figure 14 and Table 9, the combination of Sentinel-2 and GF-3 data yields better soil salinization classification than either single-source input, which is consistent with the findings of our previous research [23,65]. Multispectral data provide rich spectral information, particularly effective for identifying vegetation and salinized areas through spectral indices. However, they exhibit limitations in capturing subsurface and structural characteristics of saline soils, particularly under dense vegetation or surface crusting. In contrast, GF-3 full-polarimetric SAR data offer valuable scattering information related to surface roughness, soil moisture, and structural variations via polarimetric decomposition features, thereby improving the discrimination of different saline soil types, particularly in barren or sparsely vegetated regions. Nevertheless, PolSAR-only inputs are less effective in differentiating vegetation types or detecting subtle spectral variations, partly due to speckle noise and geometric distortions inherent in radar imaging. By integrating both data, the dual-branch architecture and hierarchical fusion module of DMSSNet effectively capture intra- and cross-modal dependencies, leading to appropriate improvements in classification accuracy.
5.3. Spatial Distribution Characteristics of Soil Salinization in Keriya Oasis
The spatial distribution, severity, and extent of soil salinization exhibit marked regional differences. Based on Figure 13 and Figure 14, HS, MS, and SS soils coexist with non-saline land, displaying a patchy and heterogeneous spatial pattern. Salinized soils are mainly distributed in the northeastern areas and along the ecotone between the oasis and the desert. This special pattern may result from the tendency of dissolved salts transported downstream from the upper Keriya River to accumulate in northern regions. Additionally, the local topography promotes northward groundwater movement, leading to a rising water table in the northern low-lying areas, which contributes to increased soil salinity.
The water-salt dynamics further contribute to this pattern [108]. The limited precipitation and high evapotranspiration rates suppress the leaching of salts into deeper soil layers, allowing for salt accumulation near the surface. When the groundwater table rises, capillary action facilitates upward salt transport, leading to surface crystallization driven by strong evaporation [109]. Since salt migration is closely linked to water movement, soil salinity distribution is highly sensitive to changes in water content and flow. Additionally, influenced by topography, salts from higher elevations tend to accumulate in lower-lying areas via runoff and subsurface flow [25]. The south-to-north gradient in elevation within the Keriya Oasis may thus contribute to the higher salinity observed in the north.
5.4. Limitations and Prospects
Despite the promising performance of DMSSNet in multi-source semantic segmentation for soil salinization mapping, several limitations remain. The quality and alignment of multi-modal inputs are critical factors influencing model performance. Specifically, optical imagery is susceptible to cloud cover [110] and seasonal phenological variations [111], while radar data, though weather-independent, can suffer from speckle noise [112] and geometric distortions [113]. Although the fusion module enhances the robustness of cross-modal representation learning, its effectiveness is limited in scenarios involving severely misaligned inputs or degraded data quality. Recent advances have proposed more sophisticated network designs and geometric correction techniques aimed at mitigating large-scale deformation in PolSAR images [114,115], and at suppressing the impact of speckle noise in segmentation tasks [116,117].
While the dual-branch structure enables modality-specific feature extraction, the current fusion strategy may insufficiently address feature redundancy or capture the most informative inter-modality interactions, particularly under imbalanced modality conditions. Future enhancements could incorporate cross-modal gating mechanisms [118,119] or contrastive learning approaches [120,121] to adaptively regulate the importance of each modality and suppress noisy or redundant features. Furthermore, the interpretability of attention maps in the fusion stage is limited, particularly in complex terrains or salinity transition zones. Incorporating Explainable AI (XAI) techniques could improve transparency and reveal how modality-specific cues are utilized, thereby enhancing model trustworthiness in real-world practical applications [122,123].
Additionally, ground truth labels generated from field surveys and expert interpretation may introduce subjectivity, especially in distinguishing salinity levels, potentially affecting classification accuracy. The absence of publicly available annotated datasets for soil salinization further constrains model scalability and reproducibility. Future research could explore semi-supervised learning [124], unsupervised clustering [125], or self-supervised pretraining approaches [126] to reduce dependence on manual labeling and enhance generalization across regions. Moreover, the DMSSNet was trained and tested in the Keriya Oasis, a representative arid region with complex salinization patterns. However, salinization manifestations may differ significantly across ecosystems (e.g., coastal wetlands [127,128], sea surface [129,130]), and the DMSSNet may not generalize well to diverse geographical contexts. Future studies could consider establishing study areas and sampling points on a global scale to investigate the model’s adaptability under diverse geographic and climatic conditions [76,131].
5.5. Model Efficiency and Deployment Suitability
Considering practical deployment scenarios, especially on embedded systems or mobile platforms with limited computational capabilities, it is crucial to evaluate not only model accuracy but also computational efficiency. As summarized in Table 8, ResUNet stands out with the smallest model size, the lowest parameter, and the fastest inference speed, which make it highly suitable for real-time applications and resource-constrained environments where low latency and energy efficiency are critical.
However, ResUNet sacrifices a portion of segmentation accuracy compared to DMSSNet. The proposed DMSSNet, with a model size of approximately 46 MB and an inference time of around 31 ms, achieves the highest mIoU of 79.12% among all models, demonstrating its effectiveness in multi-source data environments. In contrast, SegNet and DeepLabv3+ have larger models or higher computation costs with lower or similar accuracy, making them less favorable for edge deployment.
From a deployment perspective, ResUNet is the most suitable candidate for lightweight and low-power devices. However, in scenarios that prioritize segmentation precision and can accommodate moderate computational overhead, such as agricultural monitoring stations or edge-based field servers, DMSSNet offers a compelling trade-off between accuracy and efficiency, making it a viable solution for real-world multi-source RS applications.
6. Conclusions
This study proposes a dual-branch, multi-modal semantic segmentation network, Dual-Modal Deep Learning Network for Soil Salinization (DMSSNet), tailored for Soil Salinization Mapping in the Keriya Oasis. DMSSNet integrates Sentinel-2 multispectral and GF-3 full-polarimetric SAR data via parallel encoder branches, each dedicated to extracting complementary features from optical and radar modalities. The incorporation of both self-attention and CBAM within a hierarchical fusion framework enables the model to effectively capture intra- and cross-modal dependencies, thereby enhancing spatial feature representation.
The polarimetric decomposition features and spectral indices are jointly exploited to characterize diverse land surface conditions. Experimental results in the Keriya Oasis indicate that DMSSNet achieves superior performance, attaining the highest overall accuracy (OA), mean Intersection over Union (mIoU), and macro F1-score compared to conventional models such as ResUNet, SegNet, and DeepLabv3+. The integration of attention-guided fusion with multi-source remote sensing data, encompassing both optical and radar modalities, improves classification performance, particularly in complex and heterogeneous landscapes exhibiting varying degrees of soil salinization. This research demonstrates the effectiveness of multi-modal deep learning frameworks for land degradation monitoring and provides a promising technical reference for future applications in ecological management, environmental monitoring, sustainable agriculture, and agricultural production.
Author Contributions
Conceptualization, I.N.; Methodology, Y.X.; Software, I.N. and Y.X.; Validation, I.N. and Y.X.; Formal analysis, I.N.; Investigation, A.A., Y.Q. and Y.A.; Resources, I.N.; Data Curation, I.N. and Y.X.; Writing—Original Draft Preparation, I.N. and Y.X.; Writing—Review and Editing, I.N., Y.X. and A.A.; Visualization, Y.X., H.T. and L.L.; Supervision, I.N.; Project Administration, I.N.; Funding Acquisition, I.N. All authors have read and agreed to the published version of the manuscript.
Funding
This research was funded by the Natural Science Foundation of Xinjiang Uygur Autonomous Region, China (No. 2024D01C34), the Third Xinjiang Comprehensive Scientific Expedition (No. 2022xjkk0301), the National Natural Science Foundation of China (No. 42061065, No. 32160319), and 2024 National Undergraduates Training Program for Innovation of Xinjiang University (No. 202410755011).
Data Availability Statement
The datasets are available from the corresponding author upon reasonable request.
Acknowledgments
The authors extend their heartfelt gratitude to all contributors whose insightful suggestions played a pivotal role in enhancing the quality of this scholarly work.
Conflicts of Interest
The authors declare no conflicts of interest.
References
- Metternicht, G.I.; Zinck, J. Remote sensing of soil salinity: Potentials and constraints. Remote Sens. Environ. 2003, 85, 1–20. [Google Scholar] [CrossRef]
- Sahbeni, G.; Ngabire, M.; Musyimi, P.K.; Székely, B. Challenges and Opportunities in Remote Sensing for Soil Salinization Mapping and Monitoring: A Review. Remote Sens. 2023, 15, 2540. [Google Scholar] [CrossRef]
- Tarolli, P.; Luo, J.; Park, E.; Barcaccia, G.; Masin, R. Soil salinization in agriculture: Mitigation and adaptation strategies combining nature-based solutions and bioengineering. iScience 2024, 27, 108830. [Google Scholar] [CrossRef] [PubMed]
- Ghassemi, F.; Jakeman, A.J.; Nix, H.A. Salinisation of Land and Water Resources: Human Causes, Extent, Management and Case Studies; CAB International: Wallingford, UK, 1995. [Google Scholar]
- Hassani, A.; Azapagic, A.; Shokri, N. Global predictions of primary soil salinization under changing climate in the 21st century. Nat. Commun. 2021, 12, 6663. [Google Scholar] [CrossRef]
- Li, J.; Pu, L.; Han, M.; Zhu, M.; Zhang, R.; Xiang, Y. Soil salinization research in China: Advances and prospects. J. Geogr. Sci. 2014, 24, 943–960. [Google Scholar] [CrossRef]
- Sun, G.; Qu, Z.; Du, B.; Ren, Z.; Liu, A. Water-heat-salt effects of mulched drip irrigation maize with different irrigation scheduling in Hetao Irrigation District. Trans. Chin. Soc. Agric. Eng. (Trans. CSAE) 2017, 33, 144–152. [Google Scholar] [CrossRef]
- Zhang, W.-T.; Wu, H.-Q.; Gu, H.-B.; Feng, G.-L.; Wang, Z.; Sheng, J.-D. Variability of Soil Salinity at Multiple Spatio-Temporal Scales and the Related Driving Factors in the Oasis Areas of Xinjiang, China. Pedosphere 2014, 24, 753–762. [Google Scholar] [CrossRef]
- Peng, J.; Biswas, A.; Jiang, Q.; Zhao, R.; Hu, J.; Hu, B.; Shi, Z. Estimating soil salinity from remote sensing and terrain data in southern Xinjiang Province, China. Geoderma 2019, 337, 1309–1319. [Google Scholar] [CrossRef]
- Rezaei, M.; Mousavi, S.R.; Rahmani, A.; Zeraatpisheh, M.; Rahmati, M.; Pakparvar, M.; Jahandideh Mahjenabadi, V.A.; Seuntjens, P.; Cornelis, W. Incorporating machine learning models and remote sensing to assess the spatial distribution of saturated hydraulic conductivity in a light-textured soil. Comput. Electron. Agric. 2023, 209, 107821. [Google Scholar] [CrossRef]
- Allbed, A.; Kumar, L. Soil salinity mapping and monitoring in arid and semi-arid regions using remote sensing technology: A review. Adv. Remote Sens. 2013, 2, 373–385. [Google Scholar] [CrossRef]
- Tian, C.; Mai, W.; Zhao, Z. Study on key technologies of ecological management of saline alkali land in arid area of Xinjiang. Acta Ecol. Sin. 2016, 36, 7064–7068. [Google Scholar]
- Guo, B.; Zang, W.; Zhang, R. Soil Salizanation Information in the Yellow River Delta Based on Feature Surface Models Using Landsat 8 OLI Data. IEEE Access 2020, 8, 94394–94403. [Google Scholar] [CrossRef]
- Qi, Z.; Yeh, A.G.-O.; Li, X.; Lin, Z. A novel algorithm for land use and land cover classification using RADARSAT-2 polarimetric SAR data. Remote Sens. Environ. 2012, 118, 21–39. [Google Scholar] [CrossRef]
- Periasamy, S.; Ravi, K.P. A novel approach to quantify soil salinity by simulating the dielectric loss of SAR in three-dimensional density space. Remote Sens. Environ. 2020, 251, 112059. [Google Scholar] [CrossRef]
- Rhoades, J.; Chanduvi, F.; Lesch, S. Soil Salinity Assessment: Methods and Interpretation of Electrical Conductivity Measurements; The Food and Agriculture Organization: Rome, Italy, 1999. [Google Scholar]
- Bell, D.; Menges, C.; Ahmad, W.; van Zyl, J.J. The Application of Dielectric Retrieval Algorithms for Mapping Soil Salinity in a Tropical Coastal Environment Using Airborne Polarimetric SAR. Remote Sens. Environ. 2001, 75, 375–384. [Google Scholar] [CrossRef]
- Lasne, Y.; Paillou, P.; Ruffle, G.; Serradilla, C.; Demontoux, F.; Freeman, A.; Farr, T.; McDonald, K.; Chapman, B.; Malezieux, J.M. Effect of salinity on the dielectric properties of geological materials: Implication for soil moisture detection by means of remote sensing. In Proceedings of the 2007 IEEE International Geoscience and Remote Sensing Symposium, Barcelona, Spain, 23–28 July 2007; pp. 3689–3693. [Google Scholar]
- Grissa, M.; Abdelfattah, R.; Mercier, G.; Zribi, M.; Chahbi, A.; Lili-Chabaane, Z. Empirical model for soil salinity mapping from SAR data. In Proceedings of the 2011 IEEE International Geoscience and Remote Sensing Symposium, Vancouver, BC, Canada, 24–29 July 2011; pp. 1099–1102. [Google Scholar]
- Taghadosi, M.M.; Hasanlou, M.; Eftekhari, K. Soil salinity mapping using dual-polarized SAR Sentinel-1 imagery. Int. J. Remote Sens. 2019, 40, 237–252. [Google Scholar] [CrossRef]
- Shi, H.; Zhao, L.; Yang, J.; Lopez-Sanchez, J.M.; Zhao, J.; Sun, W.; Shi, L.; Li, P. Soil moisture retrieval over agricultural fields from L-band multi-incidence and multitemporal PolSAR observations using polarimetric decomposition techniques. Remote Sens. Environ. 2021, 261, 112485. [Google Scholar] [CrossRef]
- Van Zyl, J.J. Synthetic Aperture Radar Polarimetry; John Wiley & Sons: New York, NY, USA, 2011. [Google Scholar]
- Nurmemet, I.; Sagan, V.; Ding, J.-L.; Halik, Ü.; Abliz, A.; Yakup, Z. A WFS-SVM model for soil salinity mapping in Keriya Oasis, Northwestern China using polarimetric decomposition and fully PolSAR data. Remote Sens. 2018, 10, 598. [Google Scholar] [CrossRef]
- Boerner, W.-M. Recent advances in extra-wide-band polarimetry, interferometry and polarimetric interferometry in synthetic aperture remote sensing and its applications. IEE Proc. Radar Sonar Navig. 2003, 150, 113–124. [Google Scholar] [CrossRef]
- Ding, J.; Yao, Y.; Wang, F. Detecting soil salinization in arid regions using spectral feature space derived from remote sensing data. Acta Ecol. Sin. 2014, 34, 4620–4631. [Google Scholar] [CrossRef][Green Version]
- Touzi, R. Target scattering decomposition in terms of roll-invariant target parameters. IEEE Trans. Geosci. Remote Sens. 2006, 45, 73–84. [Google Scholar] [CrossRef]
- Hoekman, D.H.; Quiñones, M.J. Land cover type and biomass classification using AirSAR data for evaluation of monitoring scenarios in the Colombian Amazon. IEEE Trans. Geosci. Remote Sens. 2000, 38, 685–696. [Google Scholar] [CrossRef]
- Schuler, D.; Lee, J.-S. Mapping ocean surface features using biogenic slick-fields and SAR polarimetric decomposition techniques. IEE Proc. Radar Sonar Navig. 2006, 153, 260–270. [Google Scholar] [CrossRef]
- Gama, F.F.; Dos Santos, J.R.; Mura, J.C. Eucalyptus biomass and volume estimation using interferometric and polarimetric SAR data. Remote Sens. 2010, 2, 939–956. [Google Scholar] [CrossRef]
- Souyris, J.-C.; Henry, C.; Adragna, F. On the use of complex SAR image spectral analysis for target detection: Assessment of polarimetry. IEEE Trans. Geosci. Remote Sens. 2003, 41, 2725–2734. [Google Scholar] [CrossRef]
- Ling, L.; Peikang, H.; Xiaohu, W.; Xudong, P. Image edge detection based on beamlet transform. J. Syst. Eng. Electron. 2009, 20, 1–5. [Google Scholar]
- Cui, Y.; Yang, J.; Zhang, X. New CFAR target detector for SAR images based on kernel density estimation and mean square error distance. J. Syst. Eng. Electron. 2012, 23, 40–46. [Google Scholar] [CrossRef]
- Lee, J.-S.; Grunes, M.R.; Ainsworth, T.L.; Du, L.-J.; Schuler, D.L.; Cloude, S.R. Unsupervised classification using polarimetric decomposition and the complex Wishart classifier. IEEE Trans. Geosci. Remote Sens. 1999, 37, 2249–2258. [Google Scholar] [CrossRef]
- Ersahin, K.; Cumming, I.G.; Ward, R.K. Segmentation and classification of polarimetric SAR data using spectral graph partitioning. IEEE Trans. Geosci. Remote Sens. 2009, 48, 164–174. [Google Scholar] [CrossRef]
- Chu, H.; Guisong, X.; Hong, S. SAR images classification method based on Dempster-Shafer theory and kernel estimate. J. Syst. Eng. Electron. 2007, 18, 210–216. [Google Scholar] [CrossRef]
- Lu, D.; Weng, Q. A survey of image classification methods and techniques for improving classification performance. Int. J. Remote Sens. 2007, 28, 823–870. [Google Scholar] [CrossRef]
- Cloude, S.R.; Pottier, E. An entropy based classification scheme for land applications of polarimetric SAR. IEEE Trans. Geosci. Remote Sens. 1997, 35, 68–78. [Google Scholar] [CrossRef]
- Liu, F.; Jiao, L.; Tang, X. Task-Oriented GAN for PolSAR Image Classification and Clustering. IEEE Trans. Neural Netw. Learn. Syst. 2019, 30, 2707–2719. [Google Scholar] [CrossRef]
- Wang, L.; Xu, X.; Dong, H.; Gui, R.; Pu, F. Multi-pixel simultaneous classification of PolSAR image using convolutional neural networks. Sensors 2018, 18, 769. [Google Scholar] [CrossRef]
- Shang, R.; Wang, J.; Jiao, L.; Yang, X.; Li, Y. Spatial feature-based convolutional neural network for PolSAR image classification. Appl. Soft Comput. 2022, 123, 108922. [Google Scholar] [CrossRef]
- Liu, C.; Sun, Y.; Xu, Y.; Sun, Z.; Zhang, X.; Lei, L.; Kuang, G. A review of optical and SAR image deep feature fusion in semantic segmentation. IEEE J. Sel. Top. Appl. Earth Obs. Remote Sens. 2024, 17, 12910–12930. [Google Scholar] [CrossRef]
- Wang, N.; Jin, W.; Bi, H.; Xu, C.; Gao, J. A Survey on Deep Learning for Few-Shot PolSAR Image Classification. Remote Sens. 2024, 16, 4632. [Google Scholar] [CrossRef]
- Liu, X.; Zou, H.; Wang, S.; Lin, Y.; Zuo, X. Joint Network Combining Dual-Attention Fusion Modality and Two Specific Modalities for Land Cover Classification Using Optical and SAR Images. IEEE J. Sel. Top. Appl. Earth Obs. Remote Sens. 2024, 17, 3236–3250. [Google Scholar] [CrossRef]
- Zhou, W.; Yuan, J.; Lei, J.; Luo, T. TSNet: Three-Stream Self-Attention Network for RGB-D Indoor Semantic Segmentation. IEEE Intell. Syst. 2021, 36, 73–78. [Google Scholar] [CrossRef]
- Zhao, Q.; Liu, J.; Li, Y.; Zhang, H. Semantic Segmentation With Attention Mechanism for Remote Sensing Images. IEEE Trans. Geosci. Remote Sens. 2022, 60, 1–13. [Google Scholar] [CrossRef]
- Hu, J.; Shen, L.; Sun, G. Squeeze-and-Excitation Networks. In Proceedings of the 2018 IEEE/CVF Conference on Computer Vision and Pattern Recognition, Salt Lake City, UT, USA, 18–23 June 2018; pp. 7132–7141. [Google Scholar]
- Woo, S.; Park, J.; Lee, J.-Y.; Kweon, I.S. Cbam: Convolutional block attention module. In Computer Vision—ECCV 2018; Springer: Cham, Switzerland, 2018; pp. 3–19. [Google Scholar]
- Guo, M.-H.; Xu, T.-X.; Liu, J.-J.; Liu, Z.-N.; Jiang, P.-T.; Mu, T.-J.; Zhang, S.-H.; Martin, R.R.; Cheng, M.-M.; Hu, S.-M. Attention mechanisms in computer vision: A survey. Comput. Vis. Media 2022, 8, 331–368. [Google Scholar] [CrossRef]
- Hassanin, M.; Anwar, S.; Radwan, I.; Khan, F.S.; Mian, A. Visual attention methods in deep learning: An in-depth survey. Inf. Fusion. 2024, 108, 102417. [Google Scholar] [CrossRef]
- Ghaffarian, S.; Valente, J.; van der Voort, M.; Tekinerdogan, B. Effect of Attention Mechanism in Deep Learning-Based Remote Sensing Image Processing: A Systematic Literature Review. Remote Sens. 2021, 13, 2965. [Google Scholar] [CrossRef]
- Gao, G.; Wang, M.; Zhang, X.; Li, G. DEN: A New Method for SAR and Optical Image Fusion and Intelligent Classification. IEEE Trans. Geosci. Remote Sens. 2025, 63, 1–18. [Google Scholar] [CrossRef]
- Yu, K.; Wang, F. A Dual Attention Fusion Network for SAR-Optical Land Use Classification Based on Semantic Balance. In Proceedings of the 2024 7th International Conference on Pattern Recognition and Artificial Intelligence (PRAI), Hangzhou, China, 15–17 August 2024; pp. 707–712. [Google Scholar]
- Meng, W.; Shan, L.; Ma, S.; Liu, D.; Hu, B. DLNet: A Dual-Level Network with Self- and Cross-Attention for High-Resolution Remote Sensing Segmentation. Remote Sens. 2025, 17, 1119. [Google Scholar] [CrossRef]
- Li, X.; Zhang, G.; Cui, H.; Hou, S.; Wang, S.; Li, X.; Chen, Y.; Li, Z.; Zhang, L. MCANet: A joint semantic segmentation framework of optical and SAR images for land use classification. IJAEO 2022, 106, 102638. [Google Scholar] [CrossRef]
- Yang, Y.; Zheng, S.; Wang, X.; Ao, W.; Liu, Z. AMMUNet: Multi-Scale Attention Map Merging for Remote Sensing Image Segmentation. IEEE Geosci. Remote Sens. Lett. 2024, 22, 6000705. [Google Scholar] [CrossRef]
- Li, C.; Wang, R.; Yang, X.; Chu, D. RSRWKV: A Linear-Complexity 2D Attention Mechanism for Efficient Remote Sensing Vision Task. arXiv 2025, arXiv:2503.20382. [Google Scholar] [CrossRef]
- Nurmemet, I.; Aihaiti, A.; Aili, Y.; Lv, X.; Li, S.; Qin, Y. Quantitative Retrieval of Soil Salinity in Arid Regions: A Radar Feature Space Approach with Fully Polarimetric SAR Data. Sensors. 2025, 25, 2512. [Google Scholar] [CrossRef]
- Ghulam, A.; Qin, Q.; Zhu, L.; Abdrahman, P. Satellite remote sensing of groundwater: Quantitative modelling and uncertainty reduction using 6S atmospheric simulations. Int. J. Remote Sens. 2004, 25, 5509–5524. [Google Scholar] [CrossRef]
- Mamat, Z.; Yimit, H.; Lv, Y. Spatial distributing pattern of salinized soils and their salinity in typical area of Yutian Oasis. J. Soil. Sci. 2013, 44, 1314–1320. [Google Scholar]
- Yakup, Z.; Sawut, M.; Abdujappar, A.; Dong, Z. Soil salinity inversion in Yutian Oasis based on PALSAR radar data. Resour. Sci. 2018, 40, 2110–2117. [Google Scholar] [CrossRef]
- Sun, J.; Yu, W.; Deng, Y. The SAR payload design and performance for the GF-3 mission. Sensors 2017, 17, 2419. [Google Scholar] [CrossRef]
- Wang, H.; Yang, J.; Mouche, A.; Shao, W.; Zhu, J.; Ren, L.; Xie, C. GF-3 SAR Ocean Wind Retrieval: The First View and Preliminary Assessment. Remote Sens. 2017, 9, 694. [Google Scholar] [CrossRef]
- Ren, B.; Ma, S.; Hou, B.; Hong, D.; Chanussot, J.; Wang, J.; Jiao, L. A dual-stream high resolution network: Deep fusion of GF-2 and GF-3 data for land cover classification. IJAEO 2022, 112, 102896. [Google Scholar] [CrossRef]
- Liang, R.; Dai, K.; Xu, Q.; Pirasteh, S.; Li, Z.; Li, T.; Wen, N.; Deng, J.; Fan, X. Utilizing a single-temporal full polarimetric Gaofen-3 SAR image to map coseismic landslide inventory following the 2017 Mw 7.0 Jiuzhaigou earthquake (China). IJAEO 2024, 127, 103657. [Google Scholar] [CrossRef]
- Xiang, Y.; Nurmemet, I.; Lv, X.; Yu, X.; Gu, A.; Aihaiti, A.; Li, S. Multi-Source Attention U-Net: A Novel Deep Learning Framework for the Land Use and Soil Salinization Classification of Keriya Oasis in China with RADARSAT-2 and Landsat-8 Data. Land 2025, 14, 649. [Google Scholar] [CrossRef]
- Abulaiti, A.; Nurmemet, I.; Muhetaer, N.; Xiao, S.; Zhao, J. Monitoring of Soil Salinization in the Keriya Oasis Based on Deep Learning with PALSAR-2 and Landsat-8 Datasets. Sustainability 2022, 14, 2666. [Google Scholar] [CrossRef]
- Triki Fourati, H.; Bouaziz, M.; Benzina, M.; Bouaziz, S. Modeling of soil salinity within a semi-arid region using spectral analysis. Arab. J. Geosci. 2015, 8, 11175–11182. [Google Scholar] [CrossRef]
- Alavipanah, S.K.; Damavandi, A.A.; Mirzaei, S.; Rezaei, A.; Hamzeh, S.; Matinfar, H.R.; Teimouri, H.; Javadzarrin, I. Remote sensing application in evaluation of soil characteristics in desert areas. Nat. Environ. Changes 2016, 2, 1–24. [Google Scholar]
- Douaoui, A.E.K.; Nicolas, H.; Walter, C. Detecting salinity hazards within a semiarid context by means of combining soil and remote-sensing data. Geoderma 2006, 134, 217–230. [Google Scholar] [CrossRef]
- Liu, Y.; Wu, J.; Huang, T.; Nie, W.; Jia, Z.; Gu, Y.; Ma, X. Study on the relationship between regional soil desertification and salinization and groundwater based on remote sensing inversion: A case study of the windy beach area in Northern Shaanxi. Sci. Total Environ. 2024, 912, 168854. [Google Scholar] [CrossRef]
- Wang, Z.; Zhang, F.; Zhang, X.; Chan, N.W.; Kung, H.-t.; Ariken, M.; Zhou, X.; Wang, Y. Regional suitability prediction of soil salinization based on remote-sensing derivatives and optimal spectral index. Sci. Total Environ. 2021, 775, 145807. [Google Scholar] [CrossRef]
- Ivushkin, K.; Bartholomeus, H.; Bregt, A.K.; Pulatov, A.; Kempen, B.; de Sousa, L. Global mapping of soil salinity change. Remote Sens. Environ. 2019, 231, 111260. [Google Scholar] [CrossRef]
- Song, C.; Ren, H.; Huang, C. Estimating Soil Salinity in the Yellow River Delta, Eastern China—An Integrated Approach Using Spectral and Terrain Indices with the Generalized Additive Model. Pedosphere 2016, 26, 626–635. [Google Scholar] [CrossRef]
- Abuelgasim, A.; Ammad, R. Mapping soil salinity in arid and semi-arid regions using Landsat 8 OLI satellite data. RSASE 2019, 13, 415–425. [Google Scholar] [CrossRef]
- Khosravani, P.; Moosavi, A.A.; Baghernejad, M.; Kebonye, N.M.; Mousavi, S.R.; Scholten, T. Machine Learning Enhances Soil Aggregate Stability Mapping for Effective Land Management in a Semi-Arid Region. Remote Sens. 2024, 16, 4304. [Google Scholar] [CrossRef]
- Wang, N.; Chen, S.; Huang, J.; Frappart, F.; Taghizadeh, R.; Zhang, X.; Wigneron, J.-P.; Xue, J.; Xiao, Y.; Peng, J. Global soil salinity estimation at 10 m using multi-source remote sensing. J. Remote Sens. 2024, 4, 0130. [Google Scholar] [CrossRef]
- Broge, N.H.; Leblanc, E. Comparing prediction power and stability of broadband and hyperspectral vegetation indices for estimation of green leaf area index and canopy chlorophyll density. Remote Sens. Environ. 2001, 76, 156–172. [Google Scholar] [CrossRef]
- Allbed, A.; Kumar, L.; Aldakheel, Y.Y. Assessing soil salinity using soil salinity and vegetation indices derived from IKONOS high-spatial resolution imageries: Applications in a date palm dominated region. Geoderma 2014, 230–231, 1–8. [Google Scholar] [CrossRef]
- Rouse, J.W., Jr.; Haas, R.; Schell, J.; Deering, D.W. Monitoring Vegetation Systems in the Great Plains with ERTS; Earth resources technology satellite-1 symposium; NASA Special Publication: Hanover, MD, USA, 1973; p. 307â. [Google Scholar]
- Huete, A.; Didan, K.; Miura, T.; Rodriguez, E.P.; Gao, X.; Ferreira, L.G. Overview of the radiometric and biophysical performance of the MODIS vegetation indices. Remote Sens. Environ. 2002, 83, 195–213. [Google Scholar] [CrossRef]
- Wang, D.; Yang, H.; Qian, H.; Gao, L.; Li, C.; Xin, J.; Tan, Y.; Wang, Y.; Li, Z. Minimizing vegetation influence on soil salinity mapping with novel bare soil pixels from multi-temporal images. Geoderma 2023, 439, 116697. [Google Scholar] [CrossRef]
- Scudiero, E.; Skaggs, T.H.; Corwin, D.L. Regional scale soil salinity evaluation using Landsat 7, western San Joaquin Valley, California, USA. Geoderma Reg. 2014, 2–3, 82–90. [Google Scholar] [CrossRef]
- Wang, F.; Shengtian, Y.; Wei, Y.; Xiaodong, Y.; Jianli, D. Comparison of machine learning algorithms for soil salinity predictions in three dryland oases located in Xinjiang Uyghur Autonomous Region (XJUAR) of China. Eur. J. Remote Sens. 2019, 52, 256–276. [Google Scholar] [CrossRef]
- Shan, Z.; Wang, C.; Zhang, H.; An, W. Improved Four-Component Model-Based Target Decomposition for Polarimetric SAR Data. IEEE Geosci. Remote Sens. Lett. 2012, 9, 75–79. [Google Scholar] [CrossRef]
- Han, W.; Fu, H.; Zhu, J.; Zhang, S.; Xie, Q.; Hu, J. A polarimetric projection-based scattering characteristics extraction tool and its application to PolSAR image classification. ISPRS J. Photogramm. Remote Sens. 2023, 202, 314–333. [Google Scholar] [CrossRef]
- Aili, Y.; Nurmemet, I.; Li, S.; Lv, X.; Yu, X.; Aihaiti, A.; Qin, Y. Retrieval of Soil Moisture in the Yutian Oasis, Northwest China by 3D Feature Space Based on Optical and Radar Remote Sensing Data. Land 2025, 14, 627. [Google Scholar] [CrossRef]
- Freeman, A.; Durden, S.L. A three-component scattering model for polarimetric SAR data. IEEE Trans. Geosci. Remote Sens. 1998, 36, 963–973. [Google Scholar] [CrossRef]
- An, W.; Cui, Y.; Yang, J. Three-component model-based decomposition for polarimetric SAR data. IEEE Trans. Geosci. Remote Sens. 2010, 48, 2732–2739. [Google Scholar] [CrossRef]
- Huynen, J.R. Phenomenological Theory of Radar Targets. Ph.D. Dissertation, Engineering Consultant, Los Altos Hills, CA, USA, 1970. [Google Scholar] [CrossRef]
- Zyl, J.J.v.; Arii, M.; Kim, Y. Model-Based Decomposition of Polarimetric SAR Covariance Matrices Constrained for Nonnegative Eigenvalues. IEEE Trans. Geosci. Remote Sens. 2011, 49, 3452–3459. [Google Scholar] [CrossRef]
- Cloude, S.R.; Pottier, E. A review of target decomposition theorems in radar polarimetry. IEEE Trans. Geosci. Remote Sens. 1996, 34, 498–518. [Google Scholar] [CrossRef]
- Freeman, A.; Saatchi, S.S. On the detection of Faraday rotation in linearly polarized L-band SAR backscatter signatures. IEEE Trans. Geosci. Remote Sens. 2004, 42, 1607–1616. [Google Scholar] [CrossRef]
- Yamaguchi, Y.; Moriyama, T.; Ishido, M.; Yamada, H. Four-component scattering model for polarimetric SAR image decomposition. IEEE Trans. Geosci. Remote Sens. 2005, 43, 1699–1706. [Google Scholar] [CrossRef]
- Holm, W.A.; Barnes, R.M. On radar polarization mixed target state decomposition techniques. In Proceedings of the 1988 IEEE National Radar Conference, Ann Arbor, MI, USA, 20–21 April 1988; pp. 249–254. [Google Scholar]
- Pottier, E.; Cloude, S.R. Application of the H/A/alpha polarimetric decomposition theorem for land classification. Proc. SPIE Int. Soc. Opt. Eng. 1997, 3120, 12. [Google Scholar] [CrossRef]
- Zhu, Z.; Woodcock, C.E.; Rogan, J.; Kellndorfer, J. Assessment of spectral, polarimetric, temporal, and spatial dimensions for urban and peri-urban land cover classification using Landsat and SAR data. Remote Sens. Environ. 2012, 117, 72–82. [Google Scholar] [CrossRef]
- Pottier, E.; Ferro-Famil, L. PolSARPro V.50: An ESA educational toolbox used for self-education in the field of POLSAR and POL-INSAR data analysis. In Proceedings of the 2012 IEEE International Geoscience and Remote Sensing Symposium, Munich, Germany, 22–27 July 2012; pp. 7377–7380. [Google Scholar]
- Marcano-Cedeño, A.; Quintanilla-Domínguez, J.; Cortina-Januchs, M.G.; Andina, D. Feature selection using Sequential Forward Selection and classification applying Artificial Metaplasticity Neural Network. In Proceedings of the IECON 2010 36th Annual Conference on IEEE Industrial Electronics Society, Glendale, AZ, USA, 7–10 November 2010; pp. 2845–2850. [Google Scholar]
- Ke, G.; Meng, Q.; Finley, T.; Wang, T.; Chen, W.; Ma, W.; Ye, Q.; Liu, T.-Y. Lightgbm: A highly efficient gradient boosting decision tree. Adv. Neural Inf. Process. Syst. 2017, 30, 3149–3157. [Google Scholar]
- Wang, X.; Zhang, G.; Lou, S.; Liang, S.; Sheng, X. Two-round feature selection combining with LightGBM classifier for disturbance event recognition in phase-sensitive OTDR system. Infrared Phys. Technol. 2022, 123, 104191. [Google Scholar] [CrossRef]
- Badrinarayanan, V.; Kendall, A.; Cipolla, R. SegNet: A Deep Convolutional Encoder-Decoder Architecture for Image Segmentation. ITPAM 2017, 39, 2481–2495. [Google Scholar] [CrossRef]
- Chen, H.; Lu, S. Building Extraction from Remote Sensing Images Using SegNet. In Proceedings of the 2019 IEEE 4th International Conference on Image, Vision and Computing (ICIVC), Xiamen, China, 5–7 July 2019; pp. 227–230. [Google Scholar]
- Weng, L.; Xu, Y.; Xia, M.; Zhang, Y.; Liu, J.; Xu, Y. Water Areas Segmentation from Remote Sensing Images Using a Separable Residual SegNet Network. ISPRS Int. J. Geo-Inf. 2020, 9, 256. [Google Scholar] [CrossRef]
- Shi, Z.; Fan, J.; Du, Y.; Zhou, Y.; Zhang, Y. LULC-SegNet: Enhancing Land Use and Land Cover Semantic Segmentation with Denoising Diffusion Feature Fusion. Remote Sens. 2024, 16, 4573. [Google Scholar] [CrossRef]
- Archana, R.; Jeevaraj, P.S.E. Deep learning models for digital image processing: A review. Artif. Intell. Rev. 2024, 57, 11. [Google Scholar] [CrossRef]
- He, K.; Zhang, X.; Ren, S.; Sun, J. Deep Residual Learning for Image Recognition. In Proceedings of the 2016 IEEE Conference on Computer Vision and Pattern Recognition (CVPR), Las Vegas, NV, USA, 27–30 June 2016; pp. 770–778. [Google Scholar]
- Chen, L.-C.; Zhu, Y.; Papandreou, G.; Schroff, F.; Adam, H. Encoder-Decoder with Atrous Separable Convolution for Semantic Image Segmentation. In Proceedings of the Computer Vision—ECCV 2018, Munich, Germany, 8–14 September 2018; pp. 833–851. [Google Scholar]
- Seydehmet, J.; Lv, G.-H.; Abliz, A. Landscape Design as a Tool to Reduce Soil Salinization: The Study Case of Keriya Oasis (NW China). Sustainability 2019, 11, 2578. [Google Scholar] [CrossRef]
- Yang, J.; Zhao, J.; Zhu, G.; Wang, Y.; Ma, X.; Wang, J.; Guo, H.; Zhang, Y. Soil salinization in the oasis areas of downstream inland rivers —Case Study: Minqin oasis. Quat. Int. 2020, 537, 69–78. [Google Scholar] [CrossRef]
- Wang, Y.; Zhang, B.; Zhang, W.; Hong, D.; Zhao, B.; Li, Z. Cloud Removal With SAR-Optical Data Fusion Using a Unified Spatial–Spectral Residual Network. IEEE Trans. Geosci. Remote Sens. 2024, 62, 1–20. [Google Scholar] [CrossRef]
- Gong, Z.; Ge, W.; Guo, J.; Liu, J. Satellite remote sensing of vegetation phenology: Progress, challenges, and opportunities. ISPRS J. Photogramm. Remote Sens. 2024, 217, 149–164. [Google Scholar] [CrossRef]
- Lopez-Martinez, C.; Fabregas, X. Polarimetric SAR speckle noise model. IEEE Trans. Geosci. Remote Sens. 2003, 41, 2232–2242. [Google Scholar] [CrossRef]
- Chang, Y.; Zhao, L.; Shi, L.; Nie, Y.; Hui, Z.; Xiong, Q.; Li, P. Polarimetric calibration of SAR images using reflection symmetric targets with low helix scattering. IJAEO 2021, 104, 102559. [Google Scholar] [CrossRef]
- Xiang, D.; Xie, Y.; Cheng, J.; Xu, Y.; Zhang, H.; Zheng, Y. Optical and SAR Image Registration Based on Feature Decoupling Network. IEEE Trans. Geosci. Remote Sens. 2022, 60, 1–13. [Google Scholar] [CrossRef]
- Zhang, H.; Lei, L.; Ni, W.; Yang, X.; Tang, T.; Cheng, K.; Xiang, D.; Kuang, G. Optical and SAR Image Dense Registration Using a Robust Deep Optical Flow Framework. IEEE J. Sel. Top. Appl. Earth Obs. Remote Sens. 2023, 16, 1269–1294. [Google Scholar] [CrossRef]
- Guan, J.; Liu, R.; Tian, X.; Tang, X.; Li, S. Robust SAR Image Despeckling by Deep Learning From Near-Real Datasets. IEEE J. Sel. Top. Appl. Earth Obs. Remote Sens. 2024, 17, 2963–2979. [Google Scholar] [CrossRef]
- Kwak, Y.; Song, W.J.; Kim, S.E. Speckle-Noise-Invariant Convolutional Neural Network for SAR Target Recognition. IEEE Geosci. Remote Sens. Lett. 2019, 16, 549–553. [Google Scholar] [CrossRef]
- Arevalo, J.; Solorio, T.; Montes-y-Gómez, M.; González, F.A. Gated Multimodal Units for Information Fusion. arXiv 2017, arXiv:1702.01992. [Google Scholar] [CrossRef]
- Cheng, Y.; Cai, R.; Li, Z.; Zhao, X.; Huang, K. Locality-Sensitive Deconvolution Networks with Gated Fusion for RGB-D Indoor Semantic Segmentation. In Proceedings of the 2017 IEEE Conference on Computer Vision and Pattern Recognition (CVPR), Honolulu, HI, USA, 21–26 July 2017; pp. 1475–1483. [Google Scholar]
- Zeng, Y.; Li, H.; Wang, S.; Ge, Y. A Remote Sensing Image Classification Based on Contrast Learning with Similarity Fusion. In Proceedings of the 2024 4th International Conference on Internet of Things and Machine Learning, Nanchang, China, 9–11 August 2024; pp. 222–228. [Google Scholar]
- Yaoting, X. SAR-Optical Image Matching Model Based on Contrastive Learning. In Proceedings of the 2023 20th International Computer Conference on Wavelet Active Media Technology and Information Processing (ICCWAMTIP), Chengdu, China, 15–17 December 2023; pp. 1–5. [Google Scholar]
- Ishikawa, S.-n.; Todo, M.; Taki, M.; Uchiyama, Y.; Matsunaga, K.; Lin, P.; Ogihara, T.; Yasui, M. Example-based explainable AI and its application for remote sensing image classification. IJAEO 2023, 118, 103215. [Google Scholar] [CrossRef]
- Gizzini, A.K.; Shukor, M.; Ghandour, A.J. Extending cam-based xai methods for remote sensing imagery segmentation. arXiv 2023, arXiv:2310.01837. [Google Scholar] [CrossRef]
- van Engelen, J.E.; Hoos, H.H. A survey on semi-supervised learning. MLear. 2020, 109, 373–440. [Google Scholar] [CrossRef]
- Zeng, J.; Gu, Y.; Qin, C.; Jia, X.; Deng, S.; Xu, J.; Tian, H. Unsupervised domain adaptation for remote sensing semantic segmentation with the 2D discrete wavelet transform. Sci. Rep. 2024, 14, 23552. [Google Scholar] [CrossRef] [PubMed]
- Xu, H.; Zhang, C.; Yue, P.; Wang, K. SDCluster: A clustering based self-supervised pre-training method for semantic segmentation of remote sensing images. ISPRS J. Photogramm. Remote Sens. 2025, 223, 1–14. [Google Scholar] [CrossRef]
- Chi, Y.; Sun, J.; Liu, W.; Wang, J.; Zhao, M. Mapping coastal wetland soil salinity in different seasons using an improved comprehensive land surface factor system. Ecol. Indic. 2019, 107, 105517. [Google Scholar] [CrossRef]
- Liu, W.; Shi, T.; Zhao, Z.; Yang, C. Mapping Coastal Soil Salinity and Vegetation Dynamics Using Sentinel-1 and Sentinel-2 Data Fusion with Machine Learning Techniques. IEEE J. Sel. Top. Appl. Earth Obs. Remote Sens. 2025, 18, 14203–14214. [Google Scholar] [CrossRef]
- Ye, H.; Tang, S.; Bai, Y.; Kalhoro, M.A. Estimation of sea surface salinity from MODIS-Aqua data in the northern South China Sea. Reg. Stud. Mar. Sci. 2024, 77, 103684. [Google Scholar] [CrossRef]
- Sun, D.; Su, X.; Qiu, Z.; Wang, S.; Mao, Z.; He, Y. Remote Sensing Estimation of Sea Surface Salinity from GOCI Measurements in the Southern Yellow Sea. Remote Sens. 2019, 11, 775. [Google Scholar] [CrossRef]
- Shi, H.; Hellwich, O.; Luo, G.; Chen, C.; He, H.; Ochege, F.U.; Voorde, T.V.d.; Kurban, A.; Maeyer, P.d. A Global Meta-Analysis of Soil Salinity Prediction Integrating Satellite Remote Sensing, Soil Sampling, and Machine Learning. IEEE Trans. Geosci. Remote Sens. 2022, 60, 1–15. [Google Scholar] [CrossRef]
Disclaimer/Publisher’s Note: The statements, opinions and data contained in all publications are solely those of the individual author(s) and contributor(s) and not of MDPI and/or the editor(s). MDPI and/or the editor(s) disclaim responsibility for any injury to people or property resulting from any ideas, methods, instructions or products referred to in the content. |
© 2025 by the authors. Licensee MDPI, Basel, Switzerland. This article is an open access article distributed under the terms and conditions of the Creative Commons Attribution (CC BY) license (https://creativecommons.org/licenses/by/4.0/).
