Article

Field Study of UAV Variable-Rate Spraying Method for Orchards Based on Canopy Volume

1
College of Electronic Engineering/College of Artificial Intelligence, South China Agricultural University, Guangzhou 510642, China
2
National Center for International Collaboration Research on Precision Agricultural Aviation Pesticide Spraying Technology, Guangzhou 510642, China
*
Author to whom correspondence should be addressed.
Agriculture 2025, 15(13), 1374; https://doi.org/10.3390/agriculture15131374 (registering DOI)
Submission received: 20 May 2025 / Revised: 24 June 2025 / Accepted: 25 June 2025 / Published: 27 June 2025
(This article belongs to the Special Issue Smart Spraying Technology in Orchards: Innovation and Application)

Abstract

The use of unmanned aerial vehicle (UAV) pesticide spraying technology in precision agriculture is becoming increasingly important. However, traditional spraying methods struggle to address the precision application need caused by the canopy differences of fruit trees in orchards. This study proposes a UAV orchard variable-rate spraying method based on canopy volume. A DJI M300 drone equipped with LiDAR was used to capture high-precision 3D point cloud data of tree canopies. An improved progressive TIN densification (IPTD) filtering algorithm and a region-growing algorithm were applied to segment the point cloud of fruit trees, construct a canopy volume-based classification model, and generate a differentiated prescription map for spraying. A distributed multi-point spraying strategy was employed to optimize droplet deposition performance. Field experiments were conducted in a citrus (Citrus reticulata Blanco) orchard (73 trees) and a litchi (Litchi chinensis Sonn.) orchard (82 trees). Data analysis showed that variable-rate treatment in the litchi area achieved a maximum canopy coverage of 14.47% for large canopies, reducing ground deposition by 90.4% compared to the continuous spraying treatment; variable-rate treatment in the citrus area reached a maximum coverage of 9.68%, with ground deposition reduced by approximately 64.1% compared to the continuous spraying treatment. By matching spray volume to canopy demand, variable-rate spraying significantly improved droplet deposition targeting, validating the feasibility of the proposed method in reducing pesticide waste and environmental pollution and providing a scalable technical path for precision plant protection in orchards.

1. Introduction

Chemical pesticides are widely used in agricultural pest and disease control [1]. However, traditional continuous spraying methods often fail to adjust the dosage based on the actual conditions of crops, resulting in low pesticide utilization efficiency and severe spray waste [2,3,4]. Excessive and indiscriminate pesticide application increases production costs and causes environmental pollution and food safety risks [5], posing health threats to applicators. Variable-rate spraying technology has emerged to improve pesticide use efficiency and reduce unnecessary loss [6]. Variable-rate spraying dynamically adjusts spray dosage based on target crops’ spatial distribution and growth parameters, enabling quantitative application on demand [7]. This can significantly reduce pesticide usage and drift loss while also reducing environmental impact and saving costs [8]. Precision spraying, according to crop differences, has become an important development direction in modern agricultural plant protection.
Currently, variable-rate spraying technology is mainly implemented through ground mechanical platforms [9]. Ground-based self-propelled or tractor-mounted sprayers can carry large pesticide tanks and provide a stable supply with long operational endurance and sufficient spray capacity. These offer advantages in high-volume applications and penetration of dense canopies. In addition, ground orchard sprayers have evolved to include targeted variable-rate spraying systems that can automatically adjust nozzle angle and flow based on canopy contours, thereby achieving precise matching for different canopies [10]. However, ground machinery has limited mobility in hilly and mountainous orchards, and manual adjustment of nozzle parameters during operation is time-consuming and labor-intensive [11]. In contrast, UAV spraying systems are maneuverable, terrain-independent, and safer for remote operation, making them suitable for spraying operations in orchards located on hilly or steep terrain where ground machinery cannot reach [12]. Moreover, low-volume UAV spraying reduces exposure risk for applicators [13,14]. However, current UAVs are limited by payload and spatial constraints and cannot be equipped with overly complex or heavy spray control components [15]. Variable-rate spraying is typically implemented through pre-defined low-resolution prescription maps or simple image recognition technologies [16,17,18,19]. In summary, despite the flexible advantages of UAVs, they are still deficient in the fine control of variable spraying, and there is an urgent need to seek new solutions in sensing, perception, and control compensation.
Sensing technologies for target detection are key components of variable spraying systems. Early ground-based variable sprayers often used ultrasonic sensors to detect canopy contours [20,21], but such technology could only obtain average canopy information with limited precision. In contrast, LiDAR can acquire high-resolution three-dimensional point cloud data and is significantly more accurate than ultrasound in detecting canopy geometry and density [8]. In recent years, the application of LiDAR sensors in agricultural spraying has gained widespread attention. On one hand, researchers have integrated LiDAR into intelligent ground spraying devices to detect tree canopy size and density in real-time and dynamically control nozzle activation and flow to achieve tree-specific spraying [22]. Experiments have shown that LiDAR-guided variable-rate robotic systems can achieve comparable spraying performance to traditional methods while reducing pesticide usage, airborne drift, and ground loss by 32.46%, 44.34%, and 58.14%, respectively. On the other hand, on the UAV platform, studies have explored the use of UAV-carried LiDAR for 3D scanning modeling of cotton to guide low-resolution variable application decisions [23], but real-time high-resolution variable spraying with airborne LiDAR has not yet been realized due to the limitations of the load capacity and arithmetic power. Overall, due to its high accuracy and comprehensive canopy information acquisition capability, LiDAR is becoming an important component of agricultural variable-rate spraying perception systems and has shown potential in both ground and aerial platforms.
The three-dimensional point cloud data obtained from LiDAR provides accurate decision-making support for variable-rate spraying. By processing point cloud data, individual fruit trees can be identified and canopy parameters extracted, allowing for customized spraying strategies for each tree. Thereby, high-resolution spraying prescription maps can be generated to indicate the required spray volume for different areas or individual trees. Studies have shown that parameters such as tree canopy volume are important indicators for precise variable-rate spraying decisions and are closely related to the required spray volume [24]. UAV-based variable spraying has not yet fully leveraged the high-precision perception capabilities of LiDAR. By incorporating LiDAR into orchard variable spraying decision-making and using it to perceive the three-dimensional structure of canopies, the current low-resolution limitations of UAV variable spraying could be improved.
We propose an individual-tree-level variable-rate spraying method for orchards based on UAV-mounted LiDAR point cloud data to address existing research shortcomings. This method uses UAV-mounted LiDAR to acquire high-density 3D point clouds of orchards, analyzes the spatial distribution of individual trees, quantifies their canopy volumes, and generates differential spraying prescriptions accordingly. An unmanned aerial spraying system (UASS) then executes precision spraying according to the prescriptions. Compared to traditional uniform spraying, this method dynamically matches the spray volume to the canopy volume, reducing pesticide waste and environmental pollution risks. The innovation of this study lies in the systematic application of LiDAR point cloud analysis technology in orchard plant protection operations, realizing a complete closed loop of “3D perception–prescription decision–precision execution” and providing a reusable technical framework for orchard variable-rate spraying.

2. Materials and Methods

The overall workflow of this study is shown in Figure 1, with specific steps as follows: (1) orchard point cloud data acquisition and preprocessing; (2) individual tree segmentation and volume calculation from tree point clouds; (3) UASS spraying experiments. First, the DJI Matrice 300 RTK UAV (DJI Technology Co., Ltd., Shenzhen, China) was used to acquire point cloud data of the orchard. Then, the raw point cloud data were denoised, and an IPTD filtering algorithm [25] was used to obtain ground points. Based on the canopy height model (CHM) model, seed points of fruit trees were generated, and individual trees were segmented to obtain the canopy volume of each fruit tree. Finally, the canopy volumes were classified to generate a prescription map for spraying, and the DJI T30 was used to carry out the spraying experiments.

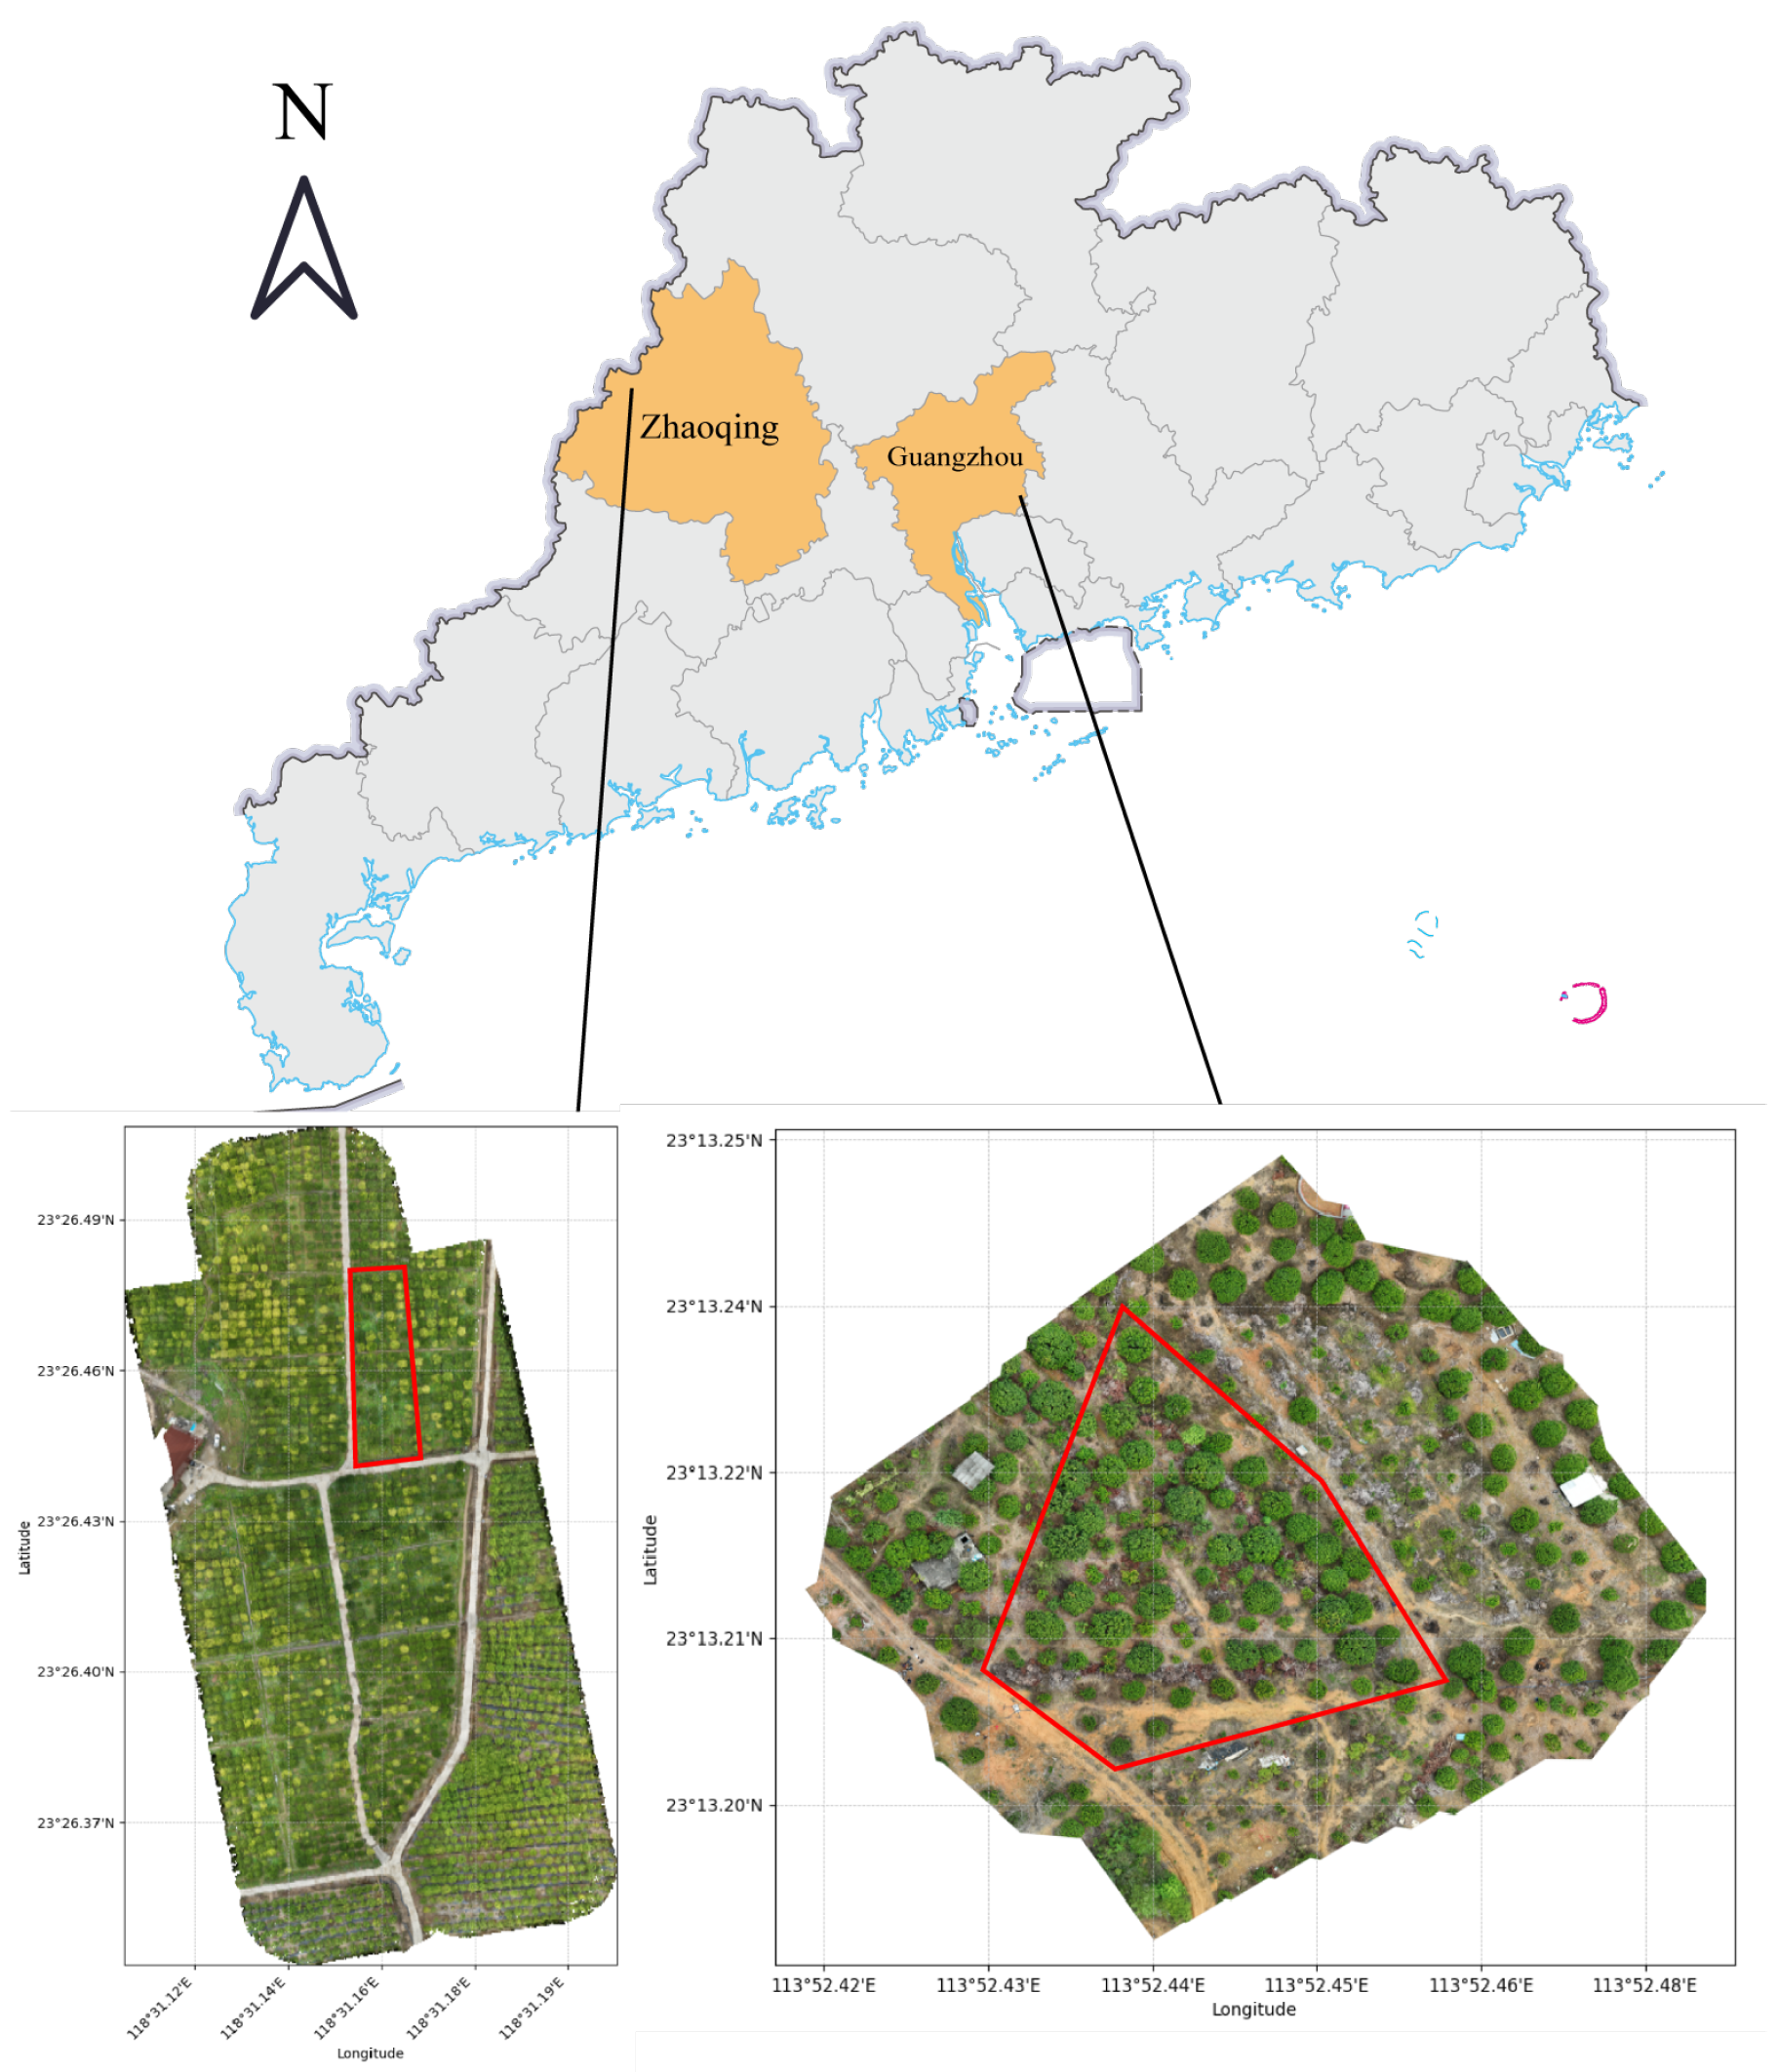
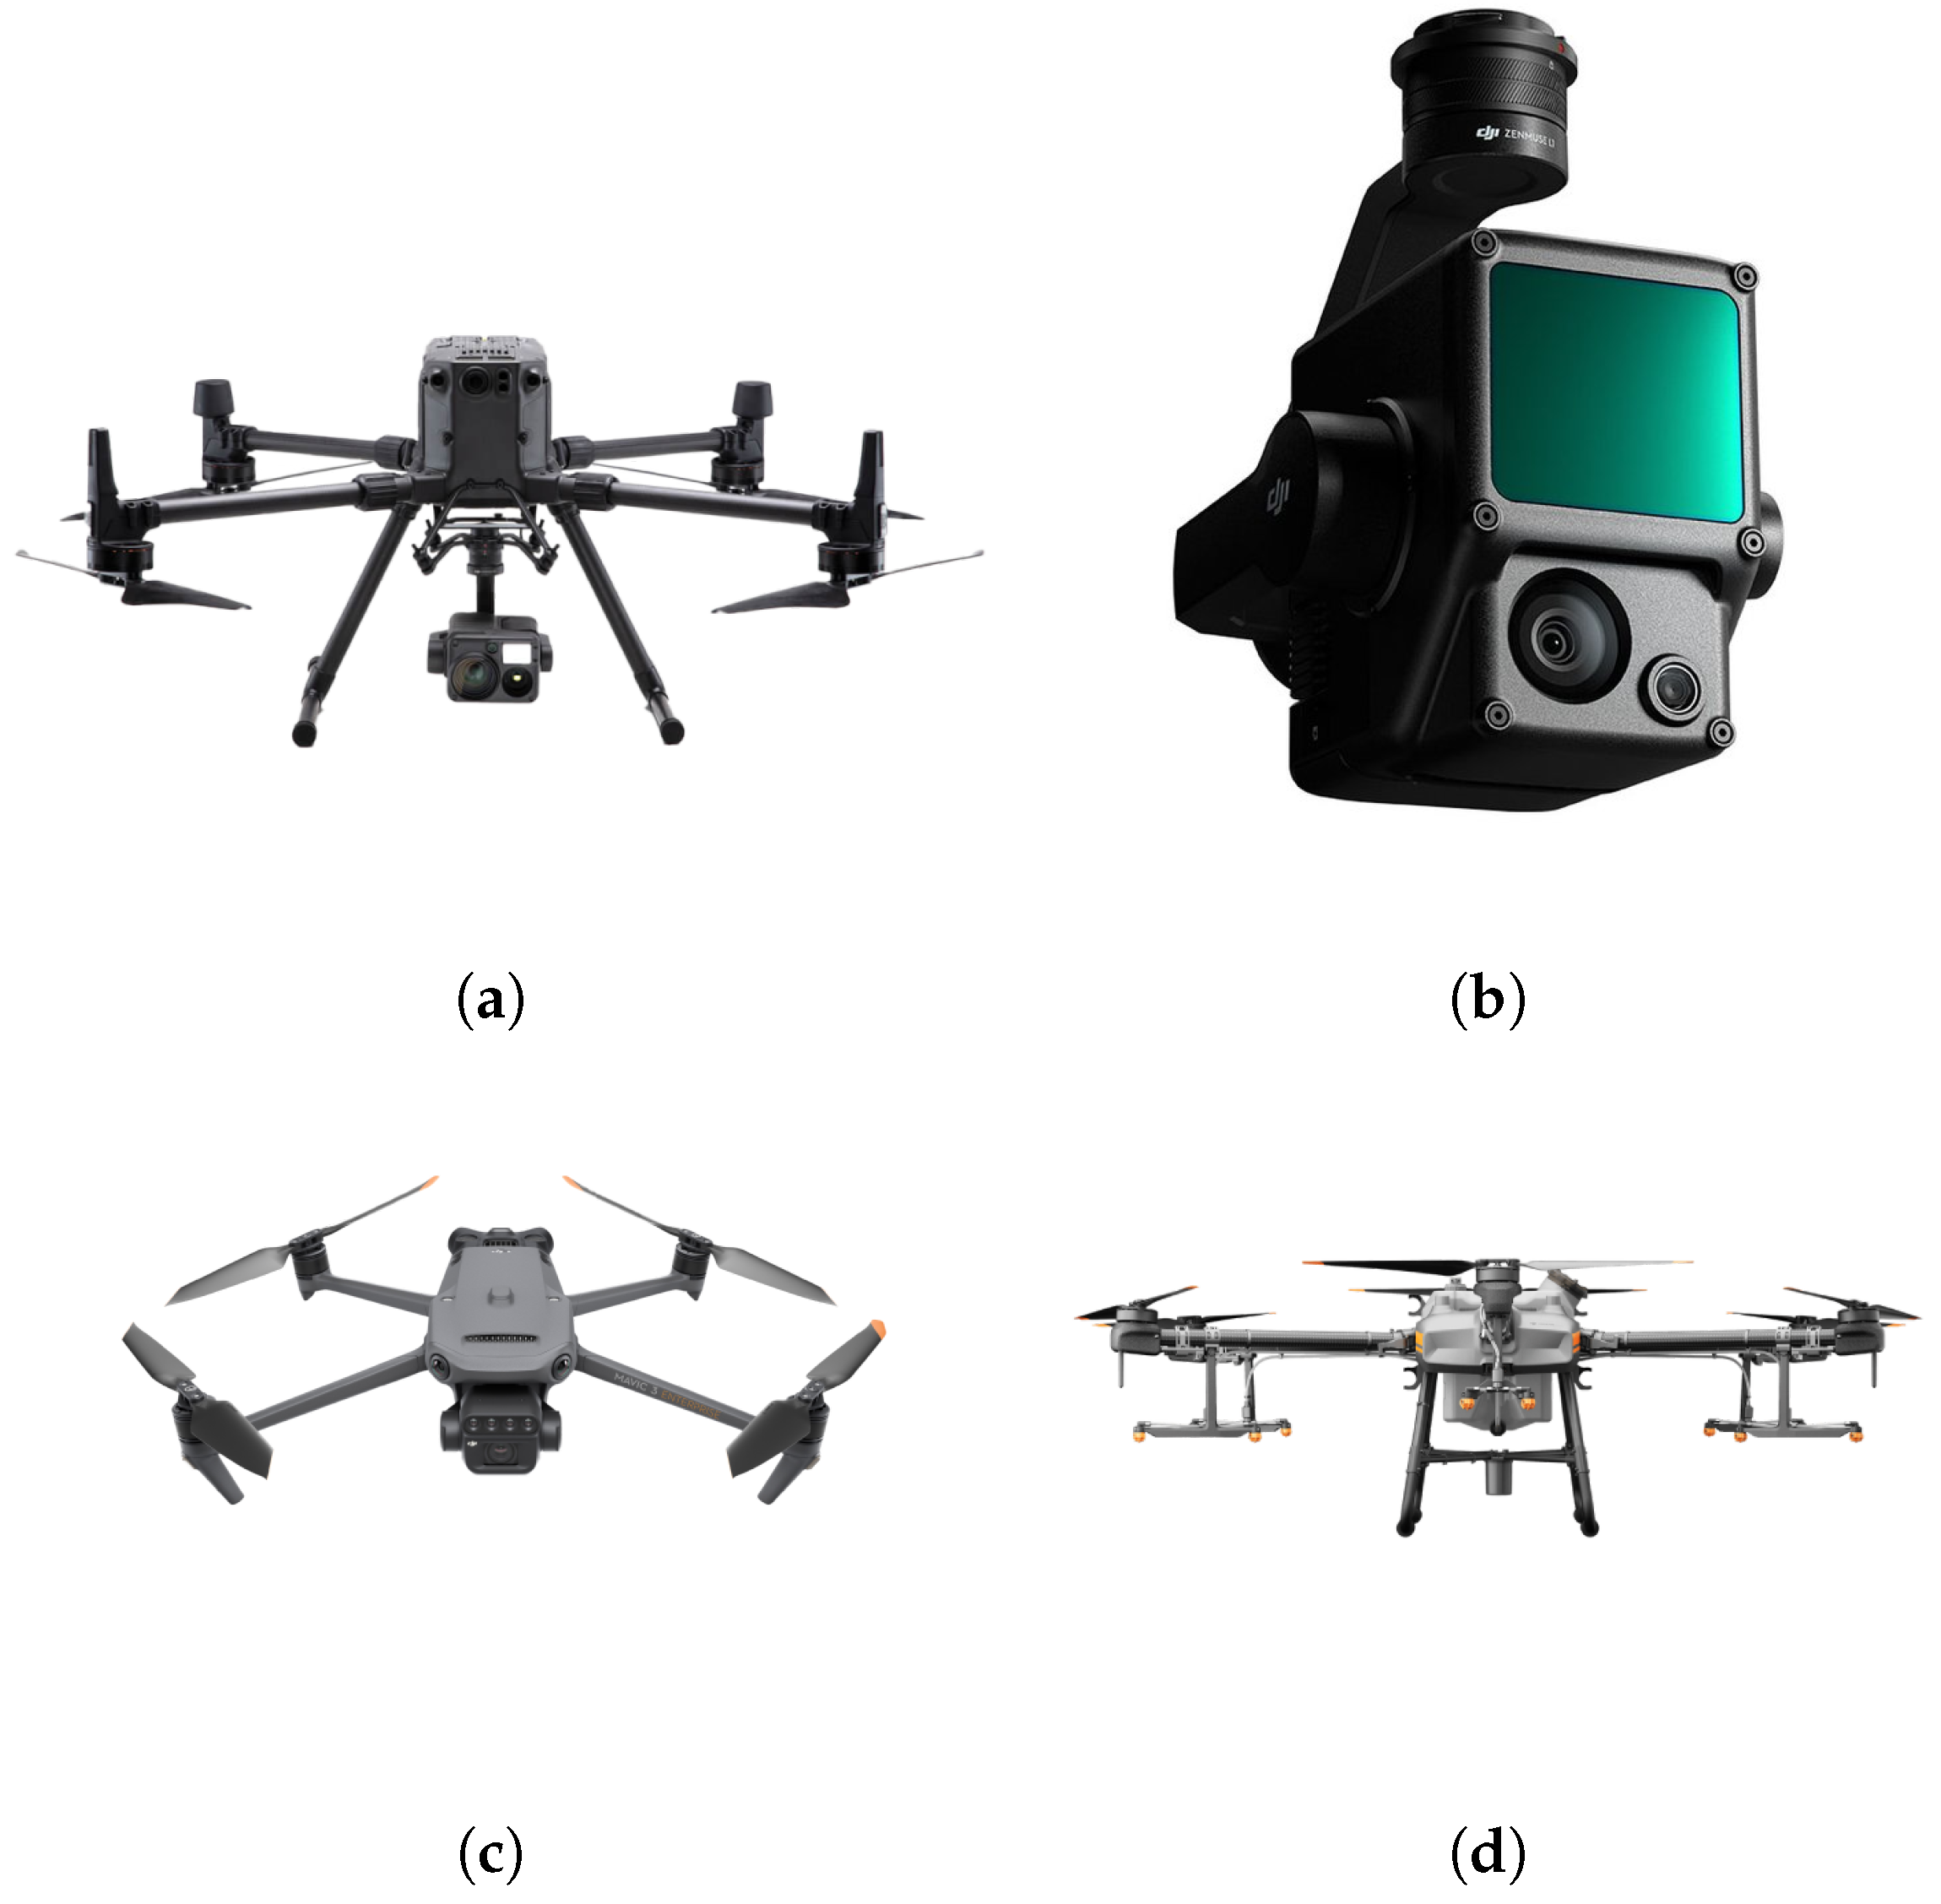
2.1. Experimental Location and Equipment

This study was conducted in two orchard scenarios in Guangdong Province, China: the Cuitian citrus orchard in Huangtian Town, Sihui City, Zhaoqing (23.26° N, 118.31° E) and the Junda litchi orchard in Zengcheng District, Guangzhou (23.13° N, 113.52° E), as shown in Figure 2. We selected areas with standardized planting but significant differences in growth as experiment areas, and remote sensing UAVs were used to obtain corresponding remote sensing data for specific fruit tree canopy detection and UASS spraying experiments.
Figure 3 shows the equipment used in this study. The DJI Matrice 300 RTK (Figure 3a) equipped with the Zenmuse L1 LiDAR-RGB fusion gimbal (Figure 3b) was used to acquire orchard point cloud data. The DJI Mavic 3M mapping UAV (Figure 3c) was used to plan spraying routes, and the DJI T30 plant protection UAV (Figure 3d) was used to carry out spraying experiments. Specific equipment parameters are detailed in Table 1.

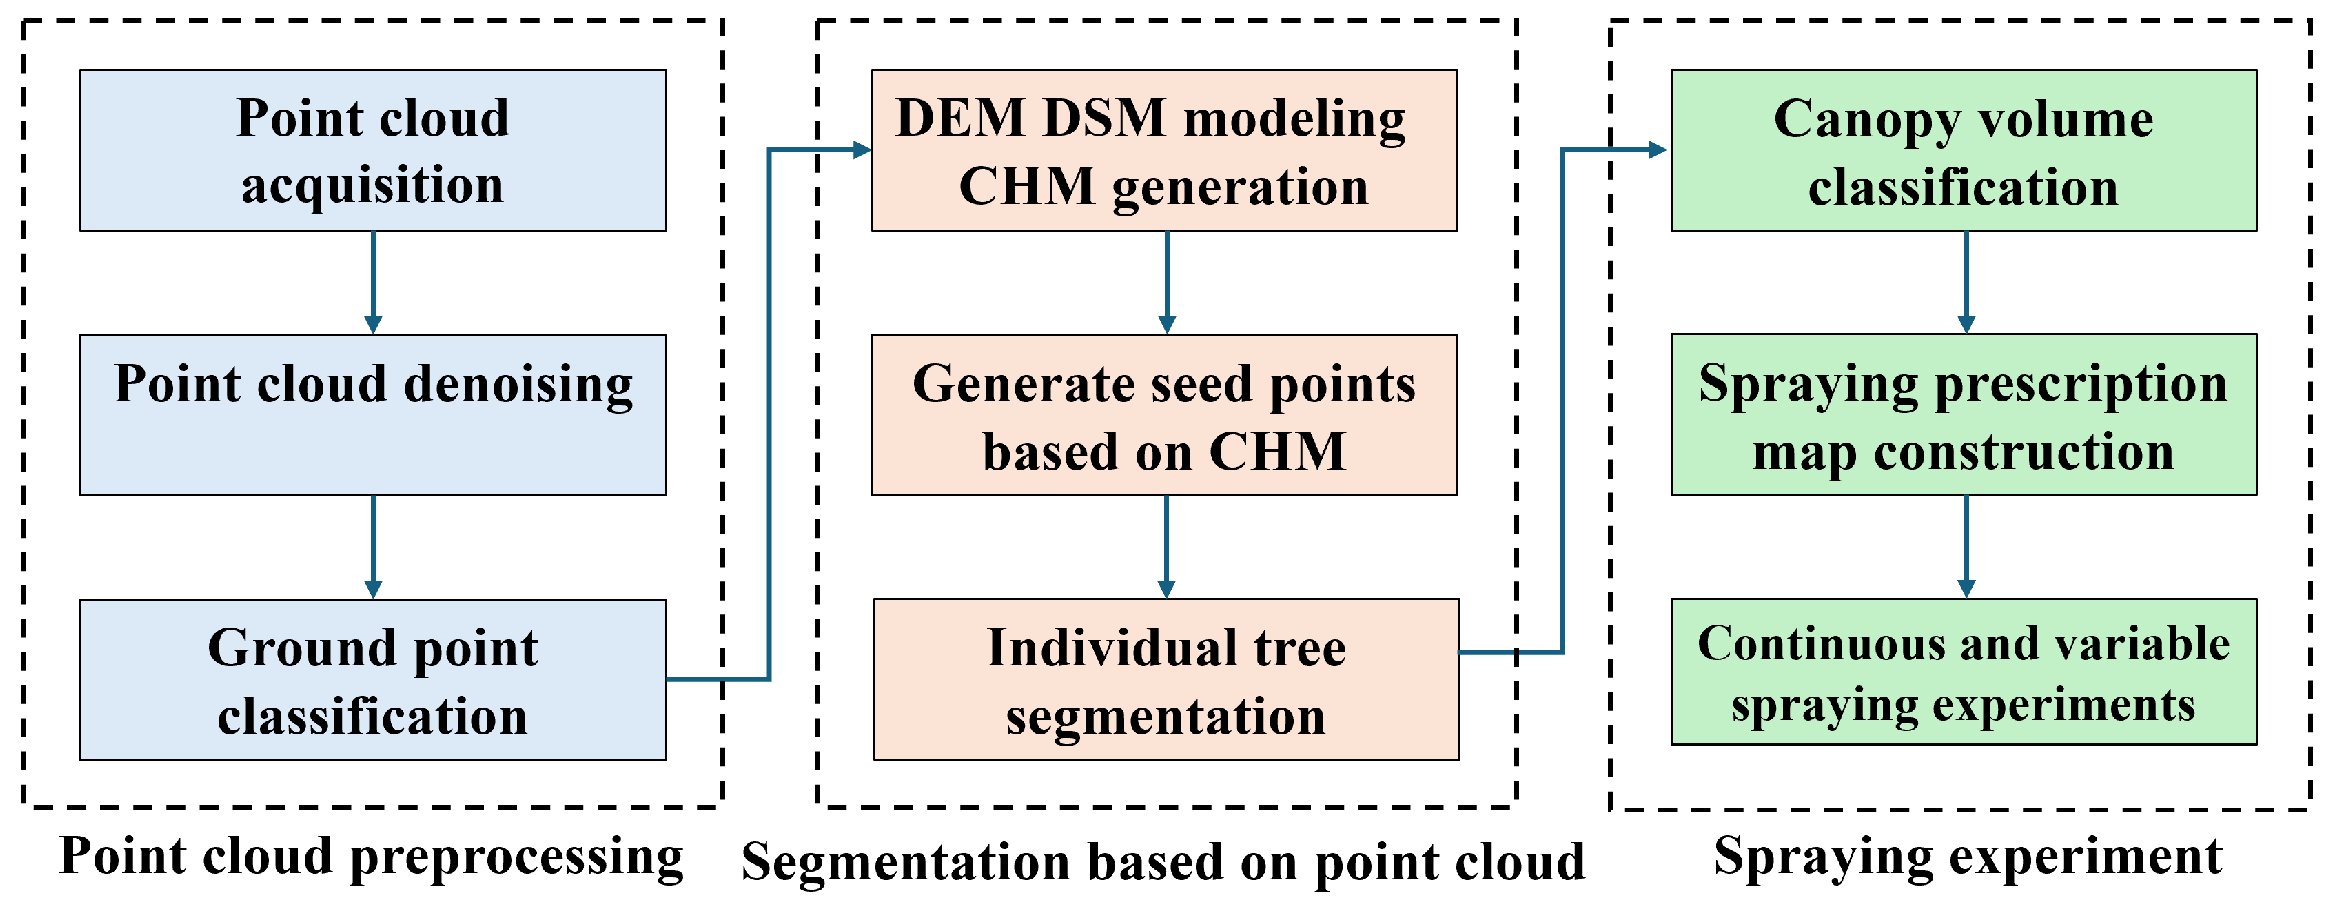
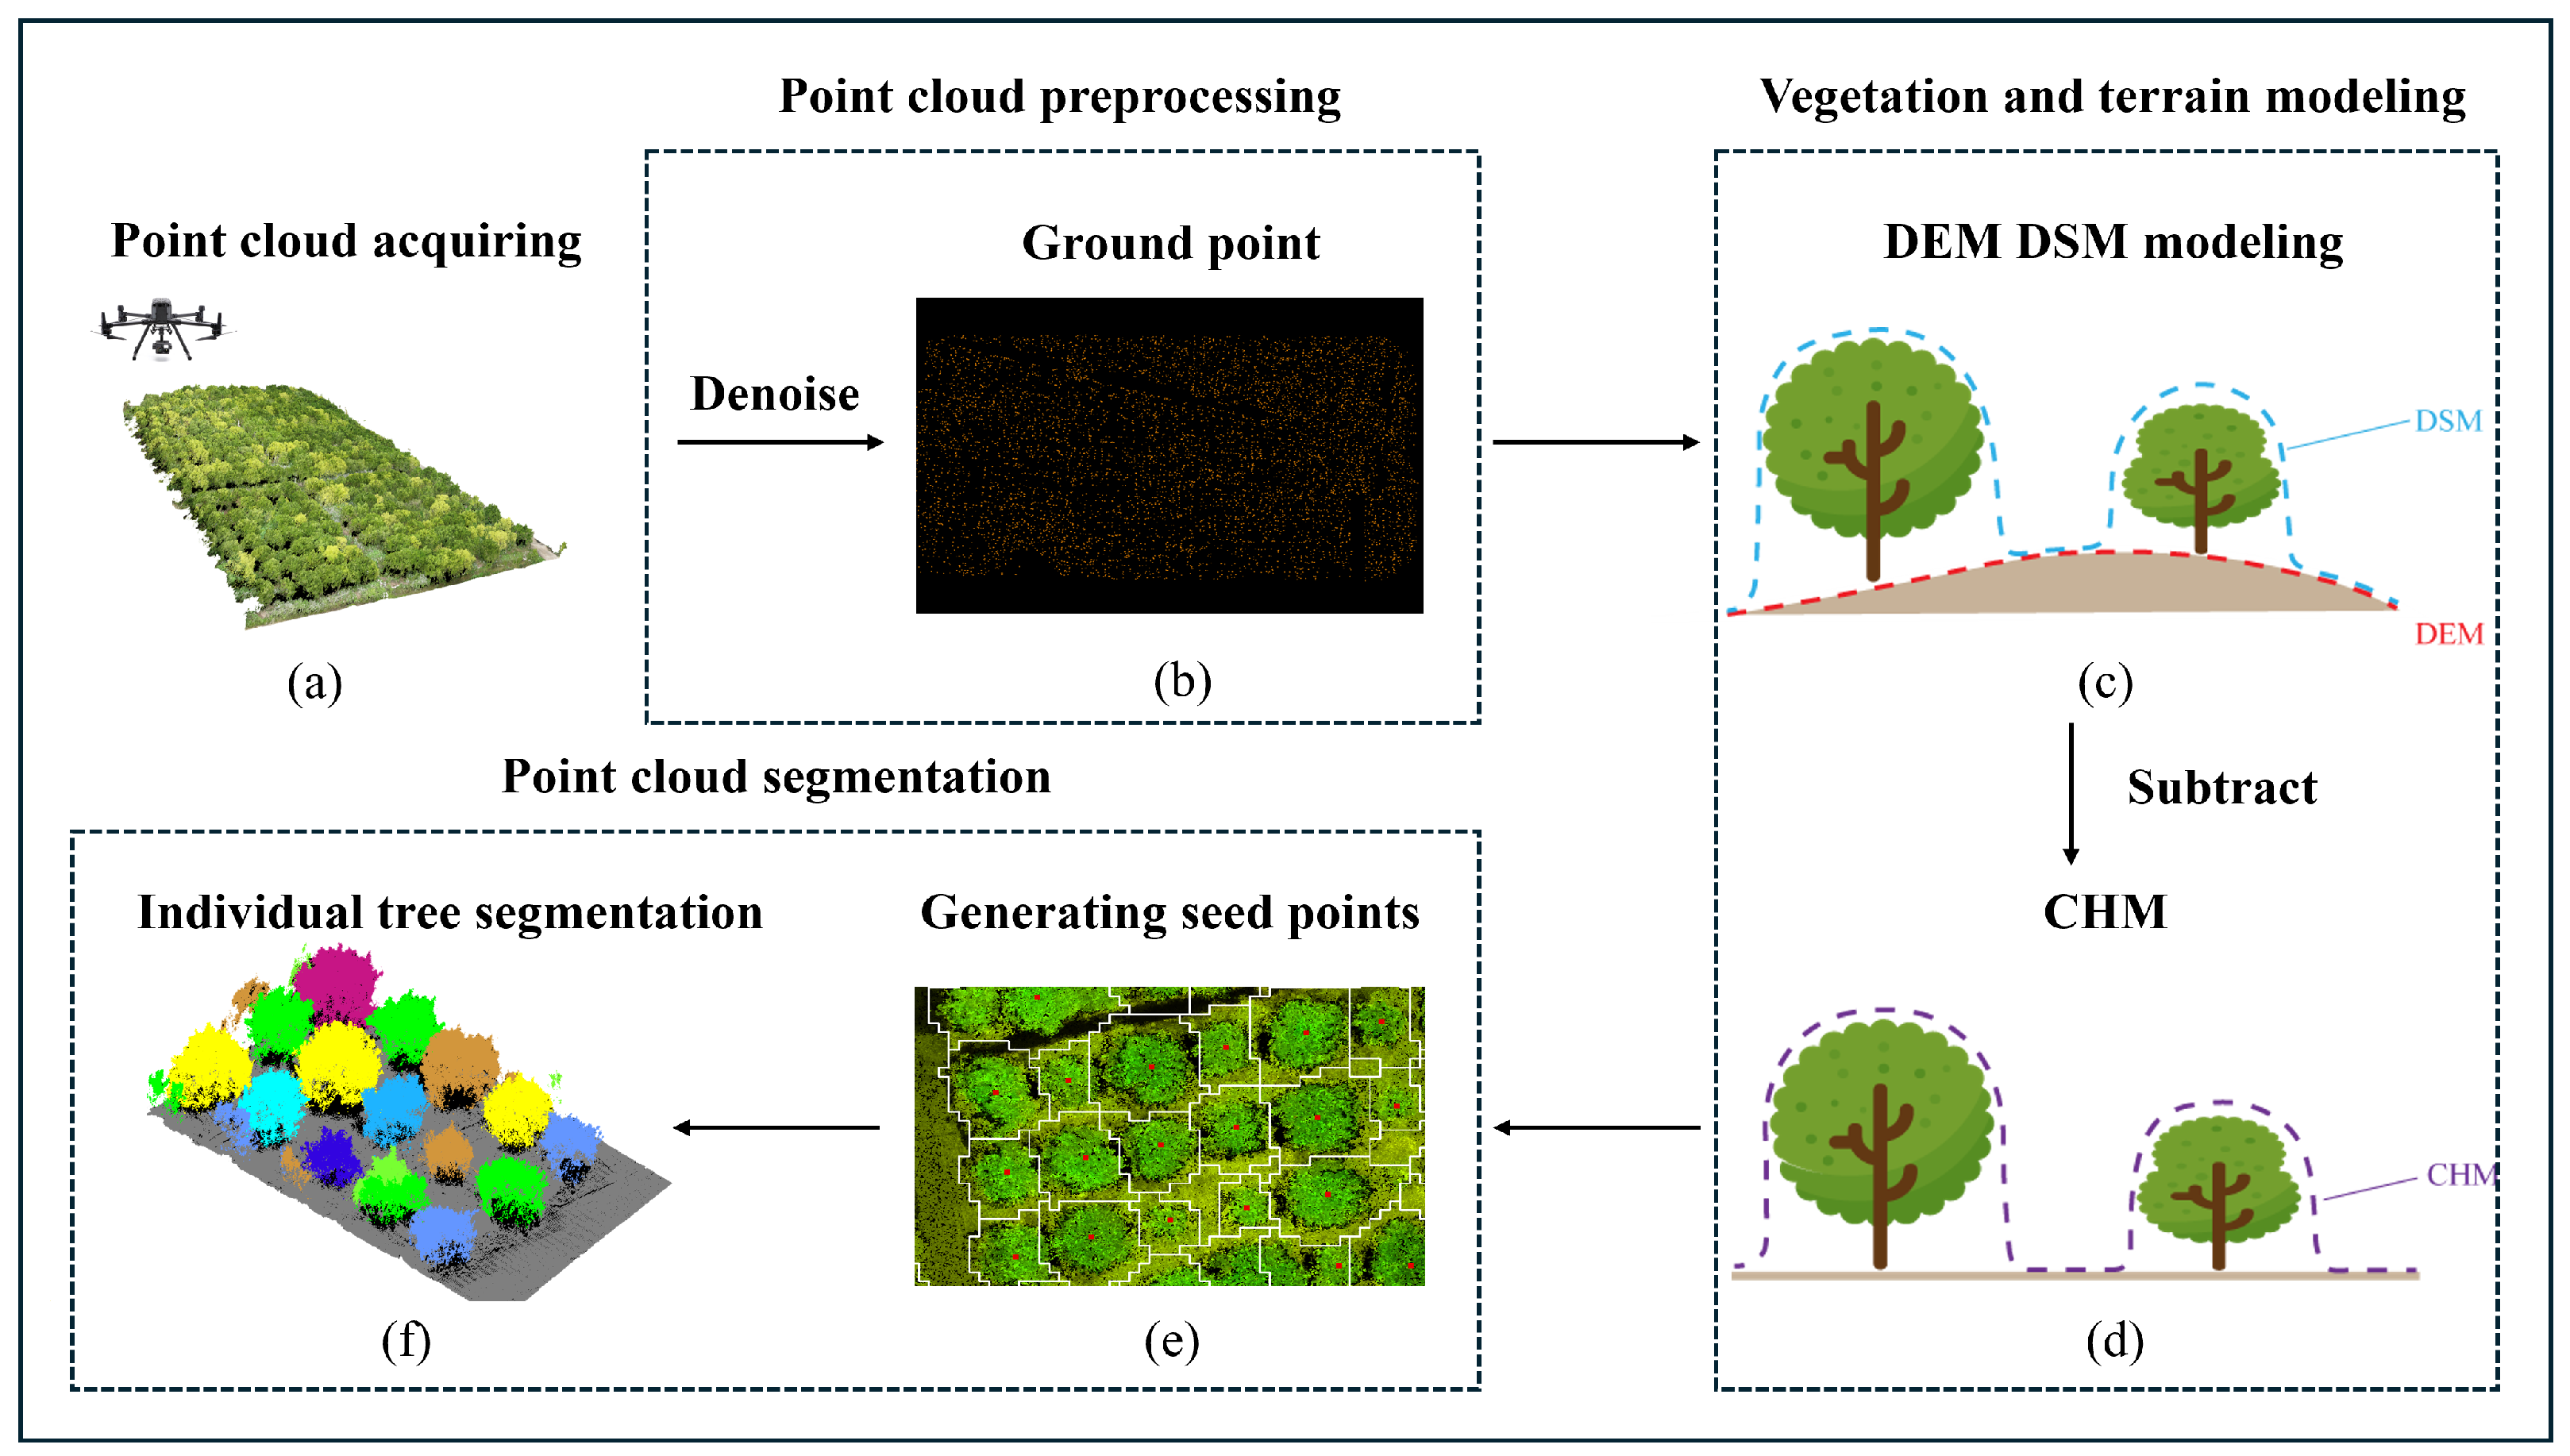
2.2. Orchard Point Cloud Acquisition and Individual Tree Segmentation Method

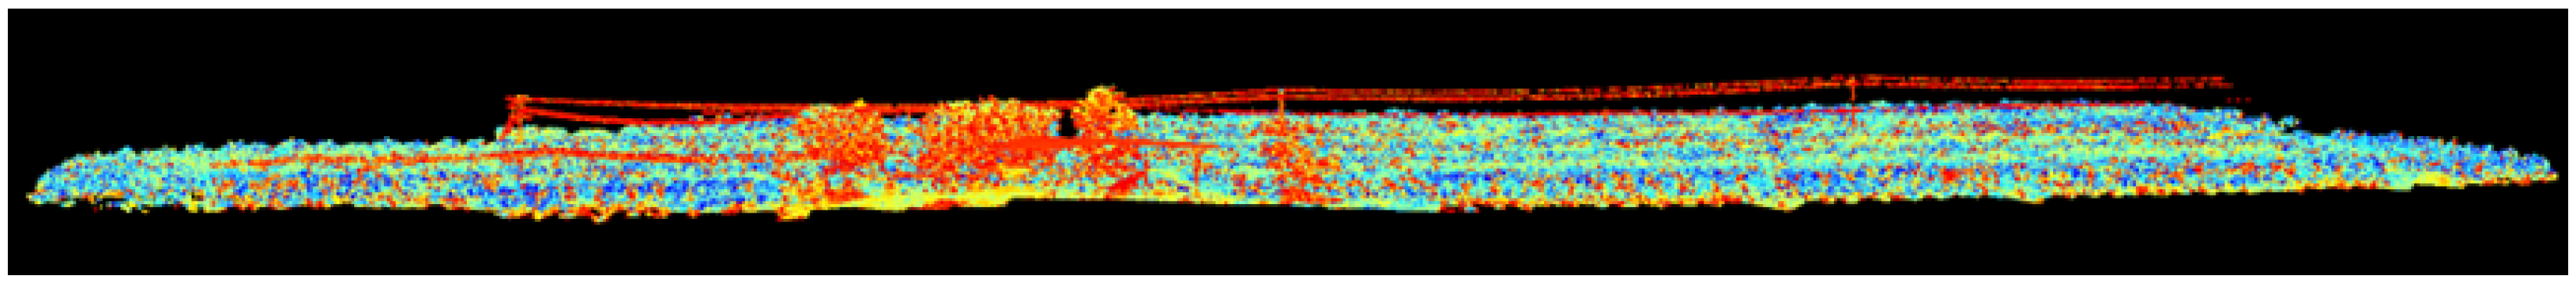
2.2.1. Orchard Point Cloud Data Collection

Figure 4 shows the workflow from point cloud data acquisition and preprocessing to individual tree segmentation. The orchard point cloud data collection was carried out on 10 January 2024 (citrus orchard), and 17 November 2024 (litchi orchard), respectively, using the DJI M300 RTK equipped with the Zenmuse L1 LiDAR-RGB fusion gimbal to obtain high-precision three-dimensional point cloud data. The flight missions were planned using DJI GO Pro software, with a flight height of 30 m. Real-time kinematic positioning ensured the spatial continuity of the data. The raw point cloud data were processed using DJI Terra software, integrating LiDAR point clouds with simultaneously acquired RGB images to achieve multi-source data fusion, generating a high-precision 3D point cloud model of the orchard, as shown in Figure 4a.

2.2.2. Point Cloud Data Preprocessing

The preprocessing of point cloud data includes noise removal and ground point classification [26]. LiDAR360 (Green Valley Co., Shanghai, China) software was used to preprocess the raw point cloud data acquired by the UAV. Raw point cloud data commonly include two types of noise: high outliers and low outliers [27]. High outliers are mainly caused by reflections from non-target objects received by the airborne LiDAR system, appearing as discrete abnormal elevation points. Low outliers are caused by multipath effects during laser ranging and sensor system errors.
A standard deviation filter algorithm based on statistical principles was used for noise removal (Equation (1)):
Z threshold = μ ± k σ
where μ is the mean elevation of the local neighborhood and σ is the standard deviation. By analyzing the statistical distribution of elevation data, thresholds were dynamically set to identify and remove abnormal noise points. The neighborhood size was set to 10 during processing, and the standard deviation multiplier k was set to 5. Figure 5 shows the raw point cloud data before denoising, with red boxes marking significant high outliers; after applying the standard deviation filter, Figure 6 shows that the abnormal noise points were effectively removed.
This study used the improved progressive TIN densification (IPTD) algorithm to classify ground points from the LiDAR point cloud data. The IPTD algorithm is based on the progressive triangulated irregular network densification framework [28], which improves the ground point classification accuracy in complex scenes by fusing morphological constraints with an iterative optimization mechanism on the terrain surface. First, a rough terrain surface was constructed using gridding and morphological opening operations (Equation (2)):
f a = Φ rec f a , f
where Φ represents the raster image, a represents the structural element, ∘ indicates morphological opening, and Φ rec indicates morphological dilation reconstruction. The lowest point in each grid cell was extracted; if the height difference between this point and the terrain surface was less than 0.5 m, it was considered a potential ground seed point. The potential ground seed points were filtered to remove outliers and obtain high-confidence ground seed points, which were used to construct the initial TIN. Finally, through downward densification and iterative upward densification based on angle and distance thresholds, the ground point set was gradually expanded to complete the final ground point extraction, as shown in Figure 4b. The optimal classification effect was achieved when the iteration angle was set to 8° and the iteration distance to 1 m.

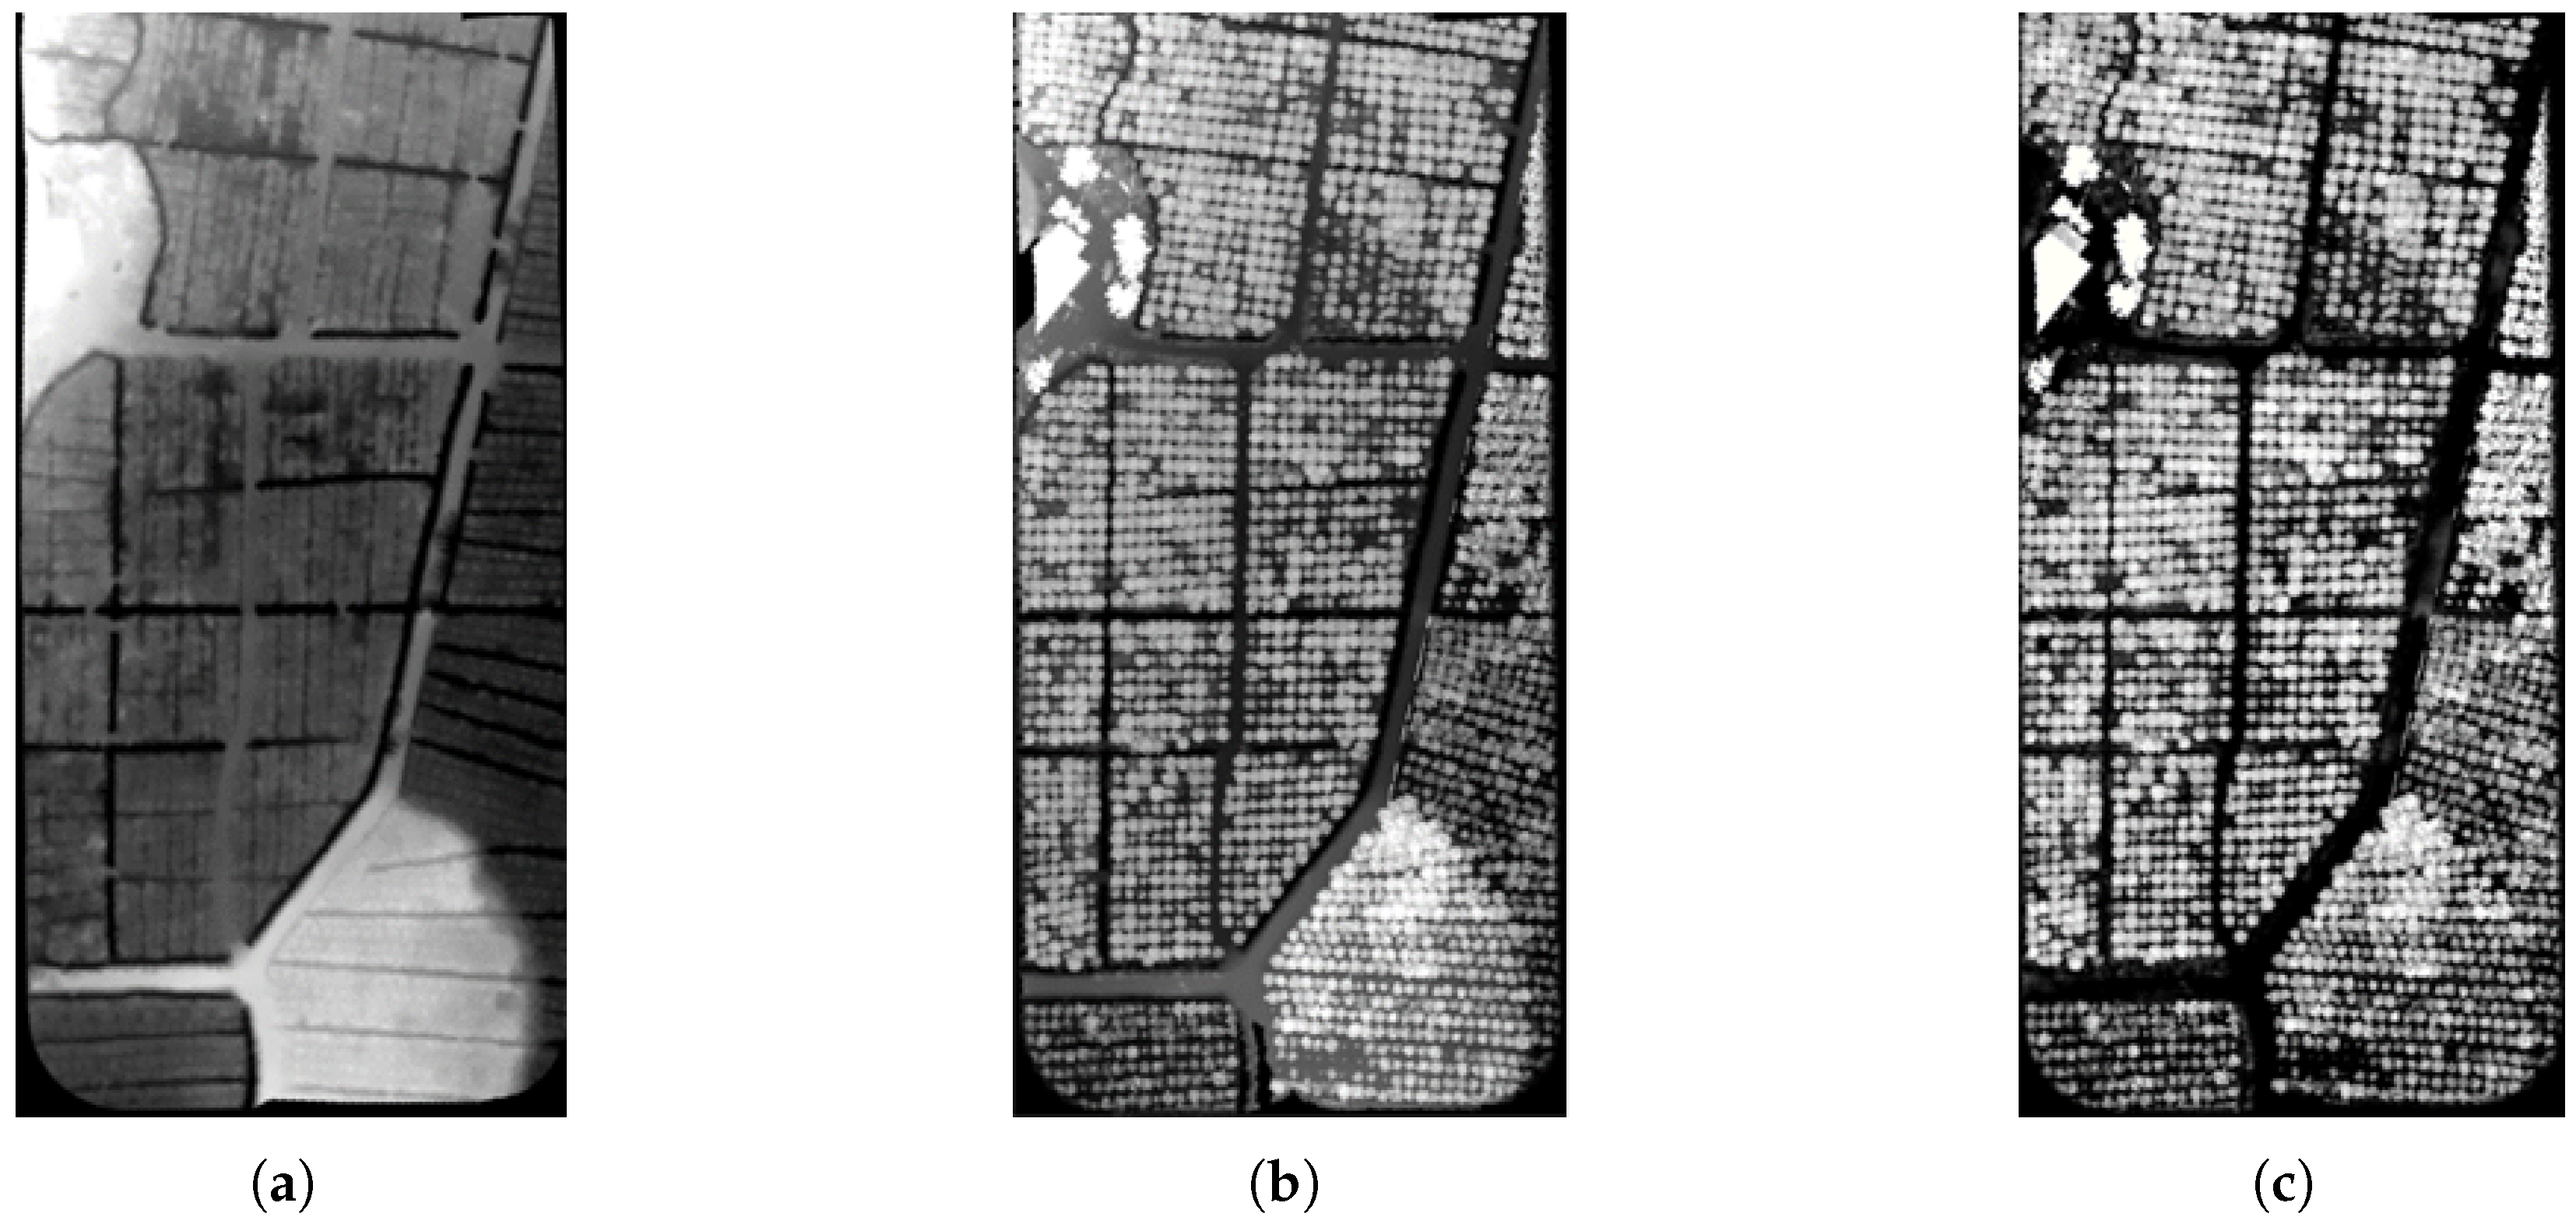
2.2.3. Terrain and Vegetation Modeling

The modeling of terrain and vegetation from UAV point cloud data provides a three-dimensional spatial basis for individual tree segmentation. In this study, point cloud data were used to construct a digital elevation model (DEM) (Figure 7a), digital surface model (DSM) (Figure 7b), and CHM (Figure 7c) to extract terrain features and quantify the spatial distribution of canopy. The DEM was generated by interpolating ground points and using a regular grid to represent terrain elevation, eliminating interference from vegetation and buildings while preserving topographic slope and structural features. The DSM was generated by interpolating the original point cloud (including ground and non-ground points), fully representing the 3D form of the surface and vegetation. The CHM was obtained by pixel-wise subtraction of DEM from DSM, removing the influence of terrain undulation and quantifying the vertical distribution of the canopy. The relationships among the three models are illustrated in Figure 4c,d.
Based on field investigation of the orchard, a threshold of 0.4 m was selected to distinguish between tree crowns and low-lying weeds or soil, which was used to generate CHM.

2.2.4. Seed Point Generation Based on CHM

To locate the apex positions of individual tree canopies, a local maximum filter was applied to the CHM to extract the maximum elevation point within each window as the initial seed point, as shown in Figure 4e. A Gaussian filter was then applied to the initial seed points,
G ( x , y ) = 1 2 π σ 2 e x 2 + y 2 2 σ 2 ,
using weighted averaging to suppress isolated noise points and eliminate pseudo-extreme values caused by canopy surface irregularities or data noise, thereby optimizing the spatial distribution accuracy of seed points. In the equation, σ denotes the standard deviation of the Gaussian distribution, and the window size was set according to the average crown diameter specific to the fruit tree scenario. The resulting seed points were used for individual tree segmentation in Section 2.2.5.

2.2.5. Individual Tree Segmentation Based on Seed Points

This study used the airborne LiDAR individual tree segmentation module of the LiDAR360 platform. It used a seed-point-driven region growth algorithm to perform segmentation and volume calculation of individual tree canopies in the orchard. The algorithm is based on the point cloud segmentation framework proposed by Li et al. [29], where Gaussian-filtered seed points serve as the initial positions of canopy peaks. Through spatial proximity and elevation gradient constraints, the region-growing algorithm is applied to achieve individual tree segmentation.
In sparse canopy regions, the algorithm effectively separates individual tree canopies. However, in densely packed canopies, leaf and branch adhesion may cause neighboring trees to be mistakenly identified as a single canopy (under-segmentation). This study used vertical profile analysis tools combined with manual interactive editing to visually inspect and optimize the spatial distribution of seed points in 3D. The final segmentation results use different colors to mark individual tree canopies, as shown in Figure 4f, with the segmentation results including parameters such as tree height, crown diameter, and canopy volume.

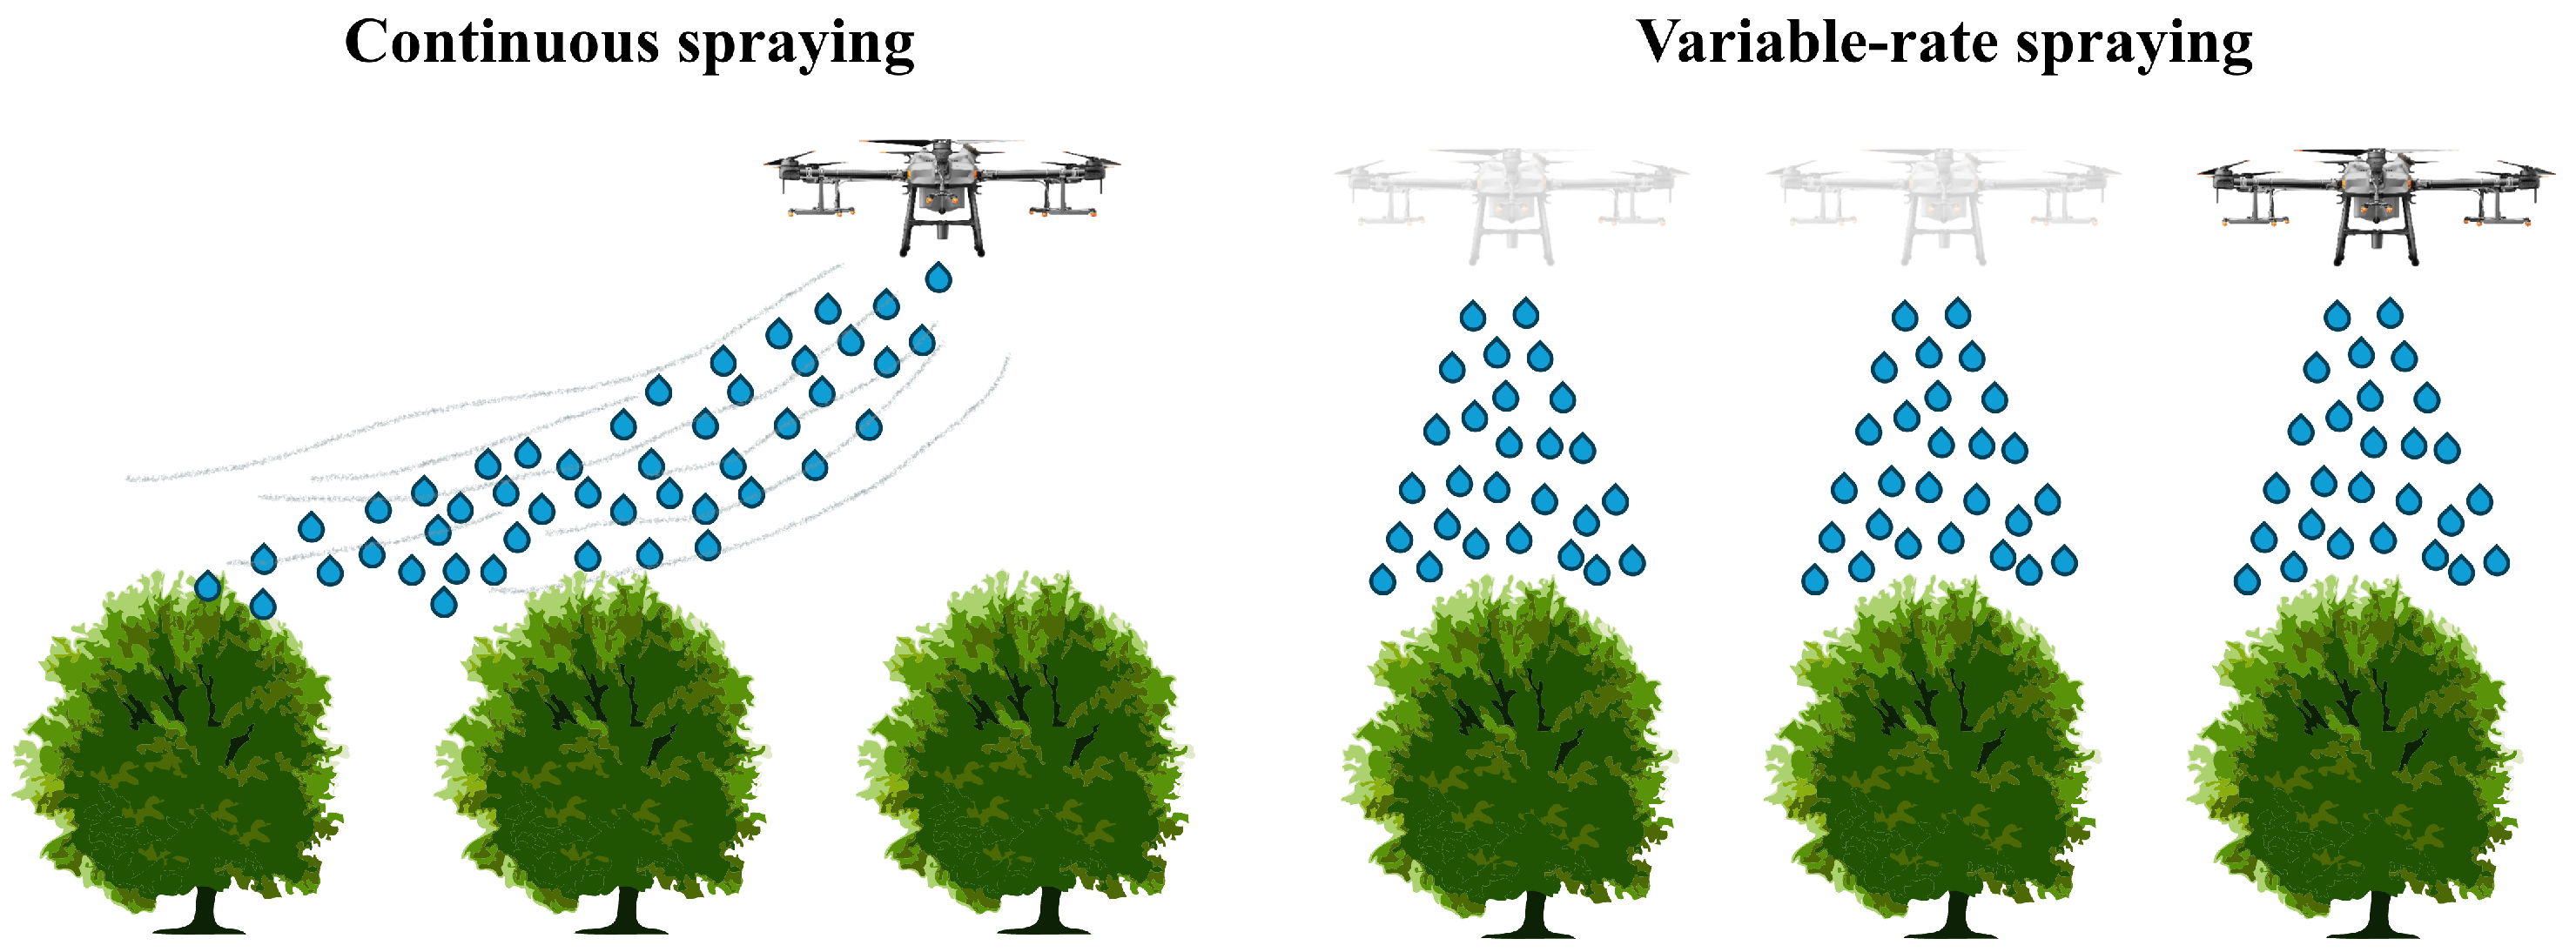
2.3. Spraying Experiment Design

2.3.1. Classification of Variable Spray Levels Based on Canopy Volume

Due to differences in planting years and individual growth, tree canopy volume in the orchard exhibited significant spatial heterogeneity. To match the dynamic pesticide deposition requirements with the differences in canopy volume, a classification standard for differential spraying levels was established based on the cumulative frequency distribution of canopy volume and expert agricultural knowledge, as shown in Table 2.

2.3.2. Spraying Route Planning and Operational Parameters

Based on the variable spraying classification standards above, areas with significant canopy volume variation were selected in the litchi and citrus orchards for spraying trials. The planning method for the UAV spraying routes is shown in Figure 8. Remote sensing images of the orchards were obtained using DJI Mavic 3M, and a 3D canopy model of the orchard was reconstructed using DJI Terra software. Spraying routes were planned along the direction of the planting rows, including continuous and variable-rate spraying modes. The flight altitude was uniformly set to 1.5 m above the canopy top. The operational parameters for both spraying modes are shown in Table 3. Treatments T1 to T4 correspond to litchi, where T1 and T2 adopt variable-rate spraying and T3 and T4 use continuous spraying. Treatments T5 and T6 correspond to citrus, with T5 using variable-rate spraying and T6 using continuous spraying. For variable-rate spraying, the spray rate was set based on the differential spraying level standards in Table 2.
Two spraying modes are shown in Figure 9. In continuous spraying mode, the nozzle remains on throughout the flight, and flight speed is set to gradients of 0.5–2 m/s to simulate conventional constant-speed spraying scenarios. In variable spraying mode, the nozzle starts in the off state. The UASS uses the RTK positioning system to identify the location of the target tree, triggers a hover, and then opens the nozzle according to the preset spraying level to perform precision spraying. The flight speed remains constant at 1 m/s.
To optimize droplet deposition uniformity in variable-rate spraying for litchi canopies and explore the influence of the spatial distribution of application points on the droplet deposition efficacy, under the framework of canopy volume graded application, we designed two application strategies, center application and distributed multi-point application, as shown in Figure 10, in which the red circle is the location where UASS performs the spraying. The center application is to release the whole amount of pesticide centrally in the center of the canopy; distributed multi-point application is to set up uniformly distributed application points in the canopy projection plane according to the corresponding application level of canopy volume, maintain the total application amount unchanged, and execute equal amount of multi-frequency release.

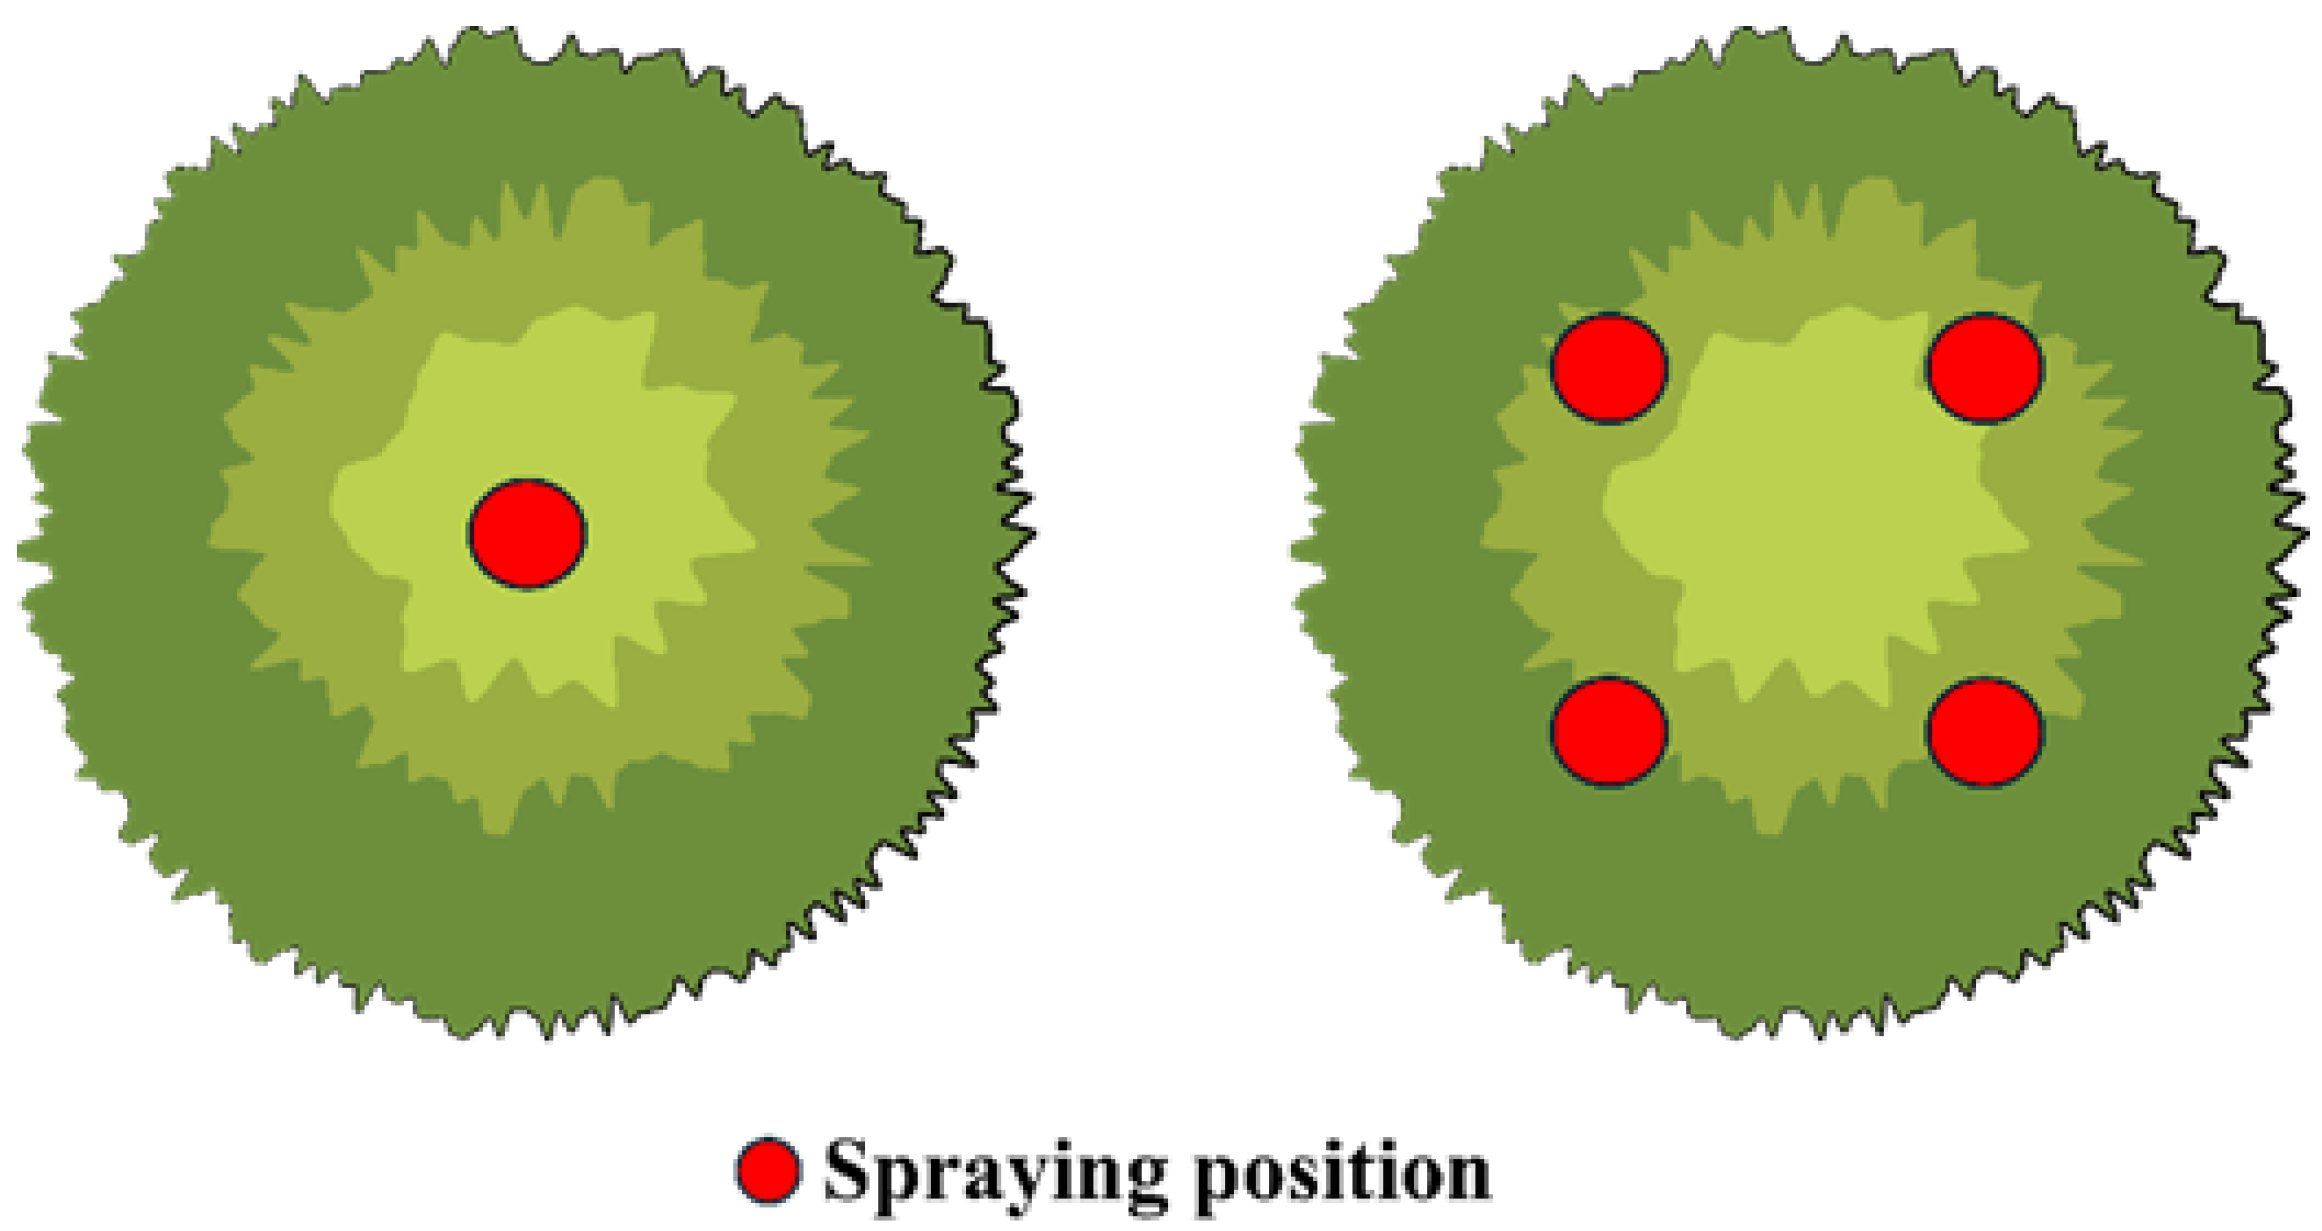
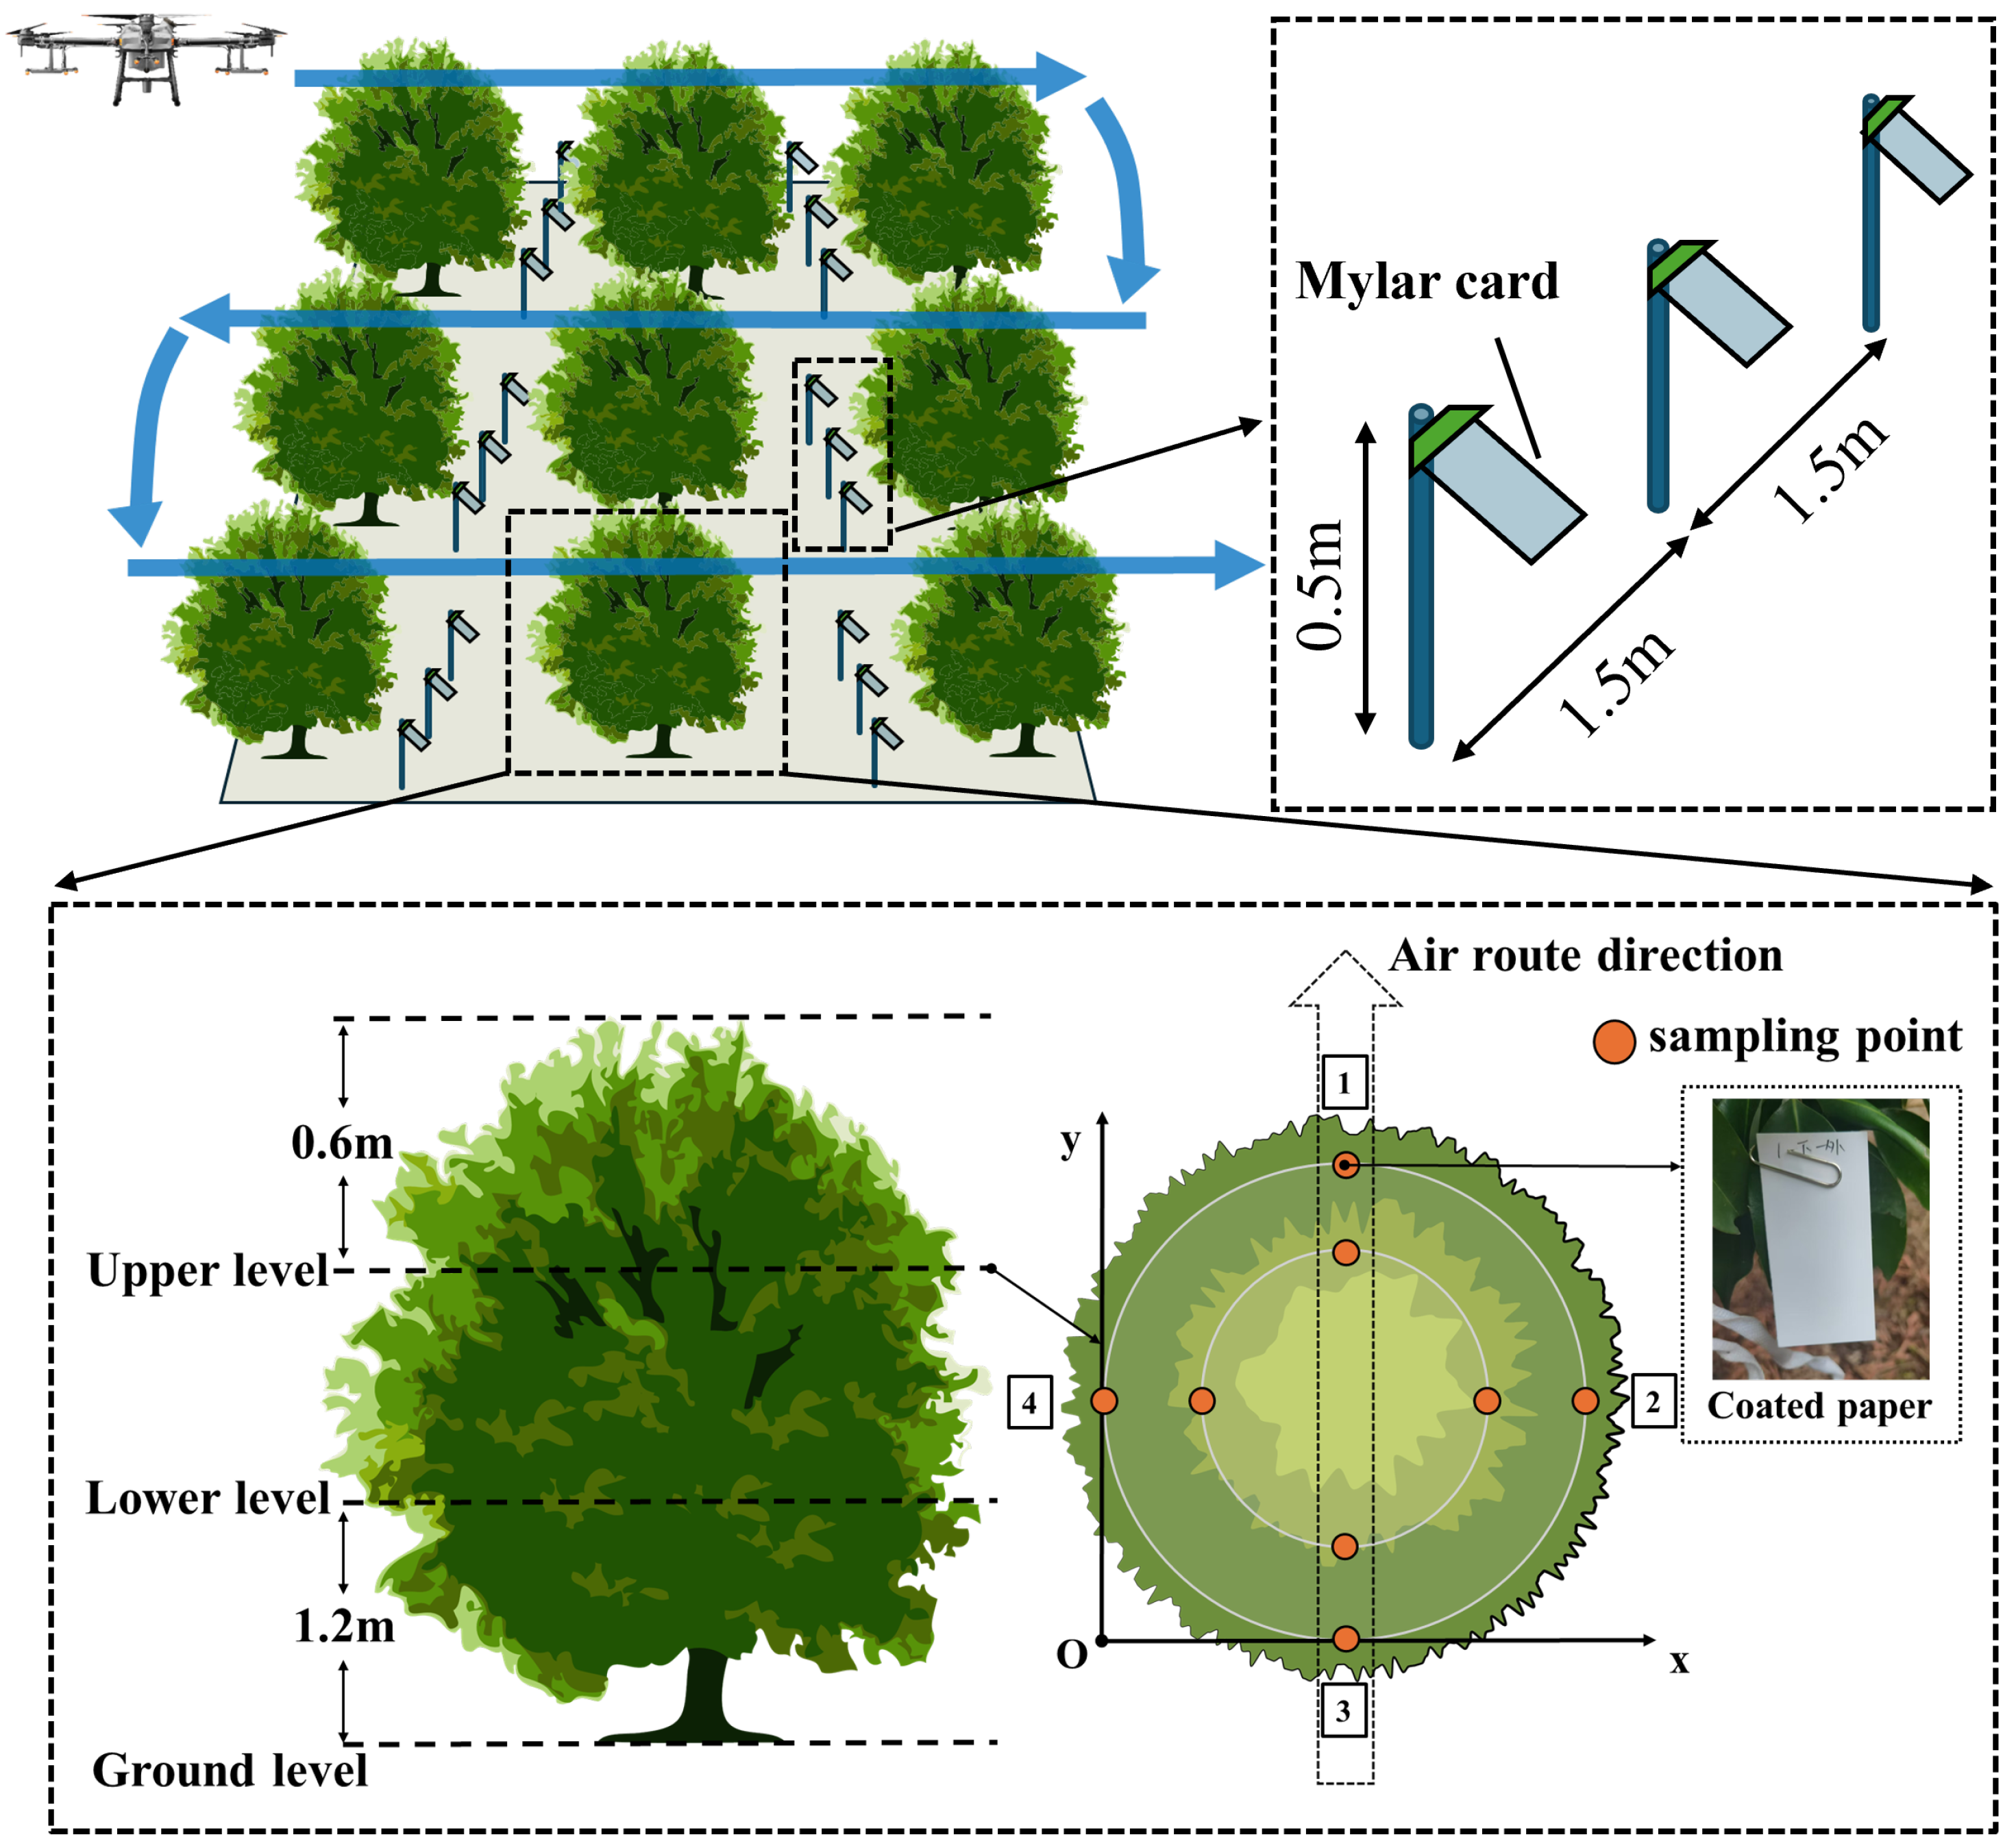
2.3.3. Droplet Sampling Point Arrangement

To verify the effect of variable spraying, healthy trees with good nutritional status and significant canopy volume variation were selected in the sampling area, excluding trees affected by pests or diseases. A rhodamine red solution with a concentration of 4 g/L was used as a tracer. Coated paper and Mylar cards were used to collect droplet deposition data from UAV spraying. Figure 11 shows the flight routes and sampling method. The coated paper was fixed at different positions within the fruit tree canopies to quantify the droplet coverage rate and internal canopy deposition characteristics. At the same time, Mylar cards were placed on the ground between rows to capture the ground drift deposition of the spray solution simultaneously.
Sampling strategies for citrus and litchi were designed according to their canopy structure differences. For citrus, sampling points were arranged in upper and lower canopy layers, with four outer points per layer in four directions, of which points 1 and 3 directly faced the UAV flight direction. Each tree had eight coated paper sheets. The coated paper (3.5 cm × 7 cm) was clipped onto the middle-upper parts of the leaves, with the sampling surface facing the route. For litchi trees, which have larger canopies and higher internal porosity, in addition to the four outer sampling points per layer, four inner points were added at distances of 0.6–0.8 m from the trunk. Each tree sample had 16 coated paper sheets to evaluate droplet penetration performance. Before deployment, all sampling points were marked with location codes to avoid data confusion.
Ground sampling points were arranged between tree rows, with Mylar cards (5 cm × 9 cm) placed at 1.5 m intervals. The cards were mounted with universal clips on height-adjustable support tubes 0.5 m above the ground to analyze droplet ground loss patterns under different spraying modes.

2.3.4. Experimental Data Processing

After the spraying experiment, coated paper samples from each tree were collected. Each sample was sealed in a plastic zip-lock bag and grouped by tree number into labeled envelopes. Ground Mylar card samples were sealed individually according to row number position.
Coated paper samples were scanned into 600 dpi grayscale images using an HP Scanjet 200 scanner (Hewlett-Packard Company, HP, Palo Alto, CA, USA) and processed using DepositScan [30] droplet deposition analysis software (United States Department of Agriculture, Wooster, OH, USA) to obtain droplet coverage rates, serving as the core evaluation indicator of spraying effectiveness.
Mylar card samples were used to obtain ground deposition data for spray drift. The droplet deposition volume was measured following ISO 24253-1 [31]. Each zip-lock bag containing a Mylar card was filled with 5 mL distilled water and thoroughly shaken to extract rhodamine red into the solution. A microplate reader was used to measure the absorbance of the eluent at 514 nm. The concentration of rhodamine red in the eluent was calculated based on a standard curve (Equation (4)):
Y = 0.0277 X + 0.0556 ( R 2 = 0.999 )
where R 2 represents the coefficient of determination, and the deposition per card was calculated using Equation (5), yielding the ground deposition amount between trees.
β dep = ρ smpl ρ blk × F cal × V dil A col
In Equation (5), β d e p is the deposition amount, ρ s m p l is the absorbance of the sample, ρ b l k is the absorbance of the blank control, F c a l is the slope of the standard curve, V d i l is the eluent volume in m L , and A c o l is the area of the droplet collector card in cm2.

3. Results

3.1. Point Cloud-Based Individual Tree Segmentation Results

We selected typical test plots within the citrus and litchi orchards to carry out individual tree segmentation and canopy volume analysis, and the results are shown in Table 4. Based on Gaussian-filtered seed points and the region growing algorithm, supplemented with manual seed point correction, 82 individual tree canopies were extracted in the litchi test area and 73 in the citrus test area, covering the full range of canopy volume samples. The coefficient of variation in canopy volume within the experimental areas was 70.37% (litchi) and 41.2% (citrus), indicating significant differences in canopy volume among individual trees in the orchards. The distribution of canopy volumes is shown in Table 5. Sample trees covered all canopy volume classes for complete gradient characterization, and canopy volume data are shown in Table 6.

3.2. Exploration of Variable Spraying Strategies

This study evaluated the deposition uniformity of different application strategies by the coefficient of variation (CV) of droplet coverage at each sampling point, with smaller CV values characterizing more uniform droplet distribution. The uniformity of droplet distribution between the center application and distributed multi-point application is shown in Table 7. The CV values of the center application strategy were stable at 78.90–107.13% in the small canopy (Tree 4), which was better than the values of the large canopy (Tree 2: 181.48–198.63%) at the same rate. This difference originated from the mismatch between the spray width of the UAV and the geometrical characteristics of the target canopy in the center application mode, which resulted in the inability of the droplets to cover the entire canopy, and the formation of local enrichment of the droplets in the canopy region, where the droplets were deposited centrally only in some areas. In contrast, by setting multiple application points within the canopy projection, the distributed multi-point application strategy significantly improves the application uniformity in different canopy layers, except for the small canopy layer. In particular, the droplet CV value of fruit tree 2 (large canopy) was reduced by 49.5% from 193.71% in the center application to 97.84% at 1.0 L application rate. Based on these findings, a distributed multi-point application strategy will be used in subsequent variable-rate spraying trials to adapt to multi-scale canopy requirements.

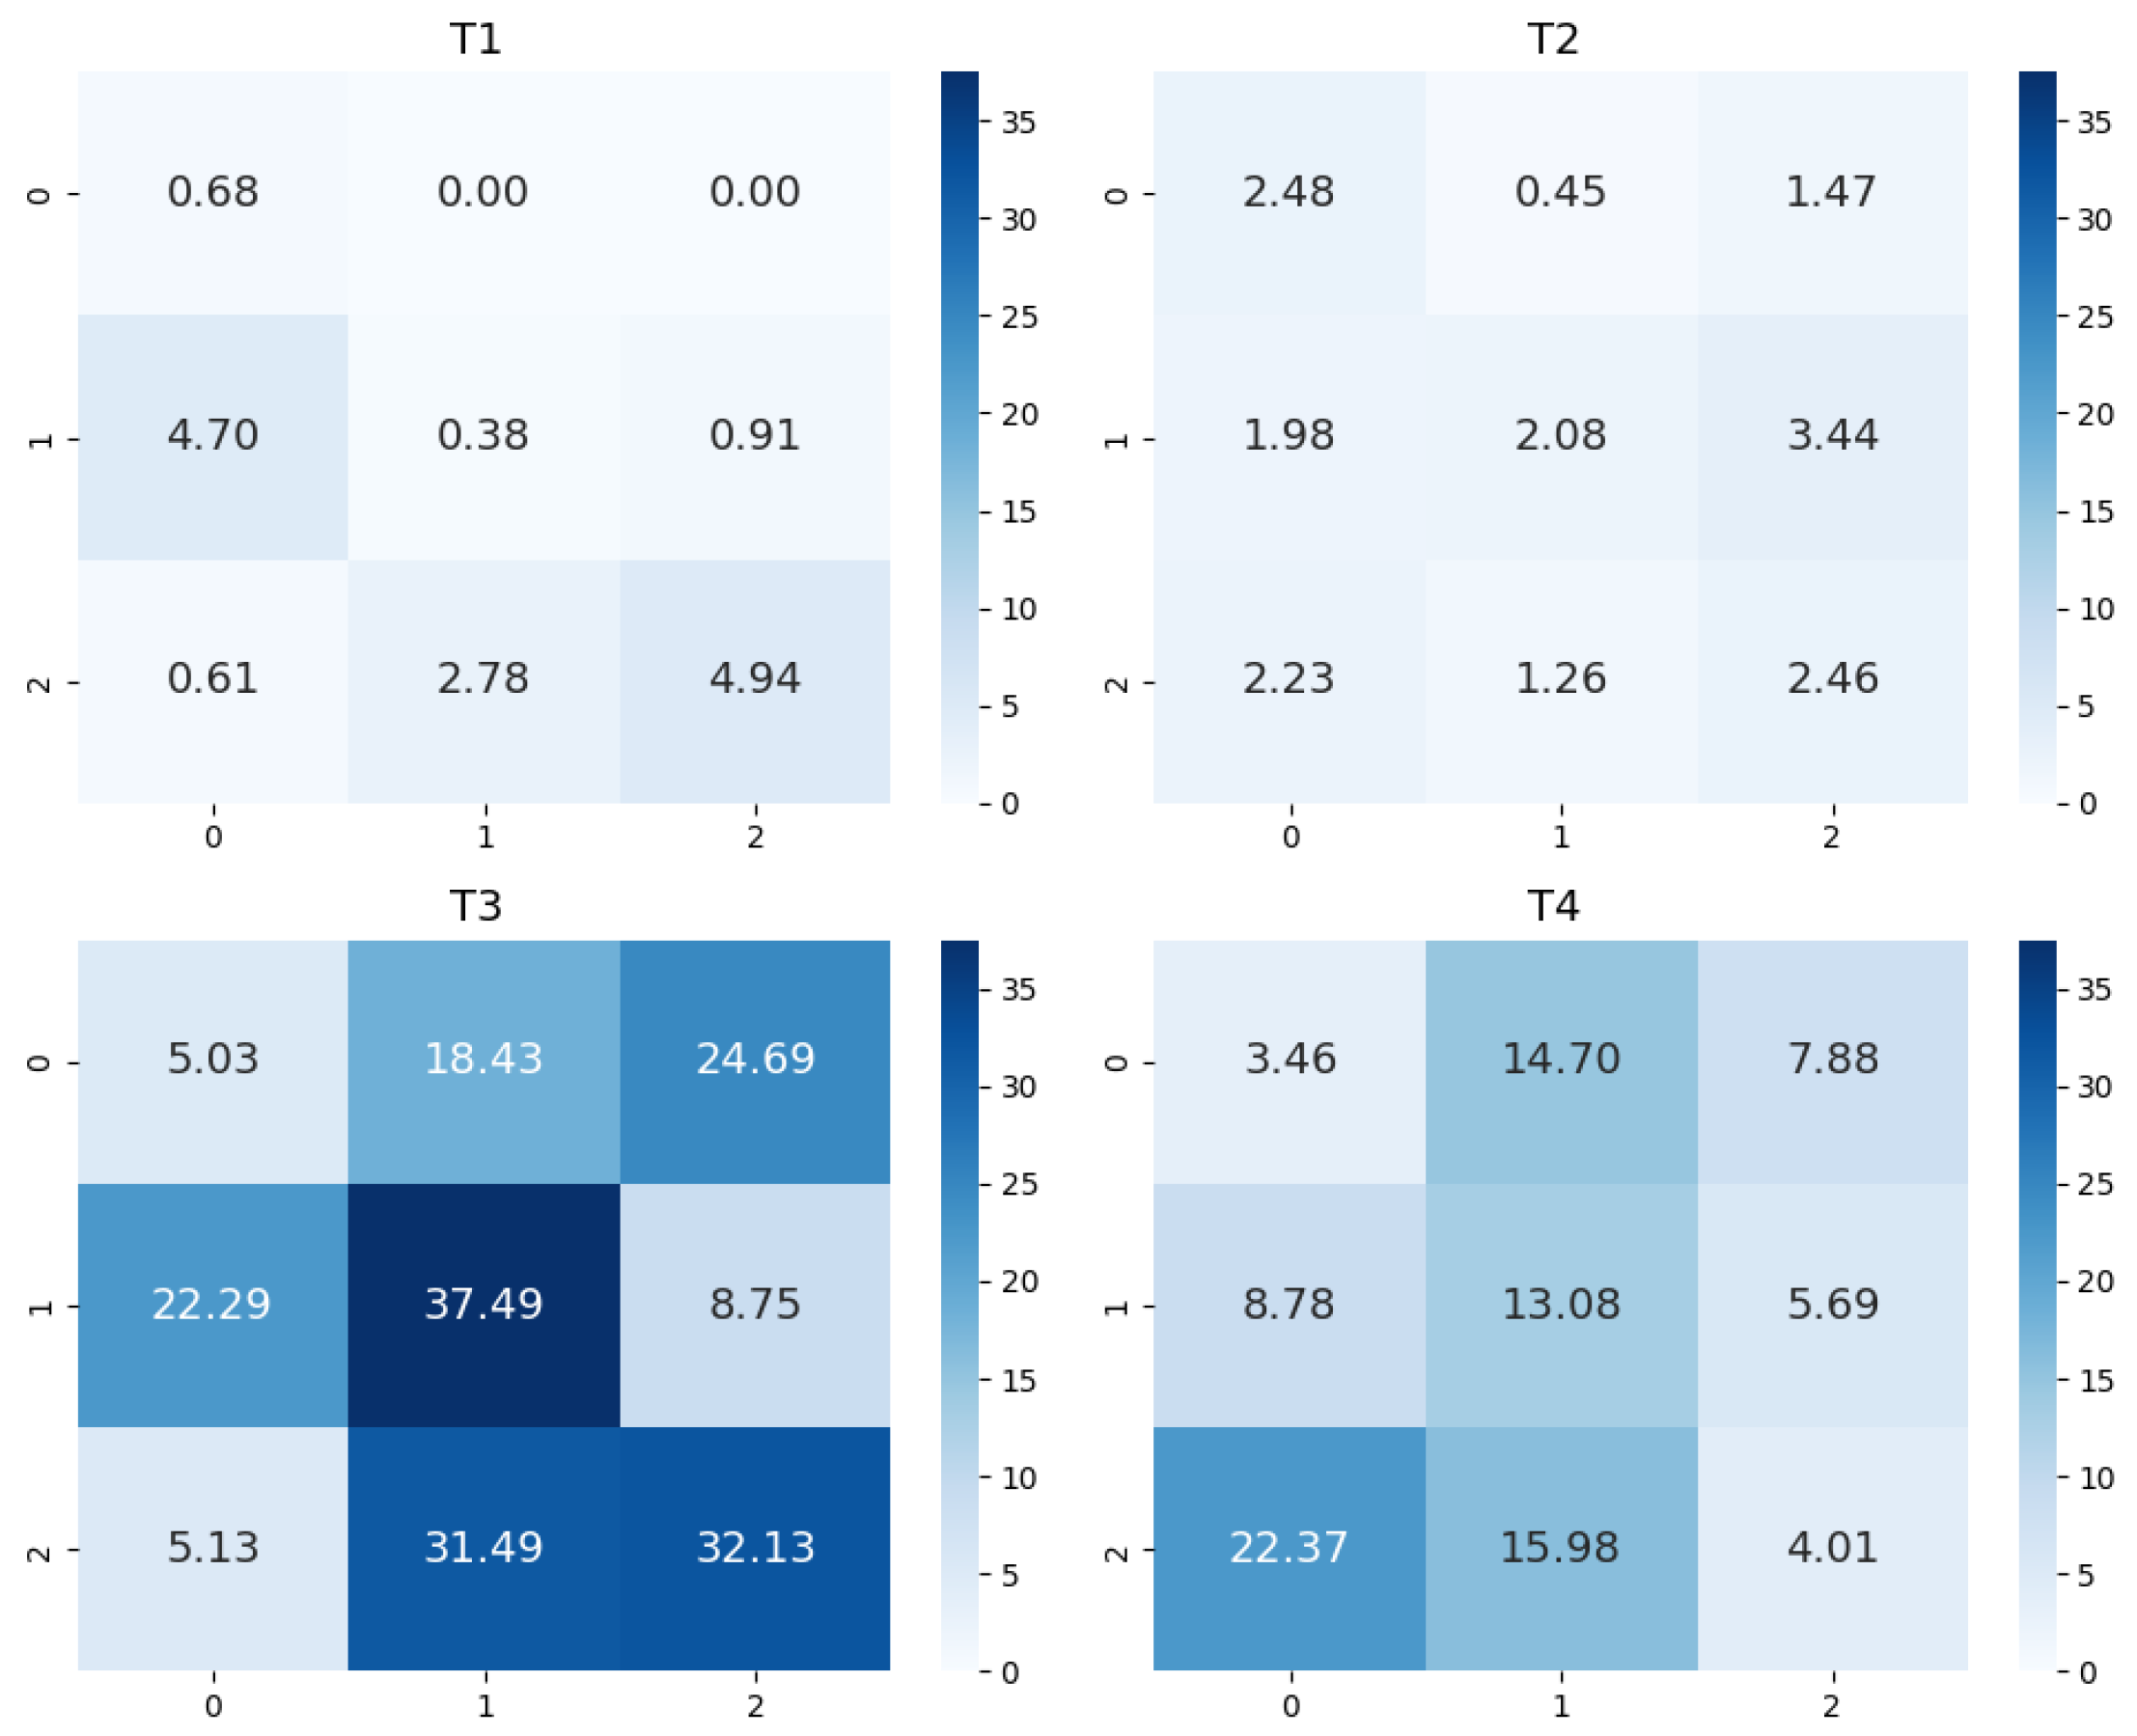
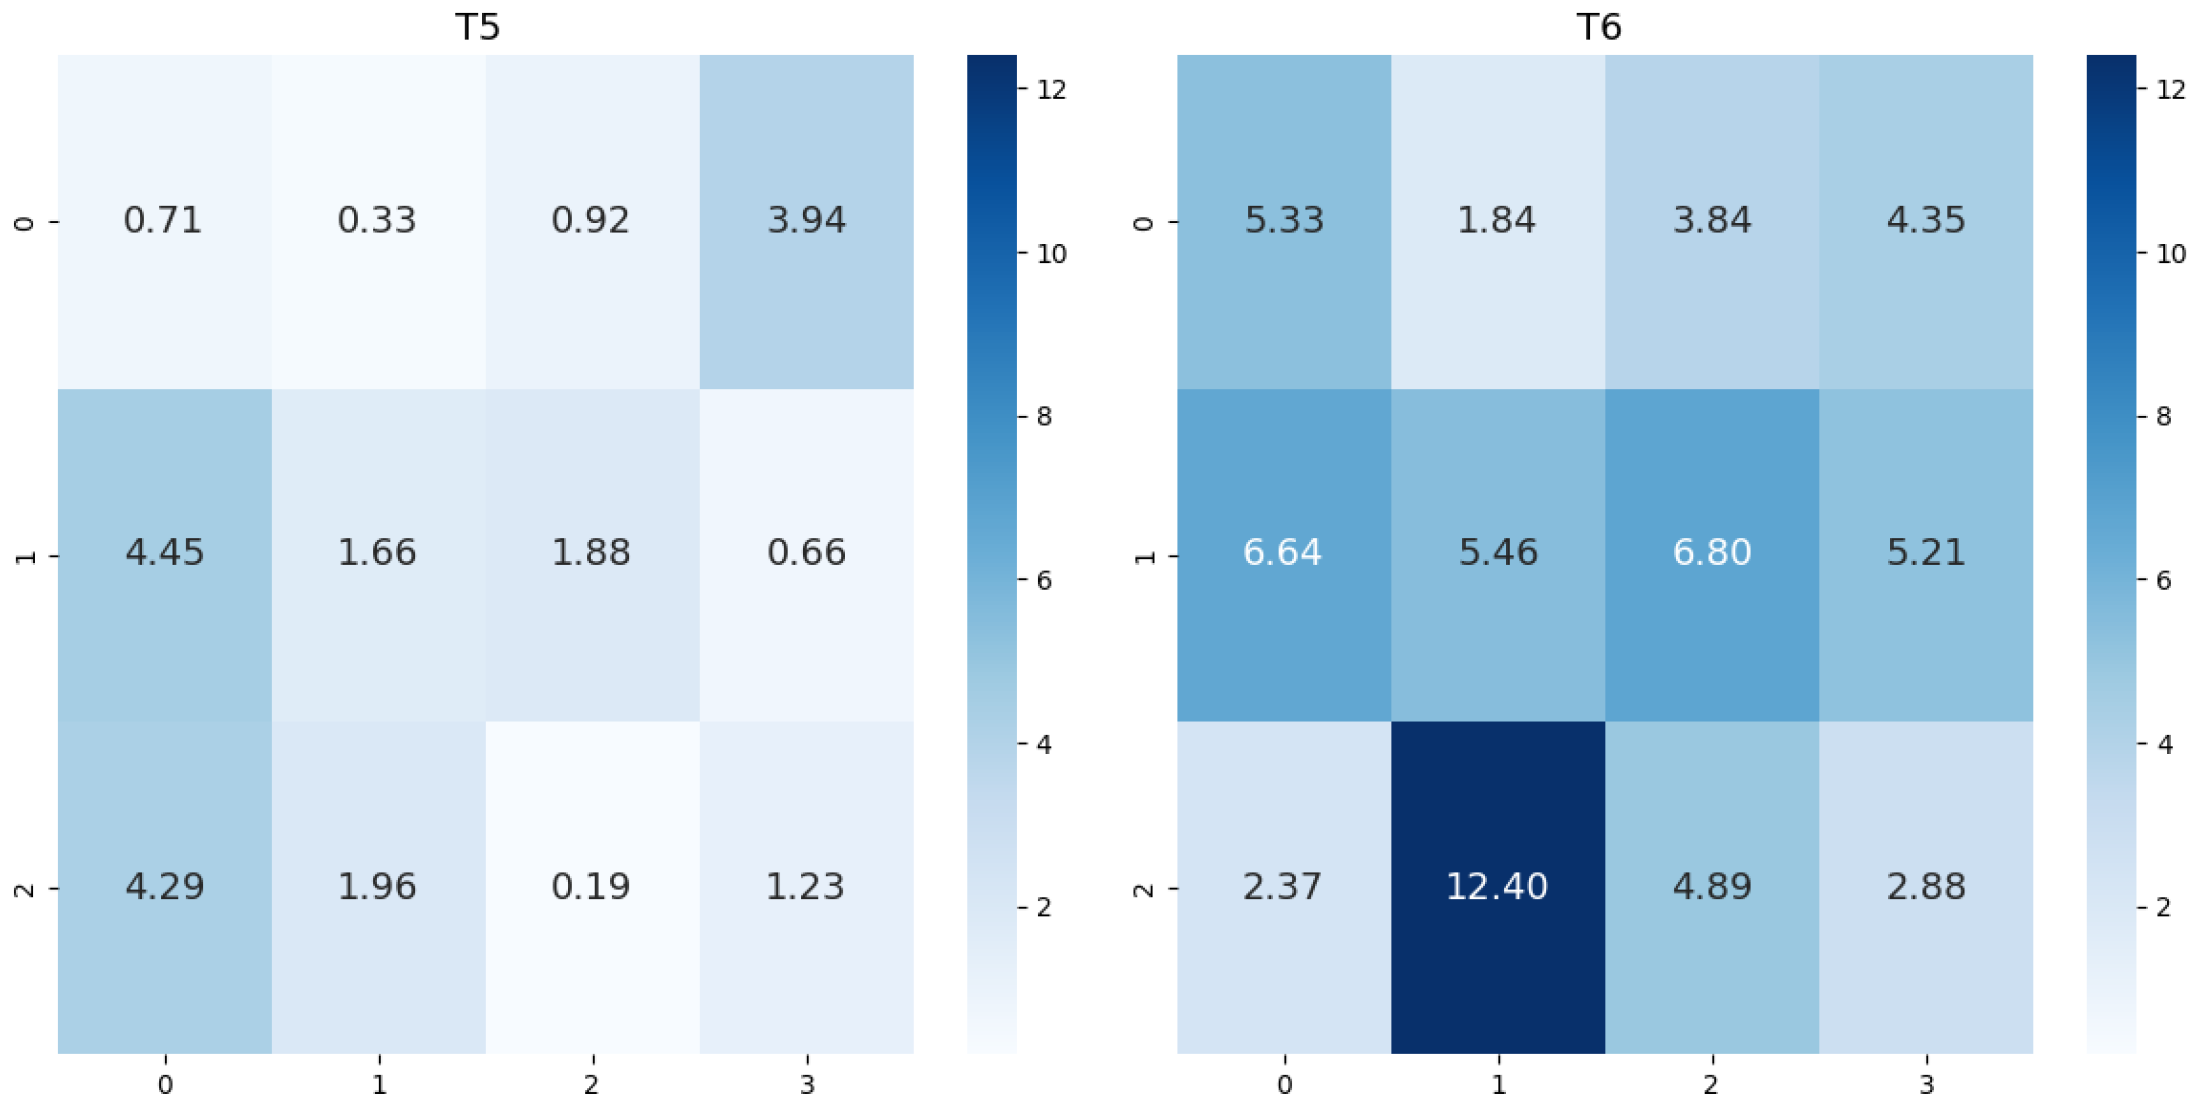
3.3. Spraying Effect Analysis

The results of the spraying test samples were compiled and summarized, yielding droplet coverage rates and ground deposition amounts for each tree, as shown in Table 8. The table lists the spray volume and the values recorded at sampling points under each treatment.
Experimental data for litchi and citrus show that volume-graded variable spraying significantly outperforms continuous spraying in droplet deposition targeting and controlling pesticide ground loss. Figure 12 presents the trends in droplet coverage rates for each treatment. In the experiment of litchi, variable-rate spraying treatments (T1, T2) adjusted pesticide volumes based on canopy volume, increasing application volume from 0.2 L to 1.6 L and corresponding canopy coverage rate from 3.87% to 14.47%, demonstrating precise dosage matching. Figure 13 shows that ground pesticide loss under variable spraying was significantly lower than that under continuous spraying. While continuous low-speed spraying (T3, 0.5 m/s) achieved 14.35% canopy coverage on large canopies, it resulted in ground deposition of 20.60 μg/cm2, indicating a significant loss. T2 achieved similar canopy coverage with 90.4% less ground deposition than T3, indicating that variable spraying can ensure droplet effectiveness while reducing loss.
The citrus trial further validated the universality of variable spraying. Treatment T5 achieved a maximum canopy coverage of 9.68% at 0.6 L, higher than T6’s maximum of 5.03%, with ground deposition only 1.85 μg/cm2—approximately 64.1% lower than T6 (5.16 μg/cm2) (Figure 14). Under T6 continuous spraying (2 m/s), canopy coverage fluctuated significantly (2.08∼5.03%), showing the limitations of fixed spraying parameters.

4. Discussion

The individual tree segmentation results based on LiDAR point clouds showed significant differences in canopy volume between litchi and citrus orchards, with a coefficient of variation of 70.37% for litchi and 41.2% for citrus, confirming high internal variability in tree growth within the orchards. The improved IPTD algorithm successfully obtained ground points and constructed the canopy height model. Combined with Gaussian-optimized seed points and the region growing algorithm, a total of 82 litchi and 73 citrus canopies were accurately extracted, with maximum canopy volumes of 96.35 m3 and 43.44 m3, respectively, demonstrating that the proposed 3D sensing workflow maintains robustness in both dense and sparse canopies, providing precise geometric input for differential spraying prescriptions.
The distributed multi-point application strategy improved the uniformity of droplet deposition in the litchi canopy through the reasonable configuration of application points, and its CV value decreased by 49.5% compared with that of the center application, which confirmed the potential of the distributed multi-point application strategy to regulate the canopy geometric mismatch problem. However, the experiment only verified the basic efficacy of the multi-point application strategy and has not yet systematically analyzed the effects of the distribution location of the application sites and the application height on the uniformity of droplet deposition. Follow-up studies need to combine the spatial heterogeneity of the branching structure of the litchi canopy to investigate the optimal application parameters further in order to improve the theoretical system of the precise regulation of variable application strategies.
Spraying tests showed that volume-graded variable spraying improved droplet targeting and significantly reduced pesticide ground loss. In the litchi trial, T2 achieved a maximum canopy coverage rate of 14.47% at a dosage of 1.6 L for large trees, while ground deposition was only 1.98 μg/cm2. In comparison, continuous low-speed spraying T3, with a similar coverage rate, resulted in 20.60 μg/cm2 of deposition. Variable spraying, thus, reduced pesticide loss by approximately 90.4%. Similar trends were observed in the citrus trial, where T5 resulted in only one-third of the ground loss of T6 while achieving better canopy coverage. Compared to Liu et al. [22], who reported a 58% reduction in ground loss using ground-based LiDAR variable spraying, this method further improves efficiency by combining UAV platforms with high-resolution 3D sensing.
The advantage of variable spraying lies in its deep coupling between spray parameters and 3D canopy phenotypes. The precise quantification of tree volume allows nozzle flow to match canopy capacity strictly, avoiding imbalances such as under-spraying for large canopies and over-spraying for small ones. Meanwhile, intermittent nozzle control significantly shortens the droplet release window, reducing secondary drift caused by rotor downwash. In orchards with low planting density or significant inter-row gaps, this strategy suppresses ground deposition and drift, improving deposition efficiency and enhancing adaptability and eco-friendliness across varied orchard structures.
Although this study validates the feasibility of the “3D sensing–prescription decision–precision execution” loop, limitations remain. The test wind speed was stable (0.3–1.2 m/s), insufficient to assess drift under strong wind conditions; offline processing of point clouds and prescriptions takes about 20 min/ha, limiting large-scale real-time operations; and under-segmentation still occurred in dense citrus areas. Moreover, the stop-and-spray strategy adopted in variable-rate spraying inevitably leads to increased energy consumption and longer operation times than continuous spraying. Although not quantified in this study, these factors are critical for evaluating the economic viability of UAV-based spraying in practical agricultural settings and warrant further investigation. Future work should focus on three areas: (1) integrating wind compensation and multi-sensor fusion to enable closed-loop control of nozzle flow and wind speed; (2) developing lightweight online point cloud parsing algorithms and edge computing frameworks to reduce data-decision latency and advance UAV variable spraying toward large-scale, intelligent deployment; and (3) optimizing spraying strategies to improve canopy coverage, particularly during critical crop growth stages such as flowering, in order to ensure effective pest and disease control.

5. Conclusions

This study established a complete workflow for individual tree variable-rate spraying in orchards based on canopy volume. The workflow utilizes an improved IPTD filtering method to obtain ground points, constructs a canopy height model, and combines Gaussian-optimized seed points with a region-growing algorithm to achieve the high-precision segmentation and volume grading of individual trees in citrus and litchi orchards, thereby generating differentiated spraying prescriptions.
A field experiment showed that the distributed multi-point application strategy improved the uniformity of fog droplet deposition in fruit trees with a maximum CV reduction of 49.5% compared to the center application; volume-graded variable-rate spraying strategies outperformed traditional continuous spraying in both droplet coverage rate and ground deposition control. In the litchi area, T2 achieved a maximum coverage rate of 14.47% for large canopies while reducing ground deposition from 20.60 μg/cm2 to 1.98 μg/cm2—a reduction of approximately 90.4%. In the citrus area, T5 increased coverage to 9.68% and reduced ground deposition from 5.16 μg/cm2 to 1.85 μg/cm2—a reduction of about 64.1%. These results demonstrate that the proposed method matches spray volume to canopy demand, enhances droplet targeting, and suppresses non-target losses.
In summary, the “3D sensing–prescription decision–precision execution” loop proposed in this study not only achieves efficient pesticide use and environmental friendliness in orchard plant protection but also provides a scalable technical path for modern precision spraying, offering significant value for improving operational efficiency and reducing chemical impacts on ecosystems.

Author Contributions

Conceptualization, P.C. and H.M.; Data curation, J.W.; Formal analysis, J.L. and H.L.; Funding acquisition, Y.L.; Investigation, H.M.; Methodology, P.C. and H.M.; software, H.M.; Project administration, P.C.; Resources, Y.L.; Supervision, P.C.; Validation, H.M., Z.C., and Z.L.; Writing—original draft, P.C. and H.M.; Writing—review and editing, H.M.; visualization, Y.W. All authors have read and agreed to the published version of the manuscript.

Funding

This research was funded by the Guangdong Basic and Applied Research Fund (2025A1515011063), the National Key Research and Development Plan Project (2023YFD2000200), and the ‘111 Center’ (D18019).

Institutional Review Board Statement

Not applicable.

Data Availability Statement

The data presented in this study are available upon request from the corresponding author.

Conflicts of Interest

The authors declare no conflicts of interest.

References

  1. Tudi, M.; Daniel Ruan, H.; Wang, L.; Lyu, J.; Sadler, R.; Connell, D.; Chu, C.; Phung, D.T. Agriculture Development, Pesticide Application and Its Impact on the Environment. Int. J. Environ. Res. Public Health 2021, 18, 1112. [Google Scholar] [CrossRef] [PubMed]
  2. Dou, H.; Zhai, C.; Chen, L.; Wang, X.; Zou, W. Comparison of orchard target-oriented spraying systems using photoelectric or ultrasonic sensors. Agriculture 2021, 11, 753. [Google Scholar] [CrossRef]
  3. Wang, B.; Yan, Y.; Zhao, J.; Kaousar, R.; Lan, Y. Status and prospect of the application of UAV remote sensing technology in smart orchard management. Crop Prot. 2025, 195, 107240. [Google Scholar] [CrossRef]
  4. Wang, G.; Han, Y.; Li, X.; Andaloro, J.; Chen, P.; Hoffmann, W.C.; Han, X.; Chen, S.; Lan, Y. Field evaluation of spray drift and environmental impact using an agricultural unmanned aerial vehicle (UAV) sprayer. Sci. Total Environ. 2020, 737, 139793. [Google Scholar] [CrossRef]
  5. Liu, Q.; Ding, M.; Zhang, H.; Wu, L.; Zhang, L.; Bao, H.; Lan, Y. Optimization of Flight Mode and Coupling Analysis of Operational Parameters on Droplet Deposition and Drift of Unmanned Aerial Spraying Systems (UASS). Agronomy 2025, 15, 367. [Google Scholar] [CrossRef]
  6. Taseer, A.; Han, X. Advancements in variable rate spraying for precise spray requirements in precision agriculture using Unmanned aerial spraying Systems: A review. Comput. Electron. Agric. 2024, 219, 108841. [Google Scholar] [CrossRef]
  7. Gu, C.; Wang, X.; Wang, X.; Yang, F.; Zhai, C. Research progress on variable-rate spraying technology in orchards. Appl. Eng. Agric. 2020, 36, 927–942. [Google Scholar] [CrossRef]
  8. Qiu, B.; Yan, R.; Ma, J.; Guan, X.; Ou, M. Research Progress Analysis of Variable Rate Sprayer Technology. Trans. Chin. Soc. Agric. Mach. 2015, 46, 59. [Google Scholar] [CrossRef]
  9. Jiao, Y.; Zhang, S.; Jin, Y.; Cui, L.; Chang, C.; Ding, S.; Sun, Z.; Xue, X. Research Progress on Intelligent Variable-Rate Spray Technology for Precision Agriculture. Agronomy 2025, 15, 1431. [Google Scholar] [CrossRef]
  10. Dou, H.; Zhai, C.; Wang, X.; Zou, W.; Li, Q.; Chen, L. Design and experiment of the orchard target variable spraying control system based on LiDAR. Trans. Chin. Soc. Agric. Eng. 2022, 38, 11–21. [Google Scholar] [CrossRef]
  11. Zheng, Y.; Jiang, S.; Chen, B.; Lü, H.; Wan, C.; Kang, F. Review on Technology and Equipment of Mechanization in Hilly Orchard. Trans. Chin. Soc. Agric. Mach. 2020, 51, 1–20. [Google Scholar] [CrossRef]
  12. Yan, Y.; Lan, Y.; Wang, G.; Hussain, M.; Wang, H.; Yu, X.; Shan, C.; Wang, B.; Song, C. Evaluation of the deposition and distribution of spray droplets in citrus orchards by plant protection drones. Front. Plant Sci. 2023, 14, 1303669. [Google Scholar] [CrossRef] [PubMed]
  13. Zhan, Y.; Chen, P.; Xu, W.; Chen, S.; Han, Y.; Lan, Y.; Wang, G. Influence of the downwash airflow distribution characteristics of a plant protection UAV on spray deposit distribution. Biosyst. Eng. 2022, 216, 32–45. [Google Scholar] [CrossRef]
  14. Chen, P.; Douzals, J.P.; Lan, Y.; Cotteux, E.; Delpuech, X.; Pouxviel, G.; Zhan, Y. Characteristics of unmanned aerial spraying systems and related spray drift: A review. Front. Plant Sci. 2022, 13, 870956. [Google Scholar] [CrossRef]
  15. Nahiyoon, S.A.; Ren, Z.; Wei, P.; Li, X.; Li, X.; Xu, J.; Yan, X.; Yuan, H. Recent Development Trends in Plant Protection UAVs: A Journey from Conventional Practices to Cutting-Edge Technologies—A Comprehensive Review. Drones 2024, 8, 457. [Google Scholar] [CrossRef]
  16. Qi, H.; Zhou, J.; Li, C.; Chen, P.; Liang, Y.; Huang, G.; Zou, J. Feasibility of variable rate spraying of centrifugal UAV using network RTK. Trans. Chin. Soc. Agric. Eng. 2021, 37, 81–89. [Google Scholar] [CrossRef]
  17. Wen, S.; Zhang, Q.; Deng, J.; Lan, Y.; Yin, X.; Shan, J. Design and experiment of a variable spray system for unmanned aerial vehicles based on PID and PWM control. Appl. Sci. 2018, 8, 2482. [Google Scholar] [CrossRef]
  18. Wang, L.; Lan, Y.; Yue, X.; Ling, K.; Cen, Z.; Cheng, Z.; Liu, Y.; Wang, J. Vision-based adaptive variable rate spraying approach for unmanned aerial vehicles. Int. J. Agric. Biol. Eng. 2019, 12, 18–26. [Google Scholar] [CrossRef]
  19. Chen, P.; Xu, W.; Zhan, Y.; Wang, G.; Yang, W.; Lan, Y. Determining application volume of unmanned aerial spraying systems for cotton defoliation using remote sensing images. Comput. Electron. Agric. 2022, 196, 106912. [Google Scholar] [CrossRef]
  20. Maghsoudi, H.; Minaei, S.; Ghobadian, B.; Masoudi, H. Ultrasonic sensing of pistachio canopy for low-volume precision spraying. Comput. Electron. Agric. 2015, 112, 149–160. [Google Scholar] [CrossRef]
  21. Gil, E.; Llorens, J.; Llop, J.; Fàbregas, X.; Escolà, A.; Rosell-Polo, J. Variable rate sprayer. Part 2–Vineyard prototype: Design, implementation, and validation. Comput. Electron. Agric. 2013, 95, 136–150. [Google Scholar] [CrossRef]
  22. Liu, L.; Liu, Y.; He, X.; Liu, W. Precision variable-rate spraying robot by using single 3D LIDAR in orchards. Agronomy 2022, 12, 2509. [Google Scholar] [CrossRef]
  23. Luo, S.; Wen, S.; Zhang, L.; Lan, Y.; Chen, X. Extraction of crop canopy features and decision-making for variable spraying based on unmanned aerial vehicle LiDAR data. Comput. Electron. Agric. 2024, 224, 109197. [Google Scholar] [CrossRef]
  24. Guo, N.; Xu, N.; Kang, J.; Zhang, G.; Meng, Q.; Niu, M.; Wu, W.; Zhang, X. A Study on Canopy Volume Measurement Model for Fruit Tree Application Based on LiDAR Point Cloud. Agriculture 2025, 15, 130. [Google Scholar] [CrossRef]
  25. Zhao, X.; Guo, Q.; Su, Y.; Xue, B. Improved progressive TIN densification filtering algorithm for airborne LiDAR data in forested areas. ISPRS J. Photogramm. Remote Sens. 2016, 117, 79–91. [Google Scholar] [CrossRef]
  26. Wang, S.; Ji, J.; Zhao, L.; Li, J.; Zhang, M.; Li, S. Canopy Segmentation of Overlapping Fruit Trees Based on Unmanned Aerial Vehicle LiDAR. Agriculture 2025, 15, 295. [Google Scholar] [CrossRef]
  27. Nurunnabi, A.; West, G.; Belton, D. Robust Locally Weighted Regression Techniques for Ground Surface Points Filtering in Mobile Laser Scanning Three Dimensional Point Cloud Data. IEEE Trans. Geosci. Remote Sens. 2016, 54, 2181–2193. [Google Scholar] [CrossRef]
  28. Axelsson, P. DEM generation from laser scanner data using adaptive TIN models. Int. Arch. Photogramm. Remote Sens. 2000, 33, 110–117. [Google Scholar]
  29. Li, W.; Guo, Q.; Jakubowski, M.K.; Kelly, M. A new method for segmenting individual trees from the lidar point cloud. Photogramm. Eng. Remote Sens. 2012, 78, 75–84. [Google Scholar] [CrossRef]
  30. Zhu, H.; Salyani, M.; Fox, R.D. A portable scanning system for evaluation of spray deposit distribution. Comput. Electron. Agric. 2011, 76, 38–43. [Google Scholar] [CrossRef]
  31. ISO 24253-1:2015; Crop Protection Equipment—Spray Deposition Test for Field Crop. International Organization for Standardization: Geneva, Switzerland, 2015.
Figure 1. Flowchart of overall work.
Agriculture 15 01374 g001
Figure 2. The location of the study area.
Agriculture 15 01374 g002
Figure 3. Experimental equipment. (a) DJI M300 RTK. (b) Zenmuse L1. (c) DJI Matrice 3M. (d) DJI T30.
Agriculture 15 01374 g003
Figure 4. Flow chart of point cloud processing.
Agriculture 15 01374 g004
Figure 5. Before denoising.
Agriculture 15 01374 g005
Figure 6. After denoising.
Agriculture 15 01374 g006
Figure 7. Terrain and vegetation modeling. (a) DSM. (b) DEM. (c) CHM.
Agriculture 15 01374 g007
Figure 8. Flowchart of flight route planning.
Agriculture 15 01374 g008
Figure 9. Comparison of continuous and variable-rate spraying.
Agriculture 15 01374 g009
Figure 10. Comparison of center and multi-point application.
Agriculture 15 01374 g010
Figure 11. Droplet sampling point arrangement.
Agriculture 15 01374 g011
Figure 12. Droplet coverage line graph. (a) Droplet coverage line graph of litchi. (b) Droplet coverage line graph of citrus.
Agriculture 15 01374 g012
Figure 13. Thermogram of deposition of litchi spray for each treatment.
Agriculture 15 01374 g013
Figure 14. Thermogram of deposition of citrus spray for each treatment.
Agriculture 15 01374 g014
Table 1. Information of the equipment used in the experiment.
EquipmentItemParameter
DJI T30Total weight36.5 kg
Maximum spraying takeoff weight66.5 kg
Maximum motor power3600 W/rotor
Nozzle modelSX11001VS
Atomized particle size130–250 μm
Maximum spray volume7.2 L/min
DJI M300 RTKTotal weight6.3 kg
Maximum takeoff weight9 kg
RTK position accuracyVertical 1 cm + 1 ppm
Horizontal 1.5 cm + 1 ppm
Zenmuse L1Image sensor1 inch
Effective pixels20 MP
Lens parameters8.8 mm / 24 mm
FOV95°
Aperturef/2.8–f/11
Digitization footprint520 MB/ha
DJI Matrice 3MTotal weight951 g
Image sensor4/3 CMOS
Effective pixels20 MP
Lens parameters24 mm
Aperturef/2.8–f/11
FOV84°
Table 2. Classification standard for differential spraying levels.
Canopy Volume
(m3)
Tree SpeciesSpray
Level
CitrusLitchi
x x 20 m 3 x 25 m 3 I
20 m 3 x 30 m 3 25 m 3 x 50 m 3 II
x 30 m 3 50 m 3 x 75 m 3 III
x 75 m 3 IV
Table 3. UASS spraying operational parameters.
TreatmentTree SpeciesSpray TypeFlight ParametersSpray Rate
T1LitchiVariable spray1 m/s0.2 L/level
T2Variable spray1 m/s0.4 L/level
T3Continuous spray0.5 m/s5.4 L/min
T4Continuous spray1 m/s5.4 L/min
T5CitrusVariable spray1 m/s0.2 L/level
T6Continuous spray2 m/s5.4 L/min
The unit “L/level” denotes the incremental spray volume associated with each spray rate level.
Table 4. Individual tree segmentation results.
Tree SpeciesMinimum (m3)Maximum (m3)Mean ± SD (m3)Coefficient of Variation
Citrus6.2643.4422.15 ± 9.1241.20%
Litchi10.7996.3535.72 ± 25.1370.37%
Table 5. Distribution of tree canopy volumes.
Tree SpeciesClassVolume Range (m3)Sample CountProportion (%)Mean ± SD (m3)
LitchiI x 25 3447.2 18.6 ± 5.2
II 25 < x 50 2838.9 36.8 ± 7.1
III 50 < x 75 1216.7 61.4 ± 6.9
IV x 75 68.3 85.2 ± 8.7
CitrusI x 20 3041.1 13.6 ± 4.3
II 20 < x 30 2737.0 25.0 ± 2.9
III x 30 1621.9 35.5 ± 3.8
Table 6. Individual segmented canopy volumes at sampling points.
Tree SpeciesTree IDCanopy Volume (m3)Class
Litchi144.3II
291.6IV
356.9III
413.9I
Citrus136.5III
225.3II
318.1I
424.0II
533.7III
618.2I
Table 7. Uniformity of droplet distribution in litchi canopy.
Tree IDApplication Rate (L)CV (%)
Center ApplicationMulti-Point Application
11.2162.9195.32
2181.4898.15
3160.67102.74
478.9088.93
11.0181.81103.67
2193.7197.84
3156.73105.21
494.6892.45
10.8152.68107.39
2198.63112.56
3143.2398.77
4107.13104.82
Table 8. Droplet deposition metrics for different treatments.
TreatmentTree IDApplication ParameterCoverage (%)Ground Deposition (μg/cm2)
T110.4 L 4.71 ± 0.24 a 1.67 ± 1.96 c
20.8 L 8.23 ± 0.29 a
30.6 L 5.35 ± 0.32 b
40.2 L 3.87 ± 0.34 d
T210.8 L 8.18 ± 0.50 c 1.98 ± 0.85 c
21.6 L 14.47 ± 1.46 a
31.2 L 10.29 ± 0.70 b
40.4 L 4.92 ± 0.79 d
T31Flight speed
0.5 m/s
6.41 ± 0.77 b 20.60 ± 12.16 a
2 14.35 ± 1.77 a
3 6.07 ± 0.61 b
4 6.66 ± 0.89 b
T41Flight speed
1.0 m/s
4.43 ± 0.49 b 10.66 ± 6.32 b
2 8.16 ± 0.91 a
3 3.12 ± 0.38 c
4 4.30 ± 0.43 b
T510.6 L 9.68 ± 1.06 a 1.85 ± 1.54 c
20.4 L 5.95 ± 0.72 b
30.2 L 3.45 ± 0.42 c
40.4 L 5.33 ± 0.67 b
50.6 L 8.72 ± 0.74 a
60.2 L 2.99 ± 0.36 d
T61Flight speed
2.0 m/s
3.67 ± 0.42 c 5.16 ± 2.76 b
2 5.03 ± 0.62 b
3 4.28 ± 0.55 b
4 2.08 ± 0.17 c
5 3.90 ± 0.50 b
6 3.91 ± 0.52 b
Different letters within the same treatment denote no significant difference (p < 0.05, Duncan’s test).
Disclaimer/Publisher’s Note: The statements, opinions and data contained in all publications are solely those of the individual author(s) and contributor(s) and not of MDPI and/or the editor(s). MDPI and/or the editor(s) disclaim responsibility for any injury to people or property resulting from any ideas, methods, instructions or products referred to in the content.

