Article

Methods for Constructing Soil Dynamic Models Under Intelligent Cultivation: Dynamic Interaction Mechanisms Between Farming Tools with Complex Structures and Soil

1
College of Engineering Technology, Jilin Agricultural University, Changchun 130118, China
2
Key Laboratory of Bionic Engineering (Ministry of Education), College of Biological and Agricultural Engineering, Jilin University, Changchun 130022, China
3
School of Mechanical and Vehicle Engineering, Changchun University, Changchun 130022, China
*
Author to whom correspondence should be addressed.
Agriculture 2025, 15(13), 1355; https://doi.org/10.3390/agriculture15131355
Submission received: 20 April 2025 / Revised: 19 June 2025 / Accepted: 23 June 2025 / Published: 25 June 2025
(This article belongs to the Section Agricultural Technology)

Abstract

A new method for finite element simulation analysis of the interaction between complex structured tillage implements and soil was established in this study. This method accurately analyzes soil fragmentation during subsoiling using tillage tools with complex structures. It also accurately reflects the force on bionic subsoilers during cultivation, the interaction law between the subsoiler and the soil, and the impact of subsoiling operations on the soil properties. Bionic subsoilers were introduced to establish a dynamic analysis model for subsoiling cultivation. The novelty lies in introducing bionic subsoilers inspired by mole claws to reduce draft force and optimize soil failure patterns. Experiments have shown that compared with standard subsoilers, the stress distribution of the bionic subsoiler-H is significantly reduced, with a maximum stress reduction of 52.96%. The stress distribution of the subsoilers after subsoiling cultivation was directly proportional to the wear of the subsoiler, and the draft force of the subsoiler was inversely proportional to the size of the soil block at the front of the subsoiler. Compared with the soil model with a plough layer, the average stress values of the standard subsoiler, bionic subsoiler-H, and bionic subsoiler-C in the models without a plough pan layer were reduced by 13.97%, 6.67%, and 7.1% lower, respectively. Abaqus finite element analysis could not only effectively reflect the actual situation of soil in the field, but also accurately simulate and analyze the effect of soil fragmentation in the subsoiling process via tillage tools with complex structures, providing a digital analysis foundation for the collection of intelligent tillage information.

1. Introduction

With the gradual popularization of intelligent and unmanned agricultural planting, multisource data fusion and analysis of soil status have led farmers to pay more attention to the “transparency” of soil [1], that is, to understand the changes in soil performance parameters in a timely manner, to perform corresponding operations on farmland according to the precise soil status, and realize “treatment with disease” of the soil. While intelligent agriculture demands precise soil management, the dynamic interaction between complex structured tillage tools and soil remains underexplored, particularly regarding soil fragmentation and stress distribution. The development of computer technology and related simulation software has made the simulation of tillage components of agricultural machinery increasingly realistic with respect to the dynamic changes in farmland [2], which provides a new solution for intelligent soil analysis and monitoring.
In the process of soil cultivation, the actual forms have more complex characteristics than other metals and nonmetals do, including the yield, fracture, and flow deformation processes of the soil, making the distribution of stress and strain a nonlinear materials problem. Among them, the accuracy of the finite element method (FEM) in predicting the interaction force between a plough and the soil in agricultural machinery applications has also been confirmed and recognized by many researchers. They used the FEM to simulate the cutting process of soil by subsoiling, confirming that the established FEM can be used to design new tillage tools suitable for various soil types. Ibrahmi et al. [3] (2015a) studied the effects of tool geometry and operational conditions on mouldboard plough forces and energy requirements via the FEM, which revealed a second-order polynomial relationship between the draft force and depth, and a linear relationship between the vertical and lateral forces and depth.
The FEM can be used to understand the effects of different plate plough designs and soil conditions on the tillage force, energy consumption, and soil quality inversion. Patuk et al. [4] (2020) used the FEM to design and simulate subsoiling fertilization machines, which can provide theoretical and technical support for selecting the best material performance and improving safety factors for agricultural tool design. However, in the use of finite element analysis, researchers have mainly focused on the stress of tillage parts during tillage, but few studies have investigated the relationship between soil damage and subsoiler stress, especially the relationship between soil fragmentation and tillage part stress during tillage using complex tillage parts. Based on these findings, the relationship between soil fragmentation and subsoiler stress was analyzed in the process of subsoiling shovel tillage with complex structures, which is difficult to analyze via classical mechanics. This study establishes a FEM to simulate the dynamic interactions between bionic subsoilers and soil, addressing the limitations of classical mechanics in analyzing nonlinear soil failure and optimizing tillage efficiency.
The widespread application of intelligent agricultural machinery and equipment has gradually thickened the plough pan layer and increased the area of the field. The purpose of subsoiling is to break the soil plough pan layer, improve the structure of the soil plough pan layer, and reduce soil turnover as much as possible without breaking the original structure of the soil plough pan layer. Therefore, with the gradual increase in the proportion of intelligent agricultural machinery and equipment, subsoiling tillage occupies a core position in current conservation tillage and has developed with the rapid advancement of intelligent agriculture and conservation tillage. The optimal subsoiler design plays an important role in reducing the energy consumption of subsoiling operations due to the characteristics of subsoiling operations, such as large tillage depths and the need for solid and high-tillage soil to break the plough soil [5,6,7]. In this study, the finite element software was used to establish a force model of the complex tillage tools and the soil fragmentation during subsoiling operations. A soil failure model at the front of the bionic subsoiler was used to simulate the fragmentation state of the soil block and analyze the correlation between the subsoiler draft force and the soil block at the front of the subsoiler. The use of a subsoiler with a crushing effect guides the design of tillage components.
Abaqus finite element analysis software was used in this work to establish a practical soil tillage model and to study and analyze the stress situation of the soil and subsoil in standard double-wing crank subsoilers and bionic subsoiler subsoiling tillage. The interaction characteristics between the subsoiler and soil, the influence of subsoiling operations on soil properties, and the main differences between the simulated data and actual tillage data are compared and analyzed, and the accuracy and feasibility of simulating and analyzing the impact of subsoiling operations on the spatial structure of the soil rather than actual measurements are explored.

2. Materials and Methods

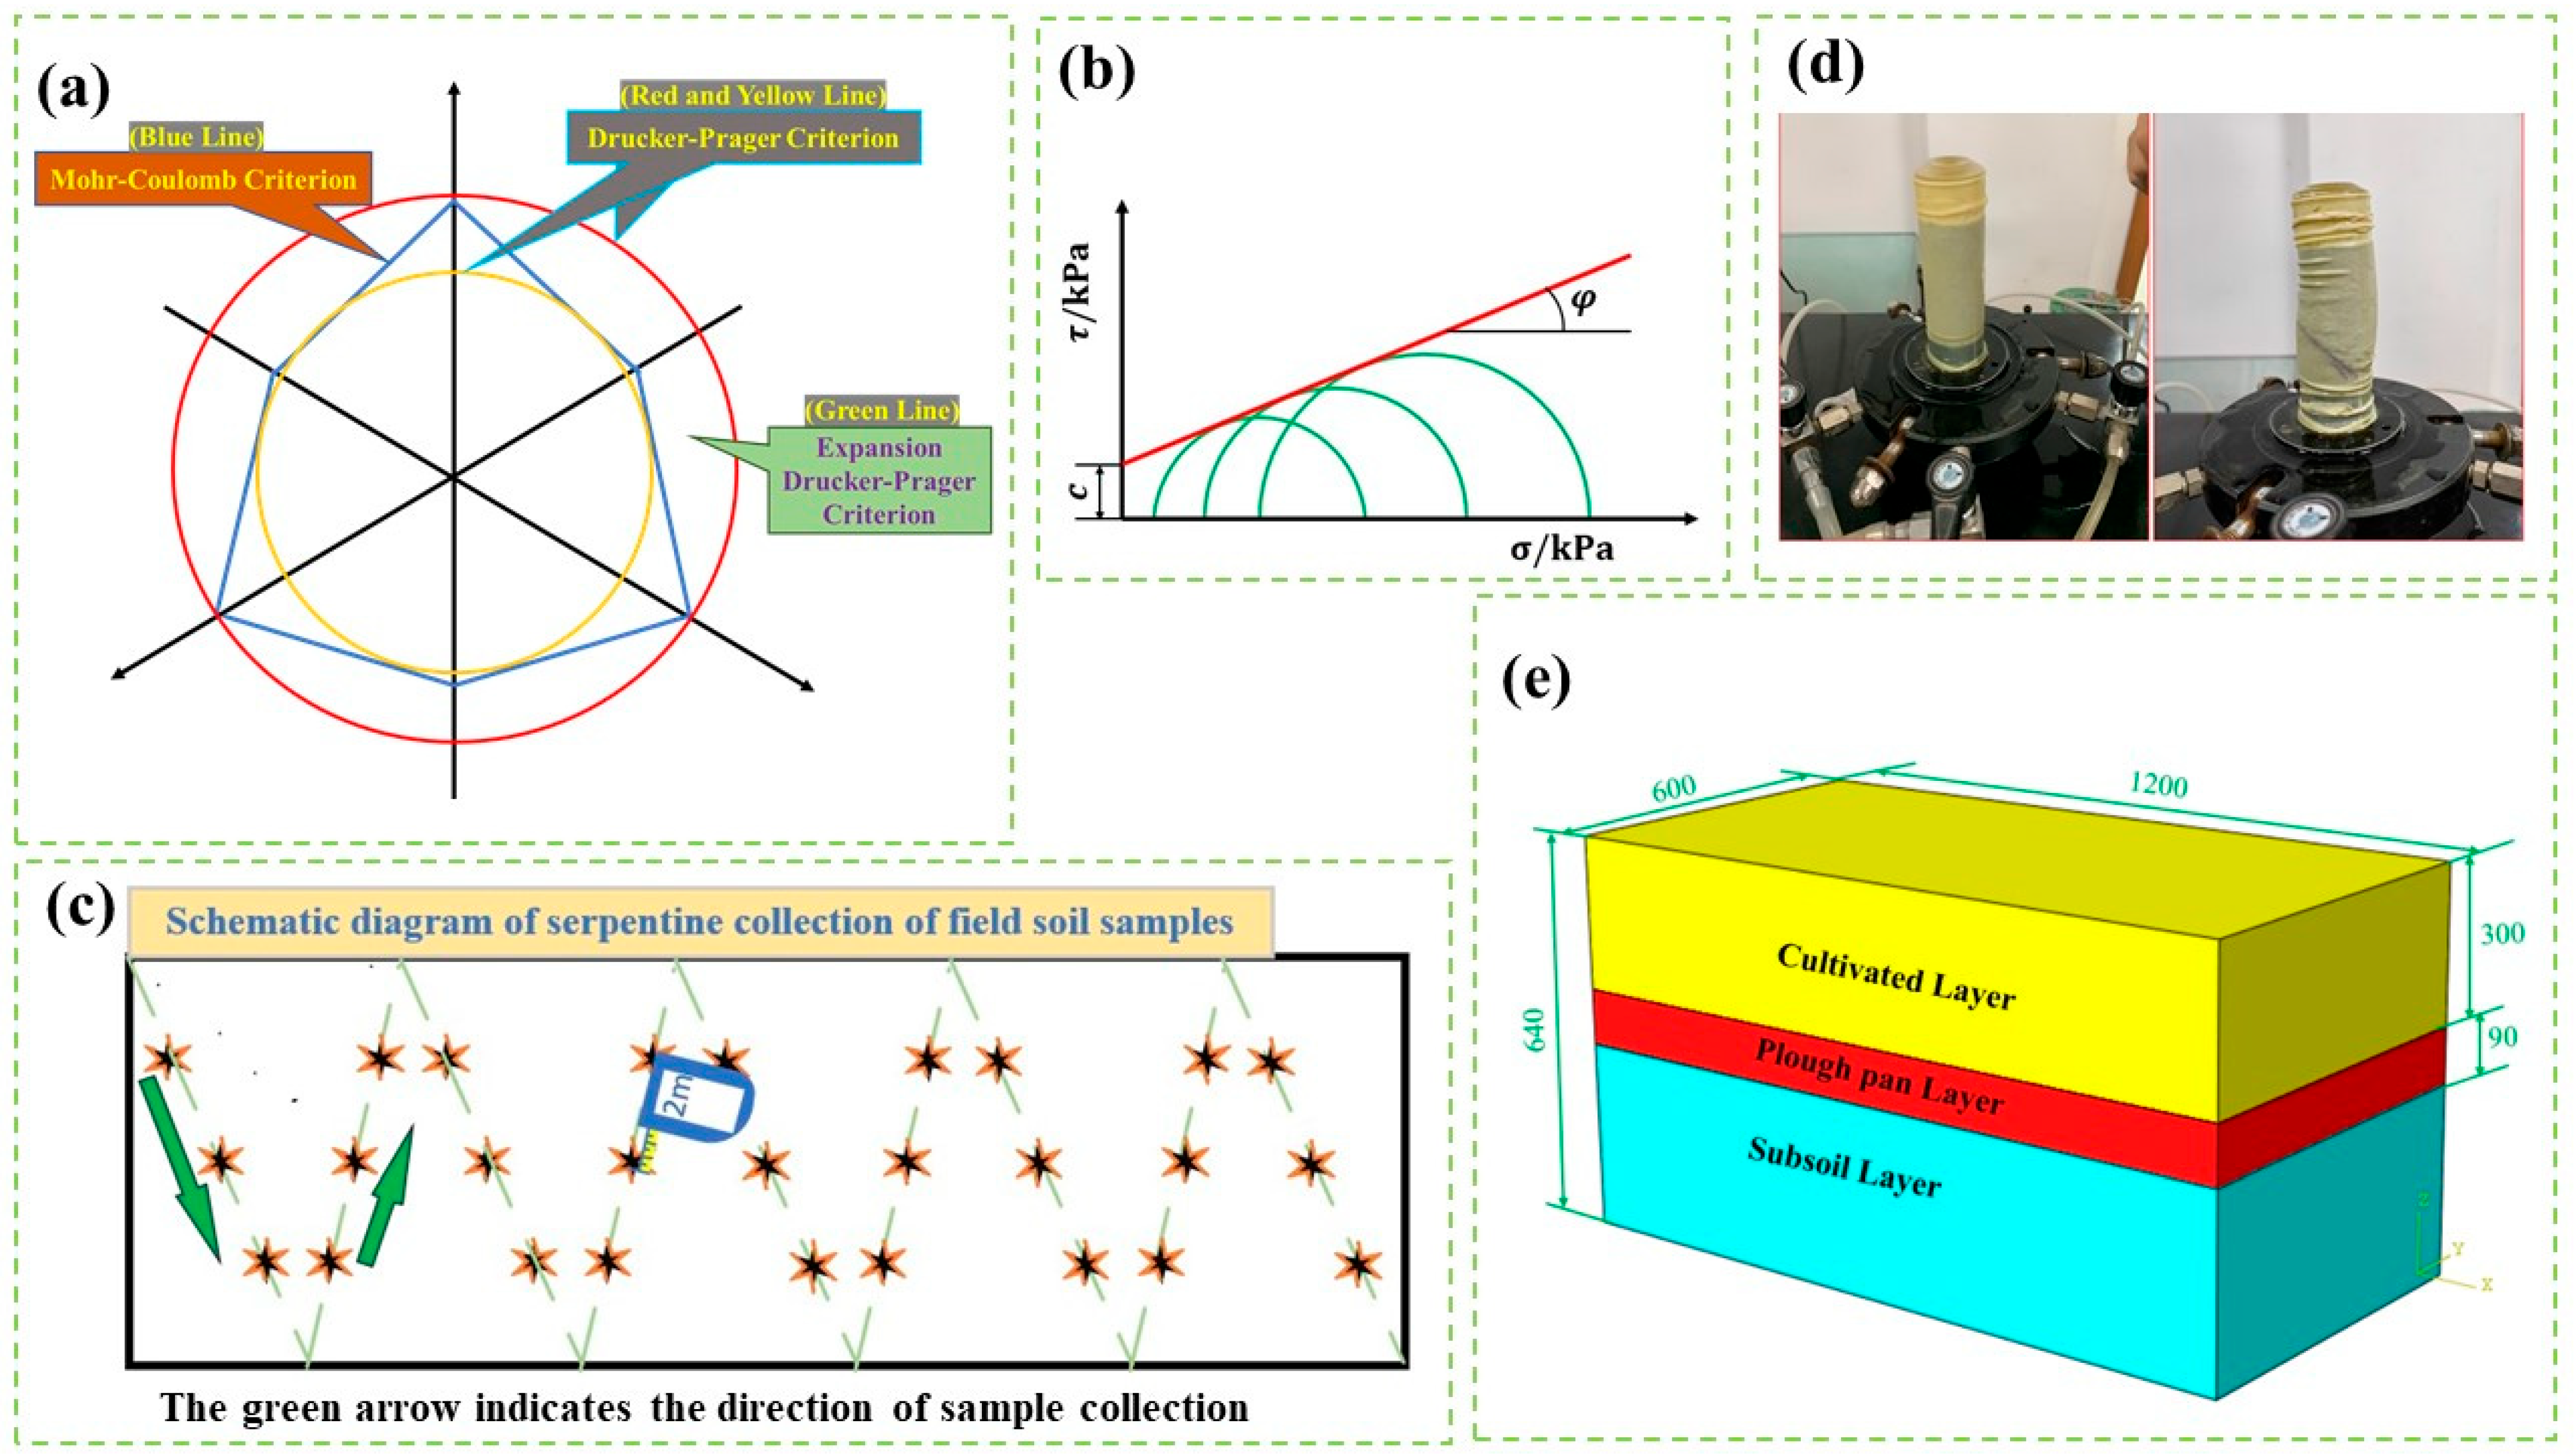
2.1. Establishment of Soil Constitutive Models

2.1.1. Mohr–Coulomb (M-C) Yield Criteria

With the rapid improvement in computer CPU computing power, Abaqus finite element software can incorporate more comprehensive contact models and soil properties in simulating soil cultivation processes, making the simulation results closer to the real situation. The trenching component model was simulated via Abaqus finite element analysis software [8], and the error between the simulation results and the measured results of the soil tank was less than 7%. Finite element analysis of the farming component soil contact system allows for the selection of appropriate soil constitutive models based on the actual conditions, assigning different parameter attributes to different soil layers, and coupling them to verify grid division, load loading, and analysis of step motion loading, achieving a model that reflects the real situation.
The field experiment in this study was conducted in Taojiatun (124.997° E, 43.661° N), Gongzhuling City, Jilin Province, northeastern China. The experiment was conducted in a typical black soil area, and a plough pan layer was confirmed through onsite excavation, thus meeting the requirements of this field experiment.
Combining the discussion of advanced models such as the Drucker–Prager cap model and the improved Cam Clay model, these models are crucial for capturing soil plasticity and stress-dependent behaviour [9,10,11]. The M-C model is well-suited for agricultural soils, which often exhibit both cohesive (clay) and frictional (sand/silt) behaviour. For quasi-static subsoiling, the M-C model provides a reasonable approximation. In this study, the soil classified as sandy loam (23% clay) contains sufficient clay to generate cohesion, while sand/silt provide frictional resistance. Therefore, this article conducts research based on M-C yield criteria; the study used the M-C yield criterion to characterize the mechanical properties of the selected experimental field soil. The yield line in the π plane is shown in Figure 1a, and its equation expression is as follows:
σ 1 σ 2 2 + σ 1 σ 3 sin φ 2 c cos φ = 0
where σ1, σ2 and σ3 are the first, second, and third principal stresses, respectively. c represents the cohesive force, and φ represents the internal friction angle.
Figure 1a shows that the yield surface of the M-C criterion is a hexagonal pyramid, which appears as an unequal hexagonal shape in the π plane. There are sharp corners and the direction of the increase in plastic strain at the corners is not unique. In stress analysis, plastic analysis may not converge, resulting in numerical calculations that cannot be performed and fail.

2.1.2. Drucker–Prager (D-P) Yield Criteria

Incorporating a D-P model, which smooths the M-C hexagonal yield surface, could improve numerical convergence in the FEM, especially for stress concentrations at the subsoiler tip. Cohesion is critical in surface soils as it dictates the initial resistance to tillage and soil fragmentation. The M-C model, validated via triaxial tests, appropriately captures this behaviour for the study’s sandy loam soil. By quantifying c and a, the model enables accurate FEM simulation of subsoiler performance, guiding the design of energy-efficient bionic tools that mitigate cohesive resistance.
The D-P yield criterion introduces the von Mises strength criterion into geotechnical analysis, and its equation expression is as follows:
α I 1 + J 2 D = 0
where I1 is the first invariant of the stress tensor. J2 is the second invariant of the stress bias, which is tangent to the hexagonal pyramid plane of the M-C criterion. The D-P criterion on the π plane is shown in Figure 1a. The correlation Equation (1) can be used for the following:
I 1 = σ 1 + σ 2 + σ 3 J 2 = 1 6 σ 1 σ 2 2 + σ 2 σ 3 2 + σ 1 σ 3 2 α = 2 sin φ 3 3 sin φ D = 6 c cos φ 3 3 sin φ
The D-P criterion is matched with the M-C criterion, and the flow rule is introduced, which is the extended D-P criterion on the π plane in Figure 1a. The correlation Equation (1) can be used to obtain the following:
α = sin φ 3 3 + sin 2 φ D = 3 c cos φ 3 3 + sin 2 φ
where α and D are the D-P strength parameters, explicitly relating them to c and φ via Equations (3) and (4).
At the same time, according to the definition of soil triaxial failure experiments, the function expression of the D-P criterion is as follows:
σ 1 σ 3 + tan β 2 / K 1 / 3 tan β σ 1 + σ 3 1 1 / 3 tan β 1 1 / 6 tan β σ c 0 = 0
The function expression of the D-P criterion for soil triaxial compression is as follows:
σ 1 σ 3 + tan β 2 + 1 / 3 tan β σ 1 + σ 3 1 1 / 3 tan β 1 + 1 / 6 tan β σ c 0 = 0
In Equations (5) and (6), β is the internal friction angle of the D-P criterion and σ c 0 is the yield stress of the D-P criterion.
In the analysis, in order to maintain the consistency of the function expression, that is, the consistency of Equations (1), (5), and (6), there are the following:
tan β = 6 sin φ 3 sin φ σ c 0 = 2 c cos φ 1 sin φ
In Equations (5) and (6), the ratio of the tension and compression of soil triaxial k is as follows:
k = 1 1 + 1 / 3 tan β
It can be known from Equations (7) and (8) that
k = 3 sin φ 3 + sin φ
According to Equation (9), the yield criterion selection is related to the soil friction angle [12].
The derivation process of the above equation shows that when the friction angle φ < 22°,  0.778 < k < 1 in Equation (9), the two models of Equations (1) and (2) can fit well [12]. At this time, the D-P criterion model used to analyze and calculate the particle contact effect is better [13,14,15,16].
Conventional models fail in compacted layers due to abrupt elastic–plastic transitions and non-smooth stress–strain responses. The subloading surface model, falling within the framework of unconventional elastoplasticity, could be used for the prediction of the softening behaviour, rather than the conventional model represented by the D-P model [17]. The D-P and M-C models were employed for FEM analysis of soil–subsoiler interaction in this work, which is rational for quasi-static subsoiling (1.8 m/s) in sandy loam (φ = 12.35°), where the D-P model fits the M-C criterion (φ < 22°). Bionic subsoiler designs (inspired by mole claws) compensate for model limitations by fragmenting soil, reducing stress concentrations, and aligning with experimental validation. To capture the nonlinear stress–strain behaviour of soil during subsoiling, the M-C and D-P yield criteria were adopted. These models address soil’s plastic deformation and failure, essential for simulating the complex stress states induced by bionic subsoilers.

2.2. Determination of Field Soil Parameters

Understanding and mastering the soil parameters can improve the study and design of the parts of soil tillage agricultural machinery, and the physical and chemical properties of soil are affected by the working state and mechanical properties of the cultivation components. In this study, the basic physical and chemical parameters of the soil in the experimental field (Gongzhuling City, Jilin Province, northeastern China), including the soil bulk density, density, moisture content, particle size, soil cohesion, and internal friction angle, were determined according to the standard of geotechnical experimental methods [18].
First, the soil excavation method was used to sample the experimental field soil. The sampling points were arranged in a serpentine manner in the field, with a sampling spacing of 2 m, for a total of 27 sampling points, as shown in Figure 1b. A ring knife (with a peripheral diameter of 54.00 mm, a height of 50.00 mm, and a wall thickness of 2 mm) was used to take each soil sample, and a small hammer was used to force the ring knife into the soil. Then, the ring knife was extracted. A soil cutter was used to flatten both ends of each ring knife, and each ring knife containing a soil sample was put into a self-sealing bag. Then, the mouth was immediately sealed, and finally, each of the collected soil samples were taken back to the laboratory for parameter measurement.

2.2.1. Soil Bulk Density—Ring Knife Sampling and Oven-Drying Method

The calculation method for the soil bulk density involves dividing the weight of the soil sample dried in a 105 °C oven to a constant weight by the volume of the ring knife (98.17 cm3). The soil density refers to the mass of soil per unit volume, which is also known as the density of soil particles. The average value of three samples was taken to determine the soil bulk and particle density.

2.2.2. Soil Moisture Content—Wet Weight Method

The difference in the soil water content affects soil disturbance and the draft force of tillage machinery. In this study, the wet weight method was used to characterize the soil moisture of different tillage layers, and three soil samples were taken every 20 mm depth. Each soil sample was put into an aluminum box, covered, and weighed via an analytical balance (Mettler Toledo instruments (Shanghai) Co., Ltd., Shanghai, China) with an accuracy of 0.1 mg, and the Mw was recorded. The cover was then opened and placed at the bottom of the aluminum box. The aluminum box and cover were thoroughly dried in an oven at 105 °C until the weight remained the same, which was recorded as Md. The calculation equation for the soil water content is as follows.
s o i l   w a t e r   c o n t e n t % = M w M d × 100 % / M d

2.2.3. Soil Particle Size Distribution—Sieving and Laser Particle Size Analysis

According to the International Soil Texture Classification, particles in the soil can be divided into clay, silt, and sand by particle size. Soils with a particle size less than 0.002 mm are classified as clay, soils with a particle size between 0.002 and 0.02 mm are classified as silt, and soils with a particle size between 0.02 and 0.2 mm are classified as sand.
In this study, the screening method and laser particle size method were used to classify the particle size of the experimental field soil. First, via the screening method, sieves with different sieve holes were stacked from top to bottom in the order of 1 mesh size (4.75 mm), 4 mesh (2.8 mm), 7 mesh (1.7 mm), 18 mesh (1 mm), 30 mesh (0.6 mm), 45 mesh (0.355 mm), 70 mesh (0.212 mm), 120 mesh (0.125 mm), and 200 mesh (0.075 mm), and the soil samples were placed in the top sieve. The sieves were subsequently shaken until the quantities of the remaining soil particles on each sieve remained unchanged. The soil remaining on each sieve was collected and weighed to calculate the percentage of each sieve to the total soil mass. Second, via the laser particle size method, 5 mg of soil was screened with a 200 mesh sieve, and the particle distribution of the soil samples was measured in the experimental area via a laser particle size analyser (BT-9300 H, Better Size Instruments Co., Ltd., Dandong, China), as shown in Figure 1c. Three soil samples were collected from the cultivated layer (0–300 mm), plough pan layer (300–380 mm), and subsoil layer (380–640 mm) of the experimental field, and the average values of the measurement results were determined.

2.2.4. Soil Cohesion and Internal Friction Angle—Triaxial Compression Test

A triaxial compression test (also known as triaxial shear test) was used to measure the cohesion and internal friction angle of the soil. The principle of this test is that under the action of principal stress in all directions, the shear failure of soil follows the M-C yield criterion, and under a certain confining pressure, the ratio of the shear stress on the stress plane to the normal stress will reach failure, thus, the ultimate stress circle of the soil under the confining pressure can be obtained. Different ultimate stress circles can be obtained for the same soil under different confining pressures. Based on the obtained ultimate stress circle, the shear force τ is the vertical coordinate, the normal force σ is the horizontal axis, a Mohr failure stress circle diagram can be drawn as the abscissa, and a set of (at least 3) envelope tangents of the Mohr failure stress can be drawn. The slope of the envelope tangent is the internal friction angle of the soil -φ. The intercept of the envelope tangent in the vertical direction is the cohesion angle of the soil-C, as shown in Figure 1b.
A SLB-1 stress–strain triaxial shear permeameter (Nanjing Soil Instrument Factory Co., Ltd., Nanjing, China) was used to carry out the triaxial unconsolidated undrained shear test of the soil. In this experimental method, the soil sample is undrained from the beginning of the loading confining pressure until the soil is destroyed, and the moisture content in the soil sample remains unchanged.
The moisture content of each experimental soil sample was 10%, and the confining pressures were 50, 100, and 200 kPa, respectively. Figure 1d shows the comparison diagram of the soil sample before and after the triaxial unconsolidated undrained shear test, from which it can be seen that each soil sample had obvious shear failure.

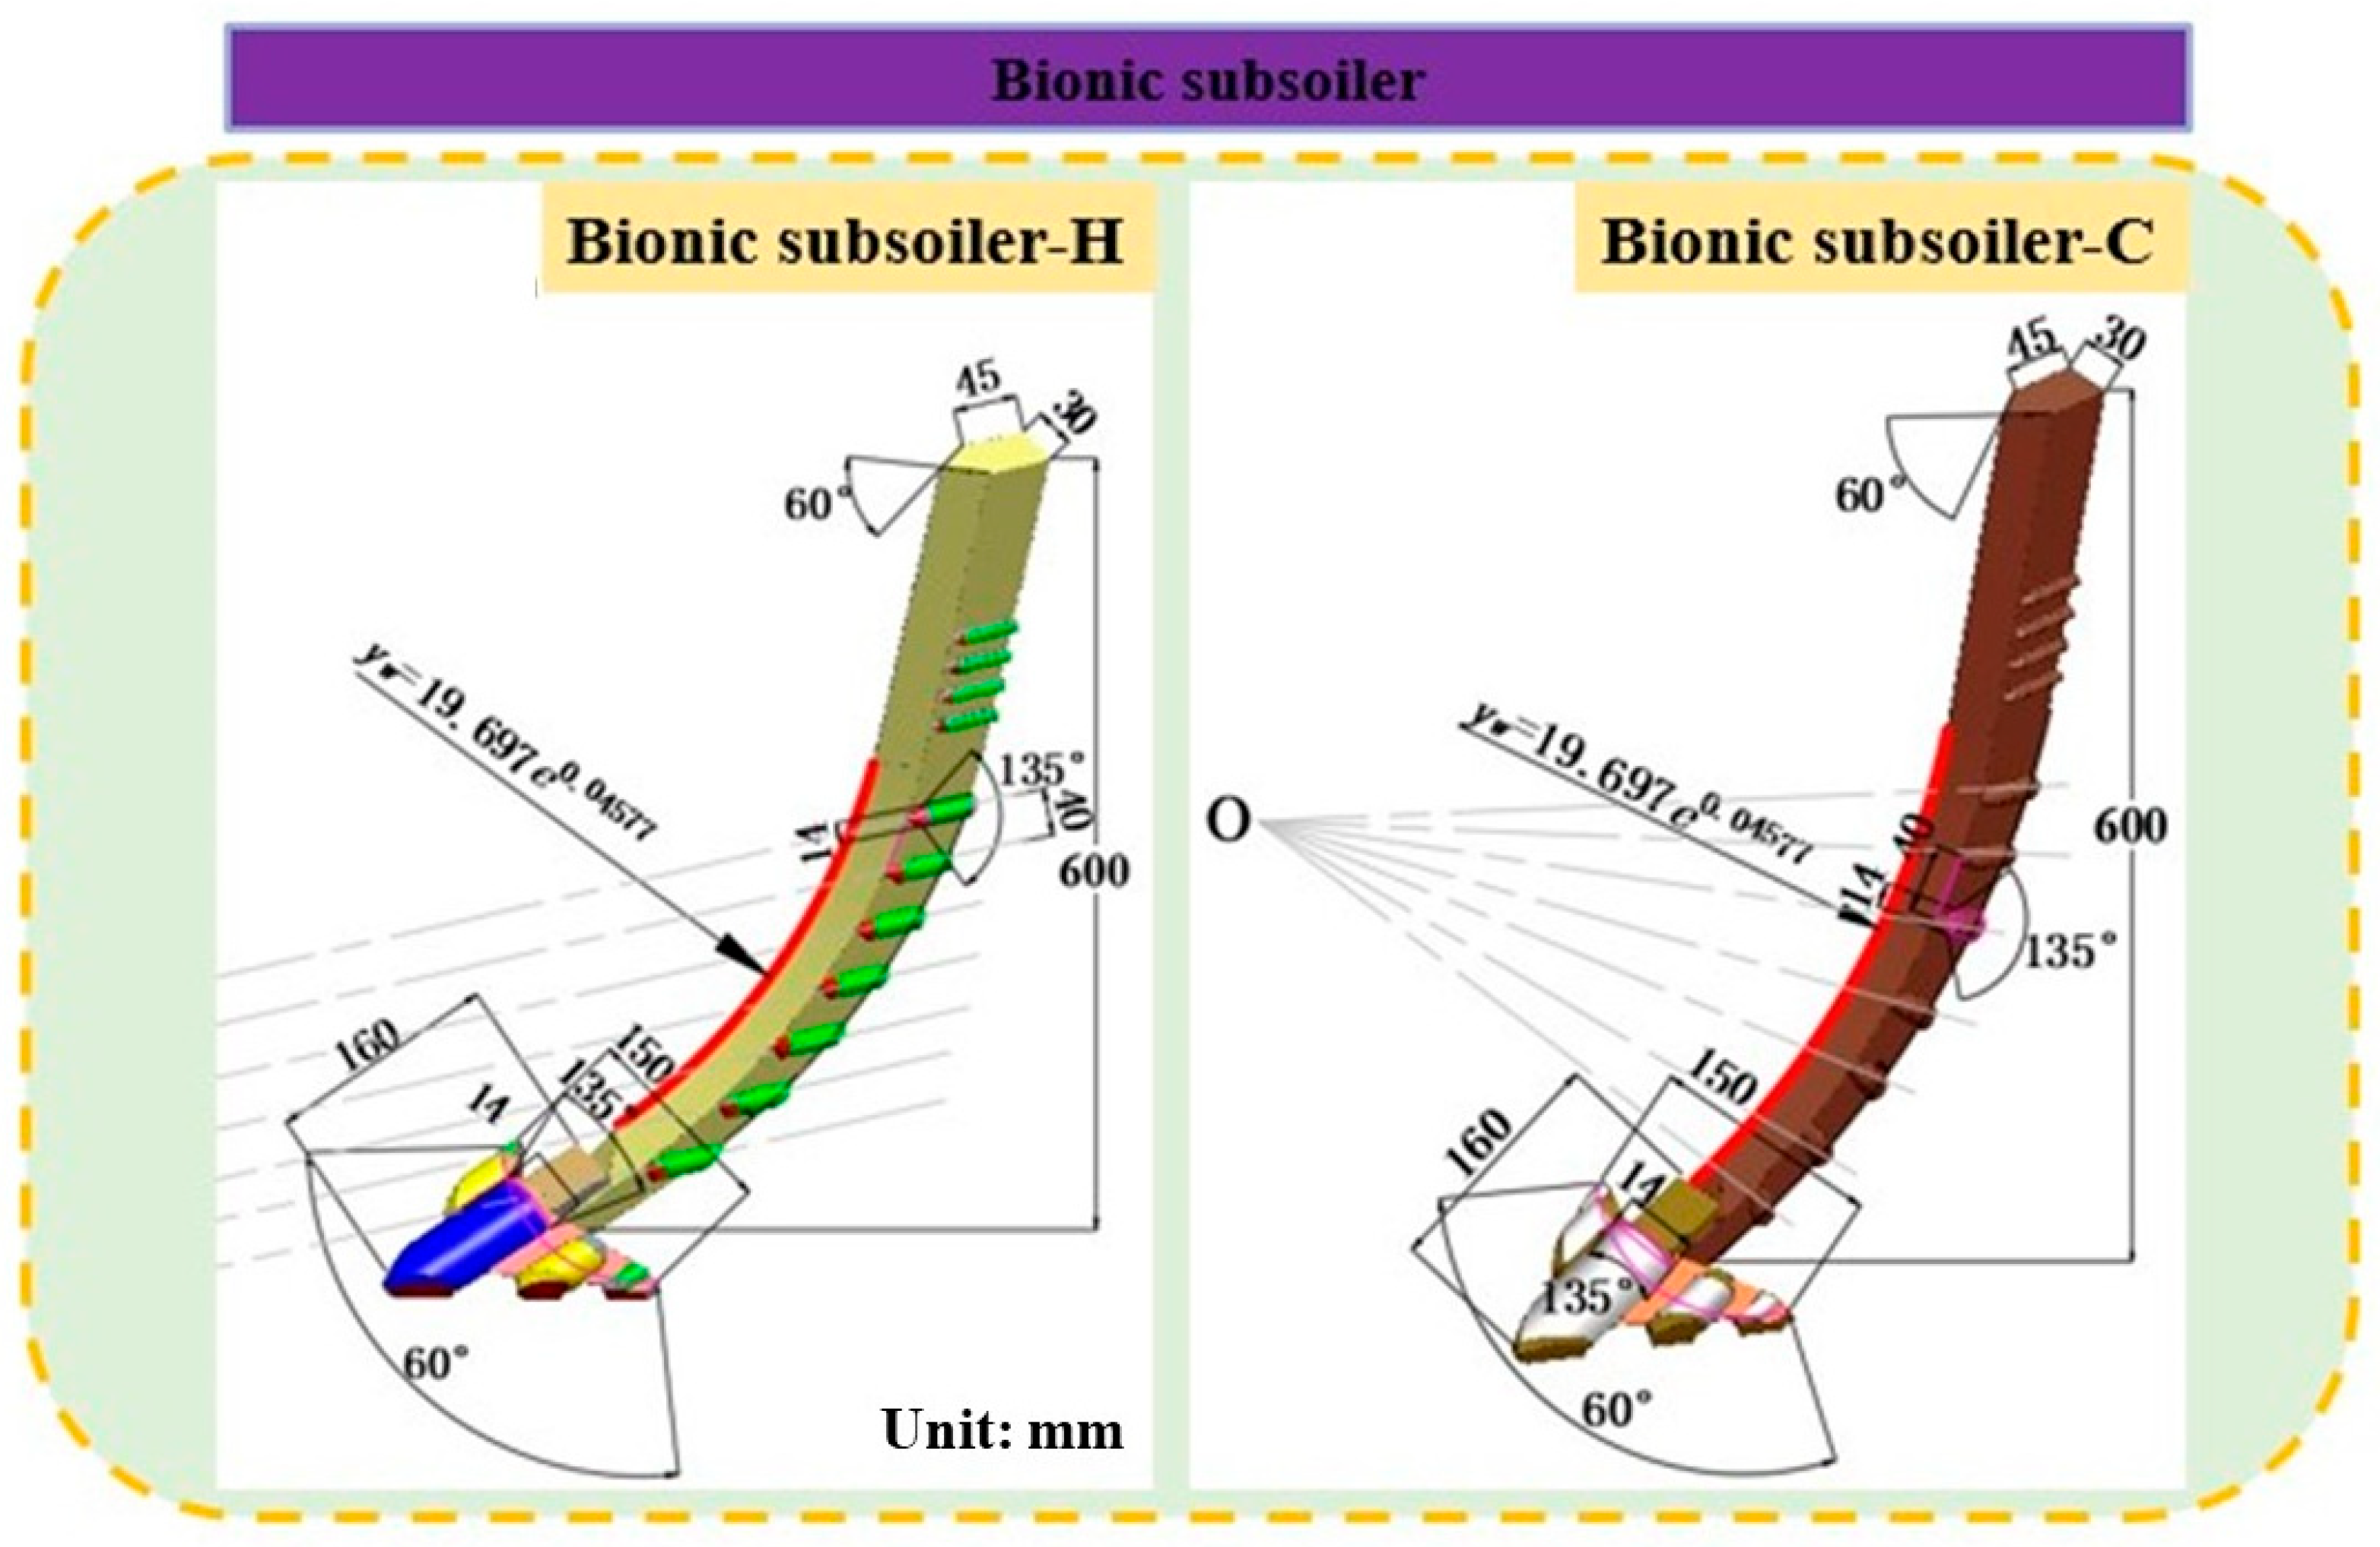
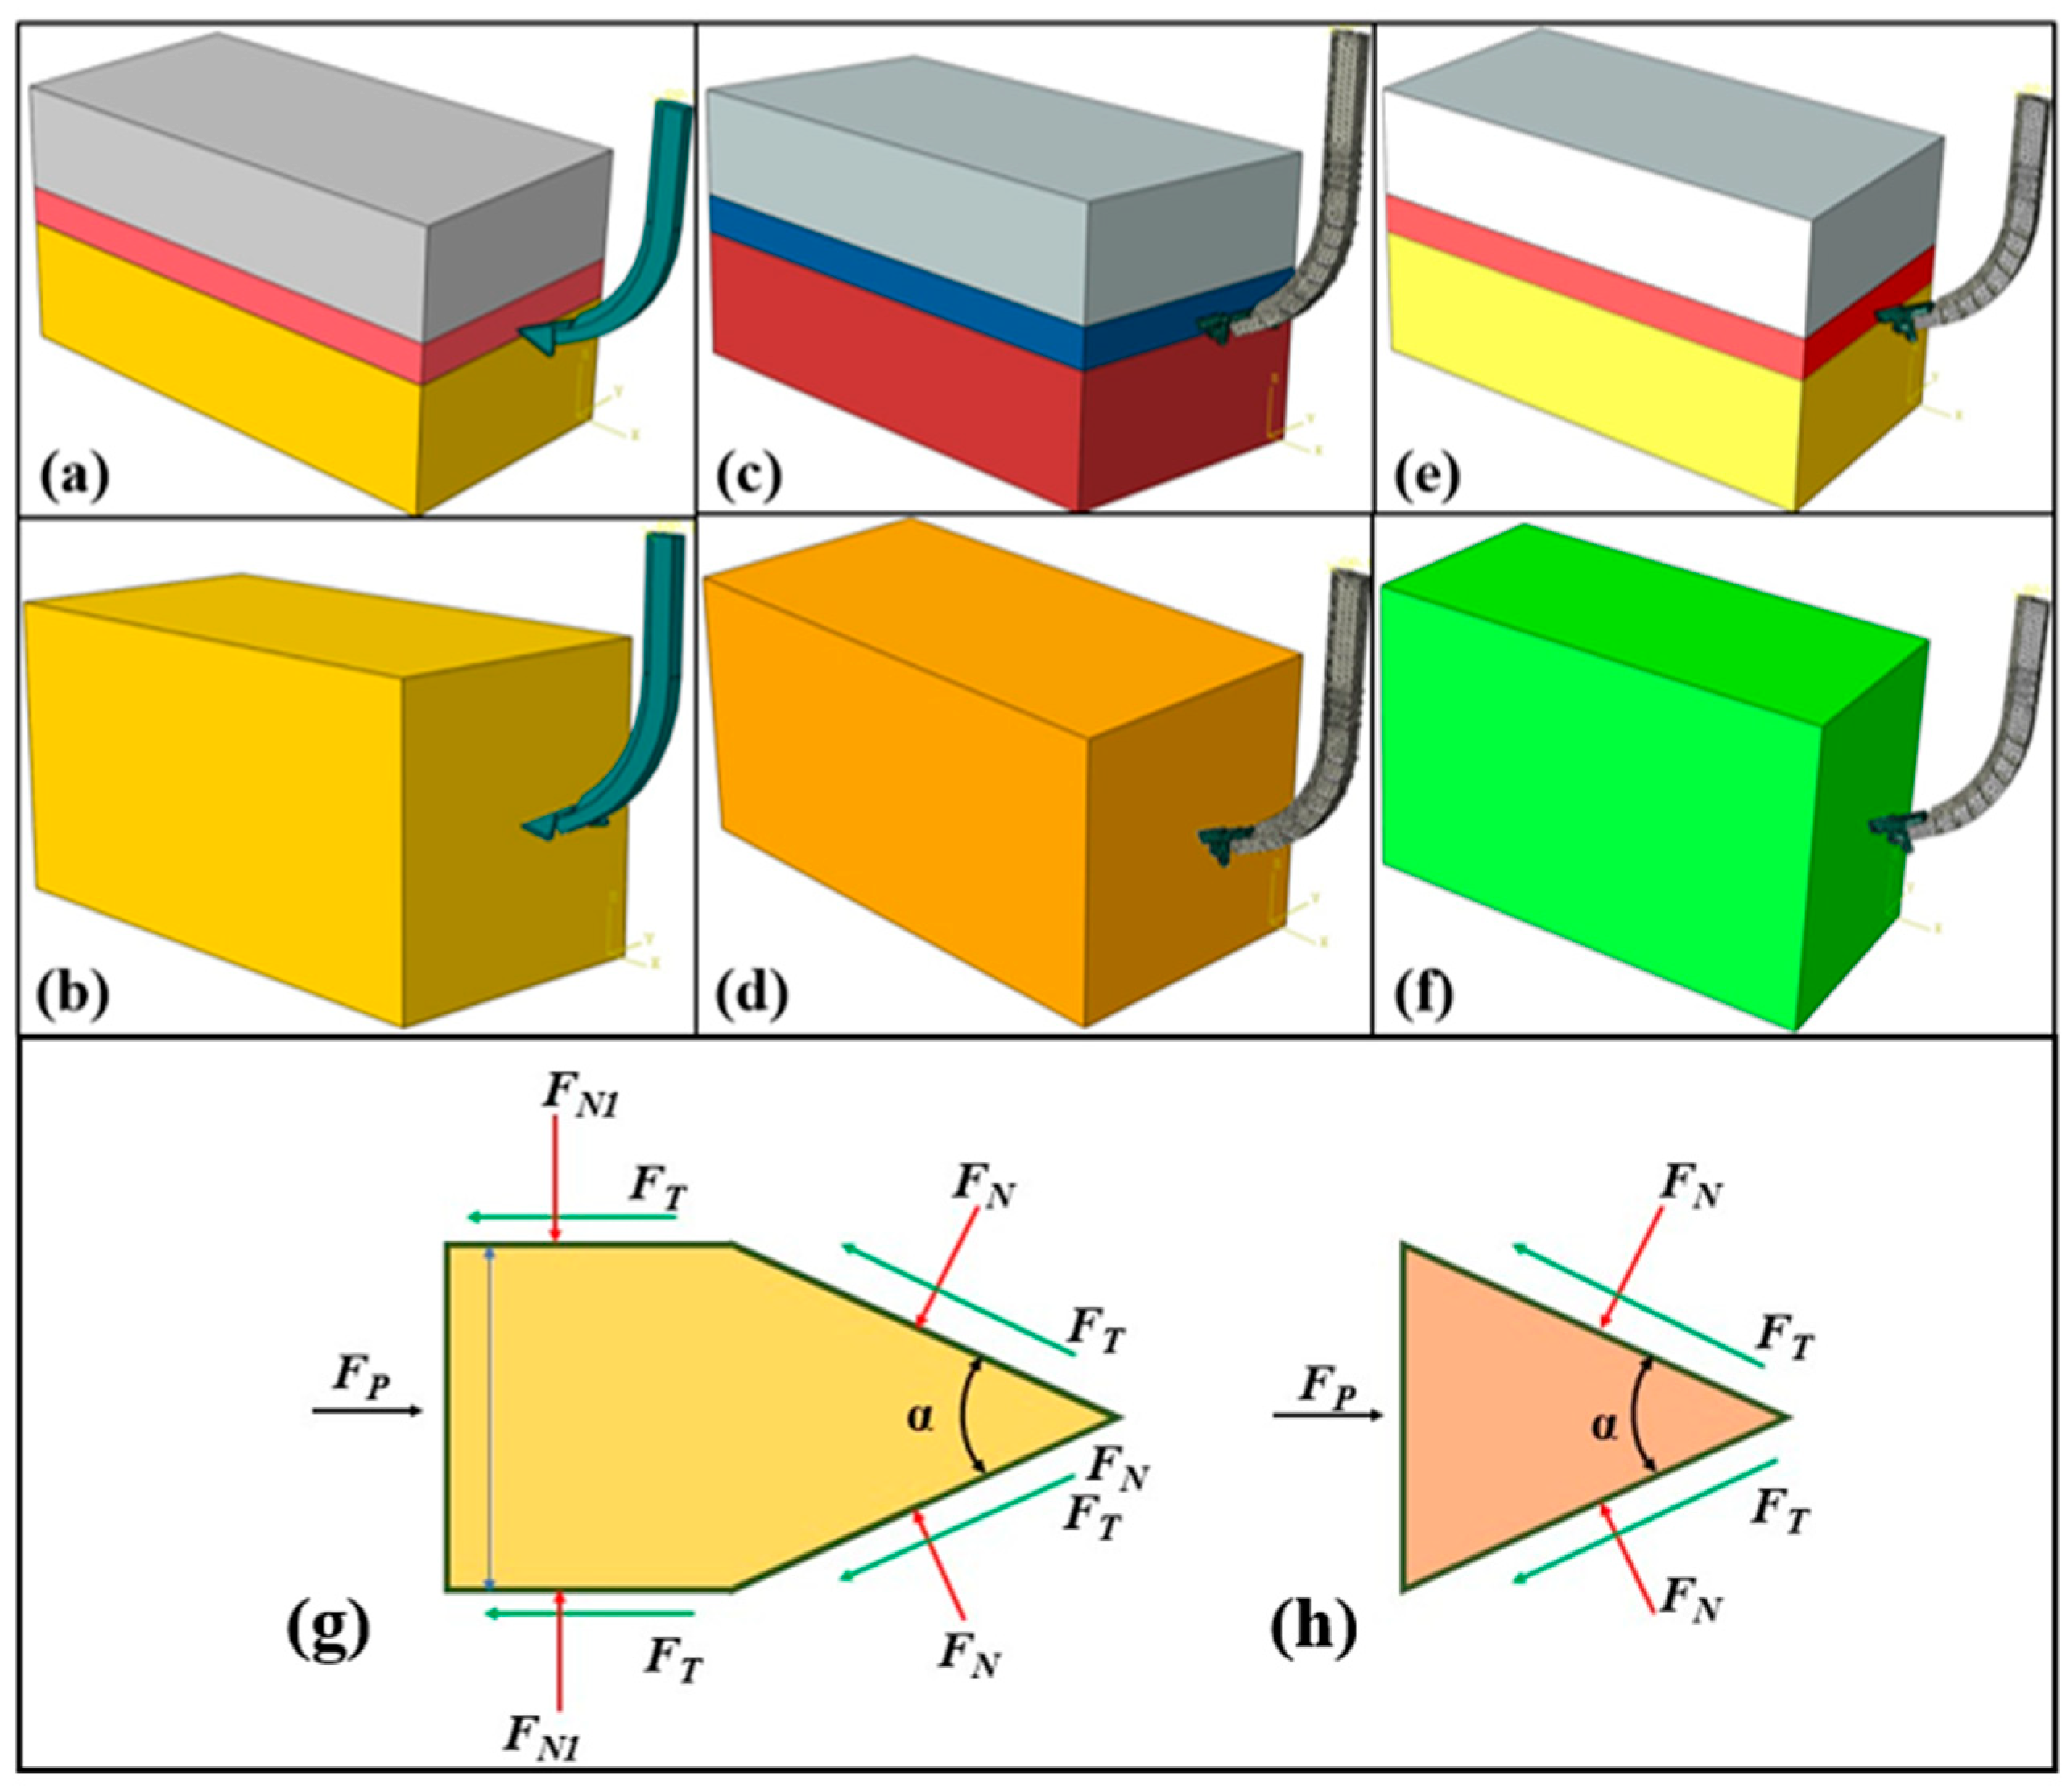
2.3. Establishment of the Soil Tillage Model

2.3.1. Material Properties and Boundary Conditions

The soil properties and structure determine the continuous changes in soil stiffness during the cultivation process, which is a nonlinear problem. Therefore, the contact problem between the subsoiler and the soil during the cultivation process is related to geometric nonlinearity, material nonlinearity, and boundary nonlinearity [19,20,21].
In this study, the explicit model in Abaqus was used for analysis. The model contains a variety of cell libraries and soil material models that could be used for explicit soil analysis and allow the actual effects of soil materials in the solution to be determined. The explicit time increment step in the analysis is related only to the maximum frequency of the soil model’s natural vibration, and is independent of the load and time of the soil tillage analysis model [22]. Pásthy et al. [23] provided a detailed introduction to FEM applications in optimizing tillage tool geometry, aligning with the bionic subsoiler design in this study. Therefore, all equations in the soil tillage analysis model do not need to be solved, and the required incremental step in the analysis process is small, making it suitable for transient and local deformation problems when the subsoiler comes into contact with the soil.

2.3.2. Geometry and Mesh Density Optimization
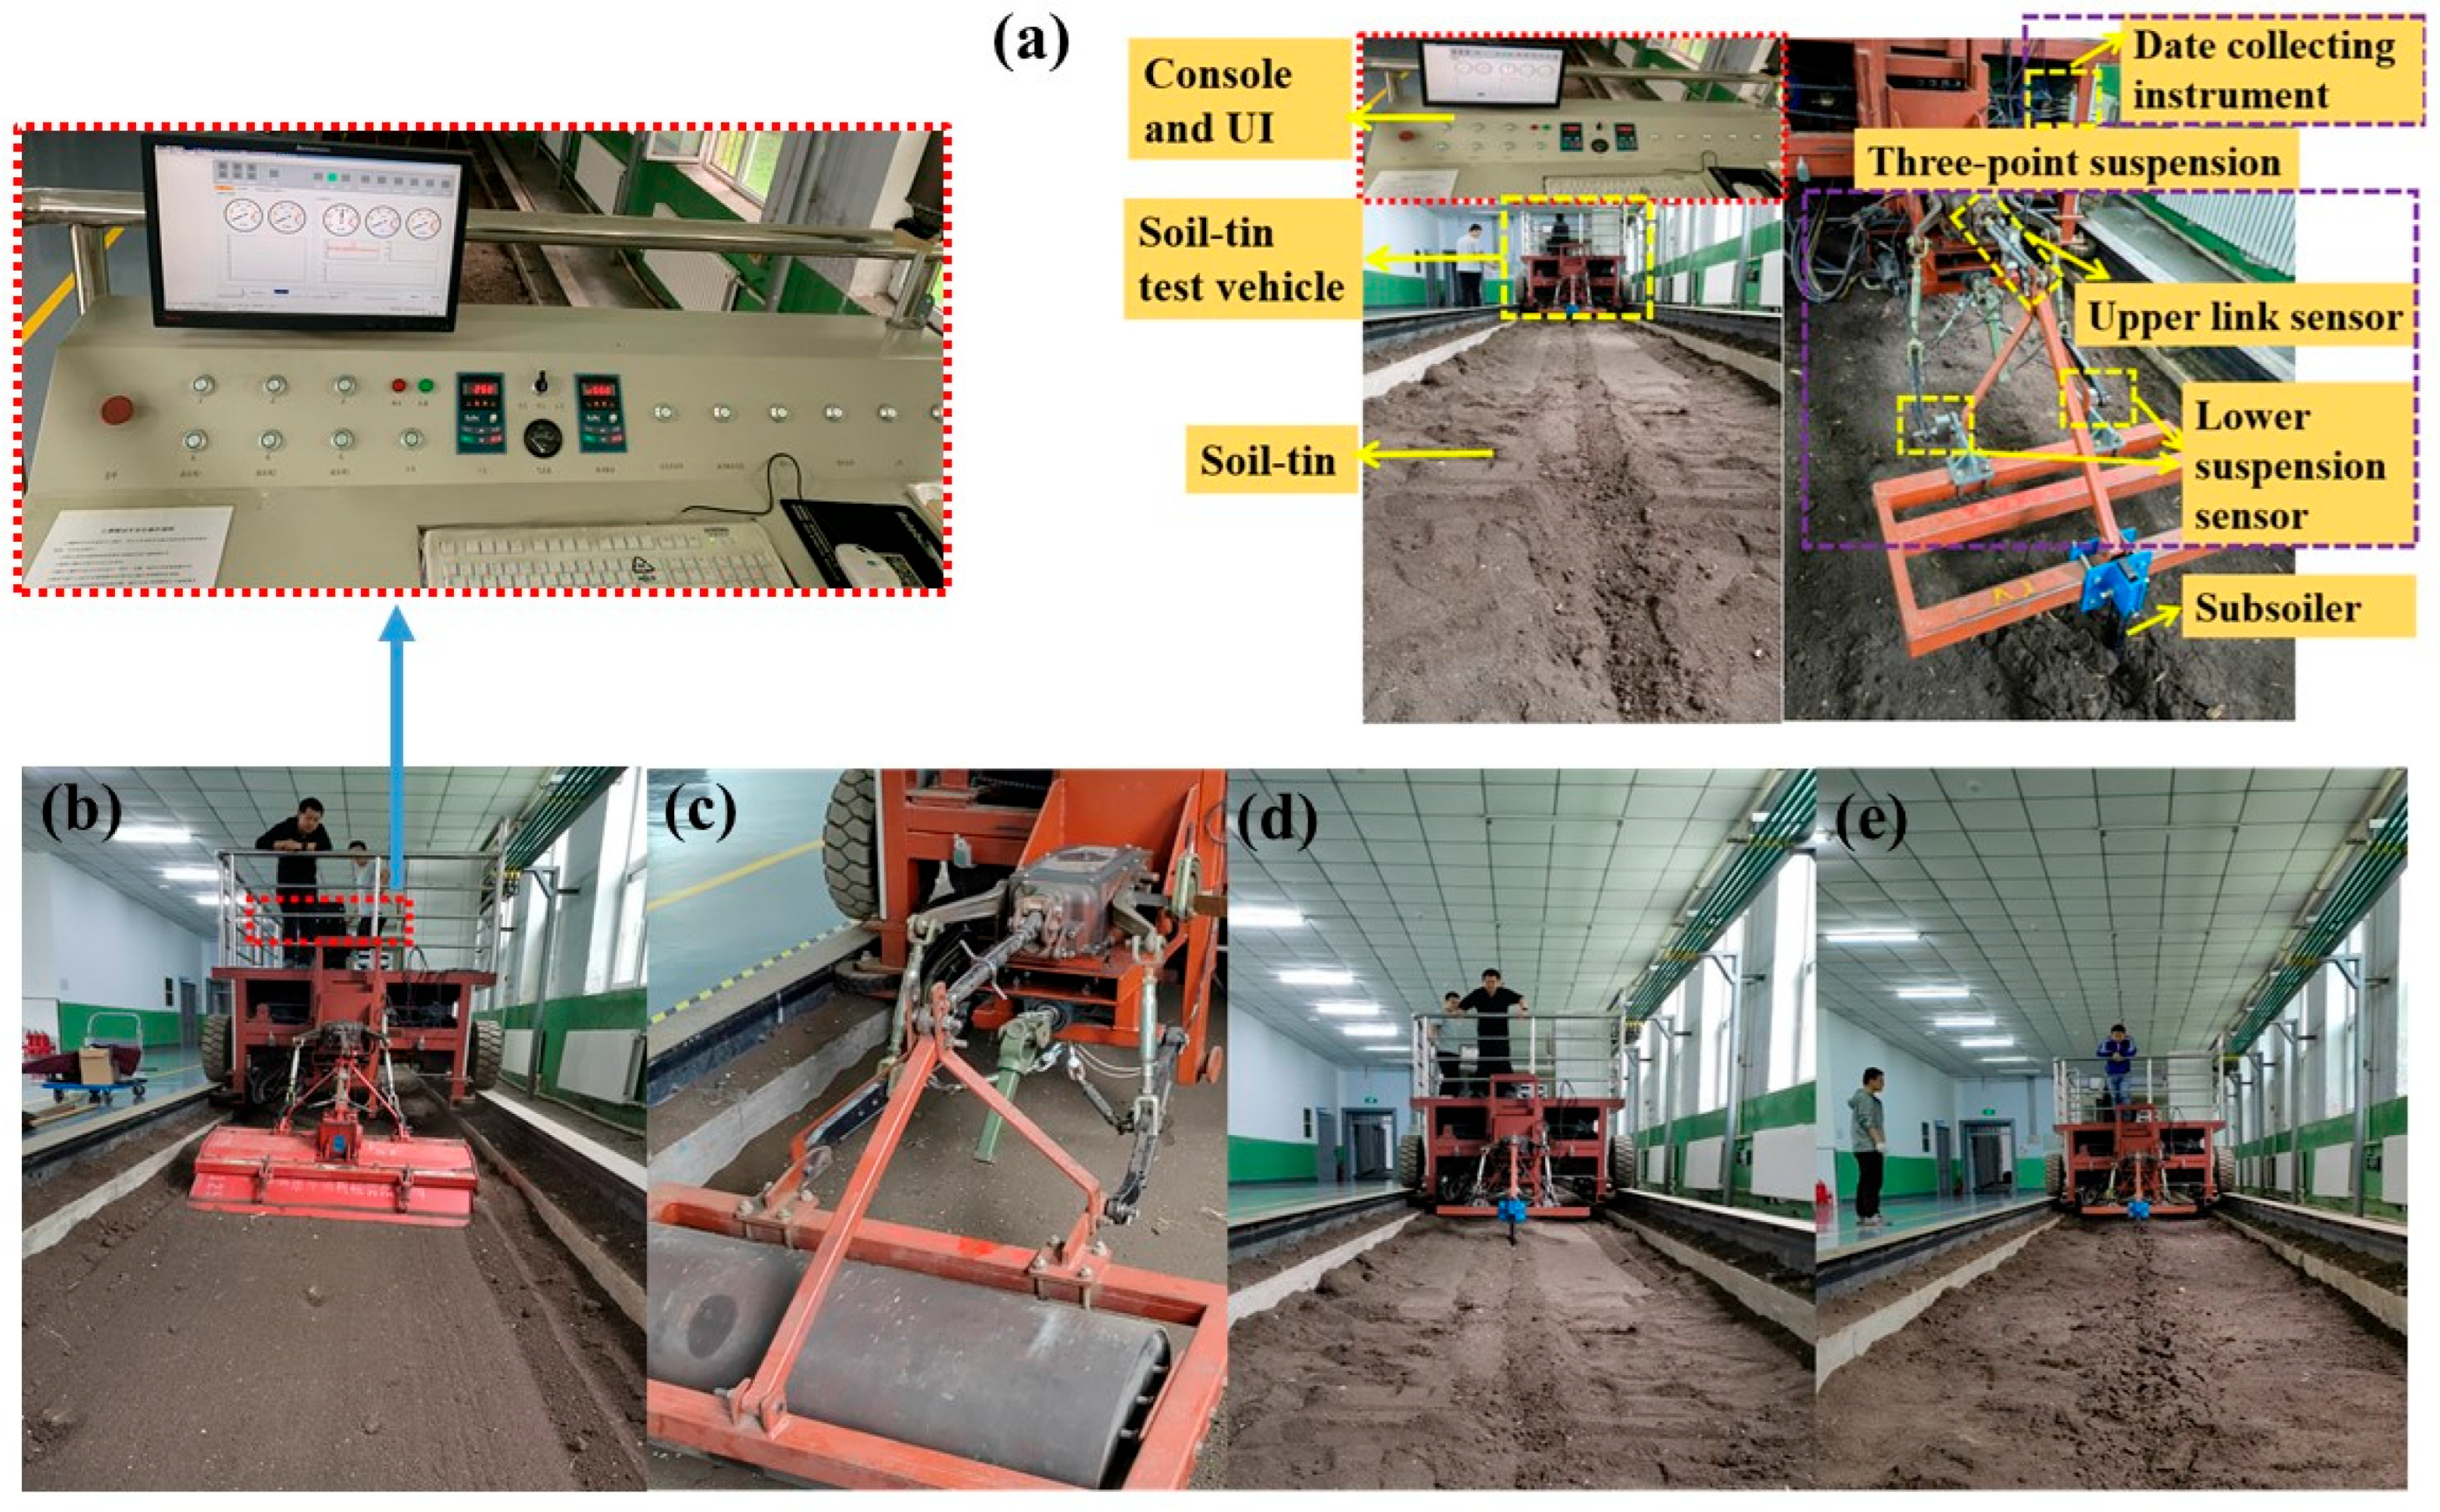
The soil model established in Abaqus, as shown in Figure 1e, had a size of Length × Width × Height = 1200 mm × 600 mm × 640 mm. A model of each soil layer was established, which was divided into three layers. Determining the Abaqus finite element analysis parameters is one of the severe limitations of using Abaqus finite element analysis for practical engineering simulations. The soil model applied fixed displacement boundaries at the bottom (z = 0 mm) and lateral sides (x = 0, x = 1200 mm, y = 0, y = 600 mm) to simulate an infinite soil domain, with a free surface at the top (z = 640 mm) to allow soil heave during subsoiling. This configuration prevents artificial boundary effects on the stress distribution. While water coupling effects (e.g., consolidation) were not explicitly modelled, the soil moisture content (5–15%) was experimentally controlled to represent field conditions, and drained conditions were assumed for quasi-static subsoiling.
The simulation results should match the actual field situation. Hence, when the simulation results match the field and soil bin situations, the Abaqus finite element analysis parameters are suitable. The parameters of the soil were measured with a cone penetrometer of SC 900 (RGB Spectrum Equipment, USP) with a 1/2″ diameter cone tip. The same penetration test was simulated via Abaqus finite element analysis (Figure 2), and the materials and interaction parameters were adjusted to obtain suitable parameters. The Abaqus finite element analysis parameters were suitable, as shown in Table 1.
To verify the accuracy and feasibility of FEM simulation analysis of the cutting effects of tillage components on soil, a standard subsoiler with simple structures and bionic subsoilers with complex structures were selected for simulation analysis [24]. The standard subsoiler was designed in accordance with the national standard (JB/T 9788-1999) [25]. The bionic subsoilers, on the other hand, were developed by leveraging bionic technology, reverse engineering, and 3D printing technology. They were designed by taking mole claws as the bionic prototype and building upon the structure of the standard subsoiler. Specifically, the toe of the mole, a typical soil-burrowing animal, served as the bionic prototype. Image technology, edge processing operators, and other techniques were employed to extract the horizontal and vertical contours of the mole toe. Corresponding curves were then fitted to reconstruct the three-dimensional surface of the mole toe. The established bionic model was subsequently applied to the design of the subsoiler tip. The subsoiler shaft was designed using the contact soil index surface of the external contour of the mole claw and the surface of the middle mole toe.
One bionic subsoiler had a circular bionic handle that was radially distributed on both sides of the shovel shaft, and the other bionic subsoiler had a horizontal bionic shovel shaft that was horizontally distributed along the working direction of the handle on both sides of the shovel shaft. This breakthrough reconstructed the three-dimensional structure and spatial layout of the mole claw and applied it to the design of the subsoiler, achieving drag reduction, wear resistance, and increased flow efficiency. Finally, 3D printing technology was utilized to process and prepare a circular bionic subsoiler and a horizontal bionic subsoiler with a combination of bionic subsoiler tips, circular bionic subsoiler shafts, and horizontal bionic subsoiler handles. Two types of bionic subsoilers were designed: bionic subsoiler-C and bionic subsoiler-H—as shown in Figure 3. The parameters of the material were directly imported into the 65 Mn software and added to the material section of the subsoiler.
The setting of the mesh density in the finite element analysis was closely related to the analysis results of the 3D model. The mesh density had a significant effect on the prediction of vertical and horizontal draft forces [26,27]. This study employs Abaqus Explicit’s adaptive meshing with 8-node hexahedral reduced-integration elements to handle large soil deformations. Elements are dynamically remeshed when the distortion thresholds (e.g., Jacobian determinant < 0.7) are exceeded, particularly in high-strain zones near the subsoiler tip. The conclusion was that with increasing mesh density, the draft force in the analysis decreased, and the analysis values became more realistic. In order to obtain accurate analysis results, high-density mesh partitioning was required when establishing the soil and subsoiler models. In this mesh partitioning situation, considerable computational time was required, and finally, the accuracy and time of the analysis were comprehensively considered.
As shown in Figure 4a, under the same tillage conditions and soil parameter settings, the influence of different mesh division numbers on the tillage draft force was investigated. The results indicate that mesh density division has a significant impact on tillage efficiency. When the <Approximate size> setting of the soil decreased from 12 to 4, the resistance increased from 30 kN to 40 kN. To obtain accurate calculation results, high-density mesh partitioning was carried out in the solver, which, however, consumed a substantial amount of computation time. The tillage draft forces with grid densities of 6 and 8 fluctuated around 40 kN. The mesh density was optimized via convergence testing, reducing the global element size from 12 to 6, decreasing the simulation error by 18% (Figure 5), while further refining to 4, increasing the computational time by 200% with minimal accuracy gains. The final mesh size of 6 mm (C3D8R elements for soil and B31 beams for subsoiler shafts) balanced error (<5%) and efficiency, consistent with Wang, S. et al. [28]. From Figure 4c, it can be seen that when the mesh division is increased from 6 to 4, the accuracy improvement is extremely limited, while the stability decreases instead [26]. The mesh density significantly affects FEM accuracy, as coarser meshes underestimate stress concentrations. Considering the balance between result accuracy and solution time, a mesh setting value of 6 was selected to avoid further compromising accuracy.
Next, according to the actual farming, subsoilers moved horizontally forward through the soil at 1.8 m/s, creating both vertical and horizontal forces, and the motion parameters of the subsoiler analysis model were added. In the <interaction> step, a reference point was created at the end of the subsoiler. This reference point was used as the control point for the movement of the subsoiler. This control point is connected to the surface of the subsoiler. The coupling type is motion (Figure 4b). Therefore, this reference point was used to control the movement of the subsoiler in the analysis. The setting of the subsoiler’s motion was completed by setting the reference point when the motion conditions were set. Then, a boundary condition with displacement/rotation type was created in the <boundary condition manager> in the <load> step settings, and the motion was set in the pop-up <edit boundary condition> window (Figure 4c) to complete the loading of the subsoiler motion.
In the “Analysis Step” setting of the subsoiler analysis model, the analysis model was set as the driving force, the basic parameters of the soil subsoiler interaction tillage model were displayed, and then the model for job analysis was submitted.
Following the above steps, soil subsoil tillage models for different subsoilers were established, including the standard subsoiler soil model (soil with plough layer as shown in Figure 5a, soil without plough layer as shown in Figure 5b), the bionic subsoiler-H soil model (soil with plough layer as shown in Figure 5c, soil without plough layer as shown in Figure 5d), and the bionic subsoiler-C soil model (soil with plough layer as shown in Figure 5e, and soil without plough layer as shown in Figure 5f).
After the analysis model was established, it was run on the Dell Precision 7920 Tower workstation, which has two 16 core Intel Xeon Silver 4216 processors and 128 GB of memory.
In the subsoiling process, the stress diagram of the surface of the shovel shaft and the shovel tip are shown in Figure 5g and 5h, respectively. In Figure 5, FN represents the normal force on the subsoiler in the cutting soil, FN1 represents the normal force on the side edge of the subsoiler in the cutting soil, FT represents the tangential force on the subsoiler in the cutting soil, and FP represents the draft force on the subsoiler in the cutting soil. The simulation was divided into two stages: (1) static penetration to model initial soil–tool contact and stress accumulation, and (2) dynamic horizontal movement (1.8 m/s) to analyze steady-state interaction. This captured both passive stress (during penetration) and active stress (during horizontal displacement), as shown in Figure 5g,h. The standard subsoiler induced a passive stress state (high vertical stress) at the tip, while bionic subsoilers redistributed stress into active shear zones. This aligns with Rankine’s earth pressure theory for soil–tool interaction. While the FEM uses simplified assumptions (e.g., linear elasticity), the staged approach captures the key mechanics of subsoiling.
During the working process of the subsoilers, the friction between the soil and subsoiler was the source of FT and the tangential force on the subsoiler could be expressed in terms of the directional force. The sliding friction coefficient between the subsoiler and the soil was set as µ′. According to the mechanical analysis shown in Figure 5g,h, the normal resistance of the subsoiler shaft was 2(FN µ′cos(α/2)). The normal force resistance of the side edge of the subsoiler shaft was 2(FN µ′) and the normal resistance of the shovel tip was 2(FN µ′sin(α/2)).
The total resistance of the subsoiler during tillage can be expressed as follows:
F t o t a l = 2 F N sin α 2 + 2 F N μ cos α 2 + 2 F N 1 μ
From the above analysis, the resistance of the subsoiler at work was obtained. At the same time, combined with the soil subsoiler FEM analysis, the stress situation of the subsoiler at the time of tillage was also obtained, and the stress situation in the software analysis window was displayed through the stress cloud picture.

2.4. Soil Bin Test

2.4.1. Experimental Setup

From 7 August to 29 August 2023, the standard subsoiler and the bionic subsoiler–cutting soil experiments were conducted at the Agricultural Machinery Laboratory of the School of Biology and Agricultural Engineering, Jilin University, via a soil bin testing system. The soil bin testing system consists of a soil bin and a soil bin testing vehicle. The dimensions of the soil bin are 50 m long, 2.1 m wide, and 1.0 m deep. The soil bin truck associated with the soil tank is an experimental 10 kW variable frequency four-wheel drive soil tank experimental vehicle (China Harbin Bona Technology Co., Ltd., Harbin, China). The test vehicle includes an operating platform, an operating interface, a data acquisition system, and three sensors with measurement ranges of 15 kN and a sensitivity of 0.045 kN. The input voltage to each sensor is 24 VDC, and the output current value of each sensor is 20 mA. The sensor model type is a BK-1-LG-type sensor, manufactured by the China Aerospace Aerodynamics Technology Research Institute, and they were installed on a three-point suspension device, as shown in Figure 6a.

2.4.2. Data Acquisition

During the soil bin tests, each subsoiler was propelled by a four-wheel drive variable frequency electric soil bin test vehicle. The experimental speed was set at 1.8 m/s, and the experimental tillage depth was 380 mm. The standard crank double wing subsoiler, the bionic subsoiler-H, and the bionic subsoiler-C were installed on the soil bin truck bench in turn for the tests.
In the soil bin experiment, in order to ensure that the soil parameters in the soil bin were consistent with those in the field soil and Abaqus FEM, the soil in the soil bin was pretreated, which included rotary tillage (Figure 6b), compaction (Figure 6c), and other treatments of the soil, and the soil structure with a plough pan layer was artificially constructed. Water was sprayed to maintain the soil moisture content: the moisture content of the plough pan layer was 15% ± 1.5%, and the moisture content of the topsoil was 10% ± 1%, as shown in Figure 6d. The moisture content of the plough pan layer was 7% ± 1%, and the moisture content of the topsoil was 5% ± 1%, as shown in Figure 6e. The soil bulk density of the artificial plough pan layer was 1.63 g/cm3, and the bulk density of the topsoil was 1.43 g/cm3.

3. Results

3.1. Field Soil Properties

Accurately obtaining soil parameters from experimental fields is the foundation for establishing soil models. The particle density, dry bulk density, and water content of the experimental field soil are shown in Table 2. The soil particle density was the highest at depths of 120–300 mm in the cultivated layer, and the dry bulk density and water content were the highest in the plough pan layer (300–380 mm). Therefore, it could be seen that the plough pan layer had high compaction, high particle density, and high soil viscosity.
The distributions of the soil particles in the experimental field are shown in Table 3. Sand and silt were the main particles in the different plough pan layers of the experimental field, and the clay content was the lowest. The soil in the experimental field was classified according to the triangular coordinate map. It was found that the soil in the experimental field was classified as sandy loam. By drawing the Mohr failure stress circle and the corresponding envelope tangent, it could be obtained that the internal friction angle φ of the soil in the experimental field was determined to be 12.35°, and the soil cohesion c was determined to be 36.86 kPa. The experimental soil (sandy loam) had a low organic matter content (≤1.9%, measured via loss-on-ignition), contributing negligibly to soil cohesion (c = 36.86 kPa) due to the sandy loam texture (Table 3). For simplifications in soil behaviour, this study uses the D-P criterion, which approximates soil behaviour as homogeneous/isotropic. While this simplifies natural soil heterogeneity, Section 2.1 justifies its use for black soil with φ = 12.35° (below 22°), where D-P fits the M-C model well (Equation (9)).

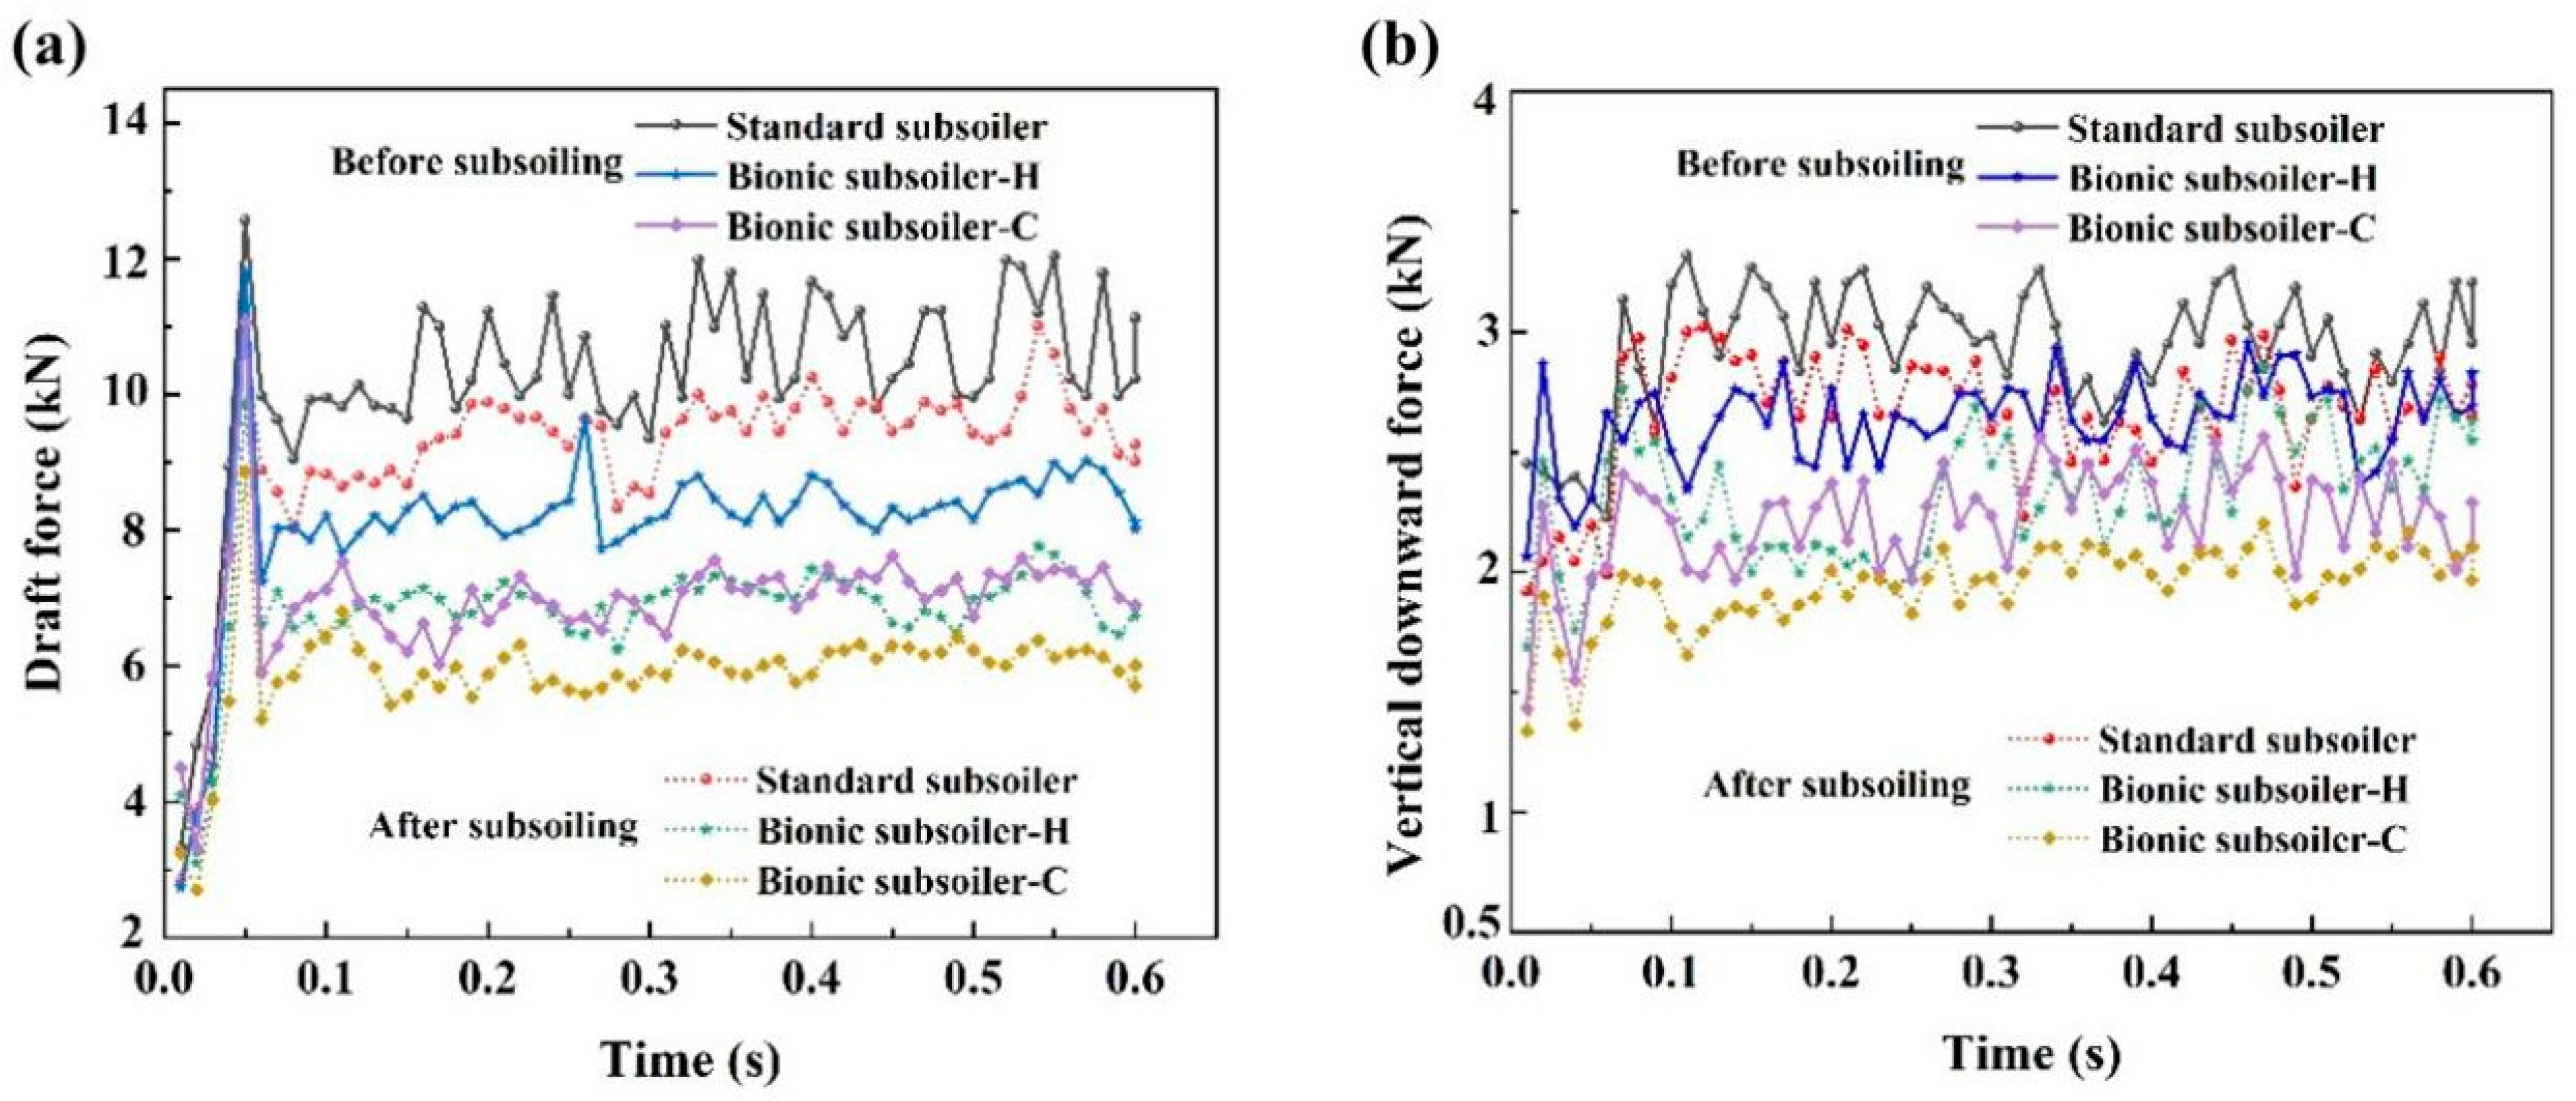
3.2. Farming Forces and Soil Failure

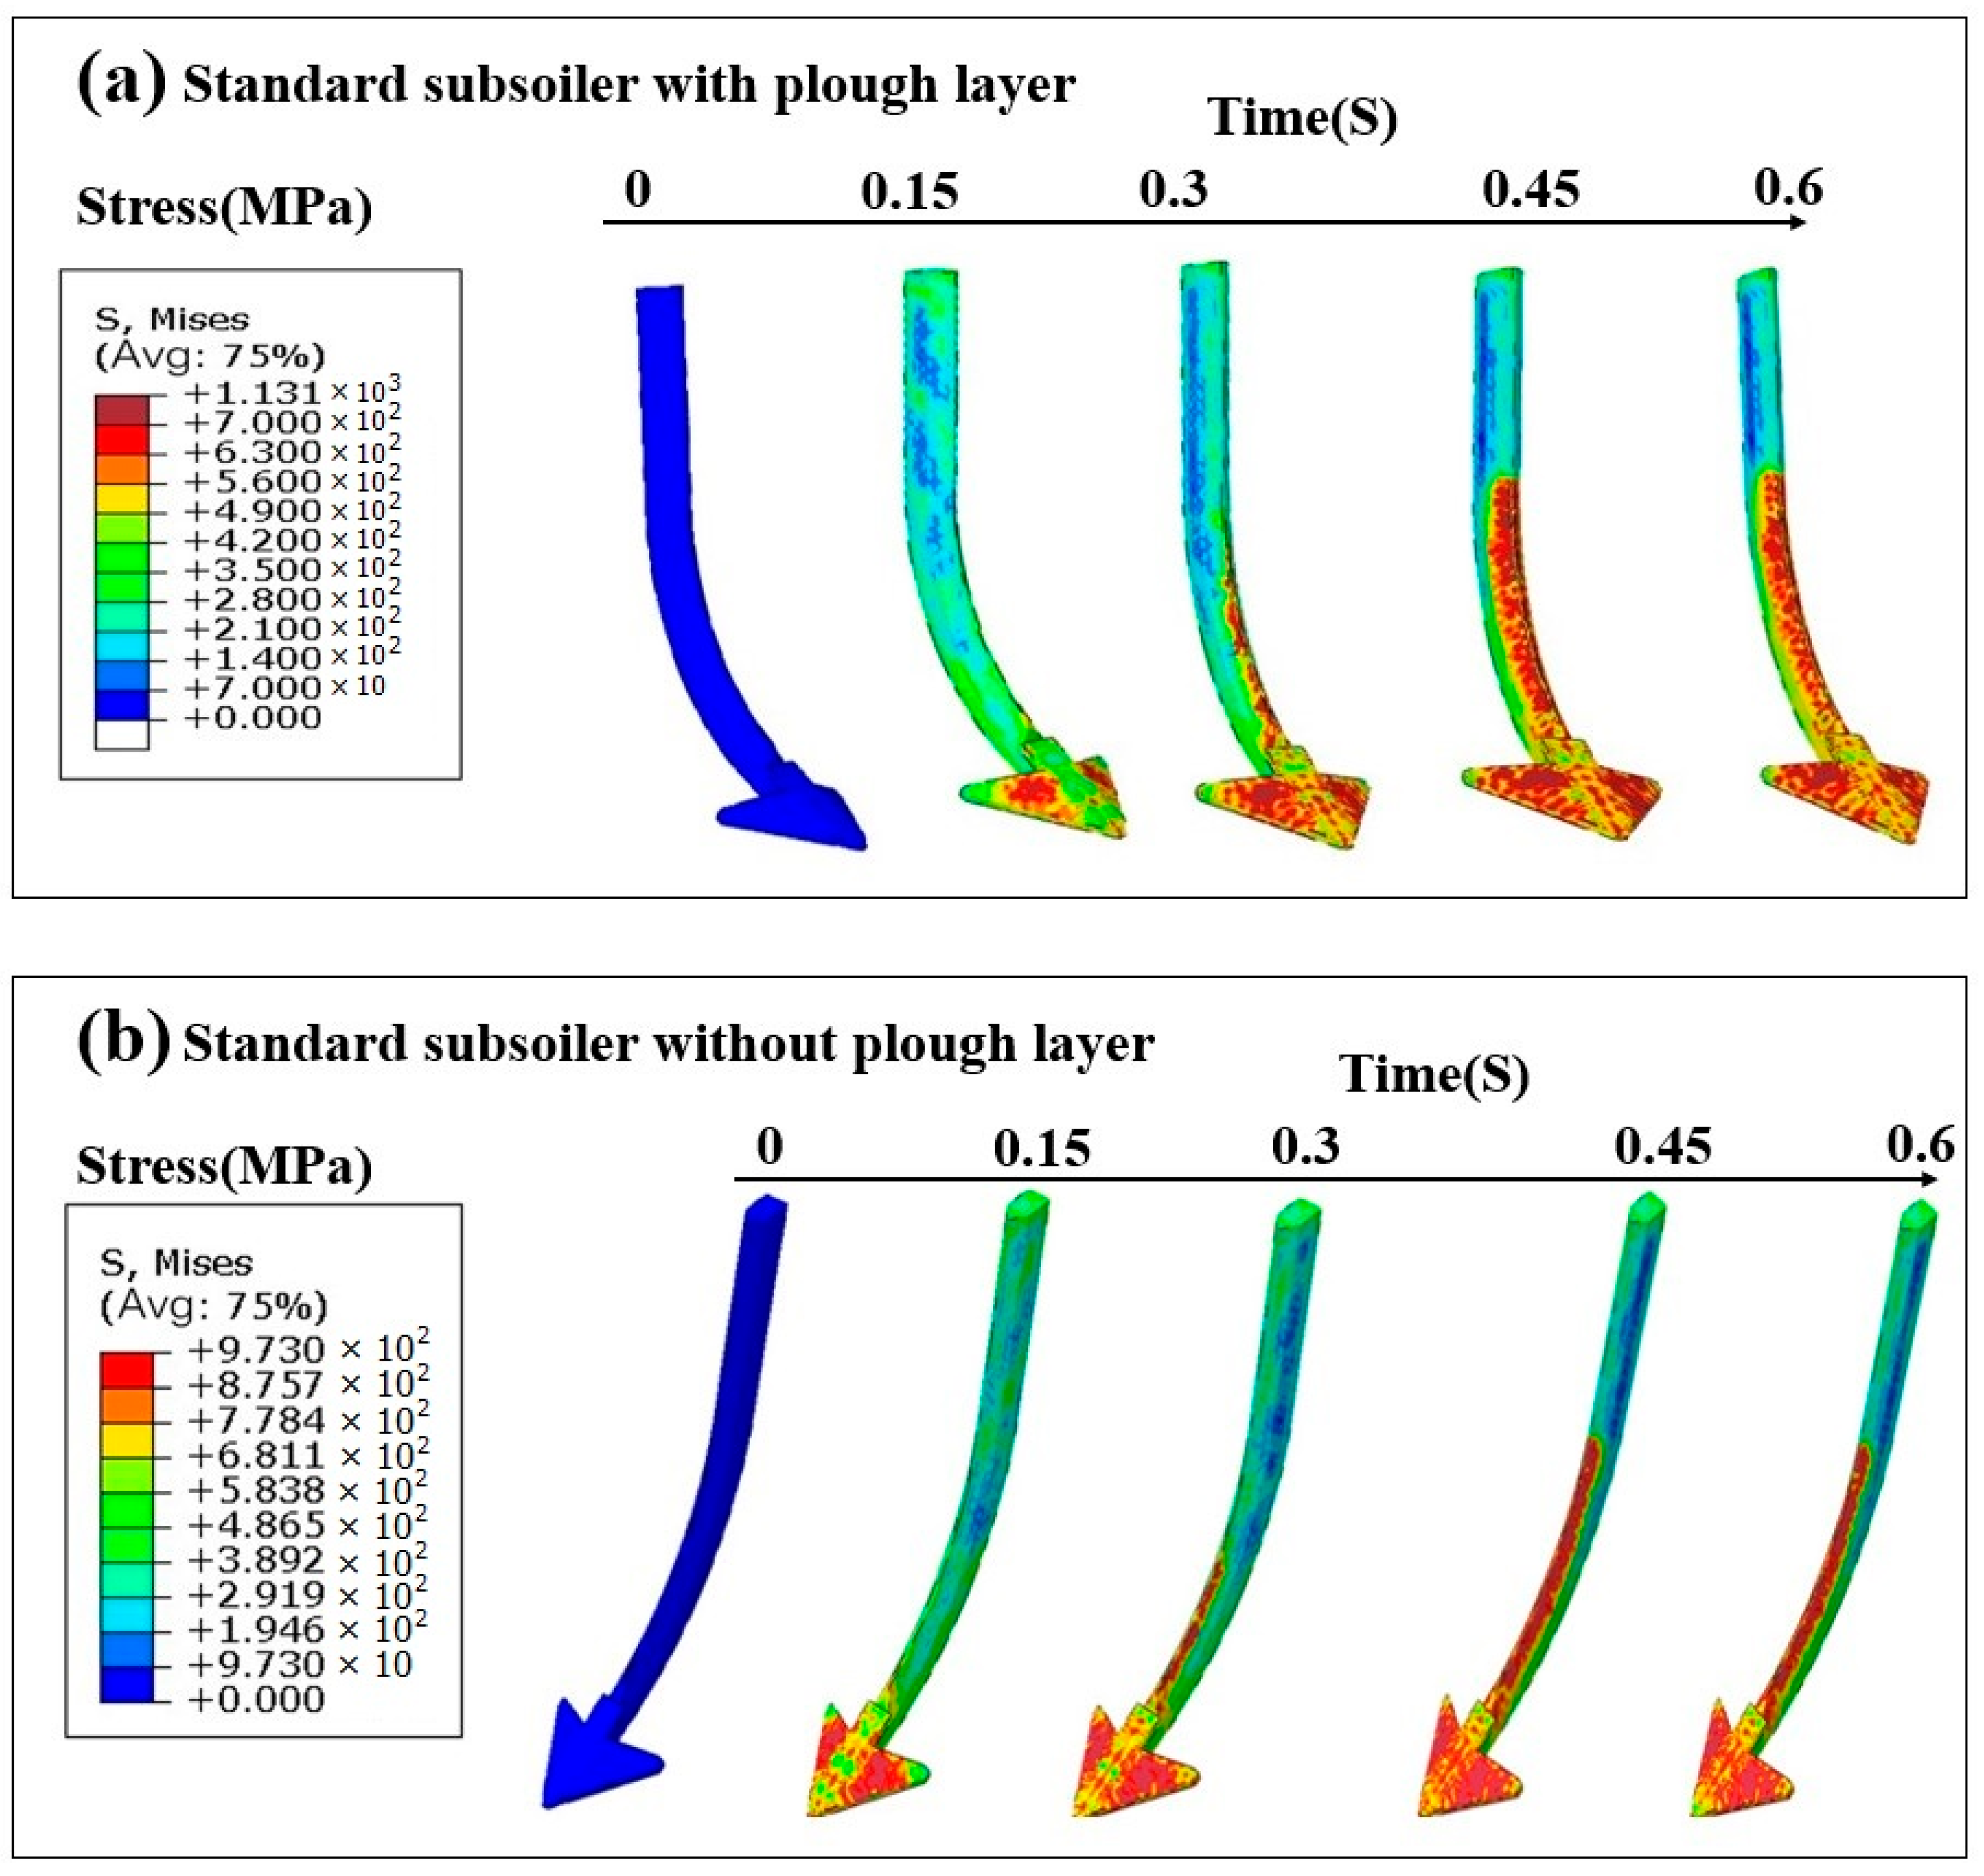
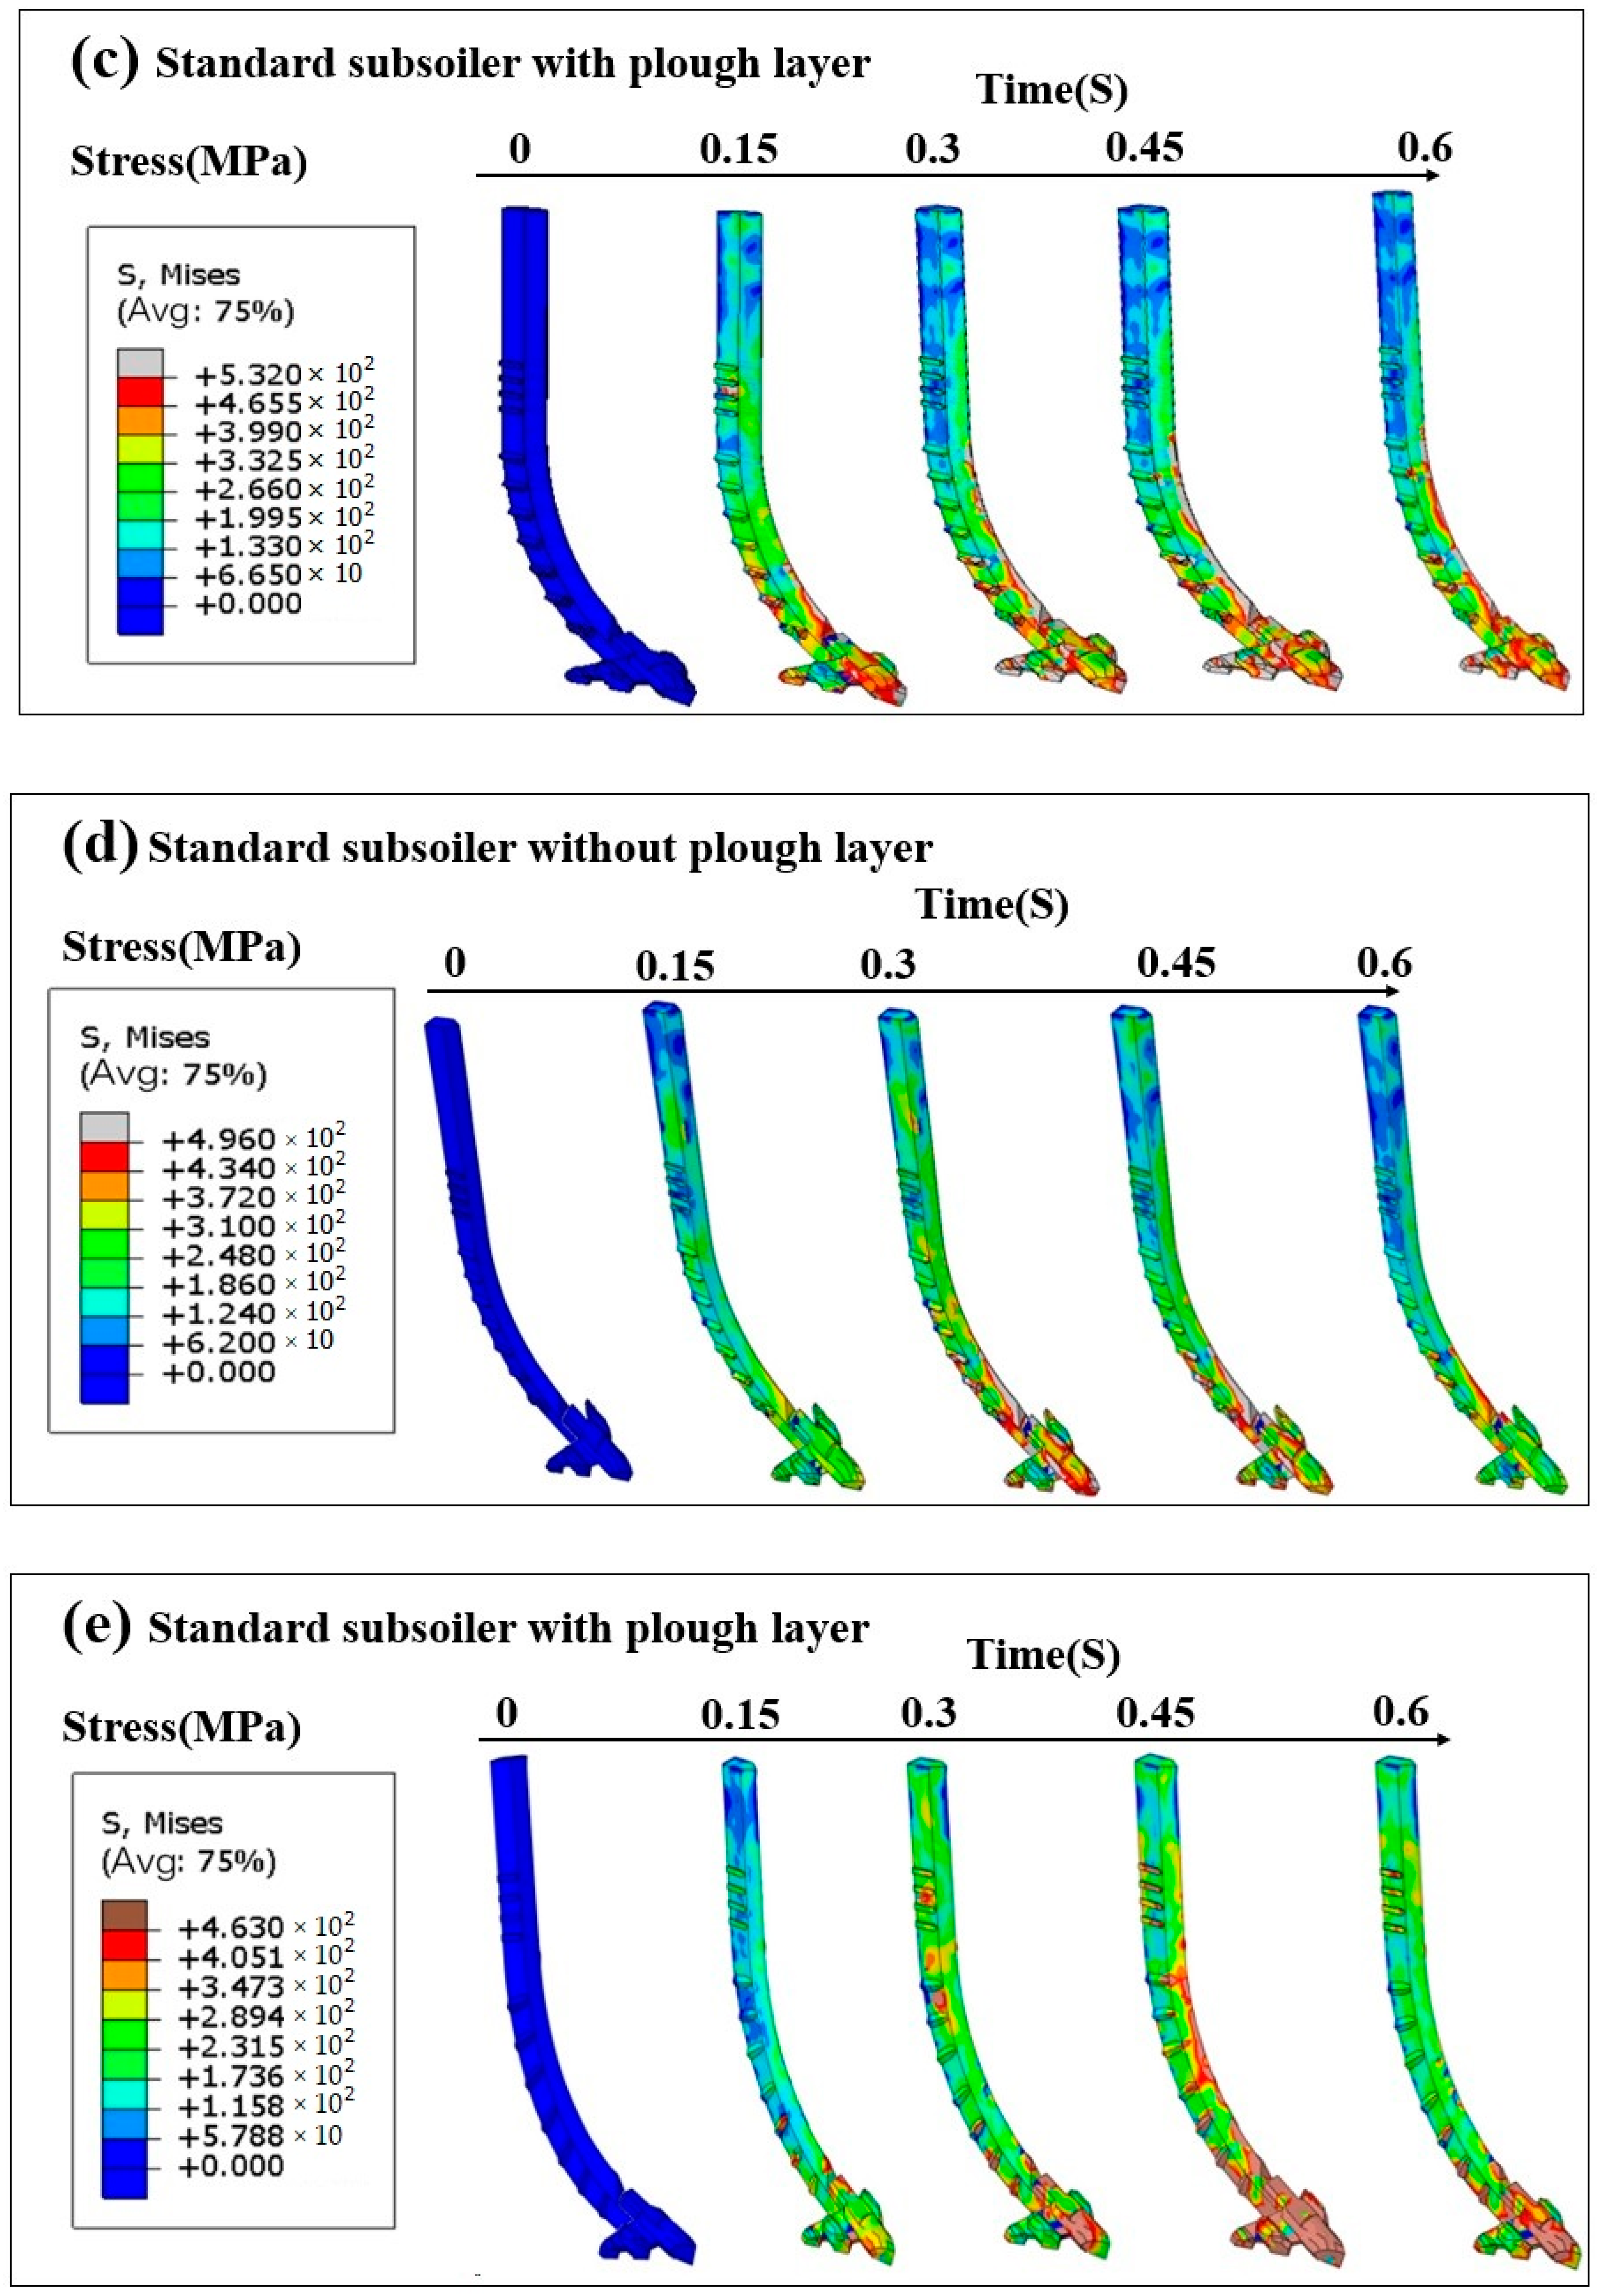
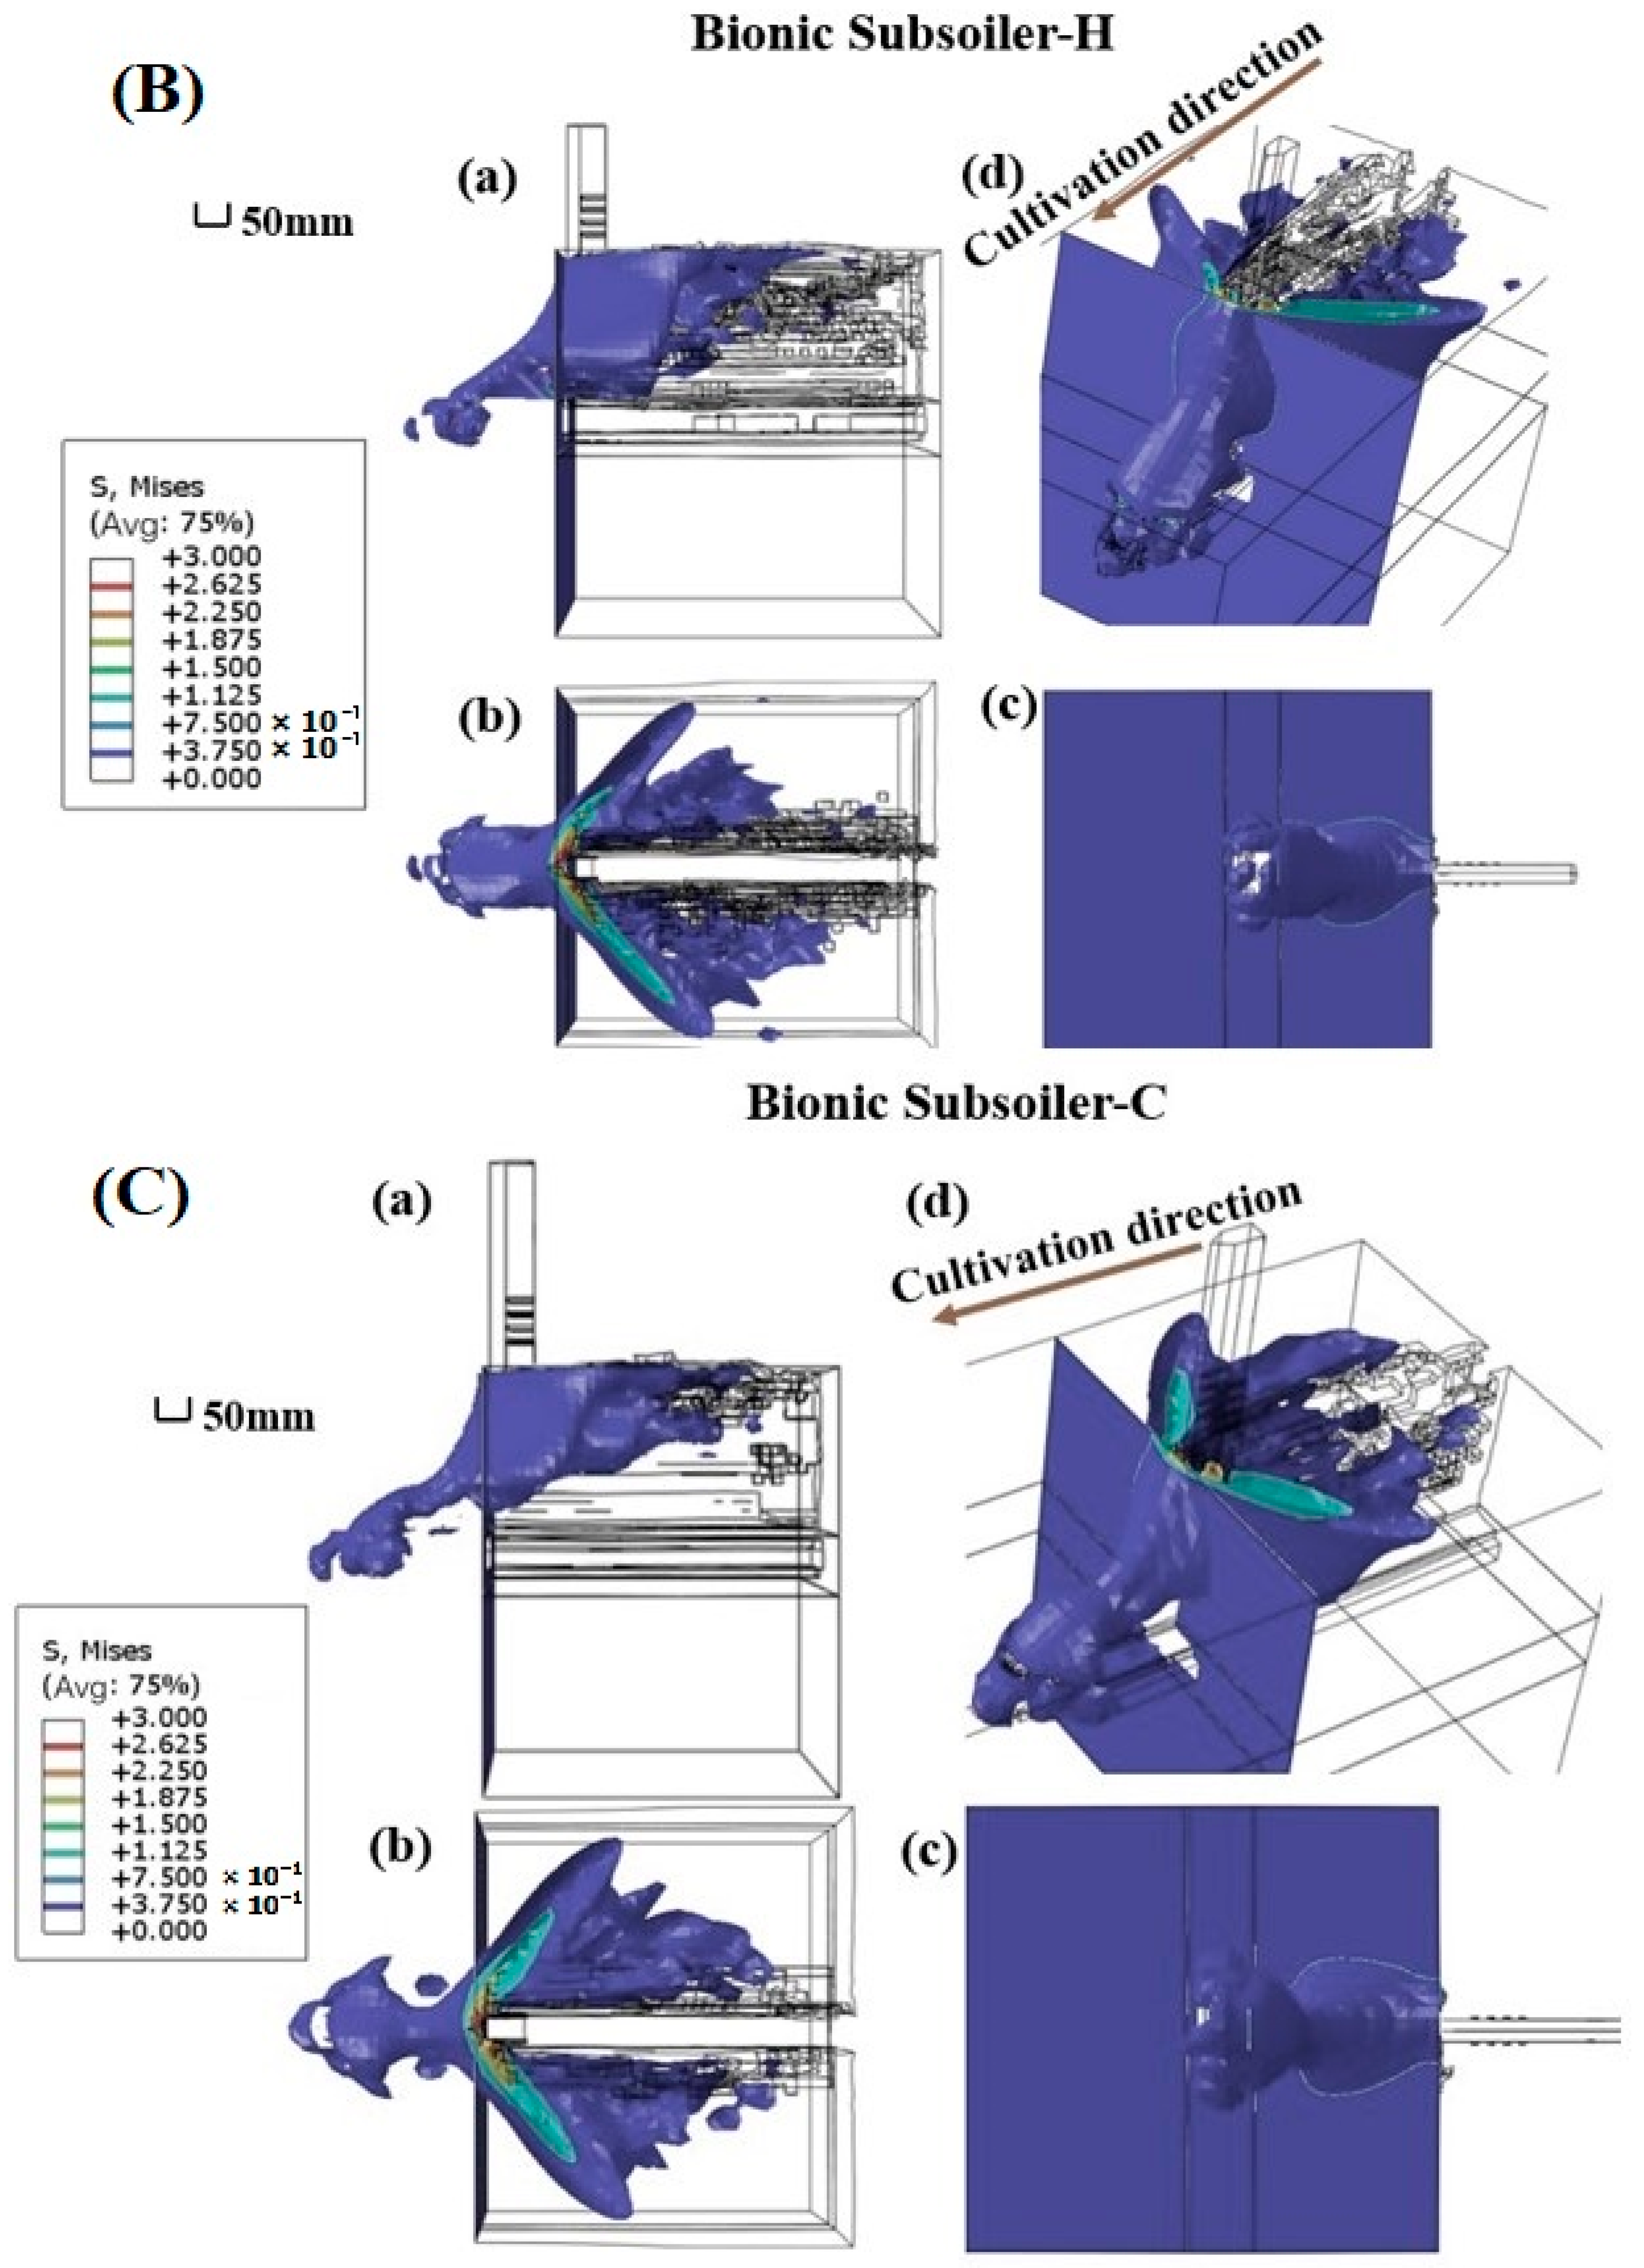
3.2.1. Stress of Subsoiler and Soil

Figure 7 shows the stress distribution of the subsoilers in the soil–subsoiler FEM corresponding to Figure 5a–f at different analysis times. Figure 7 shows that the stress of the subsoiler varied significantly among the different soil–subsoiler combination models. The stress distribution of the standard subsoiler was on the surface of the subsoiler tip and the soil contact edge of the subsoiler shaft, which was consistent with the actual wear of a subsoiler used for a long period of time. The main wear areas of the subsoiler were the surface of the shovel tip and the soil contact edge of the subsoiler shaft, which was consistent with the stress distribution in the finite element analysis. And the same conclusion has also been obtained in the discrete element analysis [29]. Therefore, the stress distribution in the model analysis could be used to characterize the wear state of the subsoilers.
Figure 8 shows the draft force and vertical downwards force in the FEM analysis. In different soil models, the force acting on the subsoiler was related to the characteristics of the soil. During the FEM analysis process, the standard subsoiler required the maximum draft force, and the average draft force in the FEM with a plough pan layer was approximately 18.41%, which was greater than that in the model without a plough pan layer. Compared with that of the standard subsoiler, the draft force of the bionic subsoiler-C in the soil model with and without plough pan layers was reduced by 12.7% and 16.4%, respectively. Moreover, there were significant differences in the influence of different subsoiler structures on the draft force. Compared with those of the standard subsoilers, the average draft forces of bionic subsoiler-H and bionic subsoiler-C in the plough soil models decreased by 16.29% and 23.67%, respectively. Ian Torotwa also reached the same conclusion when using the bionic curve for the contour on the toothed discs [30]. The variation regulation of the draft force was consistent with the variation regulation of simulated tillage stress in the subsoiler, as shown in Figure 8.
During the process of cutting soil with a subsoiler, soil slippage occurs near the surface of the subsoiler, forming a soil wedge [31]. The soil wedge is the soil block formed by the soil at the front of the tine at all tine widths [32]. After the soil bin test, the presence of soil wedges can be observed at the front of the subsoiler, as shown in Figure 9a.
In order to simulate the actual working conditions of subsoiling work, the classic soil mechanical model was utilized. Throughout the subsoiling work, the wedge-shaped soil at the front of the standard subsoiler pushes the soil forwards and upwards, forming a clear crescent failure-shaped structure, as shown in Figure 9b,c.
First, under the simulated tillage conditions of a standard subsoiler, a soil failure model at a certain speed was established on the basis of the Mohr–Coulomb (M-C) yield criterion shown in Figure 1. A mathematical model combining a soil wedge and crescent failure-shaped structure was used to represent the soil-cutting resistance of the subsoiler as follows:
F t o t a l = ( ρ g H 2 N ρ + c H N c ) w + Q H N Q + ρ H v 2 N Q ( w + 0.6 H ) F h = F t o t a l s i n ( θ 2 + θ w ) F v = F t o t a l c o s ( θ 2 + θ w )
where Ftotal, Fh, and Fv are the total cutting resistance, horizontal cutting resistance, and vertical cutting resistance of the subsoiler, respectively. ρ is the soil density, g is the gravitational acceleration, H is the working depth of the subsoiler, w is the width of the subsoiler, θW is the horizontal angle between the subsoiler and the soil during the operation process, θ is the angle formed with the soil wedge, v is the working speed of the subsoiler, and Nρ, Nc, and NQ are coefficients related to the soil density, soil cohesion, and soil pressure around the subsoiler, respectively.
Many researchers [3,33] have studied the damage to subsoilers and soil through the classical soil damage model, proving that the damage to soil caused by standard crank double-wing subsoiler cultivation conforms to the soil damage model established by the classical mathematical model. In this study, the speed factor ρHv2NQ(w + 0.6H) was added, and a modified soil damage model was established, as shown in Figure 9a. Owing to the addition of the characteristic structure of the mole’s claw to the bionic subsoiler, the working model of the bionic subsoiler was established, as shown in Figure 9b. During the working process of the bionic subsoiler, referring to the arrangement of the mole claw, multiple effective soil structures based on bionic characteristics were formed in the soil failure model, in which the crescent failure-shaped structure was superimposed, so the classical model lost its theoretical basis in the soil interaction. To further study the stress of the bionic subsoiler during the tillage process, a finite element analysis model of the soil–subsoiler (Figure 1) was used to simulate the soil morphology and structure.

3.2.2. Soil Failure Analysis

Figure 10a shows the soil failure model of the standard subsoiler during operation. In the Abaqus FEM simulating the tillage process, wedge-shaped soil blocks were formed at the front of the subsoiler, whose shapes were consistent with those in the standard subsoiler soil failure model shown in Figure 10a. That is, during the subsoiling process, similar wedge-shaped soil blocks and crescent failure-shaped structures were formed at the front of the subsoiler in both the model simulation and in the soil bin experiment. The soil–subsoiler model could truly reflect the stress of the subsoiler and the change in soil structure during the tillage process. It is assumed that the soil failure model of the bionic subsoiler in the tillage process can be established according to the classical soil mechanical model. As shown in Figure 10c, many soil shear planes corresponding to the toes of the claws were formed in the wedge-shaped soil block by the bionic subsoiler, and they interfered with each other. The conclusions drawn by Pásthy, L. et al. [23] regarding the application of the FEM in optimizing the geometric shape of tillage tools are consistent with the design of the biomimetic subsoil machine in this study. Due to the complex characteristics of the structure, the classical mathematical model cannot accurately predict the force and shape structure changes in the wedge-shaped soil block at the front of the subsoiler during the continuous tillage process [12]. Unlike the standard subsoiler’s wedge-shaped soil block (Figure 10A), bionic subsoilers create multiple shear planes (Figure 10B,C), disrupting classical failure patterns. The FEM uniquely captures these complex interactions, which cannot be modelled via traditional soil mechanics due to the tools’ irregular geometries.

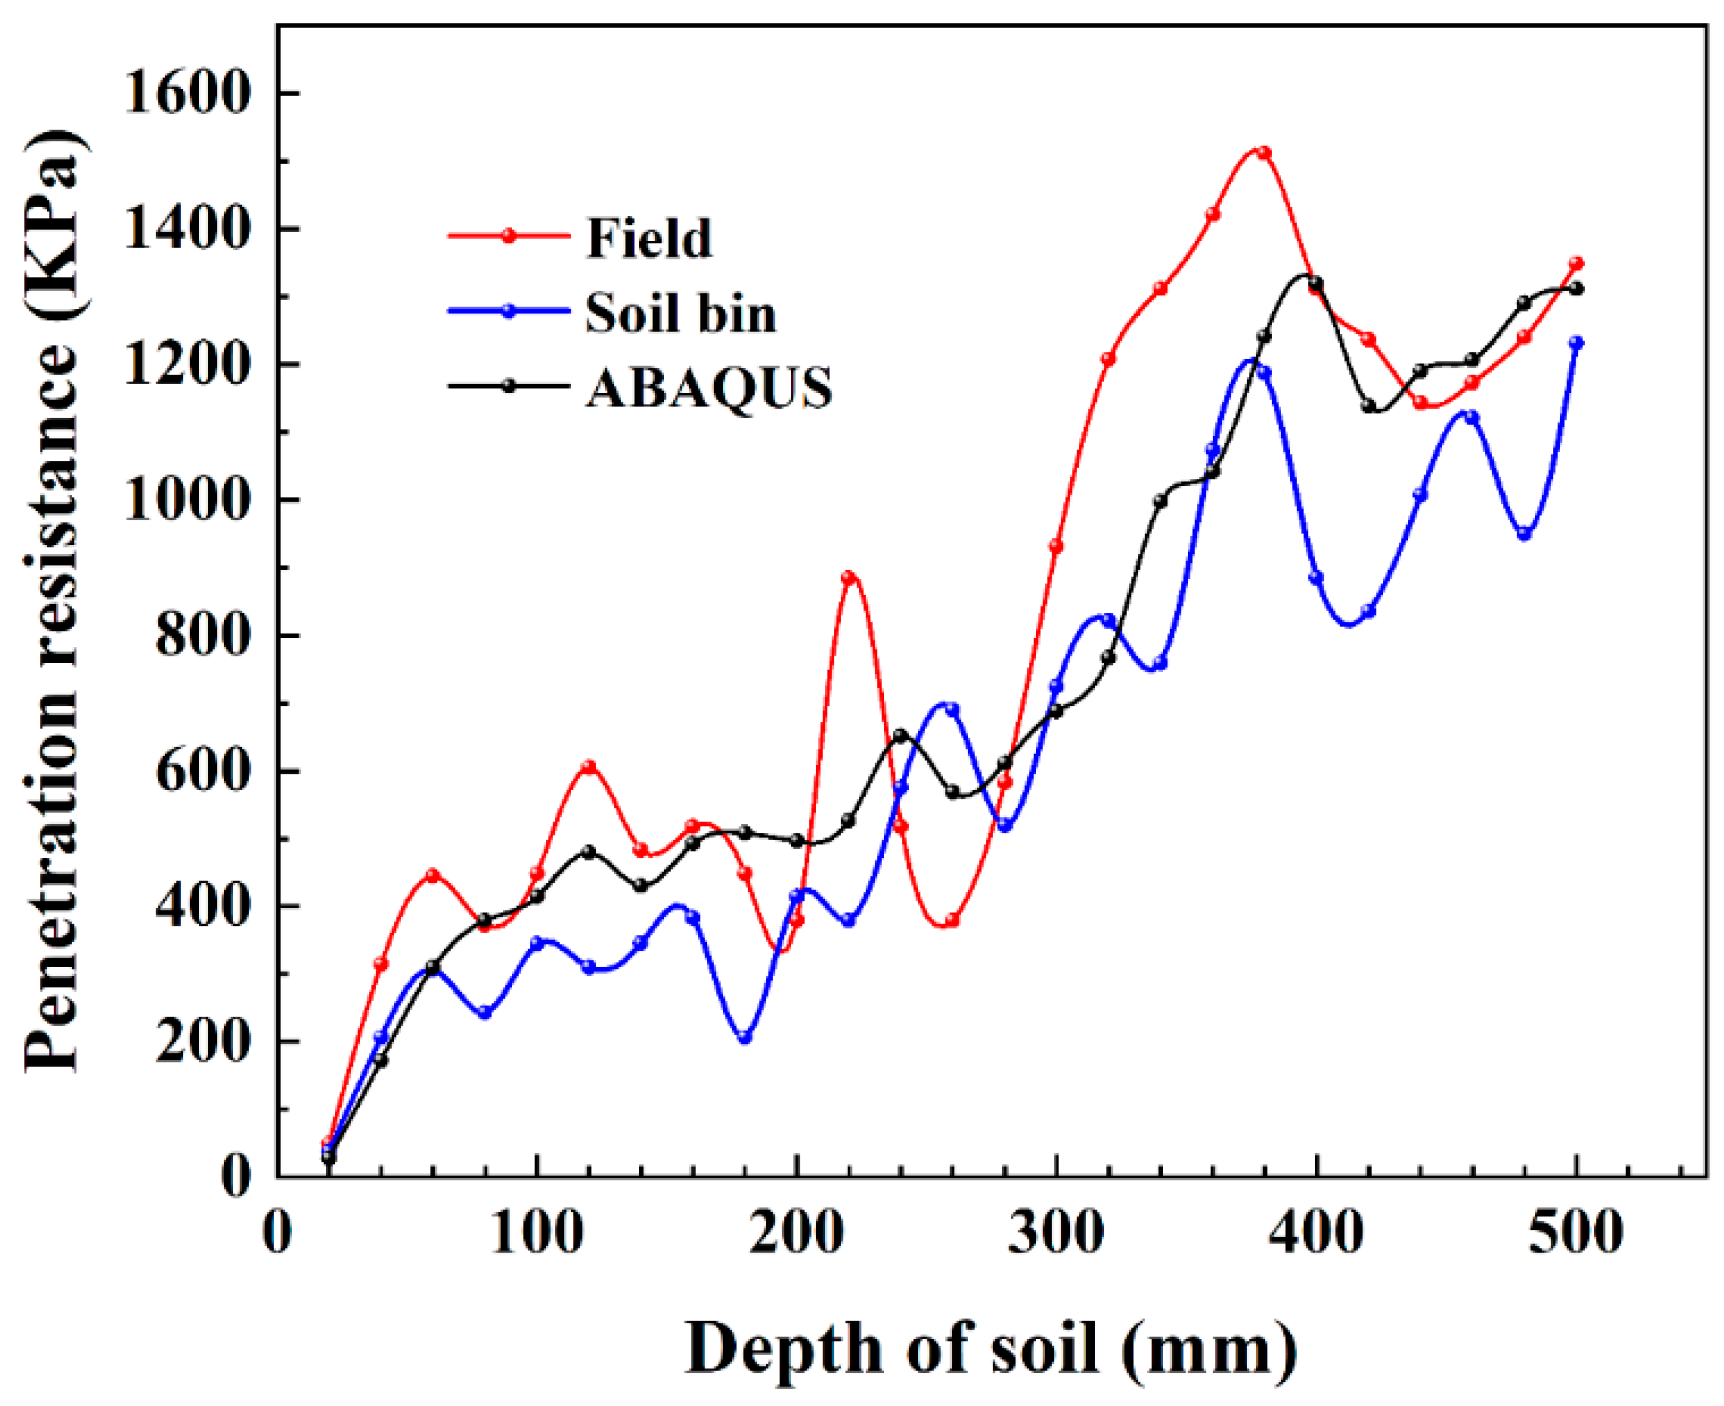
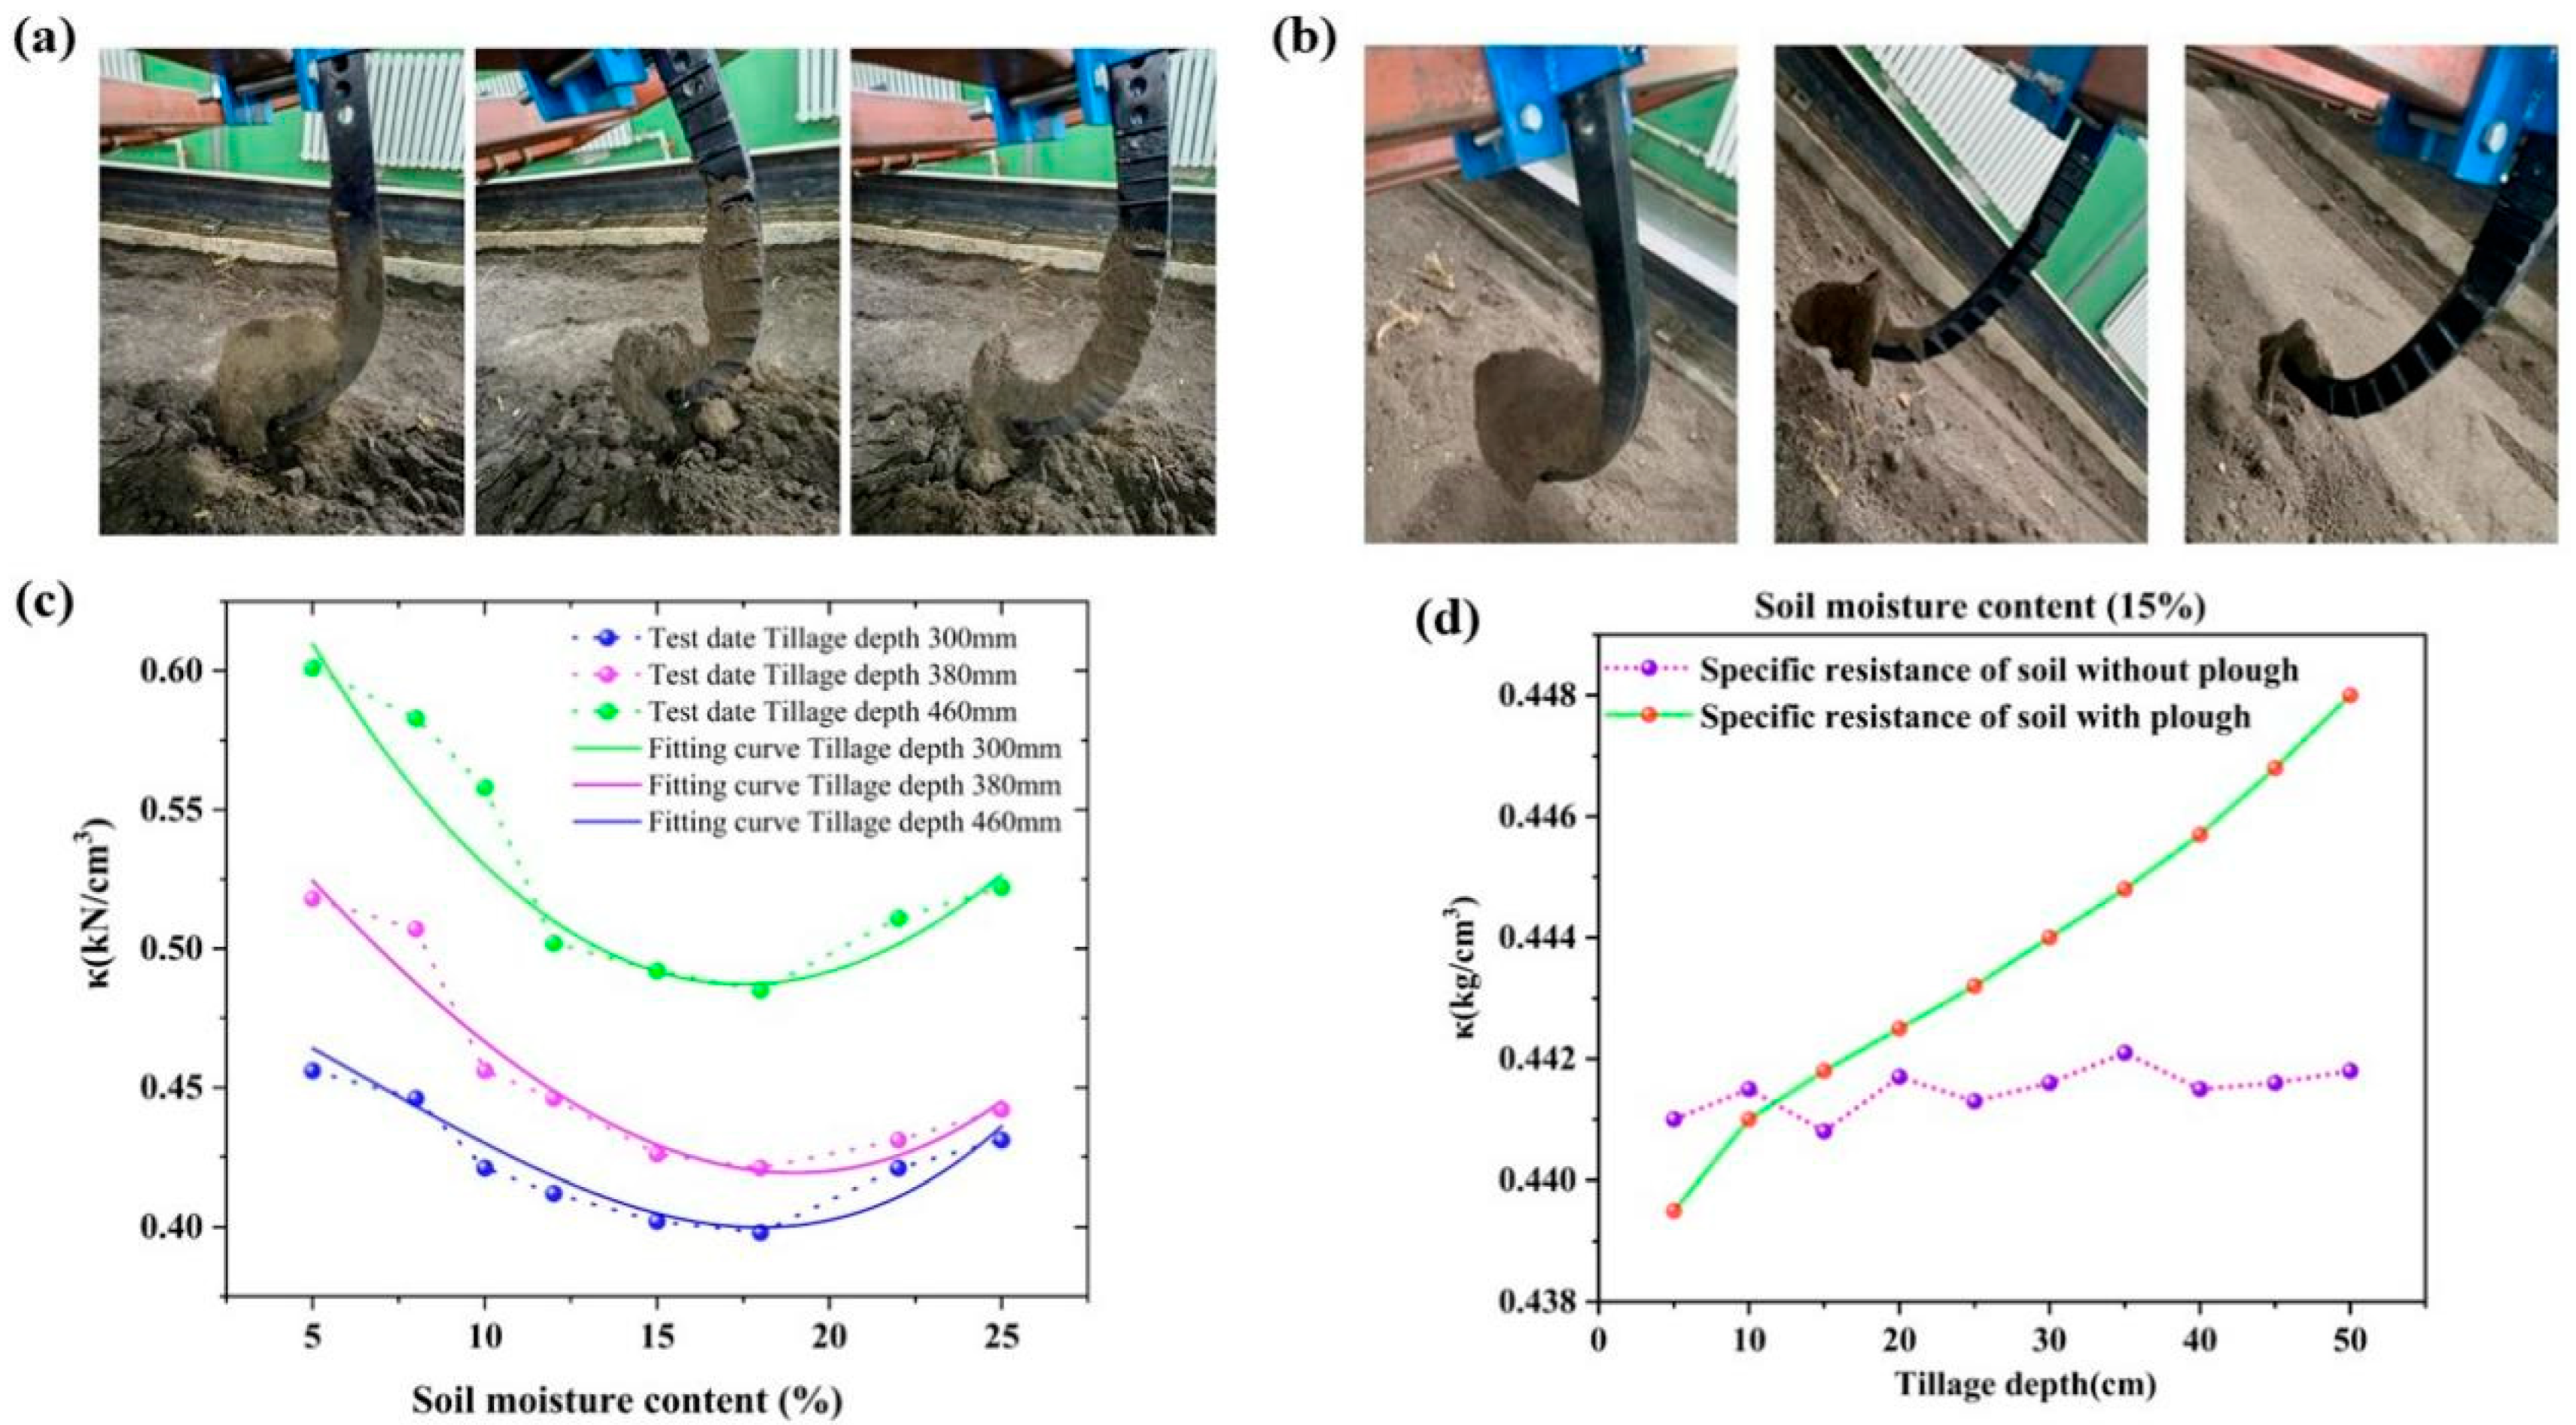
3.3. Verification of Model Accuracy Through Soil Bin Testing

The accuracy of the model was verified via soil bin experiments conducted under controlled conditions. The cultivable working length of the soil in the soil bin was 20 m, with a subsoiling depth of 380 mm. Five replicate measurements were taken at different longitudinal positions within the soil bin to account for spatial variability, yielding a mean draft force of 10,235 ± 100 N. Compared with the draft force value (9368 N) obtained in the simulation analysis, the error was 8.47%, indicating that the soil model parameters established by the Abaqus FEM were reasonable and that the establishment of a plough pan layer could simulate the actual behaviour of the plough pan layer in the field. This replicate design aligns with Celik et al. [34], who demonstrated that 5–7 test points effectively capture tillage tool performance variability. The established model can be used to analyze and study the stress, friction and wear, and soil cutting in the process of bionic subsoiler cultivation. The errors of the draft force for the standard and bionic subsoilers obtained in this study were within the error range from 5.17% to 30.19% for the equivalent stress values between the experimental and simulation results reported in the literature [34], where FEM-based stress analysis was employed in order to simulate the deformation behaviour of the Para-Plough tillage tool under consideration of the maximum loading (worst-case scenario) conditions tested in the field. The vertical force of the subsoiler was related to its soil penetration performance. Compared with that of the standard subsoiler and the bionic subsoiler-H, the vertical force of the bionic subsoiler-C was greater in the soil penetration stage. It can be concluded that when the soil properties are the same, bionic subsoiler-C has better soil-cutting performance in the process of soil penetration.
The data points were screened using the Grubbs’ test for outliers, which identified no extreme values in the draft force dataset (p > 0.05). The remaining data were normally distributed (Shapiro–Wilk test, p = 0.89), ensuring statistical validity. The simulated draft force of 9368 N was derived from three independent FEM runs with identical parameters, averaging to minimize computational noise. The resulting error of 8.47% falls within the 5.17–30.19% error range reported in comparable studies on tillage tool simulations, validating the model’s feasibility.
The wedge-shaped soil block shapes in the front of the standard subsoiler and the bionic subsoilers after the subsoiling experiments in soils with different moisture contents are shown in Figure 11a,b. It can be noted that the wedge-shaped soil blocks formed by subsoiling tillage were closely related to the shape and structure of the subsoiler, but were not much related to the soil moisture content. Moreover, after the subsoiling operation, large wedge-shaped soil blocks were formed at the front of the standard subsoiler, whereas no obvious wedge-shaped soil blocks were formed at the front of the bionic subsoilers, which was consistent with the simulation and analysis results of the Abaqus finite element model shown in Figure 10, indicating that the data simulated by the soil–subsoiler model established in this study can be used to guide the subsoiling tillage.
The soil moisture content significantly influences subsoiler performance by altering soil cohesion and friction. In the study, the plough pan layer had a higher moisture content (15.13%) compared to the cultivated layer (10.21%). Higher moisture reduces the soil hardness, decreasing the draft force initially, but excessive moisture (e.g., 17%) increases soil adhesion, leading to a U-shaped relationship between moisture and specific resistance. For bionic subsoilers, lower moisture (5%) enhances the soil fragmentation efficiency due to reduced plasticity, while higher moisture (15%) improves the cutting performance by weakening the inter-particle bonds.

4. Discussion

4.1. Stress Analysis of the Soil Tillage Dynamics Model

The stress distribution and mechanical behaviour of subsoilers during tillage are critical for understanding their wear and efficiency. Finite element analysis shows that bionic subsoilers exhibit significantly lower stress distributions than standard subsoilers when the other parameters are consistent. Through analysis, it could be seen that when the other parameters remained consistent, the finite element analysis results could better reflect the stress distribution and stress situation of the subsoiler, as well as the damage situation of the subsoilers. Compared with that of the standard subsoiler, the stress distribution of the bionic subsoiler-H was significantly lower, with a maximum stress reduction of 52.96%. The stress of the bionic subsoiler-C could be reduced by 12.97% compared with the stress of the bionic subsoiler-H. Through simulation analysis, it could be seen that during the working process of the subsoiler, the stress first increased, then decreased, and finally reached a stable state. Therefore, the bionic subsoiler designed based on the mole claw had better soil-cutting performance, which could effectively enhance the soil-cutting performance of the subsoiler and reduce the maximum stress on the subsoiler during the working process. Additionally, Armin et al.’s [35] work on soil–blade interaction validates the positive correlation between the soil bulk density and cutting force, supporting our results on plough pan layer stress concentration.
The presence of a plough pan layer further influences subsoiler stress dynamics. Through a finite element analysis of the soil model, it was found that the stress value of the subsoiler in the soil model with a plough pan layer was greater than that in the soil model without a plough pan layer. Compared with those of the soil model with a plough layer, the average stress values of the standard subsoiler, bionic subsoiler-H, and bionic subsoiler-C in the models without a plough pan layer were reduced by 13.97%, 6.67%, and 7.1% lower, respectively. The above conclusions indicate that the structural improvement of the shovel tip effectively reduced the resistance during the subsoiling process, which was verified via finite element software. This finding is consistent with the conclusion of Tong et al. [36], who reported that different tines of the subsoiler have a significant effect on the draft force and that increasing the number of tines on a subsoiler could effectively reduce the subsoiling resistance. Moreover, from the stress cloud map of the subsoiler, the stress distribution of the subsoiler in the soil model without a plough pan layer was relatively uniform, whereas in the soil model with a plough pan layer, owing to the maximum deformation and wear of the shovel tip during the operation of the subsoiler, the maximum stress distribution of the subsoiler was at the tip of the subsoiler. These results indicate that the higher the soil bulk density is, the tighter the soil, and the greater the cutting force required for cutting. Armin et al. [35] used the nonassociated Drucker–Prager constitutive law to describe the soil behaviour, as well as the separation criterion based on the compaction strain simulation of the soil being cut by the blades. They concluded that there was a significant positive correlation between the cutting force and the soil bulk density.
The above results show that the addition of a plough pan layer in the Abaqus FEM could effectively reflect the actual situation of cultivated soil, and that the model analysis of the tillage process could reflect the real stress of the subsoilers in the tillage process. Modelling subsoiling tillage simulation by collecting data can effectively reflect the improvement in soil after subsoiling, and can also reflect the stress conditions of tillage components in tillage, which can guide the optimal design of tillage components.
To analyze the stress of the subsoilers more accurately during the tillage process, the curves of the draft force and vertical force with time in the model analysis process were derived, and the stress changes in the subsoilers during the tillage process in different model analyses were obtained to understand the stress changes and damage to the soil during the tillage process, as well as the deformation and wear of the subsoilers.
The draft force–time graph shown in Figure 8a clearly shows that the established finite element soil–subsoiler tillage analysis model simulated and analyzed the subsoiling operation process, and that the draft force of the subsoiling first increased sharply and then decreased to a stable range. This conclusion is consistent with the research findings on the interaction between tillage components and the soil reported in the literature [3,37,38,39,40,41,42].

4.2. Soil Failure Analysis of the Soil Tillage Dynamics Model

The failure mode of soil during subsoiling is directly linked to subsoiler design and tillage efficiency. Figure 10A shows that during the subsoiling process with the standard subsoiler, there were always wedge-shaped soil blocks at the front of the standard subsoiler. During the cultivation process, the soil was extruded and deformed, which was similar to the deformation process of brittle materials. In subsoiling tillage, a wedge-shaped soil block is driven forwards by the standard subsoiler, and the soil at the front of the standard subsoiler is constantly forced ahead to then tear apart. Therefore, the failure mode of the shaft of the standard subsoiler in which the soil is partially cut and the soil is pushed forwards is fracture, which requires a large draft force. Ibrahmi et al. [37] also used the FEM to analyze the mouldboard plough–soil operation process and concluded that finite element analysis could be used to understand the effect of mouldboard plough design and operating conditions on tillage power, energy consumption, and soil turning quality. Moreover, when the wedge-shaped soil block is moved forwards, the soil in the front cultivated layer is lifted, which has a significant effect on the soil in the cultivated layer, which is inconsistent with the concept of conservation tillage [43].
Bionic subsoilers exhibit distinct soil failure mechanisms compared to standard designs. Standard subsoilers induced wedge-shaped soil blocks and crescent failure, while bionic subsoilers (H/C) created multiple shear planes via mole claw contours, fragmenting soil into smaller pieces. This shifted failure from bulk tearing to localized shearing, reducing the draft force by 16.29–23.67%. Figure 10B and Figure 10C simulate the state of the soil at the front of the subsoiler during the operation of the bionic subsoiler-H and the bionic subsoiler-C, respectively, and the views according to the drawing standard were saved for the convenience of research. The main views of the model analysis and prediction are shown in (a) of Figure 10B,C. This mechanism was supported by Wang et al. [29], who observed 30–40% less soil adhesion in shark-inspired subsoilers due to similar contact area reduction. Compared with those of the standard subsoiler, the wedge-shaped soil blocks at the front of the bionic subsoilers were significantly reduced, and the soil at the shovel shaft, especially at the contour index of the mole-shaped claw toe, was significantly reduced.
Moreover, the soil structure at the shovel shaft index section was obviously “thin” and could not form a crescent failure-shaped structure. The soil at the shovel tip was fractured and could not be connected. The shovel tip cuts the soil in front of it during the movement to achieve a good soil loosening effect, especially for improving the plough pan layer. The analysis results showed that the shaft of the bionic subsoiler can cut the soil well during subsoiling tillage, and that the damage to the soil caused by the bionic subsoiler was caused mainly by the shearing effect of the shaft of the bionic subsoiler, which is different from the tearing effect of the standard subsoiler on the soil. The top view and the left view of the model analysis and prediction are shown in (b) and (c) of Figure 10B and 10C, respectively. The combination of the two directions provides a clearer view that the soil at the tip of the subsoiler was irregularly distributed in small pieces along the bionic structure curve, and that the soil at the tip of the shovel was completely chopped. Through the main view, top view and left view, as well as the isometric view, it can be clearly observed that the bionic subsoilers can effectively loosen the soil, reduce the soil adhesion to the subsoilers, and reduce the resistance during the cultivation process. These findings indicated that the bionic subsoilers designed in this study effectively reduced resistance and viscosity. These results suggest that the narrow slit-shaped structure of the mole claw toe has a guiding effect on the soil movement, reducing the contact area between the subsoilers and the soil, destroying the seal of the soil, and reducing the adhesion of the soil to the subsoilers. Wang et al. [29] also optimized the structure of subsoilers and obtained the same results.
The soil fragmentation size was quantified using image analysis: standard subsoilers produced blocks ≥ 50 mm in diameter, while bionic subsoilers reduced this to <20 mm (p < 0.05, n = 20 soil samples per treatment). This correlates with the 12.7–23.67% draft force reduction, as smaller blocks require less energy to displace, consistent with Torotwa et al.’s findings on curved-edged discs [30].
A comparison of the analysis results shown in Figure 10B,C reveals that the destruction and failure of the soil by the bionic subsoiler-H and the bionic subsoiler-C were consistent during the cultivation process. The bionic subsoiler-H and bionic subsoiler-C have good cutting effects on the soil. There were no differences in the cutting effects of the shovel tips on the soil or the effects on the soil adhesion to the subsoilers. Compared with the bionic subsoiler-H, the soil adhesion on the handle of the bionic subsoiler-C was smaller, indicating that the handle with bionic claw toe characteristics according to the circular layout had a better effect on reducing the soil adhesion. From the above analysis, the software analysis was able to intuitively obtain the crushing form of the soil block at the front of the subsoilers, and the draft force values of the subsoilers were inversely proportional to the size of the soil block at the front of the subsoilers. That is, the better the cutting and crushing effect on the soil at the front of the subsoiler is, the smaller the draft force required during the subsoiling process. Compared with the standard subsoiler, the bionic subsoilers designed in this study based on the efficient mole excavation had stronger soil-cutting performance, lower adhesion to the soil, and less draft force required during the tillage process, achieving the goal of reducing energy consumption.

4.3. Prediction of Soil Cultivability via the Soil FEM

In soil cultivation research, the specific resistance of the soil is usually established to judge the cultivability of the soil and the difficulty of tillage. The specific resistance of the soil depends on its physical properties and the structure of the farming components. In this study, the specific resistance of the soil was affected mainly by the size of the subsoiler, the weight and surface coefficient of the subsoiler, the sharpness of the soil cut, and the degree of consolidation and moisture content of the soil. The mathematical equation of the specific resistance of the soil can be expressed as follows:
κ = f d f d G H w
where κ is the specific resistance of the soil (N), fd is the draft force of the subsoiling shovel, fd is the draft force coefficient of the subsoiler (half of the soil friction coefficient of subsoiler is often taken for calculation), G is the weight of the subsoiler, H is the tillage depth of the subsoiler, and w is the width of the subsoiler.
The relationship between the specific resistance of the cultivated soil and the soil moisture content (5–20%) is shown in Figure 11c. When the soil moisture content is low, the soil-specific resistance is high, and the soil is often broken into large pieces during the tillage process that are not easily broken. With increasing soil moisture content, capillary water gradually appears in the soil. At this point, the hardness and adhesion of the soil decrease. When the soil moisture content reaches approximately 10.5%, the soil-specific resistance begins to decrease. When the soil moisture content increases to approximately 17%, subsoiling tillage has the lowest resistance and the greatest degree of soil fragmentation. To better express the relationship between the soil-specific resistance and the soil moisture content, a cubic polynomial was used for fitting.
y = 9.15 e 6 x 3 + 1.42 e 4 x 2 0.01532 x + 0.59633
After fitting, the value of the evaluation coefficient, R2, was 0.98736.
According to the definition of soil-specific resistance, soil-specific resistance is related mainly to the structure of the subsoiler and the physical properties of the soil. The relevant test data simulated by the Abaqus finite element software are shown in Figure 10c. The soil moisture content had a significant effect on the tillage resistance. As the soil moisture content increased, the soil-specific resistance first decreased but then increased, which was consistent with the results of the soil bin test.
The soil bin test verified the simulation results of the Abaqus finite element model. After the subsoiling operation in the soil with a plough pan layer structure at moisture contents of 5% and 15%, the variations in the specific resistance of the soil with tillage depth were measured. In the plough pan layer, the soil-specific resistance also increased linearly with increasing tillage depth. However, there was no obvious relationship between the specific resistance of the soil and the tillage depth after subsoiling or tillage without a plough pan layer. The specific resistance basically remained unchanged with increasing tillage depth. The above conclusions show that the existence of a plough pan layer can be judged by the variation in the specific resistance depth. Celik [34] also successfully completed strength design analysis of the Para-Plough tool through the combination of CAD/CAE technology and experimental methods and verified the reliability of the simulation results, with an error value of 5.36%~30.19%. The research in this study indicated that CAD/CAE technology has broad application prospects in the field of agricultural machinery design and analysis that could improve product quality, shorten the design cycle, reduce costs, and bring new development opportunities to the agricultural machinery industry.

4.4. Prediction of Potential Environmental Impacts of Subsoiling

Subsoiling, as a critical tillage practice for breaking the plough pan layer, exerts dual-natured impacts on the environment. On the one hand, when executed appropriately, it serves as an effective measure to mitigate soil erosion. By causing minimal surface disturbance compared to conventional ploughing, subsoiling preserves the integrity of the soil structure and surface residue cover [44]. This residual layer functions as a natural shield, dampening the impact of raindrops and impeding the displacement of soil particles, thereby significantly reducing erosion risks [45].
Conversely, inappropriate subsoiling practices can exacerbate environmental degradation. Excessive subsoiling disrupts soil aggregates, rendering the soil more susceptible to wind and water erosion [5]. Dry soil subsoiling generates loose particles prone to wind displacement [46], while wet soil operations may lead to compaction and rutting, degrading soil infiltration and increasing runoff-induced soil loss [47,48]. In terms of carbon dynamics, subsoiling exposes protected organic matter to microorganisms, accelerating decomposition and carbon dioxide release [49]. However, it also improves soil aeration and water infiltration, promoting root growth and plant residue input, which could potentially sequester carbon in the long run [44].
The simulations conducted in this study offer a powerful tool for optimizing subsoiling operations to maximize soil protection. Through in-depth analysis of various subsoiling parameters, such as depth, intensity, and timing, our simulations can identify the optimal values that minimize negative environmental impacts. For example, by precisely calibrating the subsoiling depth, we can strike a balance between breaking the plough pan and preserving soil structure, thereby reducing erosion [50]. Similarly, optimizing the timing of subsoiling based on the soil moisture conditions can prevent carbon-intensive decomposition processes while enhancing carbon sequestration potential. These simulation-driven optimizations not only ensure the sustainable productivity of agricultural land, but also contribute to broader environmental conservation goals by minimizing soil erosion and optimizing carbon cycling.

5. Conclusions

In response to the limitations of traditional classical mechanics that can analyze only the interaction between simple structured tillage tools and soil, a new finite element simulation analysis method for the interaction between complex structured tillage tools and soil was successfully established in this study. This study demonstrates that bionic subsoiler designs and the FEM can significantly optimize subsoiling operations, with direct implications for energy savings, soil management, and sustainable agriculture. The soil failure model at the front of the complex bionic subsoiler constructed via finite element analysis accurately simulated the crushing shape of the soil block, which indicated that the draft force of the subsoiler during cultivation was inversely proportional to the size of the soil block at the front of the subsoiler. The better the cutting effect of the front soil, the smaller the draft force required for the subsoiling process. The error between the draft force obtained from the soil bin tests and the simulation analyses was 8.47%, indicating that the parameter settings of the soil model established via the Abaqus FEM were reasonable.
The bionic subsoiler-H reduces the draft force by 52.96% compared to the standard designs, translating to immediate fuel savings for farmers. This energy efficiency aligns with global efforts to lower agricultural carbon footprints. The establishment of the plough pan layer could simulate the actual working conditions of the field. Abaqus finite element analysis could not only effectively reflect the actual situation of field soil, but also accurately simulate and analyze the impact of soil fragmentation during the subsoiling and tillage process with complex structures. The simulation-driven optimization of subsoiling depth (e.g., 25–30 cm) and timing (based on soil moisture) ensures targeted plough pan disruption without excessive soil disturbance. This preserves surface residue cover, minimizing soil erosion risks and maintaining soil organic carbon levels. The constructed soil model effectively reflected the impact and variation patterns of subsoiling operations on soil dynamic characteristic information. Integrating these models with IoT sensors (e.g., soil moisture probes, GPS-guided tractors) could create intelligent tillage systems that adapt in real time to soil variability, further enhancing efficiency and sustainability, providing a theoretical basis and technical support for predicting and guiding cultivability, and providing a digital analysis foundation for the collection of intelligent tillage information.

Author Contributions

Conceptualization, W.S. and L.R.; methodology, W.S.; software, W.S. and J.W.; validation, Y.M., Y.G. and H.Z.; formal analysis, M.H.; investigation, L.R.; resources, W.S.; data curation, W.S.; writing—original draft preparation, W.S.; writing—review and editing, L.R.; visualization, J.W.; project administration, W.S.; funding acquisition, W.S. All authors have read and agreed to the published version of the manuscript.

Funding

This research was funded by the National Natural Science Foundation of China, grant number 32472003.

Institutional Review Board Statement

Not applicable.

Data Availability Statement

Data will be available on request.

Conflicts of Interest

The authors declare no conflicts of interest.

References

  1. Bai, H.; Zhou, X.; Zhao, Y.; Zhao, Y.; Han, Q. Soil CT image quality enhancement via an improved super-resolution reconstruction method based on GAN. Comput. Electron. Agric. 2023, 213, 108177. [Google Scholar] [CrossRef]
  2. Torotwa, I.; Ding, Q.; Makange, N.R.; Liang, L.; He, R. Performance evaluation of a biomimetically designed disc for dense-straw mulched conservation tillage. Soil Tillage Res. 2021, 212, 105068. [Google Scholar] [CrossRef]
  3. Ibrahmi, A.; Bentaher, H.; Hbaieb, M.; Maalej, A.; Mouazen, A.M. Study the effect of tool geometry and operational conditions on mouldboard plough forces and energy requirement: Part 1. Finite element simulation. Comput. Electron. Agric. 2015, 117, 258–267. [Google Scholar] [CrossRef]
  4. Patuk, I.; Hasegawa, H.; Borodin, I.; Whitaker, A.C.; Borowski, P.F. Simulation for Design and Material Selection of a Deep Placement Fertilizer Applicator for Soybean Cultivation. Open Eng. 2020, 10, 733–743. [Google Scholar] [CrossRef]
  5. Pulido-Moncada, M.; Katuwal, S.; Munkholm, L.J. Characterisation of soil pore structure anisotropy caused by the growth of bio-subsoilers. Geoderma 2022, 409, 115571. [Google Scholar] [CrossRef]
  6. Zhao, F.; Guo, Y.; Lai, S. Developed and test study on the subsoiler. In Proceedings of the 2011 International Conference on Electronic and Mechanical Engineering and Information Technology, Harbin, China, 12–14 August 2011. [Google Scholar] [CrossRef]
  7. Feng, T.; Xu, L.; Song, Y.; Li, F.; Song, Z. Design and Analysis of Bionic Rib Subsoiling Shovel Based on Hawaiian Shell. Proc. IOP Conf. Ser. Earth Environ. Sci. 2019, 267, 032048. [Google Scholar] [CrossRef]
  8. Qi, P.; Gao, F.; Qiu, L. The Finite Element Analysis and Simulation of the Gap Disc Trenching Based on ABAQUS. J. Agric. Mech. Res. 2016, 9, 64–73. [Google Scholar] [CrossRef]
  9. Kong, X.; Cai, G.; Cheng, Y.; Zhao, C. Numerical Implementation of Three-Dimensional Nonlinear Strength Model of Soil and Its Application in Slope Stability Analysis. Sustainability 2022, 14, 5127. [Google Scholar] [CrossRef]
  10. Anubhav; Wu, H. Modelling of Non-linear Shear Displacement Behaviour of Soil–Geotextile Interface. Int. J. Geosynth. Ground Eng. 2015, 1, 19. [Google Scholar] [CrossRef]
  11. Xu, X.; Dai, Z.H.; Chen, L.J.; Xu, X.T. Nonlinear Elastic-Perfectly Plastic Model of Soil and its Numerical Implementation and Application. Soil Mech. Found. Eng. 2022, 59, 215–224. [Google Scholar] [CrossRef]
  12. Ma, L.; Li, M.; Wang, W.; Cao, Y. FEM Analysis and Experimental Research of Vibration Compaction Based on Drucker-Prager Mode. J. Chongqing Jiaotong Univ. (Nat. Sci.) 2019, 38, 2–7. [Google Scholar] [CrossRef]
  13. Frenning, G. On the thermodynamic consistency of the Drucker–Prager Cap model: Modification of the plastic potential and analysis of unloading. Powder Technol. 2023, 423, 118503. [Google Scholar] [CrossRef]
  14. Liu, B.; Liu, Z.; Yang, L. Accelerating fracture simulation with phase field methods based on Drucker-Prager criterion. Front. Phys. 2023, 11, 1159566. [Google Scholar] [CrossRef]
  15. Stopa, R.; Komarnicki, P.; Kuta, Ł.; Szyjewicz, D.; Słupska, M. Modeling with the finite element method the influence of shaped elements of loading components on the surface pressure distribution of carrot roots. Comput. Electron. Agric. 2019, 167, 105046. [Google Scholar] [CrossRef]
  16. Zhang, Y.; Chen, Y.; Song, Y.; Zhang, R.; Wang, X. Finding the lowest damage picking mode for tomatoes based on finite element analysis. Comput. Electron. Agric. 2023, 204, 107536. [Google Scholar] [CrossRef]
  17. Hashiguchi, K.; Saitoh, K.; Okayasu, T.; Tsutsumi, S. Evaluation of typical conventional and unconventional plasticity models for prediction of softening behaviour of soils. Géotechnique 2002, 52, 561–578. [Google Scholar] [CrossRef]
  18. Liu, Z.; Wang, H.; Yuan, L.; Zhang, B.; Wang, W.; Ma, Z.; Xue, Y.; Li, Y. A new test method and system for the circumferential deformation of cylindrical standard specimens in geotechnical mechanics and its application. Measurement 2020, 149, 107041. [Google Scholar] [CrossRef]
  19. Karmakar, S.; Lal Kushwaha, R. CFD simulation of soil forces on a flat tillage tool. In Proceedings of the 2005 ASAE Annual International Meeting, Tampa, FL, USA, 17–20 July 2005. [Google Scholar]
  20. Zeng, Z.; Ma, X.; Chen, Y.; Qi, L. Modelling residue incorporation of selected chisel ploughing tools using the discrete element method (DEM). Soil Tillage Res. 2020, 197, 104505. [Google Scholar] [CrossRef]
  21. Li, J.; Jiang, X.; Ma, Y.; Tong, J.; Hu, B. Bionic design of a potato digging shovel with drag reduction based on the discrete element method (Dem) in clay soil. Appl. Sci. 2020, 10, 7096. [Google Scholar] [CrossRef]
  22. Vilca, N.S.; Gómez-Amador, A.M.; Jiménez de Cisneros Fonfría, J.J. Soil–Structure Interaction Analysis Using the Finite Element Method in Thin-Walled Steel Pipes Buried under Haul Roads. Appl. Sci. 2024, 14, 167. [Google Scholar] [CrossRef]
  23. Pásthy, L.; József Farkas, Z.; Haba, T.; Tamás, K. Development of a multi-way coupled discrete-finite element method simulation procedure for modelling soil-passive vibration tool interaction. Comput. Electron. Agric. 2024, 216, 108459. [Google Scholar] [CrossRef]
  24. Song, W.; Jiang, X.; Li, L.; Ren, L.; Tong, J. Increasing the width of disturbance of plough pan with bionic inspired subsoilers. Soil Tillage Res. 2022, 220, 105356. [Google Scholar] [CrossRef]
  25. JB/T 9788-1999; Subsoiler and Share Shaft. Chinese Standard Press: Beijing, China, 1999.
  26. Arvidsson, J.; Keller, T.; Gustafsson, K. Specific draught for mouldboard plough, chisel plough and disc harrow at different water contents. Soil Tillage Res. 2004, 79, 221–231. [Google Scholar] [CrossRef]
  27. Abo-Elnor, M.; Hamilton, R.; Boyle, J.T. Simulation of soil-blade interaction for sandy soil using advanced 3D finite element analysis. Soil Tillage Res. 2004, 75, 61–73. [Google Scholar] [CrossRef]
  28. Wang, S.; Liu, X.; Qi, H.; Xu, Z.; Ma, Y. Determination of Biomechanical Parameters and Development of an Improved FEM Model for Perennial Alfalfa (Medicago sativa L.) Roots. Agronomy 2024, 14, 3033. [Google Scholar] [CrossRef]
  29. Wang, Y.; Li, N.; Ma, Y.; Tong, J.; Pfleging, W.; Sun, J. Field experiments evaluating a biomimetic shark-inspired (BioS) subsoiler for tillage resistance reduction. Soil Tillage Res. 2020, 196, 104432. [Google Scholar] [CrossRef]
  30. Torotwa, I.; Ding, Q.; Alele, J.O.; He, R. 3D Finite Element Analysis of the Tillage and Straw Cutting Performance of a Curved-Edged Toothed Disc. Eng. Agric. 2022, 42, 10–17. [Google Scholar] [CrossRef]
  31. Jiang, X.; Tong, J.; Ma, Y.; Sun, J. Development and verification of a mathematical model for the specific resistance of a curved subsoiler. Biosyst. Eng. 2020, 190, 107–119. [Google Scholar] [CrossRef]
  32. Tamás, K.; Jóri, I.J.; Mouazen, A.M. Modelling soil-sweep interaction with discrete element method. Soil Tillage Res. 2013, 134, 223–231. [Google Scholar] [CrossRef]
  33. He, C.; You, Y.; Wang, D.; Wang, G.; Lu, D.; Morris Togo Kaji, J. The effect of tine geometry during vertical movement on soil penetration resistance using finite element analysis. Comput. Electron. Agric. 2016, 130, 97–108. [Google Scholar] [CrossRef]
  34. Celik, H.K.; Caglayan, N.; Topakci, M.; Rennie, A.E.W.; Akinci, I. Strength-based design analysis of a Para-Plow tillage tool. Comput. Electron. Agric. 2020, 169, 105168. [Google Scholar] [CrossRef]
  35. Armin, A.; Fotouhi, R.; Szyszkowski, W. On the FE modeling of soil-blade interaction in tillage operations. Finite Elem. Anal. Des. 2014, 92, 1–11. [Google Scholar] [CrossRef]
  36. Tong, J.; Jiang, X.H.; Wang, Y.M.; Ma, Y.H.; Li, J.W.; Sun, J.Y. Tillage force and disturbance characteristics of different geometric-shaped subsoilers via DEM. Adv. Manuf. 2020, 8, 392–404. [Google Scholar] [CrossRef]
  37. Ibrahmi, A.; Bentaher, H.; Hamza, E.; Maalej, A.; Mouazen, A.M. Study the effect of tool geometry and operational conditions on mouldboard plough forces and energy requirement: Part 2. Experimental validation with soil bin test. Comput. Electron. Agric. 2015, 117, 268–275. [Google Scholar] [CrossRef]
  38. Bahrami, M.; Naderi-Boldaji, M.; Ghanbarian, D.; Keller, T. Simulation of soil stress under plate sinkage loading: A comparison of finite element and discrete element methods. Soil Tillage Res. 2022, 223, 105463. [Google Scholar] [CrossRef]
  39. Xu, L.; Peng, X.; Lu, G. Dynamic Response Analysis of Gas Pipeline under Land slide Based on DEM-FEM Coupling. Sci. Technol. Eng. 2022, 22, 3518–3524. [Google Scholar]
  40. Li, B.; Wang, C.; Li, Y.; Zhang, S. Dynamic Response Study of Impulsive Force of Debris Flow Evaluation and Flexible Retaining Structure Based on SPH-DEM-FEM Coupling. Adv. Civ. Eng. 2021, 2021, 9098250. [Google Scholar] [CrossRef]
  41. Wang, Q.; Cao, X.; Wang, C.; Li, H.; He, J.; Lu, C. Research Progress of No/Minimum Tillage Corn Seeding Technology andMachine in Northeast Black Land of China. Trans. Chin. Soc. Agric. Eng. 2021, 52, 1–15. [Google Scholar] [CrossRef]
  42. Cheng, H.; Tang, H.; Wu, Q.; Li, G. An elasto-plasticity extended Cam-clay model for unsaturated soils usingexplicit integration algorithm in FEM with hydraulic hysteresis. Rock Soil Mech. 2020, 41, 676–686+694. [Google Scholar] [CrossRef]
  43. Tolooiyan, A.; Gavin, K. Modelling the Cone Penetration Test in sand using Cavity Expansion and Arbitrary Lagrangian Eulerian Finite Element Methods. Comput. Geotech. 2011, 38, 482–490. [Google Scholar] [CrossRef]
  44. Ning, T.; Liu, Z.; Hu, H.; Li, G.; Kuzyakov, Y. Physical, chemical and biological subsoiling for sustainable agriculture. Soil Tillage Res. 2022, 223, 105490. [Google Scholar] [CrossRef]
  45. Jin, H.; Huang, S.; Shi, D.; Li, J.; Li, J.; Li, Y.; Zhu, H. Effects of Different Tillage Practices on Soil Stability and Erodibility for Red Soil Sloping Farmland in Southern China. Agronomy 2023, 13, 1310. [Google Scholar] [CrossRef]
  46. Higaki, D.; Karki, K.K.; Gautam, C.S. Soil erosion control measures on degraded sloping lands: A case study in Midlands of Nepal. Aquat. Ecosyst. Health Manag. 2005, 8, 243–249. [Google Scholar] [CrossRef]
  47. Qin, K.; Zhao, Y.; Zhang, Y.; Cao, C.; Shen, Z. Lateral stress and its transmission law caused by operation of a double-wing subsoiler in sandy loam soil. Front. Environ. Sci. 2022, 10, 986361. [Google Scholar] [CrossRef]
  48. Håkansson, I. Subsoil compaction caused by heavy vehicles-a long-term threat to soil productivity. Soil Tillage Res. 1994, 29, 105–110. [Google Scholar] [CrossRef]
  49. Possinger, A.R.; Weiglein, T.L.; Bowman, M.M.; Gallo, A.C.; Hatten, J.A.; Heckman, K.A.; Matosziuk, L.M.; Nave, L.E.; SanClements, M.D.; Swanston, C.W.; et al. Climate Effects on Subsoil Carbon Loss Mediated by Soil Chemistry. Environ. Sci. Technol. 2021, 55, 16224–16235. [Google Scholar] [CrossRef]
  50. Lou, S.; He, J.; Li, H.; Wang, Q.; Lu, C.; Liu, W.; Liu, P.; Zhang, Z.; Li, H. Current knowledge and future directions for improving subsoiling quality and reducing energy consumption in conservation fields. Agriculture 2021, 11, 575. [Google Scholar] [CrossRef]
Figure 1. (a) Yielded curve of M-C criterion, D-P criterion, and extended D-P criterion in π plane, (b) schematic diagram of field soil collection points, (c) schematic diagram of soil shear strength envelope UU test, (d) comparison of soil samples before and after triaxial UU shear test, and (e) finite element model of cultivated soil.
Agriculture 15 01355 g001
Figure 2. Penetration resistance values of the soil at different depths in field, soil bin, and Abaqus.
Agriculture 15 01355 g002
Figure 3. Design of bionic subsoilers inspired by mole’s claw.
Agriculture 15 01355 g003
Figure 4. (a) Coupling of reference point and surface motion of subsoiler, (b) motion loading of the subsoiler in the FEM, and (c) effect of mesh division of FEM on draft force.
Agriculture 15 01355 g004
Figure 5. Subsoiler–soil analysis model: standard subsoiler soil model (a) with plough layer and (b) without plough layer, bionic subsoiler-H soil model (c) with plough layer and (d) without plough layer, bionic subsoiler-C soil model (e) with plough layer and (f) without plough layer. And stress diagram of subsoiler at (g) share shaft and (h) shovel tip.
Agriculture 15 01355 g005
Figure 6. (a) Soil bin test system, car sensor installation and data acquisition, and preparation of soil samples in soil bin: (b) rotary tillage, (c) compaction, (d) soil samples with soil moisture content of 15%, and (e) soil samples with soil moisture content of 7%.
Agriculture 15 01355 g006
Figure 7. Stress distribution of soil–subsoiler FEM model: standard subsoiler soil model (a) with plough layer and (b) without plough layer, bionic subsoiler-H soil model (c) with plough layer and (d) without plough layer, and bionic subsoiler-C soil model (e) with plough layer and (f) without plough layer.
Agriculture 15 01355 g007aAgriculture 15 01355 g007bAgriculture 15 01355 g007c
Figure 8. Stress diagram of FEM: (a) draft force and (b) vertical downward force.
Agriculture 15 01355 g008
Figure 9. (a) Soil wedge at the front of subsoiler, failure model of (b) standard subsoiler soil and (c) bionic subsoiler soil.
Agriculture 15 01355 g009
Figure 10. Soil failure model of standard subsoiler (A), bionic subsoiler-H (B), and bionic subsoiler-C (C). And main view (a), top view (b), left view (c), and isometric view (d) of the soil failure model.
Agriculture 15 01355 g010aAgriculture 15 01355 g010b
Figure 11. Shape of the soil wedge at the front of the subsoiler after the soil bin test with the soil moisture content of 15% (a) and 5% (b). And relationship between soil-specific resistance and water content (c) at different tillage depths, and relationship between soil-specific resistance and tillage depth (d) at a soil moisture content of 15%.
Agriculture 15 01355 g011
Table 1. Mechanical characteristics of soil in Abaqus finite element software.
ParameterCultivated LayerPlough Pan LayerSubsoil Layer
ρ Volume density (mg·m−3)1.411.671.53
E Young’s modulus (MPa)2.32.612.52
β Friction angle (°)24.7324.7324.73
Soil moisture content (%)10.2115.1310.62
ν Poisson’s ratio0.30.30.3
k Flow Stress ratio0.86680.86680.8668
Ψ Dilation angle (°)000
Table 2. Soil parameters of experimental field.
Measurement ItemsDepth From Surface (mm)
Cultivated LayerPlough Pan LayerSubsoil Layer
0–120120–300300–380380–640
Soil particle density (g·cm−3)2.62 ± 0.01 a2.70 ± 0.02 b2.60 ± 0.01 a2.62 ± 0.02 a
Soil dry bulk density (g·cm−3)1.36 ± 0.01 a1.44 ± 0.01 b1.67 ± 0.01 d1.53 ± 0.01 c
Soil moisture content (%)5.31 ± 0.01 a10.2 ± 0.01 c13.6 ± 0.01 c9.1 ± 0.01 b
Note: Values are given as mean ± standard deviation. Different letters in the same horizontal row indicate significantly different (p < 0.05) when analyzed via Duncan’s New Multiple Range Test.
Table 3. Particle distribution of soil samples.
Measurement ItemsDepth From Surface (mm)
Cultivated LayerPlough Pan LayerSubsoil Layer
0–300300–380380–640
Soil texture classificationsandsiltclaysandsiltclaysandsiltclay
Percentage of particle size47.839.113.148.639.312.147.239.213.6
Disclaimer/Publisher’s Note: The statements, opinions and data contained in all publications are solely those of the individual author(s) and contributor(s) and not of MDPI and/or the editor(s). MDPI and/or the editor(s) disclaim responsibility for any injury to people or property resulting from any ideas, methods, instructions or products referred to in the content.

