Article

Evaluating Coupling Security and Joint Risks in Northeast China Agricultural Systems Based on Copula Functions and the Rel–Cor–Res Framework

1
Academy of Eco-Civilization Development for Jing-Jin-Ji Megalopolis, Tianjin Normal University, Tianjin 300387, China
2
State Key Laboratory of Water Cycle and Water Security in River Basin, China Institute of Water Resources and Hydropower Research (IWHR), Beijing 100038, China
3
State Key Laboratory of Hydroscience and Engineering, Tsinghua University, Beijing 100084, China
4
Key Laboratory of Water Safety for Beijing-Tianjin-Hebei Region of Ministry of Water Resources, Beijing 100038, China
5
General Institute of Water Conservancy Resources and Hydropower Planning and Design, Ministry of Water Resources, Beijing 100120, China
*
Author to whom correspondence should be addressed.
Agriculture 2025, 15(13), 1338; https://doi.org/10.3390/agriculture15131338 (registering DOI)
Submission received: 21 May 2025 / Revised: 16 June 2025 / Accepted: 18 June 2025 / Published: 21 June 2025
(This article belongs to the Section Agricultural Economics, Policies and Rural Management)

Abstract

:
Ensuring the security of agricultural systems is essential for achieving national food security and sustainable development. Given that agricultural systems are inherently complex and composed of coupled subsystems—such as water, land, and energy—a comprehensive and multidimensional assessment of system security is necessary. This study focuses on Northeast China, a major food-producing region, and introduces the concept of agricultural system coupling security, defined as the integrated performance of an agricultural system in terms of resource adequacy, internal coordination, and adaptive resilience under external stress. To operationalize this concept, a coupling security evaluation framework is constructed based on three key dimensions: reliability (Rel), coordination (Cor), and resilience (Res). An Agricultural System Coupling Security Index (AS-CSI) is developed using the entropy weight method, the Criteria Importance Through Intercriteria Correlation (CRITIC) method, and the Technique for Order Preference by Similarity to Ideal Solution (TOPSIS) method, while obstacle factor diagnosis is employed to identify key constraints. Furthermore, bivariate and trivariate Copula models are used to estimate joint risk probabilities. The results show that from 2001 to 2022, the AS-CSI in Northeast China increased from 0.38 to 0.62, indicating a transition from insecurity to relative security. Among the provinces, Jilin exhibited the highest CSI due to balanced performance across all Rel-Cor-Res dimensions, while Liaoning experienced lower Rel, hindering its overall security level. Five indicators, including area under soil erosion control, reservoir storage capacity per capita, pesticide application amount, rural electricity consumption per capita, and proportion of agricultural water use, were identified as critical threats to regional agricultural system security. Copula-based risk analysis revealed that the probability of Rel–Cor reaching the relatively secure threshold (0.8) was the highest at 0.7643, and the probabilities for Rel–Res and Cor–Res to reach the same threshold were lower, at 0.7164 and 0.7318, respectively. The probability of Rel–Cor-Res reaching the relatively secure threshold (0.8) exceeds 0.54, with Jilin exhibiting the highest probability at 0.5538. This study provides valuable insights for transitioning from static assessments to dynamic risk identification and offers a scientific basis for enhancing regional sustainability and economic resilience in agricultural systems.

1. Introduction

Agricultural security is not only a fundamental cornerstone of national food security but also a key pillar supporting sustainable socio-economic development [1]. However, under the compounded effects of population growth, accelerated urbanization, resource constraints, climate change, and geopolitical conflicts [2,3,4,5,6,7], agricultural systems worldwide are facing unprecedented challenges. According to the Food and Agriculture Organization’s (FAO) 2022 report, approximately 900 million people globally are experiencing severe food insecurity, and 735 million are suffering from hunger [8,9]. In response, the United Nations’ (UN) 2030 Sustainable Development Goals (SDGs) explicitly identify “Zero Hunger” as Goal 2 [10], underscoring that agricultural security and sustainability have become central concerns for the international community. Moreover, agricultural systems play a pivotal role in advancing other SDGs, including Goals 1, 3, 6, and 7 [1]. Therefore, ensuring the security of agricultural systems is not only essential for achieving food security and sustainable development but also serves as a concrete response to the UN 2030 Agenda by promoting a development paradigm that integrates resource efficiency, economic resilience, and social equity.
Agricultural systems are inherently complex, involving interconnected subsystems such as water, land, and energy [11]. Their internal functioning relies on the coordinated support of critical resource elements—including water, land, and energy—while their external stability is shaped by broader forces such as economic development, social structure, and environmental change. Specifically, water resources provide irrigation necessary for crop growth and determine agricultural productivity; land resources offer physical space and soil conditions that influence the scale of production; and energy inputs fuel the entire production chain, driving the mechanization and modernization of agriculture [12,13]. At the same time, external factors such as capital investment, policy interventions, and natural disasters continue to influence the system’s operational stability and adaptive capacity [14,15,16]. Therefore, agricultural system security is not solely a matter of adequate resource provision—it is the result of a coordinated interaction among resource availability, production efficiency, and risk resistance. A comprehensive understanding and scientific assessment of agricultural system coupling security requires a multidimensional perspective that integrates these components to effectively diagnose internal mechanisms and risk structures within the system.
To comprehensively evaluate the security and sustainability of agricultural systems, numerous studies have explored regional agricultural development from the perspectives of resource carrying capacity, agricultural input–output efficiency, food security, land use structure, and ecological–environmental coordination [17,18,19,20,21,22,23]. These assessments have been supported by a variety of multi-criteria decision-making methods, including the fuzzy comprehensive evaluation [24,25], gray relational analysis [26,27], the Sustainable Agriculture Matrix [28], gravity models, and social network analysis approaches [29].
For instance, Sarkar et al. [30] used Partial Least Squares Structural Equation Modeling to explore how environmental, social, and economic factors interact and influence sustainable agriculture in Bangladesh, identifying key sustainability indicators. Bathaei and Štreimikienė [31] proposed a comprehensive set of 101 indicators spanning social, environmental, and economic dimensions to systematically evaluate sustainable agriculture. Cui et al. [32] established a multidimensional framework to assess high-quality agricultural development in the Yangtze River Economic Belt. Similarly, Yu and Wu [33] employed an entropy-weighted Technique for Order Preference by Similarity to Ideal Solution (TOPSIS) model, a Dagum Gini coefficient, and Markov chain analysis to evaluate agricultural development in Heilongjiang Province.
Meanwhile, water, land, energy, and food—recognized as core components of agricultural systems—are increasingly studied as a nexus system, reflecting their tightly coupled relationships and collective impact on agricultural security and sustainability [34,35,36,37,38]. For example, Correa-Cano et al. [39] developed an integrated water–energy–food–environment model combining irrigation simulation, economic analysis, and life cycle assessment.
Mirzaei et al. [40] built a multi-objective optimization model to maximize both the water–energy–food nexus index and agricultural profit, using the TOPSIS method to identify Pareto-optimal solutions that enhanced resource efficiency and reduced environmental risks. Ren et al. [41] proposed a water–energy–food–carbon optimization model to improve land and water resource allocation under uncertainty in China’s Yellow River Basin. Similarly, Yue et al. [42] introduced a novel imprecise multi-objective planning framework for the energy–water–food system by integrating social welfare, ecosystem service value, fuzzy logic, and nonlinear programming.
In the field of agricultural system security risk evaluation, a wide range of approaches have been employed, including climate model simulations [43], system dynamics models [44,45,46], and Bayesian networks [47,48]. These methods have been applied to investigate key aspects such as the alignment of agricultural and water resources, food production patterns, supply–demand balance, and system vulnerability [49,50,51,52]. Food production is heavily dependent on agricultural water inputs, with agriculture being the largest water-consuming sector globally. Therefore, the degree of alignment between regional agricultural development and water resource availability is a critical factor influencing food security risks [53]. Studies on food production patterns often evaluate food security by analyzing the spatiotemporal dynamics of crop yields and production potential [54].
Meanwhile, under the regulation of market mechanisms, food trade serves as a vital means to bridge supply–demand gaps and mitigate regional food insecurity; consequently, the equilibrium between food supply and demand has become a key indicator of agricultural system stability [55,56].
For example, Chen et al. [57] developed a novel food security risk assessment framework that integrates water scarcity, agricultural production, and food trade. In order to better identify systemic risks, some researchers have introduced vulnerability assessment frameworks that incorporate system exposure, sensitivity, and adaptive capacity. These frameworks typically involve constructing indicator systems based on production conditions, supply stability, accessibility, and resource use efficiency to quantitatively evaluate the vulnerability of agricultural systems [58,59,60]. For instance, Shukla et al. [61] developed a comprehensive vulnerability assessment model that integrates biophysical and socio-economic indicators to assess the dynamic vulnerability of smallholder systems in Ethiopia.
Despite the considerable progress made in evaluating agricultural security and conducting risk assessments from diverse perspectives, and the adoption of numerous integrated evaluation frameworks and decision support models, several critical limitations remain. First, most existing studies focus on single-dimensional or static analyses and lack a comprehensive investigation of the coupling mechanisms among core agricultural system resources such as water, land, energy, and food. This limits the ability to reveal the nonlinear, synergistic, and feedback relationships that govern system dynamics. Second, risk identification methods often rely on marginal analysis or static indicators, which are insufficient for capturing systemic risks in a holistic manner. Moreover, the application of joint probability models remains limited, making it difficult to dynamically assess the evolution of risks under the interaction of multiple influencing factors. Therefore, it is essential to develop a multidimensional evaluation framework that integrates resource availability, production efficiency, and system resilience. It is also necessary to innovate methodologies for identifying agricultural system coupling security and to incorporate joint probability models to accurately delineate dynamic safety boundaries and predict high-risk scenarios.
To address the limitations of existing approaches, this study introduces a Reliability–Coordination–Resilience (Rel-Cor-Res) framework that integrates three critical dimensions of agricultural system security: reliability, coordination, and resilience. This framework enables a more holistic assessment by capturing not only the adequacy of resource inputs but also their synergistic use and the system’s capacity to withstand external shocks. Furthermore, to better reflect the complex dependencies and joint dynamics among these dimensions, we adopt Copula modeling, a robust statistical method capable of representing nonlinear correlations and joint risk probabilities under uncertainty. By combining these two innovations, this study offers a multidimensional and probabilistic perspective for evaluating agricultural system security, moving beyond traditional single-indicator or static assessments.
Northeast China is employed as a representative case due to its key role in national food production. Based on core elements of agricultural systems—water, land, and energy—we construct the Agricultural System Coupling Security Index (AS-CSI) across three dimensions: Rel, Cor, and Res. The TOPSIS method is used for quantitative evaluation, and obstacle factor diagnosis helps identify key constraints. Copula models are further applied to estimate joint risks under multidimensional uncertainty. These methods enable a dynamic, probabilistic understanding of agricultural system security. The findings offer theoretical and practical insights to inform sustainable agricultural development and serve as a decision support tool for regional policy-making. By identifying vulnerable subsystems and optimizing cross-sectoral strategies, this study supports adaptive agricultural transformation under climate and socio-economic uncertainty.

2. Materials and Methods
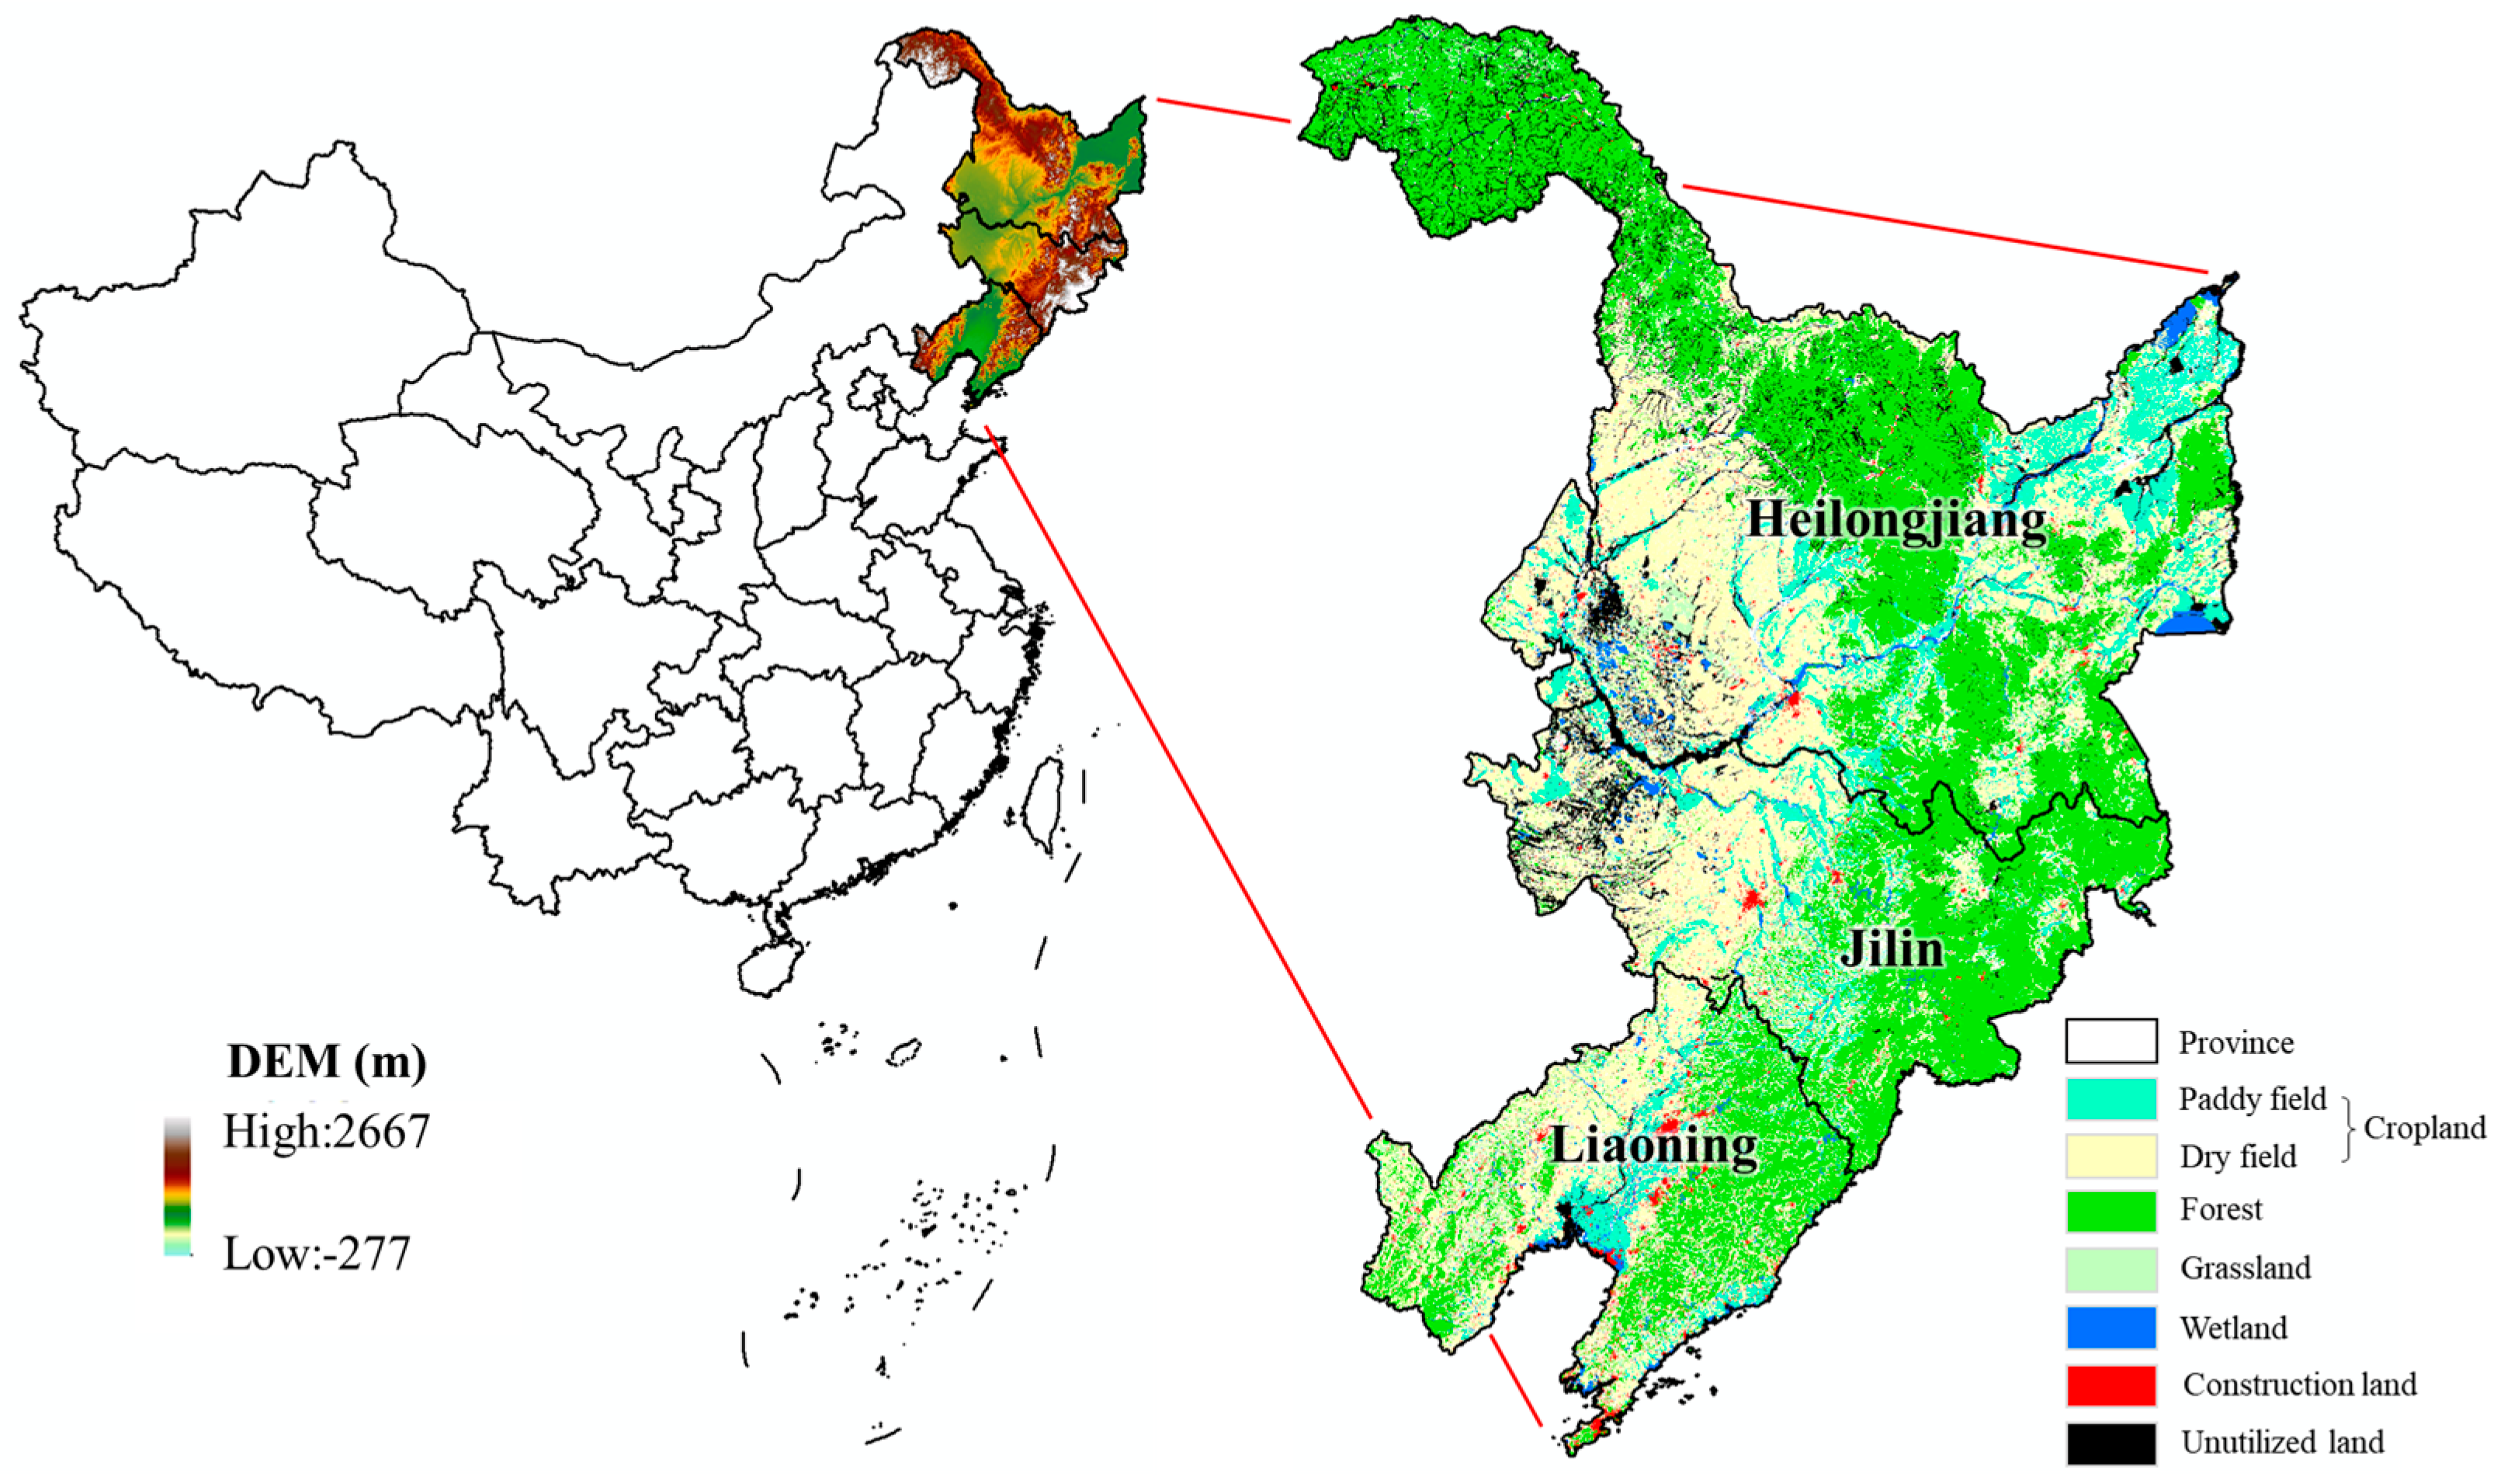
2.1. Study Area

Northeast (NE) China, comprising the provinces of Liaoning (LN), Jilin (JL), and Heilongjiang (HLJ), as shown in Figure 1, is located in the northeastern part of the country and is characterized by a temperate monsoon climate. This region is known for its vast territory, fertile land, and favorable natural conditions for the development of agriculture, forestry, and animal husbandry. Covering approximately 9.5% of China’s total land area, the region supports 6.8% of the national population and contributes 4.8% to the national Gross Domestic Product (GDP), while utilizing 8.1% of the country’s water resources and consuming 8.1% of its energy. Remarkably, it accounts for more than 20% of China’s total food production, with production exceeding 140 million tons in 2022. As a major national food-producing base, Northeast China plays a crucial role in food reserve management and emergency food supply adjustment. It has made significant contributions to national development and social stability. Therefore, ensuring agricultural system security in Northeast China and mitigating associated risks are of great importance for maintaining national food security and supporting the sustainable development of the broader economy and society.

2.2. Research Framework and Indicator System

2.2.1. Conceptual Framework of Agricultural System Coupling Security

The agricultural system is a complex and adaptive system composed of multiple interrelated subsystems—primarily water, land, and energy—which interact through dynamic feedback mechanisms. Beyond internal processes, agricultural systems are influenced by broader external drivers such as technological capacity, economic development, and policy interventions [62].
To ensure the security of the agricultural system, it is essential to guarantee the stable and sufficient supply of water, land, and energy resources on the one hand, and to optimize the allocation and cooperative functioning of these resources across subsystems on the other. Simultaneously, improving the level of external socio-economic and environmental development enhances the system’s adaptive capacity to cope with external disturbances. Coordinated progress across these three aspects enables the agricultural system to maintain a relatively secure and low-risk state.
Based on this conceptual understanding, the agricultural system can be regarded as being supported by three core subsystems—water, land, and energy—and its coupling security can be characterized by three key dimensions: reliability, coordination, and resilience, as illustrated in Figure 2.
Reliability reflects the strength of resource support provided by the water, land, and energy subsystems. It is evaluated based on the adequacy of resource supply. The more abundant the resource provision, the higher the reliability, and the more secure the system. Coordination reflects the efficiency of interaction among the subsystems in supporting agricultural production. It is assessed through indicators of food production efficiency and the synergy among water, land, and energy inputs. Higher conversion efficiency indicates stronger coordination and improved system security. Resilience reflects the system’s ability to withstand external shocks and disturbances. It is evaluated based on socio-economic development levels, environmental pollution, and exposure to natural disasters. Lower variability in these factors corresponds to higher resilience and, thus, a more secure agricultural system.

2.2.2. Indicator System Construction and Data Sources

Following the principles of objectivity, comprehensiveness, scientific rigor, practicality, and measurability, this study constructs a comprehensive indicator system for evaluating agricultural system coupling security. Based on the existing literature [63,64,65,66,67], representative and widely accepted indicators were selected. These were further refined based on the conceptual framework of the Agricultural System Coupling Security Index (AS-CSI) proposed in Section 2.2.1 and tailored to the specific characteristics of Northeast China. A total of 30 indicators were ultimately selected to comprehensively reflect the regional characteristics and multidimensional structure of agricultural system coupling security. The AS-CSI evaluation indicator system is presented in Table 1.
The study period spans from 2001 to 2022. Socio-economic data were obtained from the China Statistical Yearbook, China City Statistical Yearbook, and the respective Statistical Yearbooks of Liaoning, Jilin, and Heilongjiang Provinces. Water resource and utilization data were primarily derived from the China Water Resources Bulletin and the China Water Resources Statistical Yearbook. Agricultural and rural data were collected from various editions of the China Rural Statistical Yearbook.

2.3. Comprehensive Evaluation Method

2.3.1. Indicator Normalization

To ensure comparability across indicators with different units and scales, raw data were normalized through a dimensionless transformation. Characteristic threshold values for each indicator were determined based on the 5th, 25th, 50th, 75th, and 95th percentiles, as shown in Table 2. For a given indicator k, its Agricultural System Coupling Security Index ( μ k ) was calculated using either Equation (1) or Equation (2), depending on whether the indicator attribute is positive or negative.
Positive:
μ k = 0 , x k a k 0.3 · x k a k b k a k , a k x k b k 0.3 + 0.3 · x k b k c k b k , b k x k c k 0.6 + 0.2 · x k c k d k c k , c k x k d k 0.8 + 0.2 · x k d k e k d k , d k x k e k 1 , e k x k
Negative:
μ k = 1 , x k e k 0.8 + 0.2 · d k x k d k e k , e k x k d k 0.6 + 0.2 · c k x k c k d k , d k x k c k 0.3 + 0.3 · b k x k b k c k , c k x k b k 0.3 · a k x k a k b k , b k x k a k 0 , a k x k
where μ k represents the normalized index value for indicator k (where k = 1, 2, ..., n). The terms a k , b k , c k , d k , and e k denote the characteristic threshold values for indicator k, while x k is the observed value of the indicator.

2.3.2. Integrated Weighting Method

To enhance the scientific rigor and objectivity of indicator weighting, this study adopts a combined approach using the entropy weight method (EWM) and the CRITIC method (Criteria Importance Through Intercriteria Correlation).
(1)
EWM
The EWM is an objective weighting technique based on information entropy [68]. It reflects the dispersion of indicator values—greater variability among observations indicates more information, thereby assigning higher weights to such indicators.
p i j = μ i j i = 1 m μ i j
e j = 1 ln m i = 1 m p i j ln p i j
d j = 1 e j
w j E = d j j = 1 n d j
(2)
CRITIC Method
The CRITIC method considers both the contrast intensity and the conflict among indicators to reflect their contribution to the system [69].
S j = 1 m 1 i = 1 m ( μ i j μ j ¯ ) 2
r j k = i = 1 m ( μ i j μ j ¯ ) ( μ i k μ k ¯ ) i = 1 m ( μ i j μ j ¯ ) 2 ( μ i k μ k ¯ ) 2
C j = k = 1 n ( 1 r j k )
w j C = C j j = 1 n C j
(3)
Integrated Weighting
To combine the advantages of both methods, a multiplicative normalization method is used to derive the final comprehensive weight [65].
w j = w j E · w j C j = 1 n w j E · w j C

2.3.3. Coupling Security Index Calculation

The Technique for Order Preference by Similarity to Ideal Solution (TOPSIS) method is a fundamental and widely applied multi-attribute decision-making method, valued for its solid mathematical foundation and simplicity, and has been extensively used across various domains such as procurement, manufacturing, finance, education, and strategic planning [70]. Therefore, it is used to objectively evaluate the Agricultural System Coupling Security Index.
First, the weighted normalized matrix is calculated as
v i j = w j · μ i j
where v i j is the weighted normalized value, and μ i j and w j are obtained from Section 2.3.1 and Section 2.3.2.
Second, the positive ideal solution v j + and negative ideal solution v j are defined as
v j + = max v i j ,   v j = min v i j
The distances to the ideal and anti-ideal solutions are calculated as
D i + = j = 1 n ( v i j v j + ) 2 ,   D i = j = 1 n ( v i j v j ) 2
Finally, the Agricultural System Coupling Security Index (AS-CSI) is computed as
C S I i = D i D i + + D i 1

2.3.4. Security Level Classification

The AS-CSI (Agricultural System Coupling Security Index) values range from 0 to 1. The closer the value is to 1, the higher the agricultural system’s coupling security level. Based on the relevant literature [65,66,67,71], the CSI range is divided into five levels using an interval width of 0.2, as shown in Table 3.

2.4. Obstacle Factor Diagnosis

To further identify the key constraints affecting AS-CSI, this study applies the Obstacle Factor Diagnosis Model to decompose the evaluation system and quantitatively determine the primary limiting indicators that significantly impact the overall security score.
O j = F j I j j = 1 n F j I j
where F j is the weight of indicator j, and I j is the deviation degree of indicator j, calculated as I j = 1 μ i j .

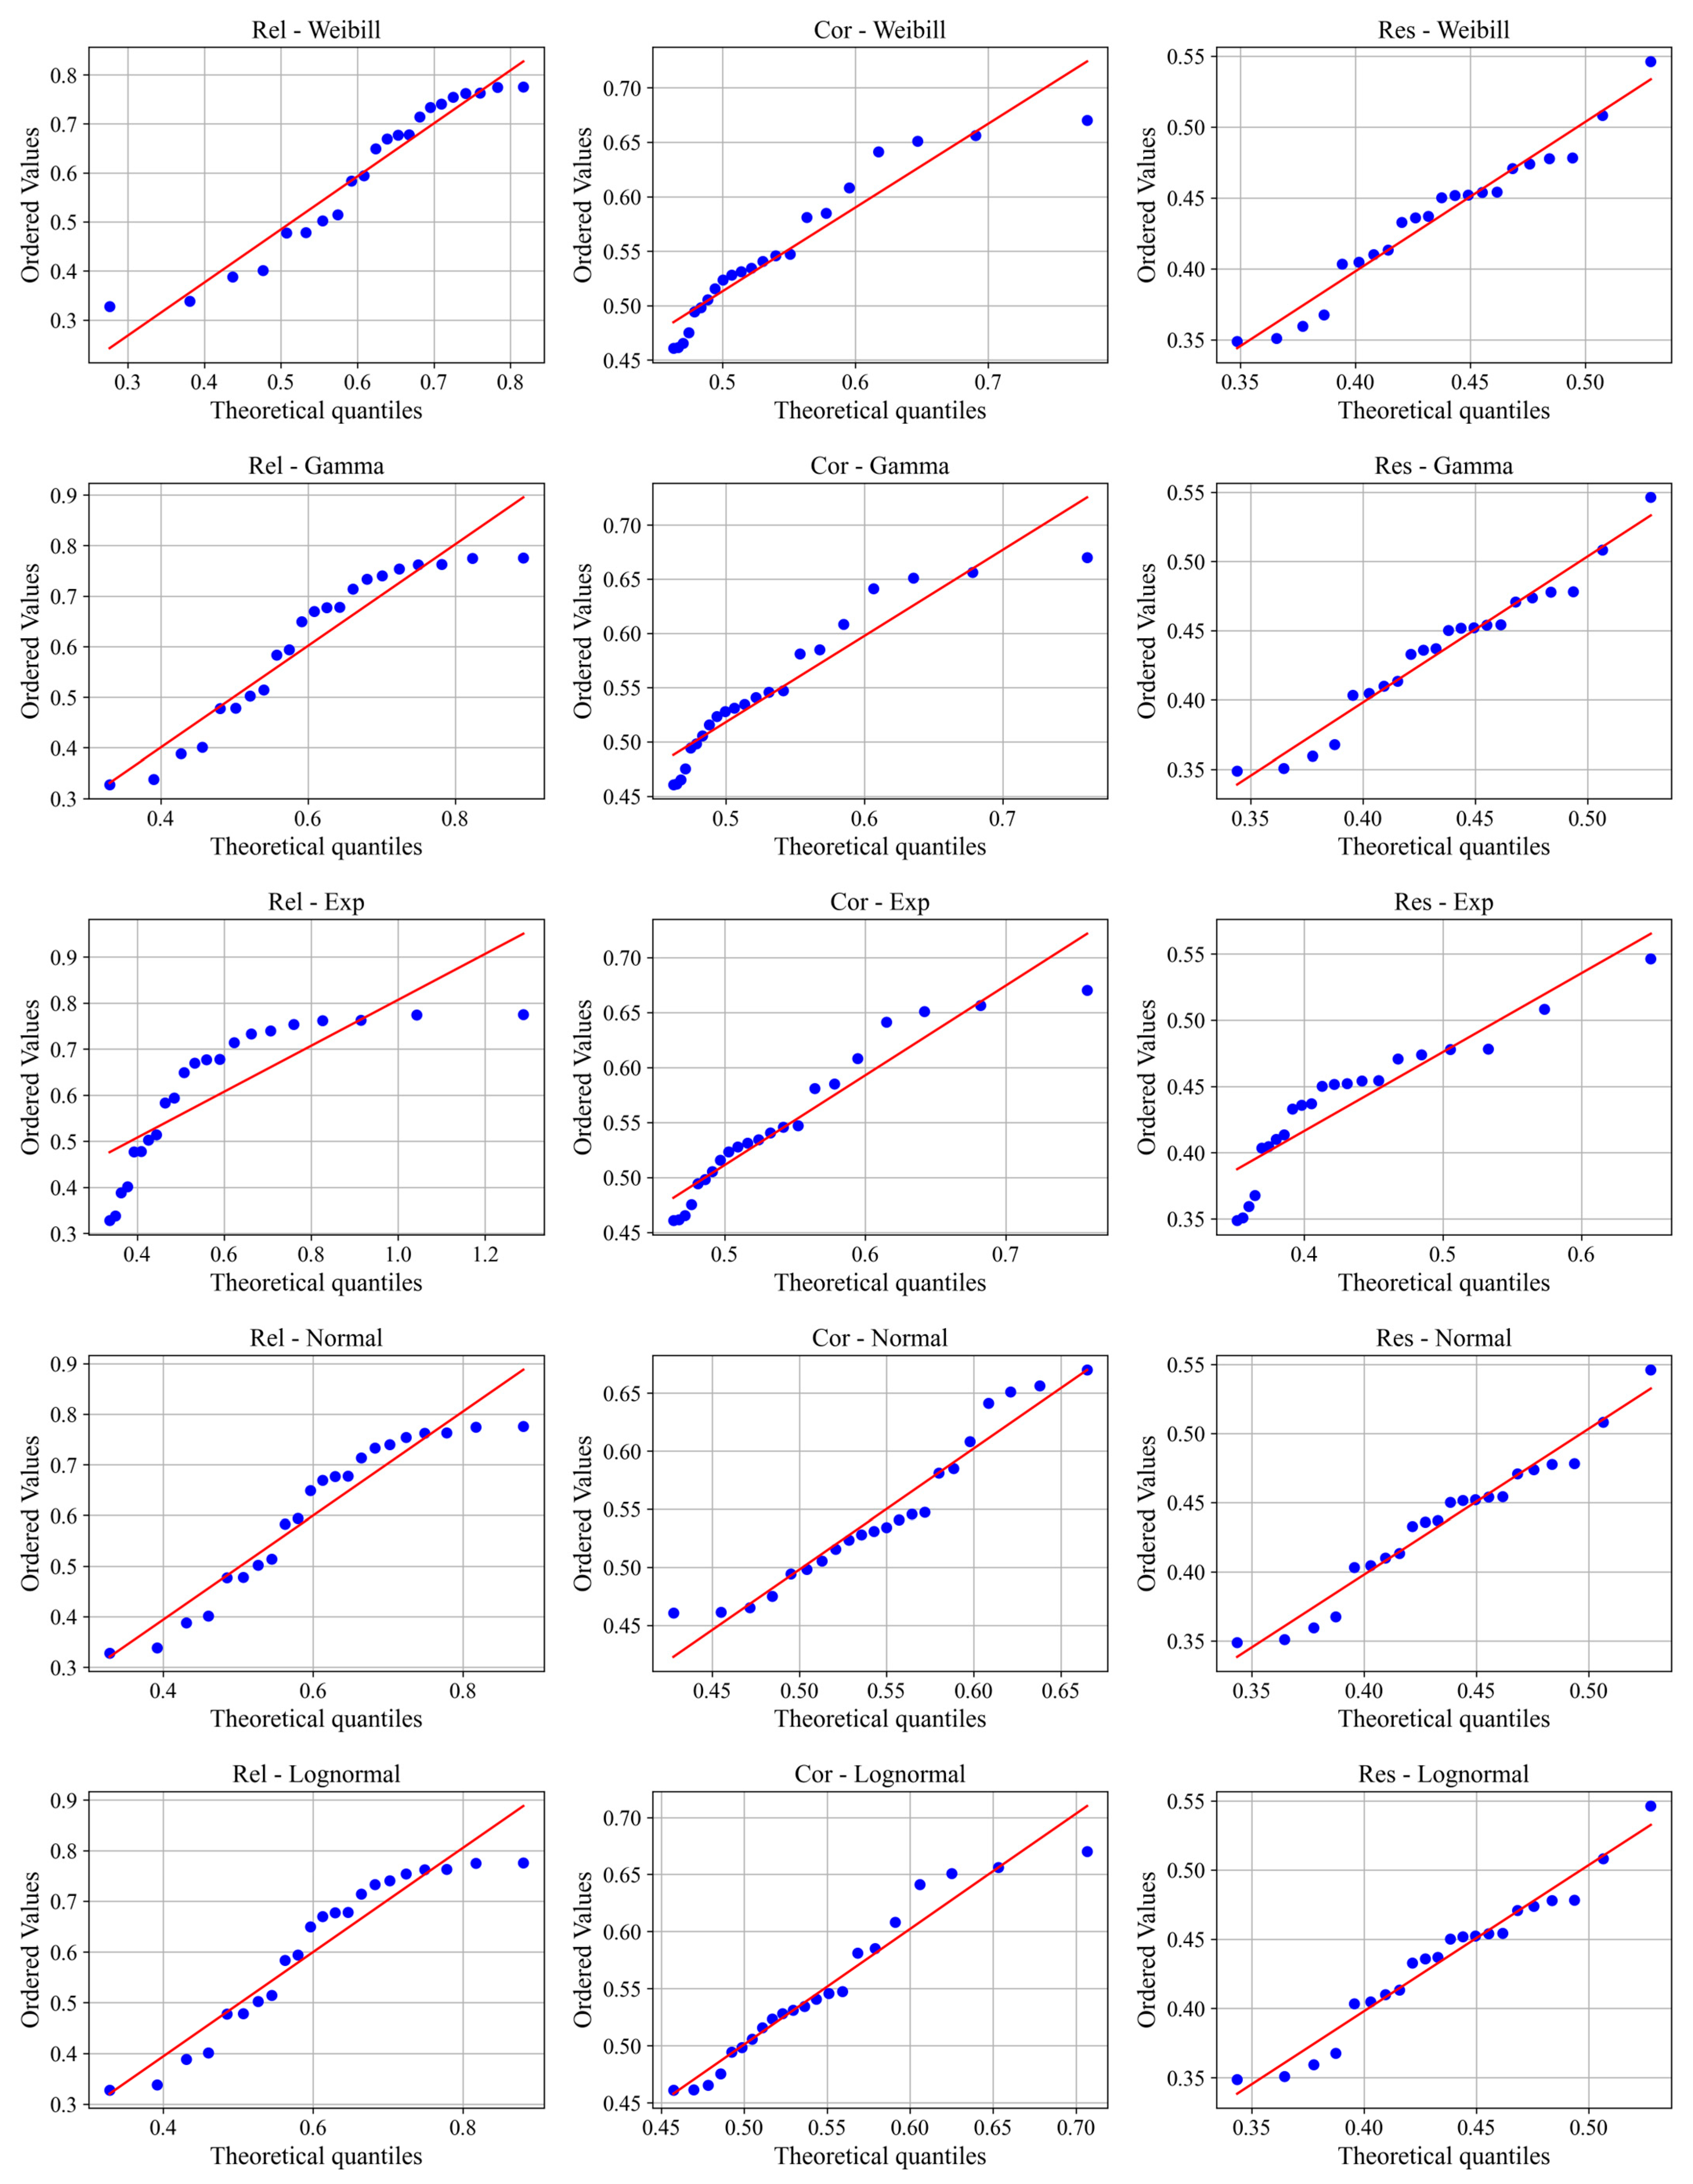
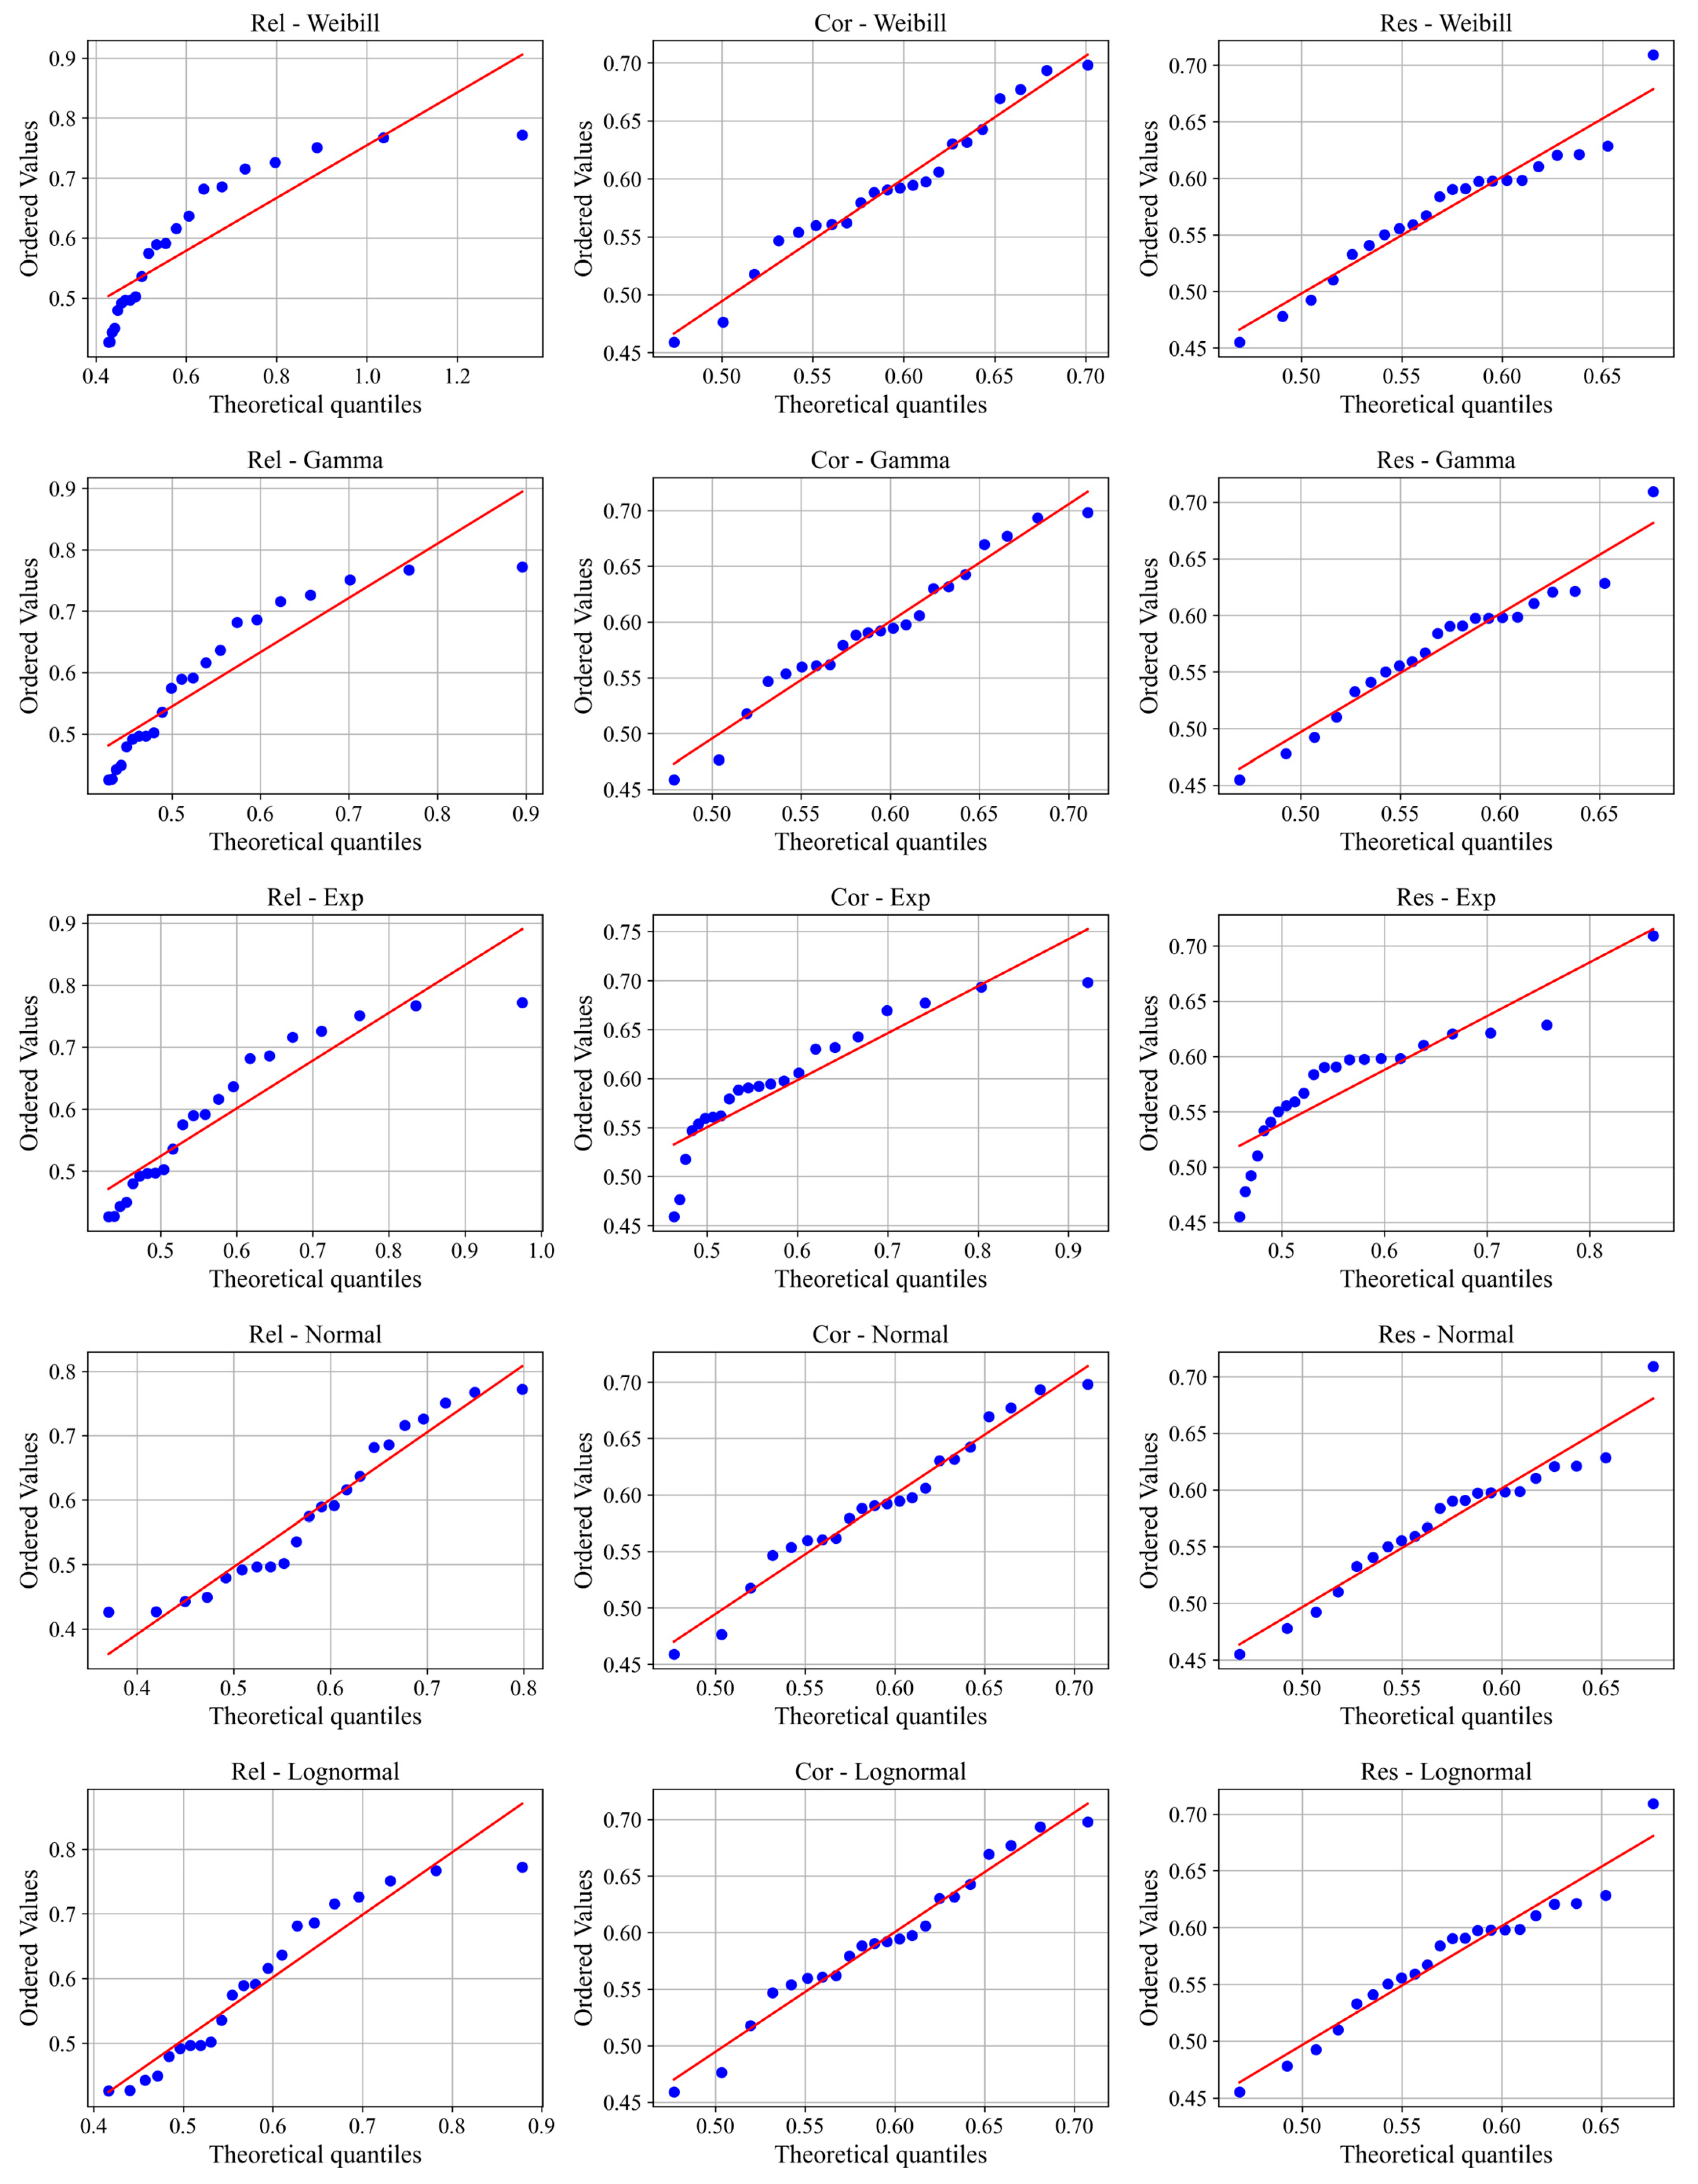
2.5. Fitting Marginal Distributions for Rel, Cor, and Res

To prepare for multivariate joint risk modeling, it is essential to accurately characterize the marginal distribution behavior of the three agricultural system dimensions: reliability, coordination, and resilience. Although these variables represent central and interrelated dimensions of agricultural system functioning, they must initially be treated as independent univariate random variables to facilitate the construction of appropriate Copula functions in the subsequent analysis.
Copula models are statistical tools that allow the modeling of complex dependence structures between random variables by separating marginal distributions from their joint dependence structure. A Copula function links univariate marginal distributions to form a multivariate distribution, enabling greater flexibility in capturing nonlinear and tail dependencies that traditional correlation-based methods often miss [72].
Before constructing the Copula, the marginal behavior of each Rel–Cor–Res variable must be accurately modeled. In this study, five commonly used univariate distribution functions—Weibull, Gamma, Exp, Normal, and Lognormal—are considered. Parameters for each candidate distribution are estimated using the Maximum Likelihood Estimation (MLE) method. The specific forms of these distribution functions are summarized in Table 4.
To determine the best-fitting marginal distribution for each variable, goodness-of-fit tests are applied. The Kolmogorov–Smirnov (K–S) test is used for statistical evaluation due to its accuracy [65,73], and the Q–Q plot is used as a visual supplement. The K–S test statistic D is defined as follows:
D = m a x 1 k n { c k m k n , c k m k 1 n }
where c k is the Copula value of the joint observation ( x k , y k ) , and m k is the number of joint samples satisfying x x k and y y k .
Copula values range from 0 to 1; a lower value indicates that the joint occurrence of X x k and Y y k is rare, while a higher value suggests more common joint behavior.

2.6. Multivariate Copula Modeling of Rel-Cor-Res

To model the joint distribution of the Rel-Cor-Res, this study employs Archimedean Copulas (a family of Copula functions characterized by a single generator function). The selected families include the Frank, Clayton, and Gumbel Copulas [65]. Their bivariate and trivariate forms are provided in Table 5. Model performance is evaluated using standard goodness-of-fit metrics: Mean Squared Error (MSE), Root Mean Squared Error (RMSE), Akaike Information Criterion (AIC), and Bayesian Information Criterion (BIC). The smaller the AIC and BIC values, the better the model fit.
M S E = 1 n 1 i = 1 n ( P e i P i ) 2
R M S E = M S E
A I C = n l n M S E + 2 k
B I C = n l n M S E + l o g ( n ) k
where n is the number of joint observations, P e i is the empirical frequency, P i is the theoretical probability, and k is the number of model parameters.

3. Results

3.1. Evaluation of Agricultural System Coupling Security

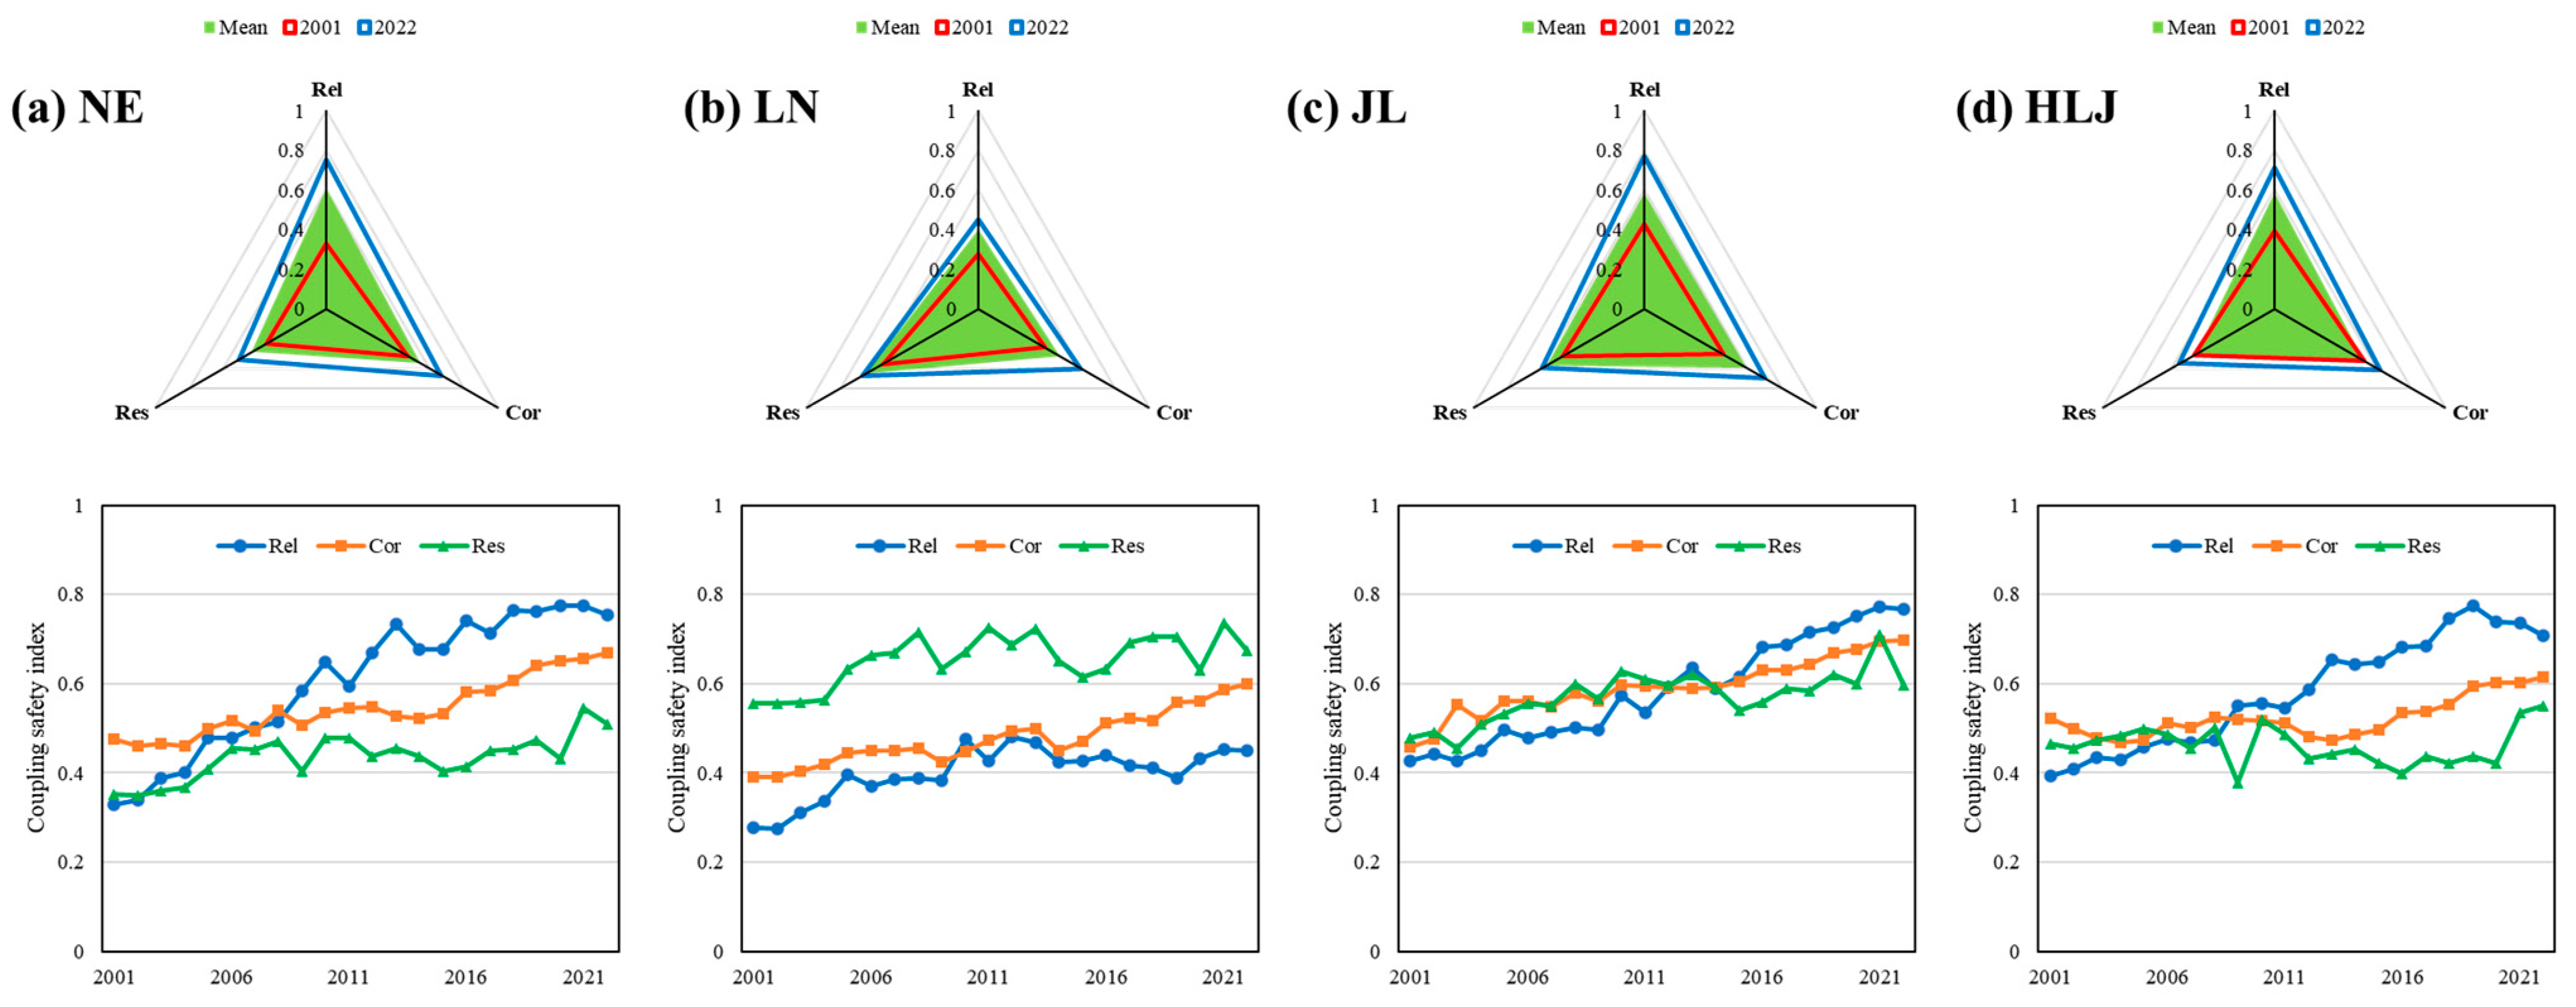
3.1.1. Spatiotemporal Evolution of Rel–Cor–Res

The temporal evolution of the reliability (Rel), coordination (Cor), and resilience (Res) in the three provinces of Northeast China from 2001 to 2022 is shown in Figure 3. At the Northeast regional level, reliability experienced rapid growth, increasing from 0.33 in 2001 to 0.75 in 2022, indicating a significant enhancement in the support capacity of water, land, and energy resources for agricultural development. The multi-year average was 0.60. Coordination started at a relatively high level of 0.48, reflecting an initially efficient resource use, but increased slowly over time, reaching 0.67 in 2022 with an average of 0.55. Resilience showed a pattern of initial growth followed by stabilization. From 2001 to 2008, it rose from 0.35 to 0.47, indicating a rapid improvement in adaptive capacity, but fluctuated within the range of 0.4–0.6 thereafter, with a lower multi-year average of 0.44. This pattern may be attributed to the region’s economic slowdown and population decline in recent years.
At the provincial level, reliability varied significantly. Liaoning exhibited the lowest reliability, averaging only 0.40 over the study period. In contrast, both Jilin and Heilongjiang had higher reliability, each averaging 0.58. In Liaoning, reliability improved between 2001 and 2010 but declined gradually from 2011 to 2022, suggesting insufficient support from water, land, and energy resources. For example, Liaoning’s average per capita water availability (positive indicator) was only 751 m3, significantly lower than Jilin (1672 m3) and Heilongjiang (2480 m3). Furthermore, Liaoning’s water resource utilization rate (negative indicator) was 51%, much higher than Jilin (29%) and Heilongjiang (39%), indicating more intensive use of limited water resources. In contrast, Jilin and Heilongjiang experienced substantial improvements in Rel between 2001 and 2022, with Jilin increasing from 0.43 to 0.77 and Heilongjiang from 0.46 to 0.70.
Regarding coordination, Jilin showed a steady upward trend, rising from 0.46 in 2001 to 0.70 in 2022, reflecting significant improvements in food production efficiency and water–land–energy synergy. Liaoning exhibited slow growth from 2001 to 2013, followed by a brief decline in 2014 and then a sharp increase to 0.60 by 2022. Heilongjiang began with a relatively high value of 0.52 in 2001 but fluctuated through 2015 before showing steady growth after 2016, reaching 0.62 in 2022. On average, Jilin had the highest coordination value (0.59), followed by Heilongjiang (0.52) and Liaoning (0.48), indicating that Jilin had the most efficient and synergistic agricultural production system.
In terms of resilience, Liaoning outperformed the other provinces with a multi-year average of 0.65, suggesting that despite its lower reliability and coordination, its higher level of economic and social development provided stronger adaptive capacity. Except for the period 2001–2004, Liaoning’s resilience value remained above 0.6. Jilin’s resilience steadily improved from 0.48 in 2001 to 0.60 in 2022, with a multi-year average of 0.57, indicating increasing risk resistance. Heilongjiang, however, exhibited more volatility, with a noticeable decline from 2011 to 2016. Although its resilience value rebounded to 0.55 by 2022, its average remained the lowest at 0.46, suggesting relatively weak system resilience.

3.1.2. Spatiotemporal Evolution of Agricultural System Coupling Security Index

The spatiotemporal variation in AS-CSI in Northeast China from 2001 to 2022 is shown in Figure 4. At the Northeast regional level, the overall CSI increased significantly from 0.38 in 2001 to 0.62 in 2022, indicating a transition from an insecure to a relatively secure state. The multi-year average CSI was 0.52. Among the three provinces, Liaoning had the lowest average CSI (0.51). Although it showed a rising trend from 2001 to 2013, a decline in 2014 slowed its growth, and by 2022, the CSI had only reached 0.59, placing it in the marginally secure level.
Jilin had the highest CSI, with a multi-year average of 0.58. Its values rose from 0.46 in 2001 to 0.67 in 2022, indicating a steady improvement in coupling security driven by balanced performance across Rel, Cor, and Res. Heilongjiang had an average CSI of 0.52. Although its initial value in 2001 (0.46) was equal to Jilin’s, its growth was slower, reaching only 0.62 by 2022. Nonetheless, this still placed Heilongjiang’s agricultural system within a relatively secure level.

3.2. Obstacle Factor Analysis

The obstacle factors affecting AS-CSI in each province of Northeast China from 2001 to 2022 are shown in Figure 5. At the Northeast regional level, among the three Rel-Cor-Res dimensions, Cor contributed the highest cumulative obstacle proportion (37%), followed by Rel (35%) and Res (28%). In Liaoning, Rel contributed the most to the total obstacle degree (41%), followed by Cor (31%) and Rel (28%); in Jilin, Rel accounted for the highest proportion (35%), while both Cor and Res contributed equally at 32%; in Heilongjiang, Res accounted for the highest proportion (40%), followed by Cor (31%) and Rel (29%).
Analyzing individual indicators, the top five obstacle factors in Northeast China were rural electricity consumption per capita (Rel9, 5.1%), proportion of agricultural GDP (Res3, 4.5%), reservoir storage capacity per capita (Rel4, 4.4%), fertilizer use per hectare (Cor7, 4.2%), and proportion of agricultural water use (Cor10, 4.1%), and these five indicators accounted for over 22% of the total obstacle degree. The top five obstacle factors in Liaoning were area under soil erosion control (Res9, 8.0%), reservoir storage capacity per capita (Rel4, 7.4%), pesticide application amount (Res8, 5.8%), GDP growth rate (Res2, 5.2%), and population growth rate (Res7, 5.2%), and these five indicators accounted for over 31% of the total obstacle degree. The top five obstacle factors in Jilin were rural electricity consumption per capita (Rel9, 5.3%), agricultural water use per capita (Rel2, 4.7%), sown area of grain foods per capita (Rel7, 4.7%), total sown area of foods per capita (Rel6, 4.7%), and proportion of agricultural water use (Cor10, 4.6%), and these five indicators accounted for over 24% of the total obstacle degree.
The top five obstacle factors in Heilongjiang were area under soil erosion control (Res9, 5.8%), rural electricity consumption per capita (Rel9, 5.3%), pesticide application amount (Res8, 5.0%), water consumption per hectare (Cor6, 4.7%), and food yield per unit of agricultural machinery power (Cor4, 4.7%), and these five indicators accounted for over 25% of the total obstacle degree.
Across all provinces, the following five indicators appeared among the top five obstacles in at least two provinces: area under soil erosion control (Res9), reservoir storage capacity per capita (Rel4), pesticide application amount (Res8), rural electricity consumption per capita (Rel9), and proportion of agricultural water use (Cor10). These indicators represent critical barriers to agricultural system security in the region and deserve focused policy attention. Among them, reliability-related indicators accounted for 40%, followed by resilience at 35% and coordination at 25%. This suggests that resource availability remains the most significant constraint on agricultural system development in Northeast China.

3.3. Results of Copula Model Fitting

3.3.1. Determination of Marginal Distribution Models

To establish the univariate marginal distributions of the Rel, Cor, and Res indicators, commonly used distribution functions—including Weibull, Gamma, Exp, Normal, and Lognormal—were selected. Parameters were estimated using the Maximum Likelihood Estimation (MLE) method, which offers desirable statistical properties such as consistency, efficiency, and invariance. The optimal marginal distribution models were determined using the Kolmogorov–Smirnov (K–S) test, and the results are summarized in Appendix A, Table A1, with parameter estimates provided in Appendix A, Table A2. Corresponding Q–Q plots are presented in Appendix A, Figure A1, Figure A2, Figure A3 and Figure A4. The distribution functions that best fit the data are highlighted in bold.
For Northeast China, the best-fitting models for Rel, Cor, and Res are Normal, Lognormal, and Normal, respectively; for Liaoning, the best-fitting models for Rel, Cor, and Res are Normal, Lognormal, and Weibull; for Jilin, the best-fitting models for Rel, Cor, and Res are Lognormal, Gamma, and Weibull; for Heilongjiang, the best-fitting models for Rel, Cor, and Res are Normal, Weibull, and Lognormal.

3.3.2. Determination of Multivariate Joint Distribution Models

The optimal multivariate joint distribution models for the Rel-Cor-Res were determined based on Copula parameter estimation and model fit evaluation using AIC and BIC criteria, as shown in Appendix A, Table A3; the multivariate models that best fit the data are highlighted in bold.
Different provinces exhibit varying best-fit Copula models for bivariate and trivariate relationships among Rel, Cor, and Res. For Northeast China, all bivariate combinations, Rel–Cor, Rel–Res, and Cor–Res, were best fitted by the Gumbel Copula; the trivariate joint distribution of Rel–Cor–Res was best fitted by the Frank Copula. For Liaoning, the Gumbel Copula was optimal for Rel–Cor and Rel–Res, while Cor–Res was best fitted by the Clayton Copula; the Frank Copula performed best for the trivariate joint distribution. For Jilin, Rel–Cor was best fitted by the Gumbel Copula, Rel–Res was best fitted by the Clayton Copula, and both Cor–Res and the three-variable joint distribution were best fitted by the Frank Copula. For Heilongjiang, Rel–Cor and Cor–Res were best fitted by the Gumbel Copula, whereas Rel–Res and the trivariate Rel–Cor–Res were best fitted by the Frank Copula. These results suggest that while bivariate dependencies vary across provinces, the Frank Copula demonstrates strong applicability in capturing complex trivariate interactions among Rel, Cor, and Res.

3.4. AS-CSI Risk Probability

3.4.1. Bivariate Joint Risk Probability

The results of bivariate Copula-based risk probability estimation for Northeast China are presented in Table 6, and the corresponding joint probability contour maps are shown in Figure 6. At the Northeast regional level, the Rel–Cor combination exhibited the highest probability of reaching a relatively secure state (threshold set at 0.8), with a joint probability of 0.7643. This reflects the generally high levels of reliability and coordination across the region. In contrast, the probabilities for Rel–Res and Cor–Res to reach the same secure level were lower, at 0.7164 and 0.7318, respectively.
For Liaoning, the joint probability of Rel–Cor achieving the 0.8 threshold was 0.7318, followed by Rel–Res at 0.7149, while Cor–Res had the lowest value at 0.6880, falling below 0.7; for Jilin, the joint probability of Rel–Cor was the highest among all provinces at 0.7799, followed by Cor–Res at 0.7150, and Rel–Res at a lower 0.6956; for Heilongjiang, all bivariate joint probabilities were the lowest among the three provinces. The Rel–Cor joint probability was 0.7206, while Rel–Res and Cor–Res were only 0.6202 and 0.6426, respectively. These lower values are likely due to Heilongjiang’s weaker resilience performance.

3.4.2. Trivariate Joint Risk Probability

The trivariate joint probability distributions for Rel, Cor, and Res are shown in Figure 7, and the three-dimensional joint distribution probabilities for AS-CSI are shown in Table 7. As expected, the joint probability increases with higher values of any of the three variables. When two variables (e.g., Cor and Res) are held constant, increasing the third variable (e.g., Rel) results in a higher overall joint probability, confirming the synergistic nature of the three-dimensional Copula model. Jilin exhibited the highest probability of Rel-Cor-Res simultaneously reaching the secure threshold of 0.8, with a trivariate joint probability of 0.5538. Liaoning, Northeast, and Heilongjiang followed closely with joint probabilities of 0.5454, 0.5448, and 0.5413, respectively.
These results suggest that imbalances among the three dimensions—such as lower Rel in Liaoning or weaker Res in Heilongjiang—can significantly lower the overall joint probability. This confirms a “short-board effect”, where the weakest dimension limits the overall coupling security level. Therefore, a coordinated improvement across Rel, Cor, and Res is essential to enhance agricultural system security.

4. Discussion

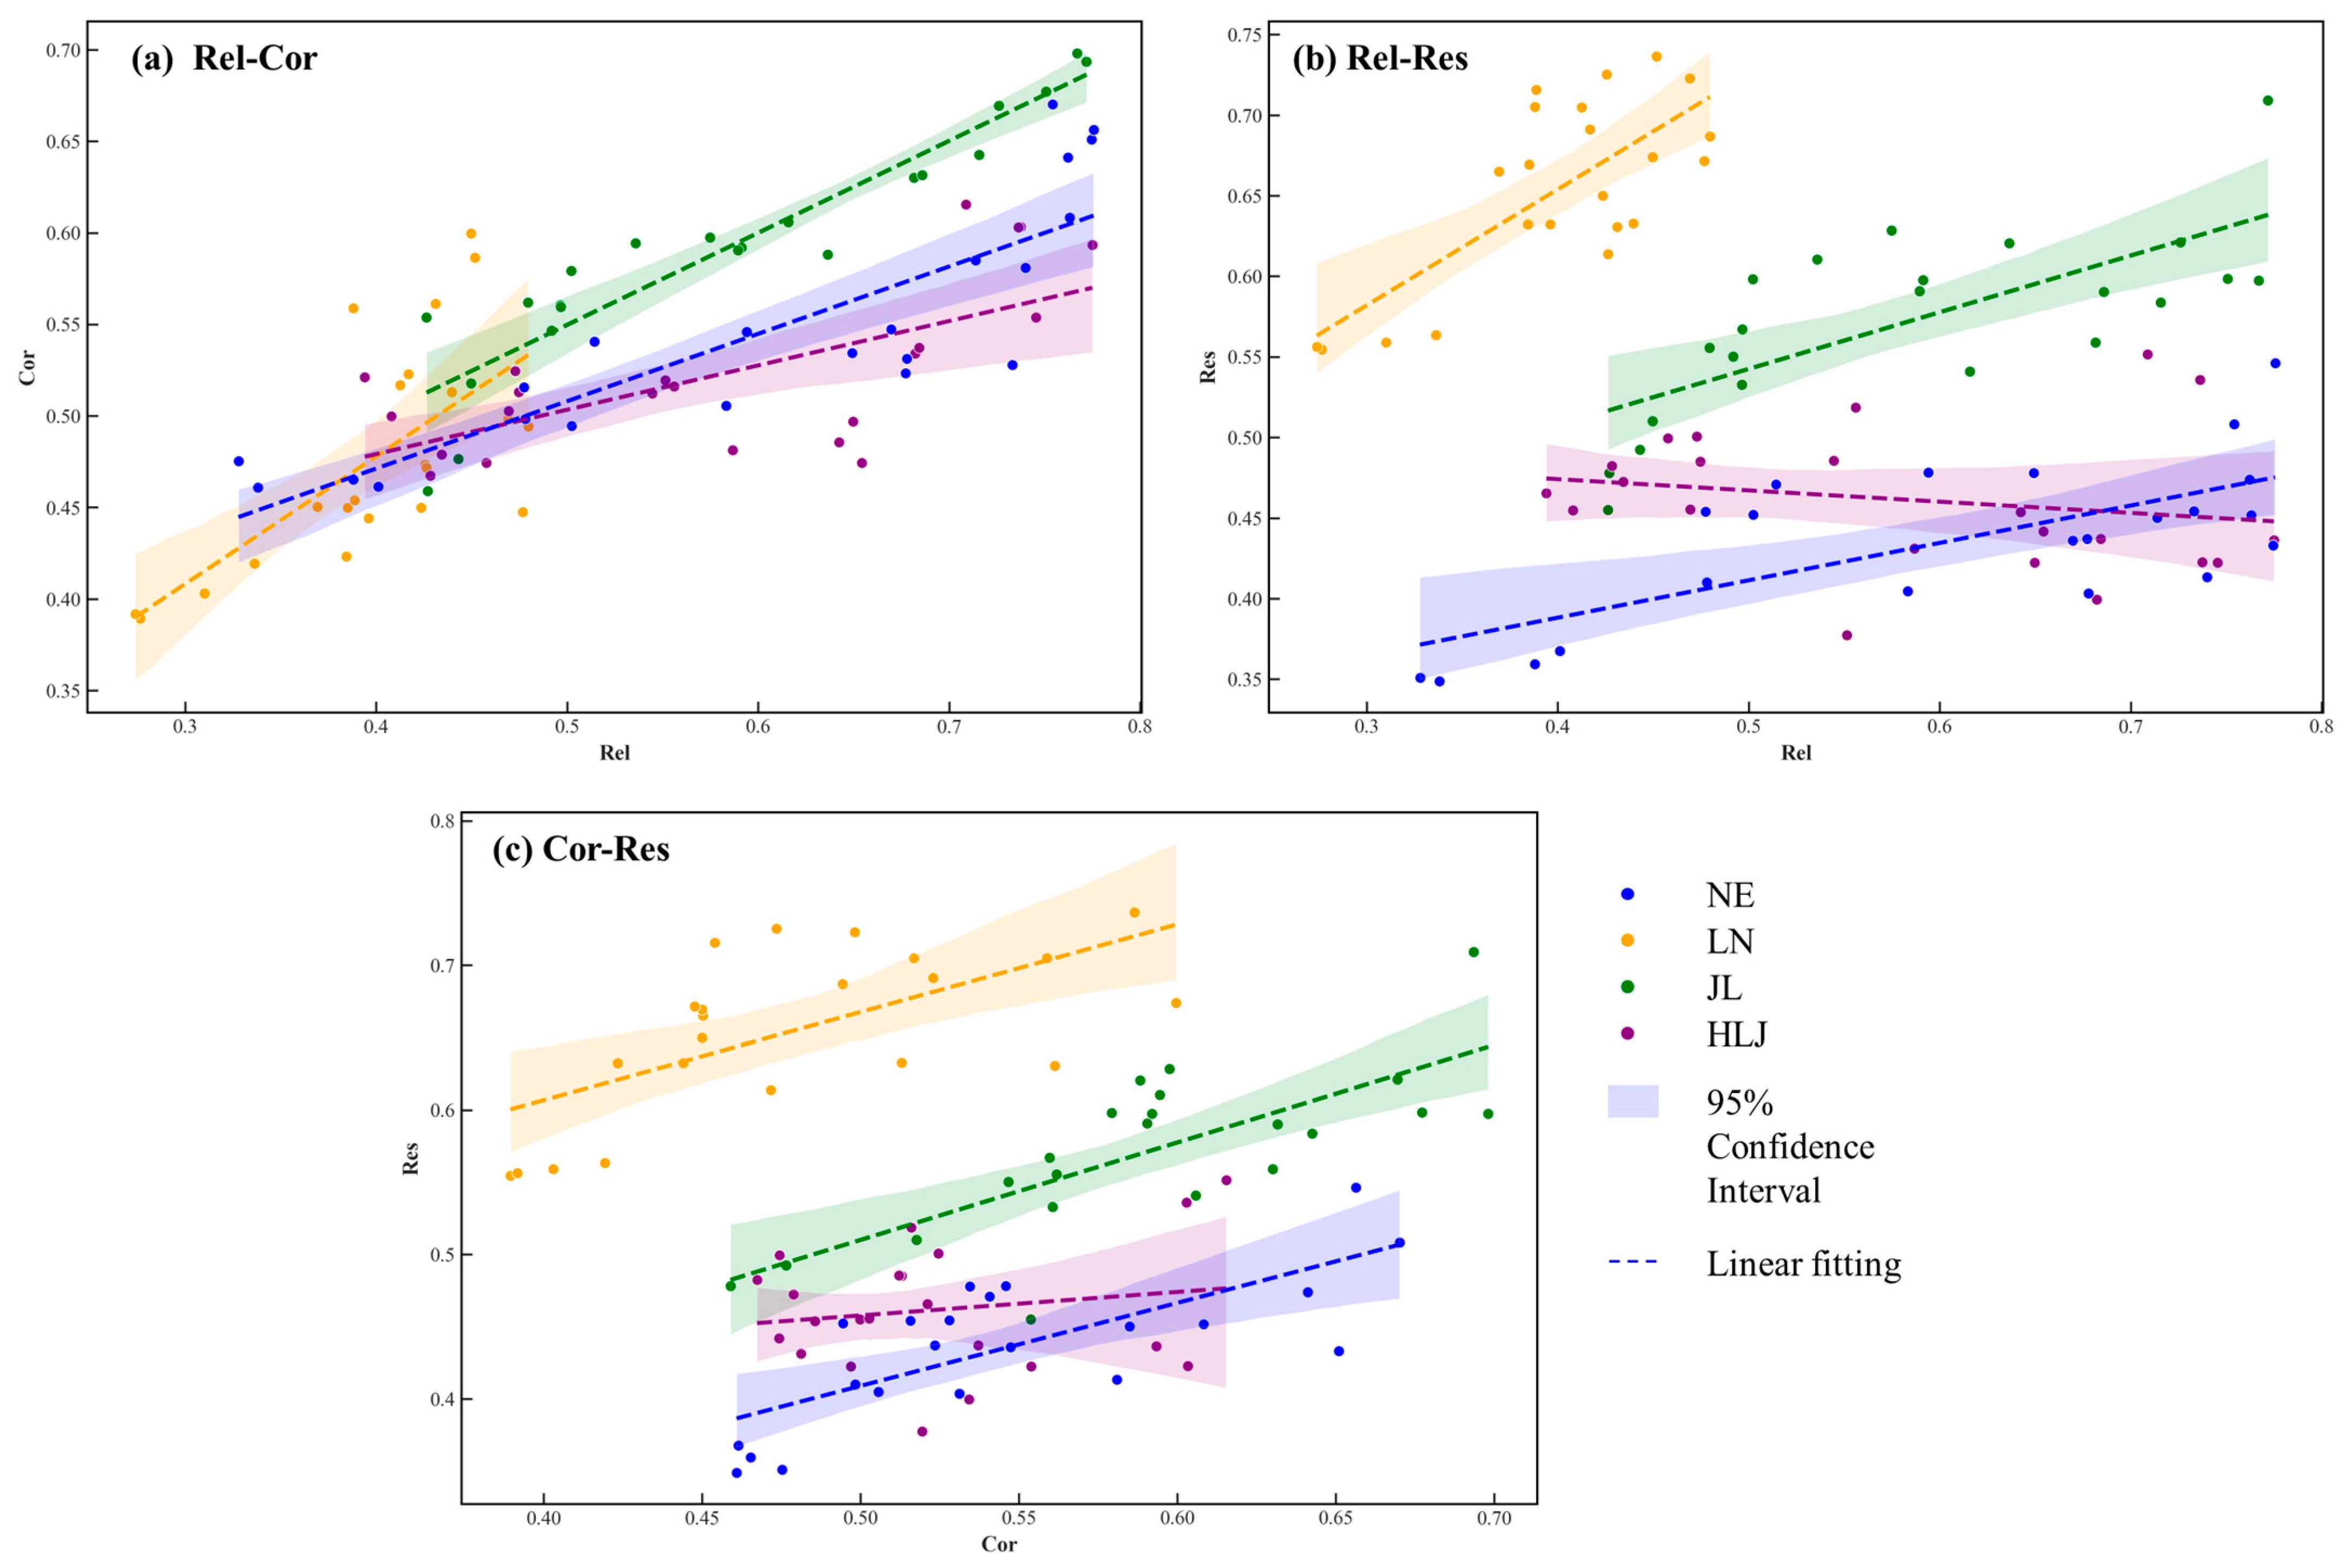
4.1. Relationships Among Rel–Cor–Res

The Agricultural System Coupling Security Index is characterized by three core dimensions: Rel, Cor, and Res. To further explore the interrelationships among these dimensions, pairwise correlation analyses were conducted for each province. The results are presented in Figure 8. As shown in Figure 8a, all three provinces exhibit a positive relationship between Rel and Cor. As Rel increases, Cor improves correspondingly. This pattern is most pronounced in Liaoning, where Cor increases rapidly with improvements in Rel, although Liaoning’s absolute Rel values remain the lowest among the three provinces. In contrast, Heilongjiang shows the weakest Rel–Cor correlation, indicating that improvements in Rel did not lead to significant gains in production efficiency or system coordination. Figure 8b illustrates the relationship between Rel and Res. In general, Res increases with Rel in Liaoning and Jilin, with Liaoning showing the steepest upward trend. This result is consistent with Liaoning’s higher level of economic and social development, which supports a stronger resilience response. However, in Heilongjiang, an opposite trend is observed: Res decreases as Rel increases. This suggests a potential structural decoupling between resource security and adaptive capacity in the province. As shown in Figure 8c, all provinces exhibit a positive correlation between Cor and Res. The strongest growth in Res with increasing Cor is observed in Jilin, while Heilongjiang again shows the weakest trend. This implies that in Heilongjiang, improvements in system efficiency have not been accompanied by meaningful enhancements in the system’s capacity to resist external shocks.
Overall, Liaoning and Jilin demonstrate strong internal coupling among the Rel–Cor–Res dimensions, with clear positive feedback loops among the three. This supports their relatively stable or improving coupling security performance. Notably, Jilin, which has the highest coupling security index overall, also exhibits the strongest synergistic relationships among Rel, Cor, and Res—indicating that all three dimensions are advancing in tandem, reinforcing each other and contributing to long-term agricultural system resilience.
In contrast, while Liaoning has relatively lower values in Rel and Cor, the positive correlations among the three dimensions indicate that the province is on a stable development trajectory, with the potential for continued improvement in coupling security. However, Heilongjiang shows weaker correlations among the three indicators, and even a negative correlation between Rel and Res, suggesting a lack of mutual reinforcement among the subsystems. This raises concerns about the province’s future agricultural system security, as structural imbalances may hinder synergistic development.
To further interpret the decoupling patterns observed in Heilongjiang, several potential underlying factors should be considered. Although the province is rich in natural resources and serves as a major national grain production base, the relatively weaker correlation between Rel and Res suggests a possible gap between resource availability and adaptive capacity. Previous studies have indicated that factors such as slower progress in agricultural modernization, disparities in policy implementation, limited investment in rural infrastructure—particularly in disaster-resilient systems—and geographic vulnerabilities like frequent flooding may contribute to such structural decoupling. Additionally, institutional and economic constraints, including inefficiencies in capital allocation and lower levels of private-sector participation in agricultural innovation, may further weaken the resilience-building process. These hypotheses warrant further empirical investigation and should be taken into account in region-specific policy planning.

4.2. Policy Implications

The findings of this study reveal region-specific challenges and opportunities for enhancing the coupling security of agricultural systems in Northeast China, with direct implications for broader economic resilience and sustainable development. Strengthening agricultural system security in this region is not only vital for ensuring a stable food supply but also essential for safeguarding employment, stabilizing commodity markets, and reducing fiscal risks associated with natural disasters and resource mismanagement.
In Liaoning Province, the primary challenge lies in its weak resource base. Addressing this requires differentiated public investment strategies aimed at modernizing water infrastructure and improving agricultural input efficiency. Policies promoting the reuse of reclaimed water, upgrading irrigation systems, and optimizing fertilizer and machinery inputs can simultaneously improve agricultural output and reduce environmental burdens. These improvements contribute to reducing production volatility, stabilizing rural employment.
In contrast, Jilin Province exhibits stronger performance in system coordination and efficiency. Its successful practices in converting resource inputs into agricultural outputs—such as integrated water/fertilizer application and digital farming—provide scalable models for other regions. Promoting these innovations across Northeast China can enhance supply chain efficiency, reduce production costs, and increase farmers’ incomes, thus supporting local consumption and contributing to rural revitalization strategies.
Although Heilongjiang Province benefits from abundant natural resources, low utilization efficiency and vulnerability to climate extremes remain key risks. Enhancing its resilience through the development of high-standard farmland, climate-resilient agricultural infrastructure, and robust insurance mechanisms is essential. These measures not only protect agricultural assets and reduce income loss during shocks but also prevent negative spillovers into downstream industries such as food processing and logistics, which rely heavily on a stable raw material supply.
This study also identifies several high-frequency obstacle factors shared across the region, such as area under soil erosion control, pesticide application amount, and reservoir storage capacity per capita. To address these common constraints, the government should introduce targeted policy interventions, including increased financial support for controlling non-point source pollution, establishing ecological compensation mechanisms, and strengthening the regulatory framework for small- and medium-sized water infrastructure to improve irrigation flexibility and system responsiveness. Furthermore, for localized constraints such as the proportion of agricultural water use, the promotion of water-saving irrigation technologies and precision planting techniques is essential. These efforts not only improve agricultural sustainability but also preserve ecosystem services that support tourism, water quality, and public health—sectors that are economically significant at both regional and national levels.

4.3. Comparison with Previous Studies

Our findings indicate that agricultural system security in Northeast China is significantly constrained by the weakest-performing subsystems—such as the low reliability observed in Liaoning or the limited resilience in Heilongjiang—highlighting the existence of a classic “bottleneck effect.” This phenomenon has been validated by previous studies. For example, Li et al. [74] demonstrated that inadequacies in key subsystems substantially reduce the overall coordination level between cultivated land and urbanization systems. Similarly, He et al. [75] found that identifying limiting factors within the agricultural carbon emission reduction and sequestration and food security nexus enhances both dimensions and improves their coupled coordination. These findings confirm that even when certain subsystems perform well, the overall system stability may still be impaired in the absence of cross-dimensional synergy.
Nevertheless, many current evaluation frameworks for agricultural systems continue to rely on single-dimensional indicators or aggregated composite indices [30,76]. Common examples include the elicitation of expert opinions combined with multi-criteria assessment for sustainability assessments [77] and widely used food security indicators provided by international organizations, such as the Food Consumption Score (FCS) from the World Food Programme and the Prevalence of Undernourishment (POU) and Food Insecurity Experience Scale (FIES) from the FAO [19].
While these methods offer practical usability, they often fail to capture the internal interactions and dynamic feedback mechanisms between system dimensions, making it difficult to identify systemic risks effectively.
To address this gap, our study introduces an integrated security assessment framework that explicitly models the interaction among three critical dimensions: reliability (Rel), coordination (Cor), and resilience (Res). This framework captures the dynamic relationships between resource availability, efficiency transformation, and adaptive capacity. It aligns with the system design proposed by Mirzaei et al. [40] for the water–energy–food–environment nexus, which emphasizes multidimensional coordination and feedback loops in promoting sustainability.
Moreover, this study introduces bivariate and trivariate Copula functions to quantify the joint probability that multiple dimensions (Rel, Cor, and Res) simultaneously reach a relatively secure state (e.g., a threshold of 0.8). The results show that despite individually favorable dimension scores, the joint probability of reaching this threshold remains low (e.g., below 0.55 for the Northeast region), indicating that interdependent risks within the system may be severely underestimated when relying solely on marginal or deterministic indicators. In contrast to traditional methods such as entropy–TOPSIS analysis [78], fuzzy comprehensive evaluation [79], system dynamics modeling [80], and Bayesian networks [47], Copula models effectively capture the dependence structure and joint behavior of multivariate variables under uncertainty, providing probabilistic insights into system failure and enabling the visualization of risk distributions [81]. Copula-based approaches perform well in modeling risks associated with droughts, yield losses, and extreme agricultural events [82,83,84]. Therefore, Copula models significantly enhance the scientific basis for agricultural risk early warning and policy design, particularly under the dual pressures of climate change and socio-economic volatility.

5. Conclusions

Based on the three dimensions of reliability, coordination, and resilience, this study developed a comprehensive evaluation framework for agricultural system coupling security in Northeast China by integrating the entropy weight method, CRITIC method, and TOPSIS model. Furthermore, bivariate and trivariate joint probability models were constructed using Copula functions to assess the probability of coupling security under multidimensional risk scenarios. The main conclusions are as follows:
(1)
The Agricultural System Coupling Security Index (CSI) in Northeast China showed a significant upward trend, increasing from 0.38 in 2001 to 0.62 in 2022, indicating a shift from an insecure to a relatively secure state. Among the three provinces, Jilin had the highest multi-year average CSI (0.58), while Liaoning and Heilongjiang were slightly lower, at 0.51 and 0.52, respectively.
(2)
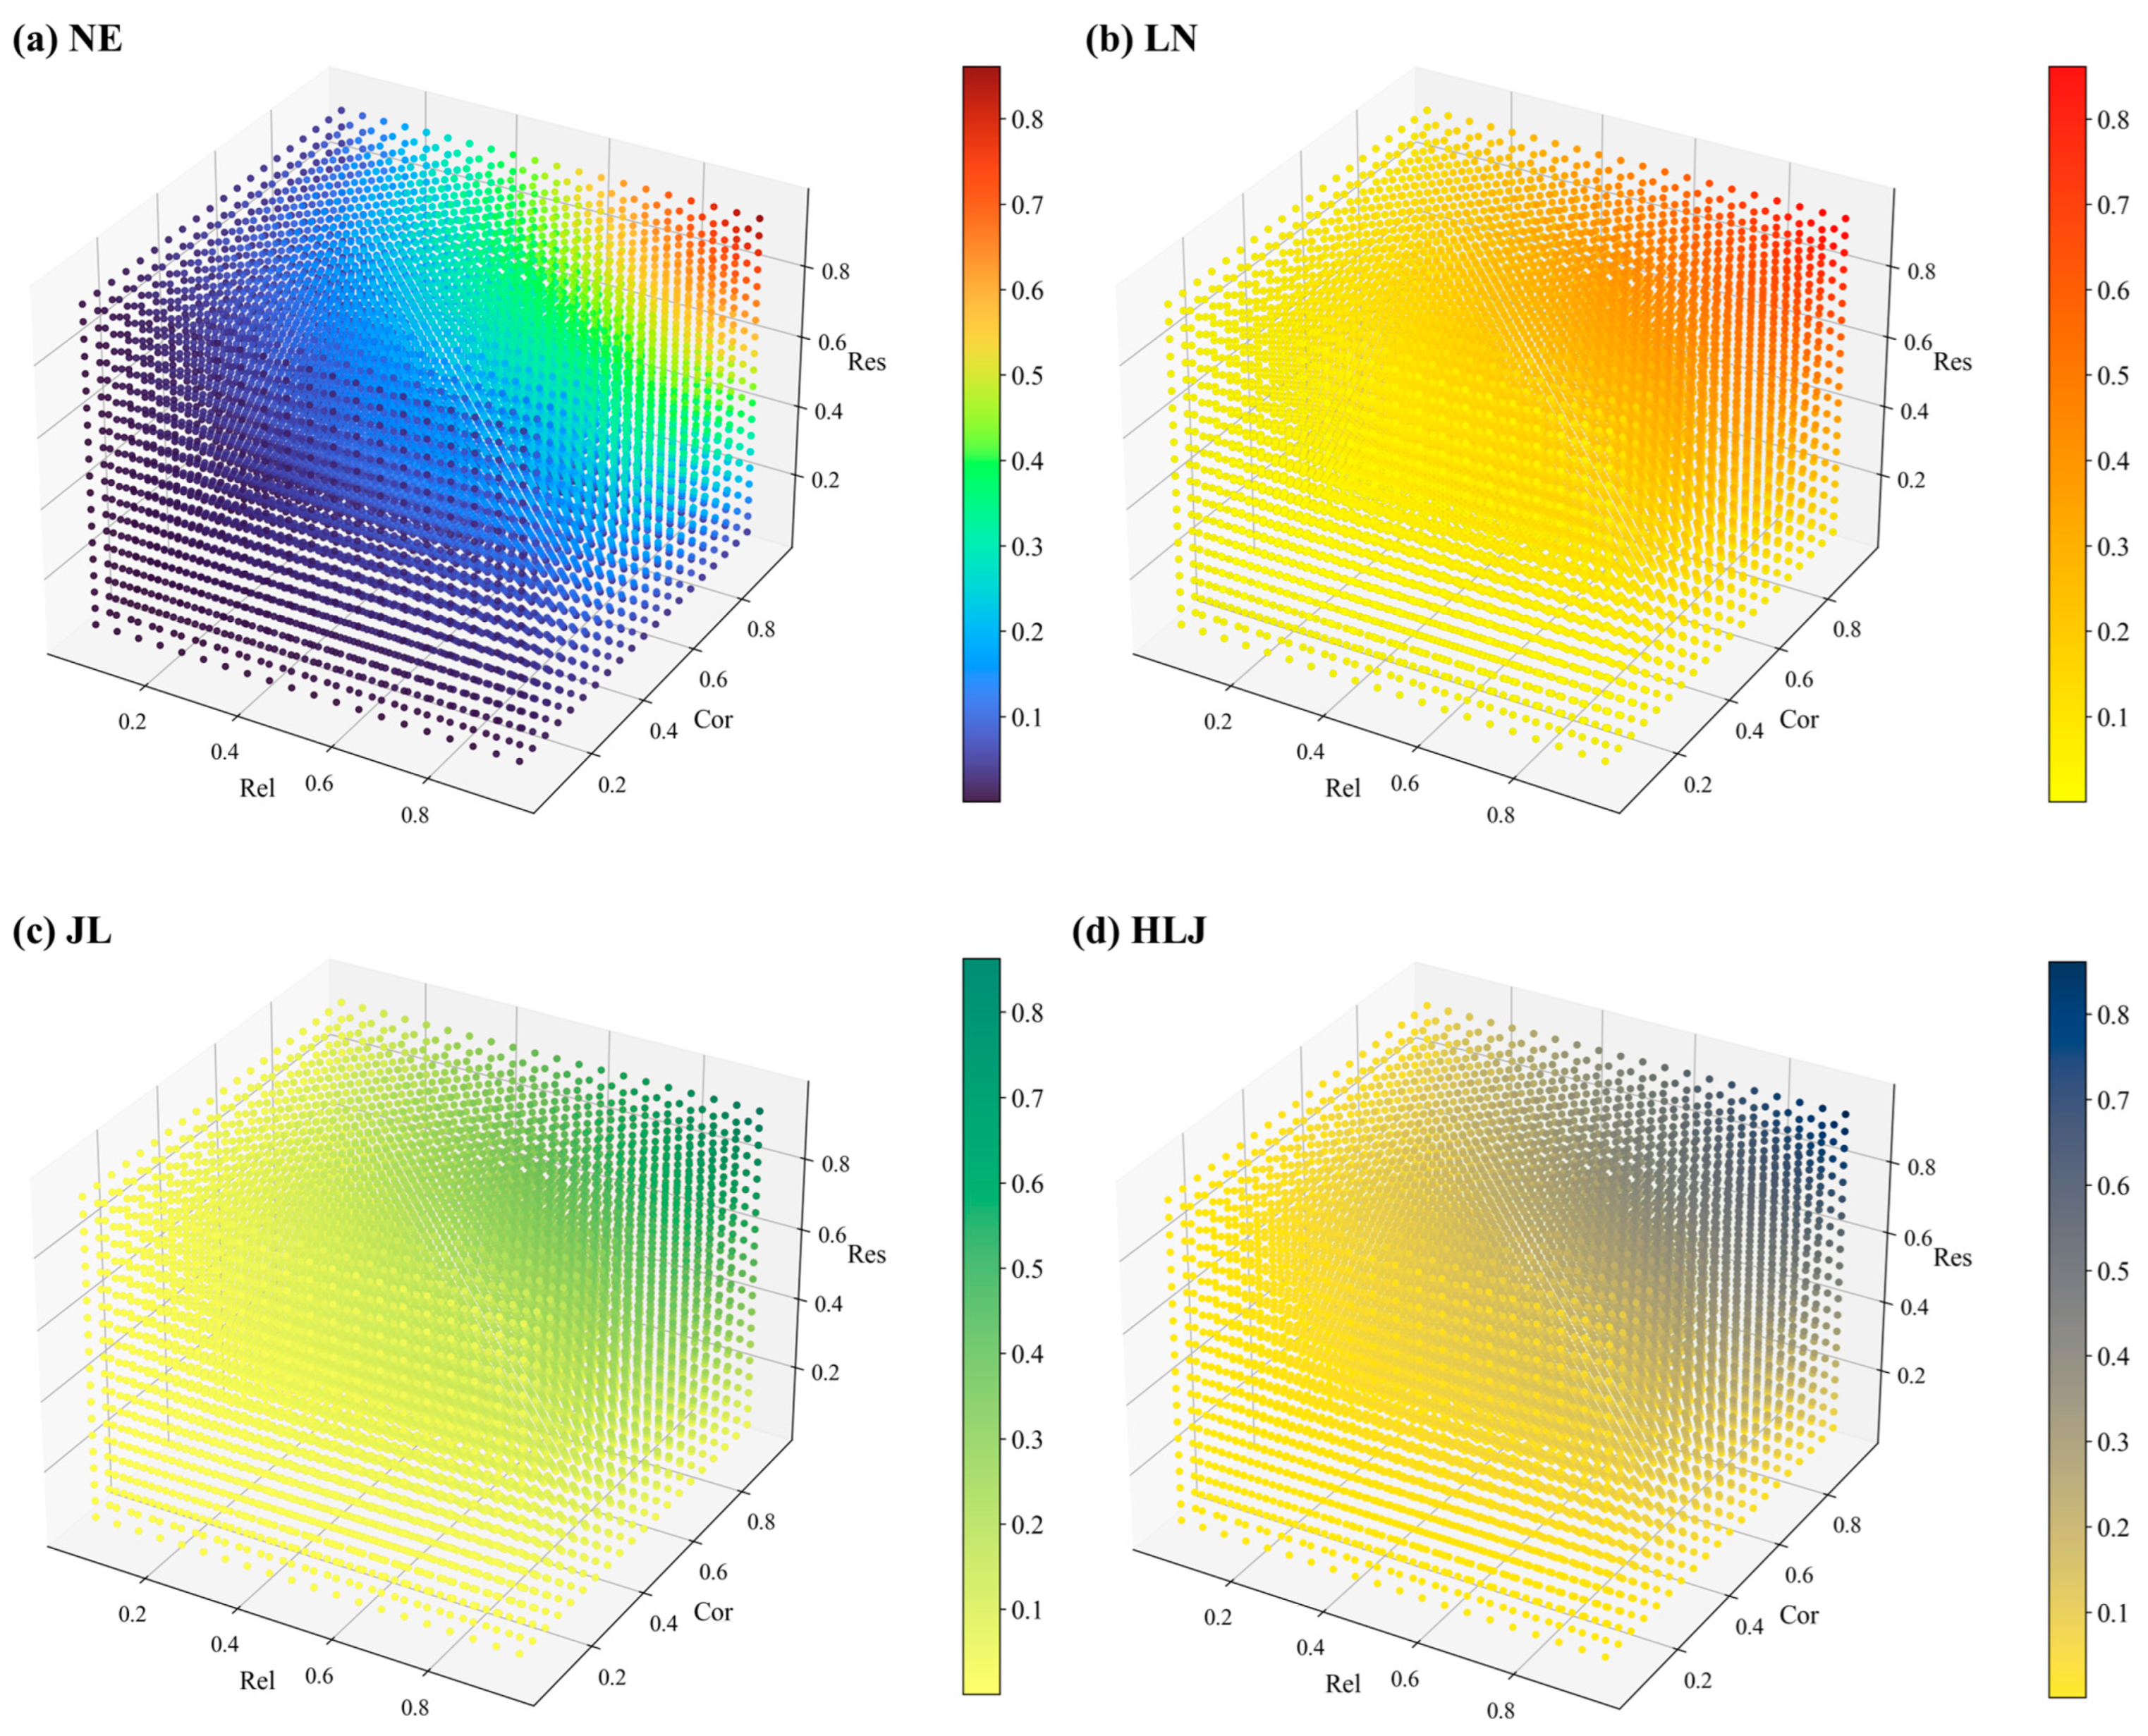
At the Northeast regional level, Rel increased rapidly over time, with a multi-year average of 0.60. Cor started at the highest initial level (0.48) but grew slowly between 2001 and 2015, averaging 0.55 over the study period. Res showed an initial increase followed by stabilization, with a relatively low average of 0.44.
(3)
Five key obstacle indicators—area under soil erosion control, reservoir storage capacity per capita, pesticide application amount, rural electricity consumption per capita, and proportion of agricultural water use—were identified as common and significant threats to agricultural system security across the region.
(4)
The bivariate joint probability of Rel–Cor reaching the relatively secure threshold (0.8) was the highest at 0.7643, reflecting strong reliability and coordination in the region. In contrast, the probabilities for Rel–Res and Cor–Res to reach the same threshold were lower, at 0.7164 and 0.7318, respectively.
(5)
The trivariate joint probability of Rel-Cor-Res reaching the relatively secure threshold (0.8) was the highest in Jilin (0.5538) and the lowest in Heilongjiang (0.5413). This highlights the importance of synergistic and balanced development across reliability, coordination, and resilience dimensions to enhance overall agricultural system coupling security.
(6)
This study introduces and operationalizes the concept of agricultural systems coupling security, which integrates the dimensions of reliability, coordination, and resilience to holistically assess the performance and stability of agricultural systems under complex environmental and socio-economic conditions. Although this term is not yet widely established in the existing literature, it offers a novel analytical lens for capturing the internal interdependence among critical resource subsystems and their collective response to external stressors. Moving forward, the Rel–Cor–Res framework and its coupling security index can serve as a foundational tool for cross-regional comparisons, scenario-based policy simulations, and long-term sustainability evaluations. It also provides a quantitative basis for studying macro-level properties of agricultural systems, such as systemic robustness, coupling dynamics, and risk transmission.

Author Contributions

Conceptualization, H.C. and Y.Z.; Data curation, Y.C. and R.L.; Formal analysis, Y.C. and J.Y.; Funding acquisition, H.C.; Methodology, W.L.; Software, H.R.; Supervision, Y.Z.; Validation, W.L.; Writing—original draft, H.C.; Writing—review and editing, H.C. and Y.Z. All authors have read and agreed to the published version of the manuscript.

Funding

This research was funded by the National Natural Science Foundation of China (Grant No. 52409041, 52379021), the Natural Science Foundation of Tianjin (Grant No. 24JCQNJC01320), the Open Research Fund of State Key Laboratory of Water Cycle and Water Security in River Basin (IWHR) (Grant No. IWHR-SKL-KF202412), the Open Research Fund Program of the State Key Laboratory of Hydroscience and Engineering (Grant No. sklhse-KF-2025-B-02), and the Open Research Fund of Key Laboratory of Water Safety for Beijing–Tianjin–Hebei Region of Ministry of Water Resources (Grant No. IWHR-JJJ-202401).

Institutional Review Board Statement

Not applicable.

Data Availability Statement

Data will be made available on request.

Acknowledgments

We are so grateful to the anonymous reviewers and editors for their suggestions.

Conflicts of Interest

The authors declare no conflicts of interest.

Appendix A

Figure A1. Q–Q plots for marginal distribution fitting of Rel, Cor, and Res variables under five univariate marginal distributions in Northeast China.
Agriculture 15 01338 g0a1
Figure A2. Q–Q plots for marginal distribution fitting of Rel, Cor, and Res Variables under five univariate marginal distributions in Liaoning.
Agriculture 15 01338 g0a2
Figure A3. Q–Q Plots for marginal distribution fitting of Rel, Cor, and Res variables under five univariate marginal distributions in Jilin.
Agriculture 15 01338 g0a3
Figure A4. Q–Q Plots for marginal distribution fitting of Rel, Cor, and Res Variables under five univariate marginal distributions in Heilongjiang.
Agriculture 15 01338 g0a4
Table A1. Results of goodness-of-fit tests for univariate marginal distributions.
DimensionMarginal DistributionLiaoningJilinHeilongjiangNortheast
PDPDPDPD
RelWeibill//0.17970.42630.17670.447//
Gamma0.17640.44920.2490.1092//0.17670.4471
Exp0.35460.00560.15470.61370.18860.36760.23930.1359
Normal0.16120.56280.17220.47910.17310.47260.17050.492
Lognormal//0.13220.7899////
CorWeibill0.11450.90390.11660.89270.10740.93820.16980.4968
Gamma0.11410.9060.09830.96950.12280.85480.21730.2161
Exp0.2320.15930.34610.00740.14370.70160.15530.6092
Normal0.15770.58970.10150.95990.16880.50480.1760.4518
Lognormal0.10730.9384//0.11030.92530.0910.9854
ResWeibill0.11280.91310.12680.82810.10060.9630.12320.8523
Gamma0.13450.773//0.09070.9858//
Exp0.3070.02450.30310.02730.32450.01460.28530.0445
Normal0.12880.81440.12890.81320.10150.96010.11660.8926
Lognormal////0.08990.987//
Table A2. Estimated parameters of univariate marginal distributions.
RegionDimensionWeibillGammaExpNormalLognormal
kλαθθμσσμ
LiaoningRel//284.1870.0030.1270.40.057//
Jilin0.7220.1630.8160.1520.1580.5840.1150.4220.265
Heilongjiang1.6820.232//0.1870.5820.122//
Northeast//226.6150.010.2760.6040.148//
LiaoningCor1.6180.1083.1420.0360.0890.4780.0590.3180.18
Jilin4.3350.258395.6670.0030.1330.5920.062//
Heilongjiang1.1890.061.2260.0460.0560.5230.0440.6470.059
Northeast0.9440.0840.790.0990.0850.5460.0640.4470.134
LiaoningRes24.8531.156237.2190.0040.10.6540.056//
Jilin3.4690.194//0.1170.5720.056//
Heilongjiang2.7140.1235.350.0070.0840.4610.0430.1070.393
Northeast3.0550.152//0.0870.4360.049//
Table A3. Copula parameter estimation and multivariate model fitting results.
VariableCopula FunctionLiaoningJilin
θAICBICθAICBIC
Rel-CorClayton2.12531.265532.356510.833327.935429.0265
Gumbel2.062517.1418.23116.4167−38.4891−37.3981
Frank6.018723.194524.2855///
Rel-ResClayton1.397117.207718.29882.62−21.5269−20.4359
Gumbel1.69858.45869.54962.31−8.9757−7.8846
Frank4.318213.236114.32727.1113−13.5862−12.4952
Cor-ResClayton2.125−18.8902−17.79912.2778−9.3308−8.2397
Gumbel2.0625−7.5409−6.44992.1389−9.8078−8.7167
Frank6.0187−9.4897−8.39876.3599−14.8109−13.7198
Rel-Cor-ResFrank1.1481−48.7365−47.64541.4361−89.7175−88.6265
Clayton1−5.618−4.5271.1605−36.9292−35.8381
VariableCopula functionHeilongjiangNortheast
θAICBICθAICBIC
Rel-CorClayton1.609422.002723.09375.4516104.8431105.9341
Gumbel1.80474.61715.70813.725852.107953.1989
Frank4.830210.015911.10713.020566.105467.1964
Rel-ResClayton///1.4478−17.5156−16.4245
Gumbel///1.7239−25.8198−24.7288
Frank−1.80942.82893.91994.442−22.3164−21.2253
Cor-ResClayton0.02632.26363.35472.12532.650133.7412
Gumbel1.01321.6962.7872.062516.855717.9467
Frank0.11722.03533.12646.018723.964725.0557
Rel-Cor-ResFrank1.0071−48.3442−47.25311.1263−12.8303−11.7393
Clayton138.781239.87220.495−12.4066−11.3156

References

  1. Viana, C.M.; Freire, D.; Abrantes, P.; Rocha, J.; Pereira, P. Agricultural land systems importance for supporting food security and sustainable development goals: A systematic review. Sci. Total Environ. 2022, 806, 150718. [Google Scholar] [CrossRef] [PubMed]
  2. Ben Hassen, T.; El Bilali, H. Impacts of the Russia-Ukraine war on global food security: Towards more sustainable and resilient food systems? Foods 2022, 11, 2301. [Google Scholar] [CrossRef] [PubMed]
  3. Krishnamurthy, R.P.K.; Fisher, J.B.; Choularton, R.J.; Kareiva, P.M. Anticipating drought-related food security changes. Nat. Sustain. 2022, 5, 956–964. [Google Scholar] [CrossRef]
  4. He, T.; Hu, Y.; Li, F.; Chen, Y.; Zhang, M.; Zheng, Q.; Jin, Y.; Ren, H. Mapping Land- and Offshore-Based Wind Turbines in China in 2023 with Sentinel-2 Satellite Data. Renew. Sustain. Energy Rev. 2025, 214, 115566. [Google Scholar] [CrossRef]
  5. Abbas, S.; Haider, A.; Kousar, S.; Lu, H.; Lu, S.; Liu, F.; Li, H.; Miao, C.; Feng, W.; Ahamad, M.I.; et al. Climate variability, population growth, and globalization impacting food security in Pakistan. Sci. Rep. 2025, 15, 4225. [Google Scholar] [CrossRef] [PubMed]
  6. Khatri, P.; Kumar, P.; Shakya, K.S.; Kirlas, M.C.; Tiwari, K.K. Understanding the intertwined nature of rising multiple risks in modern agriculture and food system. Environ. Dev. Sustain. 2024, 26, 24107–24150. [Google Scholar] [CrossRef]
  7. Maqbool, M.E.; Farhan, A.; Qamar, M.A. Global impact of COVID-19 on food safety and environmental sustainability: Pathways to face the pandemic crisis. Heliyon 2024, 10, 15. [Google Scholar] [CrossRef]
  8. Zhu, X.; Zhang, Y.; Zhu, Y.; Li, Y.; Cui, J.; Yu, B. Multidimensional deconstruction and workable solutions for addressing China’s food security issues: From the perspective of sustainable diets. Land Use Policy 2025, 148, 107401. [Google Scholar] [CrossRef]
  9. Food and Agriculture Organization of the United Nations (FAO). The State of Food Security and Nutrition in the World (SOFI) Report 2023; FAO: Rome, Italy, 2023. [Google Scholar]
  10. United Nations (UN). Transforming Our World: The 2030 Agenda for Sustainable Development; United Nations: New York, NY, USA, 2015; Available online: https://sdgs.un.org/2030agenda (accessed on 10 May 2025).
  11. Noe, E.; Alrøe, H.F. Sustainable agriculture issues explained by differentiation and structural coupling using social systems analysis. Agron. Sustain. Dev. 2015, 35, 133–144. [Google Scholar] [CrossRef]
  12. Li, M.; Li, H.; Fu, Q.; Liu, D.; Yu, L.; Li, T. Approach for optimizing the water–land–food–energy nexus in agroforestry systems under climate change. Agric. Syst. 2021, 192, 103201. [Google Scholar] [CrossRef]
  13. Chang, H.; Zhao, Y.; Cao, Y.; He, G.; Wang, Q.; Liu, R.; Ren, H.; Yao, J.; Li, W. Evaluating Sustainability of Water–Energy–Food–Ecosystems Nexus in Water-Scarce Regions via Coupled Simulation Model. Agriculture 2025, 15, 1271. [Google Scholar] [CrossRef]
  14. De Haen, H.; Hemrich, G. The economics of natural disasters: Implications and challenges for food security. Agric. Econ. 2007, 37, 31–45. [Google Scholar] [CrossRef]
  15. Lin, B.; Wang, Y. How does natural disasters affect China agricultural economic growth? Energy 2024, 296, 131096. [Google Scholar] [CrossRef]
  16. Trusova, N.V.; Hryvkivska, O.V.; Kotvytska, N.M.; Nesterenko, S.A.; Yavorska, T.I.; Kotyk, O.V. Determinants of the innovative and investment development of agriculture. Int. J. Agric. Ext. 2021, 9, 81–100. [Google Scholar] [CrossRef]
  17. Zhang, H.; Zhang, J.; Song, J. Analysis of the threshold effect of agricultural industrial agglomeration and industrial structure upgrading on sustainable agricultural development in China. J. Clean. Prod. 2022, 341, 130818. [Google Scholar] [CrossRef]
  18. Van der Ploeg, J.D.; Barjolle, D.; Bruil, J.; Brunori, G.; Madureira, L.M.C.; Dessein, J.; Drąg, Z.; Fink-Kessler, A.; Gasselin, P.; de Molina, M.G.; et al. The economic potential of agroecology: Empirical evidence from Europe. J. Rural Stud. 2019, 71, 46–61. [Google Scholar] [CrossRef]
  19. Manikas, I.; Ali, B.M.; Sundarakani, B. A systematic literature review of indicators measuring food security. Agric. Food Secur. 2023, 12, 10. [Google Scholar] [CrossRef] [PubMed]
  20. Gutzler, C.; Helming, K.; Balla, D.; Dannowski, R.; Deumlich, D.; Glemnitz, M.; Knierim, A.; Mirschel, W.; Nendel, C.; Paul, C.; et al. Agricultural land use changes–a scenario-based sustainability impact assessment for Brandenburg, Germany. Ecol. Indic. 2015, 48, 505–517. [Google Scholar] [CrossRef]
  21. Ye, S.; Wang, J.; Jiang, J.; Gao, P.; Song, C. Coupling input and output intensity to explore the sustainable agriculture intensification path in mainland China. J. Clean. Prod. 2024, 442, 140827. [Google Scholar] [CrossRef]
  22. Liu, F.; Wang, C.; Zhang, Y.; Zhou, S.; Yang, Y.; Wu, X.; Hu, F.; Liu, C. Data-driven analysis and evaluation of regional agriculture for high-quality development of Anhui Province in the Yangtze River Delta. Environ. Sci. Pollut. Res. 2022, 29, 1–14. [Google Scholar]
  23. Wang, X. Managing land carrying capacity: Key to achieving sustainable production systems for food security. Land 2022, 11, 484. [Google Scholar] [CrossRef]
  24. Sami, M.; Shiekhdavoodi, M.J.; Pazhohanniya, M.; Pazhohanniya, F. Environmental comprehensive assessment of agricultural systems at the farm level using fuzzy logic: A case study in cane farms in Iran. Environ. Model. Softw. 2014, 58, 95–108. [Google Scholar] [CrossRef]
  25. Zhao, Y.; Talha, M. Evaluation of food safety problems based on the fuzzy comprehensive analysis method. Food Sci. Technol. 2021, 42, e47321. [Google Scholar] [CrossRef]
  26. Liu, D.; Qi, X.; Fu, Q.; Li, M.; Zhu, W.; Zhang, L.; Faiz, M.A.; Khan, M.I.; Li, T.; Cui, S. A resilience evaluation method for a combined regional agricultural water and soil resource system based on Weighted Mahalanobis distance and a Gray-TOPSIS model. J. Clean. Prod. 2019, 229, 667–679. [Google Scholar] [CrossRef]
  27. Li, D.; Chen, J.; Qiu, M. The evaluation and analysis of the entropy weight method and the fractional grey model study on the development level of modern agriculture in Huizhou. Math. Probl. Eng. 2021, 2021, 5543368. [Google Scholar] [CrossRef]
  28. Zhang, X.; Yao, G.; Vishwakarma, S.; Dalin, C.; Komarek, A.M.; Kanter, D.R.; Davis, K.F.; Pfeifer, K.; Zhao, J.; Zou, T.; et al. Quantitative assessment of agricultural sustainability reveals divergent priorities among nations. One Earth 2021, 4, 1262–1277. [Google Scholar] [CrossRef]
  29. Chen, Z.; Sarkar, A.; Rahman, A.; Li, X.; Xia, X. Exploring the drivers of green agricultural development (GAD) in China: A spatial association network structure approaches. Land Use Policy 2022, 112, 105827. [Google Scholar] [CrossRef]
  30. Sarkar, A.; Azim, J.A.; Al Asif, A.; Qian, L.; Peau, A.K. Structural equation modeling for indicators of sustainable agriculture: Prospective of a developing country’s agriculture. Land Use Policy 2021, 109, 105638. [Google Scholar] [CrossRef]
  31. Bathaei, A.; Štreimikienė, D. A systematic review of agricultural sustainability indicators. Agriculture 2023, 13, 241. [Google Scholar] [CrossRef]
  32. Cui, X.; Cai, T.; Deng, W.; Zheng, R.; Jiang, Y.; Bao, H. Indicators for evaluating high-quality agricultural development: Empirical study from Yangtze River Economic Belt, China. Soc. Indic. Res. 2022, 164, 1101–1127. [Google Scholar] [CrossRef]
  33. Yu, J.; Wu, G. Spatial disparities and dynamics in the high quality agricultural development in Heilongjiang Province of China. Sci. Rep. 2025, 15, 4765. [Google Scholar] [CrossRef]
  34. Cansino-Loeza, B.; Ponce-Ortega, J.M. Sustainable assessment of Water-Energy-Food Nexus at regional level through a multi-stakeholder optimization approach. J. Clean. Prod. 2021, 290, 125194. [Google Scholar] [CrossRef]
  35. Hao, L.; Wang, P.; Yu, J.; Ruan, H. An integrative analytical framework of water–energy–food security for sustainable development at the country scale: A case study of five Central Asian countries. J. Hydrol. 2022, 607, 127530. [Google Scholar] [CrossRef]
  36. Qin, J.; Duan, W.; Chen, Y.; Dukhovny, V.A.; Sorokin, D.; Li, Y.; Wang, X. Comprehensive evaluation and sustainable development of water–energy–food–ecology systems in Central Asia. Renew. Sustain. Energy Rev. 2022, 157, 112061. [Google Scholar] [CrossRef]
  37. Radmehr, R.; Ghorbani, M.; Ziaei, A.N. Quantifying and managing the water–energy–food nexus in dry regions food insecurity: New methods and evidence. Agric. Water Manag. 2021, 245, 106588. [Google Scholar] [CrossRef]
  38. Qian, X.Y.; Liang, Q.M. Sustainability evaluation of the provincial water–energy–food nexus in China: Evolutions, obstacles, and response strategies. Sustain. Cities Soc. 2021, 75, 103332. [Google Scholar] [CrossRef]
  39. Correa-Cano, M.; Salmoral, G.; Rey, D.; Knox, J.; Graves, A.; Melo, O.; Foster, W.; Naranjo, L.; Zegarra, E.; Johnson, C.; et al. A novel modelling toolkit for unpacking the Water-Energy-Food-Environment (WEFE) nexus of agricultural development. Renew. Sustain. Energy Rev. 2022, 159, 112182. [Google Scholar] [CrossRef]
  40. Mirzaei, A.; Abdeshahi, A.; Azarm, H.; Naghavi, S. New design of water–energy–food–environment nexus for sustainable agricultural management. Stoch. Environ. Res. Risk Assess. 2022, 36, 1861–1874. [Google Scholar] [CrossRef]
  41. Ren, H.; Liu, B.; Zhang, Z.; Li, F.; Pan, K.; Zhou, Z.; Xu, X. A water–energy–food–carbon nexus optimization model for sustainable agricultural development in the Yellow River Basin under uncertainty. Appl. Energy 2022, 326, 120008. [Google Scholar] [CrossRef]
  42. Yue, Q.; Wu, H.; Wang, Y.; Guo, P. Achieving sustainable development goals in agricultural energy–water–food nexus system: An integrated inexact multi-objective optimization approach. Resour. Conserv. Recycl. 2021, 174, 105833. [Google Scholar] [CrossRef]
  43. Bazzana, D.; Foltz, J.; Zhang, Y. Impact of climate smart agriculture on food security: An agent-based analysis. Food Policy 2022, 111, 102304. [Google Scholar] [CrossRef]
  44. Wang, W.; Li, K.; Liu, Y.; Lian, J.; Hong, S. A system dynamics model analysis for policy impacts on green agriculture development: A case of the Sichuan Tibetan Area. J. Clean. Prod. 2022, 371, 133562. [Google Scholar] [CrossRef]
  45. Walters, J.P.; Archer, D.W.; Sassenrath, G.F.; Hendrickson, J.R.; Hanson, J.D.; Halloran, J.M.; Vadas, P.; Alarcon, V.J. Exploring agricultural production systems and their fundamental components with system dynamics modelling. Ecol. Model. 2016, 333, 51–65. [Google Scholar] [CrossRef]
  46. Pasqualino, R.; Monasterolo, I.; Jones, A. An integrated global food and energy security system dynamics model for addressing systemic risk. Sustainability 2019, 11, 3995. [Google Scholar] [CrossRef]
  47. Qazi, A.; Al-Mhdawi, M.K.S. Sustainability and adaptation dynamics in global food security: A Bayesian belief network approach. J. Clean. Prod. 2024, 467, 142931. [Google Scholar] [CrossRef]
  48. Eyre, R.W.; House, T.; Gómez-Olivé, F.X.; Griffiths, F.E. Bayesian belief network modelling of household food security in rural South Africa. BMC Public Health 2021, 21, 1–16. [Google Scholar] [CrossRef] [PubMed]
  49. Zou, J.; Long, H.L. The variation of farmland use and the security pattern of grain production in China since 1978. J. Nat. Resour. 2009, 24, 1366–1377. [Google Scholar]
  50. Yao, C.; Wei, Y.; Lin, H.; Cui, H. Spatial-temporal pattern and coupling coordination evolution of the vulnerability of food production and consumption ability in China. Econ. Geogr. 2019, 39, 147–156. [Google Scholar]
  51. Al Rashed, M.; Sefelnasr, A.; Sherif, M.; Murad, A.; Alshamsi, D.; Aliewi, A.; Ebraheem, A.A. Novel concept for water scarcity quantification considering nonconventional and virtual water resources in arid countries: Application in Gulf Cooperation Council countries. Sci. Total Environ. 2023, 882, 163473. [Google Scholar] [CrossRef]
  52. Luo, L.; Xing, Z.; Chu, B.; Zhang, H.; Wang, H. Virtual land trade and associated risks to food security in China. Environ. Impact Assess. Rev. 2024, 106, 107461. [Google Scholar] [CrossRef]
  53. Chen, L.; Chang, J.; Wang, Y.; Guo, A.; Liu, Y.; Wang, Q.; Zhu, Y.; Zhang, Y.; Xie, Z. Disclosing the future food security risk of China based on crop production and water scarcity under diverse socioeconomic and climate scenarios. Sci. Total Environ. 2021, 790, 148110. [Google Scholar] [CrossRef] [PubMed]
  54. Zhang, P.Y.; Pang, B.; He, J.J.; Guo, Y.; Zhu, L.Q. Coupling relationship and trend of cultivated land productivity and food security: A case study of Henan Province. Sci. Geogr. Sin. 2017, 37, 1392–1402. [Google Scholar]
  55. Yang, S.; Li, D.; Liao, H.; Zhu, L.; Zhou, M.; Cai, Z. Analysis of the balance between supply and demand of arable land in China based on food security. Sustainability 2023, 15, 5706. [Google Scholar] [CrossRef]
  56. Liu, X.; Xu, Y. Analysis of dynamic changes and main obstacle factors of grain supply and demand balance in northwest China. Sustainability 2023, 15, 10835. [Google Scholar] [CrossRef]
  57. Chen, L.; Xia, X.; Zhang, J.; Zhu, Y.; Long, C.; Chen, Y.; Guo, W.; Xu, L.; Jia, J. The food security risks in the Yangtze River Delta of China associated with water scarcity, grain production, and grain trade. Sci. Total Environ. 2024, 948, 174863. [Google Scholar] [CrossRef] [PubMed]
  58. Yao, C.S.; Yin, W.; Li, Z.T. The vulnerability assessment and driving mechanism analysis of China’s food security system. J. Nat. Resour. 2019, 34, 1720–1734. [Google Scholar] [CrossRef]
  59. Kalogiannidis, S.; Papadopoulou, C.I.; Loizou, E.; Chatzitheodoridis, F. Risk, vulnerability, and resilience in agriculture and their impact on sustainable rural economy development: A case study of Greece. Agriculture 2023, 13, 1222. [Google Scholar] [CrossRef]
  60. Das, S.; Goswami, K. Progress in agricultural vulnerability and risk research in India: A systematic review. Reg. Environ. Change 2021, 21, 24. [Google Scholar] [CrossRef]
  61. Shukla, R.; Gleixner, S.; Yalew, A.W.; Schauberger, B.; Sietz, D.; Gornott, C. Dynamic vulnerability of smallholder agricultural systems in the face of climate change for Ethiopia. Environ. Res. Lett. 2021, 16, 044007. [Google Scholar] [CrossRef]
  62. Liu, J.; Dietz, T.; Carpenter, S.R.; Alberti, M.; Folke, C.; Moran, E.; Pell, A.N.; Deadman, P.; Kratz, T.; Lubchenco, J.; et al. Complexity of coupled human and natural systems. Science 2007, 317, 1513–1516. [Google Scholar] [CrossRef]
  63. Chang, H.; Cao, Y.; Zhao, Y.; He, G.; Wang, Q.; Yao, J.; Ren, H.; Yang, H.; Hong, Z. Competitive and synergic evolution of the water–food–ecology system: A case study of the Beijing–Tianjin–Hebei region, China. Sci. Total Environ. 2024, 923, 171509. [Google Scholar] [CrossRef]
  64. Chang, H.; Zhang, B.; Han, J.; Zhao, Y.; Cao, Y.; Yao, J.; Shi, L. Evaluation of the coupling coordination and sustainable development of water–energy–land–food system on a 40-year scale: A case study of Hebei, China. Land 2024, 13, 1089. [Google Scholar] [CrossRef]
  65. Li, W.; Jiang, S.; Zhao, Y.; Li, H.; Zhu, Y.; He, G.; Xu, Y.; Shang, Y. A copula-based security risk evaluation and probability calculation for water–energy–food nexus. Sci. Total Environ. 2023, 856, 159236. [Google Scholar] [CrossRef]
  66. Xu, Y.; Yang, L.; Sun, K.; Zhu, J. Synergistic security relationships and risk measurement of water resources–social economy–ecological environment in Beijing–Tianjin–Hebei region. Ecol. Indic. 2025, 175, 113512. [Google Scholar] [CrossRef]
  67. Li, W.; Jiang, S.; Zhao, Y.; Wang, Q.; He, F.; Li, H.; Zhu, Y.; He, G. Safety Evaluation of Water–Energy–Food Coupling System in Beijing–Tianjin–Hebei Region. Water Resour. Prot. 2023, 39, 39–48. (In Chinese) [Google Scholar]
  68. Zhu, Y.; Tian, D.; Yan, F. Effectiveness of entropy weight method in decision-making. Math. Probl. Eng. 2020, 2020, 3564835. [Google Scholar] [CrossRef]
  69. Žižović, M.; Miljković, B.; Marinković, D. Objective methods for determining criteria weight coefficients: A modification of the CRITIC method. Decis. Mak. Appl. Manag. Eng. 2020, 3, 149–161. [Google Scholar] [CrossRef]
  70. Chakraborty, S. TOPSIS and Modified TOPSIS: A comparative analysis. Decis. Anal. J. 2022, 2, 100021. [Google Scholar] [CrossRef]
  71. Zuo, Q. Harmony Theory: Theory Method and Application; Science Press: Beijing, China, 2012. (In Chinese) [Google Scholar]
  72. Nelsen, R.B. An Introduction to Copulas; Springer: New York, NY, USA, 2006. [Google Scholar]
  73. Scaillet, O. A Kolmogorov–Smirnov type test for positive quadrant dependence. Can. J. Stat. 2005, 33, 415–427. [Google Scholar] [CrossRef]
  74. Li, W.; Guo, J. Coupling Coordination and Obstacle Factors of Cultivated Land System Resilience and New Urbanization. Front. Sustain. Food Syst. 2025, 9, 1554797. [Google Scholar] [CrossRef]
  75. He, H.; Zhang, Z.; Ding, R.; Shi, Y. Multi-Driving Paths for the Coupling Coordinated Development of Agricultural Carbon Emission Reduction and Sequestration and Food Security: A Configurational Analysis Based on Dynamic fsQCA. Ecol. Indic. 2024, 160, 111875. [Google Scholar] [CrossRef]
  76. Magrini, A.; Giambona, F. A Composite Indicator to Assess Sustainability of Agriculture in European Union Countries. Soc. Indic. Res. 2022, 163, 1003–1036. [Google Scholar] [CrossRef]
  77. Kamali, F.P.; Borges, J.A.R.; Meuwissen, M.P.M.; de Boer, I.J.M.; Oude Lansink, A.G.J.M. Sustainability Assessment of Agricultural Systems: The Validity of Expert Opinion and Robustness of a Multi-Criteria Analysis. Agric. Syst. 2017, 157, 118–128. [Google Scholar] [CrossRef]
  78. Wang, Z.; Wang, J.; Zhang, G.; Wang, Z. Evaluation of Agricultural Extension Service for Sustainable Agricultural Development Using a Hybrid Entropy and TOPSIS Method. Sustainability 2021, 13, 347. [Google Scholar] [CrossRef]
  79. Bera, D.; Dutta, D. A Comprehensive Evaluation of Agricultural Drought Vulnerability Using Fuzzy-AHP-Based Composite Index Integrating Sensitivity and Adaptive Capacity. Hydrol. Process. 2024, 38, e15331. [Google Scholar] [CrossRef]
  80. Stave, K.A.; Kopainsky, B. A System Dynamics Approach for Examining Mechanisms and Pathways of Food Supply Vulnerability. J. Environ. Stud. Sci. 2015, 5, 321–336. [Google Scholar] [CrossRef]
  81. Soliman, M.; Newlands, N.K.; Lyubchich, V.; Gel, Y.R. Multivariate Copula Modeling for Improving Agricultural Risk Assessment under Climate Variability. Variance 2023, 16, 1. [Google Scholar]
  82. Lei, H.; Yu, J.; Pan, H.; Li, J.; Leghari, S.J.; Shang, C.; Shi, L. A New Agricultural Drought Disaster Risk Assessment Framework: Coupled a Copula Function to Select Return Periods and the Jensen Model to Calculate Yield Loss. Sustainability 2023, 15, 3786. [Google Scholar] [CrossRef]
  83. Hou, W.; Yan, P.; Feng, G.; Zuo, D. A 3D Copula Method for the Impact and Risk Assessment of Drought Disaster and an Example Application. Front. Phys. 2021, 9, 656253. [Google Scholar] [CrossRef]
  84. Sun, Y.; Wang, K. The Implication of Copula-Based Models for Crop Insurance and Reinsurance under Systemic Risk. Front. Environ. Sci. 2022, 10, 916494. [Google Scholar] [CrossRef]
Figure 1. Study area.
Agriculture 15 01338 g001
Figure 2. Conceptual framework of agricultural system coupling security.
Agriculture 15 01338 g002
Figure 3. Temporal trends of Rel–Cor–Res in Northeast China from 2001 to 2022.
Agriculture 15 01338 g003
Figure 4. Spatiotemporal variation in AS-CSI in Northeast China from 2001 to 2022.
Agriculture 15 01338 g004
Figure 5. Obstacle factors affecting AS-CSI in Northeast China from 2001 to 2022.
Agriculture 15 01338 g005
Figure 6. Contours of the two-dimensional joint distribution of AS-CSI in Northeast China. Rel-Cor (a), Rel-Res (b), Cor-Res (c) of NE, Rel-Cor (d), Rel-Res (e), Cor-Res (f) of LN, Rel-Cor (g), Rel-Res (h), Cor-Res (i) of JL, Rel-Cor (j), Rel-Res (k), Cor-Res (l) of HLJ.
Agriculture 15 01338 g006
Figure 7. Trivariate joint probability surface for Rel–Cor–Res in Northeast China.
Agriculture 15 01338 g007
Figure 8. Correlation analysis of Rel–Cor, Rel–Res, and Cor–Res across provinces in Northeast China.
Agriculture 15 01338 g008
Table 1. Composition of the AS-CSI evaluation indicator system.
Target LayerCriterion LayerSubsystemIndicatorUnitAttributeCodeWeight
AS-CSIReliability
(0.328)
WaterWater resources per capitam3+Rel10.027
Agricultural water use per capitam3+Rel20.032
Water resources utilization rate%Rel30.031
Reservoir storage capacity per capitam3+Rel40.038
LandEffective irrigated area per capitam2+Rel50.03
Total sown area of foods per capitam2+Rel60.033
Sown area of grain foods per capitam2+Rel70.034
EnergyTotal power of agricultural machinery per capitakW+Rel80.027
Rural electricity consumption per capitakWh+Rel90.05
Application amount of chemical fertilizers per capitakg+Rel100.025
Coordination
(0.327)
Food Production EfficiencyFood yield per cubic meter of waterkg/m3+Cor10.027
Food yield per hectarekg/ha+Cor20.031
Food yield per unit of fertilizer inputkg/kg+Cor30.031
Food yield per unit of agricultural machinery powerkg/kWCor40.034
Food self-sufficiency rate%+Cor50.034
Water–Land–Energy Synergy EfficiencyWater consumption per hectaret/haCor60.032
Fertilizer use per hectaret/haCor70.037
Machinery power per hectarekW/ha+Cor80.033
Multiple cropping index%+Cor90.032
Proportion of agricultural water use%Cor100.036
Resilience
(0.345)
EconomyGDP per capita104 CNY+Res10.034
GDP growth rate%+Res20.039
Proportion of agricultural GDP%Res30.035
Water consumption per 104 CNY of agricultural GDP%Res40.03
SocialUrbanization rate%+Res50.031
Proportion of agricultural employment%Res60.033
Population growth rate%+Res70.037
EnvironmentPesticide application amount104 tRes80.036
Area under soil erosion control103 haRes90.04
Disaster-affected area103 haRes100.031
Table 2. Characteristic threshold values for AS-CSI.
CodeCharacteristic Threshold ValuesCodeCharacteristic Threshold Values
Worst
(a)
Poor
(b)
Moderate
(c)
Good
(d)
Optimal
(e)
Worst
(a)
Poor
(b)
Moderate
(c)
Good
(d)
Optimal
(e)
Rel14741096135121723029Cor62.932.442.111.861.52
Rel2193238340473885Cor70.460.410.310.220.16
Rel368%47%37%27%21%Cor82.493.554.86.197.56
Rel423873284710201326Cor9201%223%249%296%369%
Rel53524466078251817Cor1089%77%70%65%62%
Rel68981542199326094387Res10.871.573.224.465.87
Rel77301259177623824235Res21%5%8%13%19%
Rel80.40.520.681.211.85Res323%16%14%11%9%
Rel988155250434913Res428471393859706409
Rel102935516792Res549%53%59%64%69%
Cor11.6322.413.34.57Res649%43%38%34%28%
Cor235574963569164257176Res7−1.95%−1.16%−0.24%0.18%0.53%
Cor31316182230Res819.368.835.824.562.96
Cor41747134311971029825Res914,5317458500236082252
Cor5100%151%237%299%475%Res10752135131749884336
Table 3. Security level classification of AS-CSI.
AS-CSI[0,0.2)[0.2,0.4)[0.4,0.6)[0.6,0.8)[0.8,1]
Security LevelVery InsecureInsecureMarginally
Secure
Relatively
Secure
Highly
Secure
Table 4. Probability density functions of univariate marginal distributions.
DistributionFormulaParameters
Weibill f x = k λ · x λ k 1 · exp x λ k ,   x     0 Shape: k
Scale :   λ
Gamma f x = x α 1 · exp x θ Γ α θ α ,   x     0 Shape :   α
Scale :   θ
Exp f x = λ · exp λ x ,           x     0 Scale :   λ
Normal f x = 1 σ · 2 π · exp x μ 2 2 σ 2 Mean :   μ
Std .   Dev :   σ
Lognormal f x = 1 x σ · 2 π · exp ln x μ 2 2 σ 2 ,           x > 0 Log-mean: μ
Log-std. dev: σ
Table 5. Archimedean Copula functions.
DistributionFormulaParameters
Gumbel C u , v = exp ln u θ + ln v θ 1 θ θ     1
Frank C u , v = 1 θ · ln 1 + exp θ u 1 exp θ v 1 exp θ 1
C u , v , w = 1 θ · ln 1 + exp θ u 1 exp θ v 1 exp θ w 1 exp θ 1 2
θ 0
Clayton C u , v = u θ + v θ 1 1 θ
C u , v , w = u θ + v θ + w θ 2 1 θ
θ > 0
Table 6. Two-dimensional joint distribution probabilities for AS-CSI.
RegionRelCorRel-CorRelResRel-ResCorResCor-Res
Liaoning0.80.80.73180.80.80.71490.80.80.688
Jilin0.77990.69560.715
Heilongjiang0.72060.62020.6426
Northeast0.76430.71640.7318
Table 7. Three-dimensional joint distribution probabilities for AS-CSI.
RegionRelCorResRel-Cor-Res
Liaoning0.80.80.80.5454
Jilin0.5538
Heilongjiang0.5413
Northeast0.5448
Disclaimer/Publisher’s Note: The statements, opinions and data contained in all publications are solely those of the individual author(s) and contributor(s) and not of MDPI and/or the editor(s). MDPI and/or the editor(s) disclaim responsibility for any injury to people or property resulting from any ideas, methods, instructions or products referred to in the content.

