Article

Study on Outdoor Spectral Inversion of Winter Jujube Based on BPDF Models

1
College of Mechanical and Electrical Engineering, Tarim University, Alar 843300, China
2
Modern Agricultural Engineering Key Laboratory, Universities of Education Department of Xinjiang Uygur Autonomous Region, Alar 843300, China
3
Xinjiang Production and Construction Corps Key Laboratory of Utilization and Equipment of Special Agricultural and Forestry Products in Southern Xinjiang, Alar 843300, China
*
Author to whom correspondence should be addressed.
These authors contributed equally to this work.
Agriculture 2025, 15(13), 1334; https://doi.org/10.3390/agriculture15131334
Submission received: 17 May 2025 / Revised: 17 June 2025 / Accepted: 18 June 2025 / Published: 21 June 2025
(This article belongs to the Section Agricultural Product Quality and Safety)

Abstract

The outdoor spectral detection of winter jujube quality is affected by complex ambient light and surface heterogeneity, resulting in limited inversion accuracy. To address this problem, this study proposes a correction method for outdoor spectral inversion based on the bidirectional polarization reflectance distribution function (BPDF) model. It was used to enhance the detection accuracy of water content and soluble solid (SSC) content of winter jujube. Experimentally, 900–1750 nm hyperspectral data of ripe winter jujube samples were collected at non-polarization and 0°, 45°, 90°, and 135° polarization azimuths. The spectra were inverted using four semi-empirical BPDF models, Nadal–Breon, Litvinov, Maignan and Xie–Cheng, and the corrected spectra were obtained by mean fusion. The quality prediction models are subsequently combined with the competitive adaptive reweighting algorithm (CARS) and partial least squares (PLS). The results showed that the modified spectra significantly optimized the prediction performance. The prediction set correlation coefficients (Rp) of the water content and SSC models were improved by 10–30% compared with the original spectra. The percentage of models with RPIQ values greater than 2 increased from 40% to 60%. Among them, the Litvinov model performs outstandingly in the direction of no polarization and 135° polarization, with the highest Rp of 0.8829 for water content prediction and RPIQ of 2.54. The Xie–Cheng model has an RPIQ of 2.64 for SSC prediction at 90° polarization, which shows the advantage of sensitivity to the deeper constituents. The different models complemented each other in multi-polarization scenarios. The Nadal–Breon model was suitable for epidermal reflection-dominated scenarios, and the Maignan model efficiently coupled epidermal and internal moisture characteristics through the moisture sensitivity index. The study verifies the effectiveness of the spectral correction method based on the BPDF model for outdoor quality detection of winter jujube, which provides a new path for the spectral detection of agricultural products in complex environments. In the future, it is necessary to further optimize the dynamic adjustment mechanism of the model parameters and improve the ability of environmental interference correction by combining multi-source data fusion.

1. Introduction

As a Chinese specialty fruit, the quality testing of winter jujube (e.g., water content, soluble solid content, etc.) is of great significance for post-harvest grading, freshness preservation and market distribution [1,2]. Outdoor spectroscopic detection technology has become one of the important means of monitoring the quality of agricultural products due to it being rapid, non-destructive and effective in real time [3]. Near-infrared spectroscopy (900–1750 nm) is an ideal wavelength band for fruit quality testing due to its characteristic absorption peaks (e.g., 1450 nm moisture absorption band) for internal moisture and soluble solids (SSC). However, the lighting conditions in the natural environment are complex. Factors such as solar zenith angle, detection azimuth and surface reflection characteristics can cause spectral data to be interfered by environmental noise, which affects the inversion accuracy [4,5]. How to effectively correct the influence of environmental factors on spectra and improve the reliability of outdoor spectral detection is a hot topic in current research.
The bipolarized reflectance distribution function (BPDF) model is able to describe the reflectance properties of targets under different observation angles and polarization states [6]. The BPDF model can be used to quantify the effect of ambient light interference on the spectrum by coupling Fresnel’s reflection law with the surface scattering mechanism, so it is possible to quantify the effect of ambient light interference on the spectrum. It shows good applicability in the fields of surface inversion and vegetation parameter estimation. At present, scholars at home and abroad have carried out a large number of studies for this. Xie Donghai [7] et al. thoroughly studied the multi-angle polarized reflectance characteristics of target features based on DPC observation data. It was found that the polarized reflectance of the surface was not only closely related to the type of vegetation covering the surface, but also gradually decreased with the increase in vegetation index. Recent studies have made new breakthroughs in model construction and data application. Ti Rufang [8] et al. carried out a comparative analysis of semi-empirical polarization reflectance models for eight types of typical land surfaces by means of DPC multi-angle polarization observation data. In this way, a quantitative evaluation system of model performance was established, which provides key parameter support for atmospheric aerosol inversion. Zhang Zihan [9] et al. innovatively applied the random forest algorithm to hyperspectral data and realized the accurate inversion of leaf nitrogen content by eliminating the interference of polarization effects. Song Zihao [10] et al. found that soil samples from different land use types (farmland and wetland) have differences in structural characteristics and material composition. This difference caused significant spatial differentiation in the polarization spectral response. In this field, there are fewer studies for fruit quality testing in complex outdoor environments. In particular, the differences in the optical properties of the wax layer of the epidermis and the pulp tissue of winter jujube lead to the complexity of the spectral response under different polarization directions. The inversion and correction of the spectra based on the semi-empirical BPDF model is expected to compensate for the errors introduced by the complex environment and improve the prediction accuracy of the quality parameters. Therefore, this paper tries to introduce the BPDF model (e.g., Nadal–Breon, Litvinov, Maignan, and Xie–Cheng models) applicable to complex surfaces. By combining the multi-angle polarized spectral data, the inversion and correction of the outdoor spectra of jujube is carried out to explore its theoretical significance and application value [11,12].
In this manuscript, winter jujube is used as a research object, aiming at the problems of ambient light interference and surface heterogeneity faced during outdoor spectral acquisition of winter jujube. In this study, the following hypothesis is proposed: the spectral inversion correction method based on the semi-empirical BPDF model of Nadal–Breon, Litvinov, etc., can compensate for the reflectance error introduced by complex environmental factors. This in turn improves the accuracy of the prediction model for moisture and soluble solid (SSC) content of winter jujube. In this study, spectral data with different polarization azimuths were acquired by outdoor hyperspectral imaging experiments. The semi-empirical BPDF model is utilized for spectral inversion, and an outdoor spectral correction method based on the inverted spectra is proposed. The prediction models of water content and soluble solid content were established to verify the feasibility of the corrected spectra for improving the outdoor detection accuracy. The results of the study can provide new technical ideas for the spectral detection of agricultural product quality in complex environments.

2. Experimental Section

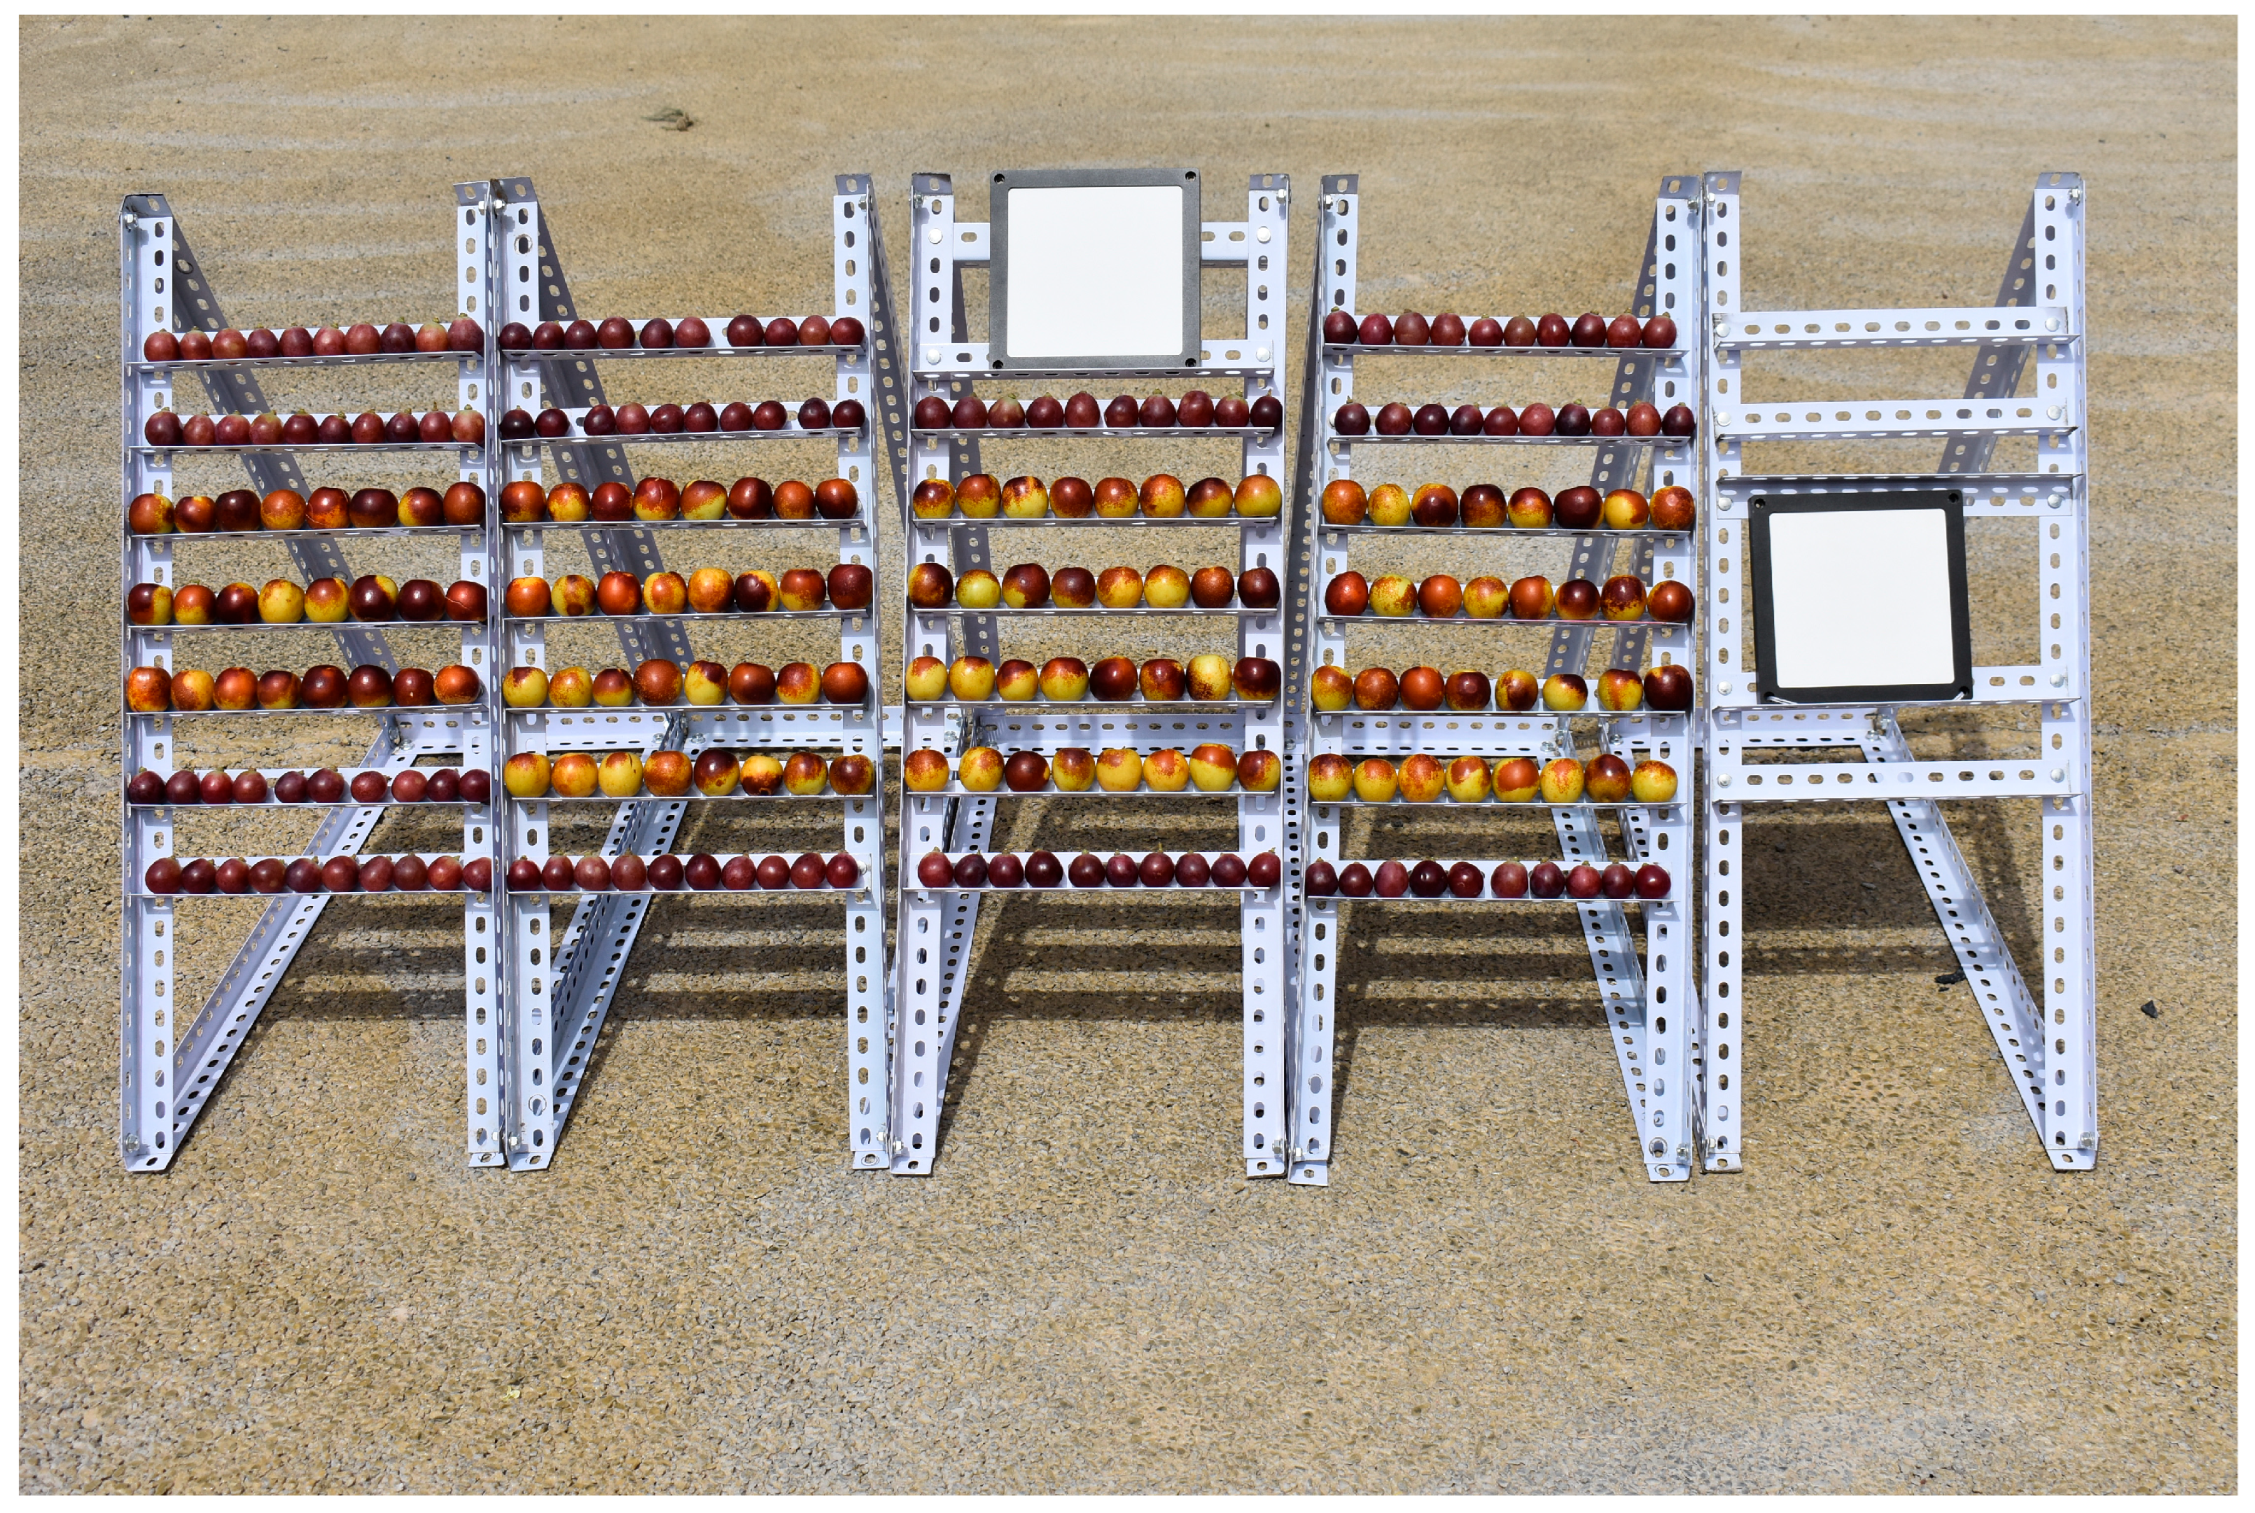
2.1. Samples and Instruments

The experimental winter jujube samples were collected from Alar City, the First Division of Xinjiang Production and Construction Corps (latitude 40°35′10″ N, longitude 81°18′12″ E). A total of 120 ripe winter jujube samples without visible damage were selected for the experiment. In this study, the Image-λ-N17E-N3 near-infrared hyperspectral imager manufactured by Sichuan Shuanglihe Spectrum Science and Technology Co. (Chengdu, China) was utilized for hyperspectral data acquisition of the winter jujube samples. The device is based on transmission grating spectroscopy, covering the 900–1750 nm spectral interval, containing 254 continuous spectral channels with a spectral resolution of 5 nm. The hyperspectral camera has a spatial resolution of 320 × 256 and performs spectral data acquisition in a linear push-sweep mode, with the acquired data in the form of mirrored hyperspectral images. When the spectral camera is wired for debugging, it is also necessary to use the HSIA-CT-150 × 150 standard whiteboard manufactured by Sichuan Shuanglihe Spectrum Science and Technology Co. (Chengdu, China). After the experiment was completed, the test samples were immediately transferred for sample moisture determination. Weighing was carried out using an electronic balance model A2003 manufactured by Mettler-Toledo Instruments Co. (Columbus, OH, USA). The samples were dried using a GZX-9140-MBE electric blast drying oven manufactured by Shanghai Boxun Medical and Biological Instruments Co. (Shanghai, China).
The moisture content of the sample was determined in accordance with the national standard GB/T 5009.3-2016 [13], and the content of soluble solids in the sample was measured using the GMK-701R handheld refractometer. In this study, sample set partitioning based on joint x-y distance (SPXY) was used to partition the sample set, and the ratio of the training set to the prediction set was 3:1. From the overall point of view, the prediction set data of water content range is included in the training set range, which helps the modeling. The statistical results of the moisture and soluble solid (SSC) contents of the sample are shown in Table 1.

2.2. Spectral Acquisition Method

Outdoor spectra were collected in sunny weather, as shown in Figure 1, and the winter jujube samples were placed on the experimental frame in order. Spatial localization was performed by means of a three-dimensional adjustable stand. The distance between the camera and the center point of the experimental stand was set to 1.5 m to ensure that the field of view covered the complete sample area and full spectral information was acquired. The polarization modulation device was used to quickly acquire hyperspectral image sequences at four polarization azimuths: 0°, 45°, 90° and 135° [14]. The experimental design effectively controlled the effects of ambient light interference and sample surface heterogeneity. After the spectral acquisition was completed, the spectra were flat-field-corrected using ENVI 5.3 software. Subsequently, the region of interest in the image was selected with a size of 3 pi×3 pi, and the spectra were processed to remove the envelope to highlight the spectral features.

2.3. Outdoor Spectral Inversion Method

Multi-angle polarization measurements at different scales have contributed to the development of two-way polarization reflectance distribution function (BPDF) models. Considering the important role of BPDF theory for surface inversion work, the establishment of predictive models in complex environments has become a research priority. In this study, four BPDF models, the Nadal–Breon model, Litvinov model, Maignan model and Xie–Cheng model, were used to invert the outdoor spectra of winter jujube.

2.3.1. Fresnel’s Law of Reflection

Fresnel’s law of reflection is used to describe how light behaves in different refractions, which generally include the angle of incidence, angle of reflection, angle of refraction, phase angle, etc. [15]. Fresnel’s formula for reflectance is as follows:
F p α 1 , n = 1 2 s i n 2 α T α I s i n 2 α T + α I t a n 2 α T α I t a n 2 α T + α I
s i n α T = s i n α I n
In the above equation, α I represents the angle of incidence, n represents the refractive index, and α T represents the angle of refraction.
The angle of incidence is expressed as
cos 2 α I = c o s θ s c o s θ v + s i n θ s s i n θ v c o s φ
In the above equation, θ represents the zenith angle. θ s represents the solar zenith angle. θ v represents the detection zenith angle. And φ represents the relative azimuth angle between the sun and the detector.

2.3.2. Nadal–Breon Model

The Nadal–Breon model was originally proposed as a semi-empirical BPDF model for the POLDER Large Aerosol data [16]. The Nadal–Breon model is formulated as follows:
R p θ s , θ v , φ = ρ 1 e x p β F p ( α 1 , n ) μ s + μ v
In the above equation, R p represents the final polarized reflectance; ρ and β are coefficients to be determined by introducing coefficients associated with the type of ground cover (forest, shrubland, low vegetation, etc.). μ s and μ v represent the cosine of the zenith angle between the sun and the direction of detection, respectively. It is shown that this semi-empirical model has strong applicability to typical land surfaces.

2.3.3. Litvinov Model

The Litvinov model is mainly used to describe the spectral response under different conditions. Especially in complex environments, it is able to analyze the chemical or physical properties of the target with respect to scattering phenomena [17]. The model uses a Gaussian function as a computational kernel to describe the spatial differences in the surface, and the Litvinov model calculation formula is as follows:
R p = α π F p α 1 , n 4 μ n μ s + μ v f ( n s , n v ) f s h ( γ )
f n v , n s = 1 π μ n 3 2 σ 2 e x p ( 1 μ n 2 μ n 2 2 σ 2 )
f s h γ , k r = c o s k r ( π γ ) 2 3
μ n = n v z + n v z n v + n s
n s = ( s i n θ s c o s φ s , s i n θ s s i n φ s , c o s θ s ) n v = ( s i n θ v c o s φ v , s i n θ v s i n φ v , c o s θ v )
In the above equation, γ represents the scattering angle, which is determined by the geometric relationship between the unit vector n s in the incident direction and the unit vector n v in the observation direction. The superscript z is the z-axis direction component. And f n v , n s is the Gaussian function characterizing the directional distribution properties. The empirical shadowing function f s h γ , k r is modulated by the parameter k r , which takes values in the range 0–1. φ s and φ v represent the solar azimuth and detection azimuth, respectively.

2.3.4. Maignan Model

Due to the non-smooth curved surface of the vegetation, multiple scattering caused by surface roughness is also an important consideration that affects the polarization reflectivity. The attenuation function proposed in this way is formulated as follows:
K α I , k = e x p ( k t a n α I )
In the above equation, k is the roughness factor, which takes values ranging from 0.1 to 0.3.
Inspired by the attenuation function, Maignan introduced the vegetation index to describe the attenuation of polarized reflectance due to different surface types [18]. In this paper, the moisture sensitivity index ( W S I ) is used as a calculation parameter, and the formula of the Maignan model is as follows:
R p θ s , θ v = C e x p t a n α I e x p ( I W S I ) F p ( α 1 , n ) 4 ( μ s + μ v )
W S I = R 980 R 1450 R 980 + R 1450
In the above equation, C represents the fitted unknown correlation coefficient, and I W S I represents the moisture sensitivity index ( W S I ). R 980 is the 980 nm reflectance, which belongs to the near-infrared high-reflectance region. R 1450 is the 1450 nm reflectance, which belongs to the moisture strong absorption band. The model also involves the relationship between the angle of incidence and the angle of refraction.

2.3.5. Xie–Cheng Model

The Xie–Cheng model takes the above factors into consideration. Not only the empirical shadow function and attenuation function are introduced, but also the effects of vegetation index and refraction angle are taken into account, and new compensation coefficients are fitted [19,20]. The new compensation coefficients are fitted according to the data, and the formula of the Xie–Cheng model is as follows:
R p = A × F p α 1 , n × f s h ( γ , k r ) × e x p ( ω × I W S I )
In the above equation, A represents the unknown coefficient of polarization data. ω represents the compensation coefficient.

2.3.6. Corrected Outdoor Spectra Method

After obtaining the inversion spectra using the four BPDF models, the inversion spectra were used to correct the outdoor spectra, which in turn resulted in corrected spectra for multiple data sources. The calculation formula is as follows:
S c o r r e c t i o n = S r a w + S i n v e r s i o n 2
In the above equation, S c o r r e c t i o n is the corrected outdoor spectra. S r a w is the original outdoor spectra. S i n v e r s i o n is the inversion spectra.
This correction method aims to improve data quality by compensating the environmental interference of outdoor spectra through model inversion. By taking the average of the two, it can theoretically balance the advantages of measured data and model predictions and reduce the error of a single data source.

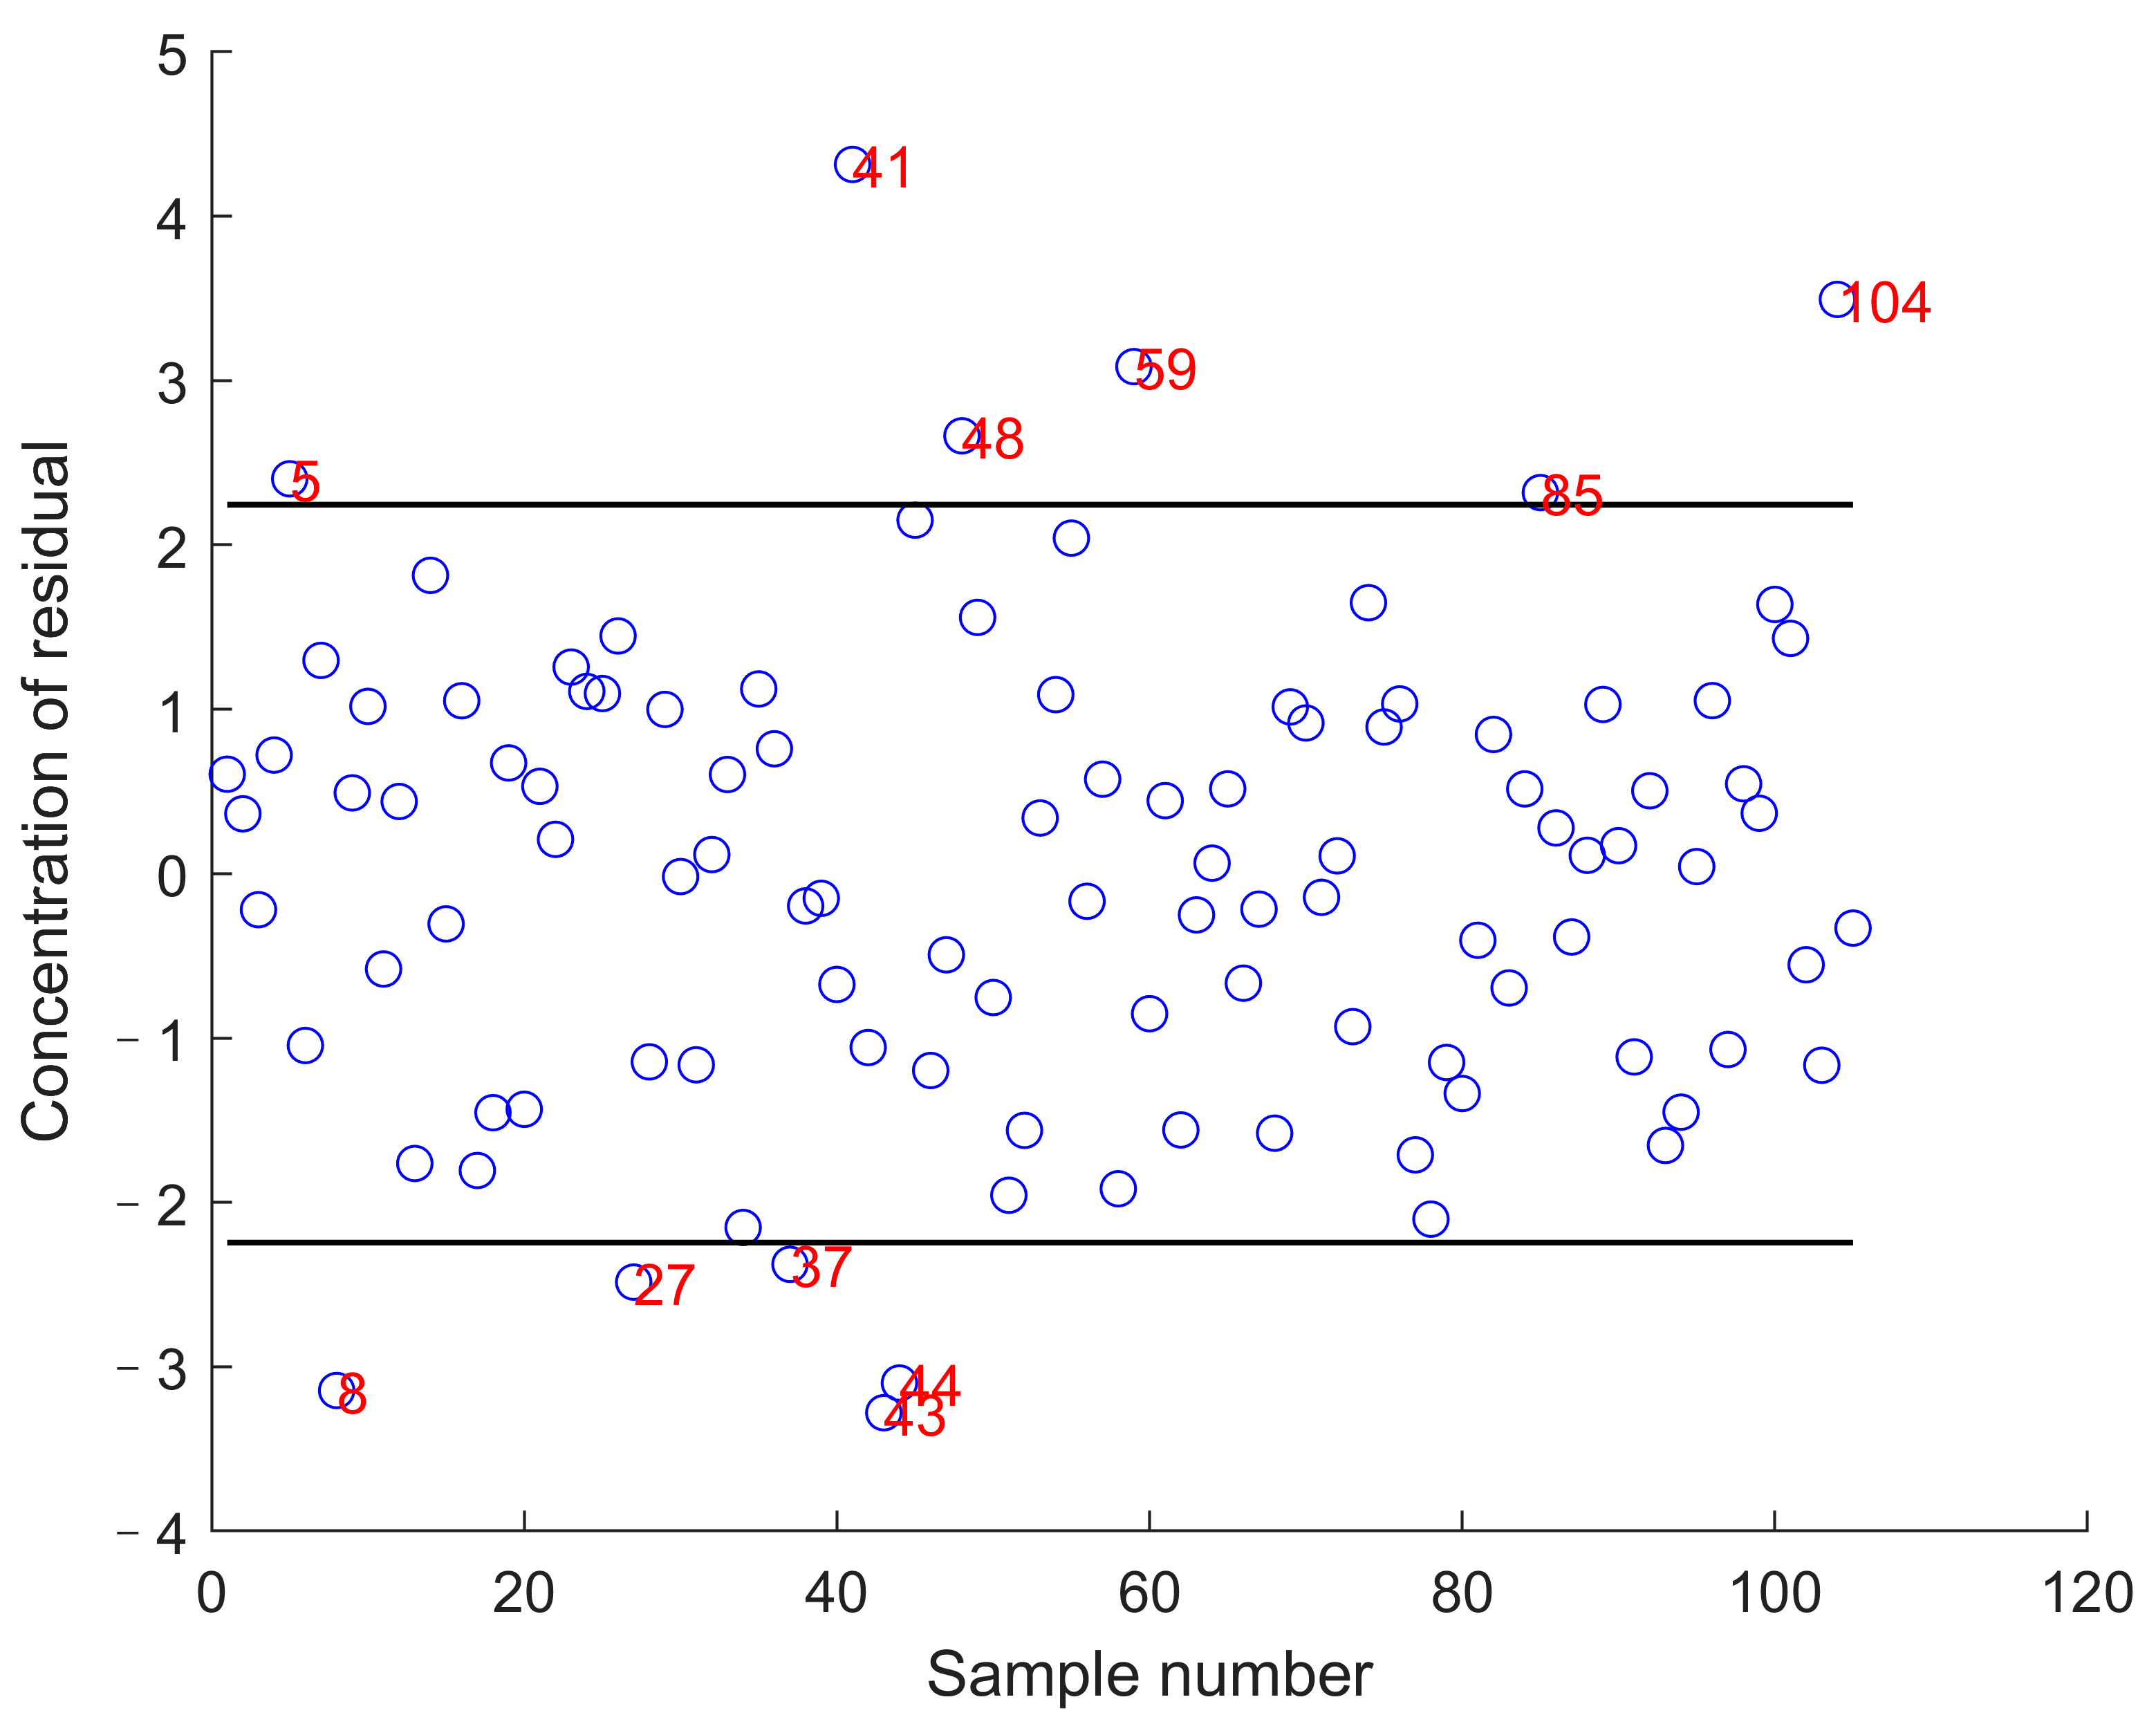
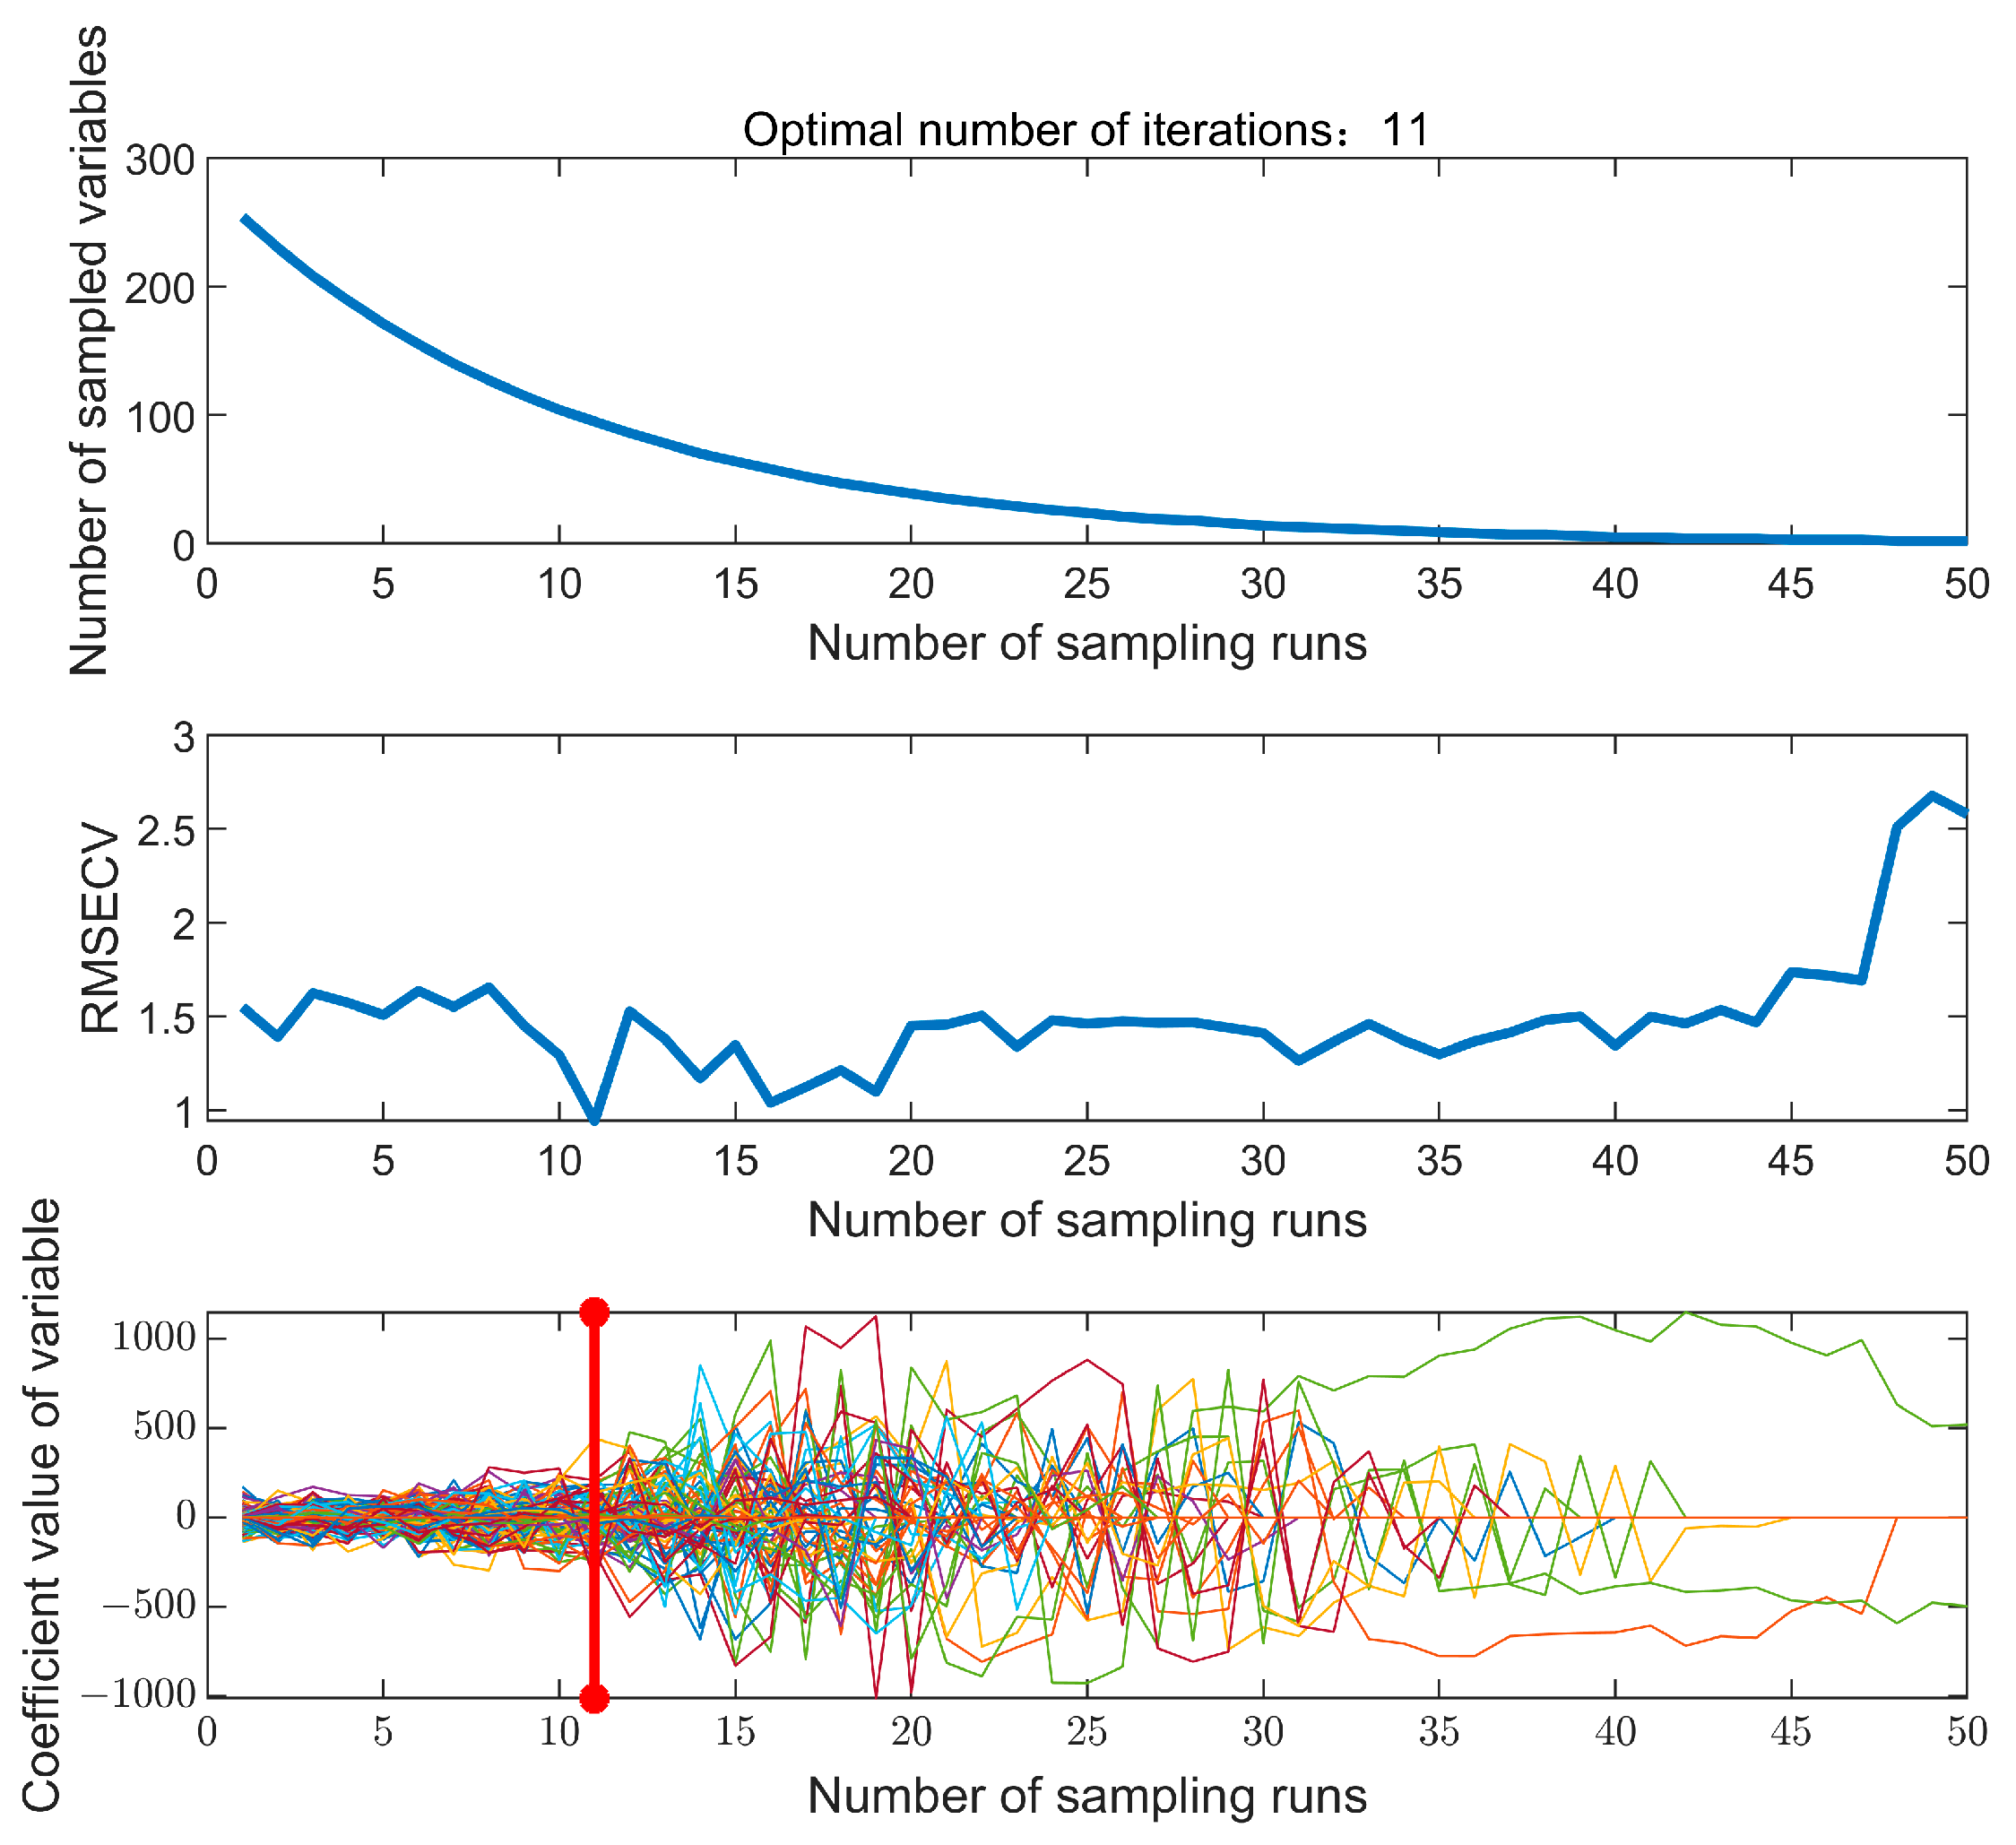
2.4. Spectral Data Processing

All the processing and modeling of the spectral data was performed using Matlab 2020b software. The sample size of the spectral data was 120. In order to explore the feasibility of correcting outdoor spectra to improve the accuracy of outdoor detection, it is necessary to establish a quality prediction model under different polarizations. However, the abnormal samples in winter jujube will affect the prediction effect and reliability of the model, so it is necessary to eliminate some abnormal samples before building the prediction model. Taking the unpolarized sample data as an example, the figure shows that the concentration residual method is used to eliminate the abnormal samples of moisture content in winter jujube, and the input threshold is 2. After calculating the number of samples and physical and chemical value data to obtain the actual elimination threshold, the result is shown in Figure 2, and 11 abnormal samples are eliminated. The same method was used to eliminate the abnormal samples of SSC content of winter jujube. The horizontal axis of the graph is the number of samples and the vertical axis represents the concentration residuals. The black solid line is the threshold boundary for sample rejection. And the red ordinate is the abnormal samples that exceed the threshold. Blue circles represent normal samples with residues within acceptable limits.
The model built on full-spectra data is more complicated and less efficient. The research results [21] show that selecting appropriate feature variables can establish a model with high accuracy, which can effectively simplify the model, improving the model robustness and computing speed. Therefore, the spectral feature variables were extracted using Competitive Adaptive Reweighted Sampling (CARS). To ensure the stability of the extracted feature variables, the cycle of extracting feature wavelengths was set to be repeated 50 times. After each extraction, the partial least squares method was used to establish a prediction model, and the group with the best prediction effect was selected as the final selected feature variables. Also taking the unpolarized sample data as an example, Figure 3 shows the extraction of the characteristic wavelengths of moisture content of winter jujube using the CARS method. As shown in Figure 3, with the increase in the number of iterations, the cross-validation root mean square error reaches the minimum at the 11th iteration, and 95 characteristic wavelength variable data points are finally selected. The upper figure demonstrates the retention rate of the characteristic wavelength variables during 50 iterations. The middle figure shows the variation curve of root mean square error of cross-validation (RMSECV) over 50 iterations. The lower figure shows the trend of variable coefficients over 50 iterations. The red vertical solid line means that the optimal number of iterations at this point is 11.
The quality prediction model was built using partial least squares (PLS) after selecting the characteristic wavelengths and optimized using cross-validation. The cross-validation was set to 10 folds, and the maximum principal component was 30. The model evaluation metrics were correlation coefficient (R), coefficient of determination ( R 2 ), root mean square error (RMSE), and performance to interquartile spacing ratio (RPIQ) [22]. When RPIQ ≥ 2, it indicates that the model has a good prediction ability. When 1.4 ≤ RPIQ < 2.0, it indicates that the model can perform a rough estimation of the sample. When RPIQ < 1.4, it indicates that the model is unreliable. The closer the coefficient of determination and correlation coefficient is to 1, the more linear the model is. The smaller the root mean square error indicates that the model has better predictive performance.
R 2 = 1 i = 1 N ( y i y ^ ) 2 i = 1 N y i y ¯ 2
R = i = 1 N x i x ¯ y i y ¯ i = 1 N x i x ¯ i = 1 N y i y ¯
R M S E = 1 N i = 1 N ( y i y ^ ) 2
R P I Q = I Q R R M S E P
In the above equation, N is the number of samples. x ¯ and y ¯ are the mean values of the corresponding variables. x i and y i are the actual values of the corresponding variables. y ^ is the predicted value of the corresponding variable. IQR is the interquartile range.

3. Results and Discussion

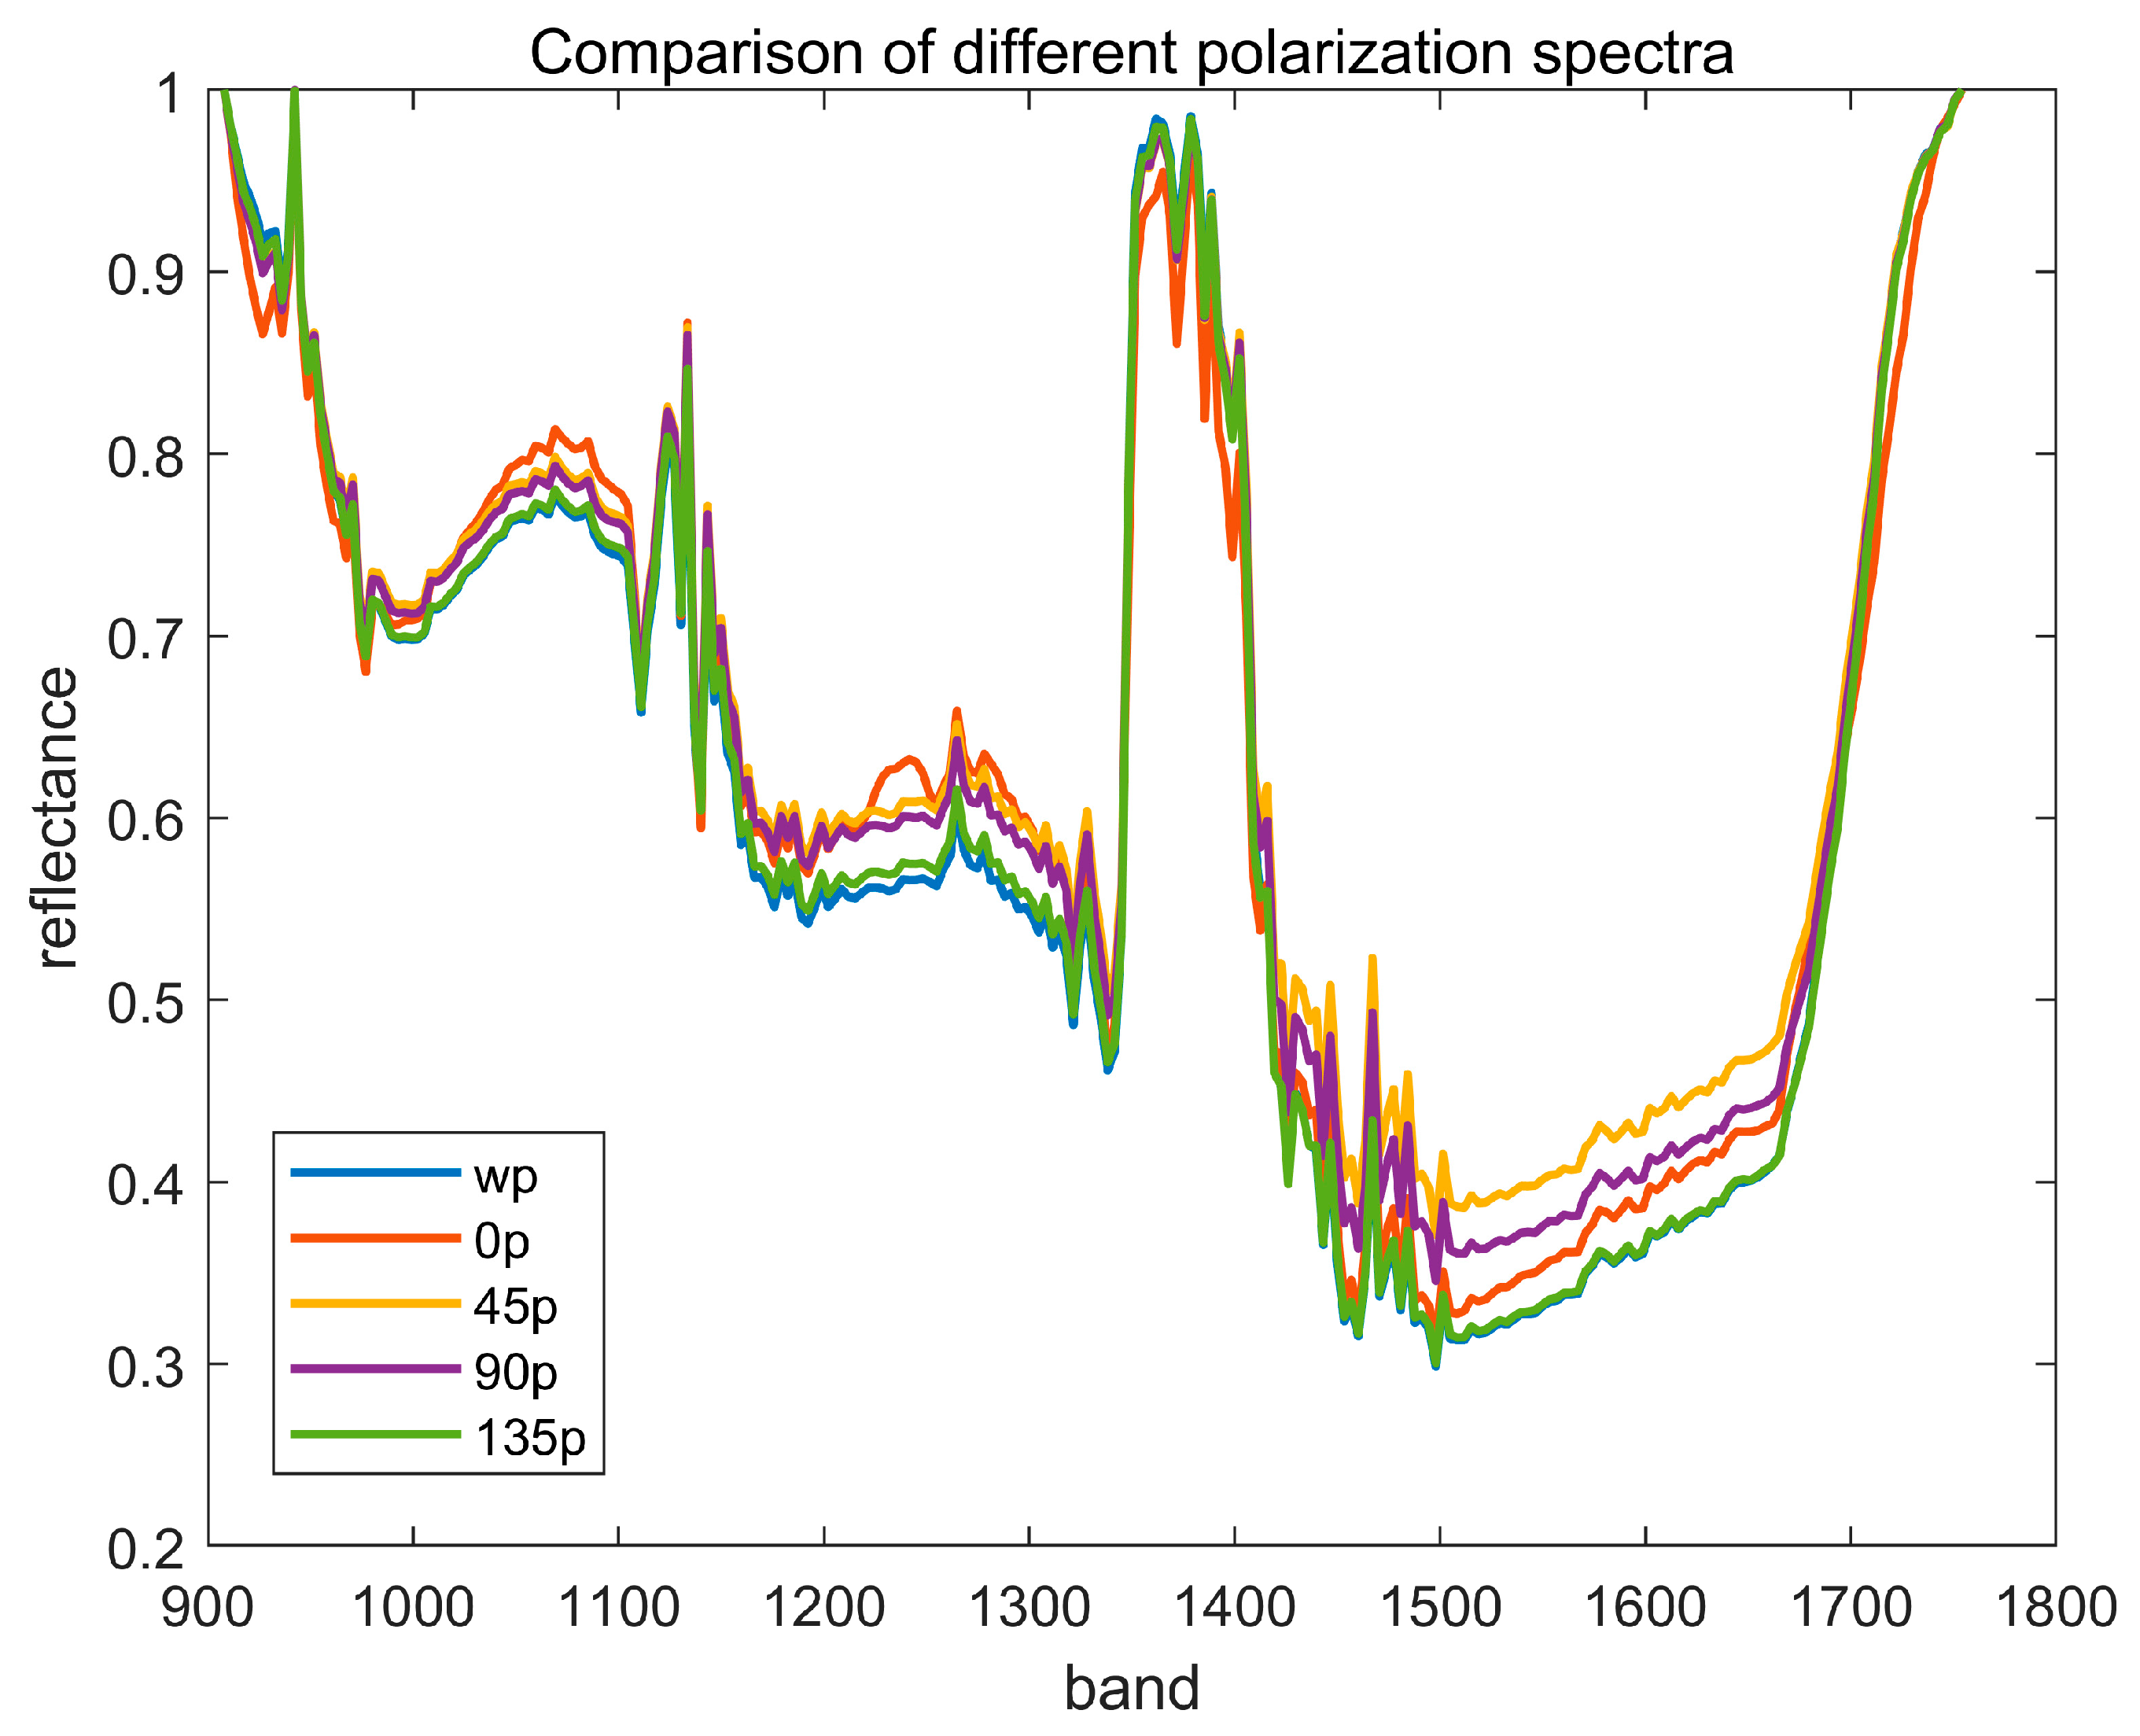
3.1. Outdoor Spectra of Winter Jujube in Different Polarization Directions

According to the spectral extraction method above, the spectral reflectance of the same winter jujube samples was extracted from the unpolarized, 0° polarized, 45° polarized, 90° polarized and 135° polarized hyperspectral images. As shown in Figure 4, “wp” uses blue to represent the non-polarized spectrum. “0 p”, “45 p”, “90 p” and “135 p” respectively use red, yellow, purple and green to represent the 0°, 45°, 90° and 135° polarization spectra. From the figure, it can be seen that the 135° polarized and unpolarized spectra are similar in the overall trend, especially in the near-infrared band (1200–1600 nm) where the reflectance changes are consistent. Considering the reason, the direction of 135° polarization is at a specific angle to the solar incidence plane, resulting in similar reflectance properties to the unpolarized reflectance properties. In the range of 1350–1400 nm, the higher reflectance of unpolarized and 135° polarized spectra than the other polarization directions is due to the fact that it is in the transition zone of the main moisture absorption peak (1450 nm). The internal moisture absorption has not yet reached its maximum and the epidermal reflection dominates, resulting in a larger peak in this interval. In the range of 1400–1700 nm, 45° polarization has the highest spectral reflectance, followed by 90° polarization, and 0° polarization has the lowest, which is related to the water absorption characteristics; 45° polarization penetrates the epidermal waxy layer at a tilted angle, but does not penetrate deep into the pulp tissue, which reduces the interaction with the internal water and results in a high reflectance. Additionally, 90° polarization is vertically polarized, which penetrates deeper and interacts with the water in the fruit pulp. The 90° polarization is vertically polarized and light penetrates deeper, resulting in strong absorption with water in the pulp, leading to a significant decrease in reflectance. Finally, 0° polarization parallel to the plane of incidence may be more readily reflected by the epidermal layer.

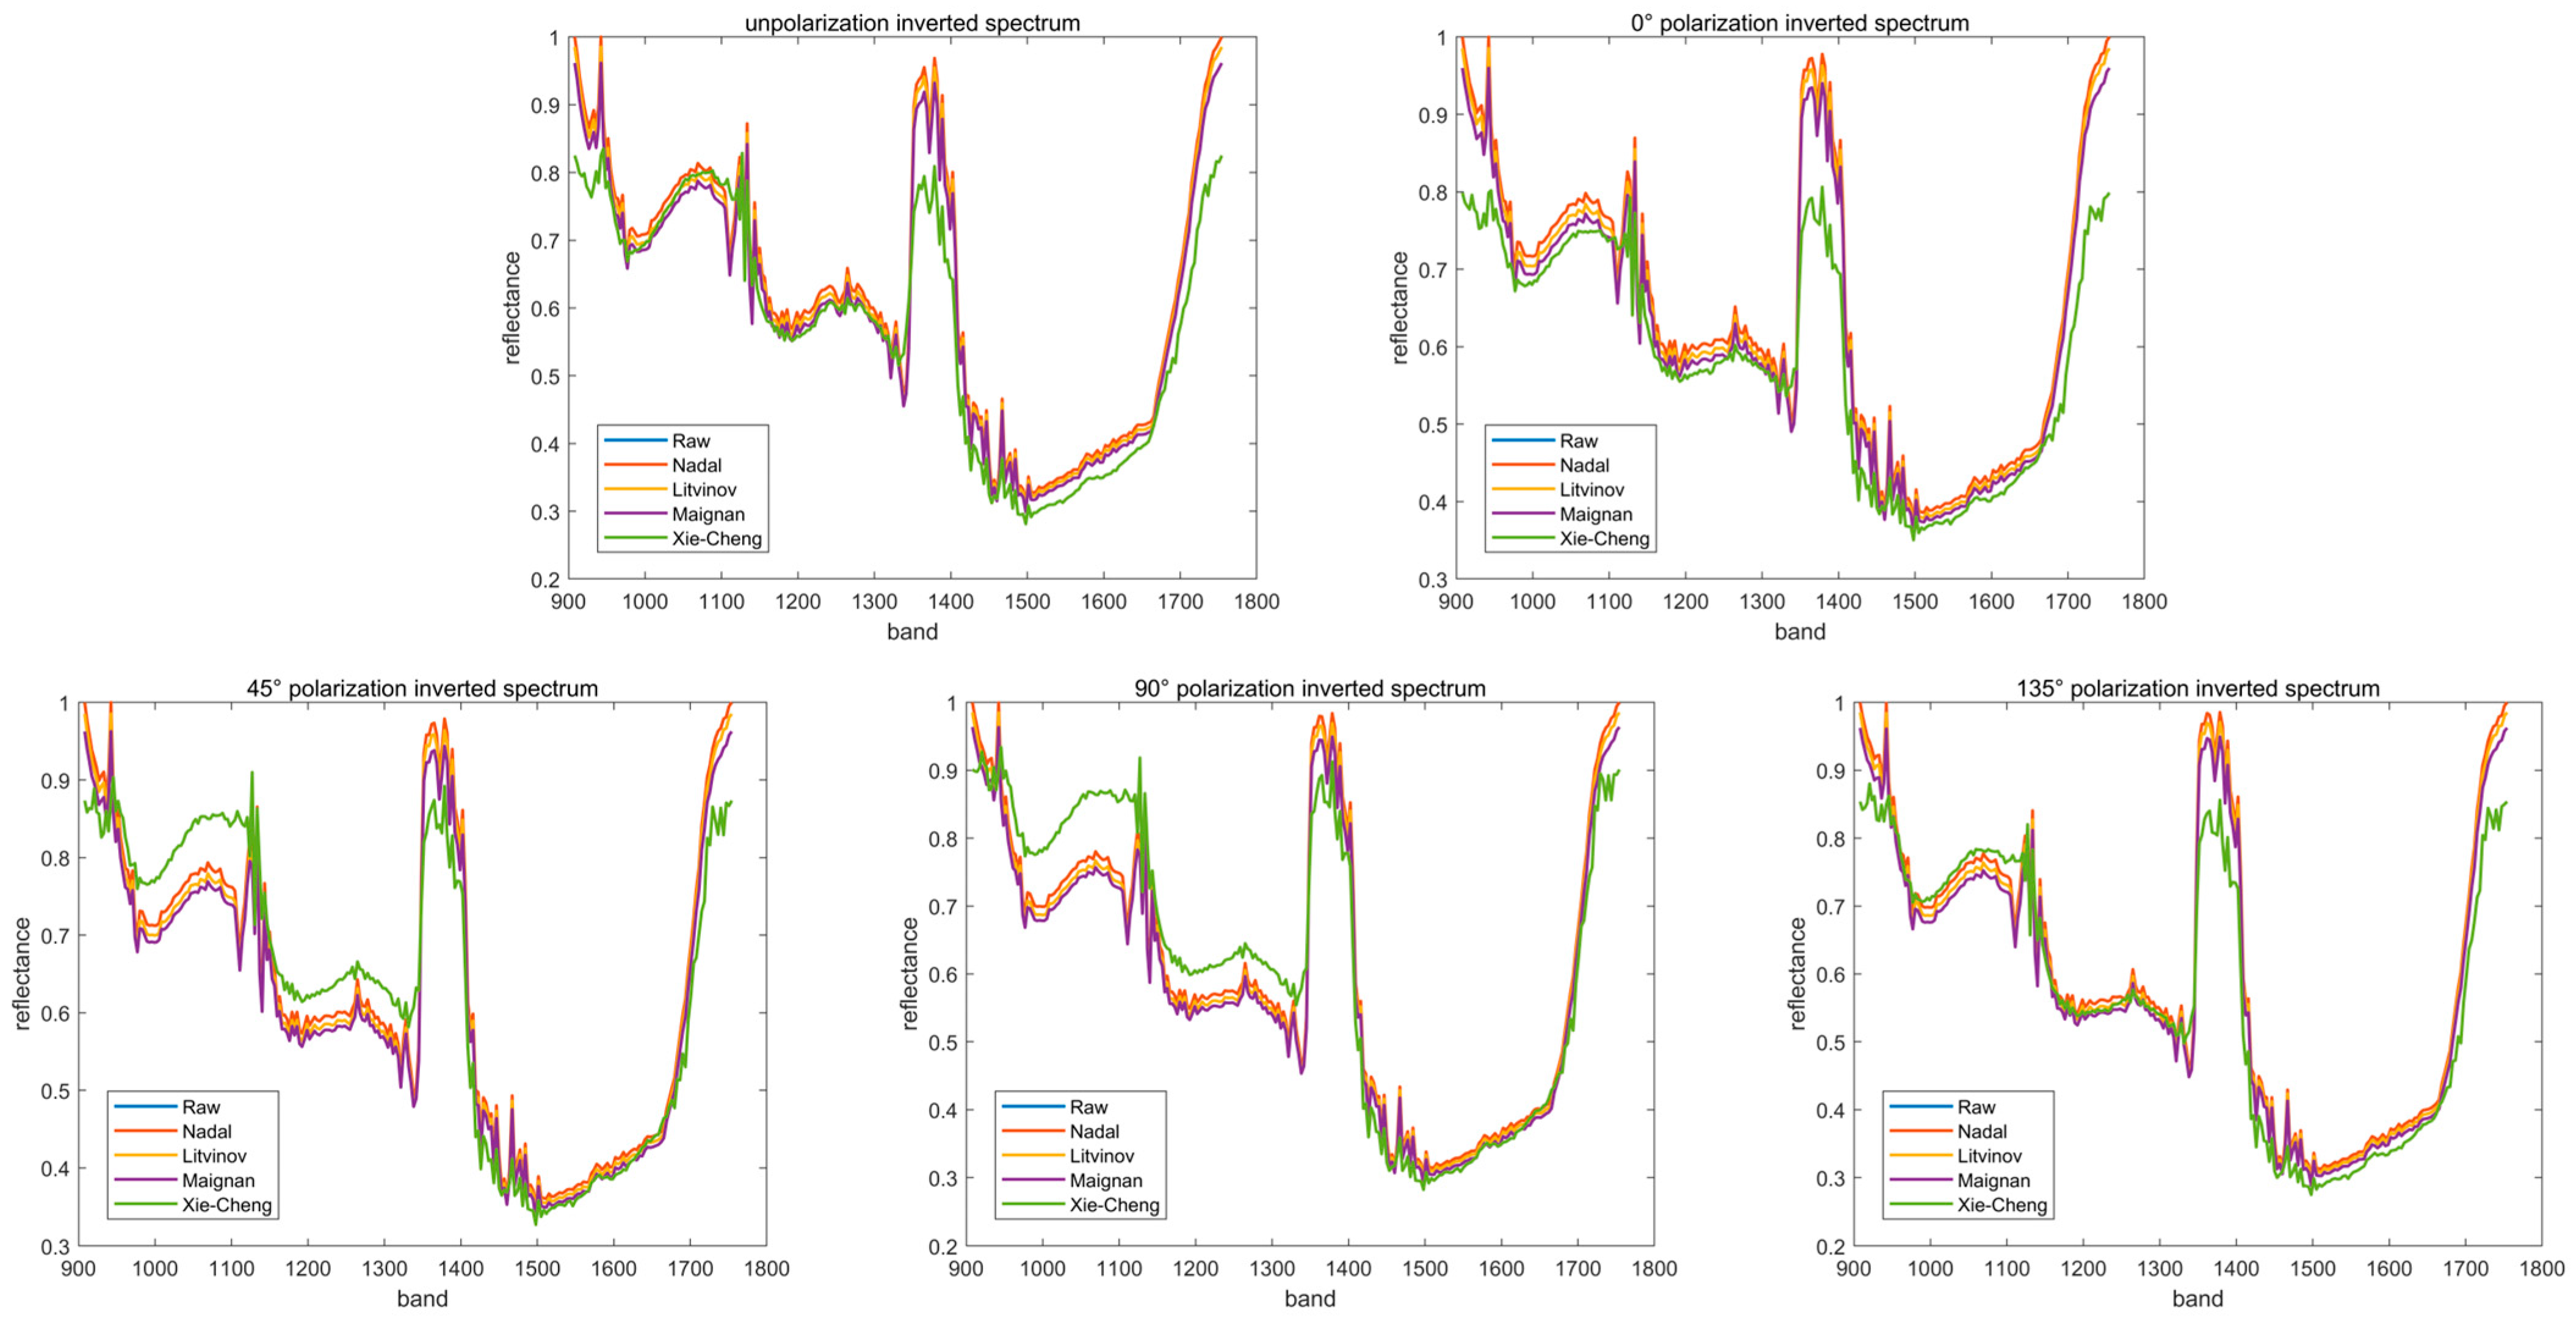
3.2. Outdoor Spectral Inversion

Four semi-empirical BPDF models, Nadal–Breon, Litvinov, Maignan and Xie–Cheng, were utilized to invert the outdoor spectra of winter jujube. The model parameters are shown in Table 2, with the Nadal–Breon and Xie–Cheng models both containing two free parameters, the Litvinov model having up to three parameters, and the Maignan model containing only one fitting parameter. During the inversion process, the input parameters of the BPDF model contain three key geometric variables: solar zenith angle, observed zenith angle, and relative azimuth. With the synchronously acquired multi-angle polarized spectral data, the free parameters of each model were iteratively fitted using a nonlinear optimization algorithm, and the polarized reflectance of date fruit was finally obtained from the inversion.
The results of the BPDF model inversion at different polarizations are shown in Figure 3. As can be seen from Table 3, the average correlation coefficients of the three models, Nadal–Breon, Litvinov and Maignan, are all above 0.99. And the average correlation coefficient of Xie–Cheng inversion is also above 0.95. From the inversion discrepancy, the deviations of each model under different polarizations are also more stable, without strong fluctuations, and the models are more stable. Among them, the Nadal model has the smallest inversion discrepancy, which is controlled at about 3.4%, while the Xie–Cheng model has the largest inversion discrepancy, which is controlled at about 20%. The larger discrepancy rate is due to the coupling of multiple sub-modules triggering the accumulation of errors while fixing the compensation coefficient. No dynamic adjustment was made according to the properties of winter jujube, which limited the flexibility of the model.
In order to further analyze the differences in the inversion effect of each model, the inversion spectra were visualized. Figure 5 shows the inversion spectra of BPDF models with different polarizations. The solid blue line represents the original spectrum. The red, yellow, purple and green solid lines represent the inversion spectra of the Nadal–Breon, Litvinov, Maignan and Xie–Cheng models, respectively. As can be seen from Figure 5, the inverted spectra of the Nadal–Breon, Litvinov and Maignan models fit the original spectra better in all polarization directions. The reason for the low peak value of the Xie–Cheng model in the 1350–1400 nm band is that the WSI does not directly correlate with the epidermal reflectance properties, which results in the model overcompensating for the water absorption effect and underestimating the reflectance in this band. Meanwhile, the reflectance in the 1000–1350 nm band of the Xie–Cheng model was significantly higher than that of the other models at 45° and 90° polarization. This is because the 45° and 90° polarization directions are more sensitive to the diffuse reflection caused by surface roughness, which fits with the fixed compensation coefficient-induced error mentioned above.

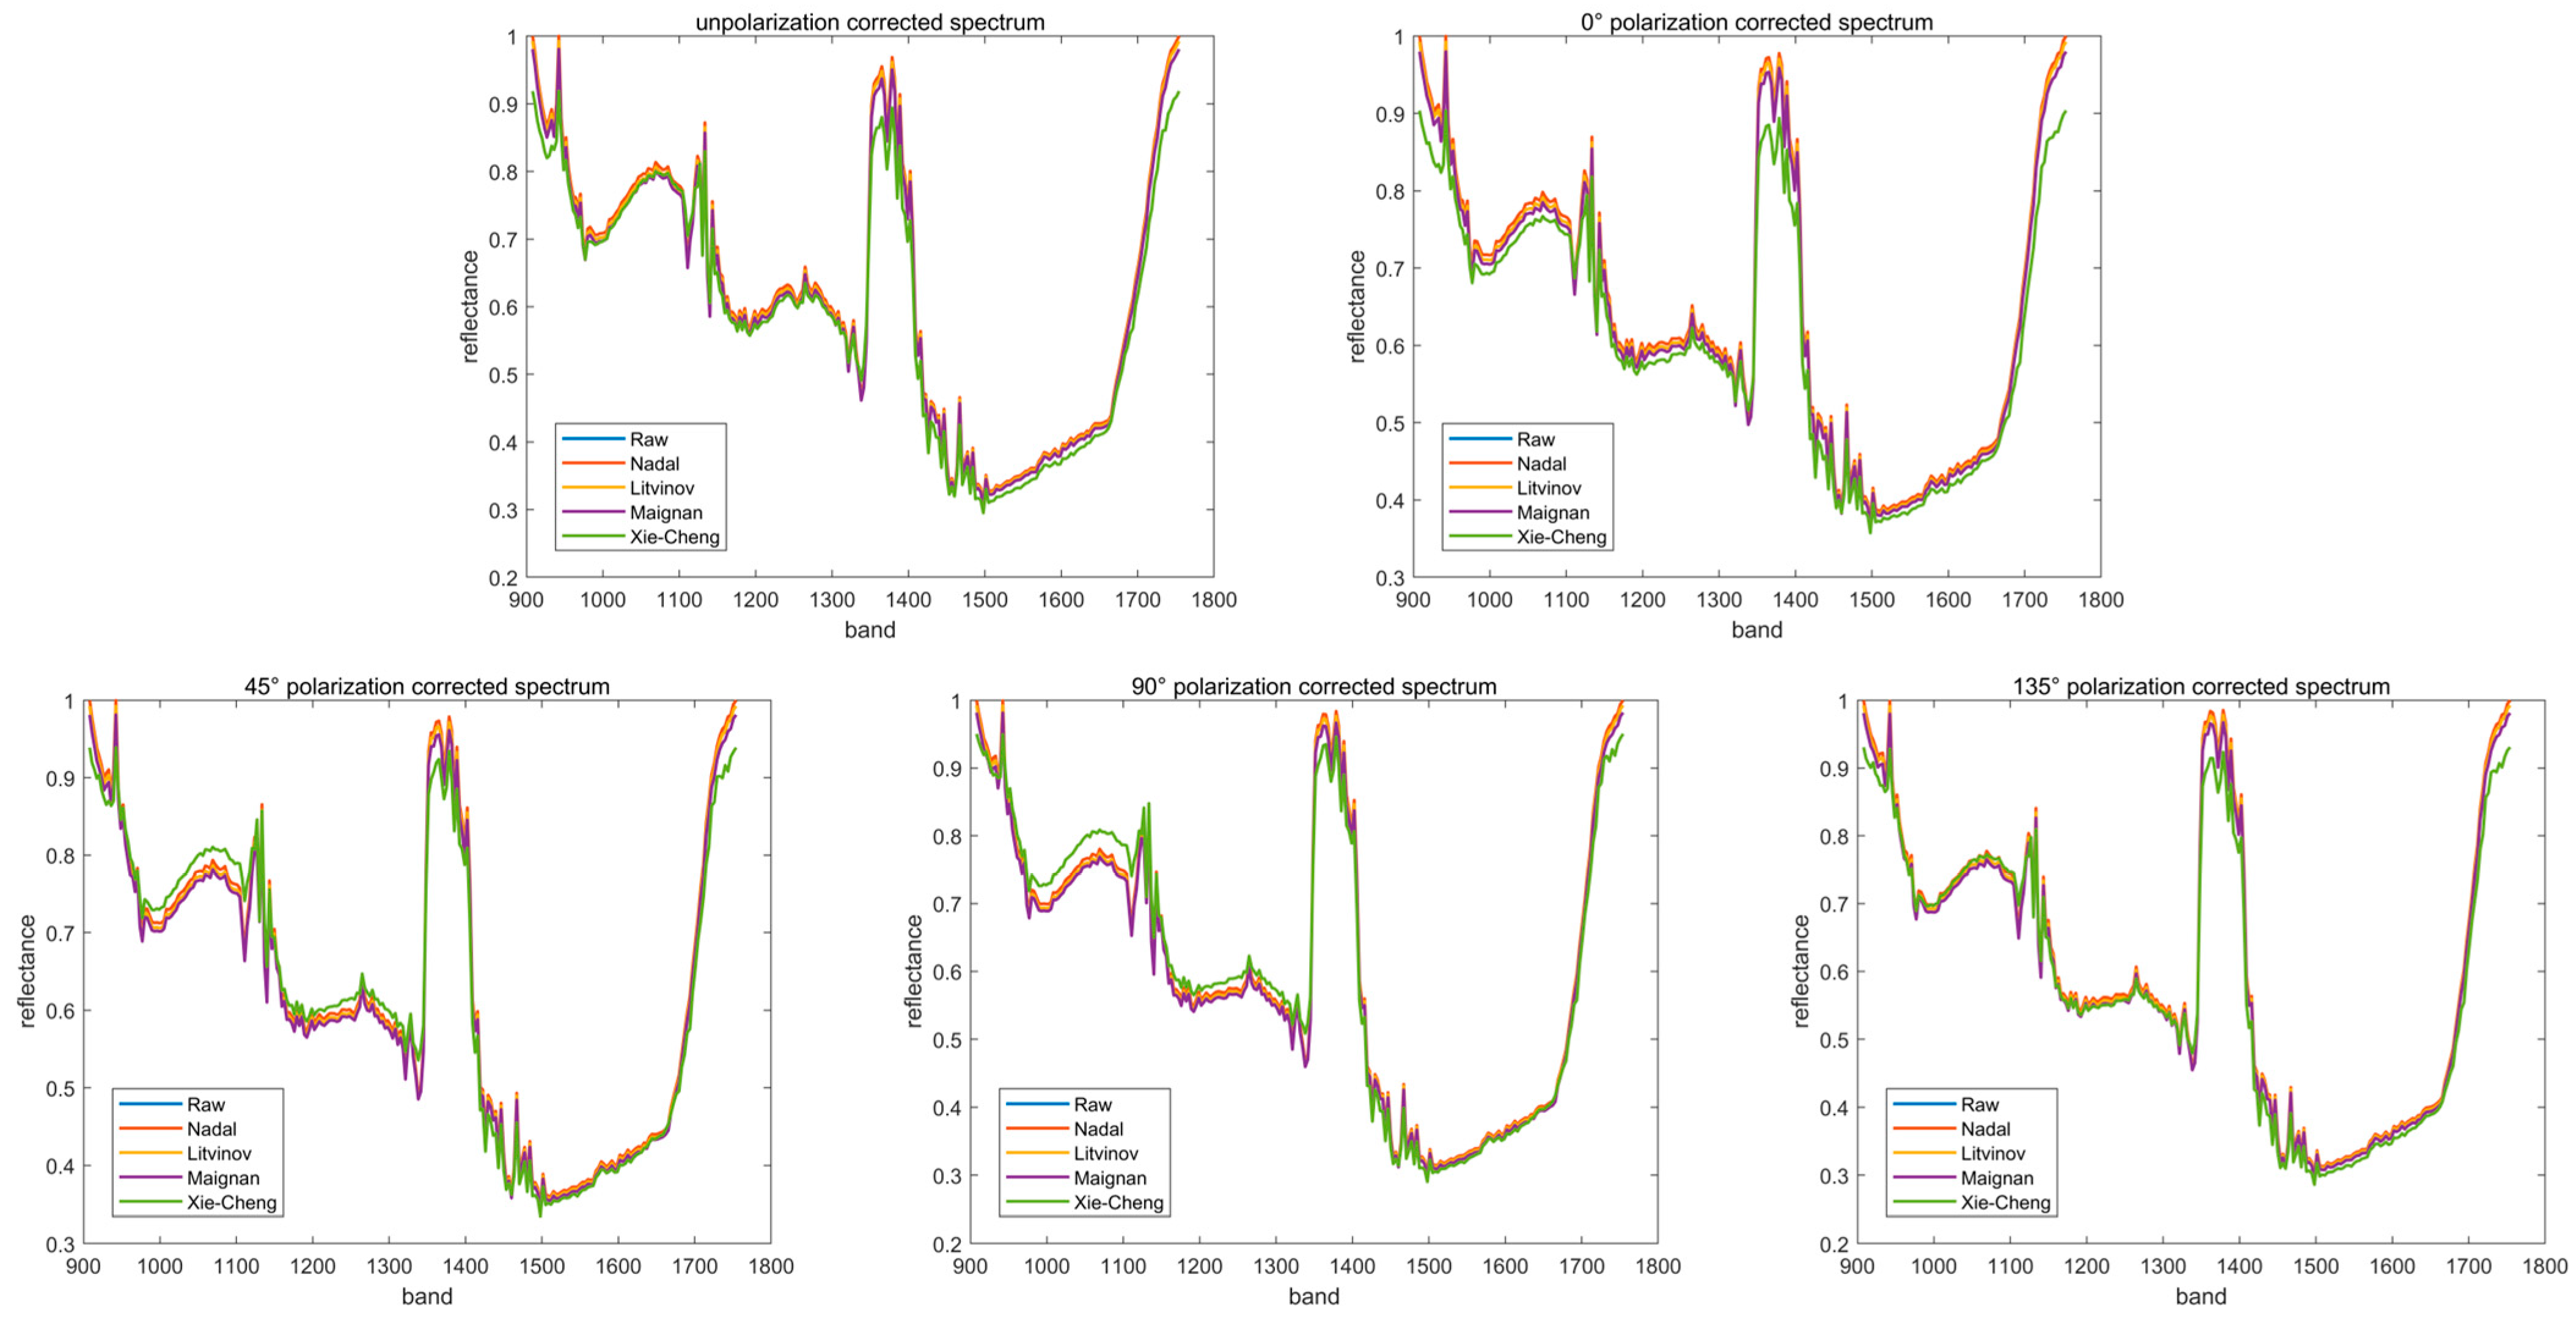
3.3. Correction of Outdoor Spectra and Its Feasibility Analysis

After the spectra were obtained by inversion using the four BPDF models, the corrected spectra at different polarizations were calculated by combining the correction spectral methods. The correction results are shown in Figure 6. The solid blue line represents the original spectrum. The red, yellow, purple and green solid lines represent the correction spectra of the Nadal–Breon, Litvinov, Maignan and Xie–Cheng models, respectively. Such methods compensate for the systematic errors and inversion errors brought by a range of data sources. From Figure 6, it can be seen that the corrected spectra have consistency with the trend of the original spectra, while the reflectance of local bands is fine-tuned. The specific correction effect establishes a prediction model to verify.
Modified spectra at different polarizations were used to establish models for the detection of moisture content and soluble solid content of red dates. Based on the results of the prediction models under different polarizations, it was verified whether the modified spectra could improve the quality detection accuracy of outdoor red dates. For the modified and original spectra under unpolarized and four polarization directions, the concentration residual method was first used to reject abnormal samples. Then, CARS algorithm feature optimization was used. PLS modeling was then used. Finally, the number of principal factors was determined using cross-validation. The results are shown in Table 4, Table 5, Table 6, Table 7 and Table 8.
Combined with the results in Table 4, Table 5, Table 6, Table 7 and Table 8, the corrected spectra have an enhancing effect on the prediction accuracy. For the water content prediction model, the corrected spectra of the Litvinov model perform best in the unpolarized direction. Rp is improved from 0.6756 to 0.8829 for the original spectra. The RPIQ improved from 2.03 to 2.55 while the RMSEP decreased from 1.51 to 1.06. The above shows that the correction significantly improves the model robustness. In the 45° polarization direction, the Rp reached 0.8928 and the RPIQ was 2.24 after the Xie–Cheng model was corrected. This accuracy is better than the Rp of 0.7881 and RPIQ of 1.81 for the original spectra. In particular, the correction effect is significant in the 1000–1350 nm range, which compensates for the surface roughness error. In the 90° polarization direction, the Maignan model had the lowest RMSEP and an RPIQ of 2.31, indicating that it was effective in correcting the deep moisture absorption characteristics. The soluble solid content prediction model was analyzed. In the 90° polarization direction, the RPIQ of the Xie–Cheng model was as high as 2.64, indicating its unique advantage for SSC prediction in the polarization direction with high penetration depth. And in the 135° polarization direction, the Litvinov model was corrected with an Rp of 0.8808 and an RPIQ of 2.9. This accuracy is significantly better than the Rp of 0.5891 and RPIQ of 1.85 for the original spectra and is related to the model’s accurate description of multiple scattering.
Analyzing the overall inversion model, the Nadal–Breon model performs stably in the unpolarized and 0° polarization directions. The Rp values of water content are all higher than 0.75, and the RPIQ is greater than 2.0. Compared with the urban surface model established by Xie et al. [7], its RPIQ value is improved by 13%, which verifies the applicability of the model in epidermal reflection-dominated scenarios. But it is weak in predicting SSC. The Rp is generally lower than 0.7, related to the lack of inclusion of vegetation indices. To address the need for surface heterogeneity compensation, the Litvinov model portrays the differences in surface microstructure by Gaussian kernel functions in the unpolarized and 135° polarization directions. The Litvinov model can accurately predict the moisture content of the surface in the non-polarized and 135° polarized directions. The highest Rp reaches 0.8829. The RMSEP is 25% lower than that of the random forest algorithm used by Zhang et al. [9]. This result confirms the advantage of the Gaussian kernel function in characterizing the heterogeneous reflectance features on the surface of jujube. The Maignan model is outstanding for water content prediction in the 90° polarization direction. At this time, the RPIQ was 2.31, because the model coupled the epidermal and internal water absorption properties through the roughness factor (k) and the water sensitivity index (WSI). However, the performance fluctuated greatly in other directions, limited by the fixed decay function. The Xie–Cheng model performed well for SSC prediction in the 45° and 90° polarization directions, and their RPIQs were both greater than 2.2. The model effectively enhances the sensitivity to the deep pulp components by introducing the dynamic compensation coefficient ω with the empirical shadow function. Compared with the land surface model proposed by Ti et al. [8], its prediction accuracy is improved by 15%. It is shown that vertically polarized light can penetrate the epidermis of jujube and produce stronger spectral interactions with the deep pulp components. However, the RMSEP of water content is higher, which may be related to the fact that the WSI is not directly associated with the epidermal reflection.

4. Conclusions

In order to improve the accuracy of outdoor detection, an outdoor spectral correction method based on the bidirectional polarization reflectance distribution function (BPDF) is proposed on the basis of the study by Gao, F et al. [12]. Outdoor polarized spectra of winter jujube were inverted by four semi-empirical BPDF models, Nadal–Breon, Litvinov, Maignan and Xie–Cheng. A mean fusion strategy was used to correct the raw spectra. The corrected spectra were subsequently used to establish a prediction model for water content and soluble solid content of winter jujube and to compare the model results. The results show that the modified spectra based on the BPDF model exhibit significant potential in the outdoor quality detection of winter jujube. Firstly, the prediction model accuracy was improved, and the Rp of most of the modified models was improved by 10–30%. The percentage of cases with RPIQ greater than two increased from 40% to 60% of the original spectra. The band characteristics are also optimized, and the reflectance of the corrected spectra in the moisture absorption peak (1450 nm) and the near-infrared high reflectance region (980 nm) is more in line with the physical law. The model application scenarios are also expanded, and the Litvinov and Xie–Cheng models are complementary in multiple polarization directions, which can be used for epidermal reflection and internal composition analysis, respectively. Especially in the 90° and 135° polarization directions, the Litvinov and Xie–Cheng models compensate for the environmental interference and surface heterogeneity, and the prediction accuracy reaches the practical level of RPIQ > 2.5.
In summary, the method of correcting outdoor spectra using different polarization inversion spectra is feasible and can provide a new way to improve the accuracy of outdoor detection of fruits. However, there are also limitations to be solved, and the RMSEP of some corrected spectra is still high. For example, the RMSEP of the Maignan model is 2.23 in the direction of no polarization, which indicates that the environmental interference is not fully corrected and needs to be further optimized by combining with multi-source data fusion. The Xie–Cheng model has a low peak value of the inversion spectra in the 1350–1400 nm band, which leads to the distortion of reflectance in some bands after correction. The compensation coefficient ω needs to be adjusted dynamically to improve the model flexibility. Future research will focus on constructing a dynamic adjustment model for BPDF parameters by combining meteorological data (e.g., solar irradiance, air humidity) to solve the residual error of the model in the non-polarized direction. Meanwhile, deep learning (e.g., Transformer architecture) is introduced to optimize the compensation coefficients of the model to improve the problem of band inversion distortion; most importantly, it is expanded to multi-species date detection to verify the model universality.

Author Contributions

Conceptualization, Y.D., H.L. (Huaping Luo) and J.Y.; methodology, Y.D., H.L. (Huaping Luo) and J.Y.; software, Y.D. and J.Y.; validation, Y.D., H.L. (Huaiyu Liu), L.K. and Y.T.; investigation, H.L. (Huaiyu Liu), L.K. and Y.T.; data curation, Y.D.; writing—original draft, Y.D. and J.Y.; writing—review and editing, Y.D. and J.Y.; supervision, H.L. (Huaping Luo) and J.Y.; project administration, H.L. (Huaping Luo) and J.Y.; funding acquisition, H.L. (Huaping Luo) and J.Y. All authors have read and agreed to the published version of the manuscript.

Funding

This work was supported by 24 Years of ‘Tianshan Talents’-L.H.P-South Xinjiang Fruits Multi-scale Near-Surface Quantitative Remote Sensing [524408001] and the National Natural Science Foundation of China’s (NSFC) ‘Multi-scale hyperspectral polarization quantitative remote sensing modeling of jujube in southern China’ [11964030]. This work was supported by the Tianchi Talented Young Doctoral Fund Project and Tarim University President’s Fund Project [TDZKBS202560].

Institutional Review Board Statement

Not applicable.

Data Availability Statement

The original contributions presented in this study are included in the article. Further inquiries can be directed to the corresponding author.

Conflicts of Interest

The authors declare that they have no known competing financial interests or personal relationships that could have appeared to influence the work reported in this paper.

References

  1. Guo, H.J.; Jin, X.W.; Zhang, Y.C.; Song, F.Y.; Shen, C.J. Current situation of winter jujube industry and research progress of preservation technology. Anhui Agric. Sci. 2023, 51, 1–4+8. [Google Scholar]
  2. Hou, F. Development status and countermeasures of Zhanhua winter jujube industry. Mod. Rural Sci. Technol. 2024, 5, 1–3. [Google Scholar]
  3. Xiong, C.H.; She, Y.X.; Jiao, X.; Shao, Y.; Jia, L.; Wang, M.; Xiao, M.; Wang, J. Application of hyperspectral imaging technology in nondestructive testing of agricultural products. Grain Oil Food Sci. Technol. 2023, 31, 109–122. [Google Scholar]
  4. Zou, Y.; Zhang, L.; Zhang, J.; Li, B.; Lv, X. Developmental Trends in the Application and Measurement of the Bidirectional Reflection Distribution Function. Sensors 2022, 22, 1739. [Google Scholar] [CrossRef]
  5. Lai, Q.; Liu, B.; Zhao, J.; Zhao, Z.; Tan, J. BRDF characteristics of different textured fabrics in visible and near-infrared band. Opt. Express 2020, 28, 3561–3575. [Google Scholar] [CrossRef] [PubMed]
  6. Shang, K.; Yan, L.; Zhang, F.Z.; Chu, J.; Yang, B.; Liu, S.; Tansey, K.; Jia, X.; Dubovik, O.; Zhang, Z.; et al. From BRDF to BPDF: A preliminary study on the evolution of remote sensing inversion base model. Chin. Sci. Inf. Sci. 2024, 54, 2001–2020. [Google Scholar]
  7. Xie, D.; Gu, X.; Cheng, T.; Yu, T.; Li, Z.; Chen, X.; Chen, H.; Guo, J. Initial research on the polarized reflectance of typical urban surface types measured by the Directional Polarimetric Camera. Sci. China (Earth Sci.) 2011, 54, 1199–1205. [Google Scholar] [CrossRef]
  8. Ti, R.F.; Fan, Y.Z.; Huang, H.L.; Liu, X.; Sun, X.; Hong, J.; Liu, S. Comparative analysis of surface BPDF model based on Gaofen-5 DPC and AERONET site data. J. Opt. 2022, 42, 146–154. [Google Scholar]
  9. Zhang, Z.H.; Yan, L.; Liu, S.Y.; Fu, Y.; Jiang, K.; Yang, B.; Liu, S.; Zhang, F. Inversion of leaf nitrogen content based on polarized reflectance model and random forest regression. Spectrosc. Spectr. Anal. 2021, 41, 2911–2917. [Google Scholar]
  10. Song, Z. H; Han, Y; Wei, C.Y; Chen, X; Gu, Q.Y; Liu, Z.P; Liu, S.S. Comparison of polarization spectral characteristics between oil-contaminated agricultural soils and wetland soils. Spectrosc. Spectr. Anal. 2022, 42, 2603–2609. [Google Scholar]
  11. Xu, J. Y; Huang, X; Luo, H.P; Liu, J.X; Suo, Y.T. Research on the effect of orientation and quality on the spatial characteristics of southern border fruit spectra and the inversion method. Spectrosc. Spectr. Anal. 2022, 42, 910–918. [Google Scholar]
  12. Gao, F.; Xu, J.Y.; Luo, H.P. Spatial characterization of spectral inversion and feasibility study of outdoor spectral correction. Spectrosc. Spectr. Anal. 2024, 44, 336–346. [Google Scholar]
  13. GB/T 5009.3-2016; National Standard for Food Safety Determination of Moisture in Food. China Standard Press: Beijing, China, 2016.
  14. Lei, D.T.; Luo, H. P; Gao, F; Di, Y.B. Quality detection of southern Xinjiang winter jujube based on polarization hyperspectral imaging. Food Res. Dev. 2025, 46, 172–177. [Google Scholar]
  15. Liu, J.X.; Liu, G.F.; Chen, D.L. Fresnel’s formula to discuss the change of amplitude of light waves upon reflection and refraction. Phys. Bull. 2021, 7, 23–26. [Google Scholar]
  16. Nadal, F.; Bréon, F.M. Parameterization of surface polarized reflectance derived from POLDER spaceborne measurements. IEEE Trans. Geosci. Remote Sens. 1999, 37, 1709–1718. [Google Scholar] [CrossRef]
  17. Litvinov, P.; Hasekamp, O.; Cairns, B. Models for surface reflection of radiance and polarized radiance: Comparison with airborne multi-angle photopolarimetric measurements and implications for modeling top-of-atmosphere measurements. Remote Sens. Environ. 2010, 115, 781–792. [Google Scholar] [CrossRef]
  18. Maignan, F.; Bréon, F.; Fédèle, E.; Bouvier, M. Polarized reflectances of natural surfaces: Spaceborne measurements and analytical modeling. Remote Sens. Environ. 2009, 113, 2642–2650. [Google Scholar] [CrossRef]
  19. Xie, D.; Cheng, T.; Wu, Y.; Fu, H.; Zhong, R.; Yu, J. Polarized reflectances of urban areas: Analysis and models. Remote Sens. Environ. 2017, 19, 29–37. [Google Scholar] [CrossRef]
  20. Yang, B.; Zhao, H.; Chen, W. Semi-empirical models for polarized reflectance of land surfaces: Intercomparison using spaceborne POLDER measurements. J. Quant. Spectrosc. Radiat. Transf. 2017, 20, 13–20. [Google Scholar] [CrossRef]
  21. Cheng, J.H.; Chen, Z.G.; Zhang, Q.H. Comparative study of different wavelength selection methods in soil organic matter content detection. China Agric. Sci. Technol. Bull. 2020, 22, 162–170. [Google Scholar]
  22. Di, Y.B.; Luo, H.P.; Liu, H.Y.; Liu, H.; Kang, L.; Tong, Y. Quantitative Detection of Water Content of Winter Jujubes Based on Spectral Morphological Features. Agriculture 2025, 15, 482. [Google Scholar] [CrossRef]
Figure 1. Outdoor sample placement.
Agriculture 15 01334 g001
Figure 2. Elimination of abnormal winter jujube samples using concentration residual method (total samples: n = 120; threshold: 2.0; eliminated samples: 11; valid samples: n = 109).
Agriculture 15 01334 g002
Figure 3. Characteristic wavelength selection via CARS algorithm (total spectral bands: 254; valid samples: n = 109; iterations: 50).
Agriculture 15 01334 g003
Figure 4. Hyperspectral reflectance under polarization azimuths.
Agriculture 15 01334 g004
Figure 5. Inversion spectra of the BPDF models at different polarizations.
Agriculture 15 01334 g005
Figure 6. Correction spectra of the BPDF models at different polarizations.
Agriculture 15 01334 g006
Table 1. Statistical table of physicochemical indexes of winter jujube samples.
IndexSample SetData RangeAverage ValueStandard DeviationCoefficient of Variation
Moisturecalibration set60.94–75.3467.173.294.91
prediction set63.15–71.8467.082.493.71
SSCcalibration set23.9–38.631.383.1610.09
prediction set26.7–37.131.432.648.40
Table 2. Parameters of semi-empirical BPDF models.
ModelParameter
Nadal–Breonρ = 5.16 β = 6
Litvinovα = 3.456 σ2 = 0.281 kr = 0.6
Maignanα = 7.235
Xie–ChengA = 0.999 kr = 0.53
Table 3. BPDF model inversion results for different polarizations.
PolarizationModelRRMSEPDifference Rate/%
NoneNadal–Breon0.99810.00603.67
Litvinov0.99800.068210.28
Maignan0.99660.097615.35
Xie–Cheng0.97420.196319.03
Nadal–Breon0.99780.02443.76
Litvinov0.99760.072010.59
Maignan0.99540.100914.19
Xie–Cheng0.97460.215921.43
45°Nadal–Breon0.99820.02464.00
Litvinov0.99790.071910.89
Maignan0.99420.097014.05
Xie–Cheng0.95860.170822.56
90°Nadal–Breon0.99820.02123.53
Litvinov0.99800.066910.18
Maignan0.99770.094214.18
Xie–Cheng0.96430.158422.44
135°Nadal–Breon0.99850.02053.40
Litvinov0.99830.06579.95
Maignan0.99650.096314.45
Xie–Cheng0.97810.185718.79
Table 4. PLS model results for non-polarization corrected spectra.
IndexSpectraNumber of
Principal Factors
Calibration SetPrediction Set
RcRMSECRpRMSEPRPIQ
MoistureRaw100.97410.77780.67561.50912.0304
Nadal–Breon100.97490.76090.79541.31692.1191
Litvinov110.97660.73280.88291.06372.5476
Maignan130.97390.79870.26362.22761.3474
Xie–Cheng110.98220.63820.76311.66511.4939
SSCRaw160.96780.78010.59131.93311.9657
Nadal–Breon80.89381.37270.55751.90351.7337
Litvinov180.98420.53290.80921.93231.5525
Maignan140.97840.68590.87121.33912.4084
Xie–Cheng110.94940.95690.62081.93771.7676
Table 5. PLS model results for 0° polarization corrected spectra.
IndexSpectraNumber of
Principal Factors
Calibration SetPrediction Set
RcRMSECRpRMSEPRPIQ
MoistureRaw160.98390.58140.80001.54732.0174
Nadal–Breon160.98760.52750.75951.95081.5719
Litvinov150.98400.58890.73451.81081.5888
Maignan160.98210.60080.72831.94251.6674
Xie–Cheng100.95690.91350.71441.75831.7440
SSCRaw120.96110.80100.74842.10581.4365
Nadal–Breon90.92441.07810.53082.17301.6222
Litvinov80.88691.33790.74901.64622.1110
Maignan120.95770.82850.64082.54281.2880
Xie–Cheng120.95400.89460.63901.76571.9539
Table 6. PLS model results for 45° polarization corrected spectra.
IndexSpectraNumber of
Principal Factors
Calibration SetPrediction Set
RcRMSECRpRMSEPRPIQ
MoistureRaw120.98190.58620.78811.49491.8142
Nadal–Breon90.96150.85230.76881.39561.9666
Litvinov120.98500.56640.86321.16172.3308
Maignan100.97700.70980.68391.64411.4817
Xie–Cheng120.97260.75120.89281.07552.2370
SSCRaw190.98780.46880.60862.59411.1950
Nadal–Breon110.96150.82100.64022.24591.0686
Litvinov110.94780.91900.67321.82091.8947
Maignan100.95230.88520.61742.01631.3763
Xie–Cheng230.99080.38940.63432.37621.4624
Table 7. PLS model results for 90° polarization corrected spectra.
IndexSpectraNumber of
Principal Factors
Calibration SetPrediction Set
RcRMSECRpRMSEPRPIQ
MoistureRaw90.96500.84230.77361.33081.8890
Nadal–Breon90.96790.83350.77741.31001.9993
Litvinov90.96340.89170.83161.05732.3654
Maignan90.97400.75240.78650.75242.3058
Xie–Cheng90.97100.76800.80771.37632.1423
SSCRaw80.93461.06480.60602.14151.5410
Nadal–Breon80.92971.09740.75181.65431.5263
Litvinov130.96460.82350.69372.05291.8024
Maignan70.90041.33600.66841.78911.7327
Xie–Cheng120.95570.86480.82111.55282.6403
Table 8. PLS model results for 135° polarization corrected spectra.
IndexSpectraNumber of
Principal Factors
Calibration SetPrediction Set
RcRMSECRpRMSEPRPIQ
MoistureRaw140.97600.64200.68251.87782.2579
Nadal–Breon150.98610.51760.69421.66652.0107
Litvinov130.97800.72210.51462.17421.4398
Maignan130.97140.80380.65671.90512.0054
Xie–Cheng160.98820.47970.65762.03641.9603
SSCRaw100.94960.94430.58912.11341.8454
Nadal–Breon120.95900.86350.69841.52012.2367
Litvinov140.97730.65650.88081.46232.9235
Maignan120.95740.91110.73711.54992.1937
Xie–Cheng140.97750.62790.62442.18111.5130
Disclaimer/Publisher’s Note: The statements, opinions and data contained in all publications are solely those of the individual author(s) and contributor(s) and not of MDPI and/or the editor(s). MDPI and/or the editor(s) disclaim responsibility for any injury to people or property resulting from any ideas, methods, instructions or products referred to in the content.

