Article

Soil Organic Matter Content Prediction Using Multi-Input Convolutional Neural Network Based on Multi-Source Information Fusion

1
College of Biological and Agricultural Engineering, Jilin University, Changchun 130022, China
2
Jilin Provincial Key Laboratory of Smart Agricultural Equipment and Technology, Jilin University, Changchun 130022, China
3
State Key Laboratory of Black Soils Conservation and Utilization, Northeast Institute of Geography and Agroecology, Chinese Academy of Sciences, Harbin 150081, China
4
Changchun Hyperspectral Imaging Technology Co., Ltd., Changchun 130022, China
5
Department of Agricultural and Rural Engineering, University of Venda, Thohoyandou 0950, South Africa
*
Author to whom correspondence should be addressed.
Agriculture 2025, 15(12), 1313; https://doi.org/10.3390/agriculture15121313
Submission received: 29 April 2025 / Revised: 12 June 2025 / Accepted: 17 June 2025 / Published: 19 June 2025
(This article belongs to the Section Agricultural Soils)

Abstract

:
Soil organic matter (SOM) content is a key indicator for assessing soil health, carbon cycling, and soil degradation. Traditional SOM detection methods are complex and time-consuming and do not meet the modern agricultural demand for rapid, non-destructive analysis. While significant progress has been made in spectral inversion for SOM prediction, its accuracy still lags behind traditional chemical methods. This study proposes a novel approach to predict SOM content by integrating spectral, texture, and color features using a three-branch convolutional neural network (3B-CNN). Spectral reflectance data (400–1000 nm) were collected using a portable hyperspectral imaging device. The top 15 spectral bands with the highest correlation were selected from 260 spectral bands using the Correlation Coefficient Method (CCM), Boruta algorithm, and Successive Projections Algorithm (SPA). Compared to other methods, CCM demonstrated superior dimensionality reduction performance, retaining bands highly correlated with SOM, which laid a solid foundation for multi-source data fusion. Additionally, six soil texture features were extracted from soil images taken with a smartphone using the gray-level co-occurrence matrix (GLCM), and twelve color features were obtained through the color histogram. These multi-source features were fused via trilinear pooling. The results showed that the 3B-CNN model, integrating multi-source data, performed exceptionally well in SOM prediction, with an R2 of 0.87 and an RMSE of 1.68, a 23% improvement in R2 compared to the 1D-CNN model using only spectral data. Incorporating multi-source data into traditional machine learning models (SVM, RF, and PLS) also improved prediction accuracy, with R2 improvements ranging from 4% to 11%. This study demonstrates the potential of multi-source data fusion in accurately predicting SOM content, enabling rapid assessment at the field scale and providing a scientific basis for precision fertilization and agricultural management.

1. Introduction

Soil is one of the most important components of the Earth’s surface, playing a critical role in ecosystems and agricultural production. However, soil degradation has become one of the major global challenges, particularly in intensively cultivated regions such as Northeast China, where it is characterized by a decline in organic matter, reduced fertility, structural damage, and weakened carbon cycling capacity [1]. SOM content is a key indicator for assessing soil health, fertility, and carbon cycling potential, as well as an essential parameter for reflecting the degree of soil degradation. SOM contains the decomposition products of plant and animal residues [2,3]. Accurate assessment of SOM content not only helps improve agricultural production efficiency but also provides critical data for evaluating carbon sequestration potential and studying climate change [4].
The combustion method is the primary technique for determining SOM. Both the wet combustion method and the more recent dry combustion method [5,6,7] typically require extensive sample preparation and are prone to reagent contamination. As a result, these methods are destructive, labor-intensive, and consume significant time and energy [8]. In recent years, spectral analysis techniques have gradually become mainstream tools for predicting SOM due to their efficiency and non-destructive nature. Particularly, visible and near-infrared spectroscopy (vis–NIR) can provide detailed information on soil components by detecting spectral reflectance at different wavelengths [9]. However, spectral techniques often face limitations when influenced by soil physical properties, such as color and texture (in this study, the term “texture” refers specifically to visual surface patterns extracted from soil images, rather than the conventional soil science definition based on particle size composition), resulting in reduced predictive accuracy due to unaccounted physical variability. Studies have shown that combining spectral data with image feature parameters can enhance the generalization ability of models [10].
Image data capture visual soil characteristics, such as color variations and texture, which reflect changes in SOM content [11]. As SOM content increases, soil color darkens and porosity becomes more pronounced—changes detectable through high-resolution imagery [12]. Recent research on SOM analysis using image data has grown. Swetha et al. used a random forest (RF) model to predict total soil carbon, combining Munsell soil color charts with non-standardized Nix data, achieving an R2 of 0.66, demonstrating the potential of color features in SOM prediction [13]. Yang et al. developed an SOM prediction model using smartphone images, achieving a maximum R2 of 0.77 [14]. Costa et al. incorporated soil color parameters into a nutrient classification model, significantly improving SOM prediction accuracy [15]. Despite progress, many deep learning-based SOM prediction models still rely primarily on spectral or image data alone; the exploration of new modeling methods to improve model accuracy is highly necessary [16,17]. Integrating spectral and image features can overcome these limitations, improving SOM prediction accuracy. However, due to differences in data types—such as heterogeneous formats like spectral reflectance and image-based features—further exploration of feature extraction methods is needed [18].
Multi-source data fusion techniques have proven to significantly improve prediction model accuracy [19]. These techniques can be classified into low-level, mid-level, and high-level fusion. Low-level fusion combines raw data directly, but it may introduce redundancy that affects performance. High-level fusion models each data source separately and combines their predictions, which is computationally complex [20]. Mid-level fusion, which extracts and integrates features from different sources, strikes a balance between efficiency and accuracy and is the most commonly used approach [21]. Recently, combining multi-source data fusion with deep learning, especially convolutional neural networks (CNNs), has gained attention for its ability to extract valuable spectral and spatial features, improving SOM prediction accuracy [22,23]. Although most previous SOM prediction studies used single spectral indices or multiple features, research on multi-input CNNs integrating diverse data sources is limited [24]. Swetha et al. combined spectral data with image-based texture and color features, and models captured complementary information, enhancing robustness. Recent studies have shown that multi-branch CNNs, which integrate spatial and spectral features, can significantly boost performance by leveraging complementary soil characteristics from image data [13]. This study aims to develop a three-branch convolutional neural network architecture based on the integration of multi-source data, including spectral information, image texture, and color features. By enabling parallel extraction and fusion of diverse features, the model captures complementary information across data types, thereby enhancing its representation capability for soil organic matter content and improving prediction accuracy and robustness.
This study explores the potential of multi-source data fusion techniques to improve SOM content prediction accuracy in typical black soil areas. Due to improper land use and management, black soil, an essential agricultural resource, has seen a significant decline in SOM, leading to soil degradation that threatens food security and ecosystem stability [25]. This study aims to (1) analyze the characteristics of SOM in Northeast China’s black soil and extract its spectral, texture, and color features; (2) compare three spectral band selection algorithms and identify the most suitable dimensionality reduction method; and (3) evaluate the impact of multi-source feature fusion using a 3B CNN on SOM prediction accuracy, comparing it with traditional machine learning models. Achieving these objectives will improve SOM prediction accuracy and provide essential data and guidance for addressing soil degradation in black soil regions, supporting optimized soil management and sustainable agriculture.

2. Materials and Methods

2.1. Study Aera of Soil Samples

The Northeast Black Soil Region in China, one of the world’s three major black soil areas—alongside the Russian–Ukrainian steppes and the North American prairies—is known for its fertile soil and high agricultural potential. However, the region’s fragile ecosystem is under dual pressure from climate change and human activities. Studies have shown that climate-driven soil degradation, combined with long-term intensive agriculture, has led to significant loss of SOM, primarily due to nutrient depletion and soil erosion. In recent decades, the organic matter content in some areas of the black soil region in Northeast China has declined markedly from an initial level of 60–80 g/kg to just 20–30 g/kg, highlighting the severity of ongoing degradation in cultivated land quality [26]. Monitoring changes in SOM content is crucial for assessing soil health, improving farming practices, optimizing fertilization, and implementing conservation measures to balance agricultural and ecological development, thereby ensuring food security. This study was conducted at two experimental fields in Hailun City, Heilongjiang Province, Northeast China (located at 47°28′ N, 126°57′ E; see Figure 1). The terrain of the study area is flat with an elevation below 200 m, and the predominant soil type is black soil. The sampling sites are primarily agricultural land. The region has a temperate continental climate characterized by four distinct seasons. The annual average temperature ranges approximately from −4 °C to 6 °C, while annual precipitation falls between 400 and 750 mm. Precipitation generally increases from west to east across the province (data sources: Heilongjiang Provincial Department of Ecology and Environment, 2024 Environmental Status Bulletin; China Meteorological Administration, National Surface Climate Data Yearbook) [27,28]. These climatic conditions significantly influence the accumulation and decomposition of SOM: lower temperatures help slow down SOM decomposition, while concentrated summer rainfall may intensify nutrient leaching and organic matter loss. Therefore, precise monitoring of SOM dynamics under such environmental conditions is essential for evaluating soil health, guiding agricultural management, and formulating sustainable land use strategies.
Soil samples were collected in October 2022 under clear weather conditions, with 70 and 64 shallow soil samples randomly collected from two experimental fields, respectively. A grid sampling method was used for uniform sampling in both experimental fields, with one sampling point set every 5 × 5 m. The sampling depth was 0 to 20 cm. Approximately 500 g of soil was collected at each sampling point. After collection, the soil samples were packed in cloth bags and transported to the laboratory for analysis.

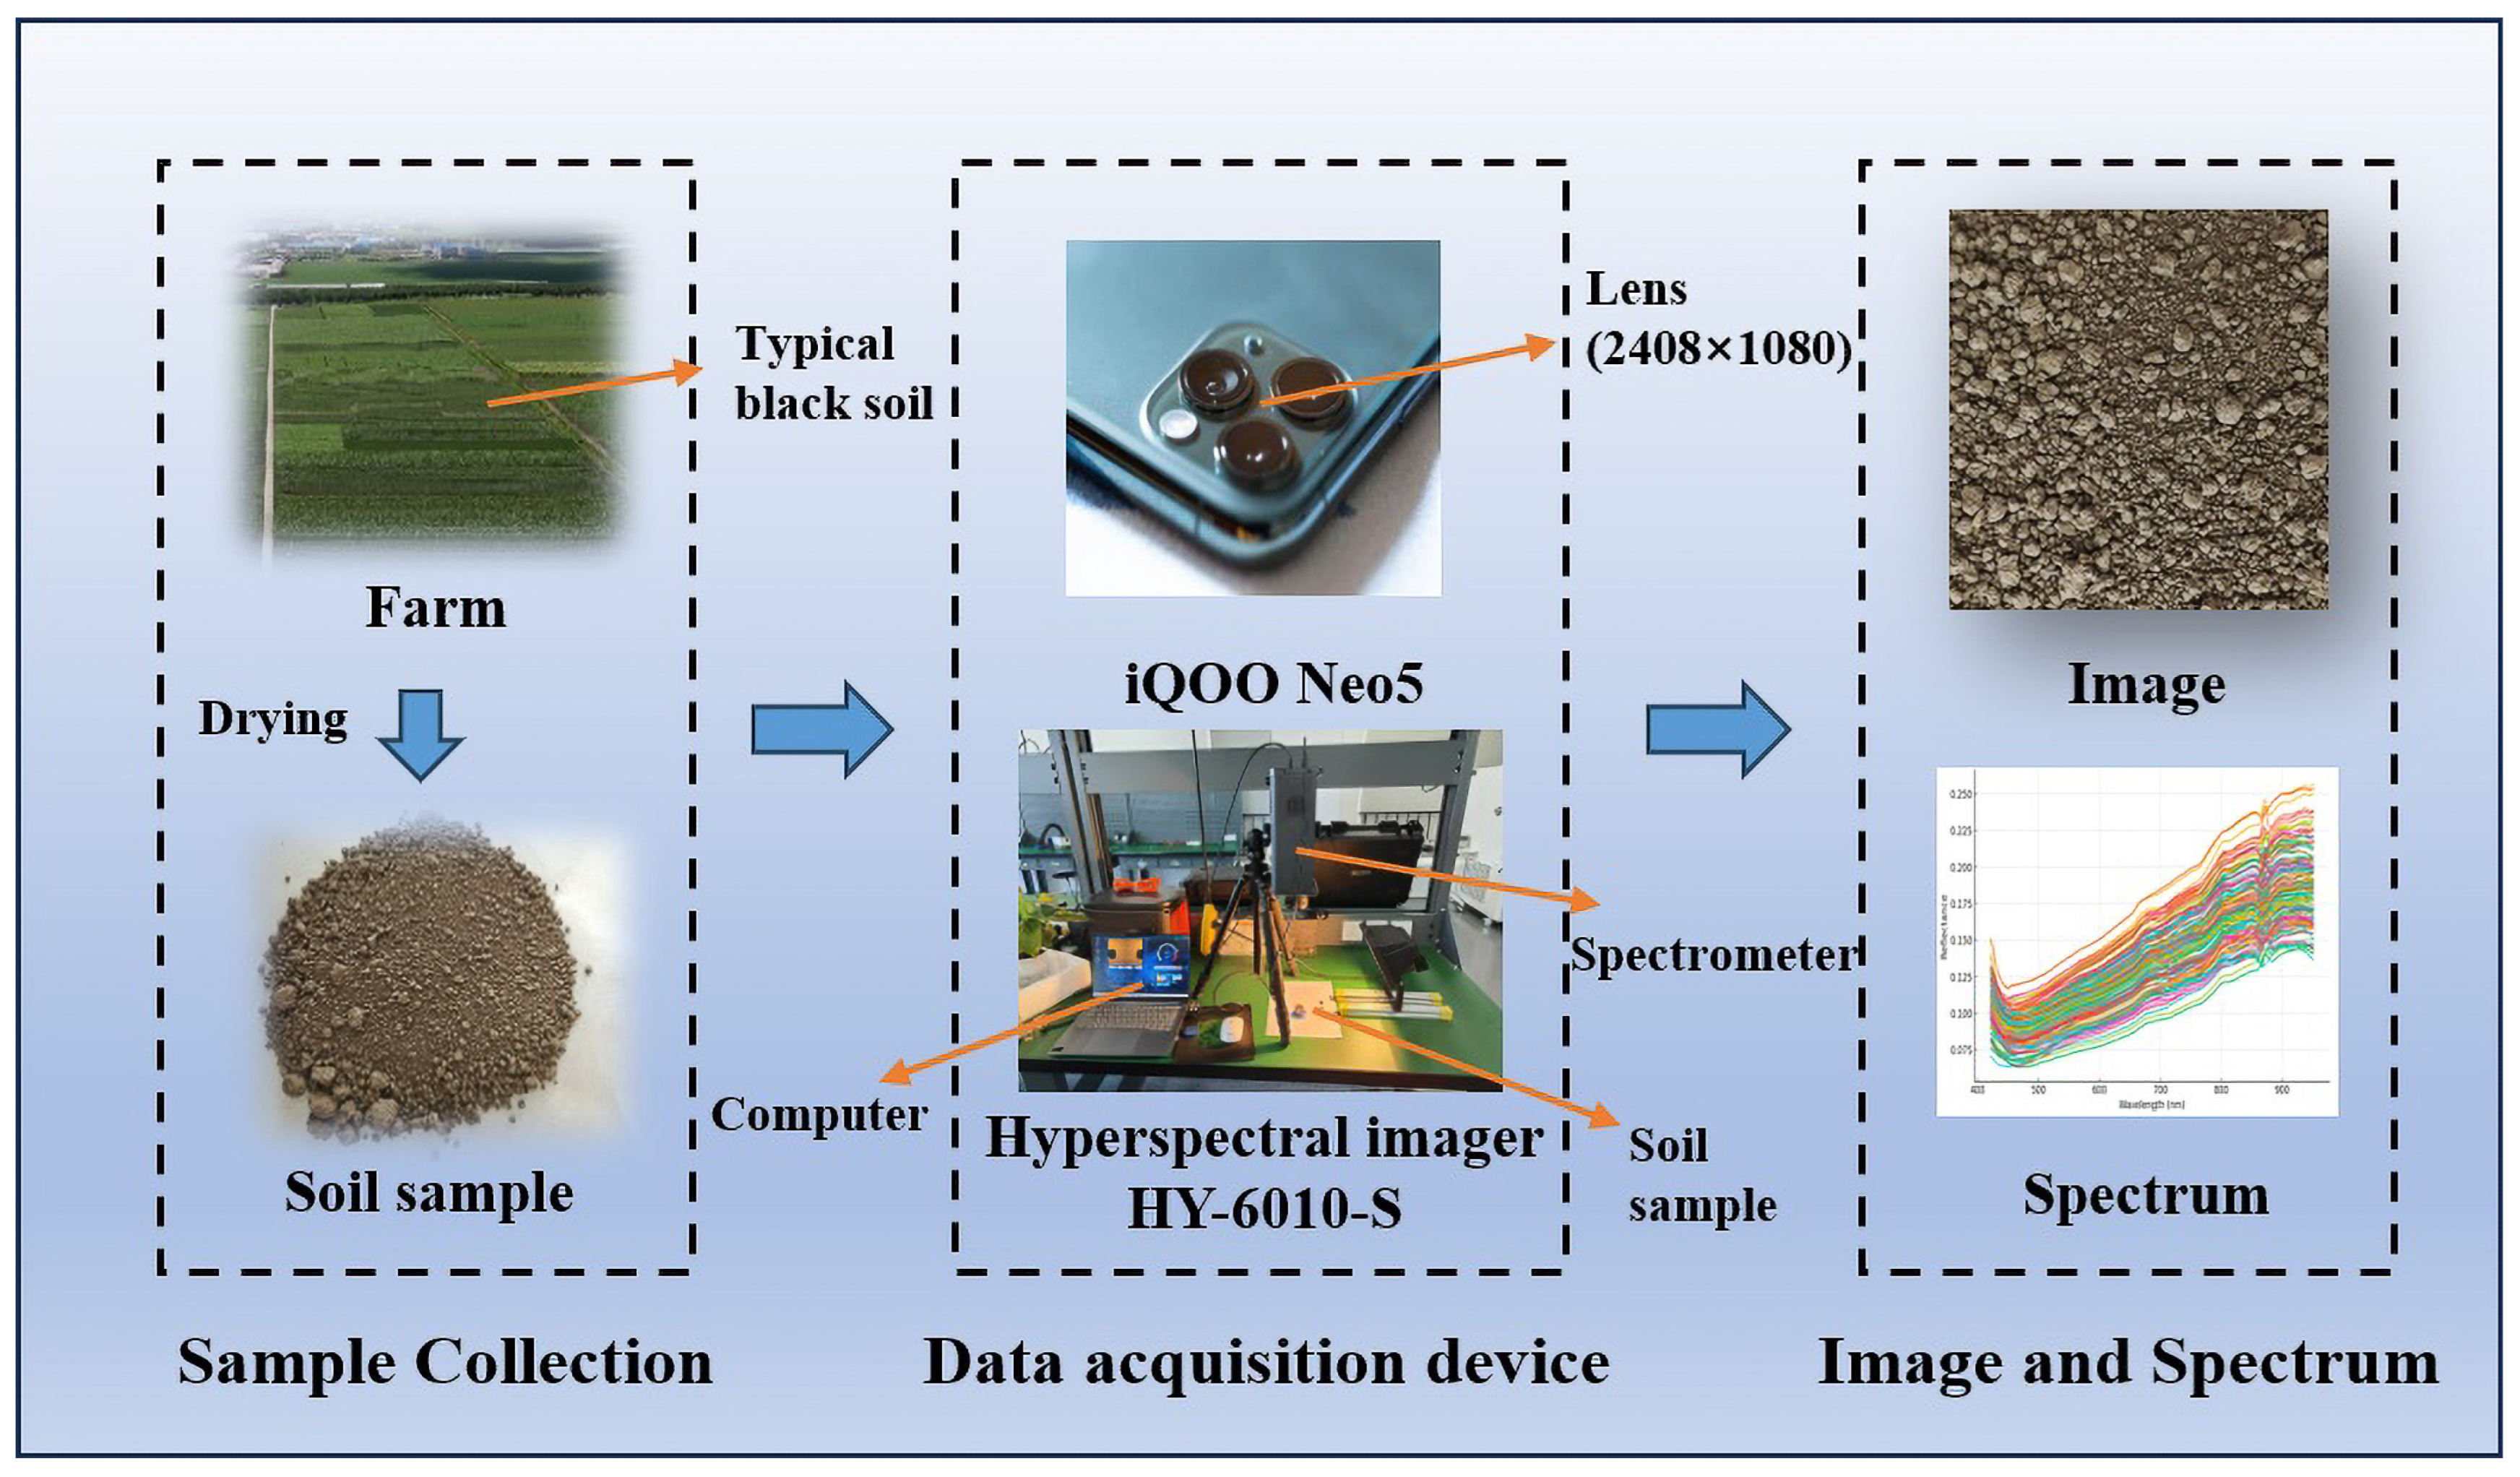
2.2. Acquisition Process of Soil Sample Information

After soil sample collection, the samples were first processed in the laboratory to remove non-soil materials such as stones and straw residues. The samples were then air-dried at room temperature (20–25 °C) for 48 h. To preserve the soil’s original structure and porosity, each sample was photographed using an iQOO Neo5 smartphone with a resolution of 2408 × 1080. This device was chosen for its high-resolution imaging capability, which is suitable for subsequent soil granulometry analysis. The samples were evenly spread on a smooth background and photographed under uniform lighting to avoid the impact of uneven illumination on feature extraction. These images were used for subsequent extraction of soil texture and color features.
The samples were then crushed and sieved through a 2 mm mesh. Each sample was divided into two parts: one for determining SOM content and the other for spectral data extraction. In this study, soil organic carbon (SOC) content was determined using the potassium dichromate oxidation-titration method. To minimize potential interference from inorganic carbon, all soil samples were pretreated with hydrochloric acid (HCl) prior to analysis to effectively remove any inorganic carbon, ensuring that the measured values accurately reflected the organic carbon content. A commonly used conversion factor of 1.724 was then applied to convert SOC to SOM content. The processed and converted data were subsequently used for modeling analysis to ensure the accuracy and consistency of the results. Spectral data were acquired using a portable hyperspectral imaging system (HY-6010-S, Changchun Hyperspectral Imaging Technology Co., Ltd., Changchun, China), covering the visible spectral range (400–1000 nm) with 300 bands at a spectral resolution of 2 nm. To enhance data quality, 40 edge bands with low signal-to-noise ratios were removed, and the remaining data were processed with smoothing and denoising techniques. As a result, 260 high-quality spectral bands were retained for subsequent analysis. The experimental setup included a darkroom, a halogen lamp, and a control computer. In the darkroom, the halogen lamp illuminated the soil samples at a 45° angle. After setup, hyperspectral images of the soil samples and a calibration whiteboard were captured between July and August 2023. Spectral reflectance data were extracted using ENVI software (version 5.3, L3Harris Technologies, Inc., Melbourne, FL, USA). The process of obtaining soil spectral and image data is shown in Figure 2.

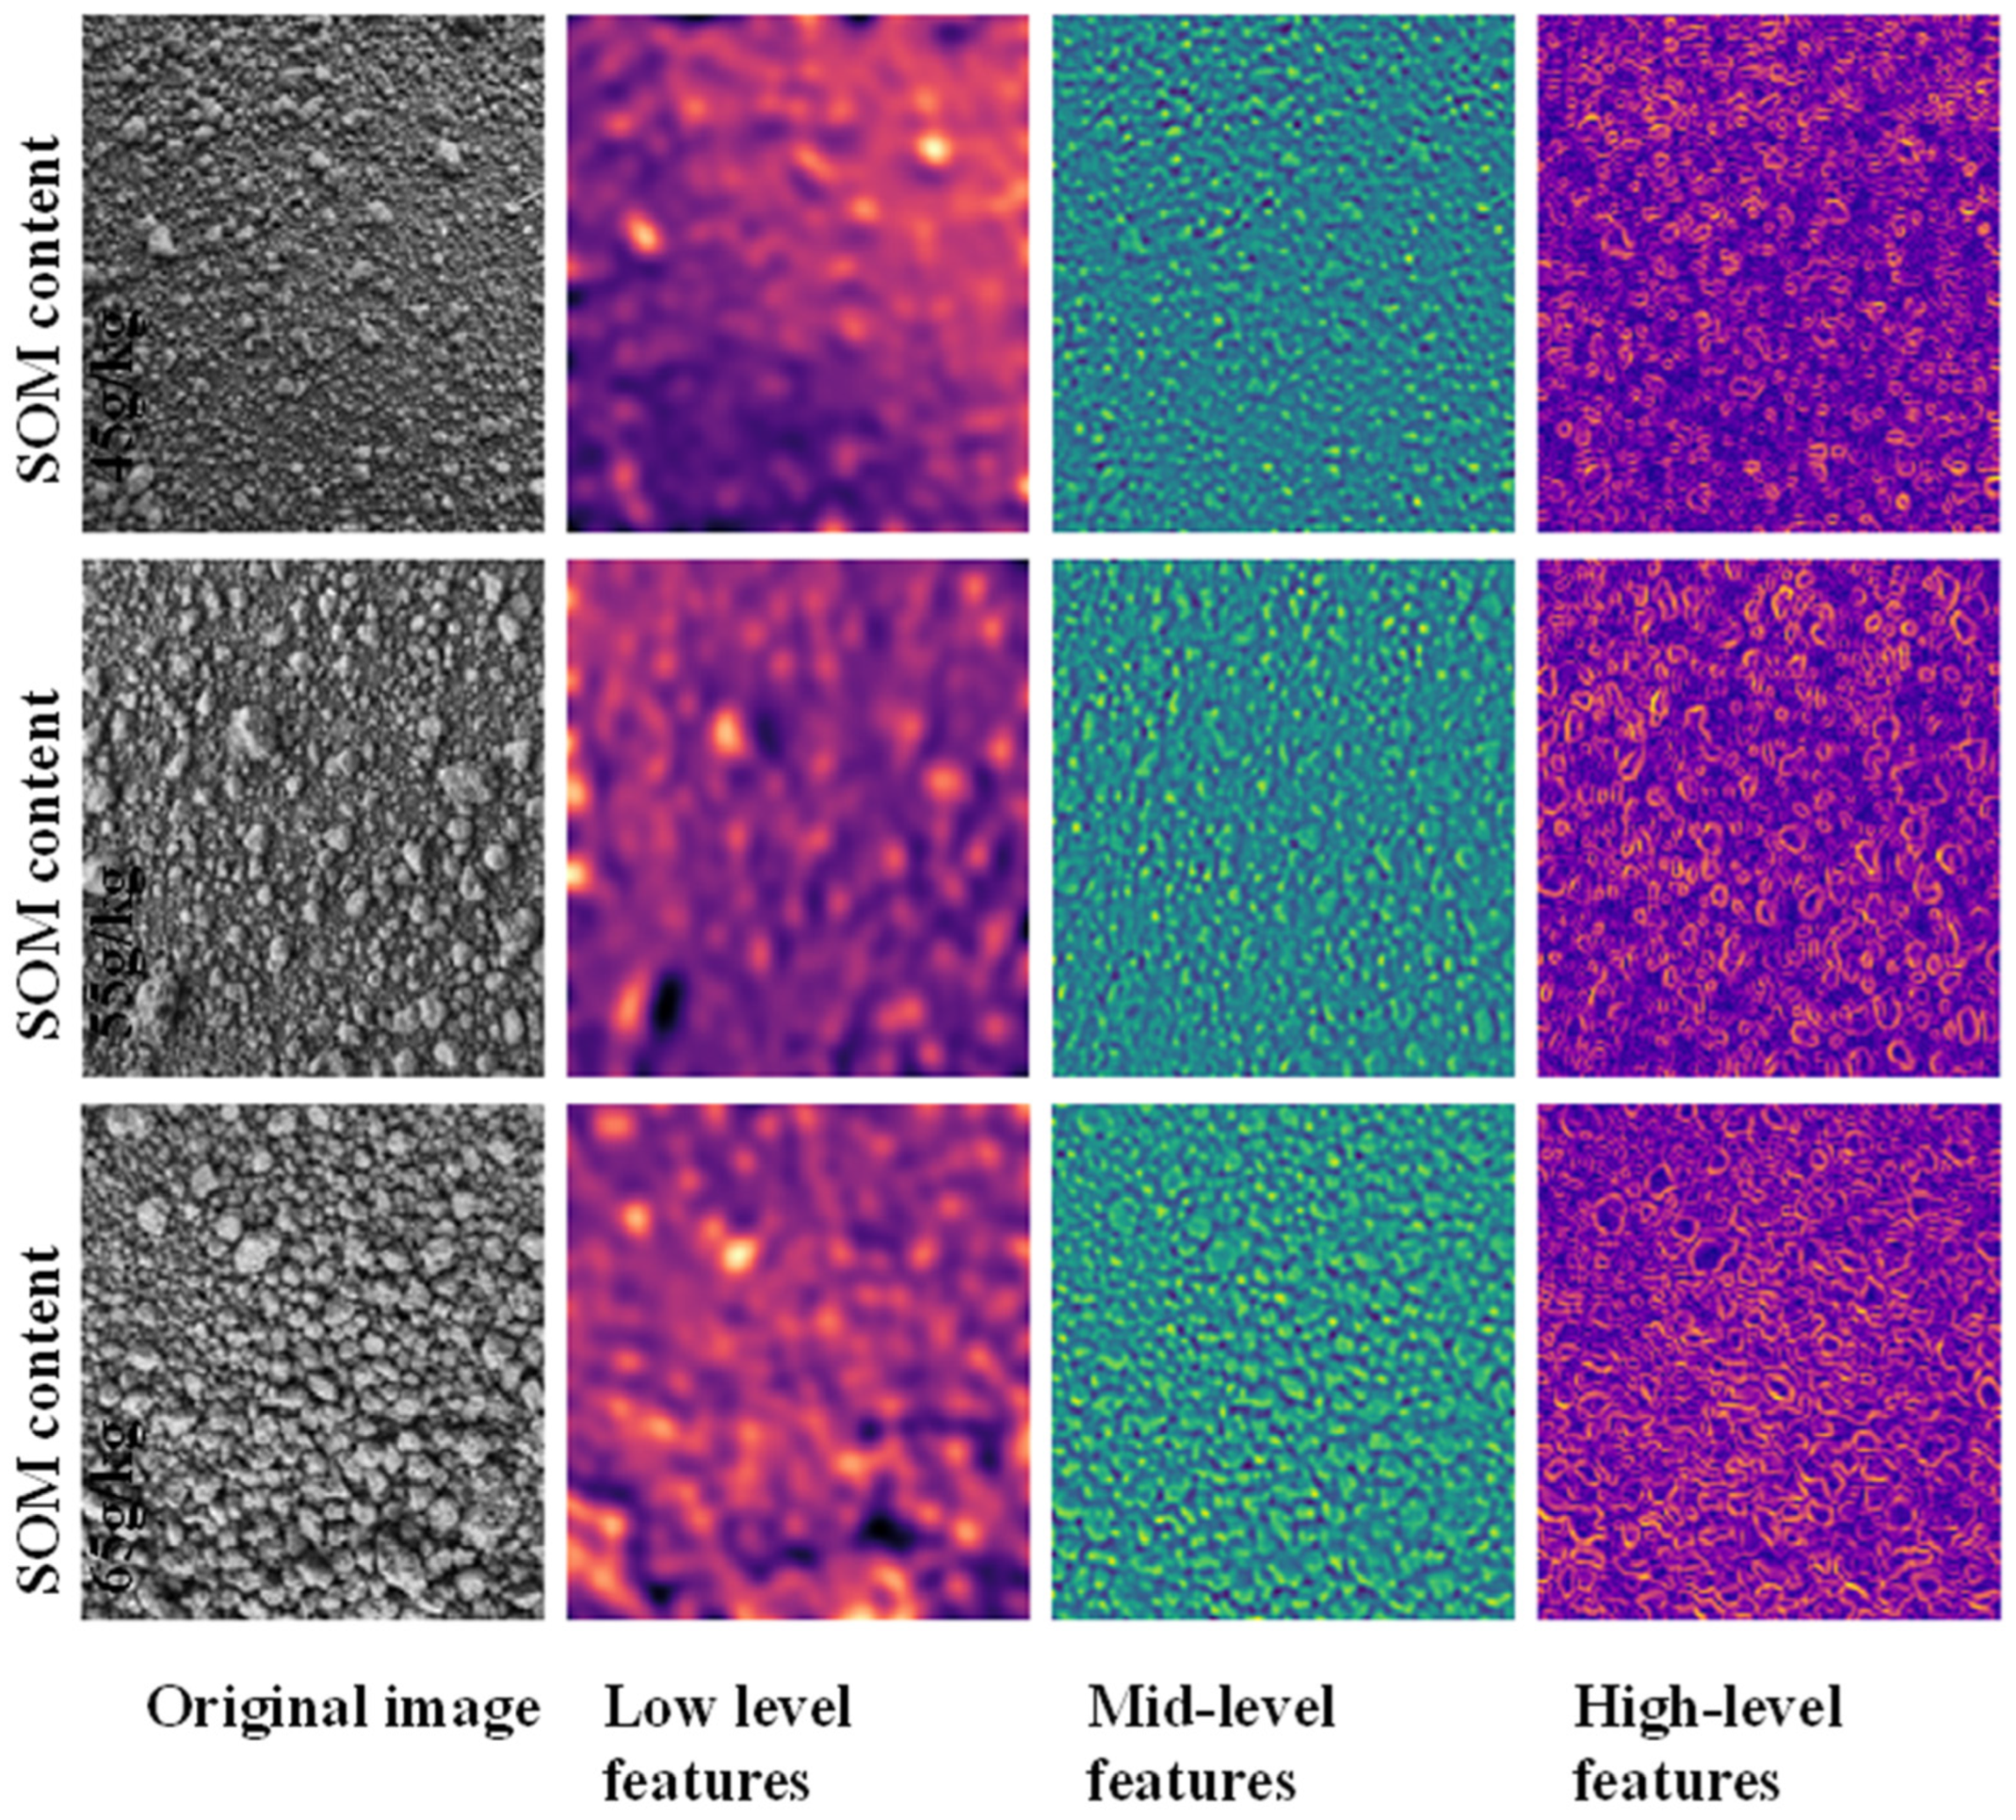
2.3. Extraction of Image Information from Smartphone Images

In this study, Python 3.8 was used to extract information from soil images captured by a smartphone, combining the GLCM and color histogram methods to extract texture and color features of the soil images. Soil images at different resolutions reveal distinct textural and structural characteristics. Low-level features offer higher spatial resolution, capturing fine-grained texture details, while high-level features convey richer semantic information but tend to lose perceptual detail in structural representation [29,30]. As shown in Figure 3, different scales highlight the effects of varying organic matter content in soil images. The gray-level co-occurrence matrix (GLCM) is an intermediate-level feature extraction method that generates texture indices such as contrast, homogeneity, and correlation by analyzing pixel intensity co-occurrence patterns. GLCM captures spatial variations in grayscale distribution by calculating correlations between points at specified distances and directions [31,32,33]. Intermediate-level methods like GLCM offer advantages in analyzing soil image texture, reducing redundant features while retaining enough information to balance accuracy and computational cost. Unlike low-level features that directly use pixel values, GLCM can more effectively capture the spatial distribution of soil particles and extract the texture features of soil images. The calculation formulas for texture feature-related parameters are shown in Table 1.
The color histogram method is employed to extract features from soil images by analyzing the statistical properties of each color channel within the image. In this approach, key statistical indicators are typically extracted and analyzed, such as the mean, standard deviation, skewness, and kurtosis of the RGB color channels. The color histogram method is a technique used for image analysis, which statistically examines the distribution of each color component in the red, green, and blue (RGB) color space, thereby describing the overall hue and color proportions of the image. Specifically, the RGB color space represents each pixel of the image as values from three primary color channels—red, green, and blue. By calculating the distribution of each color channel, it is possible to derive the color distribution patterns, color uniformity, and relative proportions of the colors present. The formulas related to the color feature parameters used in this study are shown in Table 2.

2.4. Spectral Band Selection Algorithms

To address the issues of numerous spectral bands and high redundancy in the spectral data, several band selection algorithms were applied to screen for sensitive bands before developing the SOM prediction model [34]. In this study, several common spectral sensitive band selection methods were chosen, and by comparing the Boruta algorithm, the SPA, and the CCM, the most suitable spectral data dimensionality reduction method was ultimately selected.
The Boruta algorithm is a feature selection method based on random forests. It identifies truly important features by comparing them with randomly generated “shadow features”, which are created by shuffling the original features and serve as a baseline for importance evaluation [35]. Through iterative testing, Boruta retains only those features whose importance is significantly higher than that of the shadow features. Owing to its robustness and effectiveness in handling complex datasets, the Boruta algorithm has been widely adopted in various research fields.
SPA is a forward cyclic selection algorithm that reduces redundancy in the spectral matrix for dimensionality reduction [36]. It selects uncorrelated variables to mitigate multicollinearity. The process involves two steps: first, determining the maximum number of variables and calculating all possible combinations; second, using a multivariate regression method to model the combinations and selecting the optimal set by minimizing the RMSECV through cross-validation.
CCM is a band selection method based on the correlation between variables and the target variable [37]. It calculates the Pearson correlation coefficient between each band’s spectral reflectance and SOM content, selecting the most sensitive bands. Significance testing ensures that only bands with strong correlations to SOM are retained, improving model accuracy and stability.

2.5. Subsection

2.5.1. Traditional Inversion Models

In this study, three traditional regression models—support vector machine regression (SVM), partial least squares regression (PLS), and random forest regression (RF)—will be used to predict SOM content, and their results will be compared with the predictive performance of the three-branch convolutional neural network (3-branch CNN) model. The purpose of this comparison is to evaluate the advantages and disadvantages of traditional regression methods versus deep learning methods in multi-source information fusion modeling, providing a reference for improving model accuracy and optimizing soil nutrient content prediction.
SVM is a supervised learning algorithm suitable for both classification and regression tasks. In regression, known as support vector regression (SVR), it handles nonlinear relationships using a soft margin and kernel functions. By maximizing the margin between data points, SVM enhances generalization while minimizing sample error and reducing the upper bound of generalization error [38].
PLS improves upon multiple linear regression and principal component regression by performing dimensionality reduction while extracting features correlated with response variables [39]. It avoids overfitting and is particularly effective in scenarios where the number of variables exceeds the number of samples, such as chemometrics and spectral analysis.
RF is an ensemble method based on decision trees, combining multiple trees to enhance prediction accuracy and reduce overfitting. Each tree is trained on random samples and feature subsets, giving RF strong noise resistance and stability [40]. Additionally, RF provides measures of feature importance, making it valuable for identifying influential variables in fields like ecology, agriculture, and finance.

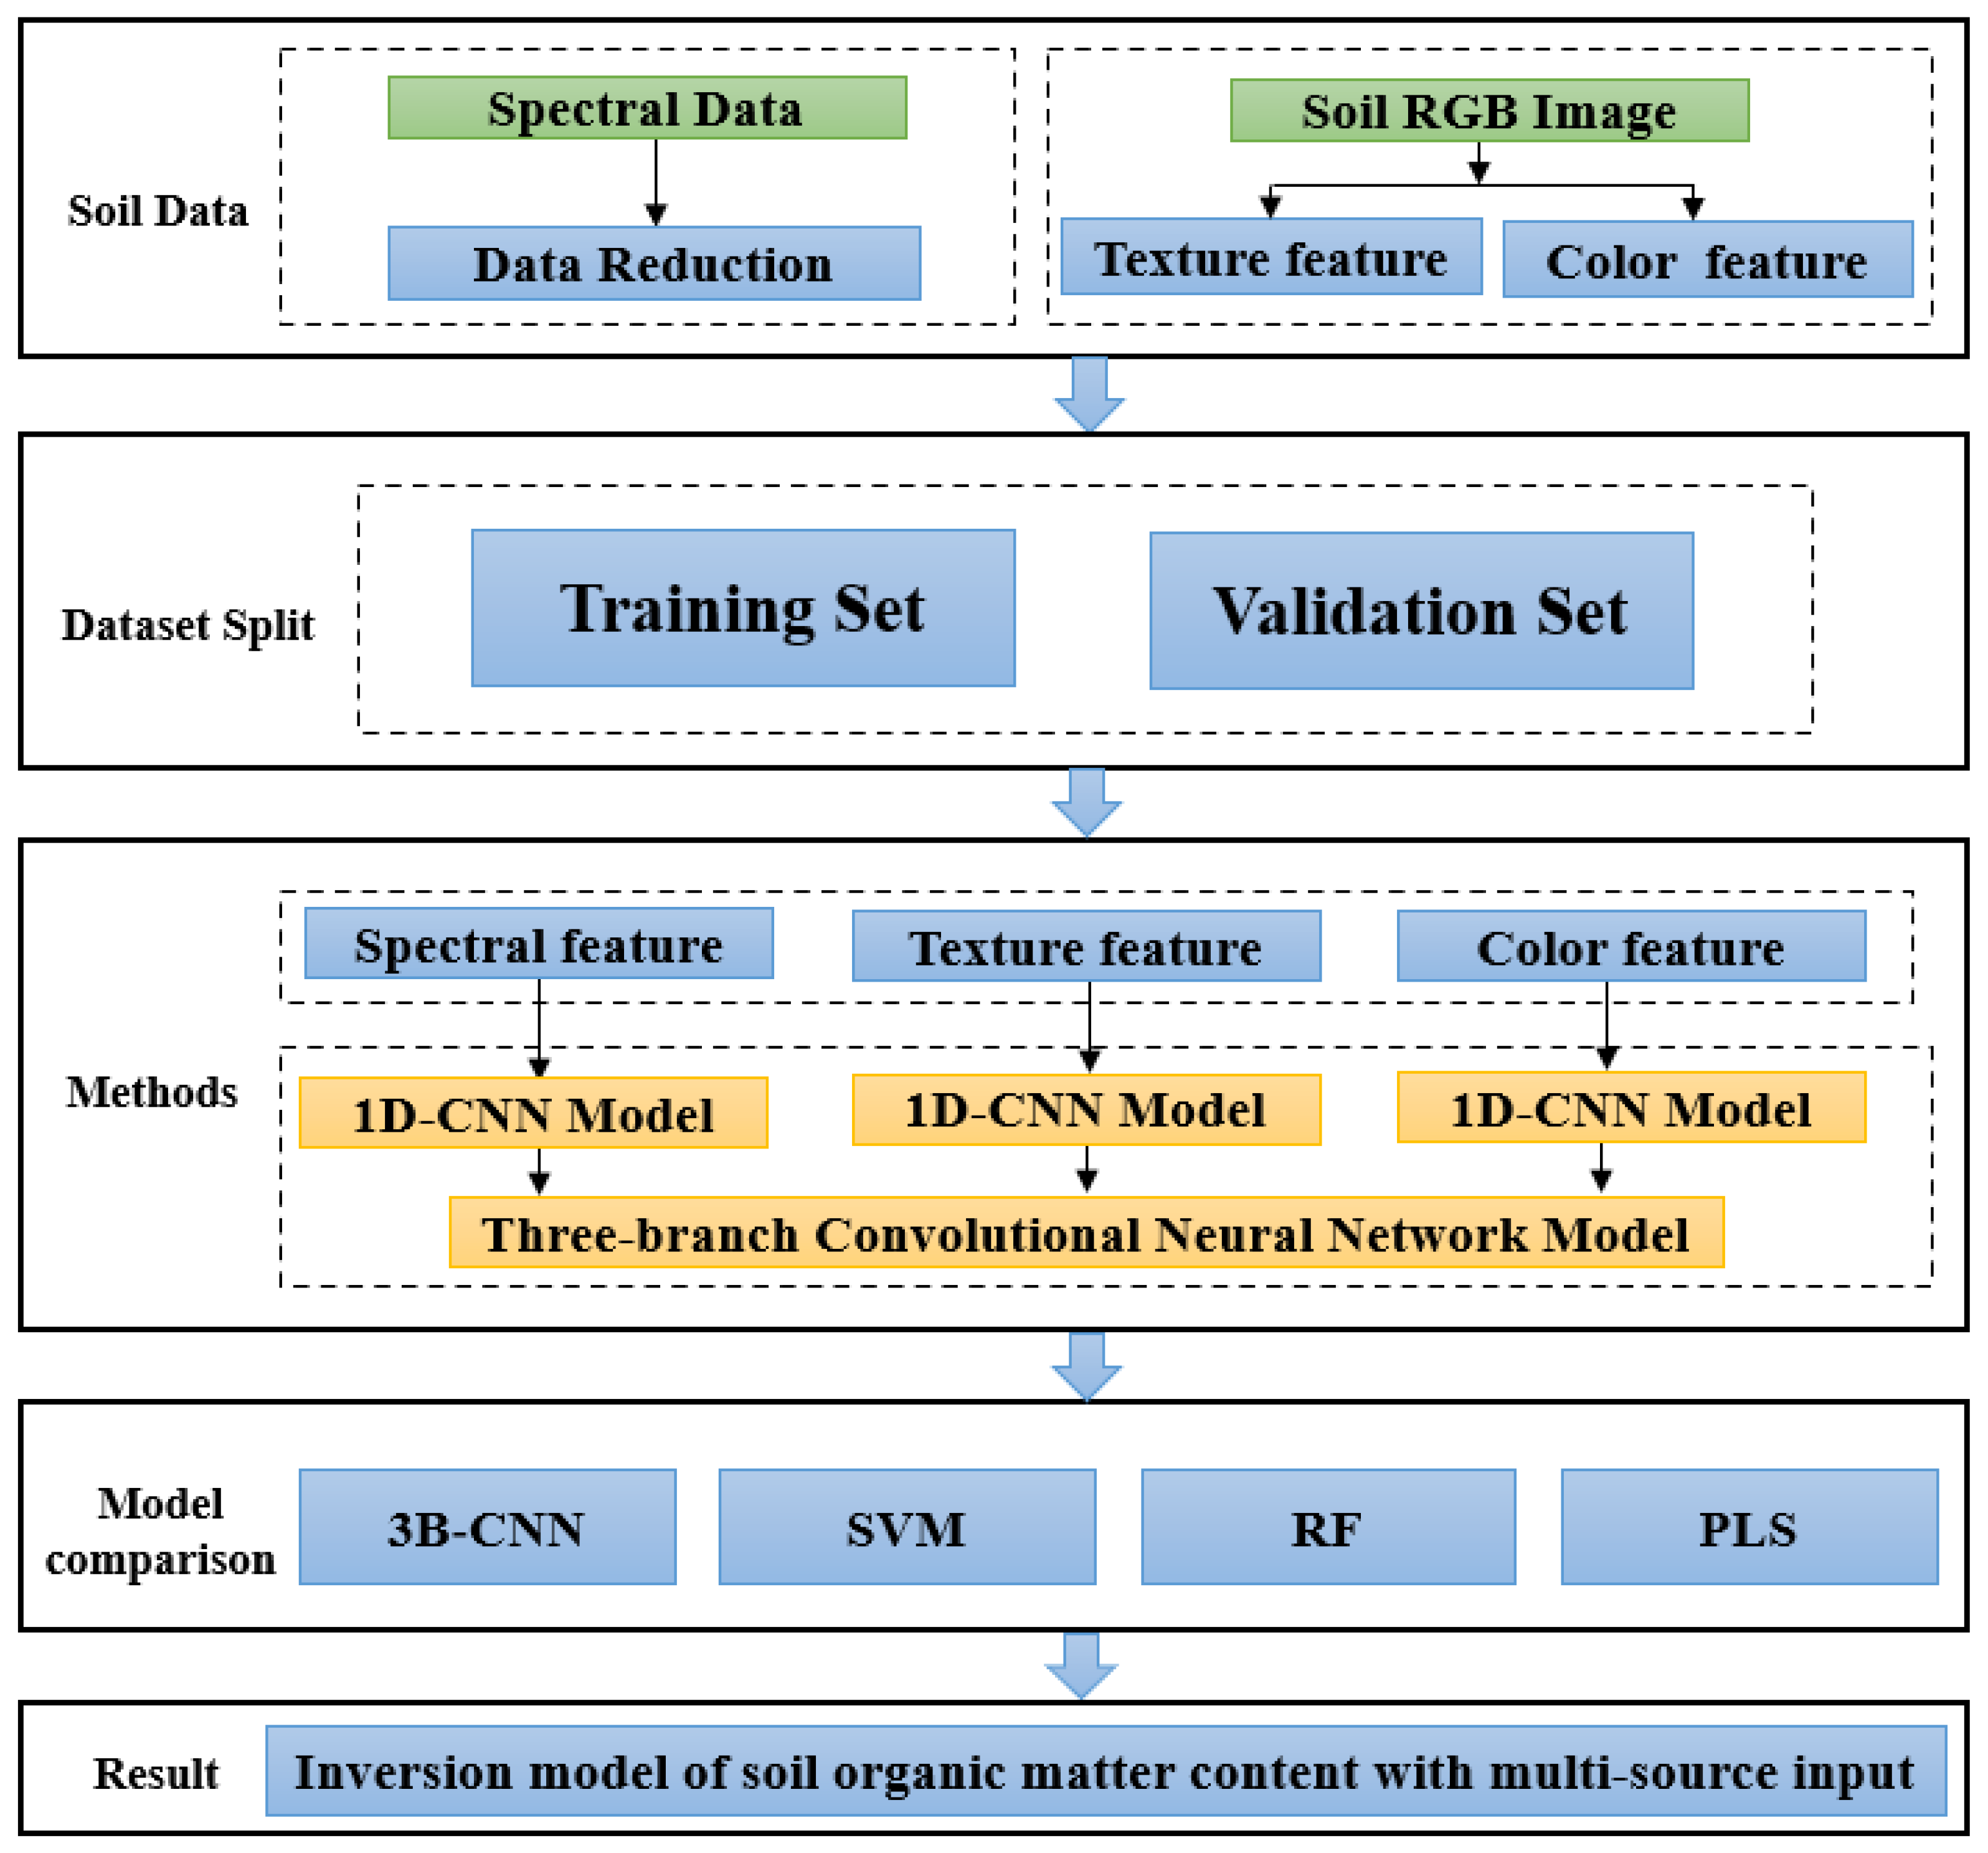
2.5.2. Three-Branch CNN Model (3B-CNN)

This study proposed a novel model for predicting SOM content. This model consists of three CNN branch network modules and a feature fusion module. The three branches separately take spectral feature data, texture feature data, and color feature data as inputs, enabling more refined feature extraction to achieve more accurate SOM content prediction. The overall framework of the model is shown in Figure 4.
The three-branch CNN is characterized by three independent 1D-CNN branches, each consisting of a one-dimensional convolutional neural network (1D-CNN) with four convolutional layers (Conv) and three max-pooling layers (Max-Pool). In many convolutional neural networks, the number of channels (such as 64, 128, 256, and 512) is commonly used in the convolutional layers, as these values strike a good balance between improving model performance and computational resources [41]. In this study, the number of channels in the convolutional layers was 64, 128, 256, and 512, respectively, with a kernel size of 3 × 1 and a stride of 1. The max-pooling layers use a pooling window of 2 with a stride of 2 to progressively extract features and reduce dimensionality. The three one-dimensional convolutional neural network (1D-CNN) branches were designed to process spectral, texture, and color features, with input dimensions of 15 spectral bands, 6 texture features, and 12 color features, respectively. Each branch extracts distinct types of information from soil samples across different dimensions. The integration of these multi-source features serves as an effective input for subsequent feature fusion. This network architecture enables comprehensive extraction of spectral, texture, and color characteristics, ensuring that the model fully captures the complex properties of soil samples and ultimately enhances prediction accuracy.
The feature fusion module integrates data features from different sources to capture their complementarity and interaction. In this process, features from different modalities are first extracted using convolutional neural networks (CNNs) and then fused through trilinear pooling. Trilinear pooling performs an outer product operation among the three types of features, projecting them into a higher-dimensional space to capture high-order interactions across modalities, thereby enhancing the effectiveness of feature fusion and overall model performance. Feature fusion captured the complex interactions between different modalities, improving the model’s understanding of multimodal data, avoiding feature redundancy, and enhancing prediction accuracy and model generalization ability. This fusion approach significantly improved performance in multimodal data processing tasks, particularly those involving image and spectral data.
The modeling process of the multi-branch CNN for predicting SOM content included data preparation, feature extraction, model training, and model comparison. The flowchart of this process is shown in Figure 5.

2.6. Model Evaluation Metrics

In this study, we selected classic regression evaluation metrics—coefficient of determination (R2) and root mean square error (RMSE)—to validate the predictive performance of the model [31]. R2 measures the goodness of fit, with values closer to 1 indicating better model fit, while RMSE reflects the magnitude of prediction errors, with lower values indicating higher prediction accuracy. Additionally, relative prediction deviation (RPD) and relative prediction interval quantile (RPIQ) were included as supplementary metrics. RPD evaluates the stability of the model’s predictions, and RPIQ assesses the reliability of the predicted intervals. Overall, higher R2, lower RMSE, higher RPD, and lower RPIQ values typically indicate stronger model fit and greater predictive reliability.
R 2 = 1 i = 1 n ( y i y ^ i ) 2 i = 1 n ( y i y ¯ i ) 2
R M S E = 1 n i = 1 n ( y i y ¯ i ) 2
R P D = σ r e f R M S E
R P I Q = P I T V I
In these formulas, yi represents the actual observed values, y ^ i represents the predicted values from the model, y ¯ is the mean of all actual observed values, and n is the number of samples. These two metrics were used to measure the model’s fitting performance and prediction error, respectively. σ r e f is the standard deviation of the reference dataset. PI is the prediction interval of the model, and TVR is the true value range of the data.

3. Results

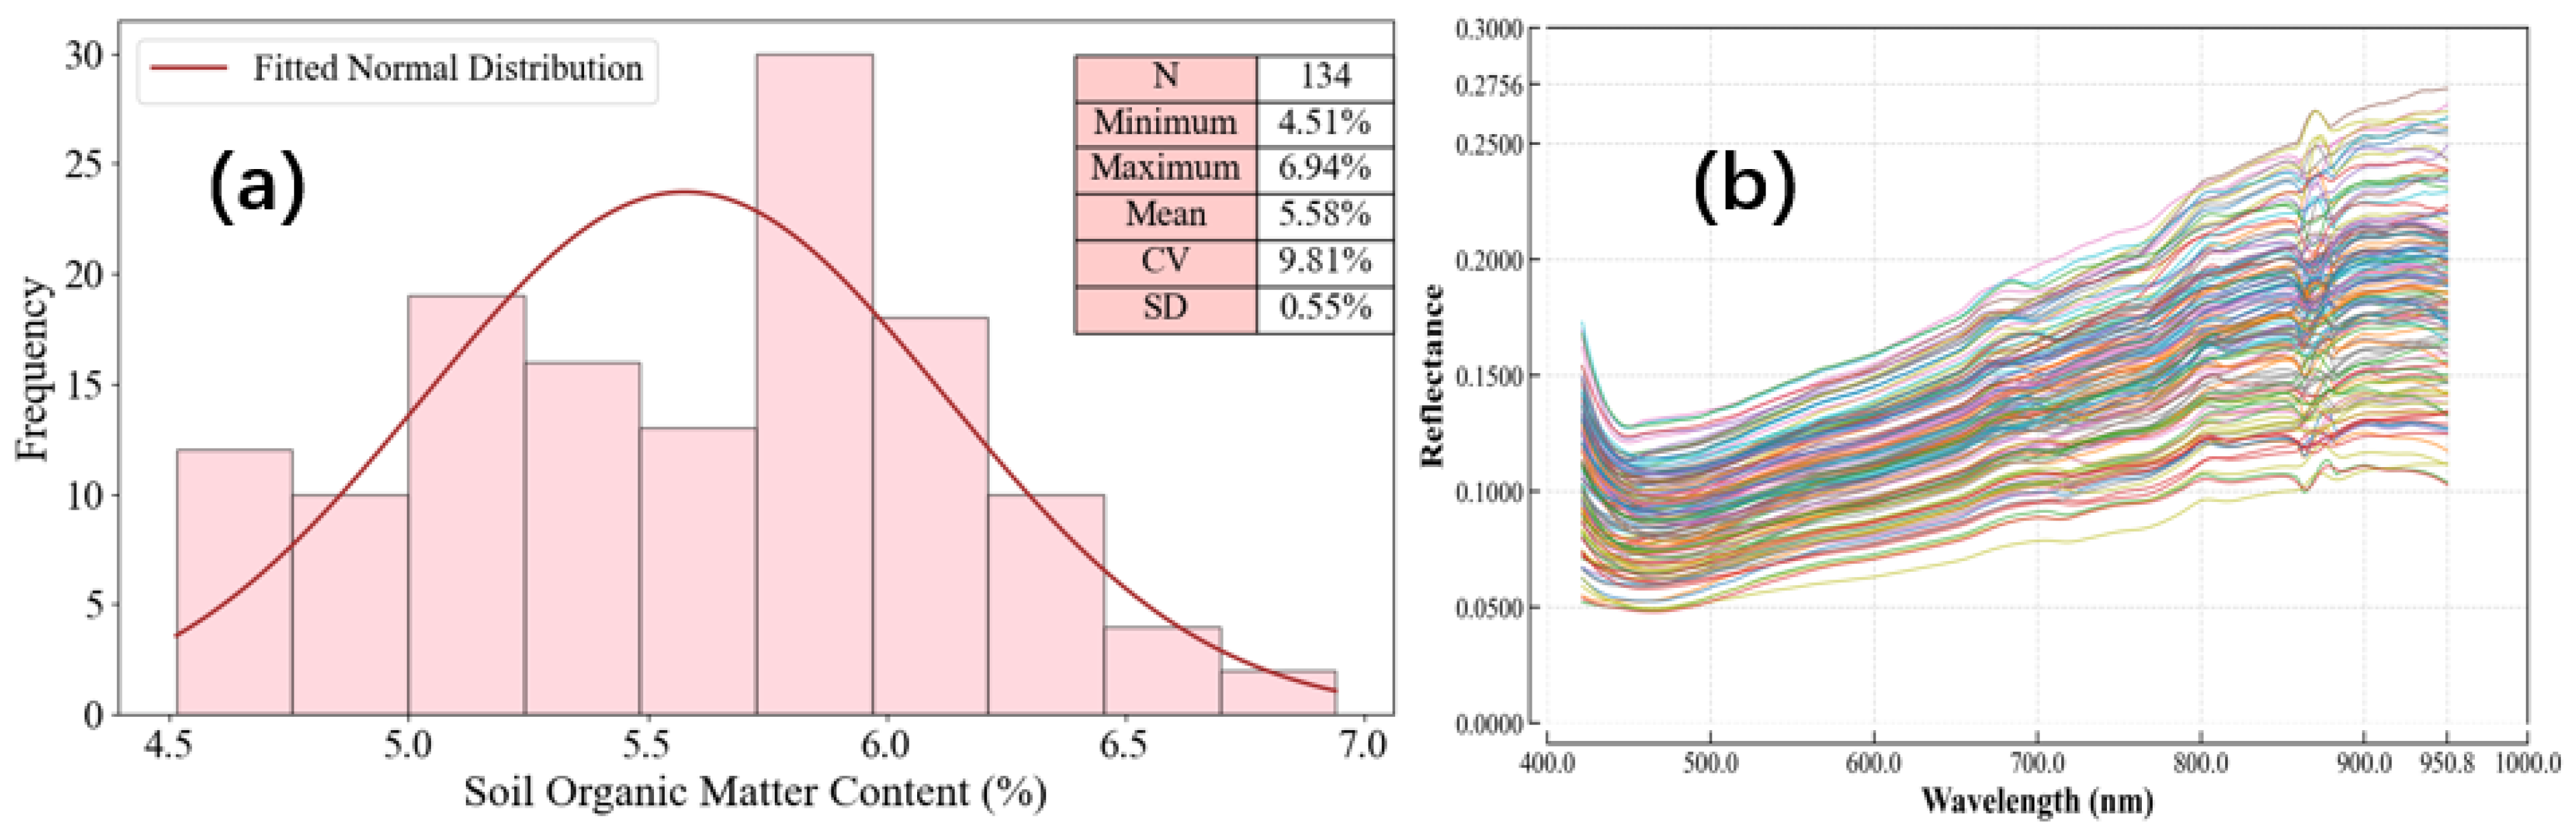
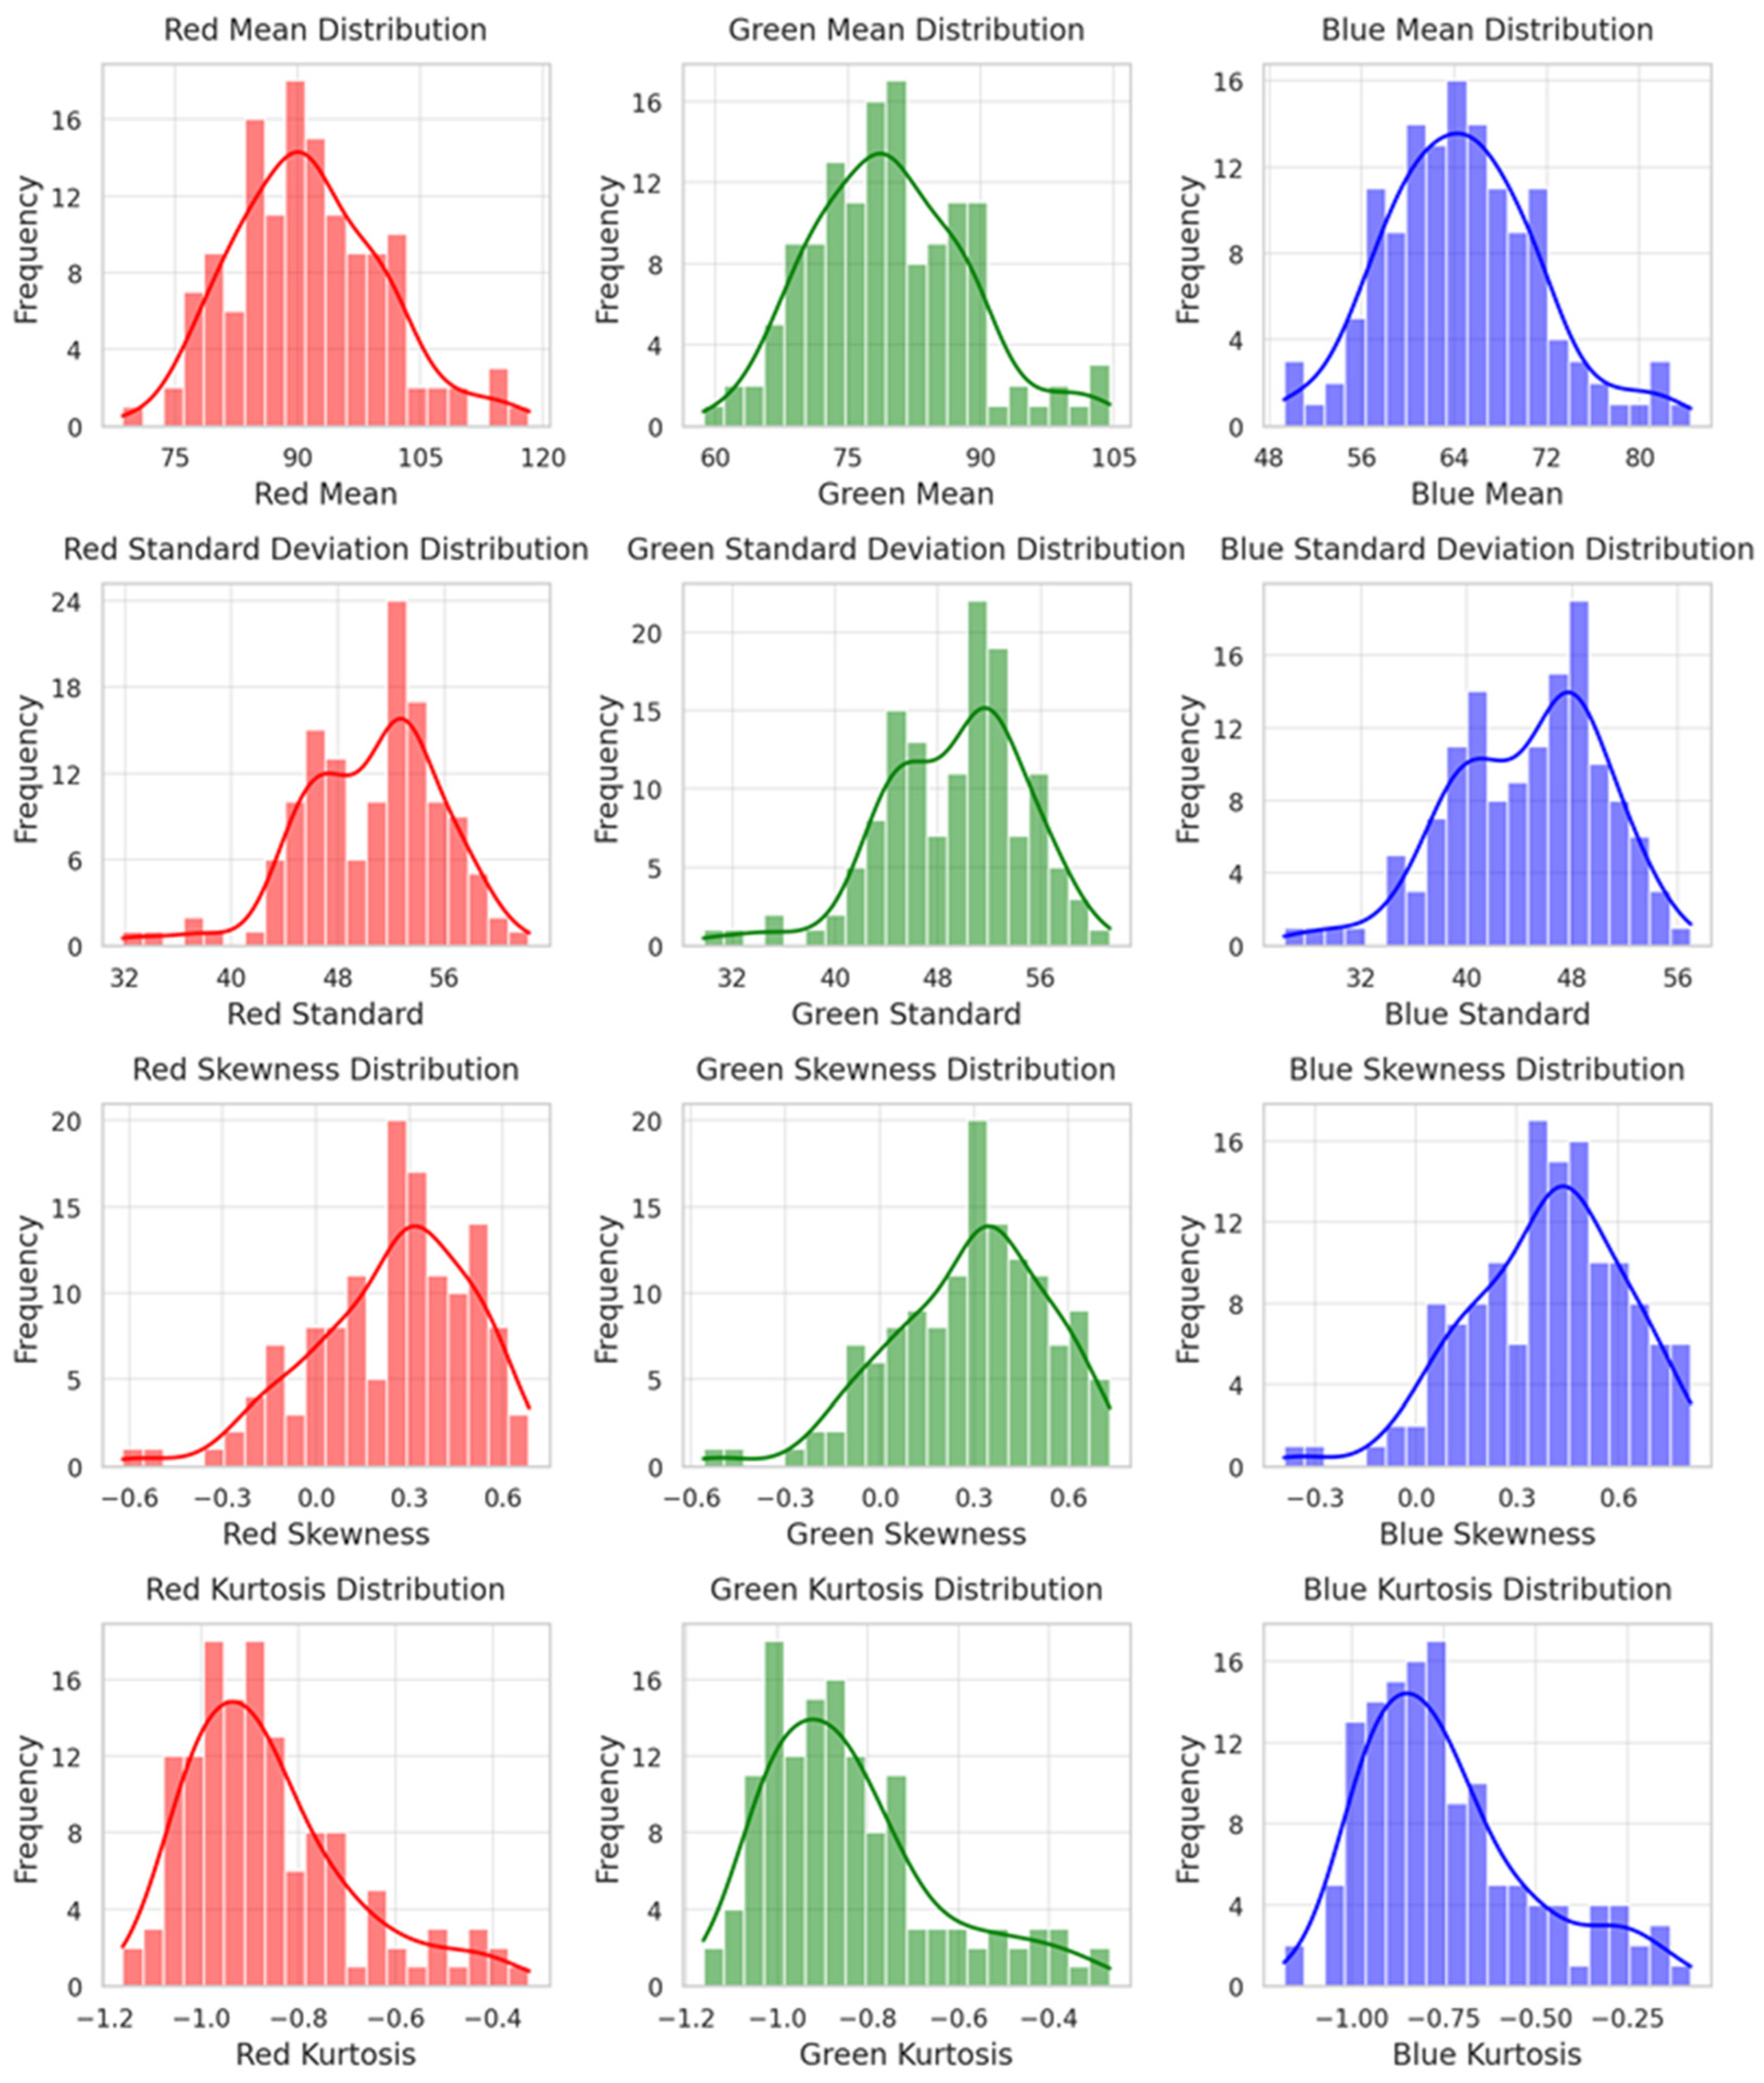
3.1. Statistical Analysis of Soil Sample Information

The dataset consists of 134 samples, with SOM content ranging from 4.51% to 6.94%, an average of 5.58%, a standard deviation of 0.55%, and a coefficient of variation (CV) of 9.81%. As shown in Figure 6a, the SOM content data was concentrated, with the fitted curve closely matching the histogram. The concentration of the data helps reduce the sensitivity of complex models to outliers, as it minimizes the impact of extreme values on model training by reducing their influence on parameter estimation and gradient updates. This, in turn, lowers the risk of model overfitting and contributes to improved prediction accuracy. In this study, the soil samples were randomly divided into two subsets: one for training and the other for testing, with an 80–20% split. This approach ensures that both subsets are representative of the overall dataset. Additionally, it helps minimize any potential biases that might arise from the order of the data or underlying patterns, ultimately improving the model’s ability to generalize and its accuracy in predictions.
The spectral data collected in the visible and near-infrared regions initially consisted of 300 spectral bands, as shown in Figure 6b. After removing invalid edge bands and applying smoothing and denoising processes, 260 effective bands were retained. To enhance the model accuracy in subsequent modeling, the obtained spectral data underwent mean-centering preprocessing. This technique involved subtracting the mean of each band, ensuring that the spectral data for each band had a mean of zero, effectively removing any offset. This preprocessing step helps improve the model’s stability and fitting accuracy. The spectral curves of soil samples with varying SOM content exhibited significant differences. Although the spectral curves for soils with different SOM contents followed similar overall trends, they differed substantially in their values. As shown in Figure 6b, soils with higher SOM content exhibited lower spectral reflectance in the visible wavelength range, indicating a negative correlation between SOM content and spectral reflectance.
The texture features, as shown in Figure 7, including contrast, energy, entropy, homogeneity, correlation, and angular second moment (ASM), provide valuable information about soil structure and composition by quantitatively describing subtle variations in the soil surface texture. Specifically, these features reflect various aspects of soil surface texture, such as roughness, complexity, and uniformity, helping to deepen our understanding of the physical properties of soil and its changes. The heatmap in Figure 7 displays the linear relationships between these features through varying color intensities, with darker colors indicating higher correlations and lighter colors representing lower correlations. For instance, the strong positive correlation between contrast and energy suggests that these two features share similar information content in describing the complexity and roughness of the image texture. Additionally, the strong positive correlation between entropy and homogeneity highlights the intricate relationship between the complexity of soil surface texture and its uniformity. Entropy serves as a measure of texture complexity, reflecting the level of disorder or irregularity in the soil surface texture, and is often used to characterize variations in pixel intensity within an image. A higher entropy value signifies a greater degree of texture variation and irregularity. In contrast, homogeneity gauges the smoothness of the texture, indicating the regularity and consistency of the soil’s surface. The strong correlation between these two features suggests that more complex soil textures tend to exhibit lower homogeneity, meaning that increased texture variability and irregularity typically result in reduced uniformity. This insight is valuable for understanding the soil surface structure and its connection to soil organic matter content, enhancing our ability to assess soil characteristics across different types and conditions and their subsequent impact on soil health and physical properties.
The histograms in Figure 8 show the distribution of the mean, standard deviation (SD), skewness, and kurtosis for the red, green, and blue channels, reflecting the diversity and distribution of colors in soil images. The mean values of the red channel are mainly concentrated between 70 and 110, with a peak at approximately 90 ± 5, indicating higher brightness and a wider range. The green channel’s mean values are concentrated between 60 and 100, peaking around 80–90, suggesting moderate brightness and a more focused distribution. The blue channel’s mean values range from 55 to 85, with a peak around 70, indicating lower brightness and a narrower range. The SD distribution reveals consistent brightness variation across the channels, with the red channel ranging from 35 to 60, the green from 30 to 55, and the blue from 25 to 55. The blue channel’s smaller variation suggests more stable brightness. Skewness and kurtosis further highlight the symmetry and extremity of the brightness distribution. The skewness ranges for the red and blue channels are broader, from −0.6 to 0.6 and −0.4 to 0.8, respectively, showing slight positive skewness and some high-brightness areas. The green channel’s skewness ranges from −0.4 to 0.4, indicating a more symmetrical distribution. For kurtosis, the red and blue channels have wider ranges (−1.2 to 0.8 and −1.2 to 0.6), reflecting more extreme brightness distributions, while the green channel is concentrated between −1.0 and −0.2, showing a more uniform and smoother distribution. The mean and SD effectively represent the overall brightness level and variation, while skewness and kurtosis capture the symmetry and extremity, helping models more accurately predict soil properties and providing a foundation for further analysis of soil color patterns.

3.2. Prediction Model of SOM Content Based on Spectral Data

In this study, to evaluate the impact of multi-source information fusion on model performance, we first compared and determined the optimal spectral band selection method in the model using only spectral information as input. The model results are shown in Figure 9.
In this study, three dimensionality reduction methods—Boruta, SPA, and CCM—were applied to identify sensitive spectral bands, extracting the most informative features from the original spectral data. These reduced datasets were then used to train regression models, including SVM, RF, PLS, and 1D-CNN, to predict SOM content. Validation results revealed that the choice of dimensionality reduction method had a significant impact on the predictive performance of the models. Among the methods tested, CCM consistently outperformed the others. Compared to Boruta, CCM improved the R2 by up to 6.25% in certain models.
In the regression models, the spectral data processed using CCM exhibited the best predictive performance. As shown in Table 3, in the SVM model, the CCM-reduced data achieved an R2 value of 0.63 and an RMSE of 3.23, outperforming the results obtained using SPA and Boruta. In the RF model, CCM demonstrated particularly strong performance, achieving an R2 value of 0.68 and an RMSE of 3.44, significantly surpassing other dimensionality reduction techniques. Similarly, in the PLS and 1D-CNN models, the spectral data reduced by CCM also showed relatively strong predictive results, with R2 values exceeding 0.62 and RMSEs of 3.27 and 3.43, respectively. Overall, CCM proved to be the most effective dimensionality reduction method, especially in the RF model, where its advantages were most pronounced—R2 values in the validation set were 1.56% and 6.25% higher than those achieved using SPA and Boruta, respectively. These results highlight CCM’s ability to effectively reduce data redundancy and noise while retaining critical information essential for SOM prediction, thereby improving the accuracy and stability of the models.
In conclusion, the CCM dimensionality reduction method demonstrated superior performance in this study, especially in the RF model, where it significantly improved predictive accuracy and reduced error—likely due to RF’s ability to leverage CCM’s highly correlated bands for robust feature importance ranking. By identifying the spectral bands most relevant to SOM prediction, CCM effectively minimized data redundancy and enhanced model generalization. These findings underscore CCM’s suitability for the specific data characteristics in this study, as well as its strong adaptability across various regression models. Consequently, CCM emerged as a robust technical solution for the rapid and accurate prediction of SOM content. It was therefore selected as the spectral data processing method for subsequent multi-source data modeling, ensuring improved reliability and precision in SOM content estimation. However, while CCM excelled in this dataset, its performance may vary with more heterogeneous soil types, and further validation across diverse soil conditions is warranted.

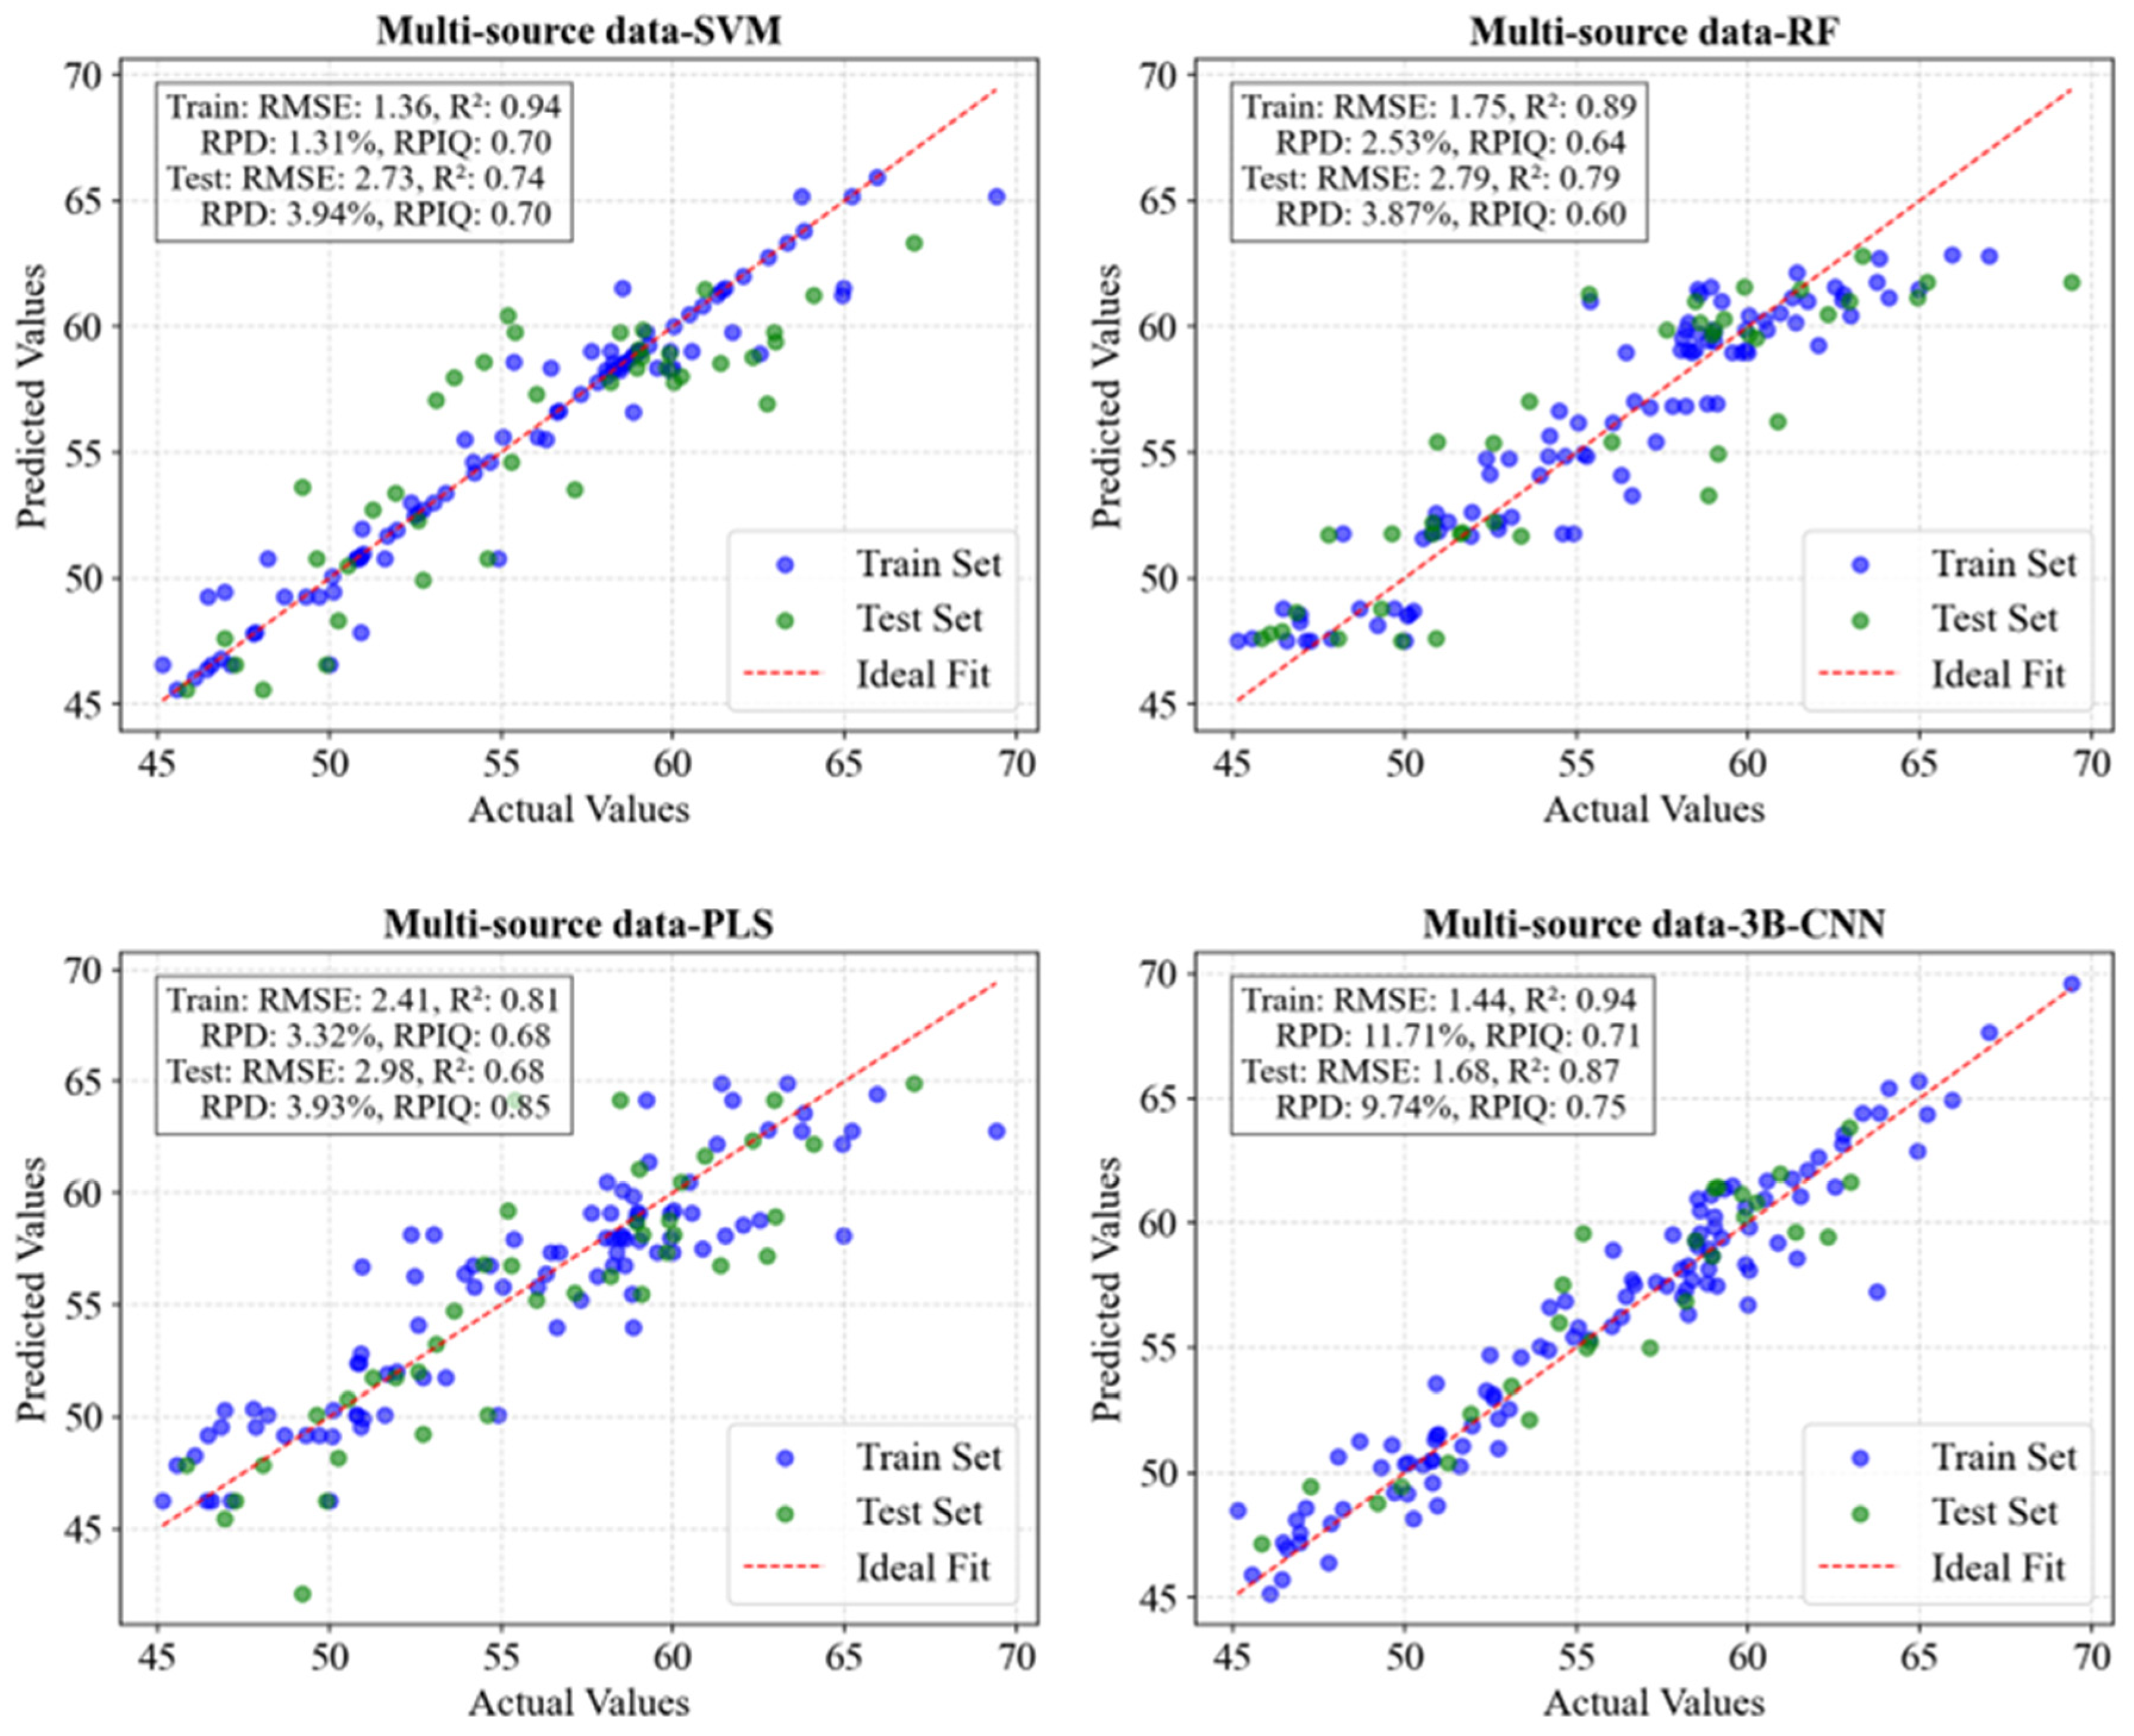
3.3. The SOM Content Prediction Model Based on Multi-Source Data

Changes in SOM content have a substantial influence on both the physical and spectral properties of soil. As SOM increases, soil darkens due to higher humus content, and porosity tends to rise as organic matter contributes to improved soil structure. These characteristics can be effectively detected using high-resolution imagery, enabling accurate assessment of SOM-related variations [12]. This study explores multi-source information input (spectral, texture, and color features) for SOM modeling by constructing an inversion model and evaluating various models, including SVM, RF, PLS, and 3B-CNN. Results are shown in Figure 10.
As shown in Figure 10, the performance of different models in predicting SOM content using multi-source data varies. Among the four models, the CCM-3B-CNN achieved the best prediction results, with an R2 value of 0.87 on the validation set, significantly higher than those of the other models, and an RMSE of only 1.68, indicating the lowest prediction error. This demonstrates that the 3B CNN model can more effectively capture the multidimensional information from soil spectral, texture, and color features and leverage the correlations between multi-source data to improve prediction accuracy. In contrast, the CCM-RF and CCM-SVM models, after integrating multi-source data, achieved R2 values of 0.79 and 0.74, with the RMSE values of 2.79 and 2.73, respectively. Although these models showed improvements compared to the CCM-PLS model, their performance still fell short of the 3B CNN model. This indicates that, in the context of multi-source data fusion, deep learning methods exhibit stronger predictive capabilities compared to traditional machine learning models.
The results indicate that the introduction of multi-source information significantly enhances the predictive performance of all models, particularly the 3B-CNN model, which showed the best performance in capturing nonlinear features and multidimensional data correlations, with much higher prediction accuracy compared to the other models. In contrast, while SVM, RF, and PLS showed some improvements after incorporating multi-source information, their performance was still inferior to that of the 3B-CNN model. This demonstrates that multi-source information fusion has high application potential in SOM content prediction, especially when used in deep learning models.
As shown in Figure 11, the bar chart illustrates the importance of spectral, texture, and color features in the CCM-3B-CNN model. The chart is based on the L2 norm of the convolutional layer weights for each feature branch, with a larger L2 norm indicating a greater contribution of that feature to the model. The results show that spectral features contribute the most to the prediction, followed by texture and color features. This reflects the dominant role of spectral data in providing insights into soil characteristics, while texture and color serve a supportive role. By analyzing feature importance, it is evident that the model effectively utilizes the correlations between these features to improve prediction accuracy, further validating the significance of multi-source data fusion in soil organic matter prediction. However, the impact of combining different features on model performance may vary, which is a potential direction for future research. Due to space constraints, this will not be discussed further here.

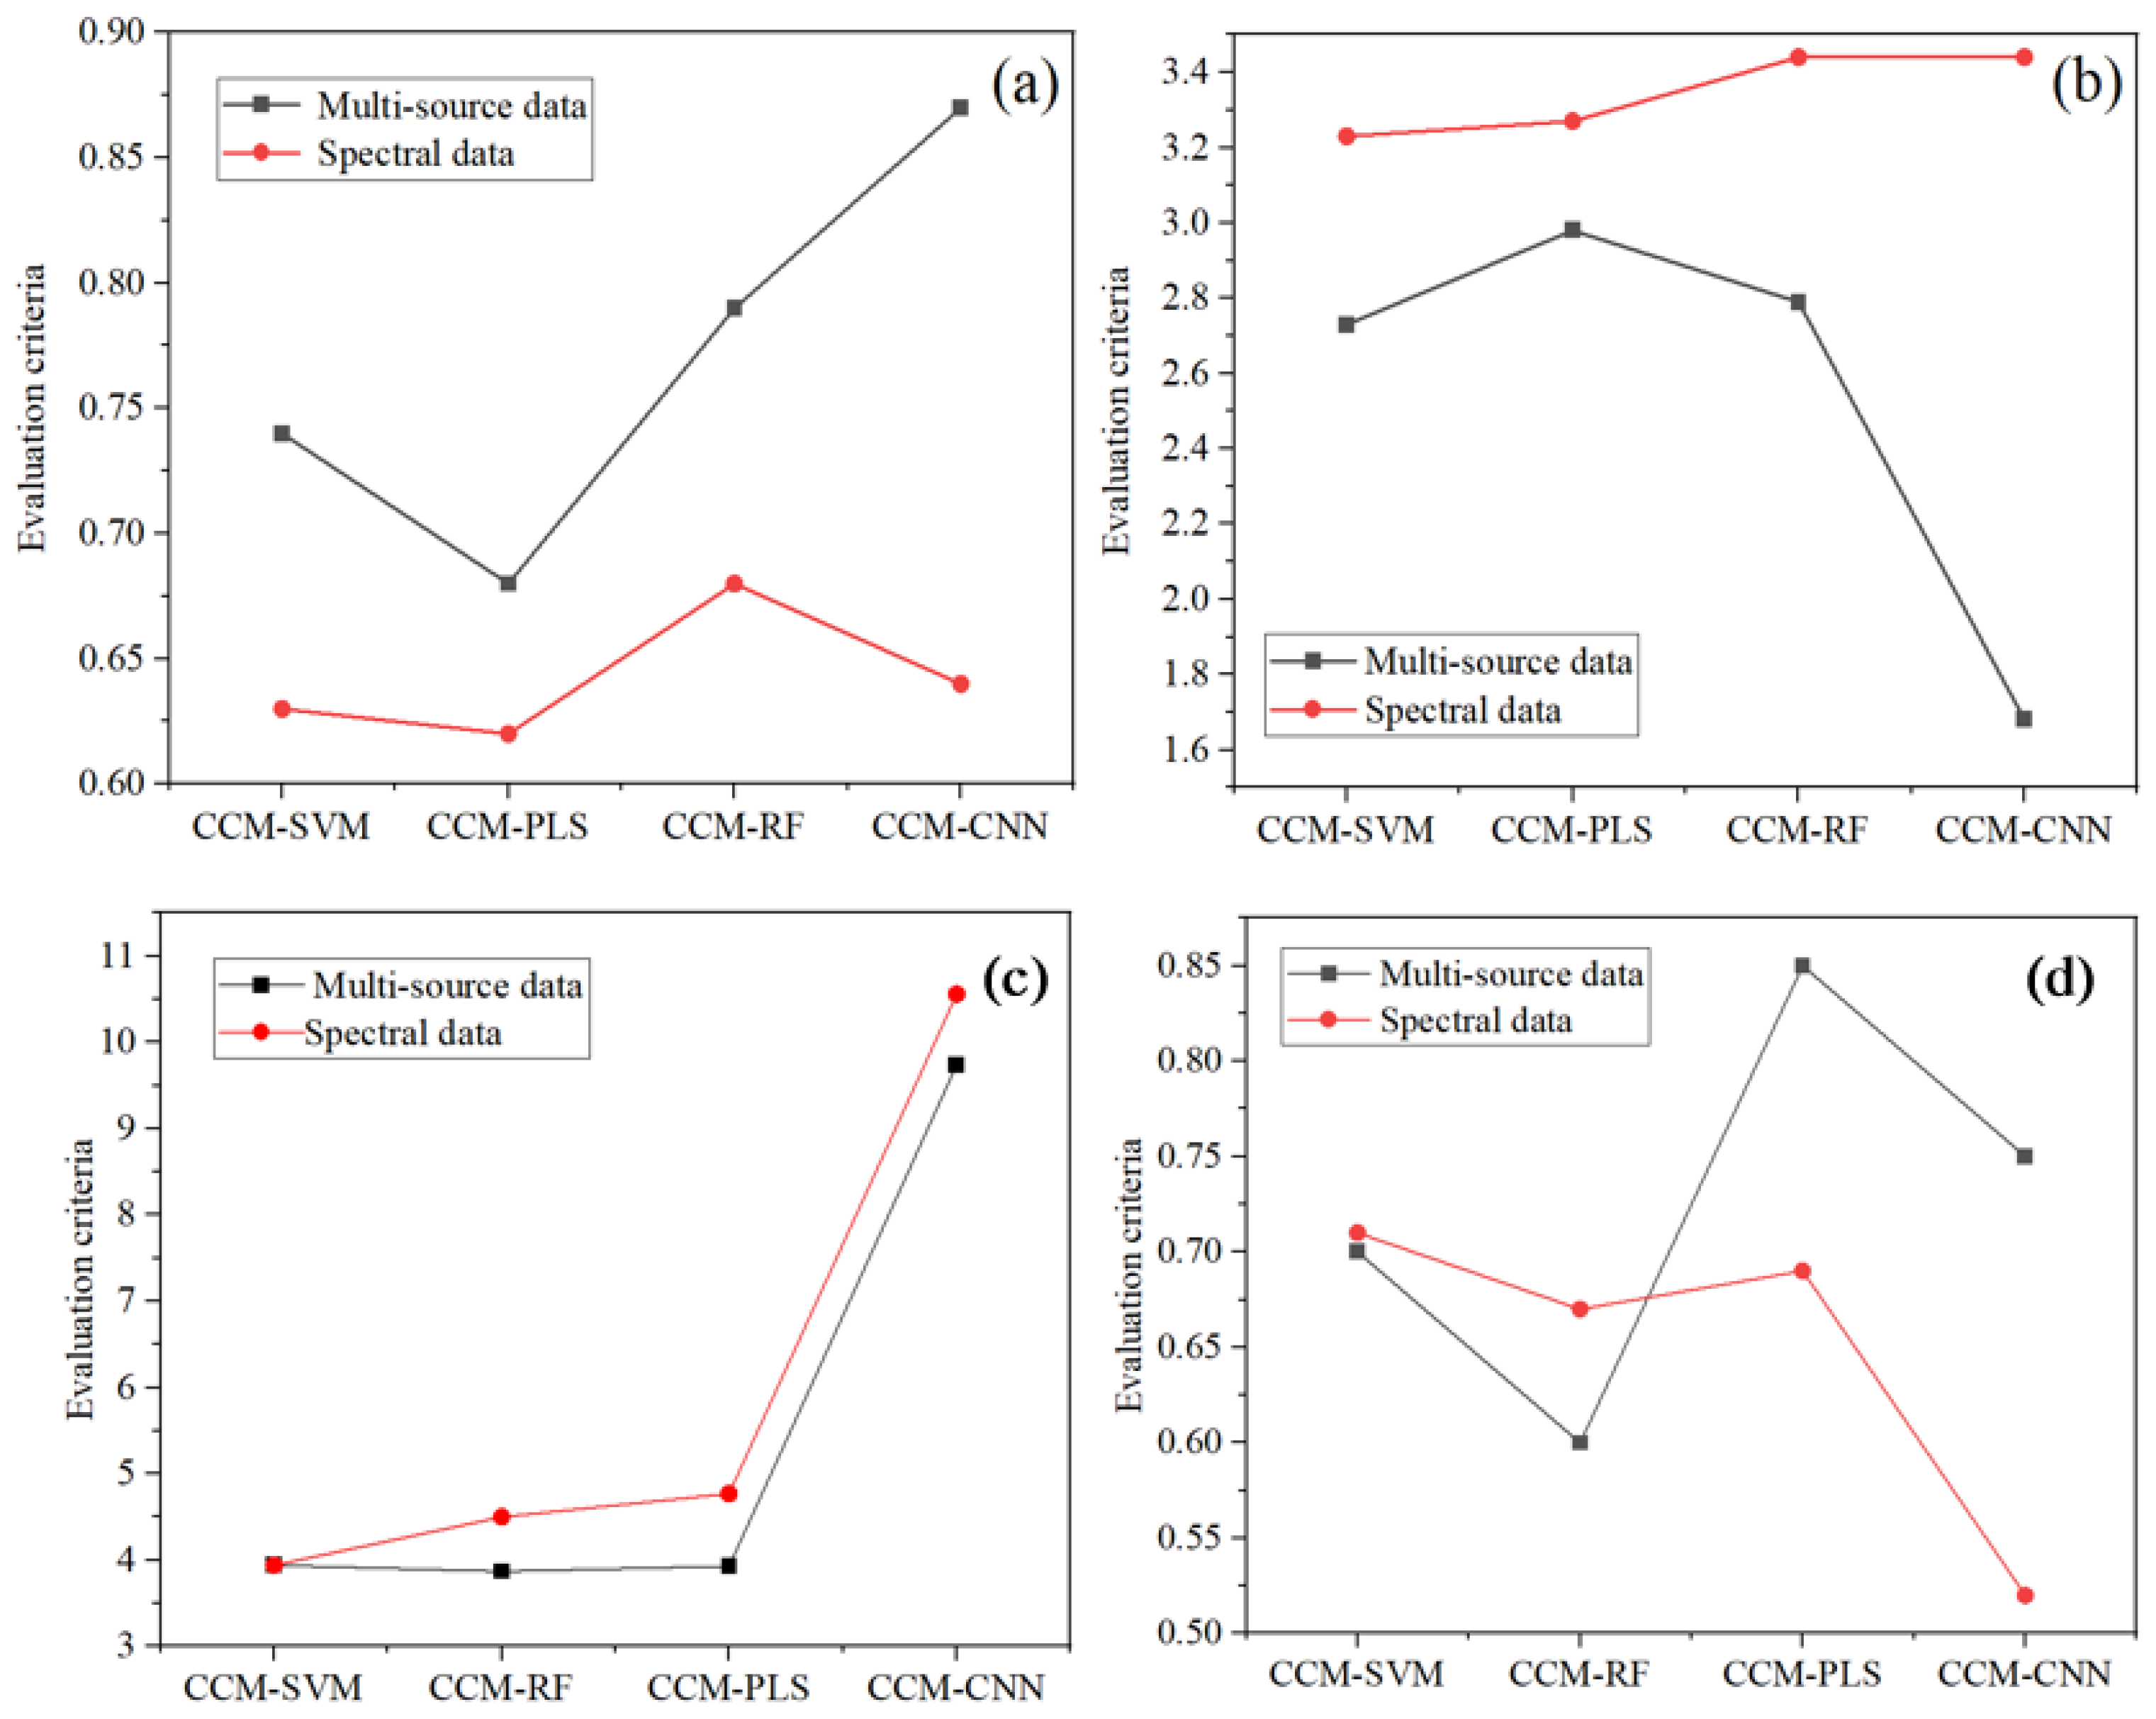
3.4. Comparison of the Results Between Spectral Input and Multi-Source Data Input

When only spectral information was used as input, the regression results obtained using the CCM dimensionality reduction method were the best. Therefore, the CCM was used as the preprocessing method for spectral data, serving as the basis for comparing the regression model results between spectral-only input and multi-source data input.
From Figure 12a, It can be observed that while the CCM-CNN model performed relatively well in terms of R2 when using only spectral data as input, its overall predictive performance remained limited. However, after introducing multi-source data (spectral, texture, and color), the R2 values of all models significantly improved, especially for the CCM-CNN model, which achieved the highest R2 value, indicating a higher fit for predicting SOM content. This result demonstrates that multi-source data fusion significantly enhances the model’s ability to represent soil characteristics and improves prediction accuracy.
In Figure 12b, the RMSE comparison further validates the advantage of multi-source data fusion. When using only spectral data, the RMSE values of all models were relatively high, particularly for the CCM-RF and CCM-PLS models, which showed noticeable errors. After introducing multi-source data, the RMSE values of all models decreased with different degrees. The CCM-CNN model showing the lowest RMSE, indicating better stability and accuracy in predicting SOM content.
In Figure 12c, the RPD comparison illustrates the improvement in model stability and generalizability when incorporating multi-source data. Across all models, RPD values increased after integrating spectral, texture, and color features, indicating that the models gained stronger predictive robustness. The CCM-CNN model exhibited the highest RPD under the multi-source configuration, reflecting its superior capability in capturing the variability of SOM content with enhanced model stability and generalization performance.
In Figure 12d, RPIQ values offer further evidence of prediction reliability across different models. While models using only spectral data maintained relatively consistent but lower RPIQ scores, introducing multi-source inputs led to a substantial rise in RPIQ for most models—most notably for the CCM-PLS model. However, the CCM-CNN model showed a slight decline in RPIQ, which may reflect a trade-off between interval concentration and prediction range. Overall, multi-source input tends to enhance the confidence and effectiveness of SOM content prediction in most models
Overall, the introduction of multi-source data significantly enhanced the predictive performance of all models. The increase in R2 and the decrease in RMSE indicate that multi-source data fusion—by integrating spectral proxies of chemical composition with physical features such as texture and color—provides a more comprehensive representation of soil properties, thereby improving model accuracy. Furthermore, improvements in RPD and RPIQ further demonstrate the positive effect of data fusion on enhancing model stability and the reliability of prediction intervals. The advantages of multi-source data were particularly pronounced in the three-branch CNN model, highlighting CNN’s superiority in handling complex and high-dimensional data features.

4. Discussion

4.1. Impact of Multi-Source Data Fusion on Soil Organic Matter Prediction

Spectral data, due to its efficiency and non-destructive nature, has long been widely used for predicting soil properties. In recent years, extensive research has been conducted on using spectral methods to estimate SOM content. Numerous scholars have explored various combinations of data processing techniques and models, with regression model R2 values ranging from 0.6 to 0.8. For example, Gmur et al. applied regression trees to various soil types and achieved R2 values ranging from 0.60 to 0.80 [42]. Hong et al. utilized extreme learning machines (ELMs) combined with correlation coefficient analysis on homogeneous soils, obtaining R2 values between 0.72 and 0.78 [43]. Similarly, Xu et al. employed multivariate regression methods for predicting SOM content in paddy soils, reporting R2 values from 0.60 to 0.78 [44]. In comparison, this study used the CCM for spectral dimensionality reduction, but the prediction accuracy remained relatively low, with R2 values ranging from 0.64 to 0.68. While these results are within a similar range to those reported by Gmur et al., the slight differences are likely due to variations in soil heterogeneity or spectral preprocessing methods. This highlights that a single source of information is insufficient to fully capture the complexity of soil properties. Relying solely on spectral data clearly has limitations, as its predictive accuracy often overlooks the influence of soil physical properties, such as texture and color. As demonstrated in the study by [45], combining spectral data with other variables, such as soil texture and specific elemental characteristics, can improve prediction accuracy and model robustness. This emphasizes the necessity of integrating multiple data sources to achieve reliable soil property assessments.
In this study, the 3B-CNN model achieved deep fusion of multi-source features through trilinear pooling. By integrating spectral, texture, and color features, the 3B-CNN model achieved high-precision predictions on the validation set, with an R2 of 0.87 and an RMSE of 1.68, significantly superior to traditional methods relying on a single data source (R2 ranging from 0.6 to 0.8). This indicates that multi-source data fusion can overcome the limitations of insufficient single-feature information, providing a more comprehensive representation for SOM prediction.
Although this study achieved deep fusion of multi-source data through the 3B-CNN model and obtained high accuracy in SOM prediction (R2 reaching 0.87 and RMSE at 1.68), significantly outperforming traditional single data source methods (R2 ranging from 0.6 to 0.8), certain limitations remain compared to other studies. For instance, Rosero-Vlasova et al., in their research on soils from wildfire burns and cropland abandonment in Aragón Province, Spain, employed Correlated Component Regression (CCR) combined with visible–near infrared–shortwave infrared spectroscopy to predict SOM, achieving R2 values ranging from 0.70 to 0.87, demonstrating advantages in model simplification and accuracy enhancement [46]. Additionally, [47] applied Back Propagation Neural Networks (BPNNs) in combination with Continuous Wavelet Transform (CWT) and other spectral preprocessing methods for predicting SOC in soils from the Bosten Lake oasis in Xinjiang, achieving higher R2 values (0.82 to 0.86), highlighting the potential in optimizing multi-dimensional spectral parameters. Compared to these studies, the model in this research, while excelling in multi-source feature integration, still requires further validation in terms of applicability and generalization to complex soil types or broader regional environments. Moreover, compared to neural network-based approaches that integrate multimodal techniques, the 3B-CNN model may encounter limitations in computational efficiency and model complexity, particularly when processing high-dimensional data. These challenges highlight potential areas for future optimization and enhancement. Future work could explore model pruning or lightweight CNN architectures to reduce computational demands.
Although the model achieved good predictive accuracy by integrating multi-source information, the generalizability of the current results, particularly its applicability across different regions, soil types, and climatic conditions, has not been fully explored. The model’s performance may vary in different environments. Future research should validate the model under diverse conditions to ensure its broad applicability. Additionally, the regional and climatic characteristics of the dataset may affect its global applicability, so further validation is needed across various regions and soil types.

4.2. Effectiveness of Spectral Band Selection Methods

Spectral band selection is crucial for improving the efficiency and accuracy of SOM prediction models. There is no uniform standard for spectral reflectance preprocessing [48]. This study compared three band selection methods—CCM, SPA, and the Boruta algorithm—and applied them to models such as SVM, RF, and PLS to evaluate their effectiveness in dimensionality reduction and extracting key features. The results demonstrated that CCM outperformed all other feature selection methods across the tested models. Its advantage lies in quantifying the correlation between individual spectral bands and SOM content, enabling the identification of the most representative features. By selecting bands with the highest correlation coefficients, CCM effectively eliminates redundant information while preserving features most sensitive to SOM variation, thereby enhancing predictive accuracy and reducing computational complexity. In this study, using CCM to reduce the number of bands from 260 to 15 markedly improved model efficiency. In comparison, although SPA addresses multicollinearity, its forward selection strategy may overlook subtle and nonlinear interactions among spectral bands, leading to suboptimal feature subsets. Meanwhile, Boruta, despite its ability to rank feature importance, tends to retain a large number of marginally relevant bands, which increases feature dimensionality, introduces noise, and ultimately reduces model performance.
However, there are some limitations in this study. The effectiveness of CCM may be influenced by soil type, spectral characteristics, and environmental factors, particularly when the relationship between spectral features and SOM content is complex or nonlinear. Future research could explore combining CCM with specific algorithms, such as genetic algorithms or recursive feature elimination, or applying advanced deep learning methods to further improve model accuracy and robustness. Additionally, the dataset used in this study may have regional and climatic characteristics, making the results less applicable in other regions or with different soil types. Therefore, future studies should validate the proposed band selection methods in diverse geographic regions and soil types to ensure their broad applicability. Finally, while band selection significantly improves model efficiency and accuracy, how to integrate this method with other spectral data preprocessing techniques, sensor fusion, and big data analysis in practical applications remains an area for further exploration.
In conclusion, this study emphasizes the importance of selecting appropriate band selection methods for different datasets and tasks. The excellent performance of CCM demonstrates its suitability for extracting key features from high-dimensional spectral data. Future research could explore hybrid approaches to combine the strengths of multiple selection algorithms, further enhancing performance and facilitating the rapid processing of high-dimensional data and multimodal fusion.

5. Conclusions

The content of SOM (soil organic matter) is a critical indicator of soil health, agricultural productivity, and carbon cycling. Traditional SOM measurement methods are complex, time-consuming, and destructive, making them unsuitable for the rapid, non-destructive analysis required in modern agriculture. The innovative contribution of this study lies in the proposed multi-source data fusion approach, which combines spectral data, texture features, and color features, significantly enhancing the accuracy of SOM prediction. Compared to previous studies that relied primarily on a single data source, we are the first to apply a trilinear pooling method within the three-branch convolutional neural network (3B-CNN) framework to fuse multi-source features. This approach more effectively captures high-order interaction features between different data sources, optimizing the model’s feature representation capability. Moreover, the accuracy of SOM prediction has been significantly improved with this model, as evidenced by an R2 of 0.87 and an RMSE of 1.68 on the validation set, surpassing traditional methods such as SVM, RF, and PLS. This innovative approach provides new technological support for soil health assessment and precision agriculture, fully demonstrating the advantages of multi-source data fusion. The main conclusions of this study are as follows:
  • Compared with SPA and Boruta methods, the CCM performed best in selecting sensitive bands highly correlated with SOM. It effectively removed redundant information while retaining key features, achieving a maximum prediction accuracy of R2 = 0.68 in the random forest model.
  • Compared with single-source inputs, multi-source data fusion significantly improved the prediction accuracy of traditional machine learning models such as SVM and RF. For instance, after incorporating multi-source data, the R2 values of the CCM-SVM and CCM-RF models increased to 0.74 and 0.79, respectively.
  • By combining spectral, texture, and color features, the 3B-CNN model achieved a prediction accuracy of R2 = 0.87 and RMSE = 1.68 on the validation set, significantly outperforming traditional models such as SVM, RF, and PLS. This high accuracy enables rapid, non-destructive SOM monitoring for precision agriculture and land management.
However, it is important to note that multi-source data fusion has certain limitations. Due to the need for samples to undergo various technical testing methods, the frequency of data fusion remains low. This may affect the feasibility and efficiency of its large-scale application. In practical applications, overcoming this limitation to ensure the efficiency and usability of multi-source data fusion will be a key challenge for future research.
In conclusion, this study validated the effectiveness of multi-source data fusion and the 3B-CNN model in SOM prediction, providing technical support for soil health assessment, soil degradation monitoring, and sustainable agricultural management. Future research can further optimize the computational complexity of deep learning models and expand the dataset to validate the model’s applicability across more diverse soil types and regions.

Author Contributions

Conceptualization, L.G. and Q.G.; methodology, Q.G. and M.Z.; software, P.C.; validation, P.H., L.L., D.D. and C.L.; formal analysis, M.Z.; investigation, M.K.; resources, L.L.; data curation, P.H.; writing—review and editing, L.G., F.C.M. and Q.G.; visualization, Q.G.; supervision, J.Q.; project administration, J.Q.; funding acquisition, J.Q. and L.G. All authors have read and agreed to the published version of the manuscript.

Funding

This study was supported by the National Natural Science Foundation of China (Grant No. U23A6001) and the Research Foundation of Science and Technology Department of Jilin Province (Grant No. 20240304017SF), which provided funding to support fieldwork, hyperspectral imaging equipment, and data analysis. We thank each of the editors and anonymous reviewers for their insightful comments.

Institutional Review Board Statement

Not applicable.

Data Availability Statement

The raw data supporting the conclusions of this article will be made available by the authors on request.

Conflicts of Interest

The authors Dong Ding and Changcheng Liu are both from Changchun Hyperspectral Imaging Technology Co., Ltd., where Dong Ding serves as the General Manager and Changcheng Liu serves as the Sales Manager. All authors declare no conflicts of interest.

References

  1. Liu, X.B.; Zhang, X.Y.; Wang, Y.X.; Sui, Y.Y.; Zhang, S.L.; Herbert, S.J.; Ding, G. Soil degradation: A problem threatening the sustainable development of agriculture in Northeast China. Plant Soil Environ. 2010, 56, 87–97. [Google Scholar] [CrossRef]
  2. Wang, D.D.; Chakraborty, S.; Weindorf, D.C.; Li, B.; Sharma, A.; Paul, S.; Ali, M.N. Synthesized use of VisNIR DRS and PXRF for soil characterization: Total carbon and total nitrogen. Geoderma 2015, 243, 157–167. [Google Scholar] [CrossRef]
  3. Luo, Z.K.; Wang, E.L.; Sun, O.J. Soil carbon change and its responses to agricultural practices in Australian agro-ecosystems: A review and synthesis. Geoderma 2010, 155, 211–223. [Google Scholar] [CrossRef]
  4. Guo, L.; Zhang, H.; Shi, T.; Chen, Y.; Jiang, Q.; Linderman, M. Prediction of soil organic carbon stock by laboratory spectral data and airborne hyperspectral images. Geoderma 2019, 337, 32–41. [Google Scholar] [CrossRef]
  5. Meersmans, J.; Van Wesemael, B.; Van Molle, M. Determining soil organic carbon for agricultural soils: A comparison between the Walkley & Black and the dry combustion methods (north Belgium). Soil Use Manag. 2009, 25, 346–353. [Google Scholar]
  6. Wielopolski, L.; Chatterjee, A.; Mitra, S.; Lal, R. In situ determination of Soil carbon pool by inelastic neutron scattering: Comparison with dry combustion. Geoderma 2011, 160, 394–399. [Google Scholar] [CrossRef]
  7. Beltrame, K.K.; Souza, A.M.; Coelho, M.R.; Winkler, T.C.B.; Souza, W.E.; Valderrama, P. Soil Organic Carbon Determination Using NIRS: Evaluation of Dichromate Oxidation and Dry Combustion Analysis as Reference Methods in Multivariate Calibration. J. Braz. Chem. Soc. 2016, 27, 1527–1532. [Google Scholar] [CrossRef]
  8. Senesi, G.S.; Senesi, N. Laser-induced breakdown spectroscopy (LIBS) to measure quantitatively soil carbon with emphasis on soil organic carbon. A review. Anal. Chim. Acta 2016, 938, 7–17. [Google Scholar] [CrossRef]
  9. Shi, Z.; Ji, W.; Viscarra Rossel, R.A.; Chen, S.; Zhou, Y. Prediction of soil organic matter using a spatially constrained local partial least squares regression and the Chinese vis-NIR spectral library. Eur. J. Soil Sci. 2015, 66, 679–687. [Google Scholar] [CrossRef]
  10. Meng, X.T.; Bao, Y.L.; Wang, Y.; Zhang, X.L.; Liu, H.J. An advanced soil organic carbon content prediction model via fused temporal-spatial-spectral (TSS) information based on machine learning and deep learning algorithms. Remote. Sens. Environ. 2022, 280, 113166. [Google Scholar] [CrossRef]
  11. Song, H.F.; Yang, W.W.; Dai, S.S.; Yuan, H.Y. Multi-source remote sensing image classification based on two-channel densely connected convolutional networks. Math. Biosci. Eng. 2020, 17, 7353–7377. [Google Scholar] [CrossRef] [PubMed]
  12. Alirezazadeh, P.; Rahimi-Ajdadi, F.; Abbaspour-Gilandeh, Y.; Landwehr, N.; Tavakoli, H. Improved digital image-based assessment of soil aggregate size by applying convolutional neural networks. Comput. Electron. Agric. 2021, 191, 106499. [Google Scholar] [CrossRef]
  13. Swetha, R.K.; Dasgupta, S.; Chakraborty, S.; Li, B.; Weindorf, D.C.; Mancini, M.; Silva, S.H.G.; Ribeiro, B.T.; Curi, N.; Ray, D.P. Using Nix color sensor and Munsell soil color variables to classify contrasting soil types and predict soil organic carbon in Eastern India. Comput. Electron. Agric. 2022, 199, 107192. [Google Scholar] [CrossRef]
  14. Yang, J.W.; Shen, F.L.; Wang, T.W.; Luo, M.Y.; Li, N.; Que, S.X. Effect of smart phone cameras on color-based prediction of soil organic matter content. Geoderma 2021, 402, 115365. [Google Scholar] [CrossRef]
  15. Costa, J.J.F.; Giasson, É.; da Silva, E.B.; Coblinski, J.A.; Tiecher, T. Use of color parameters in the grouping of soil samples produces more accurate predictions of soil texture and soil organic carbon. Comput. Electron. Agric. 2020, 177, 105710. [Google Scholar] [CrossRef]
  16. Ng, W.; Minasny, B.; Montazerolghaem, M.; Padarian, J.; Ferguson, R.; Bailey, S.; McBratney, A.B. Convolutional neural network for simultaneous prediction of several soil properties using visible/near-infrared, mid-infrared, and their combined spectra. Geoderma 2019, 352, 251–267. [Google Scholar] [CrossRef]
  17. Wu, C.; Yang, Y.; Xia, J. A simple digital imaging method for estimating black-soil organic matter under visible spectrum. Arch. Agron. Soil Sci. 2017, 63, 1346–1354. [Google Scholar] [CrossRef]
  18. Wang, W.C.; Yang, W.; Zhou, P.; Cui, Y.L.; Wang, D.; Li, M.Z. Development and performance test of a vehicle-mounted total nitrogen content prediction system based on the fusion of near-infrared spectroscopy and image information. Comput. Electron. Agric. 2022, 192, 106613. [Google Scholar] [CrossRef]
  19. Liu, X.; Jiao, L.C.; Li, L.L.; Tang, X.; Guo, Y.W. Deep multi-level fusion network for multi-source image pixel-wise classification. Knowl.-Based Syst. 2021, 221, 106921. [Google Scholar] [CrossRef]
  20. Pei, Y.F.; Zuo, Z.T.; Zhang, Q.Z.; Wang, Y.Z. Data Fusion of Fourier Transform Mid-Infrared (MIR) and Near-Infrared (NIR) Spectroscopies to Identify Geographical Origin of Wild Paris polyphylla var. yunnanensis. Molecules 2019, 24, 2559. [Google Scholar] [CrossRef]
  21. Cao, Q.; Zhong, Y.F.; Ma, A.L.; Zhang, L.P. Urban Land Use/Land Cover Classification Based on Feature Fusion Fusing Hyperspect Image And Lidar Data. In Proceedings of the 38th IEEE International Geoscience and Remote Sensing Symposium (IGARSS), Valencia, Spain, 22–27 July 2018. [Google Scholar]
  22. Zhu, Y.X.; Li, W.; Zhang, M.M.; Pang, Y.; Tao, R.; Du, Q. Joint feature extraction for multi-source data using similar double-concentrated network. Neurocomputing 2021, 450, 70–79. [Google Scholar] [CrossRef]
  23. Li, K.; Zhang, W.; Yu, D.; Tian, X. HyperNet: A deep network for hyperspectral, multispectral, and panchromatic image fusion. ISPRS J. Photogramm. Remote. Sens. 2022, 188, 30–44. [Google Scholar] [CrossRef]
  24. Vivone, G. Multispectral and hyperspectral image fusion in remote sensing: A survey. Inf. Fusion 2023, 89, 405–417. [Google Scholar] [CrossRef]
  25. Du, Z.B.; Gao, B.B.; Ou, C.; Du, Z.R.; Yang, J.Y.; Bayartungalag, B.; Battogtokh, D.; Wenju, Y.; Zhu, D.H. A Quantitative Analysis of Factors Influencing Organic Matter Concentration in the Topsoil of Black Soil in Northeast China Based on Spatial Heterogeneous Patterns. ISPRS Int. J. Geo-Inf. 2021, 10, 348. [Google Scholar] [CrossRef]
  26. Tang, H.Z.; Zhang, Y.Y.; Liu, Q.; Guo, M.Y.; Niu, J.C.; Xia, Q.Y.; Liang, M.Y.; Liu, Y.J.; Huang, Y.F.; Du, Y.M. Comprehensive evaluation of cultivated land quality in black soil of Northeast China: Emphasizing functional diversity and risk management. Appl. Sci. 2025, 15, 3753. [Google Scholar] [CrossRef]
  27. Heilongjiang Provincial Department of Ecology and Environment. Environmental Status Bulletin; Heilongjiang Provincial Department of Ecology and Environment: Dandong, China, 2024. [Google Scholar]
  28. China Meteorological Administration. National Surface Climate Data Yearbook; China Meteorological Administration: Beijing, China, 2024. [Google Scholar]
  29. Zhang, C.; Li, G.; Du, S. Multi-Scale Dense Networks for Hyperspectral Remote Sensing Image Classification. IEEE Trans. Geosci. Remote Sens. 2019, 57, 9201–9222. [Google Scholar] [CrossRef]
  30. Song, W.W.; Li, S.T.; Fang, L.Y.; Lu, T. Hyperspectral Image Classification With Deep Feature Fusion Network. IEEE Trans. Geosci. Remote Sens. 2018, 56, 3173–3184. [Google Scholar] [CrossRef]
  31. Liu, Y.; Feng, H.K.; Yue, J.B.; Jin, X.L.; Li, Z.H.; Yang, G.J. Estimation of potato above-ground biomass based on unmanned aerial vehicle red-green-blue images with different texture features and crop height. Front. Plant Sci. 2022, 13, 938216. [Google Scholar] [CrossRef]
  32. Zhang, X.W.; Zhang, K.F.; Sun, Y.Q.; Zhao, Y.D.; Zhuang, H.F.; Ban, W.; Chen, Y.; Fu, E.J.; Chen, S.; Liu, J.X.; et al. Combining Spectral and Texture Features of UAS-Based Multispectral Images for Maize Leaf Area Index Estimation. Remote. Sens. 2022, 14, 331. [Google Scholar]
  33. Park, Y.; Guldmann, J.-M. Measuring continuous landscape patterns with Gray-Level Co-Occurrence Matrix (GLCM) indices: An alternative to patch metrics? Ecol. Indic. 2020, 109, 105802. [Google Scholar] [CrossRef]
  34. Zhou, W.; Xiao, J.Y.; Li, H.R.; Chen, Q.; Wang, T.; Wang, Q.; Yue, T.X. Soil organic matter content prediction using Vis-NIRS based on different wavelength optimization algorithms and inversion models. J. Soils Sediments 2023, 23, 2506–2517. [Google Scholar] [CrossRef]
  35. Wang, R.; Tuerxun, N.; Zheng, J. Improved estimation of SPAD values in walnut leaves by combining spectral, texture, and structural information from UAV-based multispectral image. Sci. Hortic. 2024, 328, 112940. [Google Scholar] [CrossRef]
  36. Araújo, M.C.U.; Saldanha, T.C.B.; Galvão, R.K.H.; Yoneyama, T.; Chame, H.C.; Visani, V. The successive projections algorithm for variable selection in spectroscopic multicomponent analysis. Chemom. Intell. Lab. Syst. 2001, 57, 65–73. [Google Scholar] [CrossRef]
  37. Huang, R.B.; Hanif, M.F.; Siddiqui, M.K.; Hanif, M.F.; Petros, F.B. Analyzing boron oxide networks through Shannon entropy and Pearson correlation coefficient. Sci. Rep. 2024, 14, 26552. [Google Scholar] [CrossRef]
  38. Melgani, F.; Bruzzone, L. Classification of hyperspectral remote sensing images with support vector machines. IEEE Trans. Geosci. Remote. Sens. 2004, 42, 1778–1790. [Google Scholar] [CrossRef]
  39. Jones, B.K.; Hastie, T. Partial least squares prediction in high-dimensional regression. Ann. Statist. 2019, 47, 871–904. [Google Scholar]
  40. Rokach, L. Decision forest: Twenty years of research. Inf. Fusion 2016, 27, 111–125. [Google Scholar] [CrossRef]
  41. He, K.M.; Zhang, X.G.; Ren, S.Q.; Sun, J. Delving Deep into Rectifiers: Surpassing Human-Level Performance on ImageNet Classification. In Proceedings of the IEEE International Conference on Computer Vision, Santiago, Chile, 11–18 December 2015. [Google Scholar]
  42. Gmur, S.; Vogt, D.; Zabowski, D.; Moskal, L.M. Hyperspectral Analysis of Soil Nitrogen, Carbon, Carbonate, and Organic Matter Using Regression Trees. Sensors 2012, 12, 10639–10658. [Google Scholar] [CrossRef]
  43. Hong, Y.S.; Chen, S.C.; Zhang, Y.; Chen, Y.Y.; Yu, L.; Liu, Y.F.; Liu, Y.L.; Cheng, H.; Liu, Y. Rapid identification of soil organic matter level via visible and near-infrared spectroscopy: Effects of two-dimensional correlation coefficient and extreme learning machine. Sci. Total Environ. 2018, 644, 1232–1243. [Google Scholar] [CrossRef]
  44. Xu, S.X.; Zhao, Y.C.; Wang, M.Y.; Shi, X.Z. Comparison of multivariate methods for estimating selected soil properties from intact soil cores of paddy fields by Vis-NIR spectroscopy. Geoderma 2018, 310, 29–43. [Google Scholar] [CrossRef]
  45. Guedes, W.N.; Babos, D.V.; Costa, V.C.; Morais, C.P.; Freitas, V.S.; Stenio, K.; Xavier, A.A.P.; Borduchi, L.C.L.; Villas-Boas, P.R.; Milori, D.M.B.P. Evaluation of univariate and multivariate calibration strategies for the direct determination of total carbon in soils by laser-induced breakdown spectroscopy: Tutorial. J. Opt. Soc. Am. B 2023, 40, 1319–1330. [Google Scholar] [CrossRef]
  46. Rosero-Vlasova, O.A.; Vlassova, L.; Pérez-Cabello, F.; Montorio, R.; Nadal-Romero, E. Soil organic matter and texture estimation from visible-near infrared-shortwave infrared spectra in areas of land cover changes using correlated component regression. Land Degrad. Dev. 2019, 30, 544–560. [Google Scholar] [CrossRef]
  47. Yang, J.X.; Li, X.G.; Ma, X.F.; Ge, X.Y. Potential of Hyperspectral Data Combined with Optimal Band Combination Algorithm for Estimating Soil Organic Carbon Content in Lakeside Oasis. Land Degrad. Dev. 2024, 35, 5874–5885. [Google Scholar] [CrossRef]
  48. Vašát, R.; Kodešová, R.; Klement, A.; Borůvka, L. Simple but efficient signal pre-processing in soil organic carbon spectroscopic estimation. Geoderma 2017, 298, 46–53. [Google Scholar] [CrossRef]
Figure 1. Sampling area location.
Agriculture 15 01313 g001
Figure 2. Diagram showing the process of spectral data extraction and soil image acquisition. (The colored lines in the figure represent the spectral reflectance of different soil samples, with each line corresponding to one soil sample).
Agriculture 15 01313 g002
Figure 3. Illustration of soil texture feature extraction at multiple scales using GLCM.
Agriculture 15 01313 g003
Figure 4. Architecture of the three-branch CNN model integrating spectral, texture, and color features for SOM prediction. (The colored lines in the figure represent the spectral reflectance of different soil samples, with each line corresponding to one soil sample).
Agriculture 15 01313 g004
Figure 5. Flowchart of the 3B-CNN modeling process for SOM prediction, including data preparation, feature extraction, and model training. (The green part in the figure represents the input information, the yellow part represents the 3B-CNN module, and the blue part represents other processes).
Agriculture 15 01313 g005
Figure 6. Soil sample information: (a) statistical analysis of organic matter content; (b) spectral reflectance of soil samples. (The colored lines in the figure represent the spectral reflectance of different soil samples, with each line corresponding to one soil sample).
Agriculture 15 01313 g006
Figure 7. Heatmap showing correlations among GLCM-derived texture features for soil samples. C (contrast); E (energy); En (entropy); H (homogeneity); Co (correlation); ASM (angular second moment).
Agriculture 15 01313 g007
Figure 8. Histograms of color features (mean, standard deviation, skewness, kurtosis) for RGB channels in soil images.
Agriculture 15 01313 g008
Figure 9. Fitting results of SVM, RF, PLS, and 1D-CNN models using CCM, SPA, and Boruta-selected spectral data.
Agriculture 15 01313 g009
Figure 10. Fitting results of SVM, RF, PLS, and 3B-CNN models using multi-source (spectral, texture, color) data.
Agriculture 15 01313 g010
Figure 11. Feature Importance of Spectral, Texture, and Color Features for SOM Pre diction.
Agriculture 15 01313 g011
Figure 12. Comparison of R2 (a), RMSE (b), RPD (c), and RPIQ (d) performance of SVM, RF, PLS, and CNN models using spectral-only versus multi-source inputs.
Agriculture 15 01313 g012
Table 1. Calculation formulas related to texture feature parameters.
Texture FeatureFormulaExplanation of VariablesMeanings
Contrast C = i , j ( i j ) 2 P ( i , j ) i , j : gray-level indices; P i , j : probability value at position i , j in the GLCMMeasures gray-level differences, indicating texture roughness.
Energy E = i , j P ( i , j ) 2 P i , j : probability value at position i , j in the GLCMMeasures texture regularity, higher values indicate smoother texture.
Entropy E n = i , j P ( i , j ) l o g P ( i , j ) P i , j : probability value at position i , j in the GLCMMeasures image complexity and uncertainty.
Homogeneity H = i , j P ( i , j ) 1 + ( i j ) 2 P i , j : probability value at position i , j in the GLCM; i , j : gray-level indicesMeasures pixel similarity, higher values indicate uniformity.
Correlation Co = i , j ( i μ x ) ( j μ y ) P ( i , j ) σ x σ y μ x , μ y : means of rows and columns; σ x , σ y : standard deviations; P i , j : joint probability in the GLCMMeasures linear relationship between pixels, higher values indicate stronger correlation.
Angular Second Moment A S M = i , j P ( i , j ) 2 P i , j : probability value at position i , j in the GLCMMeasures uniformity of texture, with higher values indicating more consistent patterns.
Table 2. Calculation formulas related to color feature parameters.
Color FeatureFormulaExplanation of VariablesMeanings
Mean μ c = 1 N i = 1 N I c x i I c x i : intensity of color channel c at pixel x i ; N : total number of pixelsThe average value of the color channel, representing the overall color bias.
Standard Deviation σ c = 1 N i = 1 N I c x i μ c 2 μ c : mean intensity; σ c : standard deviation; I c x i , N : as aboveThe degree of dispersion in the color distribution; the larger the deviation, the greater the variation.
Skewness Skewness c = 1 N σ c 3 i = 1 N I c x i μ c 3 σ c : standard deviation; μ c : mean; I c x i : color intensityThe asymmetry of the color distribution, describing its skewness.
Kurtosis Kurtosis c = 1 N σ c 4 i = 1 N I c x i μ c 4 3 σ c : std dev; μ c : mean intensity; I c x i : intensity; N : pixel countThe sharpness of the color distribution, indicating how concentrated or flat the distribution is.
Table 3. Prediction results of different models for SOM content based on spectral data in the test set.
ModelValidation SetTest Set
R2RMSERPDRPIQR2RMSERPDRPIQ
Boruta-SVM0.703.023.27%0.640.603.373.76%0.69
SPA-SVM0.673.203.72%0.640.633.243.94%0.73
CCM-SVM0.673.183.66%0.640.633.233.94%0.71
Boruta-PLS0.693.074.28%0.620.593.424.44%0.69
SPA-PLS0.693.074.27%0.600.603.384.80%0.66
CCM-PLS0.703.054.18%0.590.623.274.50%0.67
Boruta-RF0.742.713.67%0.720.643.634.91%0.70
SPA-RF0.702.913.90%0.710.673.474.84%0.69
CCM-RF0.702.893.85%0.720.683.444.77%0.69
Boruta-1D CNN0.633.2210.13%0.590.613.5910.69%0.55
SPA-1D CNN0.653.1410.13%0.580.623.5410.73%0.52
CCM-1D CNN0.653.1310.13%0.590.643.4310.56%0.52
Disclaimer/Publisher’s Note: The statements, opinions and data contained in all publications are solely those of the individual author(s) and contributor(s) and not of MDPI and/or the editor(s). MDPI and/or the editor(s) disclaim responsibility for any injury to people or property resulting from any ideas, methods, instructions or products referred to in the content.

