Abstract
Mineral nutrition management in sweet cherry orchards remains a critical challenge due to the lack of site-specific fertilization guidelines, particularly in Greece, a significant cherry-producing country. This study aimed to develop a predictive framework for total nutrient losses in sweet cherry orchards by proposing simplified estimations using fresh fruit yield as the sole input variable. Field experiments were conducted in two orchards with distinct rootstocks (MxM 14 and CAB-6P), analyzing soil properties, leaf nutrient status, and uptake patterns on different plant components. Results indicated that despite differences in soil texture and pH, nutrient availability was generally sufficient, with only Fe and Zn marginally below optimal levels in leaf tissue. Principal Component Analysis (PCA) revealed distinct nutrient distribution patterns, with N evenly distributed across fruits, peduncles, and prunings, while K was concentrated in fruits and peduncles, and Ca and Mg predominantly in fallen leaves. Notably, K was redistributed from leaves to fruits under high yields, evidenced by negative correlations between leaf biomass and K uptake. Strong relationships (r2 > 0.8) were found between fresh fruit yield and uptake of N, P, K, Mg, B, and Cu, enabling reliable predictions of total nutrient losses. Estimated annual nutrient removals were 85.6 kg ha−1 N, 8.94 kg ha−1 P, 42.7 kg ha−1 K, and 12.0 kg ha−1 Mg, with significant fractions retained in prunings and fallen leaves (e.g., 51.8 kg ha−1 N, 6.2 kg ha−1 P). The developed yield-based models provide a practical tool for optimizing fertilization strategies, while our findings highlight the potential for nutrient recycling through sustainable residue management.
1. Introduction
Mineral nutrition of sweet cherry trees is an aspect of major concern among farmers and stakeholders involved in the chain of cherry production and distribution, whereas for Greece, with an annual production of 45,000–113,000 tons (7–8% of EU production), ranked at No. 12 globally in cherry production [1], the above acquires a particular economic importance. However, until now, few published studies have focused on adjusting fertilization practices for cherry orchards, both to accurately define the mineral elements that are taken up by trees each year [2] as well as to account for the various soil parameters that regulate the buffering capacities of these elements in terms of their availability rates within the soil–soil solution–rhizosphere system [3,4].
In the absence of such information, and for Greece particularly, fertilization recommendations for cherry orchards are mainly based on empirical estimations either extrapolated from data specific to different deciduous stone-fruit tree species or data derived from studies on cherry trees grown under various environmental and soil conditions in other countries [5]. Similar gaps and limitations in implementing adjusted fertilization recommendation strategies have also been documented by other studies on cherry orchards grown across the broader Mediterranean region [4].
Current fertilization recommendations for deciduous fruit trees in general, and particularly for cherry orchards, are largely based on the combination of two distinct approaches: (i) leaf tissue analysis, which provides a snapshot of nutrient status in the tree at a specific point in time; and (ii) soil nutrient availability assessments, which estimate the nutrient supply capacity of the soil [6]. However, both approaches have inherent limitations if not sufficiently calibrated [7]. Leaf tissue analysis captures plant nutrient status only at the time of sampling and needs to be addressed in comparison with valid critical sufficiency thresholds of each nutrient that correspond to the specific tree species and variety [8]. Accordingly, soil nutrient analysis measures the availability of macro- and micronutrients in the soil but does not directly account for plant uptake dynamics if the respective soil tests that are to be used for the assessment are not adequately calibrated to reflect direct relationships between the available nutrient forms in the soil and their respective uptake by trees. Moreover, in fruit trees, soil analysis alone is not a satisfactory guide for fertilizer recommendations, mainly because of the difficulty of accurately determining the root zones from which most of the nutrients are taken up [7].
In view of the above, a preliminary necessary step in bypassing these limitations is to develop a nutrient budgeting framework to elucidate specific patterns of relations between yield-based data and the corresponding nutrient uptake potential. In this approach and for cherry orchards particularly, the quantification of nutrient removal through harvested fruits, leaf litter, and prunings, if linked and correlated with fresh biomass yield, could help reliably assess nutrient losses per year and, thus, establish an assessment framework for nutrient uptake [2].
Among different theoretical models that are used to describe specific relationships between yield parameters and nutrient uptake and are cited in the literature, Mitscherlich’s law of diminishing returns, and Liebscher’s theory of variable endurance, which is formalized by the Michaelis–Menten model, are mostly discussed, whereas their hyperbolic nature is based on the assumption that as nutrient uptake increases, yield also increases but at a decreasing rate [9].
However, the above relationships are the yield response curves, which connect yield response with a specific nutrient, a lack of which is regarded as a constraint factor for plant growth, and the supply of which forms the specific form of the exponential curve [10].
We hypothesize that if total nutrient losses can be estimated based on easily obtained data of harvested fresh fruit parameters, and respective relationships could be established, these estimates could serve as a preliminary tool for improving fertilization recommendations. Although previous studies, including those from the broader Mediterranean region, have explored nutrient budgets in cherry orchards [2], the main novelty of our work lies in predicting total annual nutrient losses directly from the fresh fruit yield. By establishing empirical relationships between fruit yield and the nutrients removed in harvested and residual plant parts (leaves and prunings), we offer a yield-based modeling approach that can be readily used by growers to adjust fertilization practices without relying exclusively on periodic soil or tissue testing. This approach is particularly valuable for Greek cherry production, where such calibrated models are currently lacking. In addition, the assessment of nutrients accumulated in plant residues that remain on the soil surface and can potentially be reused (such as fallen leaves and prunings) could provide further insights into nutrient cycling and efficiency in cherry orchards.
Based on that, the objectives of this study are to develop a predictive framework for nutrient removal and uptake in sweet cherry orchards by quantifying the relationships between fresh biomass yield and nutrient concentrations in different plant compartments, including fruits, peduncles, prunings, and fallen leaves. Specifically, this study aims to (i) assess the total annual nutrient losses from cherry orchards through harvested fruits and removed biomass, (ii) evaluate the contribution of plant residues, such as fallen leaves and prunings, to nutrient recycling within the orchard system, and (iii) to establish prediction models that can assess total nutrient losses based on the harvested fresh fruits biomass. By establishing yield-based nutrient removal estimates, this study seeks to provide a preliminary but reliable framework for refining fertilization recommendations, improving nutrient use efficiency, and promoting sustainable soil fertility management in cherry orchards.
2. Materials and Methods
2.1. Description of the Experimental Site
The experiment was conducted in 2021 on two cherry orchards located at the Achladochori farm, Giannitsa, Pella region, Greece. Both orchards featured intercropped cherry varieties, but they differed in location, tree age, and rootstocks used for grafting.
The first orchard is a commercial 0.4-hectare cherry orchard in the “Anadasmos” area of the Achladochori farm. It was established in January 2012 with the varieties Early Bigi, Bigarreau Burlat, and Lapins, all grafted onto the MxM 14 rootstock. The planting design was linear, with 5 m spacing between rows and 4 m spacing between trees within rows. The orchard comprised 8 rows, each containing 26 trees per row, pruned into a vase-like shape with approximately 4 central branches per tree.
In the odd-numbered rows (1, 3, 5, 7), the Early Bigi variety was planted, while in the even-numbered rows (2, 4, 6, 8), the Bigarreau Burlat and Lapins varieties were alternated in a 2-2 pattern. Early Bigi was the primary cultivar of the experimental farm, yielding the bulk of the orchard’s production, while the other two served as pollinators. Despite its excellent flavor, Bigarreau Burlat has diminished commercial value, whereas Lapins remains attractive to growers due to its marketability and desirable traits. Therefore, the study of this specific variety is of greater interest.
The second orchard was a commercial 0.2-hectare cherry orchard, half the size of the first, established in December 2013. Although the same varieties were used as in the first orchard, this time, they were grafted onto the CAB-6P rootstock. Planting distances were 5 m between rows and 5 m within rows, resulting in 4 rows of 19 trees each. Trees were pruned into a vase-like shape with approximately 4 central branches per tree. In the odd-numbered rows (1, 3), the Early Bigi variety was planted, while in the even-numbered rows (2, 4), the Bigarreau Burlat and Lapins varieties alternated in a 3-3 pattern.
In each orchard, 5 trees of the Lapins variety were selected. The selected trees were representative of typical management and yield conditions in each orchard, while sampling was stratified by tree vigor and canopy uniformity within each orchard to minimize variability due to tree condition. Soil sampling and analysis were conducted once per tree, while leaf sampling and analysis were performed twice—once in July and once during leaf fall. Additional measurements included production volume, leaf litter weight (collected in autumn), and pruning weight (collected during winter pruning). Finally, chemical analyses were performed on fruits, peduncles, leaves, and prunings to quantify macro- and micronutrient removal and evaluate the feasibility of nutrient recycling to minimize resource waste.
2.2. Fruit Harvest and Production Measurement
One advantage of the Lapins variety is its ability to ripen in one or two stages, depending on climatic conditions, compared to the three-stage ripening of the other two varieties. In 2021, all cherries ripened almost simultaneously, allowing for harvest completion in two days—one day per orchard. The harvest took place on 13 and 14 June 2021, in the Achladochori farm area.
Harvesting was performed manually using 0.45 kg tare-weight containers. Weighing was performed with a small professional scale (max weight capacity: 150 kg, precision: 2 decimal places in multiples of 5). This allowed for calculating the total production per tree and the average yield per Lapins tree in the two orchards.
2.3. Collection and Weighing of Leaves and Prunings
Leaf sampling and analysis were conducted twice, once in July 2021 and once during leaf fall. Leaf collection involved spreading nets under the trees. Net placement varied between orchards due to tree size differences. The orchard with MxM 14 rootstock had larger trees, necessitating a setup that would not obstruct routine orchard management activities, such as soil mechanical weed control or post-harvest spraying. In contrast, the CAB-6P orchard was regularly visited by wild boars, which could damage equipment. Consequently, nets were adjusted to prevent damage from wildlife. Leaf collection occurred monthly during the summer when natural leaf drop was observed. Leaves were collected into bags and weighed using the same professional scale used for fruit production.
2.4. Soil and Plant Tissue Analyses
Soil sampling was conducted in July 2021. Surface soil samples (0–30 cm) were collected around the tree trunk within the projection of the canopy’s perimeter. After transport to the laboratory, samples were air-dried, crushed, and sieved through a 2 mm mesh. The following analyses were performed on this material:
The soil texture was determined using the hydrometer method [11]. Soil pH and electrical conductivity (EC) were measured in a saturated paste extract [12]. For samples with pH ≥ 6.5, total calcium carbonate (CaCO3) was quantified using a digital calcimeter (FOG L, bd INVENTIONS, Thessaloniki, Greece). Soil organic matter (SOM) was determined via the wet oxidation method [13].
Soil total N was measured using the Kjeldahl method [14], while available NO3-N was determined via UV–visible spectrophotometry after extraction with 2 M KCl [15]. Available P (Olsen-P) was extracted using 0.5 M NaHCO3 at pH 8.5 and analyzed using the ascorbic acid method [16]. Exchangeable cations (K, Ca, Mg) were extracted with 1 M NH4OAc at pH 7 and analyzed via ICP-OES [17]. Micronutrients (Fe, Mn, Cu, Zn) were determined after extraction with DTPA [18] and analyzed using ICP-OES, whereas available B was measured spectrophotometrically using the azomethine-H method after hot water extraction [19].
The harvested aboveground biomass was subdivided into different plant parts (fruits, peduncles, prunings, and fallen leaves), dried at 75 °C until a constant weight was reached, and then weighed to determine the respective dry biomass yield. The dried samples were subsequently ground for chemical analysis. Total N was determined using the Kjeldahl method [14], while the concentrations of other nutrients (P, K, Ca, Mg, Fe, Mn, Cu, Zn, and B) were analyzed following dry combustion at 500 °C for at least four hours. The resulting ash was dissolved in 6 M HCl, and nutrient determination in plant tissues was performed using the same methods as those applied for soil analysis.
2.5. Statistical Analyses
Linear or linearized regression models were applied between yield parameters and nutrient uptake among different plant parts to investigate relationships that could describe and predict nutrient outputs during the growing season. The empirical criterion of standardized skewness and kurtosis below 2 was applied to test the normality of the data. Transformations of variables were performed in the context of linearized modeling. The best models were selected based on the coefficient of determination criterion r2, between observed and simulated data. Differences among mean values were assessed using ANOVA—One Way Analysis of Variance, single factor, at a probability level of p < 0.05. Significant differences between treatments were determined using Tukey’s HSD test with a significance level of p ≤ 0.05, whereas principal component analysis (PCA) was also performed on centered and standardized data. All analyses, along with corresponding visualization of graphs, were conducted using R software (V.4.2.2), installing “ggplot2”, “datasets”, “multcompView”, “dplyr”, and “tidyr” packages.
3. Results
3.1. Physicochemical Properties of Studied Soils
The physicochemical properties of the two soils used in this experiment, along with their differences from the ANOVA analysis, are summarized in Figure 1. The soils were classified as Loam (L), where the MxM14 rootstock was established, and Sandy Loam (SL), in the case of CAB-6P rootstock, respectively. They exhibited differences in clay, silt, and sand content, pH, and bulk density. In contrast, no significant differences were observed in their CaCO3 content, electrical conductivity (EC), or organic matter (OM) content.
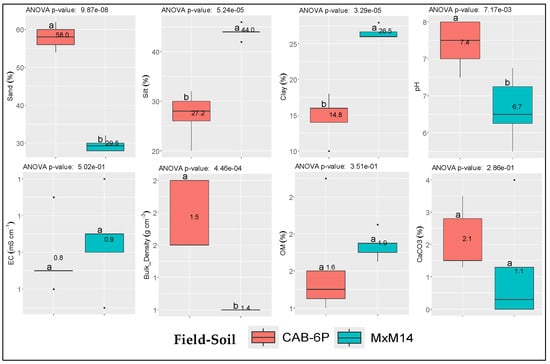
Figure 1.
Mean values (n = 5 per field) and respective differences in the studied physicochemical properties between the two selected soils. Dots (∙) indicate outliers; EC: electrical conductivity; OM: soil organic matter. Soil coding (MxM14 and CAB-6P) refers to the respective rootstock established at each field.
3.2. Available Forms of Studied Macro- and Micronutrients in Soil and Respective Concentrations from Leaf Analysis Between Two Fields
The mean values of the available forms of each studied macro- and micronutrient from soil samples taken from the two fields, along with their differences, are presented in Figure 2. Results indicated that among the three major macronutrients, only soil NO3-N levels were marginally below sufficiency for the CAB-6P rootstock and marginally sufficient for the MxM14 rootstock, based on reference sufficiency levels reported in the literature [20]. In contrast, P-Olsen and available K values (K-ex) were within the respective sufficiency ranges and did not differ significantly between the two soils [21,22]. Regarding micronutrients, significant differences were observed between the two soils for available Fe, Mn, and Cu, whereas Zn and B showed no significant variation. Notably, the soil supporting the CAB-6P rootstock exhibited micronutrient levels of Fe, Mn, and Cu below the reported sufficiency thresholds [20] (Supplementary Table S1).
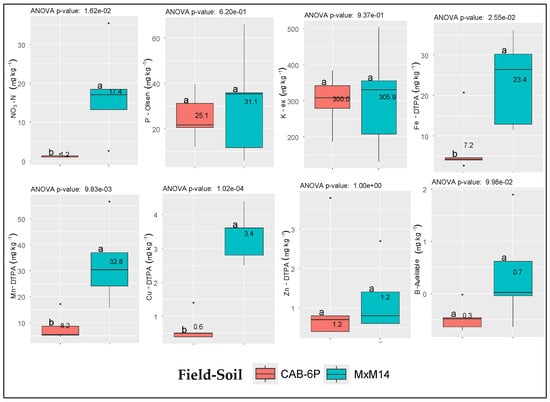
Figure 2.
Mean values (n = 5 per field) and respective differences in the available forms of macro- and micronutrients between the two selected soils. Dots (∙) indicate outliers; Soil coding (MxM14 and CAB-6P) refers to the respective rootstock established at each field.
The mean concentrations of macro- and micronutrients derived from the regular leaf tissue analysis of samples collected from the two fields are presented in Figure 3. The results indicate that the concentrations of the major macronutrients (N, P, and K) fall within the sufficiency ranges reported in the literature for cherry orchards [23]. Similarly, among the micronutrients, Mn, Cu, and B were also within adequate levels. However, Fe concentrations were below the sufficiency range of 100–250 mg kg−1, while Zn levels were slightly below the corresponding sufficiency threshold of 20–50 mg kg−1 (Supplementary Table S1).
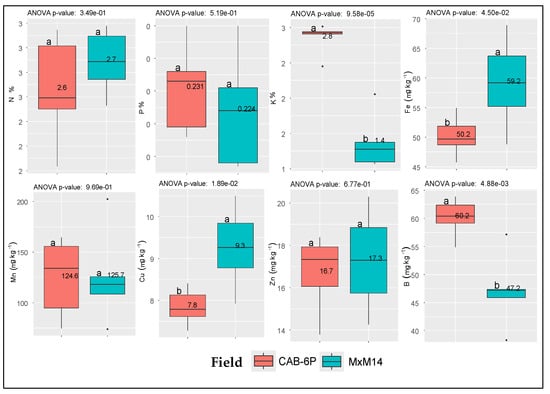
Figure 3.
Mean values (n = 5 per field) and respective differences in the leaf tissue concentrations of macro- and micronutrients between the two selected fields. Dots (∙) indicate outliers; Coding MxM14 and CAB-6P refer to the respective rootstock established at each field.
3.3. Distribution Patterns of Nutrient Concentration and Their Total Uptake Among Different Plant Parts
Principal Component Analysis (PCA) was employed to assess the overall variability patterns of macro- and micronutrient concentration among different plant parts. Results showed that a significant proportion of the total variance (93.4%) was clustered within four components, with two of them accounting for 68.4% of the variance (Figure 4).
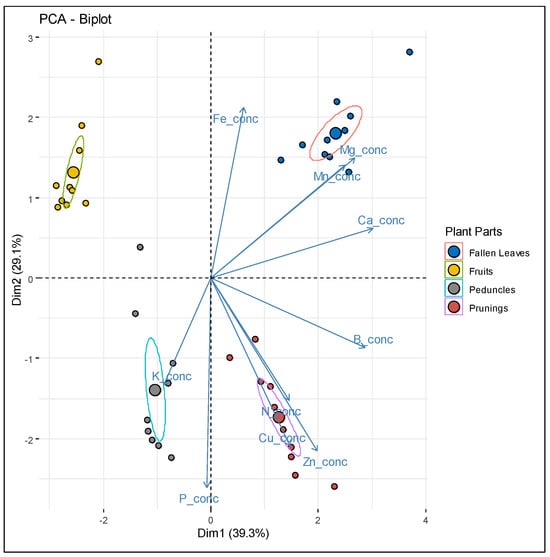
Figure 4.
PCA biplots (95% confidence ellipses) of plant tissue concentrations of macro- and micronutrients scattered in different plant parts (n = 10, representing 40 total plant part measurements).
Accordingly, as indicated by the PCA biplot, higher concentrations of N, Cu, and Zn are closely associated with prunings, while K concentration shows a strong alignment with peduncles. On the other hand, Mg and Mn concentrations are more closely aligned with fallen leaves, whereas Ca and B appear to be equally balanced between prunings and fallen leaves.
As expected, the total uptake percentage profile among the plant components further corroborates this distribution, as indicated in Figure 5. Notably, the majority of N uptake is evenly distributed between fruits and peduncles and prunings, while P uptake is primarily associated with prunings. On the other hand, K uptake is predominantly concentrated in fruits and peduncles, and Ca uptake is mostly attributed to fallen leaves. Similarly, Mg and Mn show the highest uptake in fallen leaves, at 64.8% and 72.2%, respectively, whereas Fe uptake is relatively balanced, with substantial portions found in fruits and peduncles (44.6%) and fallen leaves (40.6%).
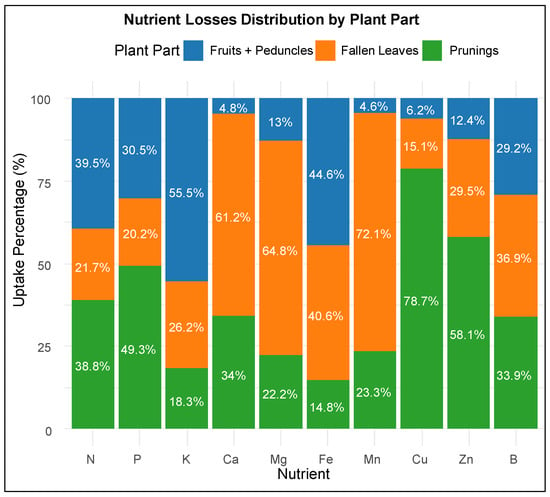
Figure 5.
Stacked bar charts showing the percentage contribution of each plant part to the total losses of accumulated macro- and micronutrients.
Accordingly, a strong association with prunings was found for Cu and Zn, accounting for 78.7% and 58% of their total uptake, whereas B uptake appeared more evenly distributed, with significant contributions from all three components.
3.4. Relations Between Fresh Yield Parameters of Different Plant Parts and Respective Nutrient Uptake Magnitudes
The datasets of fresh weight and uptake magnitudes were normalized by dividing each value by the maximum within its respective plant part group, thereby generating scaled values ranging from 0 to 1 for easier comparison. The results are presented in Figure 6. Linear regressions were then applied, and the intercept and slope variables, along with the coefficients of determination (r2) and p-values, are shown in Supplementary Table S2.
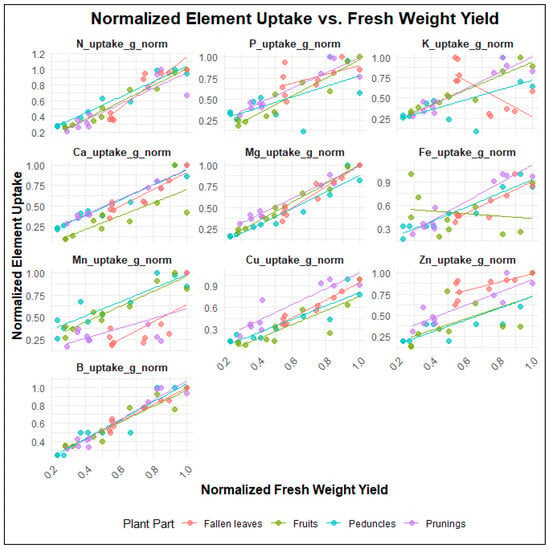
Figure 6.
Relationships between uptake of each studied macro- or micronutrient and fresh weight yield of respective plant part that was removed during the year (n = 10 per plant part). Fresh weight and uptake values were normalized by dividing each value by the maximum within its respective plant part group (scale 0–1).
The acquired linear models show that for nutrients such as N, Ca, Mg, B, and Cu, there are strong relationships (high r2 > 0.8 and significant p-values < 0.05) between fresh weight yield and nutrient uptake across most plant parts, whereas for nutrients such as P, K, Mn, Zn, and Fe, the relationships are moderate to weak (r2 < 0.7 in some cases, e.g., P in peduncles, K in peduncles, Zn in fruits). Regarding plant-specific trends, fruits generally show the strongest relationships for most nutrients (e.g., N, P, K, Mg, B), whereas, in contrast, fallen leaves exhibit weaker relationships for some other nutrients (e.g., P, K, Mn, Zn). Notably, K uptake in fallen leaves and Fe uptake in fruits showed negative slopes and nonlinear patterns, indicating unique uptake dynamics.
3.5. Relations Between Harvested Fresh Weight of Fruits and Peduncles and Total Nutrient Losses
Linear or linearized regression models were used to analyze the relationship between the fresh weight yield parameters of harvested fruits and peduncles (x) and the total nutrient losses, which include the amounts of nutrients taken up by prunings, fallen leaves, fruits, and peduncles (y). The best-fitting models are presented in Table 1 and Figure 7. Additionally, simplified linear models, excluding the intercept, represented by the equation y = ax, were applied to assess their prediction accuracy (Table 2 and Figure 8). This approach was adopted to enhance practical field applications, as the simplified models better support grower decision-making through their straightforward calculations.

Table 1.
Linearized equation models between the fresh weight yield parameters of harvested fruits and peduncles (x) and the total nutrient losses, which include the amounts of nutrients taken up by prunings, fallen leaves, fruits, and peduncles (y). The approximate nutrient loss per hectare was assessed by multiplying the fresh weight threshold, set at 50 kg per tree, by 400, assuming 400 trees ha−1.
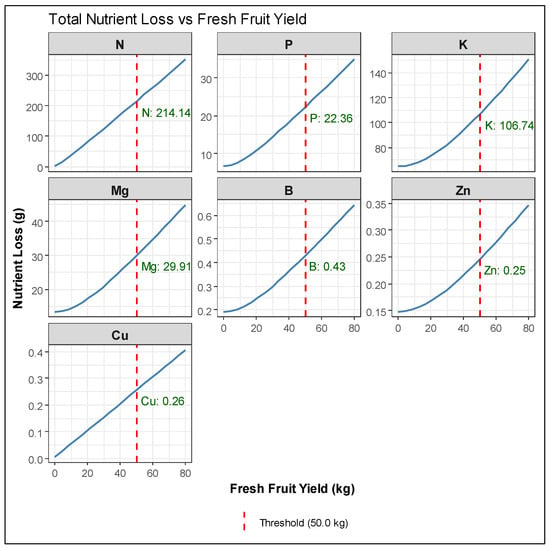
Figure 7.
Models of total nutrient loss prediction for each studied macro- and micronutrient (n = 10), as derived from equations of Table 1. Fresh weight threshold was set at 50 kg per tree.

Table 2.
Simplified linear equation models, excluding the intercept between the fresh weight yield parameters of harvested fruits and peduncles (x) and the total nutrient losses, which include the amounts of nutrients taken up by prunings, fallen leaves, fruits, and peduncles (y). Nutrient loss refers to a fresh weight threshold at 20,000 kg ha−1.
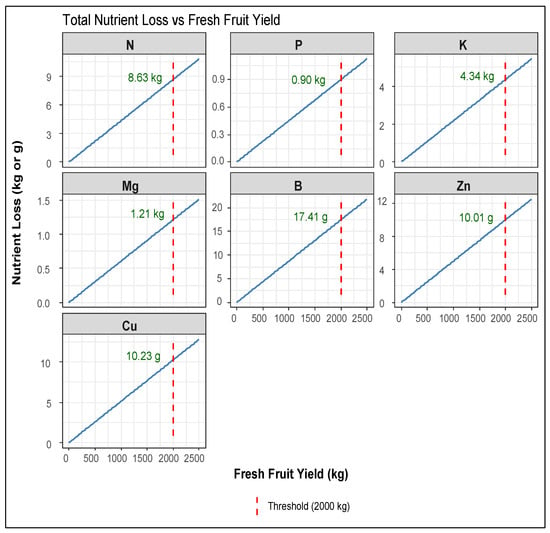
Figure 8.
Models of total nutrient loss prediction for each studied macro- and micronutrient (n = 10), as derived from the simplified 1:1 equations of Table 2. Fresh weight threshold was set at 2000 kg of fresh-weight fruit production.
In the first group of equations, a fresh weight threshold was set at 50 kg per tree, and then, the approximate nutrient loss per hectare was assessed by multiplying by 400, assuming 400 trees ha−1. As shown in Table 1, nutrients with an acceptable fit (r2 > 0.75) included N, P, K, Mg, B, Zn, and Cu, with N, P, K, and B demonstrating the strongest relationships. In contrast, Fe and Mn uptake did not fit any of the tested models, preventing the prediction of total loss. In the second group of equations (Table 2 and Figure 8), the calculated nutrient loss refers to a fresh weight threshold at 20,000 kg ha−1. For primary nutrients, including N and P, the simplified y = ax models maintained high predictive accuracy while yielding nutrient removal estimates that closely matched those from the complex equations.
4. Discussion
4.1. Soil and Regular Plant Analysis Interpretation
While soil NO3-N, Cu, and Fe levels were below sufficiency thresholds in the MxM14 rootstock field, leaf analysis showed that most nutrients were within sufficiency ranges, except for Fe and Zn. Nevertheless, micronutrient deficiencies in the leaves of deciduous trees may not always be associated with chlorosis symptoms or have a negative impact on yield and fruit quality, as demonstrated by Milošević et al. (2014) in the case of Fe deficiency [24]. Given the absence of visible chlorotic symptoms, our findings suggest that in both fields, cherry trees grew under soil conditions that provided sufficient nutrient availability to support adequate uptake. Therefore, no major nutrient limitation affecting cherry tree nutrition could be assumed.
Parameters that may influence the vegetative growth and yield of fruit trees are either controlled by orchard management or are genotype-dependent [25]. Among them, factors such as climate, soil, cultivar, rootstock, training, pruning, plant protection, weed control, irrigation, and fertilization are considered the most crucial [6]. Given that both orchards followed the same management practices and were located in close proximity, minimizing potential climatic influences, the variation in yield parameters can be primarily attributed to differences in cherry tree age. In addition, the distinct rootstocks onto which the studied cherry variety was grafted might also have a potential effect on yield variance [26].
4.2. Nutrient Distribution and Uptake Patterns
Results derived from the PCA biplots and Figure 5 revealed distinct nutrient distribution patterns among different plant parts, as well as respective allocation strategies. In particular, the balanced distribution of N uptake between fruits, peduncles, and prunings indicates the crucial role that N plays in both reproductive and vegetative growth [27], whereas the predominant association of P with prunings and of K with fruits and peduncles could be ascribed to the limited accumulation of P in the cherry fruits [28] or the well-known function of K in cherry fruit quality [29], respectively.
In addition, Mg, despite its phloem mobility, was predominantly partitioned to leaves, which is consistent with its role in chlorophyll and photosynthetic enzymes, while Cu, in contrast, accumulated strongly in woody tissues (prunings), likely due to its essential role in lignification processes [7]. These distribution patterns, along with the trends observed for the other macro- and micronutrients studied, are generally consistent with findings reported in previous studies on cherry trees and other deciduous species [2,30].
The equations derived from this study (Table 1 and Table 2) provide a predictive framework for assessing total nutrient loss based on the fresh biomass yield of the harvested fruits and peduncles.
In contrast to yield response models such as the Michaelis–Menten or Mitscherlich’s equation, which relate yield response to a specific nutrient whose lack is regarded as a constraint factor for plant growth, thus shaping the characteristic exponential curve, our approach differs. Here, the dependent variable is total nutrient uptake, representing the overall nutrient loss due to the removal or harvest of plant parts. The independent variable, on the other hand, is the harvested fresh yield weight, chosen as a readily accessible and easily measurable predictor for estimating nutrient loss.
From this point of view, the shape of the curves obtained for assessing the total nutrient loss for each element (Figure 7) is influenced by the factors governing the individual relationships that define the partial uptake patterns from the corresponding plant part yield parameters used to estimate total nutrient loss (Figure 6 and Supplementary Table S2). Consequently, the linearity or non-linearity of these individual relationships, variations in slope, and their predictive power or statistical significance play a key role in determining the overall pattern of total nutrient uptake removed, as plotted against the fresh weight yield of the harvested fruits and peduncles. The above could be attributed to specific uptake patterns caused by the specific effects of soil properties [7], translocation and redistribution patterns from different plant organs [30,31], or dilution effects [32].
The case of K is an indicative example in this context and a particularly important finding of this study. The observed negative and nonlinear relationship between fallen leaf yield and its corresponding K uptake (Figure 6), along with the relationship between fresh fruit weight, peduncle yield, and the K uptake of fallen leaves, strongly suggests a redistribution of K between leaves and fruits. This pattern is particularly evident under high fruit yield conditions, where nutrient demand is elevated. Supporting our findings, Roeva et al. (2022) also reported that in years with higher fruit loads on sour cherry trees, potassium concentrations in leaves were significantly reduced [29]. Similarly, comparable trends have been observed in other deciduous trees, such as pear and apple, where foliar potassium levels were negatively correlated with increasing yield [33,34].
Conversely, the limited predictive power of models using fresh fruit and peduncle yield to estimate total Fe and Mn loss stems from the inability to establish well-fitted individual 1:1 relationships in respective plant parts. Specifically, this limitation arises from weak correlations between fresh fruit and peduncle yield with Fe loss and between fallen leaves and prunings with Mn loss.
Fe, for instance, is predominantly found in soils as poorly soluble oxides and hydroxides, particularly under neutral to alkaline pH conditions, which is the case of the soils used in this study [35]. This limited solubility restricts Fe availability for plant uptake, often resulting in highly variable Fe uptake that is influenced by soil conditions and root physiology. Consequently, Fe homeostasis in plant cells must be tightly regulated to prevent deficiency [36]. This complex regulation, combined with the inconsistent availability of Fe in soil, may explain the weak predictive power of models attempting to estimate total Fe loss based solely on fresh fruit and peduncle yield. A similar rationale may also account for the respective incapability to predict Mn loss in soil alkaline conditions.
On the other hand, macronutrients such as Ca and Mg followed a distinct pattern with a more pronounced reduction in total uptake at higher fresh fruit yields (a trend that was also well described by a third-order polynomial curve). In the case of Ca, the above could be attributed to its limited mobility in the phloem, which prevents efficient translocation [31], a fact which is also evidenced in our study from respective low levels of accumulation in fruits and peduncles shown in Figure 5. At elevated yields, the plant prioritizes phloem-fed fruit expansion, but since Ca remains locked in vegetative tissues (61.2% in fallen leaves), total uptake trends may show a sharper decline than for other more mobile nutrients. In a similar manner, although Mg is more mobile in the phloem than Ca, its accumulation in fruits may also be limited at high yields, leading to patterns similar to those observed for Ca.
4.3. Integrating Fresh Fruit Yield Data into Nutrient Uptake Predictions
Our final predictions of total nutrient loss are generally consistent with findings from previous studies. Roversi and Monteforte (2006) reported total P losses ranging from 6.20 to 10.77 kg ha−1 for different sweet cherry varieties, while K losses ranged from 16.47 to 47.09 kg ha−1 [2]. These values align with our results, which estimate P and K losses at 8.94 kg ha−1 and 42.7 kg ha−1, respectively. However, our predicted total N (85.6 kg ha−1) and Mg losses (12.0 kg ha−1) exceeded the ranges reported by the same authors (38.56–64.60 kg ha−1 for N and 5.08–8.79 kg ha−1 for Mg). In contrast, Baghadi and Sadowski (1998), who assessed the nutrient requirements of sour cherry trees, reported a total N loss of 95.0 kg ha−1, a value comparable to our findings [37].
The same authors analyzed the annual nutrient uptake of sour cherry trees by distinguishing between nutrients that are permanently removed through harvested fruits, those retained within the trees, and those present in plant residues that remain on the soil surface and can potentially be reused (such as fallen leaves and prunings). Their findings indicate that 47% of total nitrogen, 55% of total potassium, 38% of total phosphorus, and 83% of total magnesium are retained in these residues and may contribute to nutrient recycling. These percentages correspond to estimated recoverable amounts of 55.2 kg ha−1 N, 2.2 kg ha−1 P, 34.38 kg ha−1 K, and 12.1 kg ha−1 Mg, respectively.
By comparing these values with the total nutrient losses predicted by our models (Table 1) and the nutrient distribution among plant parts (Figure 5), we found similar trends. Specifically, in our study, the nutrients potentially available for reuse—assuming plant residues remain on the soil surface and are not removed—amount to 51.8 kg ha−1 N, 6.2 kg ha−1 P, 19.0 kg ha−1 K, and 10.4 kg ha−1 Mg.
In contrast to prior nutrient-budget studies for cherry trees [2,37], which required laborious organ-specific sampling, our models simplify the estimation of total nutrient losses by using fresh fruit yield as the sole input variable—a practical metric readily available to growers. This approach eliminates the need to quantify partial uptake from individual plant parts (e.g., leaves, prunings) while maintaining predictive accuracy (Figure 7 and Figure 8).
Moreover, our findings provide valuable insight into the fraction of nutrients that can be recycled, which is essential for evaluating soil fertility and tree nutrition within a comprehensive fertilization strategy [30]. Incorporating these estimates into fertilization planning can help minimize external chemical inputs and promote sustainable nutrient management under an integrated orchard management approach, refining existing fertilization guidelines for cherries in Greece [5]. In addition, the predictive models developed in this study could serve as a basis for practical applications in nutrient management planning, such as mobile decision-support tools, regional nutrient management guidelines, or farmer advisory platforms. The use of two different rootstocks in the orchards included in our study allowed the prediction models to capture variability potentially associated with rootstock type. This suggests that future recalibration of the models could also accommodate additional sources of variation, such as cultivar differences.
5. Conclusions
Our study provides a predictive framework for nutrient uptake in cherry orchards, offering valuable insights into nutrient distribution, uptake dynamics, and total nutrient losses associated with fruit production. Despite variations in soil properties, nutrient availability appeared sufficient to support cherry tree growth, while tree age was the main factor that affected the variability in yield between the two orchards. The relationships between fresh fruit yield and total nutrient uptake were found to be nonlinear in the studied yield range in most cases due to the complexity of soil properties, redistribution, and retention in different plant parts, as well as dilution effects in the models. Our prediction models estimate total nutrient losses of 85.6 kg ha−1 N, 8.94 kg ha−1 P, 42.7 kg ha−1 K, and 12.0 kg ha−1 Mg, with a significant portion retained in plant residues. Specifically, 51.8 kg ha−1 N, 6.2 kg ha−1 P, 19.0 kg ha−1 K, and 10.4 kg ha−1 Mg remain in fallen leaves and prunings, potentially contributing to nutrient recycling. Respective results were also obtained for micronutrients such as B, Zn, and Cu. These findings underscore the need for integrated fertilization strategies that account for both nutrient removal and reuse, supporting sustainable orchard management and reducing dependence on external inputs. While our models offer a preliminary framework for site-specific nutrient recommendations based on fresh yield parameters, further validation across a broader set of orchards and seasons will be necessary to confirm the robustness and generalizability of the proposed approach.
Supplementary Materials
The following supporting information can be downloaded at https://www.mdpi.com/article/10.3390/agriculture15121312/s1, Table S1: Sufficiency thresholds for interpreting soil and plant tissue nutrient concentrations; Table S2: Linear regression equation components between uptake of each studied macro- or micronutrient and fresh weight yield of respective plant part that was removed during the year. Fresh weight and uptake values were normalized by dividing each value by the maximum within its respective plant part group (scale 0–1).
Author Contributions
Conceptualization, V.A. and I.K.; methodology, F.B., I.K. and V.A.; software, F.B. and I.K.; validation, I.K., F.B. and V.A.; formal analysis, F.B., V.A. and I.K.; investigation, I.K., C.P., A.T., P.K. and G.G.; resources, V.A.; data curation, I.K., C.P., A.T., P.K. and G.G.; writing—original draft preparation, F.B.; writing—review and editing, F.B., V.A., G.T., I.K. and A.P.-V.; visualization, F.B.; supervision, V.A. and A.P.-V.; project administration, V.A. and F.B.; funding acquisition, V.A. All authors have read and agreed to the published version of the manuscript.
Funding
This research received no external funding.
Institutional Review Board Statement
Not applicable.
Data Availability Statement
All data supporting the results of this study are included in the manuscript, and datasets are available upon request.
Conflicts of Interest
The authors declare no conflicts of interest.
References
- Papapetros, S.; Louppis, A.; Kosma, I.; Kontakos, S.; Badeka, A.; Kontominas, M.G. Characterization and Differentiation of Botanical and Geographical Origin of Selected Popular Sweet Cherry Cultivars Grown in Greece. J. Food Compos. Anal. 2018, 72, 48–56. [Google Scholar] [CrossRef]
- Roversi, A.; Monteforte, A. Preliminary Results on the Mineral Uptake of Six Sweet Cherry Varieties. Acta Hortic. 2006, 721, 123–128. [Google Scholar] [CrossRef]
- Ughini, V.; Roversi, A. Application of the Szűcs Algorithm as an Aid for Orchard Mineral Fertilization. Acta Hortic. 2006, 721, 299–306. [Google Scholar] [CrossRef]
- Ughini, V.; Roversi, A. Estimation of Sweet Cherry Fertilizer Requirements by the Szűcs’ Method Varies by Cultivar. Acta Hortic. 2008, 795, 733–738. [Google Scholar] [CrossRef]
- Stylianidis, D.C.; Simonis, A.D.; Syrgiannidis, G.D. Nutrition, Fertilization of Deciduous Fruit Trees: Deficiencies, Toxicities, Physiological Disorders of Fruits; Stamoulis Publications: Athens, Greece, 2002. (In Greek) [Google Scholar]
- Milošević, T.; Milošević, N. Soil fertility: Plant nutrition vis-à-vis fruit yield and quality of stone fruits. In Fruit Crops; Elsevier: Amsterdam, The Netherlands, 2020; pp. 583–606. [Google Scholar]
- Marschner, H. Marschner’s Mineral Nutrition of Higher Plants; Academic Press: London, UK, 2012; Volume 89, p. 651. [Google Scholar]
- Smith, F.W.; Loneragan, J.F. Interpretation of Plant Analysis: Concepts and Priciples. In Plant Analysis: An Interpretation Manual; Reuter, D.J., Robinson, J.B., Eds.; CSIRO Publishing: Collingwood, Australia, 1997; pp. 3–33. [Google Scholar]
- Nijland, G.O.; Schouls, J. The Relation Between Crop Yield, Nutrient Uptake, Nutrient Surplus and Nutrient Application; Wageningen Agricultural University: Wageningen, The Netherlands, 1997. [Google Scholar]
- Dhanoa, M.S.; Sanderson, R.; Cardenas, L.M.; Shepherd, A.; Chadwick, D.R.; Powell, C.D.; Ellis, J.L.; López, S.; France, J. Overview and Application of the Mitscherlich Equation and Its Extensions to Estimate the Soil Nitrogen Pool Fraction Associated with Crop Yield and Nitrous Oxide Emission. In Advances in Agronomy; Elsevier: Amsterdam, The Netherlands, 2022; Volume 174, pp. 269–295. ISBN 978-0-323-98957-2. [Google Scholar]
- Bouyoucos, G.J. Hydrometer Method Improved for Making Particle Size Analyses of Soils. Agron. J. 1962, 54, 464–465. [Google Scholar] [CrossRef]
- Rhoades, J.D. Salinity: Electrical Conductivity and Total Dissolved Solids. In Methods of Soil Analysis: Part 3 Chemical Methods; Sparks, D.L., Page, A.L., Helmke, P.A., Loeppert, R.H., Soltanpour, P.N., Tabatabai, M.A., Johnston, C.T., Sumner, M.E., Eds.; SSSA Book Series; Soil Science Society of America, American Society of Agronomy: Madison, WI, USA, 1996; pp. 417–435. [Google Scholar]
- Walkley, A.J.; Black, I.A. Estimation of Soil Organic Carbon by the Chromic Acid Titration Method. Soil Sci. 1934, 37, 29–38. [Google Scholar] [CrossRef]
- Bremner, J.M. Nitrogen-Total. In Methods of Soil Analysis: Part 3 Chemical Methods; Sparks, D.L., Page, A.L., Helmke, P.A., Loeppert, R.H., Soltanpour, P.N., Tabatabai, M.A., Johnston, C.T., Sumner, M.E., Eds.; SSSA Book Series; Soil Science Society of America, American Society of Agronomy: Madison, WI, USA, 1996; pp. 1085–1121. [Google Scholar]
- Mulvaney, R.L. Nitrogen-Inorganic Forms. In Methods of Soil Analysis: Part 3 Chemical Methods; Sparks, D.L., Page, A.L., Helmke, P.A., Loeppert, R.H., Soltanpour, P.N., Tabatabai, M.A., Johnston, C.T., Sumner, M.E., Eds.; SSSA Book Series; Soil Science Society of America, American Society of Agronomy: Madison, WI, USA, 1996; pp. 1123–1184. [Google Scholar]
- Kuo, S. Phosphorus. In Methods of Soil Analysis: Part 3 Chemical Methods; Sparks, D.L., Page, A.L., Helmke, P.A., Loeppert, R.H., Soltanpour, P.N., Tabatabai, M.A., Johnston, C.T., Sumner, M.E., Eds.; SSSA Book Series; Soil Science Society of America, American Society of Agronomy: Madison, WI, USA, 1996; pp. 869–919. [Google Scholar]
- Thomas, G.W. Exchangeable Cations. In Agronomy Monographs; Page, A.L., Ed.; American Society of Agronomy, Soil Science Society of America: Madison, WI, USA, 2015; pp. 159–165. [Google Scholar]
- Lindsay, W.L.; Norvell, W.A. Development of a DTPA Soil Test for Zinc, Iron, Manganese, and Copper. Soil Sci. Soc. Am. J. 1978, 42, 421–428. [Google Scholar] [CrossRef]
- Keren, R. Boron. In Methods of Soil Analysis: Part 3 Chemical Methods; Sparks, D.L., Page, A.L., Helmke, P.A., Loeppert, R.H., Soltanpour, P.N., Tabatabai, M.A., Johnston, C.T., Sumner, M.E., Eds.; SSSA Book Series; Soil Science Society of America, American Society of Agronomy: Madison, WI, USA, 1996; pp. 603–626. [Google Scholar]
- Siatwiinda, S.M.; Ros, G.H.; Yerokun, O.A.; De Vries, W. Options to reduce ranges in critical soil nutrient levels used in fertilizer recommendations by accounting for site conditions and methodology: A review. Agron. Sustain. Dev. 2024, 44, 9. [Google Scholar] [CrossRef]
- Bai, Z.; Li, H.; Yang, X.; Zhou, B.; Shi, X.; Wang, B.; Li, D.; Shen, J.; Chen, Q.; Qin, W.; et al. The critical soil P levels for crop yield, soil fertility and environmental safety in different soil types. Plant Soil 2013, 372, 27–37. [Google Scholar] [CrossRef]
- Bilias, F.; Barbayiannis, N. Evaluation of sodium tetraphenylboron (NaBPh4) as a soil test of potassium availability. Arch. Agron. Soil Sci. 2017, 63, 468–476. [Google Scholar] [CrossRef]
- Reuter, D.J.; Edwards, D.G.; Wilhelm, N.S. Temperate and tropical crops. In Plant Analysis: An Interpretation Manual; Reuter, D.J., Robinson, J.B., Eds.; CSIRO Publishing: Collingwood, Australia, 1997; pp. 83–278. [Google Scholar]
- Milošević, T.; Milošević, N.; Milivojević, J.; Glišić, I.; Nikolić, R. Experiences with Mazzard and Colt sweet cherry rootstocks in Serbia which are used for high density planting system under heavy and acidic soil conditions. Sci. Hortic. 2014, 176, 261–272. [Google Scholar] [CrossRef]
- Milošević, T.; Moreno, M.Á.; Milošević, N.; Milinković, M. Regulation of Yield, Fruit Size, and Leaf Mineral Nutrients of the ‘Šumadinka’ Sour Cherry Cultivar with Help of Rootstocks. J. Plant Growth Regul. 2023, 42, 5587–5599. [Google Scholar] [CrossRef]
- Cantín, C.M.; Pinochet, J.; Gogorcena, Y.; Moreno, M.Á. Growth, yield and fruit quality of ‘Van’ and ‘Stark Hardy Giant’ sweet cherry cultivars as influenced by grafting on different rootstocks. Sci. Hortic. 2010, 123, 329–335. [Google Scholar] [CrossRef]
- Rutkowski, K.; Łysiak, G.P. Effect of Nitrogen Fertilization on Tree Growth and Nutrient Content in Soil and Cherry Leaves (Prunus cerasus L.). Agriculture 2023, 13, 578. [Google Scholar] [CrossRef]
- Rowley, S.D. Phosphorous and Potassium Fertility Management for Maximizing Tart Cherry Fruit Quality and Productivity on Alkaline Soils. Master’s Thesis, Utah State University, Logan, UT, USA, 2013. [Google Scholar] [CrossRef]
- Roeva, T.; Leonicheva, E.; Leonteva, L.; Stolyarov, M. Potassium dynamics in orchard soil and potassium status of sour cherry trees affected by soil nutritional conditions. J. Cent. Eur. Agric. 2022, 23, 103–113. [Google Scholar] [CrossRef]
- Quartieri, M.; Polidori, G.; Baldi, E.; Toselli, M. Evaluation of Removed and Recycled Mineral Nutrients in Italian Commercial Persimmon Orchards. Horticulturae 2023, 9, 374. [Google Scholar] [CrossRef]
- Kumar, A.; Singh, U.M.; Manohar, M.; Gaur, V.S. Calcium transport from source to sink: Understanding the mechanism(s) of acquisition, translocation, and accumulation for crop biofortification. Acta Physiol. Plant 2015, 37, 1722. [Google Scholar] [CrossRef]
- Jarrell, W.M.; Beverly, R.B. The dilution effect in plant nutrition studies. In Advances in Agronomy; Elsevier: Amsterdam, The Netherlands, 1981; pp. 197–224. [Google Scholar] [CrossRef]
- Brunetto, G.; Nava, G.; Ambrosini, V.G.; Comin, J.J.; Kaminski, J. The pear tree response to phosphorus and potassium fertilization. Rev. Bras. Frutic. 2015, 37, 507–516. [Google Scholar] [CrossRef]
- Kuzin, A.I.; Kashirskaya, N.Y.; Kochkina, A.M.; Kushner, A.V. Correction of Potassium Fertigation Rate of Apple Tree (Malus domestica Borkh.) in Central Russia during the Growing Season. Plants 2020, 9, 1366. [Google Scholar] [CrossRef]
- Li, M.; Watanabe, S.; Gao, F.; Dubos, C. Iron Nutrition in Plants: Towards a New Paradigm? Plants 2023, 12, 384. [Google Scholar] [CrossRef]
- Briat, J.-F.; Dubos, C.; Gaymard, F. Iron nutrition, biomass production, and plant product quality. Trends Plant Sci. 2015, 20, 33–40. [Google Scholar] [CrossRef] [PubMed]
- Baghdadi, M.; Sadowski, A. Estimation of nutrient requirements of sour cherry. Acta Hortic. 1998, 468, 515–522. [Google Scholar] [CrossRef]
Disclaimer/Publisher’s Note: The statements, opinions and data contained in all publications are solely those of the individual author(s) and contributor(s) and not of MDPI and/or the editor(s). MDPI and/or the editor(s) disclaim responsibility for any injury to people or property resulting from any ideas, methods, instructions or products referred to in the content. |
© 2025 by the authors. Licensee MDPI, Basel, Switzerland. This article is an open access article distributed under the terms and conditions of the Creative Commons Attribution (CC BY) license (https://creativecommons.org/licenses/by/4.0/).