

Comparative Analysis of the Expression of Genes Involved in Fatty Acid Synthesis Across Camelina Varieties

 ,
,  , and
, and 
Abstract
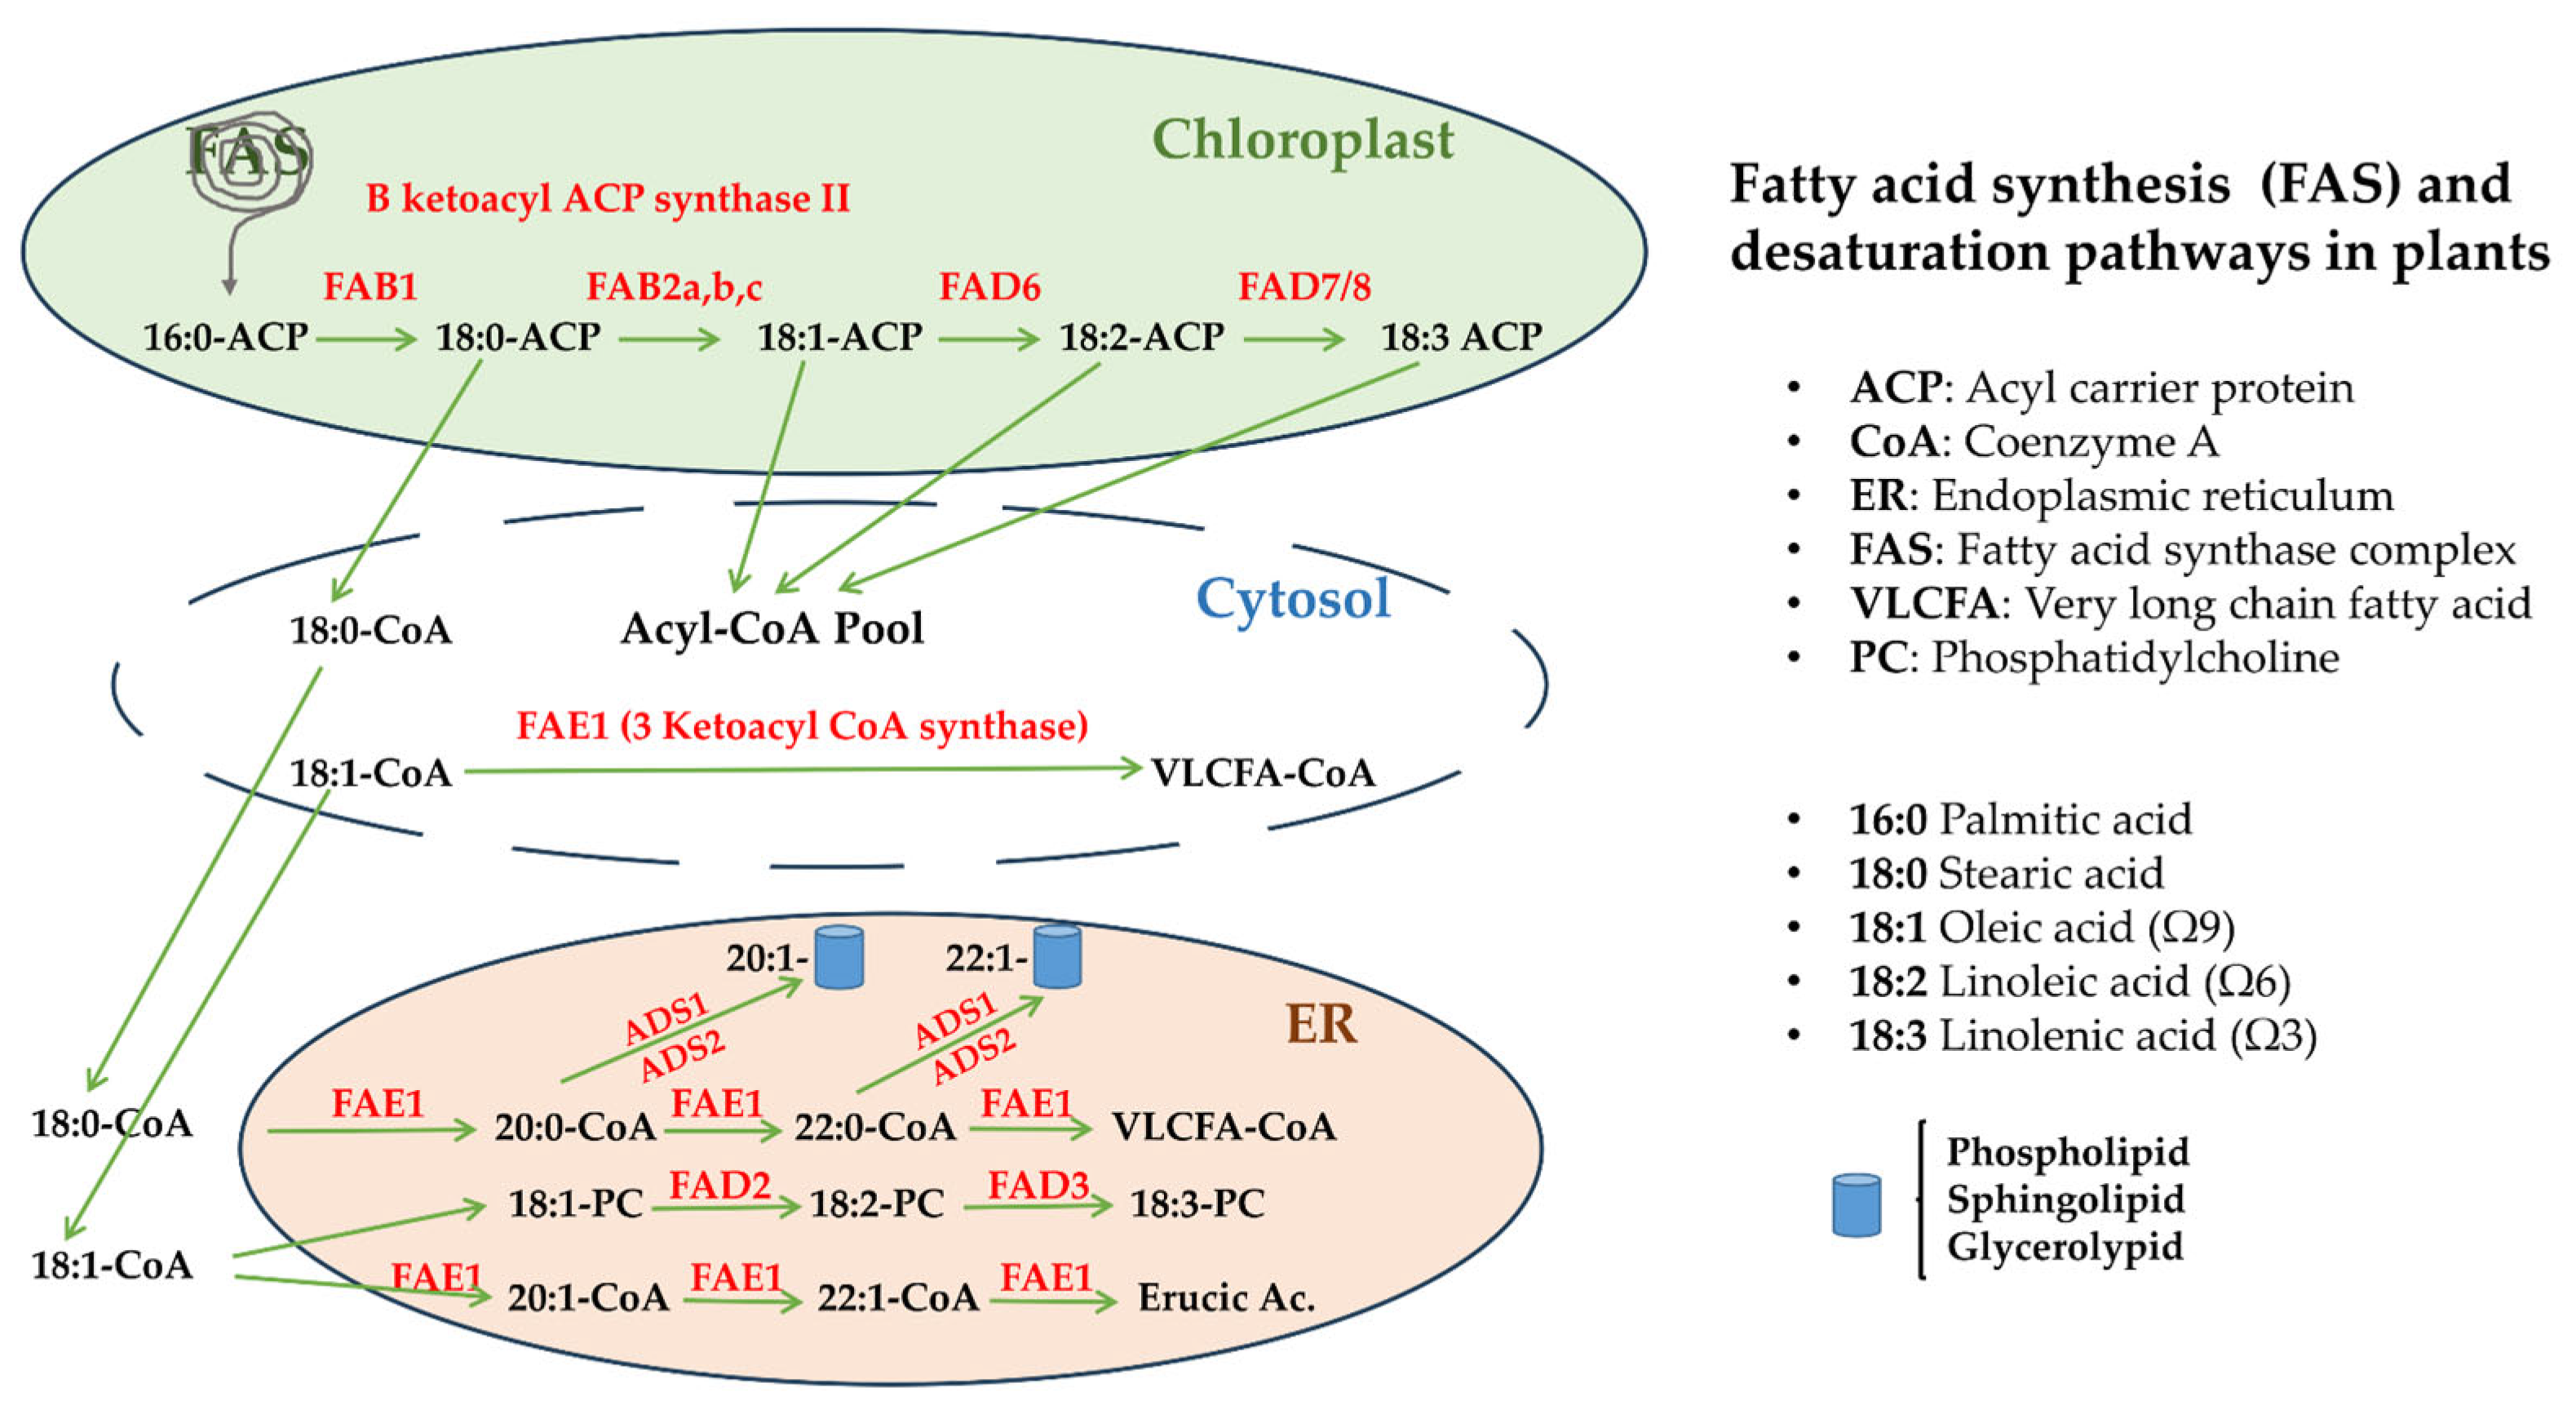
1. Introduction
2. Materials and Methods
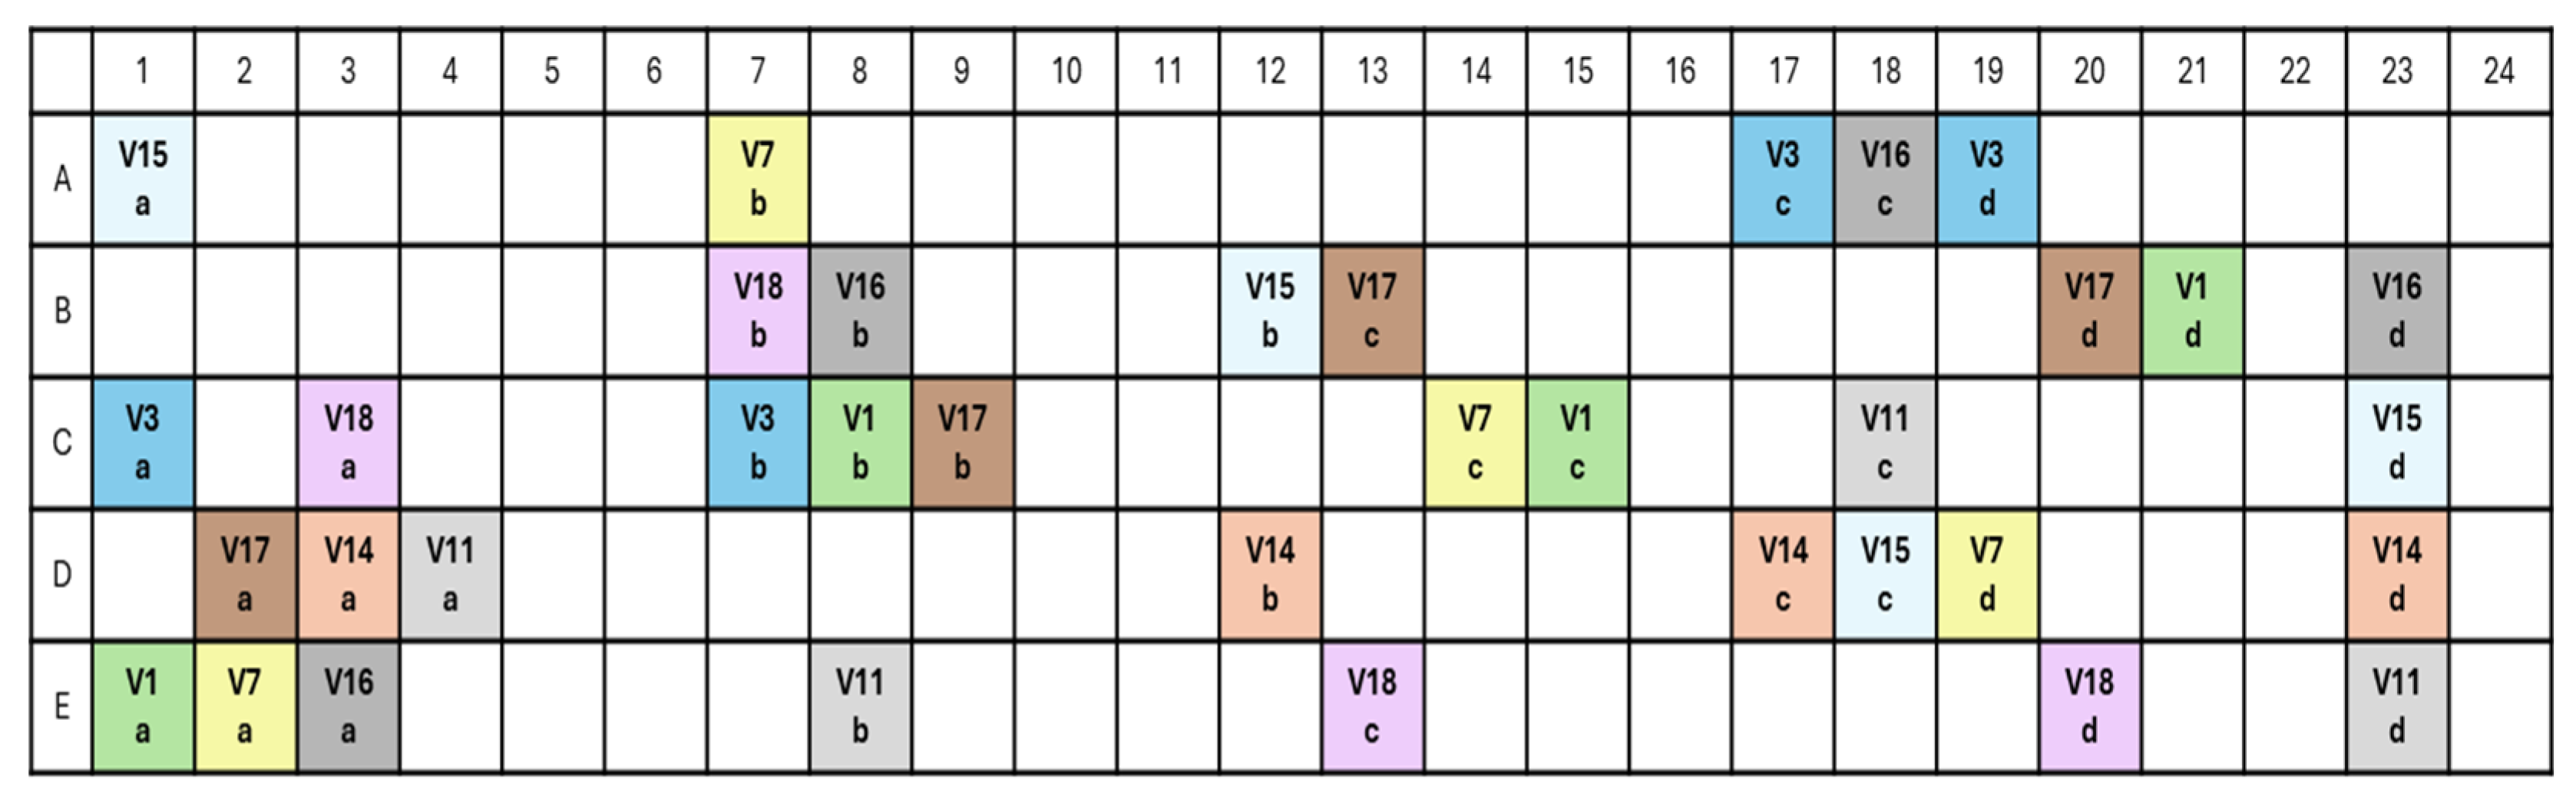
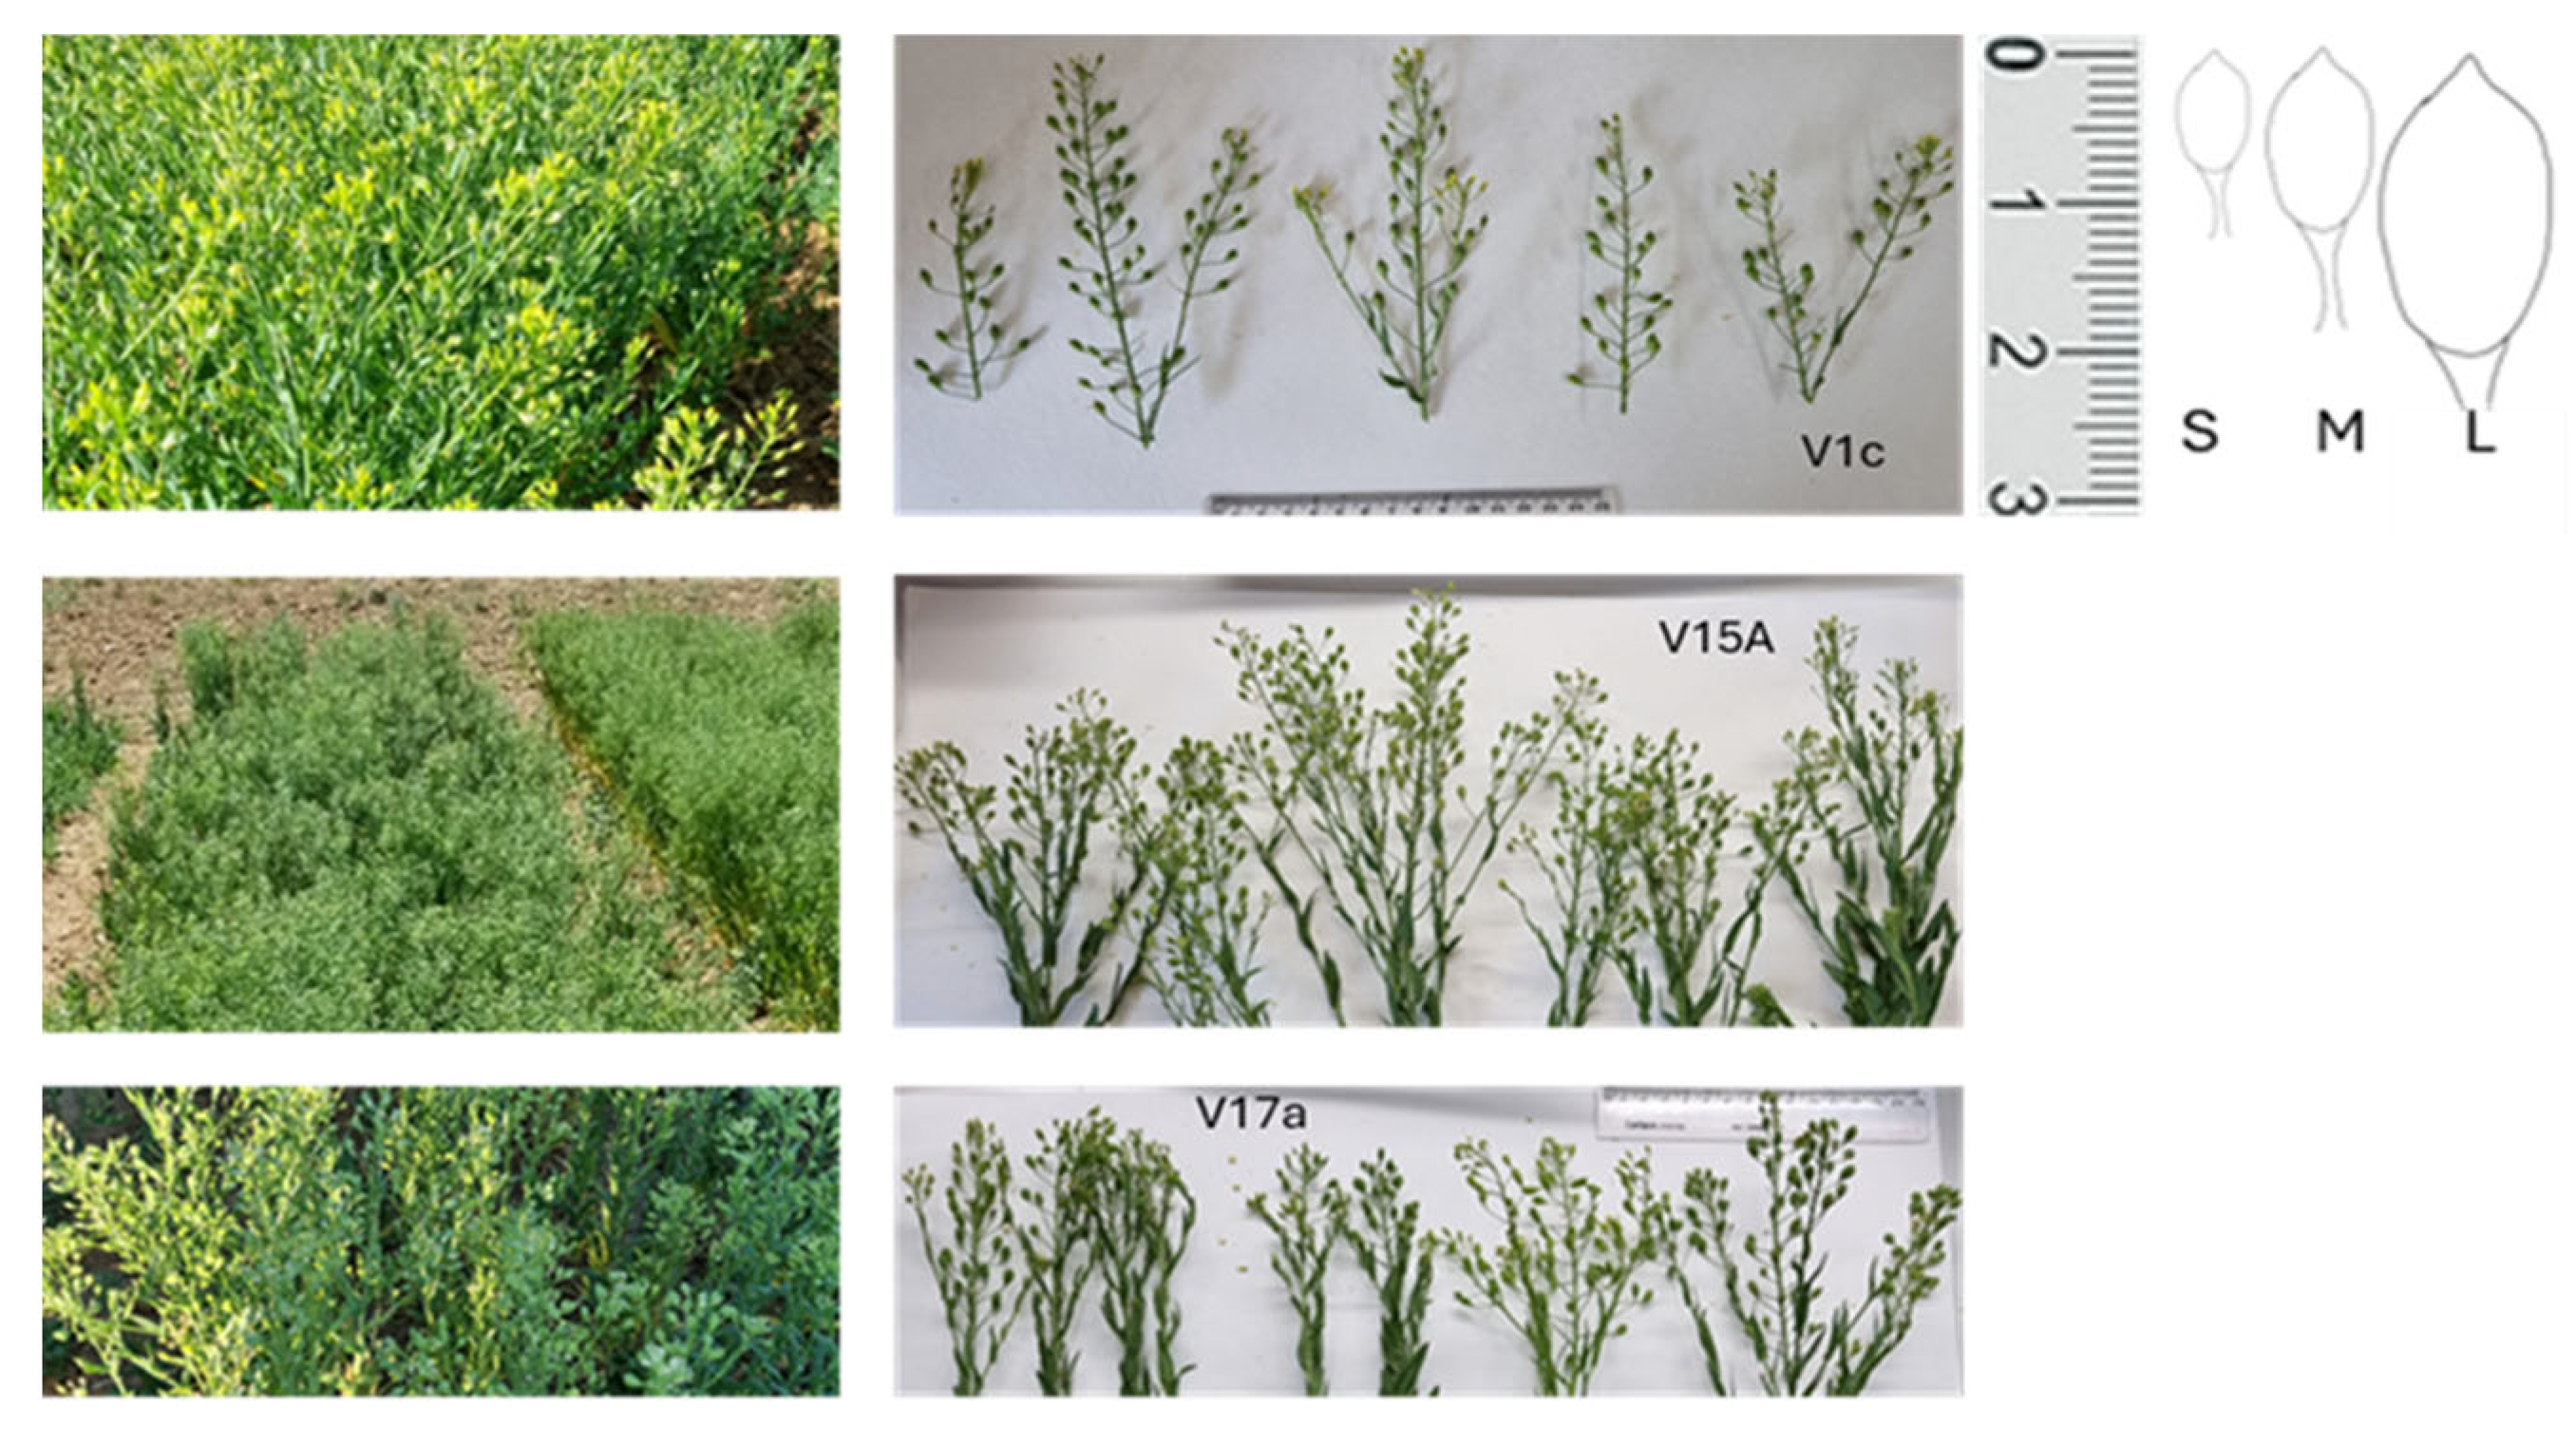
2.1. Plant Material and Experimental Design
2.2. Sample Collection
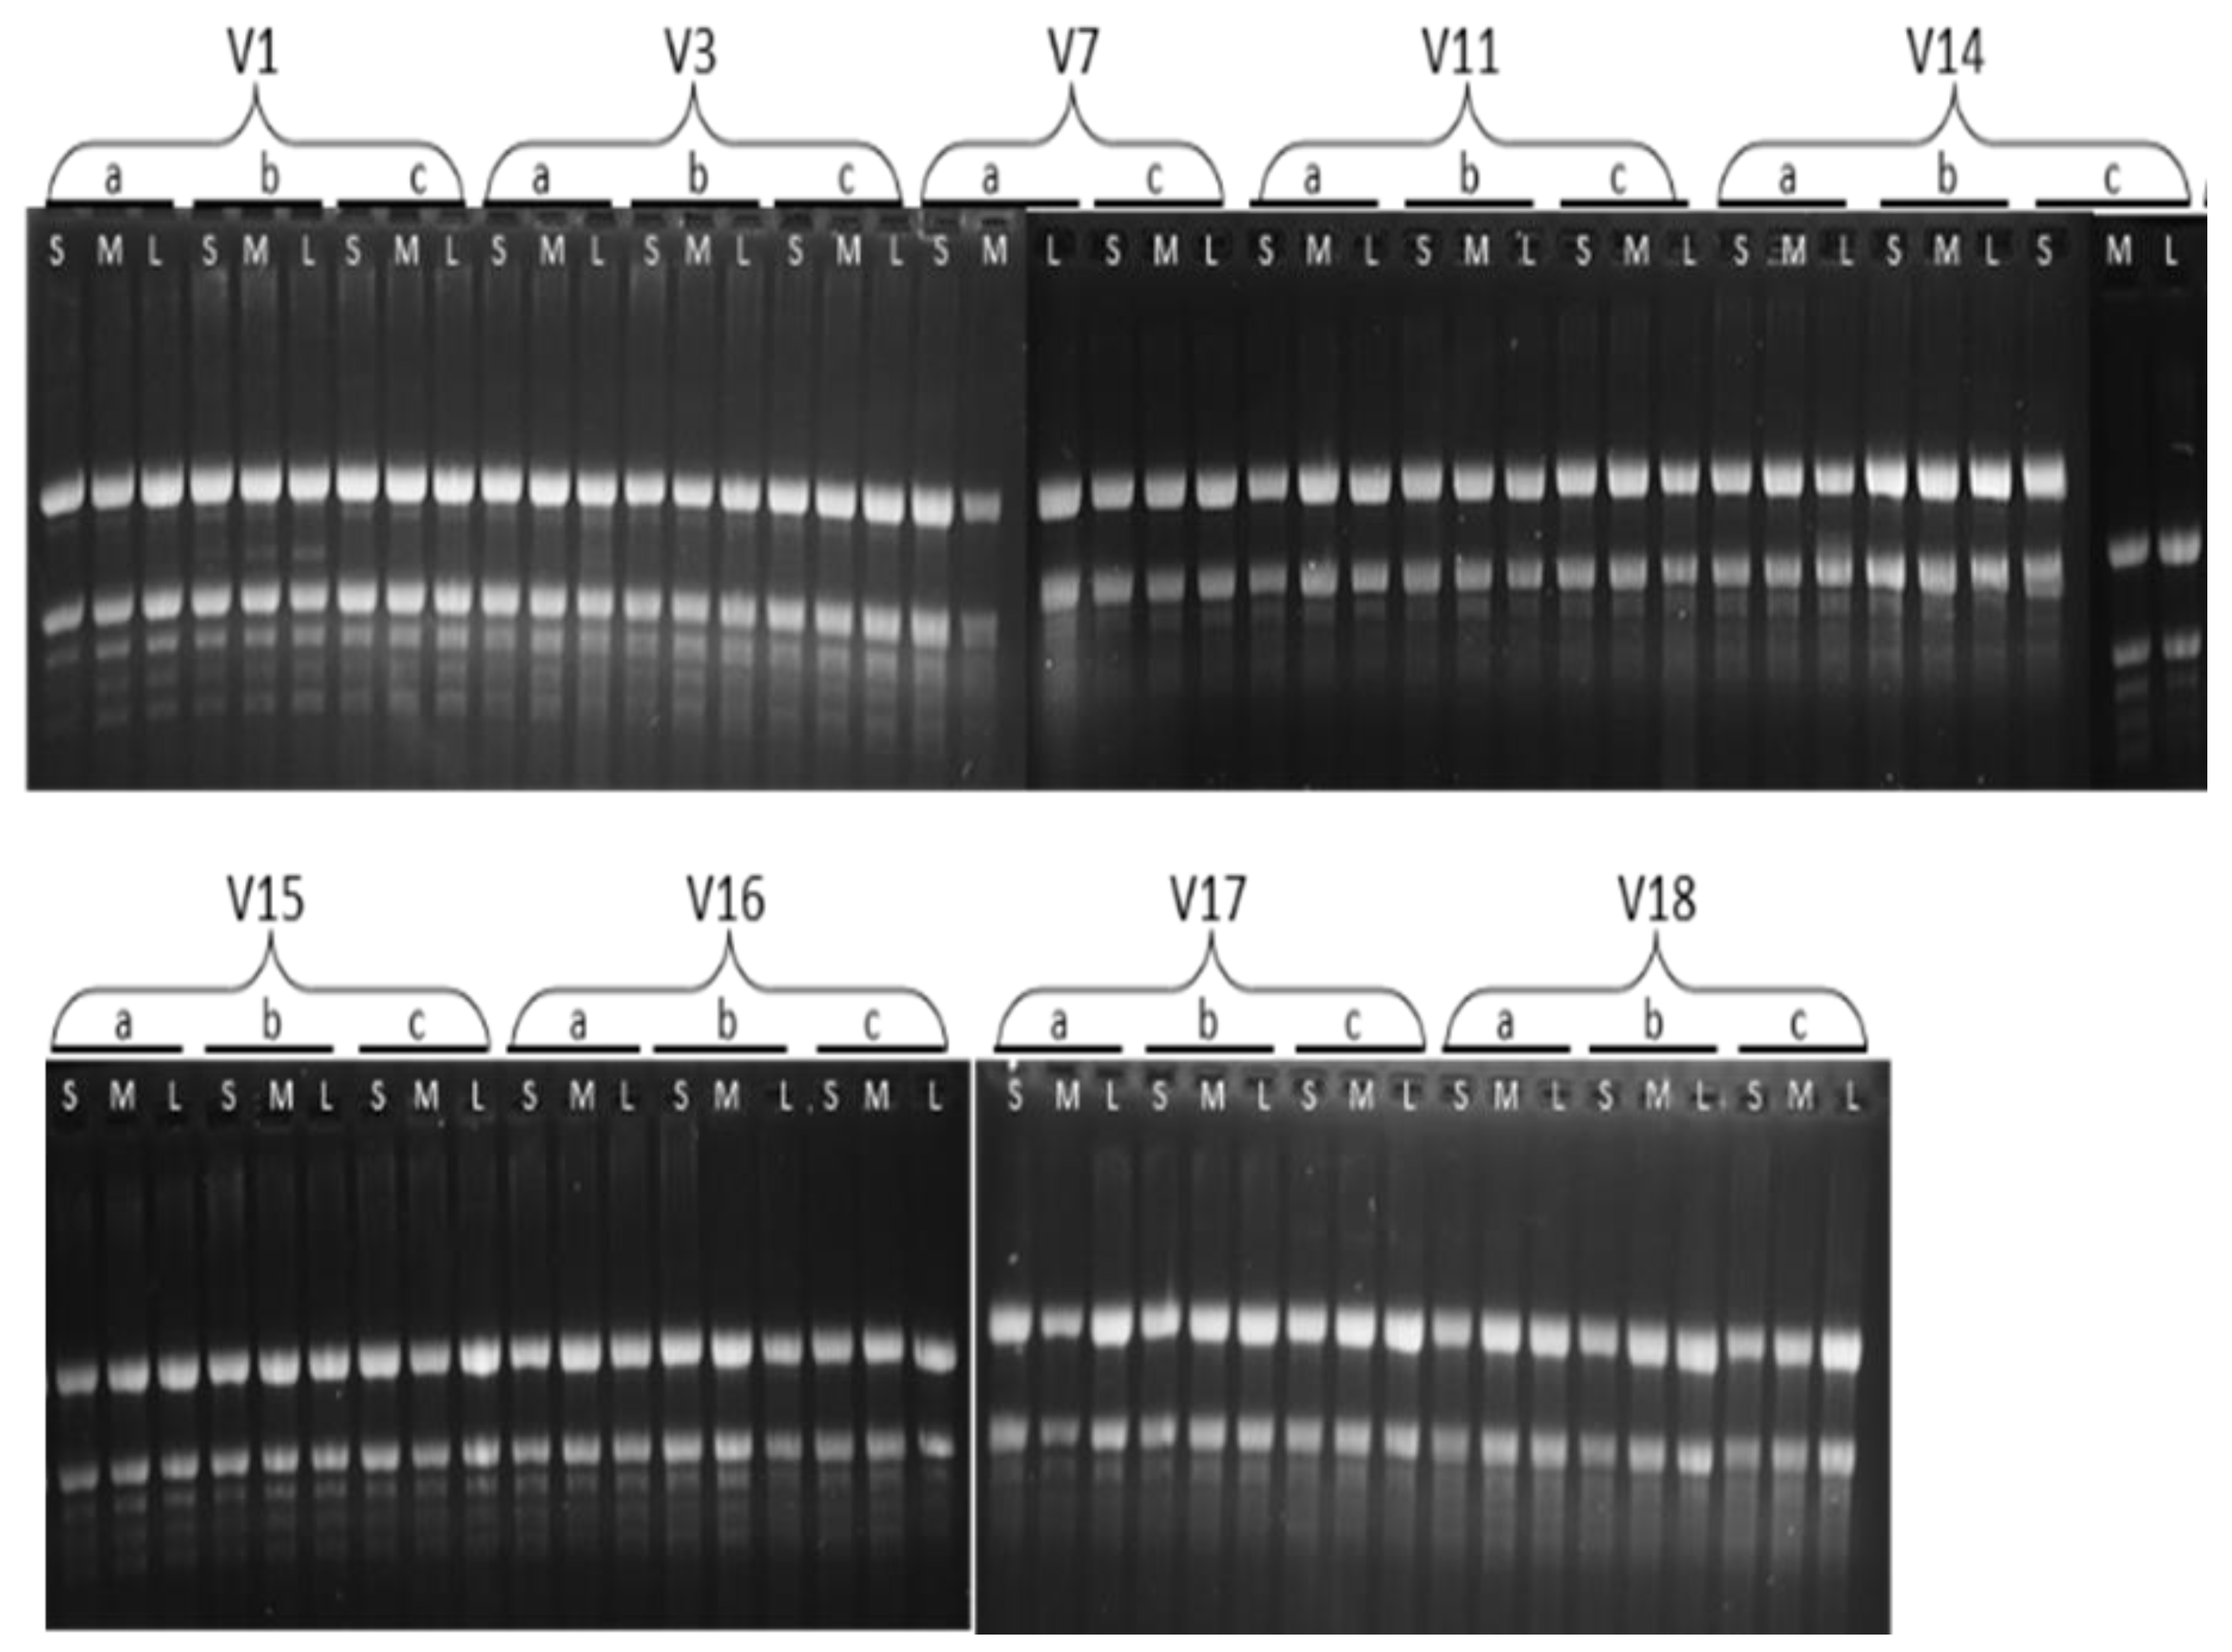
2.3. RNA Extraction and cDNA Synthesis
2.4. Candidate Gene Selection
2.5. Primer Design
2.6. qRT-PCR Analysis
- Preincubation at 95 °C, 120″;
- Amplification for 40× (95 °C, 5″, ramp 4.4 °C/s; 60 °C, 30″, ramp 1 °C/s; fluorescence acquisition);
- Melting from 60 °C to 97 °C continuously (4.4 °C/s).
2.7. Data Analysis
2.8. Statistical Analysis
3. Results
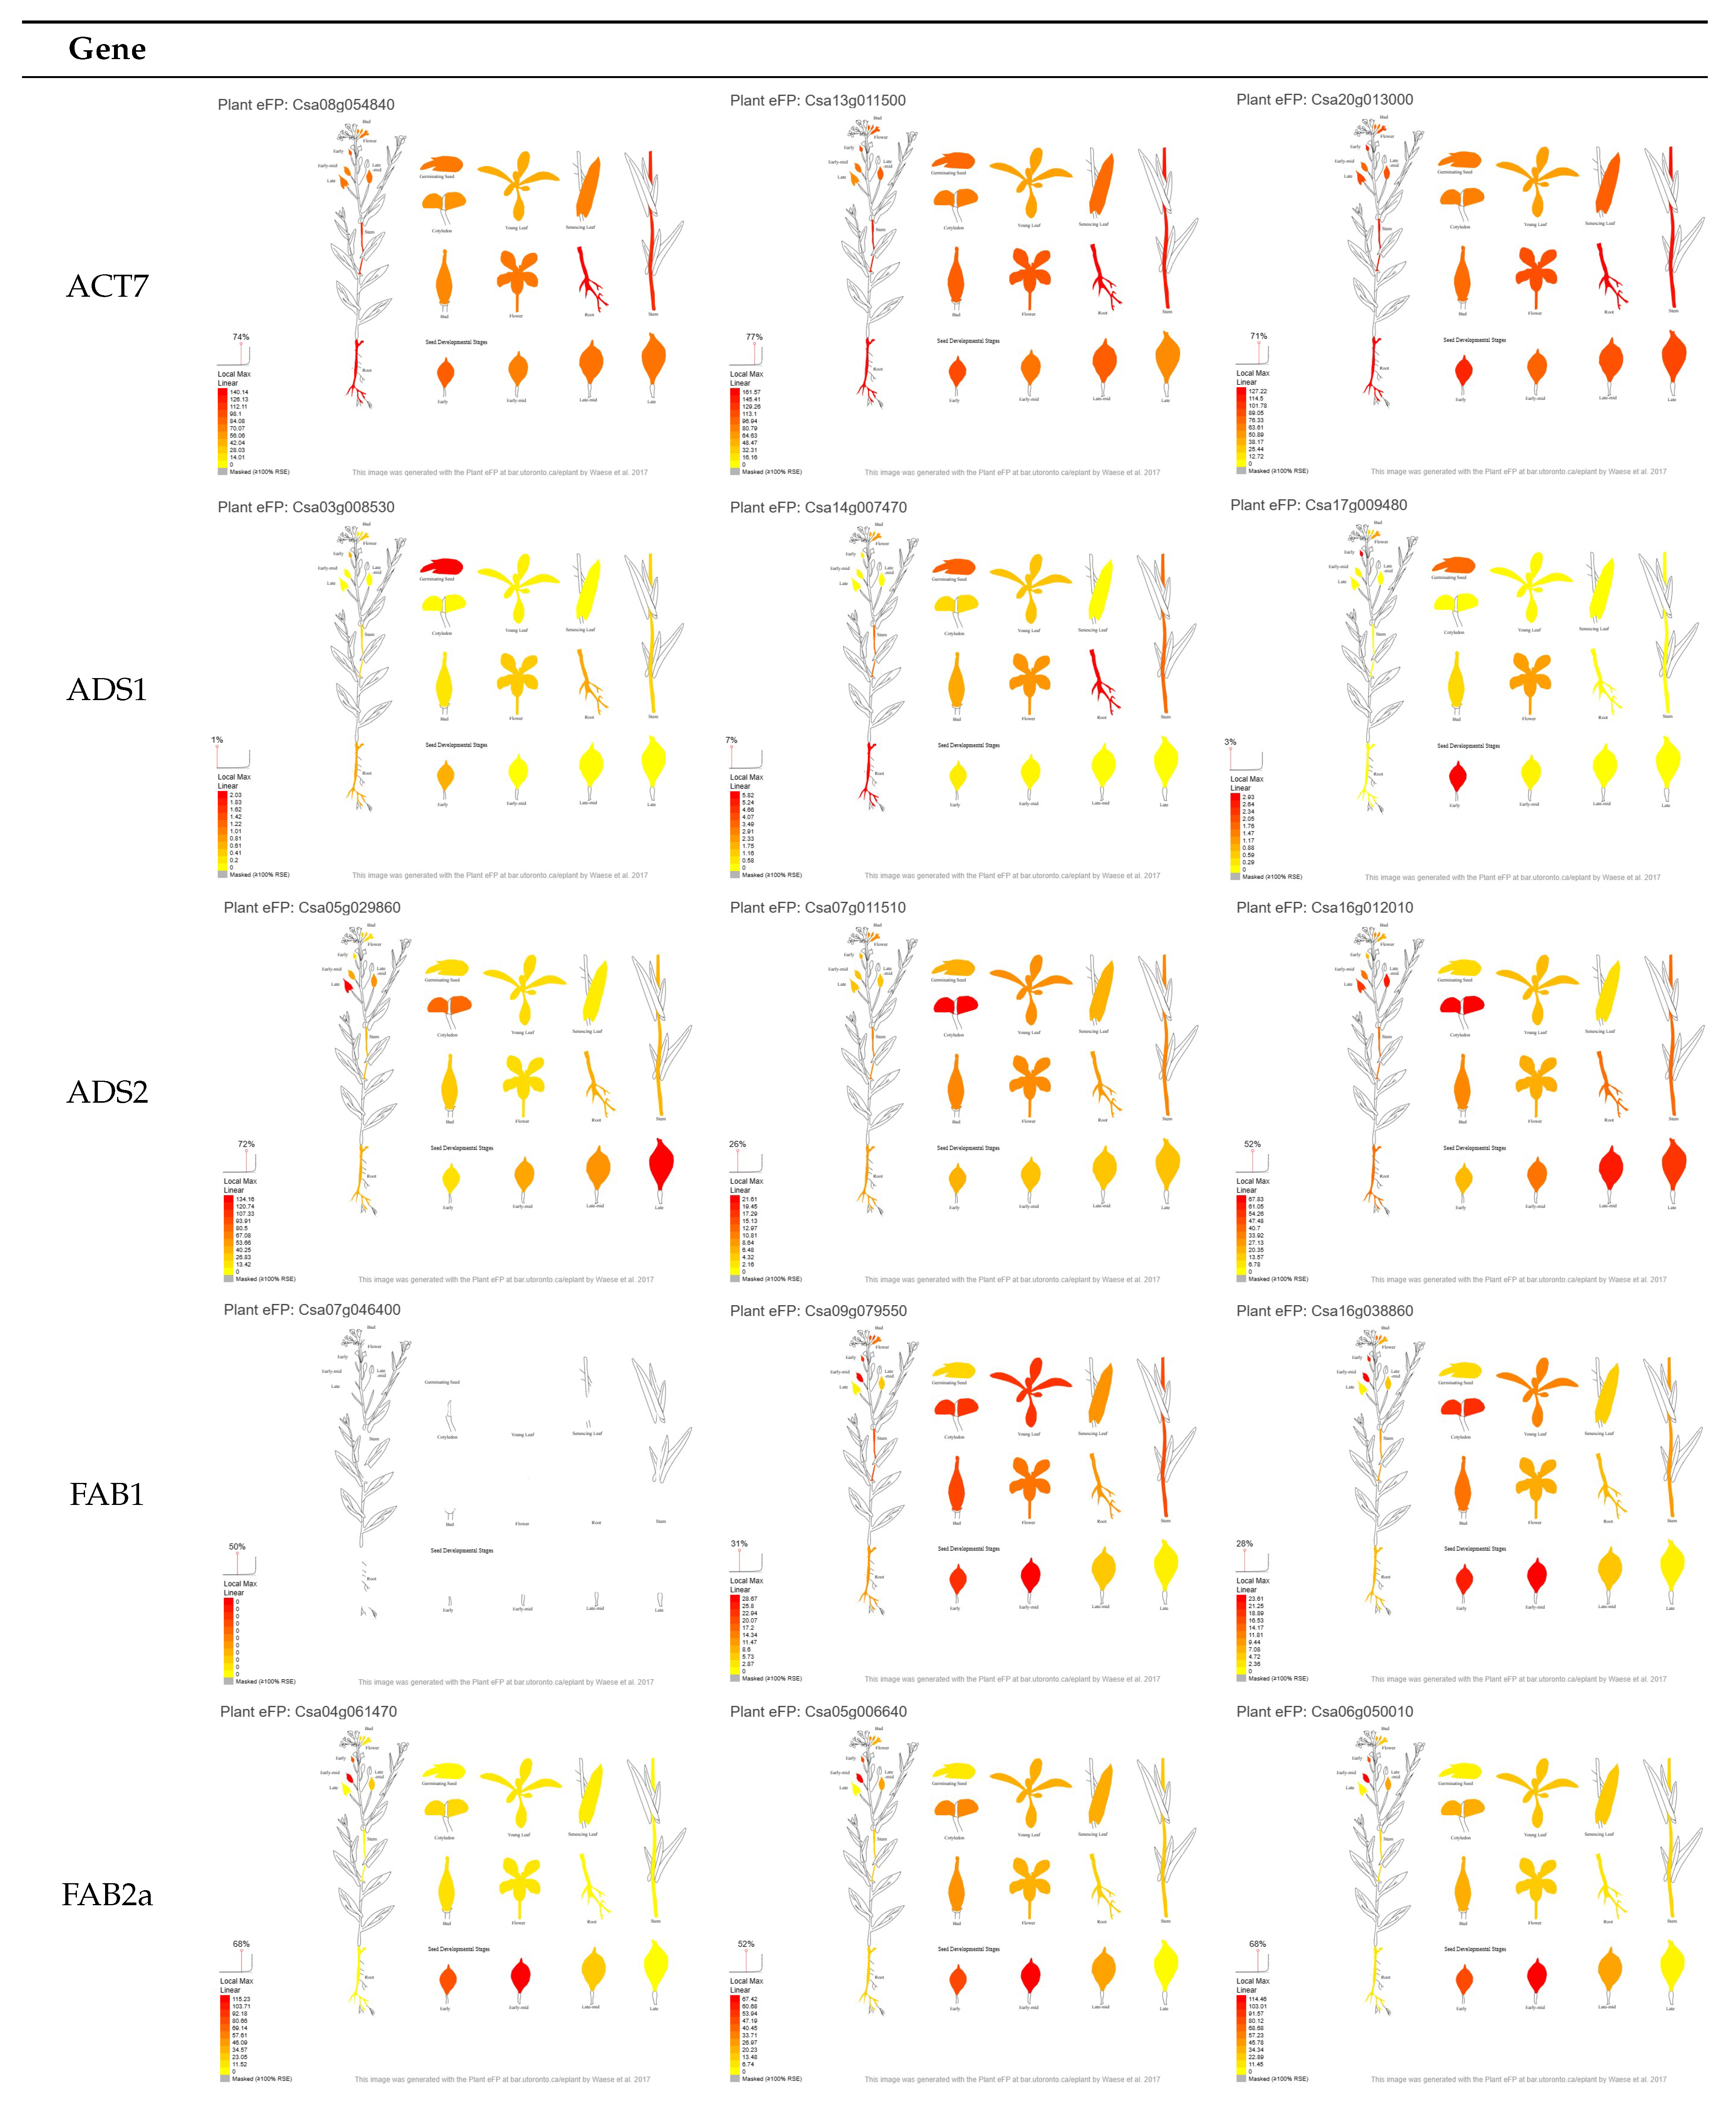
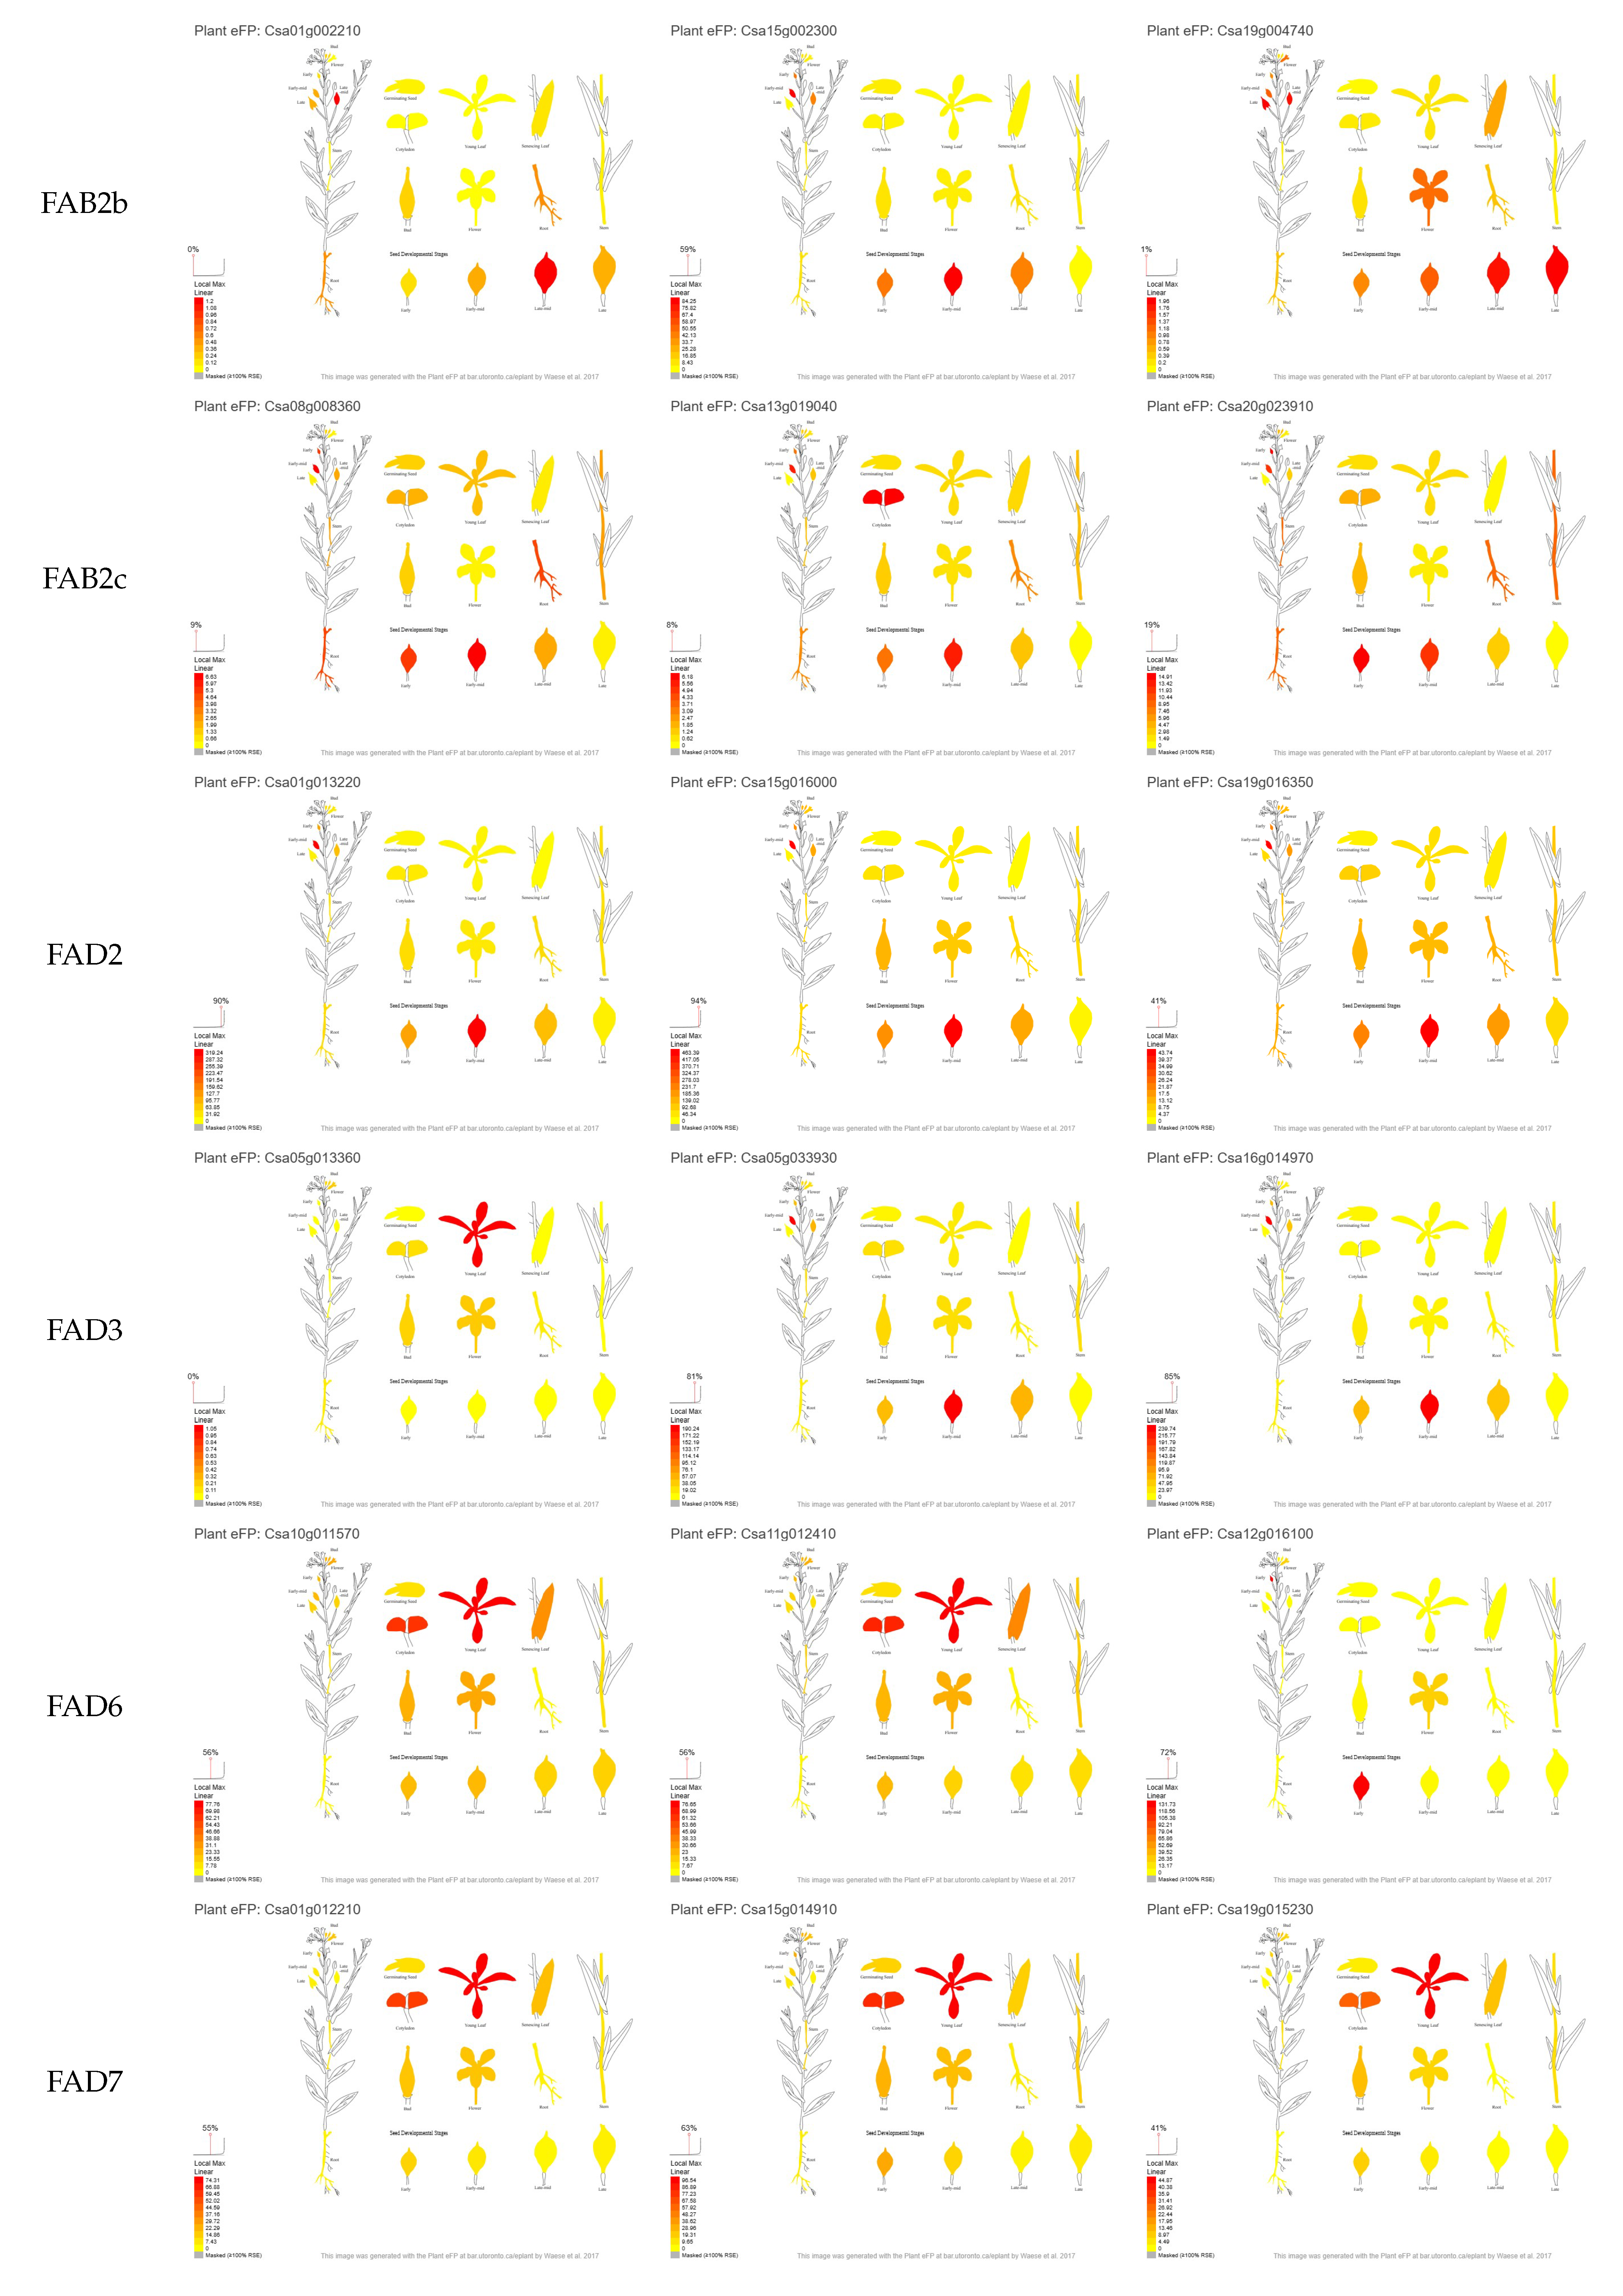
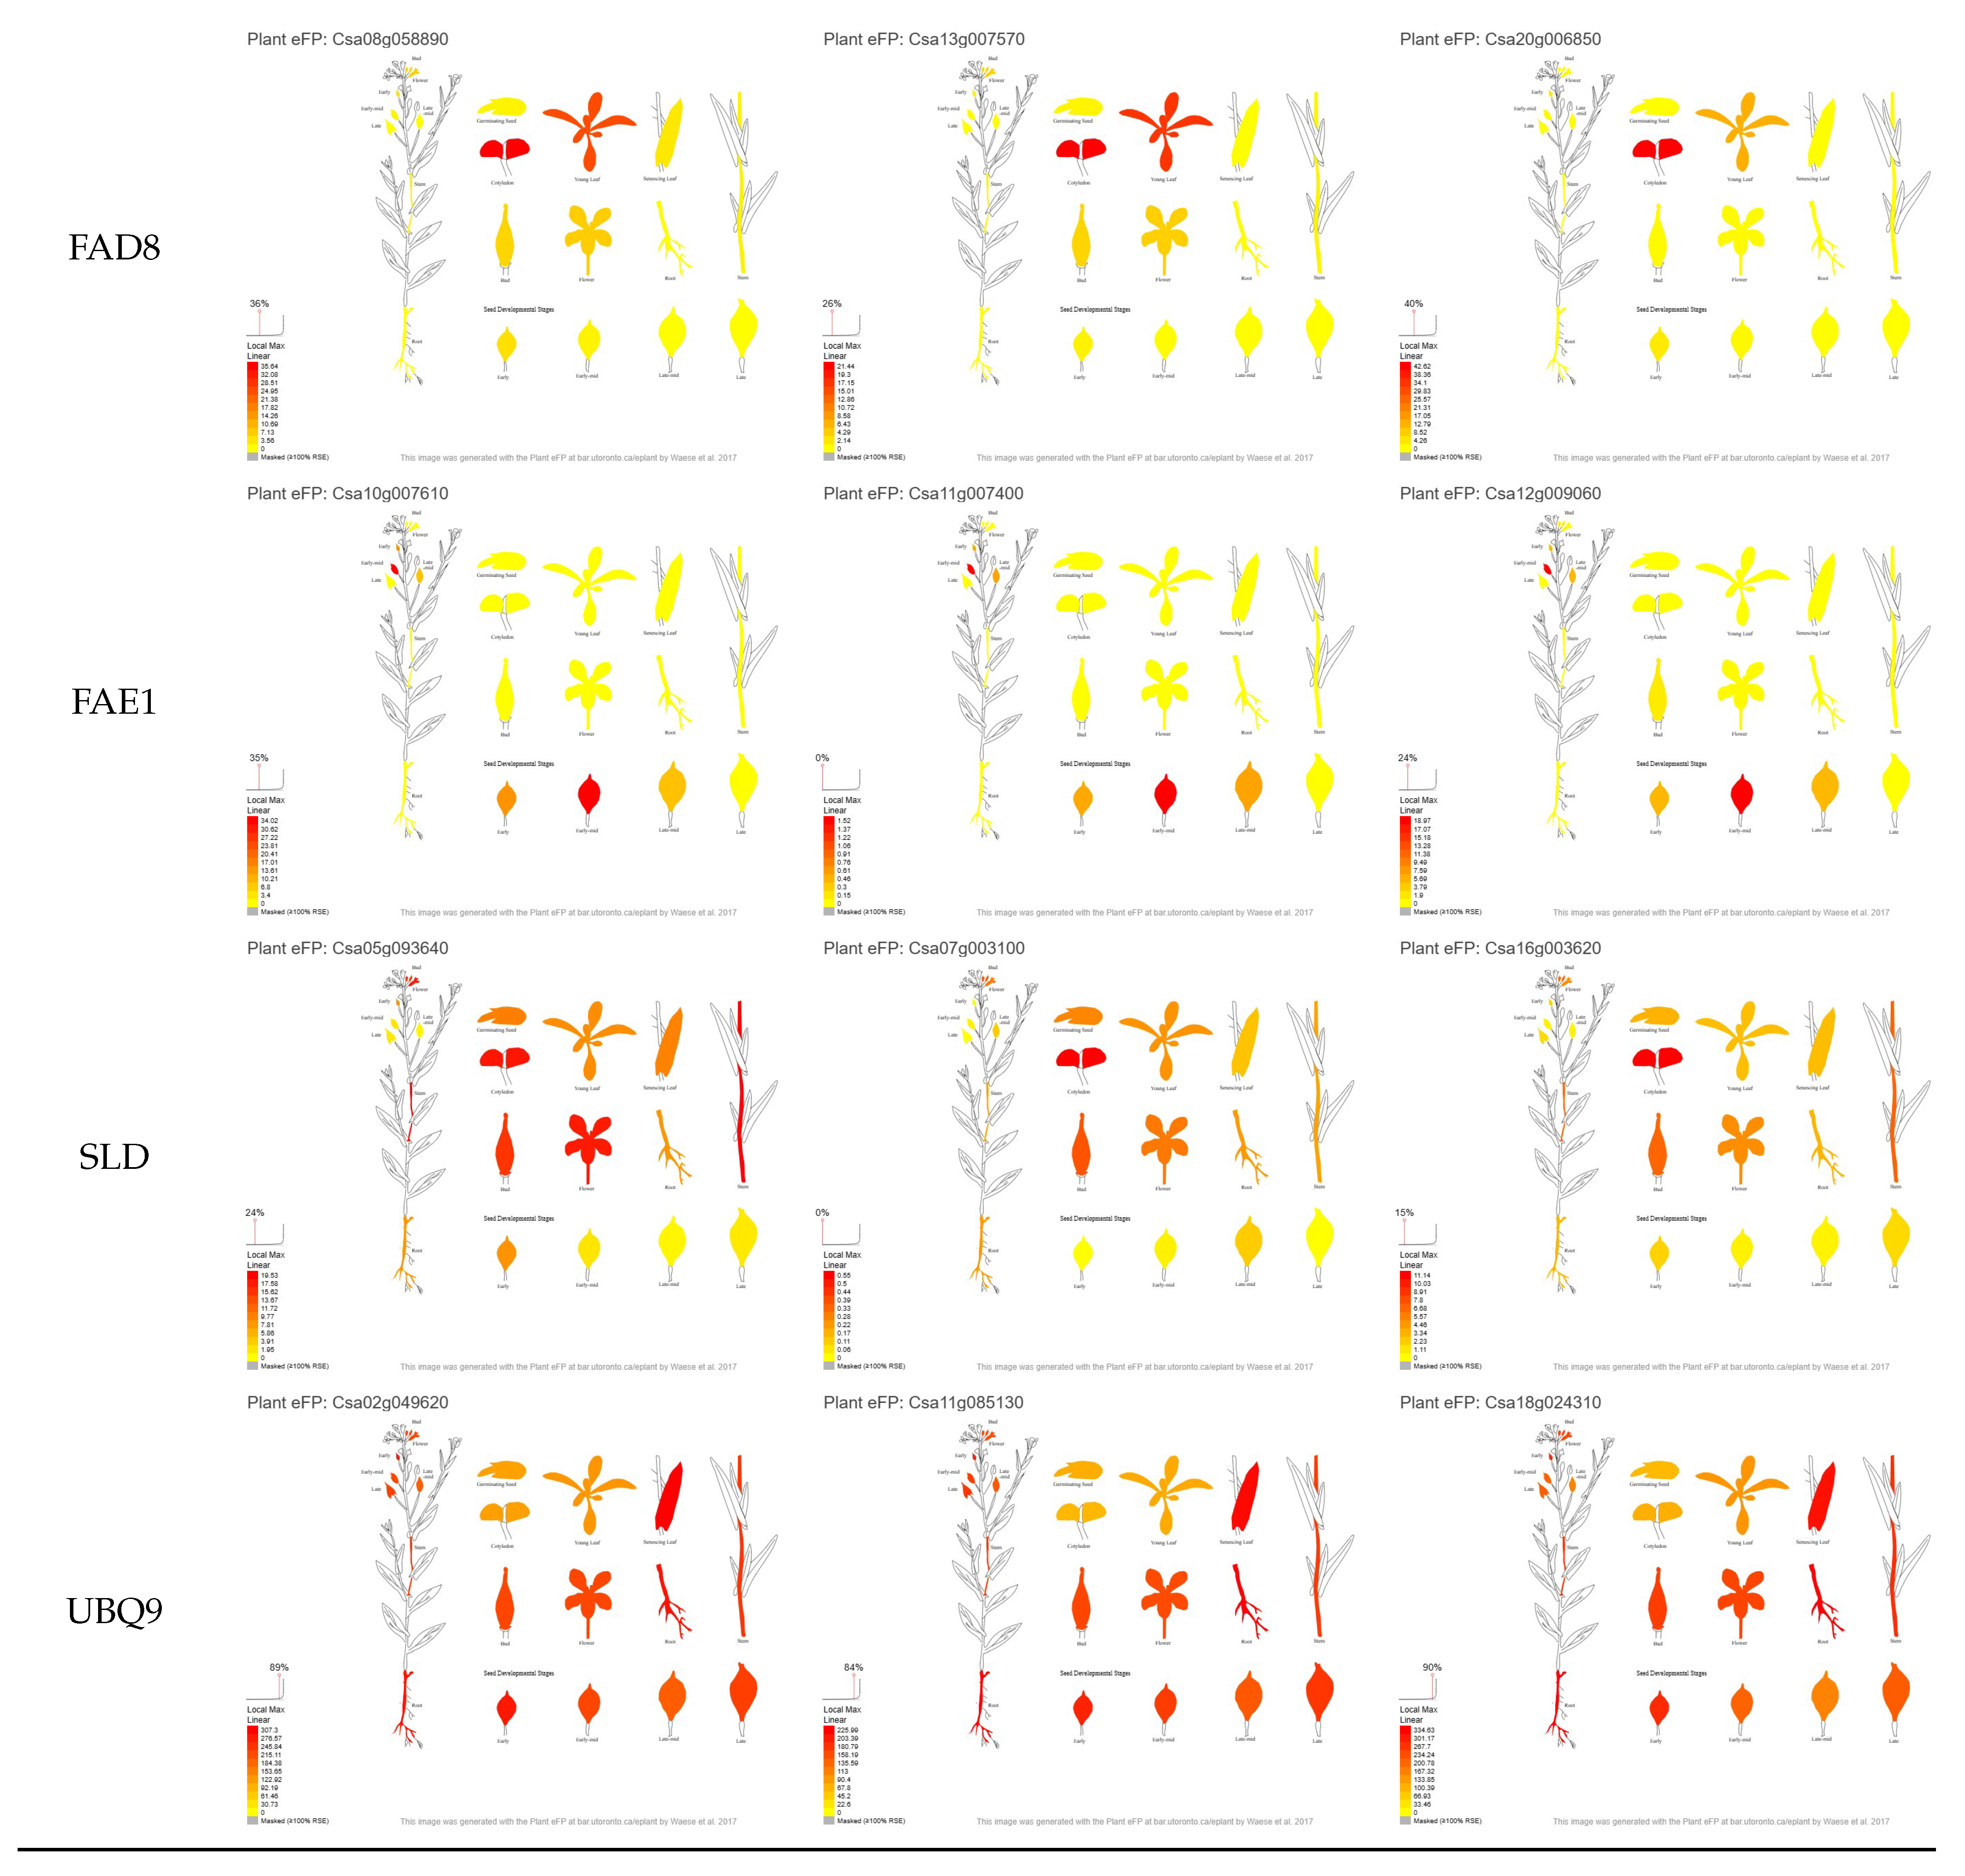
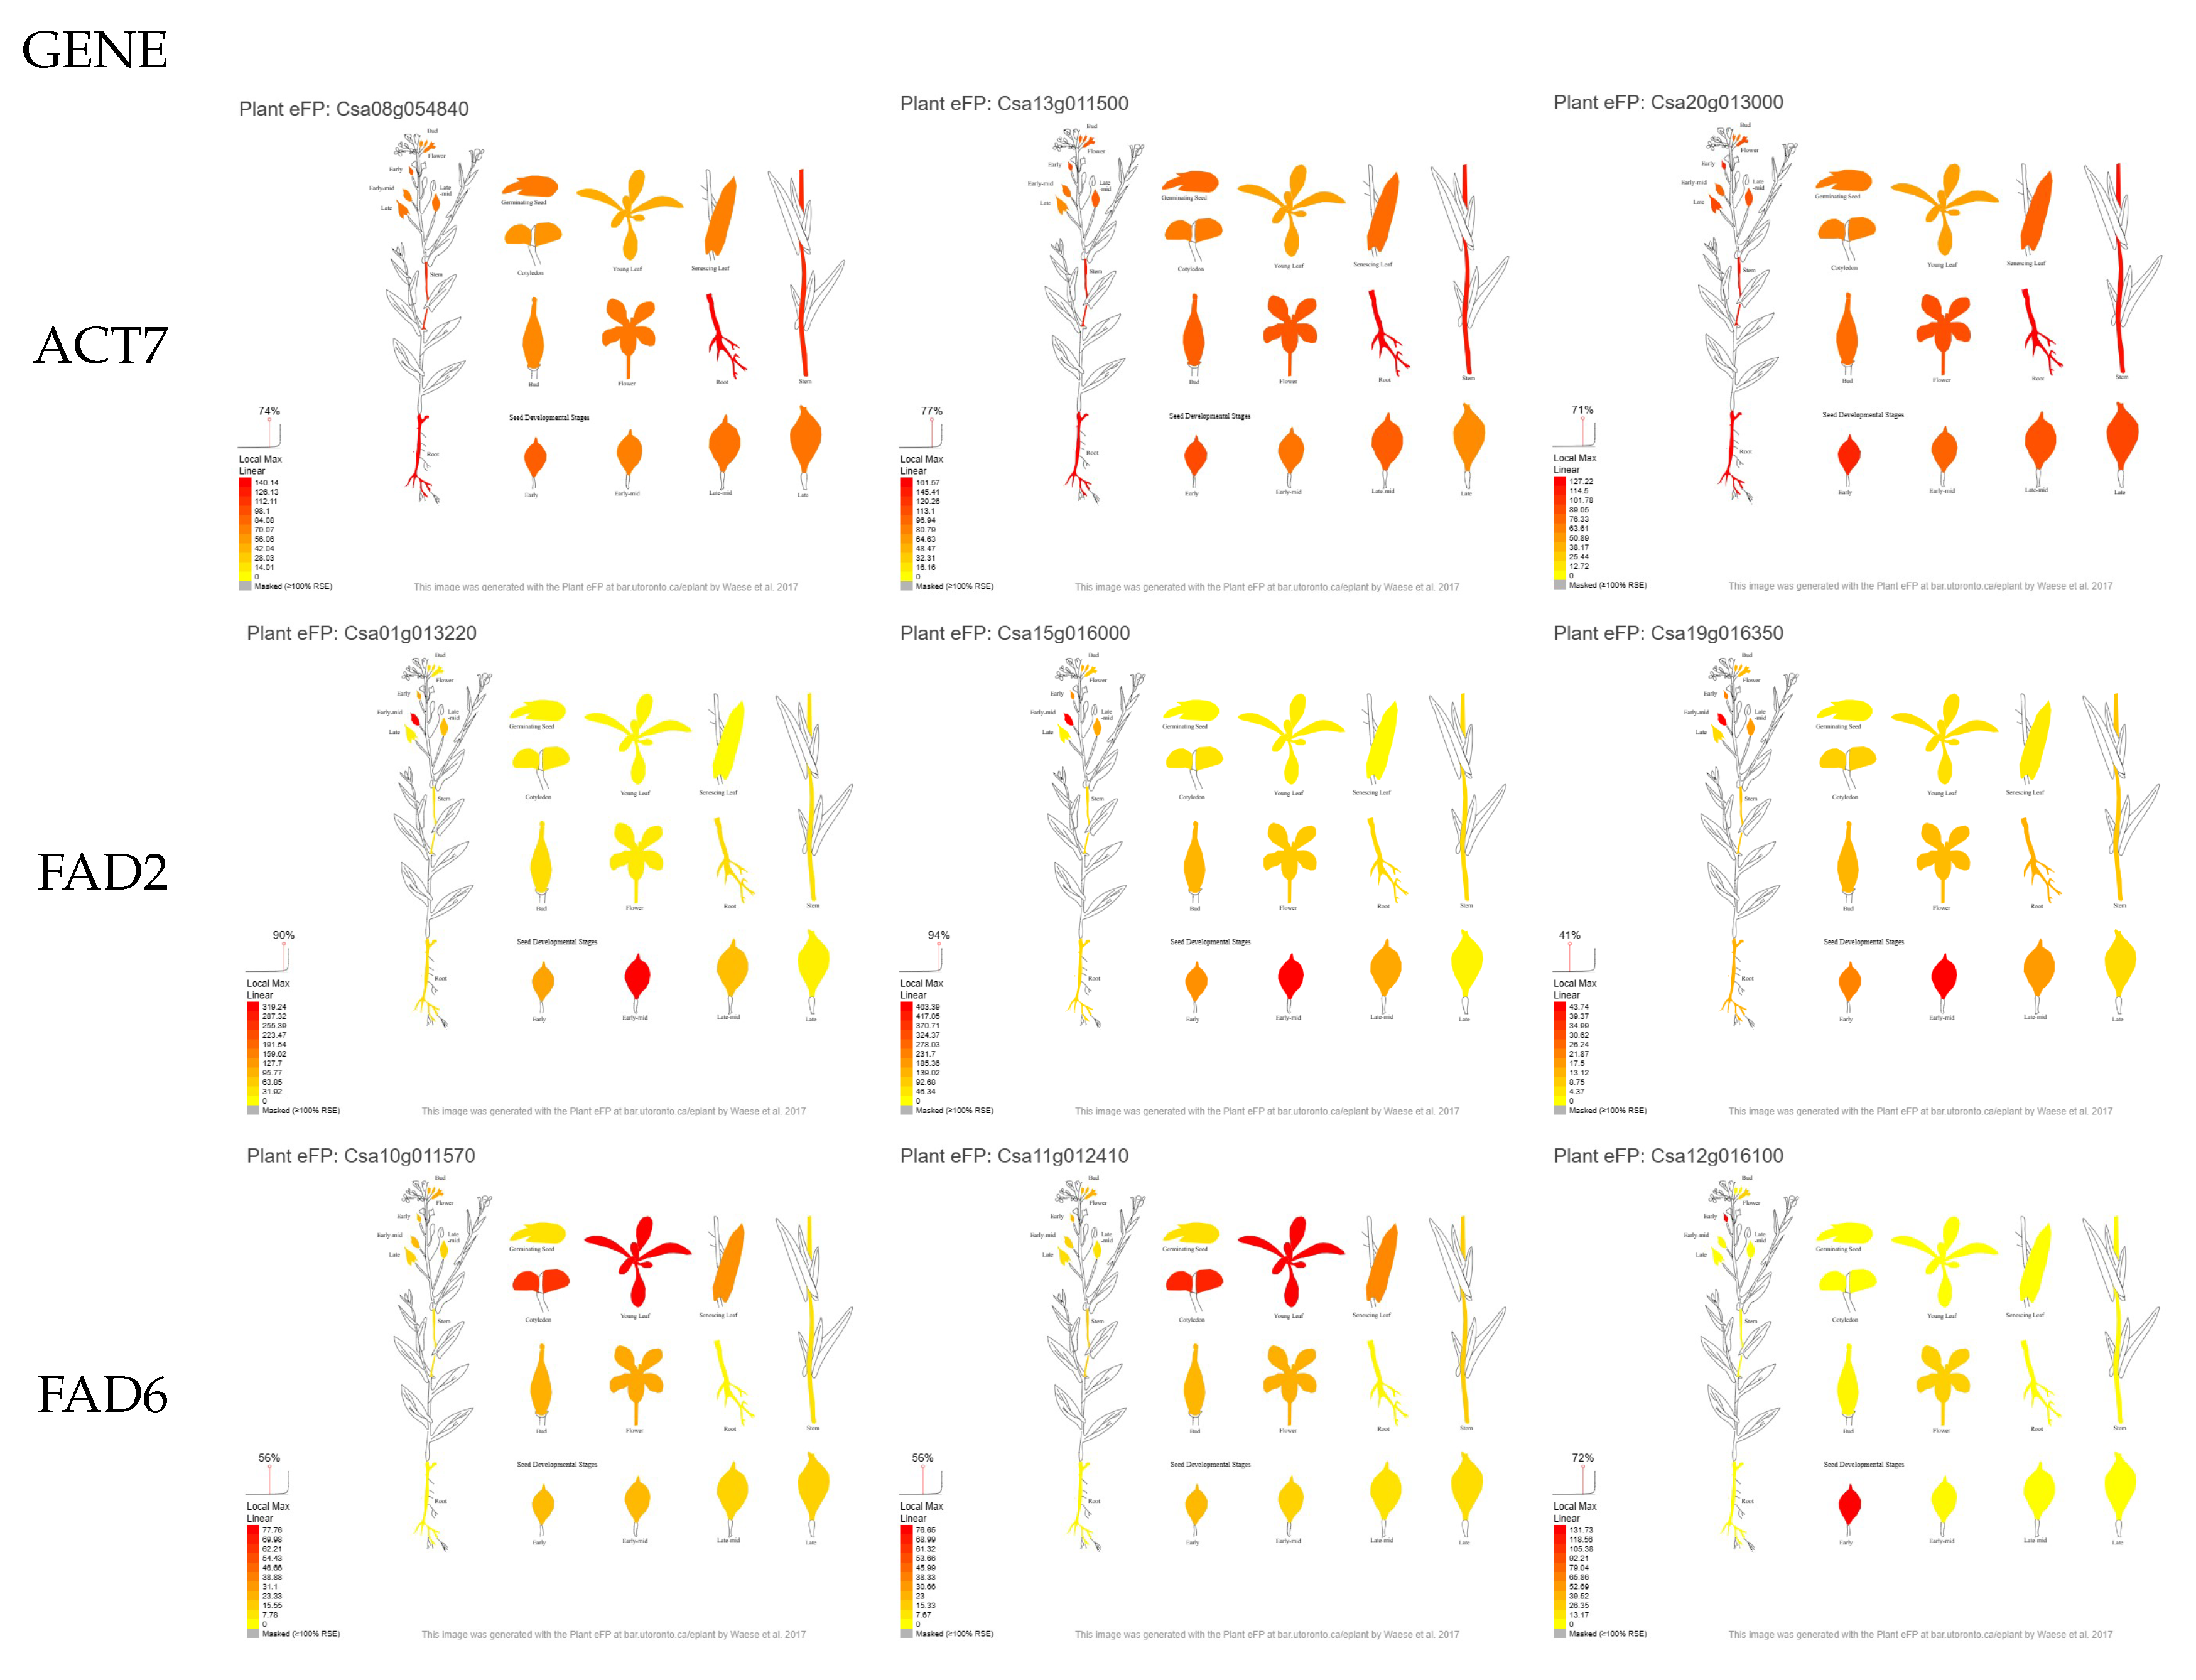
3.1. Selection of Candidate Genes Based on Their in Silico Expression Pattern
3.2. Primer Design
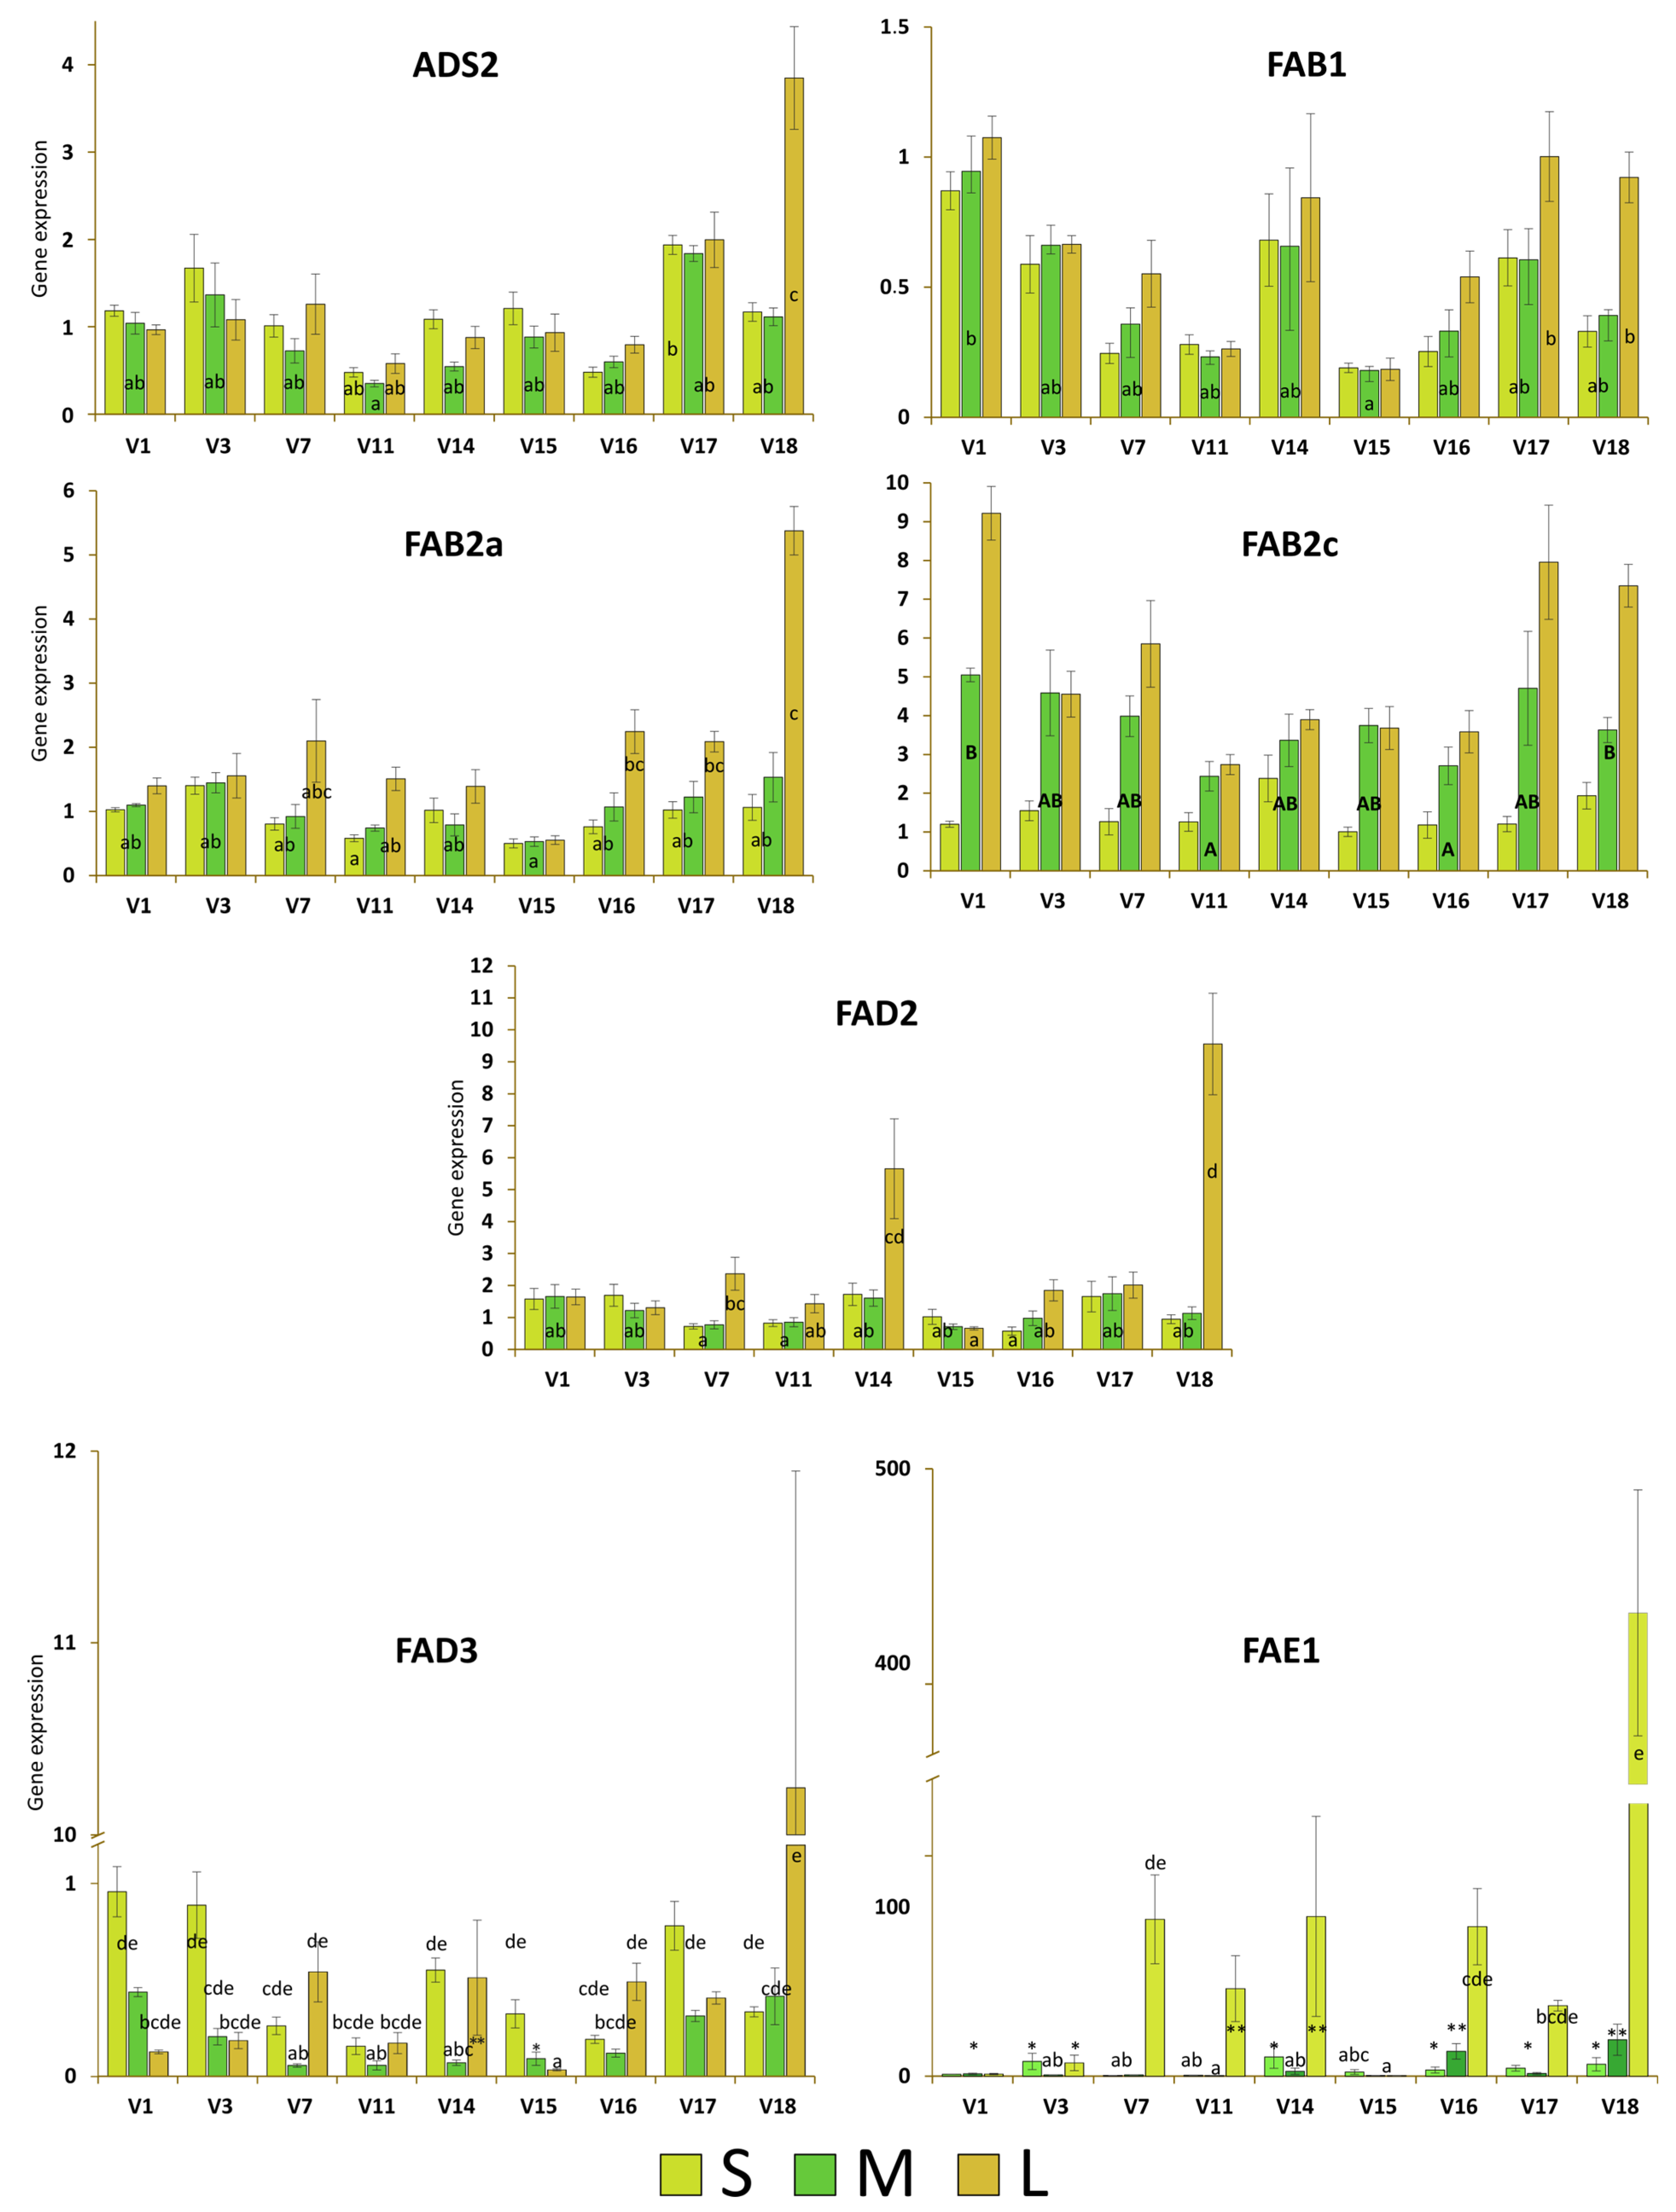
3.3. Expresssion Analyses
3.3.1. ADS2
3.3.2. FAB1
3.3.3. FAB2a
3.3.4. FAB2c
3.3.5. FAD2
3.3.6. FAD3
3.3.7. FAE1
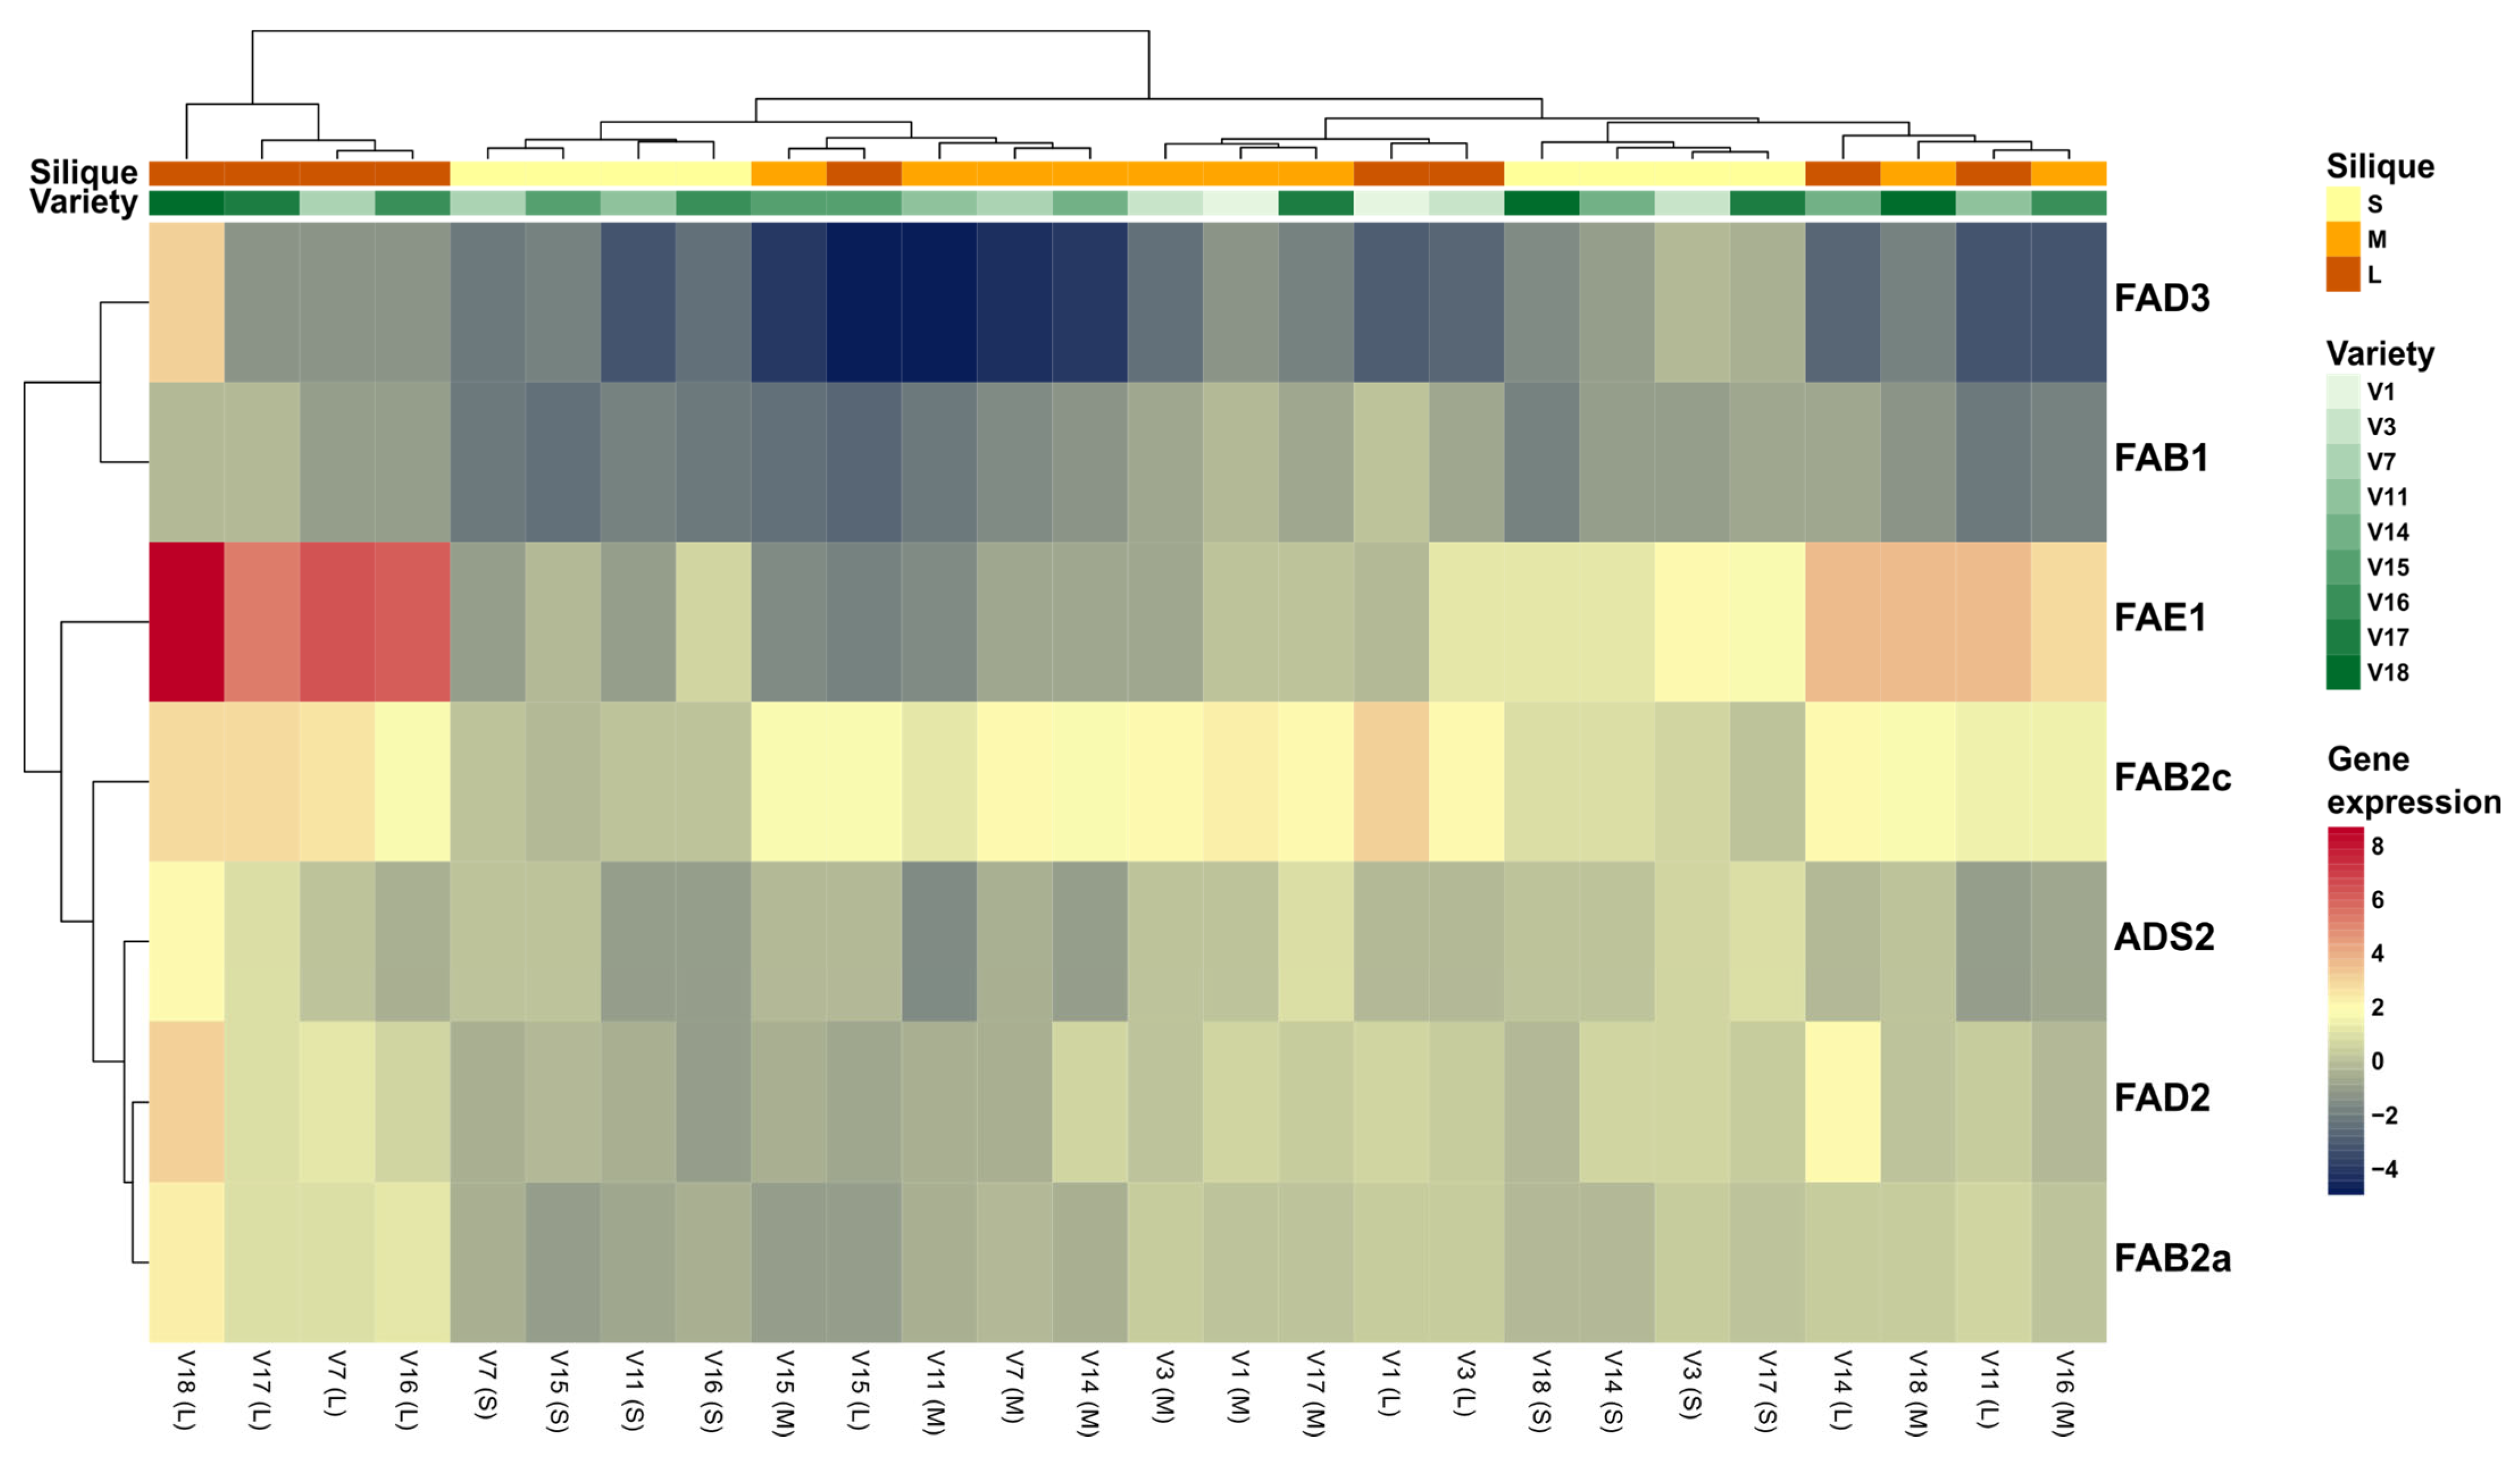
3.3.8. Global Analyses
4. Discussion
4.1. Gene Expression Insights
4.2. Functional and Applied Implications
5. Conclusions
Author Contributions
Funding
Institutional Review Board Statement
Data Availability Statement
Conflicts of Interest
Appendix A

| Sample | Type | Conc. | Unit | A260 (Abs) | A280 (Abs) | 260/280 | 260/230 | Date and Time |
|---|---|---|---|---|---|---|---|---|
| V1.1 S | RNA | 14,597 | ng/µL | 36,493 | 16,682 | 219 | 238 | 21 June 2023 17:12:38 |
| V1.1 M | RNA | 5381 | ng/µL | 13,454 | 6381 | 211 | 204 | 21 June 2023 17:14:19 |
| V1.1 L | RNA | 6289 | ng/µL | 15,723 | 7424 | 212 | 203 | 21 June 2023 17:15:16 |
| V1.2 S | RNA | 15,293 | ng/µL | 38,232 | 17,312 | 221 | 235 | 21 June 2023 17:16:22 |
| V1.2 M | RNA | 8644 | ng/µL | 21,609 | 10,050 | 215 | 207 | 21 June 2023 17:17:10 |
| V1.2 L | RNA | 7560 | ng/µL | 18,900 | 8968 | 211 | 181 | 21 June 2023 17:18:07 |
| V1.3 S | RNA | 12,185 | ng/µL | 30,462 | 13,809 | 221 | 240 | 21 June 2023 17:18:54 |
| V1.3 M | RNA | 9517 | ng/µL | 23,793 | 11,154 | 213 | 202 | 21 June 2023 17:19:50 |
| V1.3 L | RNA | 5643 | ng/µL | 14,108 | 6774 | 208 | 167 | 21 June 2023 17:20:45 |
| V3.1 S | RNA | 10,763 | ng/µL | 26,909 | 12,198 | 221 | 240 | 21 June 2023 17:53:15 |
| V3.1 M | RNA | 5870 | ng/µL | 14,676 | 7200 | 204 | 152 | 21 June 2023 17:54:18 |
| V3.1 L | RNA | 6160 | ng/µL | 15,400 | 7257 | 212 | 207 | 21 June 2023 17:55:03 |
| V3.2 S | RNA | 13,064 | ng/µL | 32,660 | 14,816 | 220 | 239 | 21 June 2023 17:55:54 |
| V3.2 M | RNA | 6226 | ng/µL | 15,565 | 7266 | 214 | 219 | 21 June 2023 17:56:35 |
| V3.2 L | RNA | 7887 | ng/µL | 19,717 | 9359 | 211 | 168 | 21 June 2023 17:57:24 |
| V3.3 S | RNA | 11,845 | ng/µL | 29,612 | 13,572 | 218 | 241 | 21 June 2023 17:58:12 |
| V3.3 M | RNA | 8102 | ng/µL | 20,255 | 9338 | 217 | 207 | 21 June 2023 17:58:59 |
| V3.3 L | RNA | 7916 | ng/µL | 19,789 | 9351 | 212 | 169 | 21 June 2023 17:59:49 |
| V7.1 S | RNA | 9600 | ng/µL | 24,000 | 10,842 | 221 | 242 | 22 June 2023 10:44:45 |
| V7.1 M | RNA | 5672 | ng/µL | 14,180 | 6663 | 213 | 212 | 22 June 2023 10:45:56 |
| V7.1 L | RNA | 7027 | ng/µL | 17,568 | 8146 | 216 | 222 | 22 June 2023 10:46:44 |
| V7.3 S | RNA | 9094 | ng/µL | 22,735 | 10,388 | 219 | 233 | 14 June 2023 10:28:01 |
| V7.3 M | RNA | 8559 | ng/µL | 21,398 | 9807 | 218 | 231 | 14 June 2023 10:29:39 |
| V7.3 L | RNA | 7142 | ng/µL | 17,854 | 8117 | 220 | 225 | 14 June 2023 10:30:32 |
| V7.2 S | RNA | 16,599 | ng/µL | 41,496 | 19,023 | 218 | 239 | 22 June 2023 10:47:49 |
| V7.2 M | RNA | 8892 | ng/µL | 22,231 | 10,070 | 221 | 223 | 22 June 2023 10:51:20 |
| V7.2 L | RNA | 6608 | ng/µL | 16,521 | 7631 | 217 | 226 | 22 June 2023 10:52:03 |
| V11.1 S | RNA | 7351 | ng/µL | 18,377 | 8435 | 218 | 220 | 22 June 2023 10:53:02 |
| V11.1 M | RNA | 9940 | ng/µL | 24,850 | 11,381 | 218 | 224 | 22 June 2023 10:53:41 |
| V11.1 L | RNA | 8759 | ng/µL | 21,898 | 9937 | 220 | 224 | 22 June 2023 10:54:43 |
| V11.2 S | RNA | 12,417 | ng/µL | 31,041 | 14,113 | 220 | 229 | 22 June 2023 12:39:48 |
| V11.2 M | RNA | 5851 | ng/µL | 14,628 | 7103 | 206 | 152 | 22 June 2023 12:40:24 |
| V11.2 L | RNA | 1763 | ng/µL | 4407 | 2027 | 217 | 230 | 22 June 2023 12:41:24 |
| V11.3 S | RNA | 11,175 | ng/µL | 27,938 | 12,649 | 221 | 236 | 22 June 2023 12:42:20 |
| V11.3 M | RNA | 10,191 | ng/µL | 25,477 | 11,975 | 213 | 183 | 22 June 2023 12:43:04 |
| V11.3 L | RNA | 5431 | ng/µL | 13,577 | 6452 | 210 | 181 | 22 June 2023 12:44:05 |
| V14.1 L | RNA | 8625 | ng/µL | 21,562 | 9877 | 218 | 228 | 22 June 2023 12:45:00 |
| V14.1 M | RNA | 6124 | ng/µL | 15,309 | 7448 | 206 | 144 | 22 June 2023 12:45:50 |
| V14.1 L | RNA | 3936 | ng/µL | 9840 | 4692 | 210 | 171 | 22 June 2023 12:46:47 |
| V14.2 S | RNA | 12,435 | ng/µL | 31,087 | 13,639 | 228 | 242 | 27 June 2023 11:35:07 |
| V14.2 M | RNA | 8832 | ng/µL | 22,080 | 10,373 | 213 | 176 | 27 June 2023 11:36:03 |
| V14.2 L | RNA | 8503 | ng/µL | 21,258 | 9785 | 217 | 208 | 27 June 2023 11:36:46 |
| V14.3 S | RNA | 18,155 | ng/µL | 45,386 | 20,415 | 222 | 238 | 27 June 2023 11:37:37 |
| V14.3 M | RNA | 7950 | ng/µL | 19,876 | 9193 | 216 | 191 | 27 June 2023 11:38:17 |
| V14.3 L | RNA | 3806 | ng/µL | 9515 | 4409 | 216 | 208 | 27 June 2023 11:39:05 |
| V15.1 S | RNA | 12,523 | ng/µL | 31,307 | 14,163 | 221 | 241 | 27 June 2023 11:40:05 |
| V15.1 M | RNA | 10,604 | ng/µL | 26,509 | 12,125 | 219 | 210 | 27 June 2023 11:40:50 |
| V15.1 L | RNA | 4647 | ng/µL | 11,617 | 5317 | 219 | 219 | 27 June 2023 11:41:33 |
| V15.2 S | RNA | 16,608 | ng/µL | 41,520 | 18,748 | 221 | 233 | 27 June 2023 11:42:20 |
| V15.2 M | RNA | 5489 | ng/µL | 13,721 | 6502 | 211 | 173 | 27 June 2023 11:42:50 |
| V15.2 L | RNA | 9272 | ng/µL | 23,181 | 10,983 | 211 | 171 | 27 June 2023 11:43:08 |
| V15.4 L | RNA | 8823 | ng/µL | 22,057 | 10,317 | 214 | 186 | 27 June 2023 11:45:03 |
| V16.1 L | RNA | 9421 | ng/µL | 23,552 | 10,654 | 221 | 235 | 27 June 2023 11:46:02 |
| V17.1 S | RNA | 14,150 | ng/µL | 35,375 | 16,189 | 219 | 237 | 26 June 2023 12:04:04 |
| V17.1 M | RNA | 7243 | ng/µL | 18,108 | 8391 | 216 | 186 | 26 June 2023 12:05:03 |
| V17.1 L | RNA | 9493 | ng/µL | 23,732 | 10,919 | 217 | 227 | 26 June 2023 12:05:47 |
| V17.2 S | RNA | 16,695 | ng/µL | 41,737 | 18,921 | 221 | 238 | 26 June 2023 12:06:37 |
| V17.2 M | RNA | 7610 | ng/µL | 19,024 | 9000 | 211 | 177 | 26 June 2023 12:07:15 |
| V17.2 L | RNA | 6126 | ng/µL | 15,315 | 7116 | 215 | 196 | 26 June 2023 12:08:03 |
| V17.4 S | RNA | 15,474 | ng/µL | 38,684 | 17,591 | 220 | 229 | 26 June 2023 12:09:01 |
| V17.4 M | RNA | 6459 | ng/µL | 16,147 | 7621 | 212 | 192 | 26 June 2023 12:09:40 |
| V17.4 L | RNA | 4994 | ng/µL | 12,486 | 5835 | 214 | 207 | 26 June 2023 12:11:21 |
| V18.1 S | RNA | 12,369 | ng/µL | 30,923 | 14,150 | 219 | 231 | 26 June 2023 12:12:13 |
| V18.1 M | RNA | 10,177 | ng/µL | 25,442 | 11,651 | 218 | 232 | 26 June 2023 12:12:58 |
| V18.1 L | RNA | 10,785 | ng/µL | 26,962 | 12,296 | 219 | 235 | 26 June 2023 12:13:41 |
| V18.2 S | RNA | 7607 | ng/µL | 19,017 | 8685 | 219 | 235 | 26 June 2023 12:14:33 |
| V18.2 M | RNA | 7811 | ng/µL | 19,527 | 9039 | 216 | 223 | 26 June 2023 12:15:09 |
| V18.2 L | RNA | 6201 | ng/µL | 15,502 | 7202 | 215 | 216 | 26 June 2023 12:15:53 |
| V18.4 S | RNA | 10,742 | ng/µL | 26,855 | 12,258 | 219 | 225 | 26 June 2023 12:16:51 |
| V18.4 M | RNA | 5906 | ng/µL | 14,765 | 6926 | 213 | 197 | 26 June 2023 12:17:36 |
| V18.4 L | RNA | 8568 | ng/µL | 21,421 | 9870 | 217 | 148 | 26 June 2023 12:18:33 |
| Gene | Sense Oligo | Antisense Oligo | Amplicon Size (bp) |
|---|---|---|---|
| ACT-7 | AGAAAATACAGTGTCTGGATCGGAGGA | TCGTACTCTCCCTTTGAAATCCACAT*C | 86 |
| ADS2 | TAGCCATCTTCTATGGATCTATGACTCTGC | AACCTATAAAAACCACTGCCTCTTCAAATC | 99 |
| FAB1 | AATGTGGAGTTTTGATTGGCTCAGC | TCTTCTTGTATGAGATTCTCAGAGCTTCAA | 87 |
| FAB2a | AAGACCATTCAGTACTTGATTGGATCCG | TGAAGCCAAGGTAGGGATTATTCTCTG | 70 |
| FAB2c | GAAGGGAGGAGAGCACAGGATTATCT | GCTTGAACCTATCATTAGCTCTTTCCTCT | 85 |
| FAD2 | TAGTGAACGCGTTCCTCGTCTTGA | TCCCACTCGGATGAATCGTAGTGA | 82 |
| FAD3 | CTCTTCCCACAGATTCCCTCACTATCACT | TGGTTCTCTGTAGTATCTTCCCAACACATG | 84 |
| FAE1 | CAGGGTTTAAGTGTAACAGTGCGGTTT | ATCTATCGATGCAATGTTCCCAAGG | 90 |
References
- Kagale, S.; Koh, C.; Nixon, J.; Bollina, V.; Clarke, W.E.; Tuteja, R.; Spillane, C.; Robinson, S.J.; Links, M.G.; Clarke, C.; et al. The emerging biofuel crop Camelina sativa retains a highly undifferentiated hexaploid genome structure. Nat. Commun. 2014, 5, 3706. [Google Scholar] [CrossRef] [PubMed]
- Ghamkhar, K.; Croser, J.; Aryamanesh, N.; Campbell, M.; Kon’kova, N.; Francis, C. Camelina (Camelina sativa (L.) Crantz) as an alternative oilseed: Molecular and ecogeographic analyses. Genome 2010, 53, 558–567. [Google Scholar] [CrossRef] [PubMed]
- Vollmann, J.; Moritz, T.; Kargl, C.; Baumgartner, S.; Wagentristl, H. Agronomic evaluation of camelina genotypes selected for seed quality characteristics. Ind. Crops Prod. 2007, 26, 270–277. [Google Scholar] [CrossRef]
- Berti, M.; Gesch, R.; Eynck, C.; Anderson, J.; Cermak, S. Camelina uses, genetics, genomics, production, and management. Ind. Crops Prod. 2016, 94, 690–710. [Google Scholar] [CrossRef]
- Zanetti, F.; Alberghini, B.; Marjanović Jeromela, A.; Grahovac, N.; Rajković, D.; Kiprovski, B.; Monti, A. Camelina, an ancient oilseed crop actively contributing to the rural renaissance in Europe. A review. Agron. Sustain. Dev. 2021, 41, 2. [Google Scholar] [CrossRef]
- Montero-Muñoz, I.; Mostaza-Colado, D.; Capuano, A.; Mauri Ablanque, P.V. Seed and Straw Characterization of Nine New Varieties of Camelina sativa (L.) Crantz. Land 2023, 12, 328. [Google Scholar] [CrossRef]
- Gómez, E.; Montero Muñoz, I.; Mostaza-Colado, D.; Capuano, A.; Mauri Ablanque, P.V. Camelina Sativa (L.) Crantz, a Promising Crop for Biofuel and Biomass Production in Central Spain. In Proceedings of the 31st European Biomass Conference and Exhibition, Bologna, Italy, 5–8 June 2023. [Google Scholar] [CrossRef]
- Neupane, D.; Lohaus, R.H.; Solomon, J.K.Q.; Cushman, J.C. Realizing the Potential of Camelina sativa as a Bioenergy Crop for a Changing Global Climate. Plants 2022, 11, 772. [Google Scholar] [CrossRef] [PubMed]
- Zubr, J. Oil-seed crop: Camelina sativa. Ind. Crops Prod. 1997, 6, 113–119. [Google Scholar] [CrossRef]
- Ghidoli, M.; Ponzoni, E.; Araniti, F.; Miglio, D.; Pilu, R. Genetic Improvement of Camelina sativa (L.) Crantz: Opportunities and Challenges. Plants 2023, 12, 570. [Google Scholar] [CrossRef]
- Faten, M.I.; El Habbasha, S.F. Chemical Composition, Medicinal Impacts and Cultivation of Camelina (Camelina sativa): Review. Int. J. PharmTech Res. 2015, 8, 114–122. [Google Scholar]
- Somerville, C.R.; Browse, J.; Jaworski, J.G.; Ohlrogge, J.B. Lipids. In Biochemistry and Molecular Biology of Plants; Buchanan, B.B., Gruissem, W., Jones, R.L., Eds.; American Society of Plant Physiologists: Rockville, MD, USA, 2000; pp. 456–526. [Google Scholar] [CrossRef]
- Russo, R.; Reggiani, R. Antinutritive Compounds in Twelve Camelina sativa Genotypes. Am. J. Plant Sci. 2012, 03, 1408–1412. [Google Scholar] [CrossRef]
- Ratusz, K.; Symoniuk, E.; Wroniak, M.; Rudzińska, M. Bioactive Compounds, Nutritional Quality and Oxidative Stability of Cold-Pressed Camelina (Camelina sativa L.) Oils. Appl. Sci. 2018, 8, 2606. [Google Scholar] [CrossRef]
- Carlsson, A.S.; LaBrie, S.T.; Kinney, A.J.; Von Wettstein-Knowles, P.; Browse, J. A KAS2 cDNA complements the phenotypes of the Arabidopsis fab1 mutant that differs in a single residue bordering the substrate binding pocket. Plant J. 2002, 29, 761–770. [Google Scholar] [CrossRef]
- Rodríguez-Rodríguez, M.F.; Salas, J.J.; Venegas-Calerón, M.; Garcés, R.; Martínez-Force, E. Molecular cloning and characterization of the genes encoding a microsomal oleate Δ12 desaturase (CsFAD2) and linoleate Δ15 desaturase (CsFAD3) from Camelina sativa. Ind. Crops Prod. 2016, 89, 405–415. [Google Scholar] [CrossRef]
- Neumann, N.G.; Nazarenus, T.J.; Aznar-Moreno, J.A.; Rodriguez-Aponte, S.A.; Mejias Veintidos, V.A.; Comai, L.; Durrett, T.P.; Cahoon, E.B. Generation of camelina mid-oleic acid seed oil by identification and stacking of fatty acid biosynthetic mutants. Ind. Crops Prod. 2021, 159, 113074. [Google Scholar] [CrossRef]
- Raboanatahiry, N.; Yin, Y.; Chen, K.; He, J.; Yu, L.; Li, M. In Silico Analysis of Fatty Acid Desaturases Structures in Camelina sativa, and Functional Evaluation of Csafad7 and Csafad8 on Seed Oil Formation and Seed Morphology. Int. J. Mol. Sci. 2021, 22, 10857. [Google Scholar] [CrossRef] [PubMed]
- Abdullah, H.M.; Akbari, P.; Paulose, B.; Schnell, D.; Qi, W.; Park, Y.; Pareek, A.; Dhankher, O.P. Transcriptome profiling of Camelina sativa to identify genes involved in triacylglycerol biosynthesis and accumulation in the developing seeds. Biotechnol. Biofuels 2016, 9, 136. [Google Scholar] [CrossRef]
- Chao, W.S.; Wang, H.; Horvath, D.P.; Anderson, J.V. Selection of endogenous reference genes for qRT-PCR analysis in Camelina sativa and identification of FLOWERING LOCUS C allele-specific markers to differentiate summer- and winter-biotypes. Ind. Crops Prod. 2019, 129, 495–502. [Google Scholar] [CrossRef]
- Yuan, L.; Li, R. Metabolic Engineering a Model Oilseed Camelina sativa for the Sustainable Production of High-Value Designed Oils. Front. Plant Sci. 2020, 11, 11. [Google Scholar] [CrossRef]
- Yadav, N.S.; Wierzbicki, A.; Aegerter, M.; Caster, C.S.; Perez-Grau, L.; Kinney, A.J.; Hitz, W.D.; Booth, J.R., Jr.; Schweiger, B.; Stecca, K.L.; et al. Cloning of Higher Plant [omega]-3 Fatty Acid Desaturases. Plant Physiol. 1993, 103, 467–476. [Google Scholar] [CrossRef]
- Wu, J.; James Jr, D.W.; Dooner, H.K.; Browse, J. A Mutant of Arabidopsis Deficient in the Elongation of Palmitic Acid. Plant Physiol. 1994, 106, 143–150. [Google Scholar] [CrossRef] [PubMed]
- Arondel, V.; Lemieux, B.; Hwang, I.; Gibson, S.; Goodman, H.M.; Somerville, C.R. Map-Based Cloning of a Gene Controlling Omega-3 Fatty Acid Desaturation in Arabidopsis. Science 1992, 258, 1353–1355. [Google Scholar] [CrossRef] [PubMed]
- Okuley, J.; Lightner, J.; Feldmann, K.; Yadav, N.; Lark, E.; Browse, J. Arabidopsis FAD2 gene encodes the enzyme that is essential for polyunsaturated lipid synthesis. Plant Cell 1994, 6, 147–158. [Google Scholar] [CrossRef]
- Haslam, T.M.; Kunst, L. Extending the story of very-long-chain fatty acid elongation. Plant Sci. 2013, 210, 93–107. [Google Scholar] [CrossRef]
- James, D.W.; Lim, E.; Keller, J.; Plooy, I.; Ralston, E.; Dooner, H.K. Directed tagging of the Arabidopsis Fattuy Acid Elongation1 (FAE1) gene with the maize transposon activator. Plant Cell 1995, 7, 309–319. [Google Scholar] [CrossRef]
- Kagale, S.; Nixon, J.; Khedikar, Y.; Pasha, A.; Provart, N.J.; Clarke, W.E.; Bollina, V.; Robinson, S.J.; Coutu, C.; Hegedus, D.D.; et al. The developmental transcriptome atlas of the biofuel crop Camelina sativa. Plant J. 2016, 88, 879–894. [Google Scholar] [CrossRef]
- Livak, K.J.; Schmittgen, T.D. Analysis of Relative Gene Expression Data Using Real-Time Quantitative PCR and the 2−ΔΔCT Method. Methods 2001, 25, 402–408. [Google Scholar] [CrossRef]
- Bates, D.; Mächler, M.; Bolker, B.; Walker, S. Fitting Linear Mixed-Effects Models Using lme4. J. Stat. Softw. 2015, 67, 1–48. [Google Scholar] [CrossRef]
- de Mendiburu, F. Agricolae: Statistical Procedures for Agricultural Research. In CRAN: Contributed Packages; John Wiley & Sons: Hoboken, NJ, USA, 2023. [Google Scholar] [CrossRef]
- Kolde, R. Pheatmap: Pretty Heatmaps. In CRAN: Contributed Packages; John Wiley & Sons: Hoboken, NJ, USA, 2010. [Google Scholar] [CrossRef]
- R Core Team. R: A Language and Environment for Statistical Computing; R Core Team: Vienna, Austria, 2022. [Google Scholar]
- Schmittgen, T.D.; Livak, K.J. Analyzing real-time PCR data by the comparative CT method. Nat. Protoc. 2008, 3, 1101–1108. [Google Scholar] [CrossRef]
- Ozseyhan, M.E.; Kang, J.; Mu, X.; Lu, C. Mutagenesis of the FAE1 genes significantly changes fatty acid composition in seeds of Camelina sativa. Plant Physiol. Biochem. 2018, 123, 1–7. [Google Scholar] [CrossRef]
- Li, H.; Hu, X.; Lovell, J.T.; Grabowski, P.P.; Mamidi, S.; Chen, C.; Amirebrahimi, M.; Kahanda, I.; Mumey, B.; Barry, K.; et al. Genetic dissection of natural variation in oilseed traits of camelina by whole-genome resequencing and QTL mapping. Plant Genome 2021, 14, e20110. [Google Scholar] [CrossRef]
- Malik, M.R.; Tang, J.; Sharma, N.; Burkitt, C.; Ji, Y.; Mykytyshyn, M.; Bohmert-Tatarev, K.; Peoples, O.; Snell, K.D. Camelina sativa, an oilseed at the nexus between model system and commercial crop. Plant Cell Rep. 2018, 37, 1367–1381. [Google Scholar] [CrossRef]
- Obour, A.K.; Obeng, E.; Mohammed, Y.A.; Ciampitti, I.A.; Durrett, T.P.; Aznar-Moreno, J.A.; Chen, C. Camelina Seed Yield and Fatty Acids as Influenced by Genotype and Environment. Agron. J. 2017, 109, 947–956. [Google Scholar] [CrossRef]
- Hao, Y.; Ge, X.; Xu, R.; Zhao, X.; Zhai, M. Transcriptome analysis of lipid biosynthesis during kernel development in two walnut (Juglans regia L.) varieties of ‘Xilin 3′ and ‘Xiangling’. BMC Plant Biol. 2024, 24, 828. [Google Scholar] [CrossRef]
- Pushkova, E.N.; Povkhova, L.V.; Dvorianinova, E.M.; Novakovskiy, R.O.; Rozhmina, T.A.; Gryzunov, A.A.; Sigova, E.A.; Zhernova, D.A.; Borkhert, E.V.; Turba, A.A.; et al. Expression of FAD and SAD Genes in Developing Seeds of Flax Varieties under Different Growth Conditions. Plants 2024, 13, 956. [Google Scholar] [CrossRef]
- Rodríguez-Rodríguez, M.F.; Sánchez-García, A.; Salas, J.J.; Garcés, R.; Martínez-Force, E. Characterization of the morphological changes and fatty acid profile of developing Camelina sativa seeds. Ind. Crops Prod. 2013, 50, 673–679. [Google Scholar] [CrossRef]
- Karvonen, H.M.; Aro, A.; Tapola, N.S.; Salminen, I.; Uusitupa, M.I.J.; Sarkkinen, E.S. Effect of alpha-linolenic acid-rich Camelina sativa oil on serum fatty acid composition and serum lipids in hypercholesterolemic subjects. Metabolism 2002, 51, 1253–1260. [Google Scholar] [CrossRef]
- Yaşar, F. Mixing of Biodiesels Produced from Different Sources to Jet Fuels and Comparison of Specifications of Fuel Blends. Eur. J. Tech. 2020, 10, 86–96. [Google Scholar] [CrossRef]
- Elangovan, T.; Jeryrajkumar, L. Biodiesel and its Properties from Various Feedstocks. Int. J. Trends Eng. Technol. 2015, 1, 1–7. [Google Scholar]
- Gul, M.; Masjuki, H.H.; Kalam, M.A.; Zulkifli, N.W.M.; Mujtaba, M.A. A Review: Role of Fatty Acids Composition in Characterizing Potential Feedstock for Sustainable Green Lubricants by Advance Transesterification Process and its Global as Well as Pakistani Prospective. Bioenergy Res. 2020, 13, 1–22. [Google Scholar] [CrossRef]

Disclaimer/Publisher’s Note: The statements, opinions and data contained in all publications are solely those of the individual author(s) and contributor(s) and not of MDPI and/or the editor(s). MDPI and/or the editor(s) disclaim responsibility for any injury to people or property resulting from any ideas, methods, instructions or products referred to in the content. |
© 2025 by the authors. Licensee MDPI, Basel, Switzerland. This article is an open access article distributed under the terms and conditions of the Creative Commons Attribution (CC BY) license (https://creativecommons.org/licenses/by/4.0/).
Share and Cite
Gómez, E.; Hueros, G.; Mostaza-Colado, D.; Capuano, A.; Uscola, M.; Mauri, P.V. Comparative Analysis of the Expression of Genes Involved in Fatty Acid Synthesis Across Camelina Varieties. Agriculture 2025, 15, 1305. https://doi.org/10.3390/agriculture15121305
Gómez E, Hueros G, Mostaza-Colado D, Capuano A, Uscola M, Mauri PV. Comparative Analysis of the Expression of Genes Involved in Fatty Acid Synthesis Across Camelina Varieties. Agriculture. 2025; 15(12):1305. https://doi.org/10.3390/agriculture15121305
Chicago/Turabian StyleGómez, Elisa, Gregorio Hueros, David Mostaza-Colado, Aníbal Capuano, Mercedes Uscola, and Pedro V. Mauri. 2025. "Comparative Analysis of the Expression of Genes Involved in Fatty Acid Synthesis Across Camelina Varieties" Agriculture 15, no. 12: 1305. https://doi.org/10.3390/agriculture15121305
APA StyleGómez, E., Hueros, G., Mostaza-Colado, D., Capuano, A., Uscola, M., & Mauri, P. V. (2025). Comparative Analysis of the Expression of Genes Involved in Fatty Acid Synthesis Across Camelina Varieties. Agriculture, 15(12), 1305. https://doi.org/10.3390/agriculture15121305