
Drought Risk Assessment and Zoning in the Tarim River Basin, Xinjiang, China
Abstract
1. Introduction
2. Materials and Methods
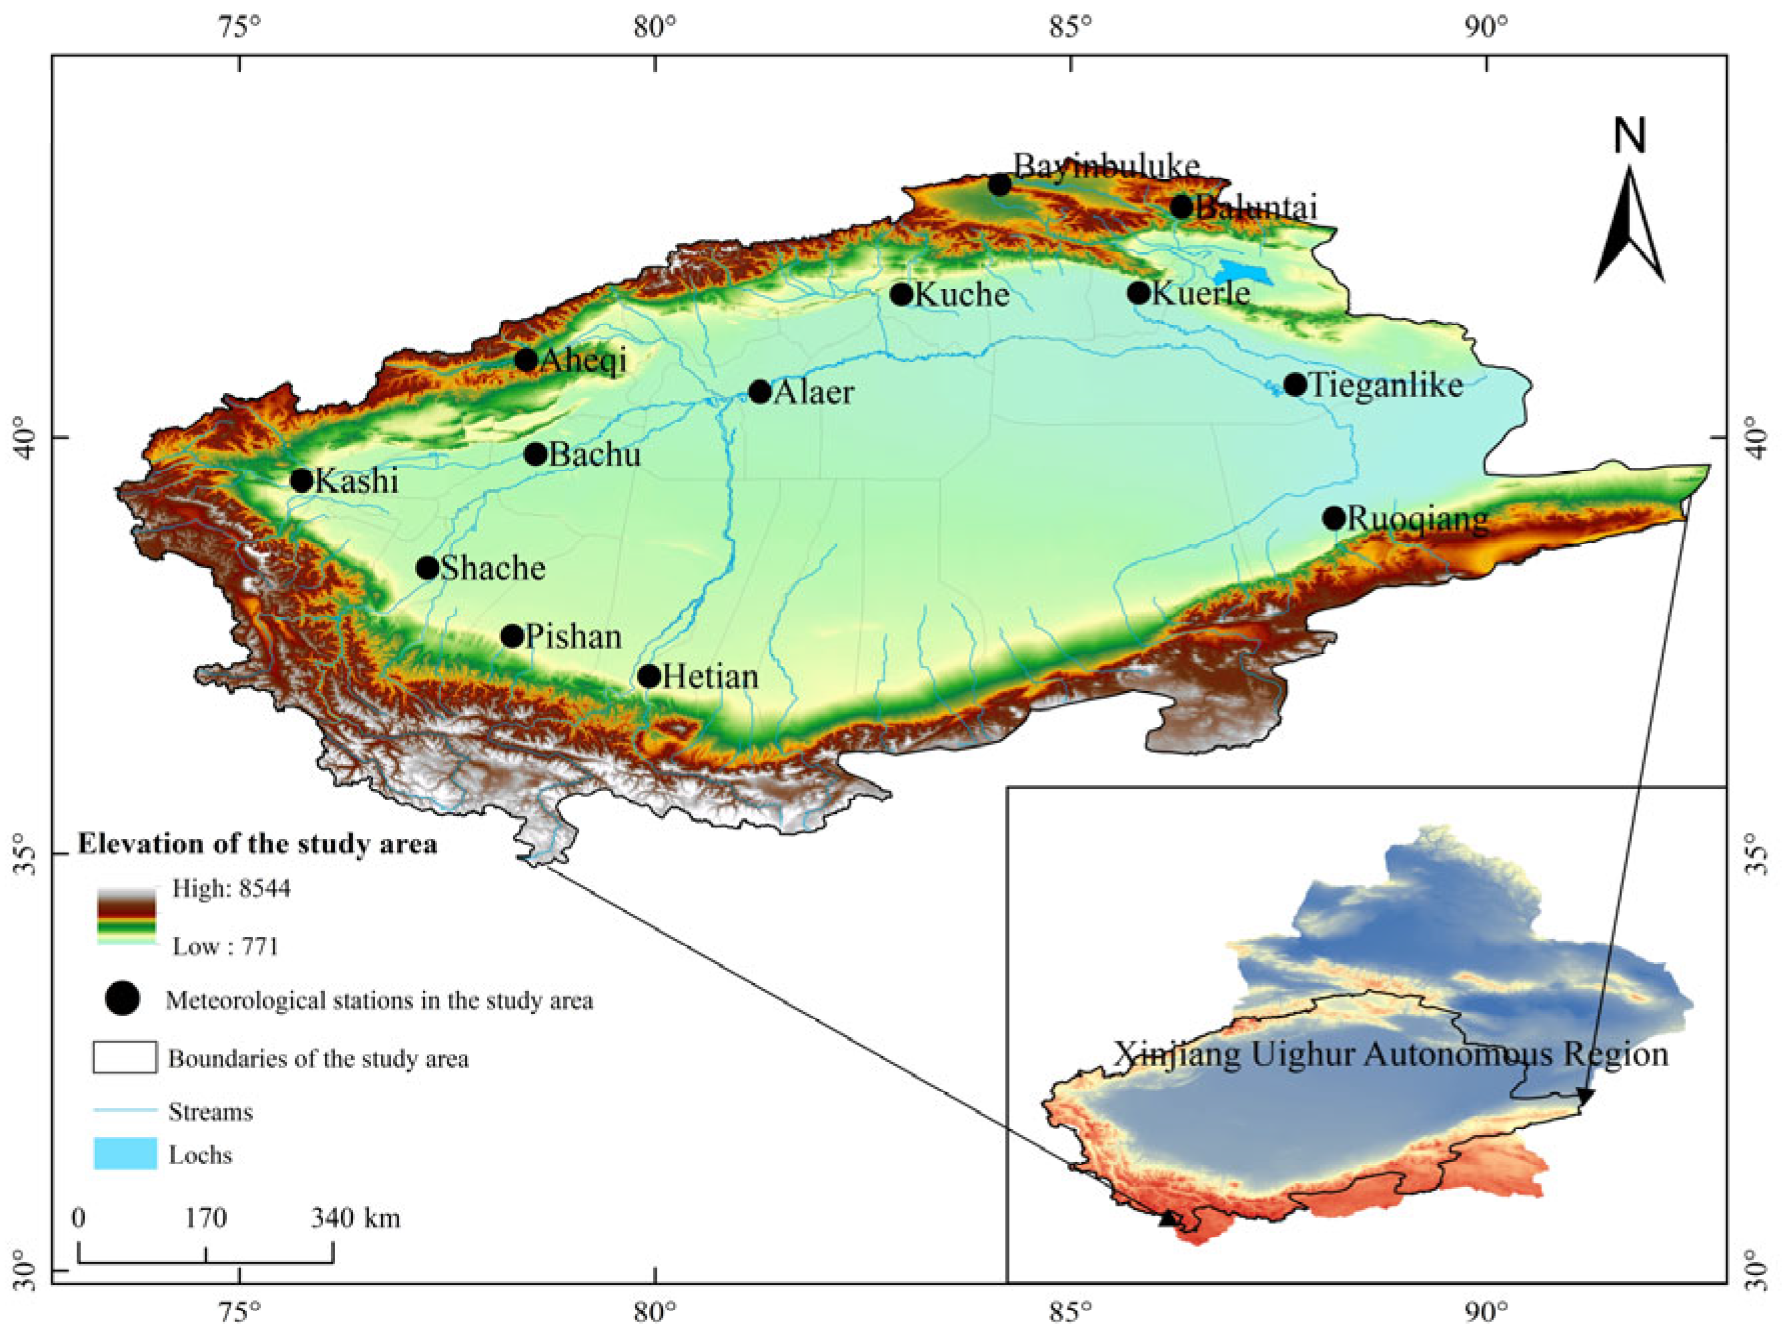
2.1. Data Sources
2.2. Research Methodology
2.2.1. Construction of the Comprehensive Drought Index (nSPEI)
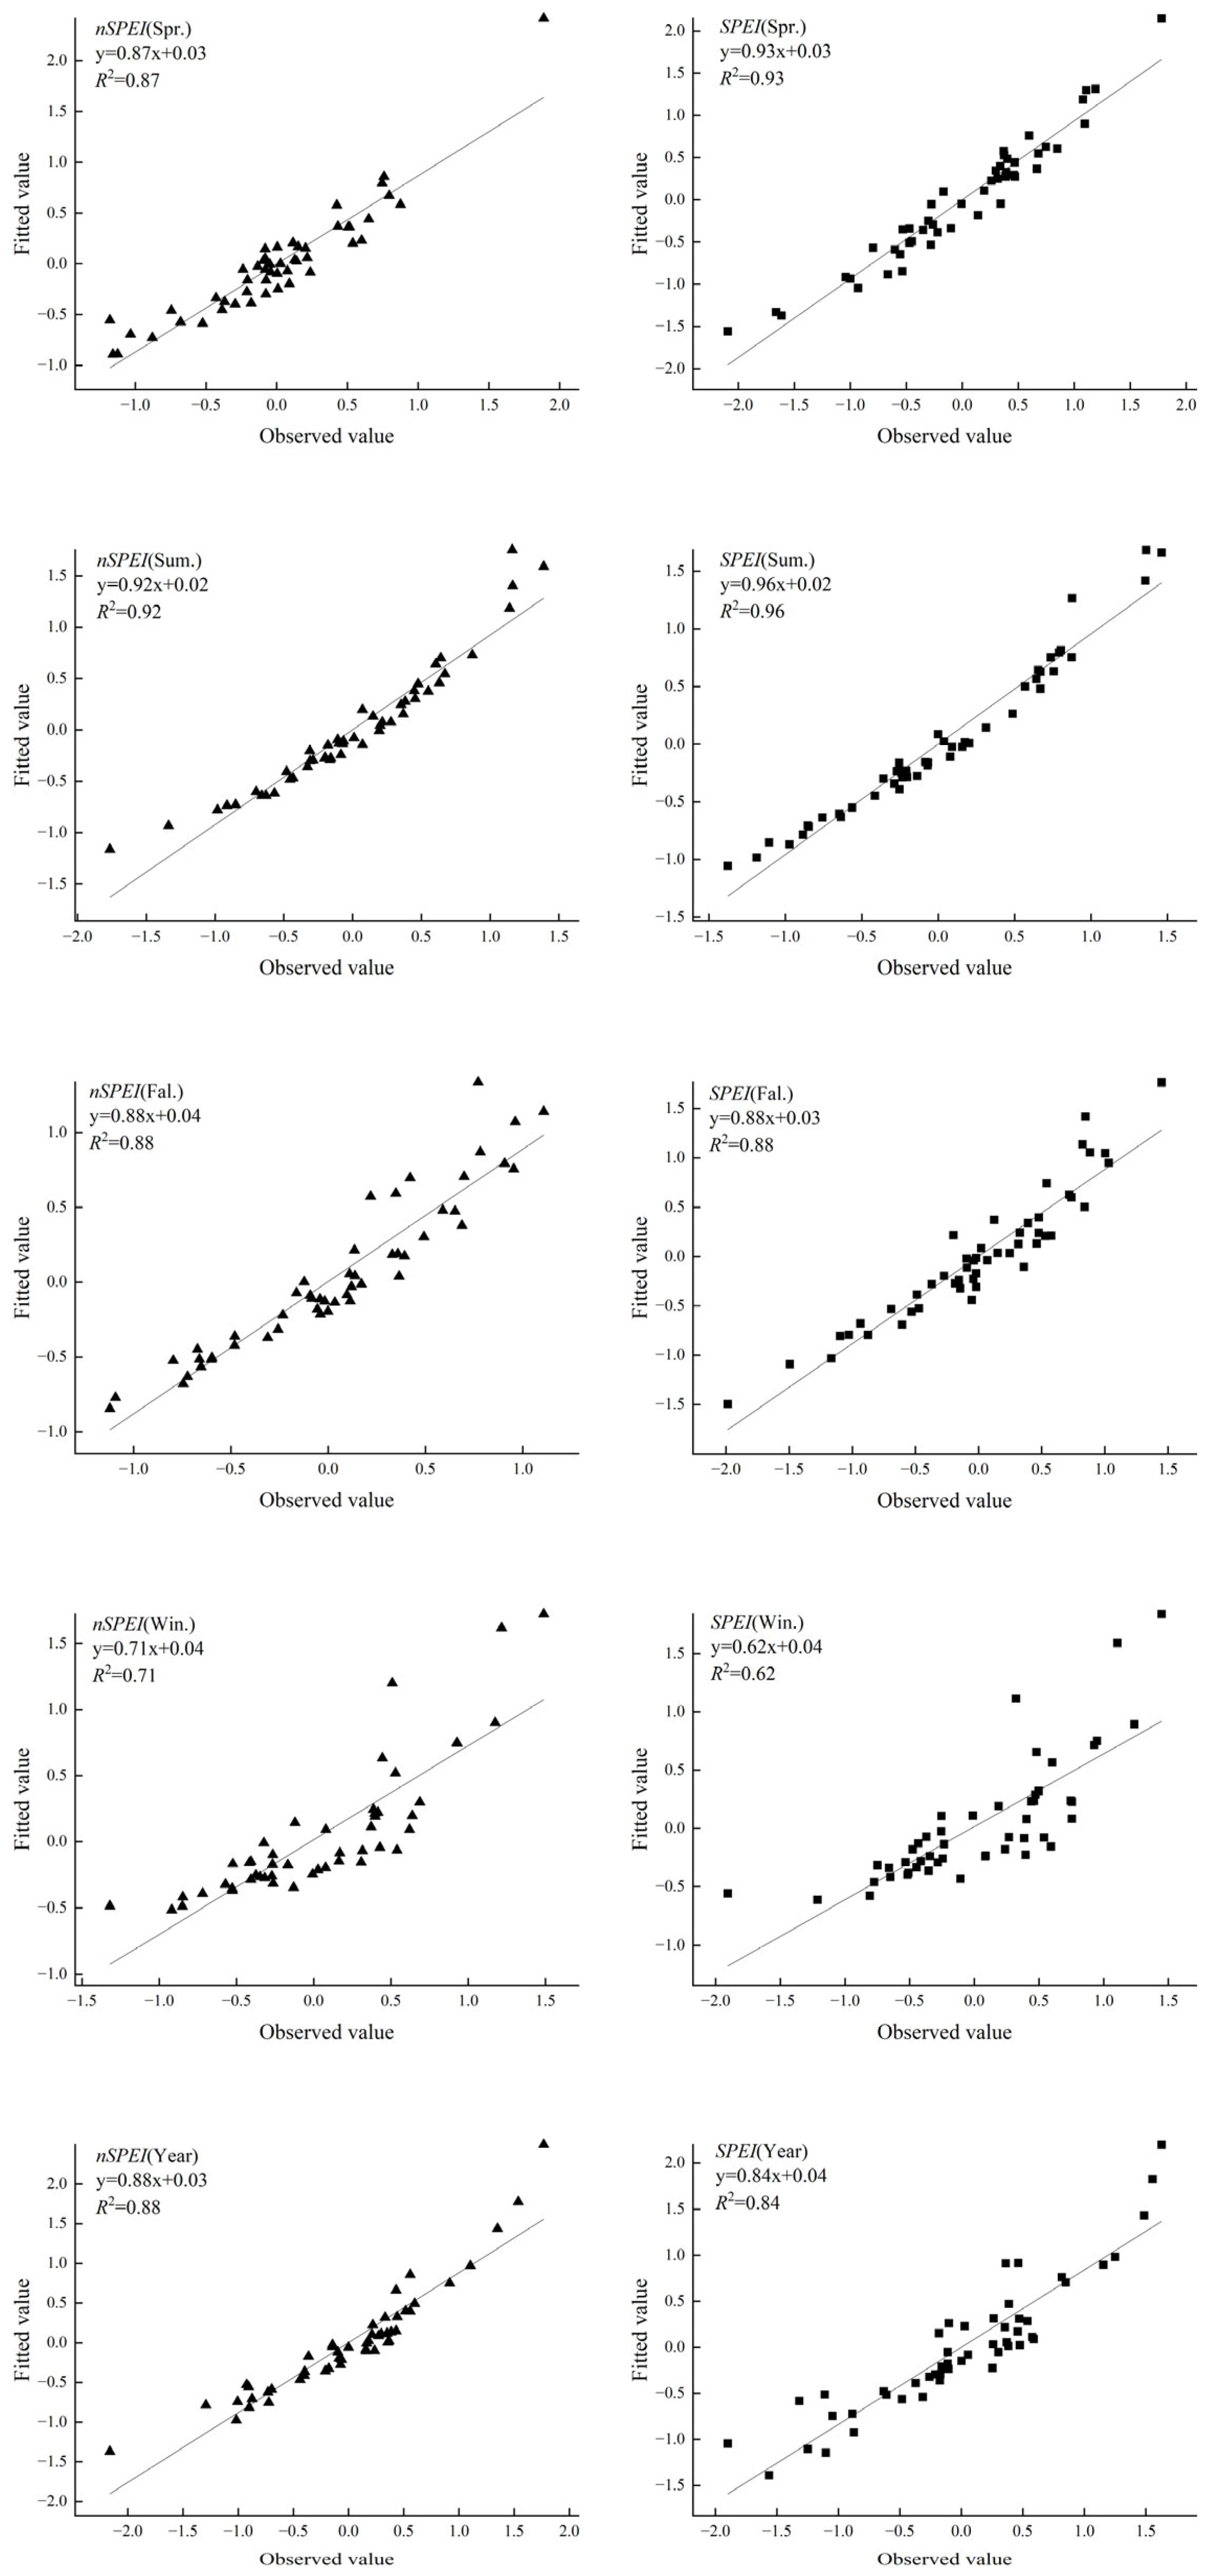
2.2.2. Analysis of Drought Index Applicability
- (1)
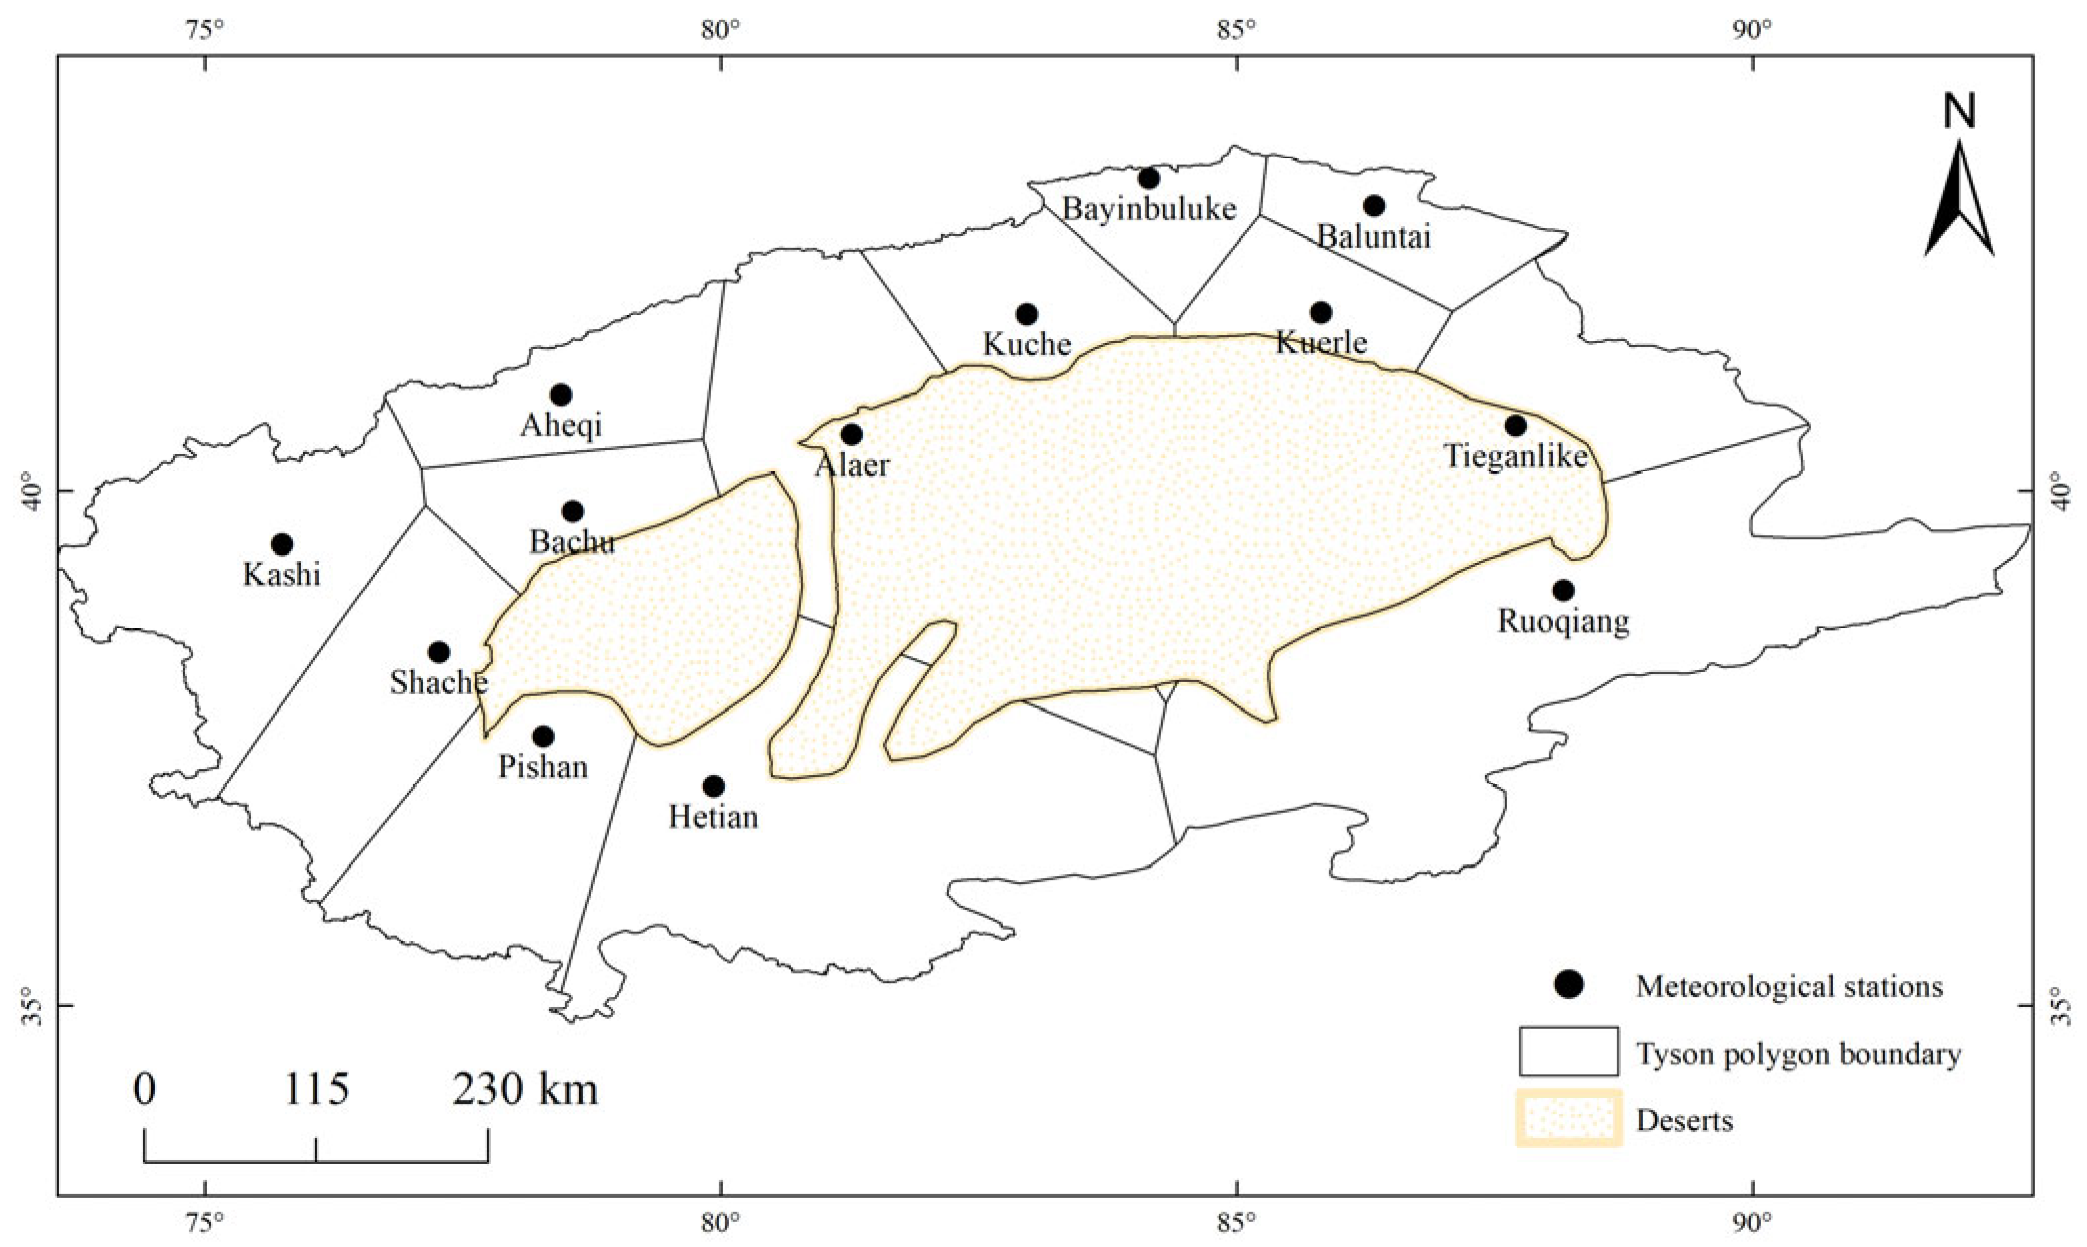
- Spatial data processing using the Tyson polygon method
- (2)
- Proportions of sites with drought events
2.2.3. Drought Disaster Risk Assessment Method Based on Natural Hazard Theory
- (1)
- Standardization of the indicator data
- (2)
- Attribution of weights to the indicators
- (3)
- Weighted comprehensive evaluation method
- (4)
- Drought disaster risk index method
3. Results
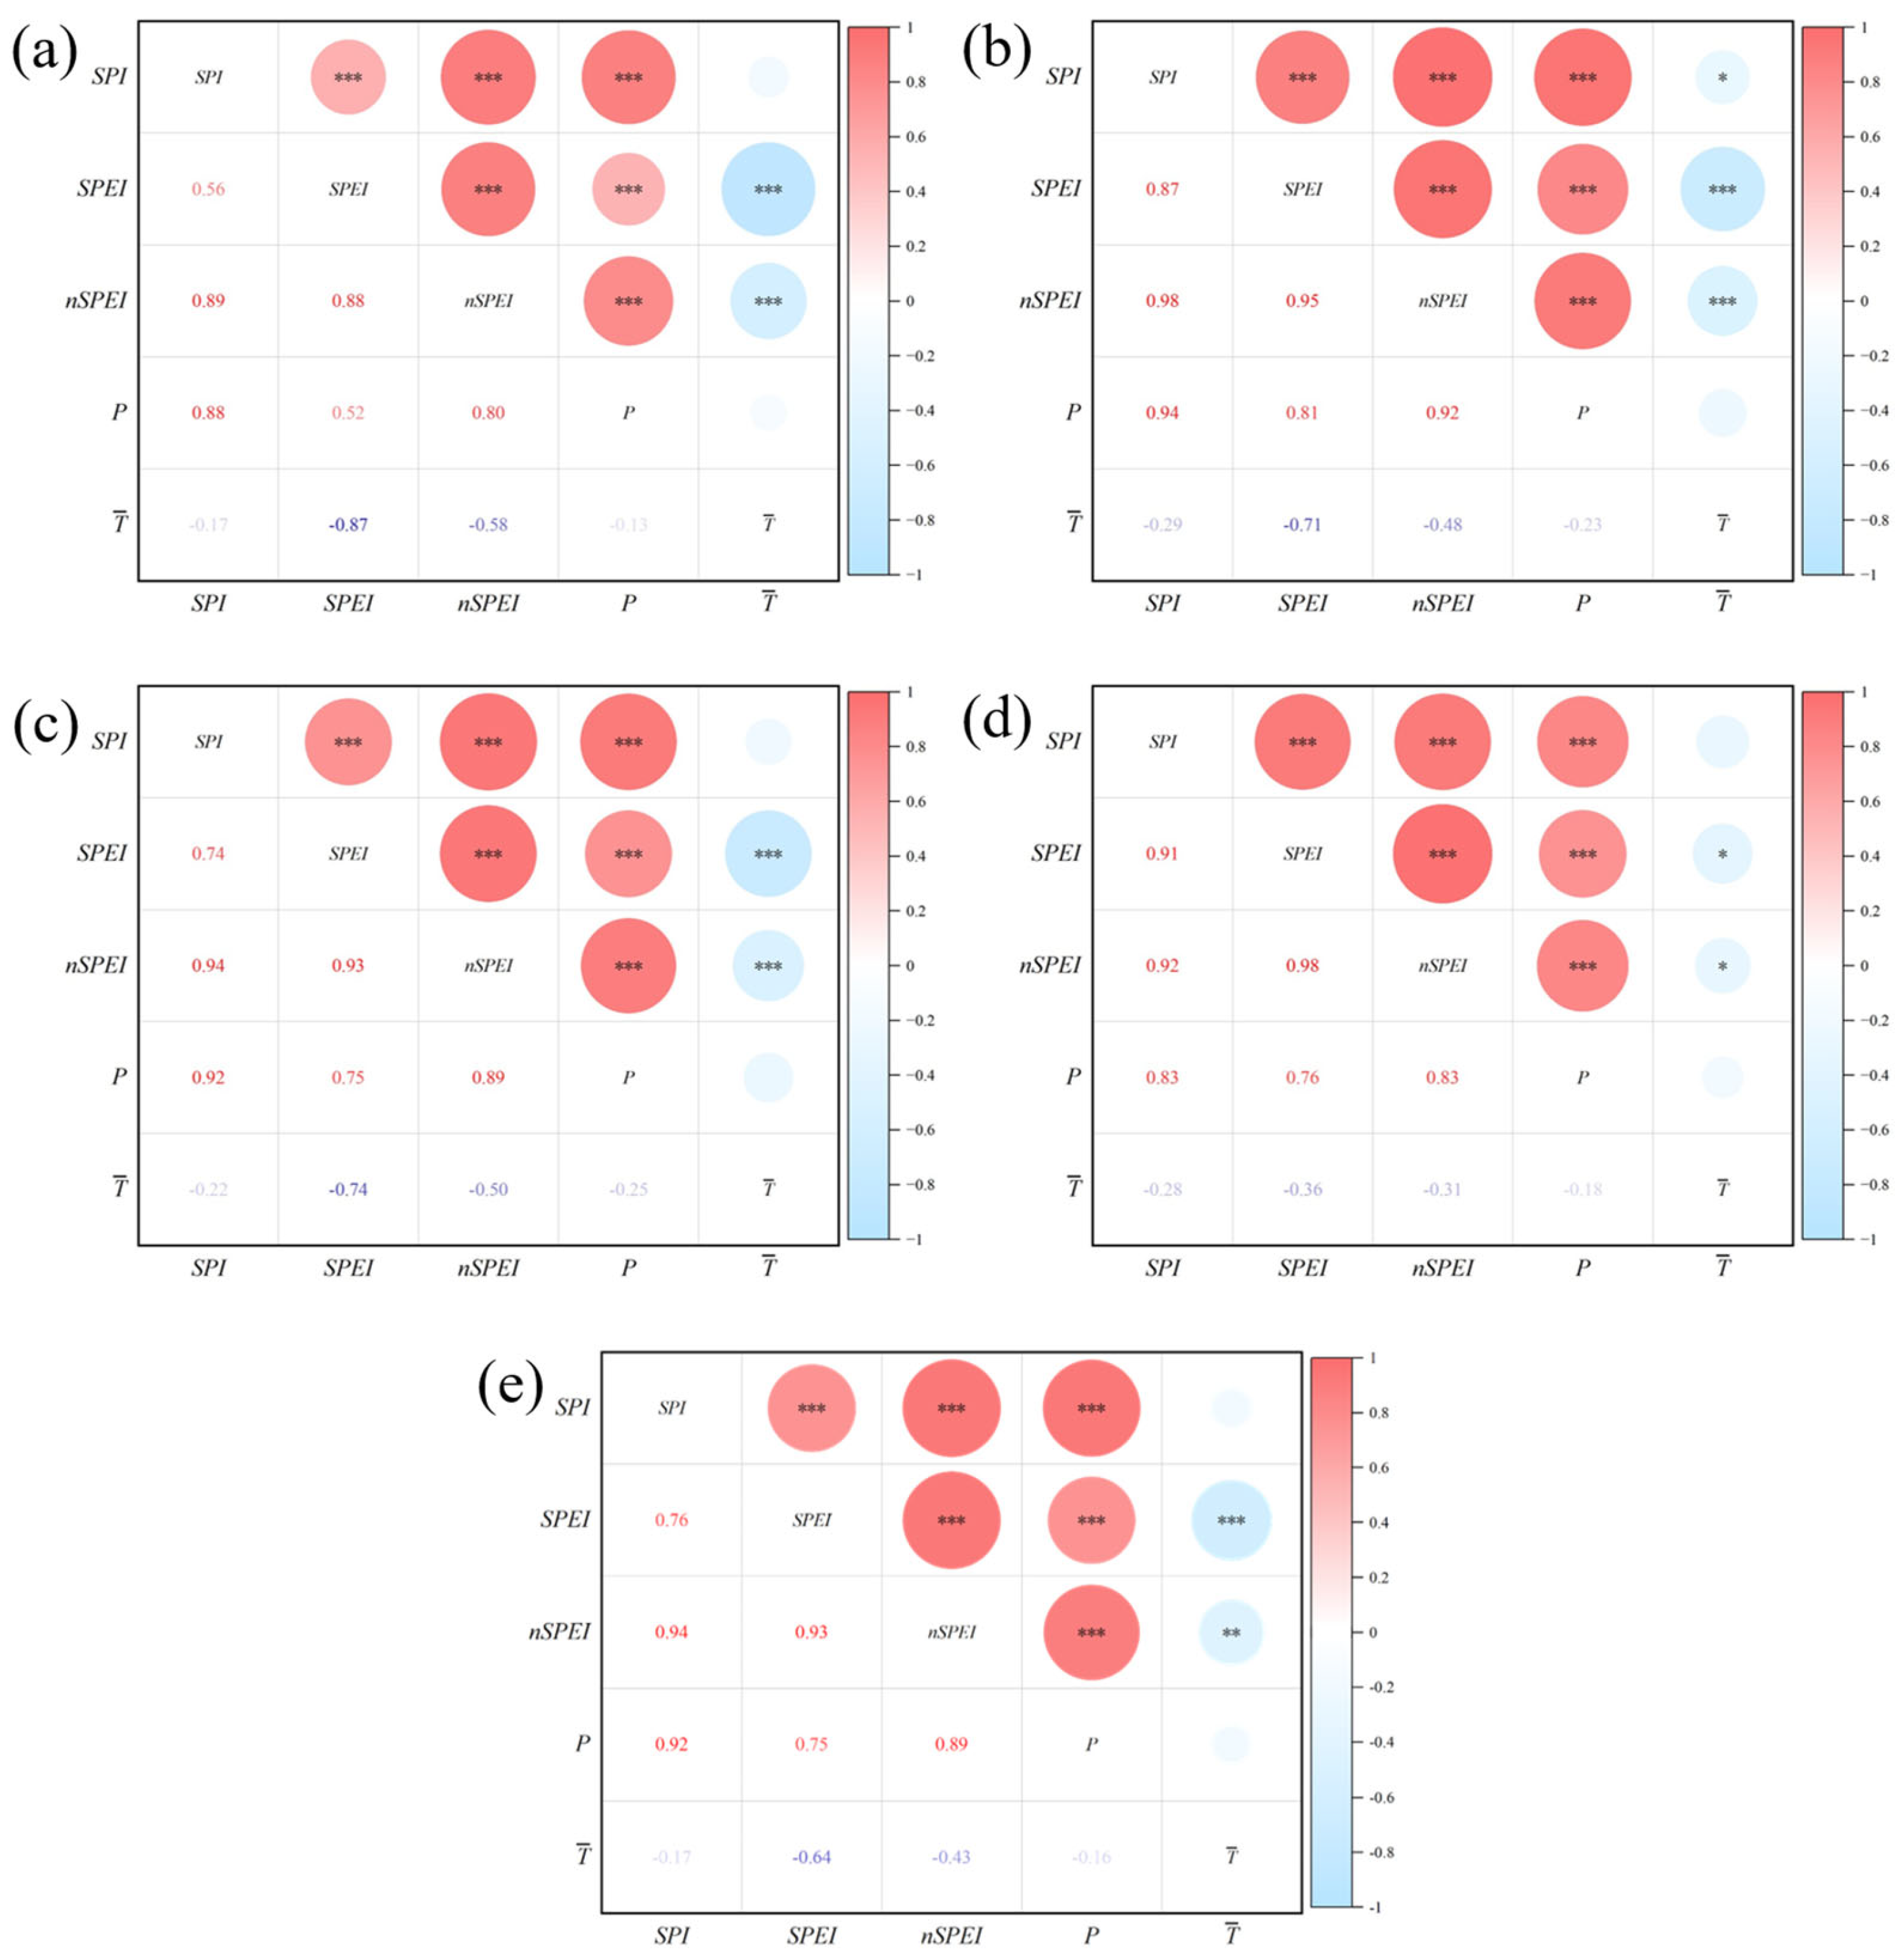
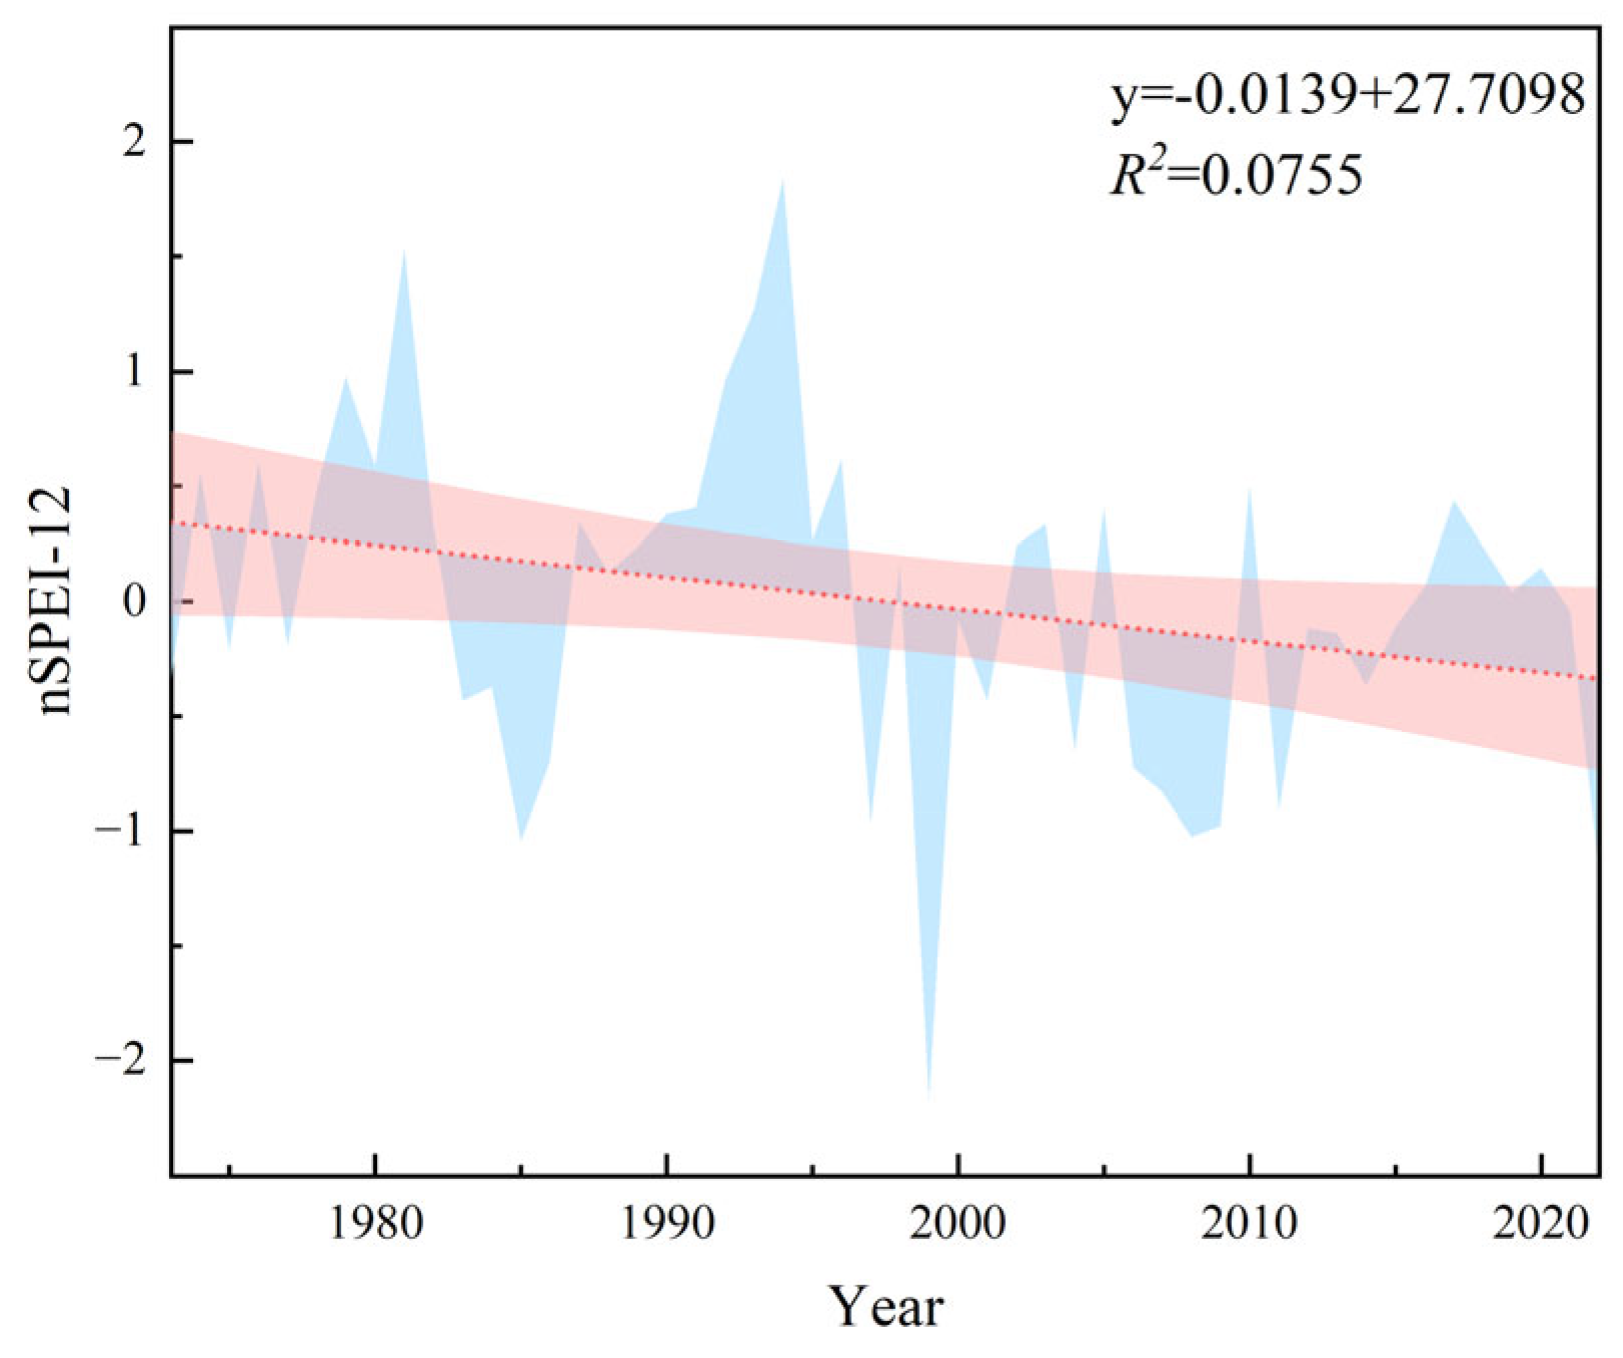
3.1. Relationships Between the Drought Indexes and Meteorological Factors
3.2. Comparative Analysis of Typical Years with Drought Events
3.3. Construction of the Drought Disaster Risk Assessment Index and Determination of Associated Weights
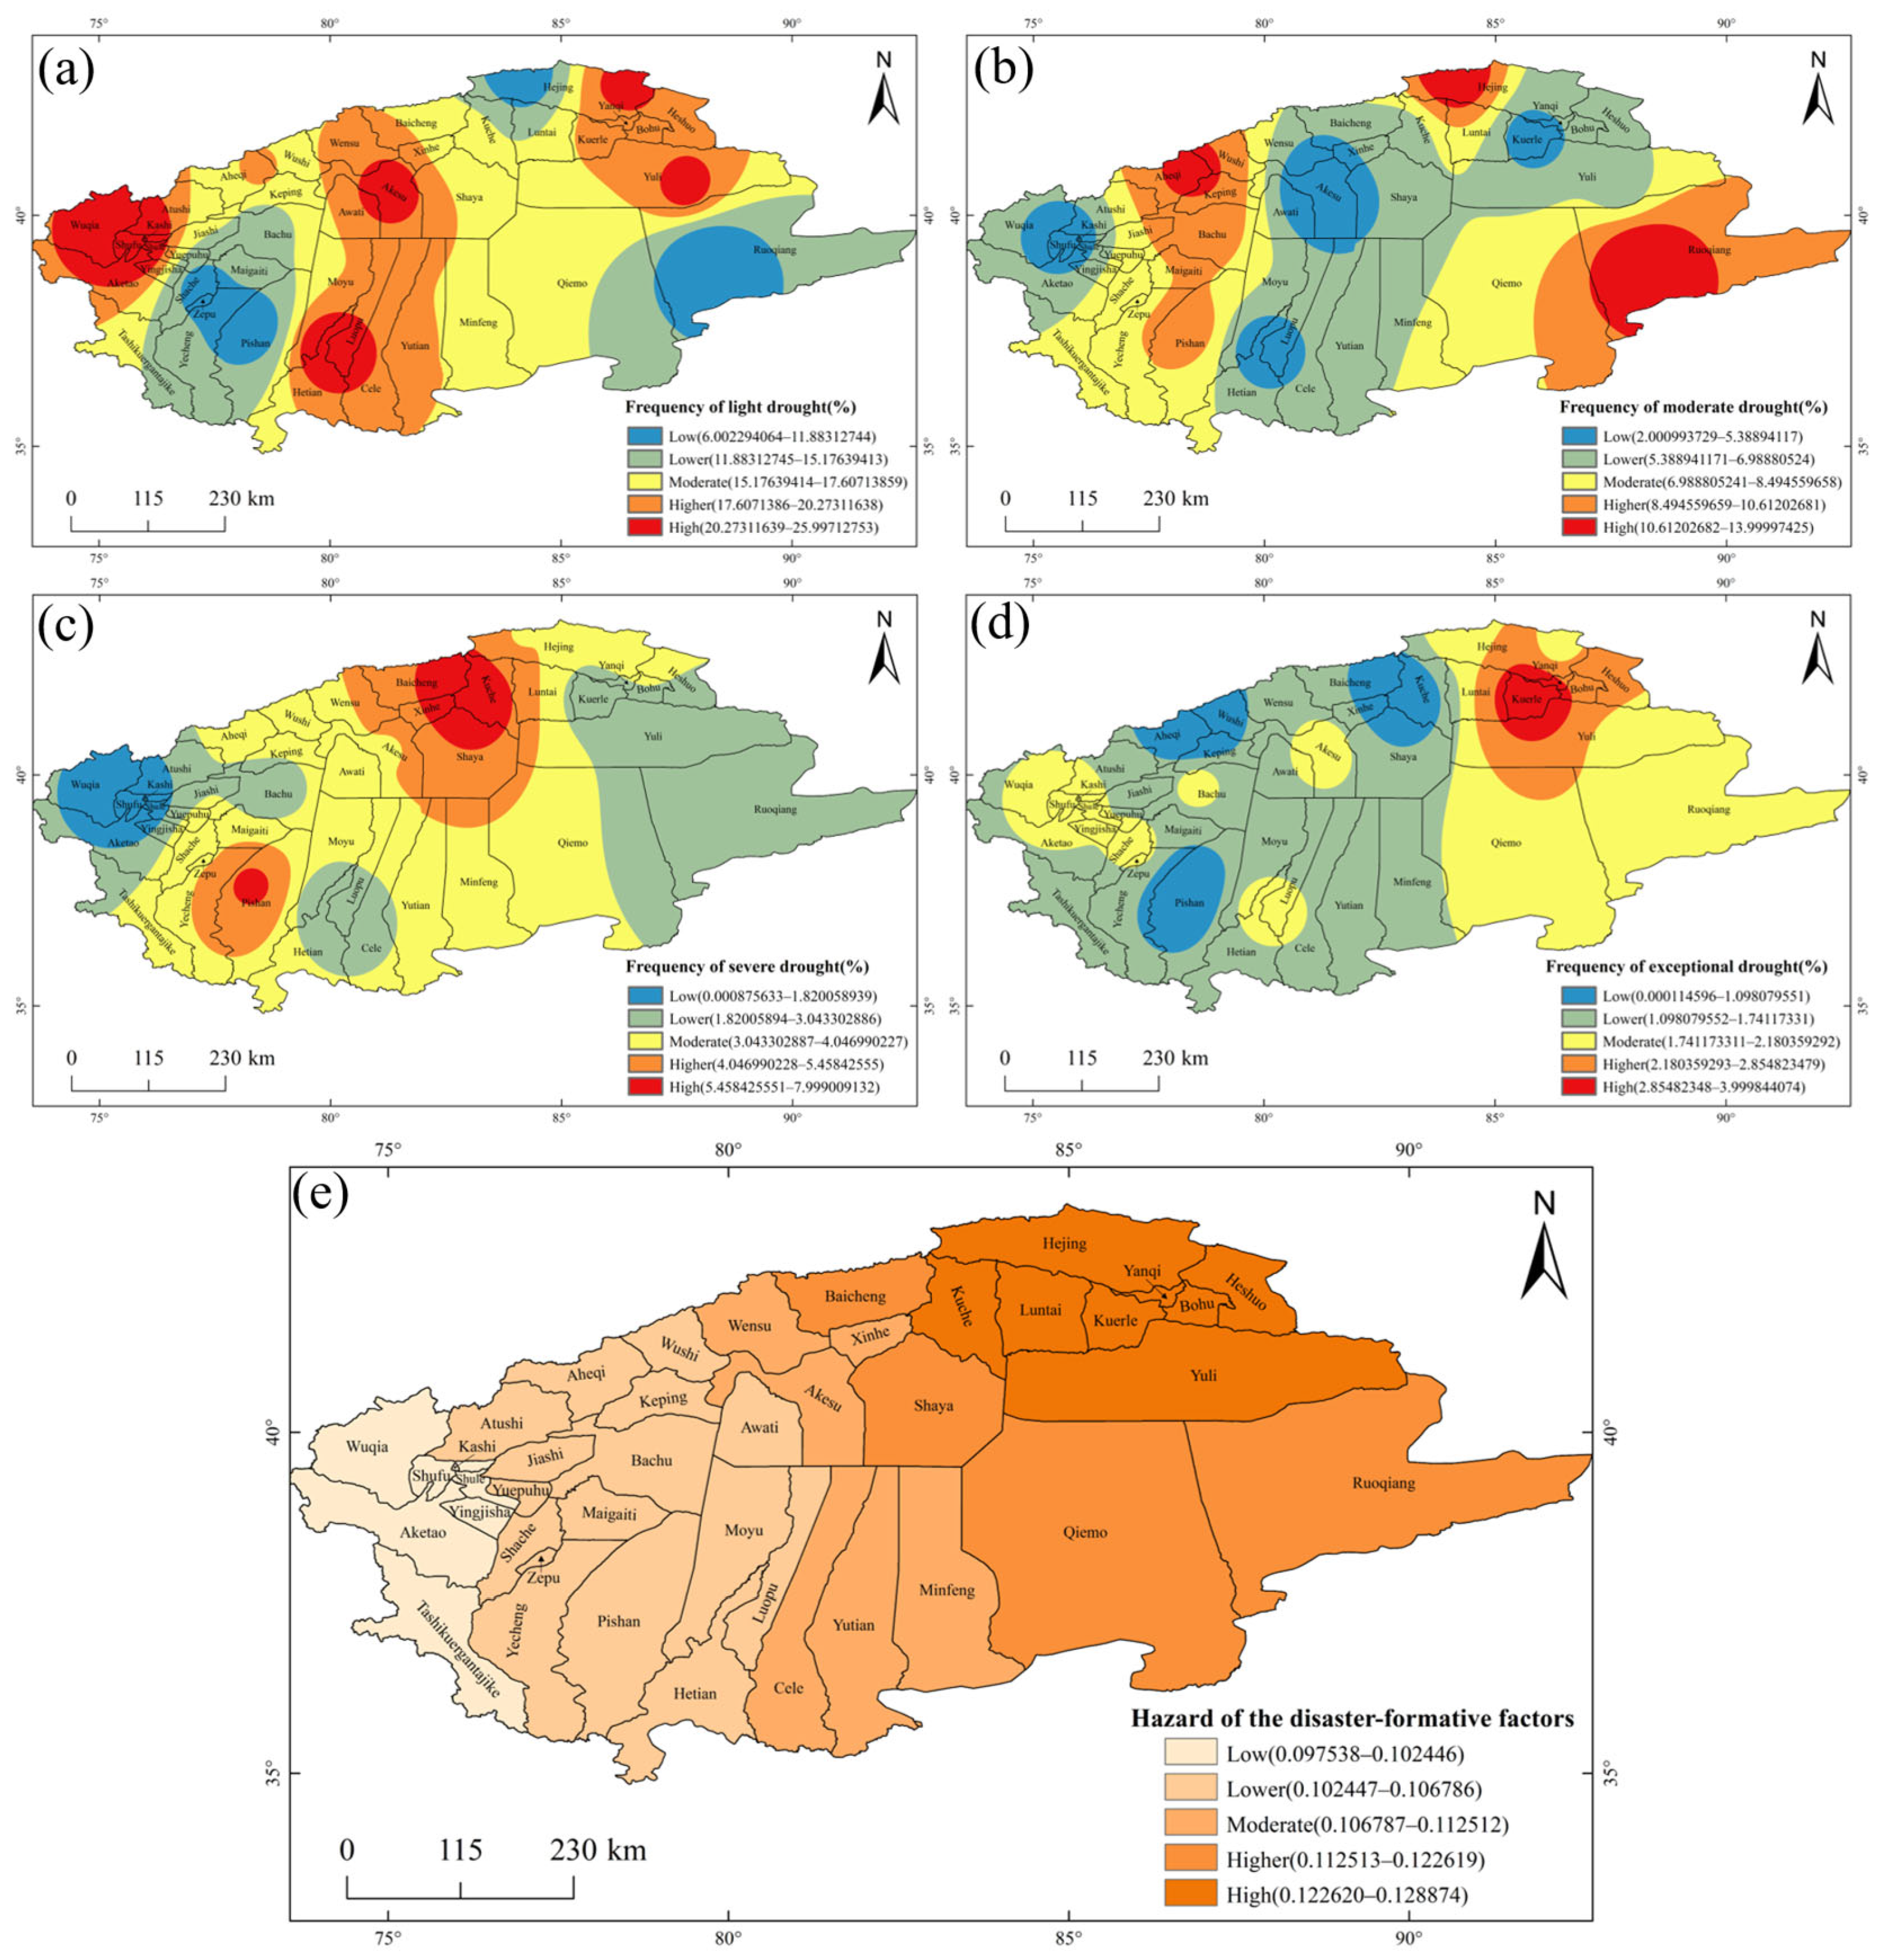
3.4. Analysis of Drought Disaster-Driven Factors
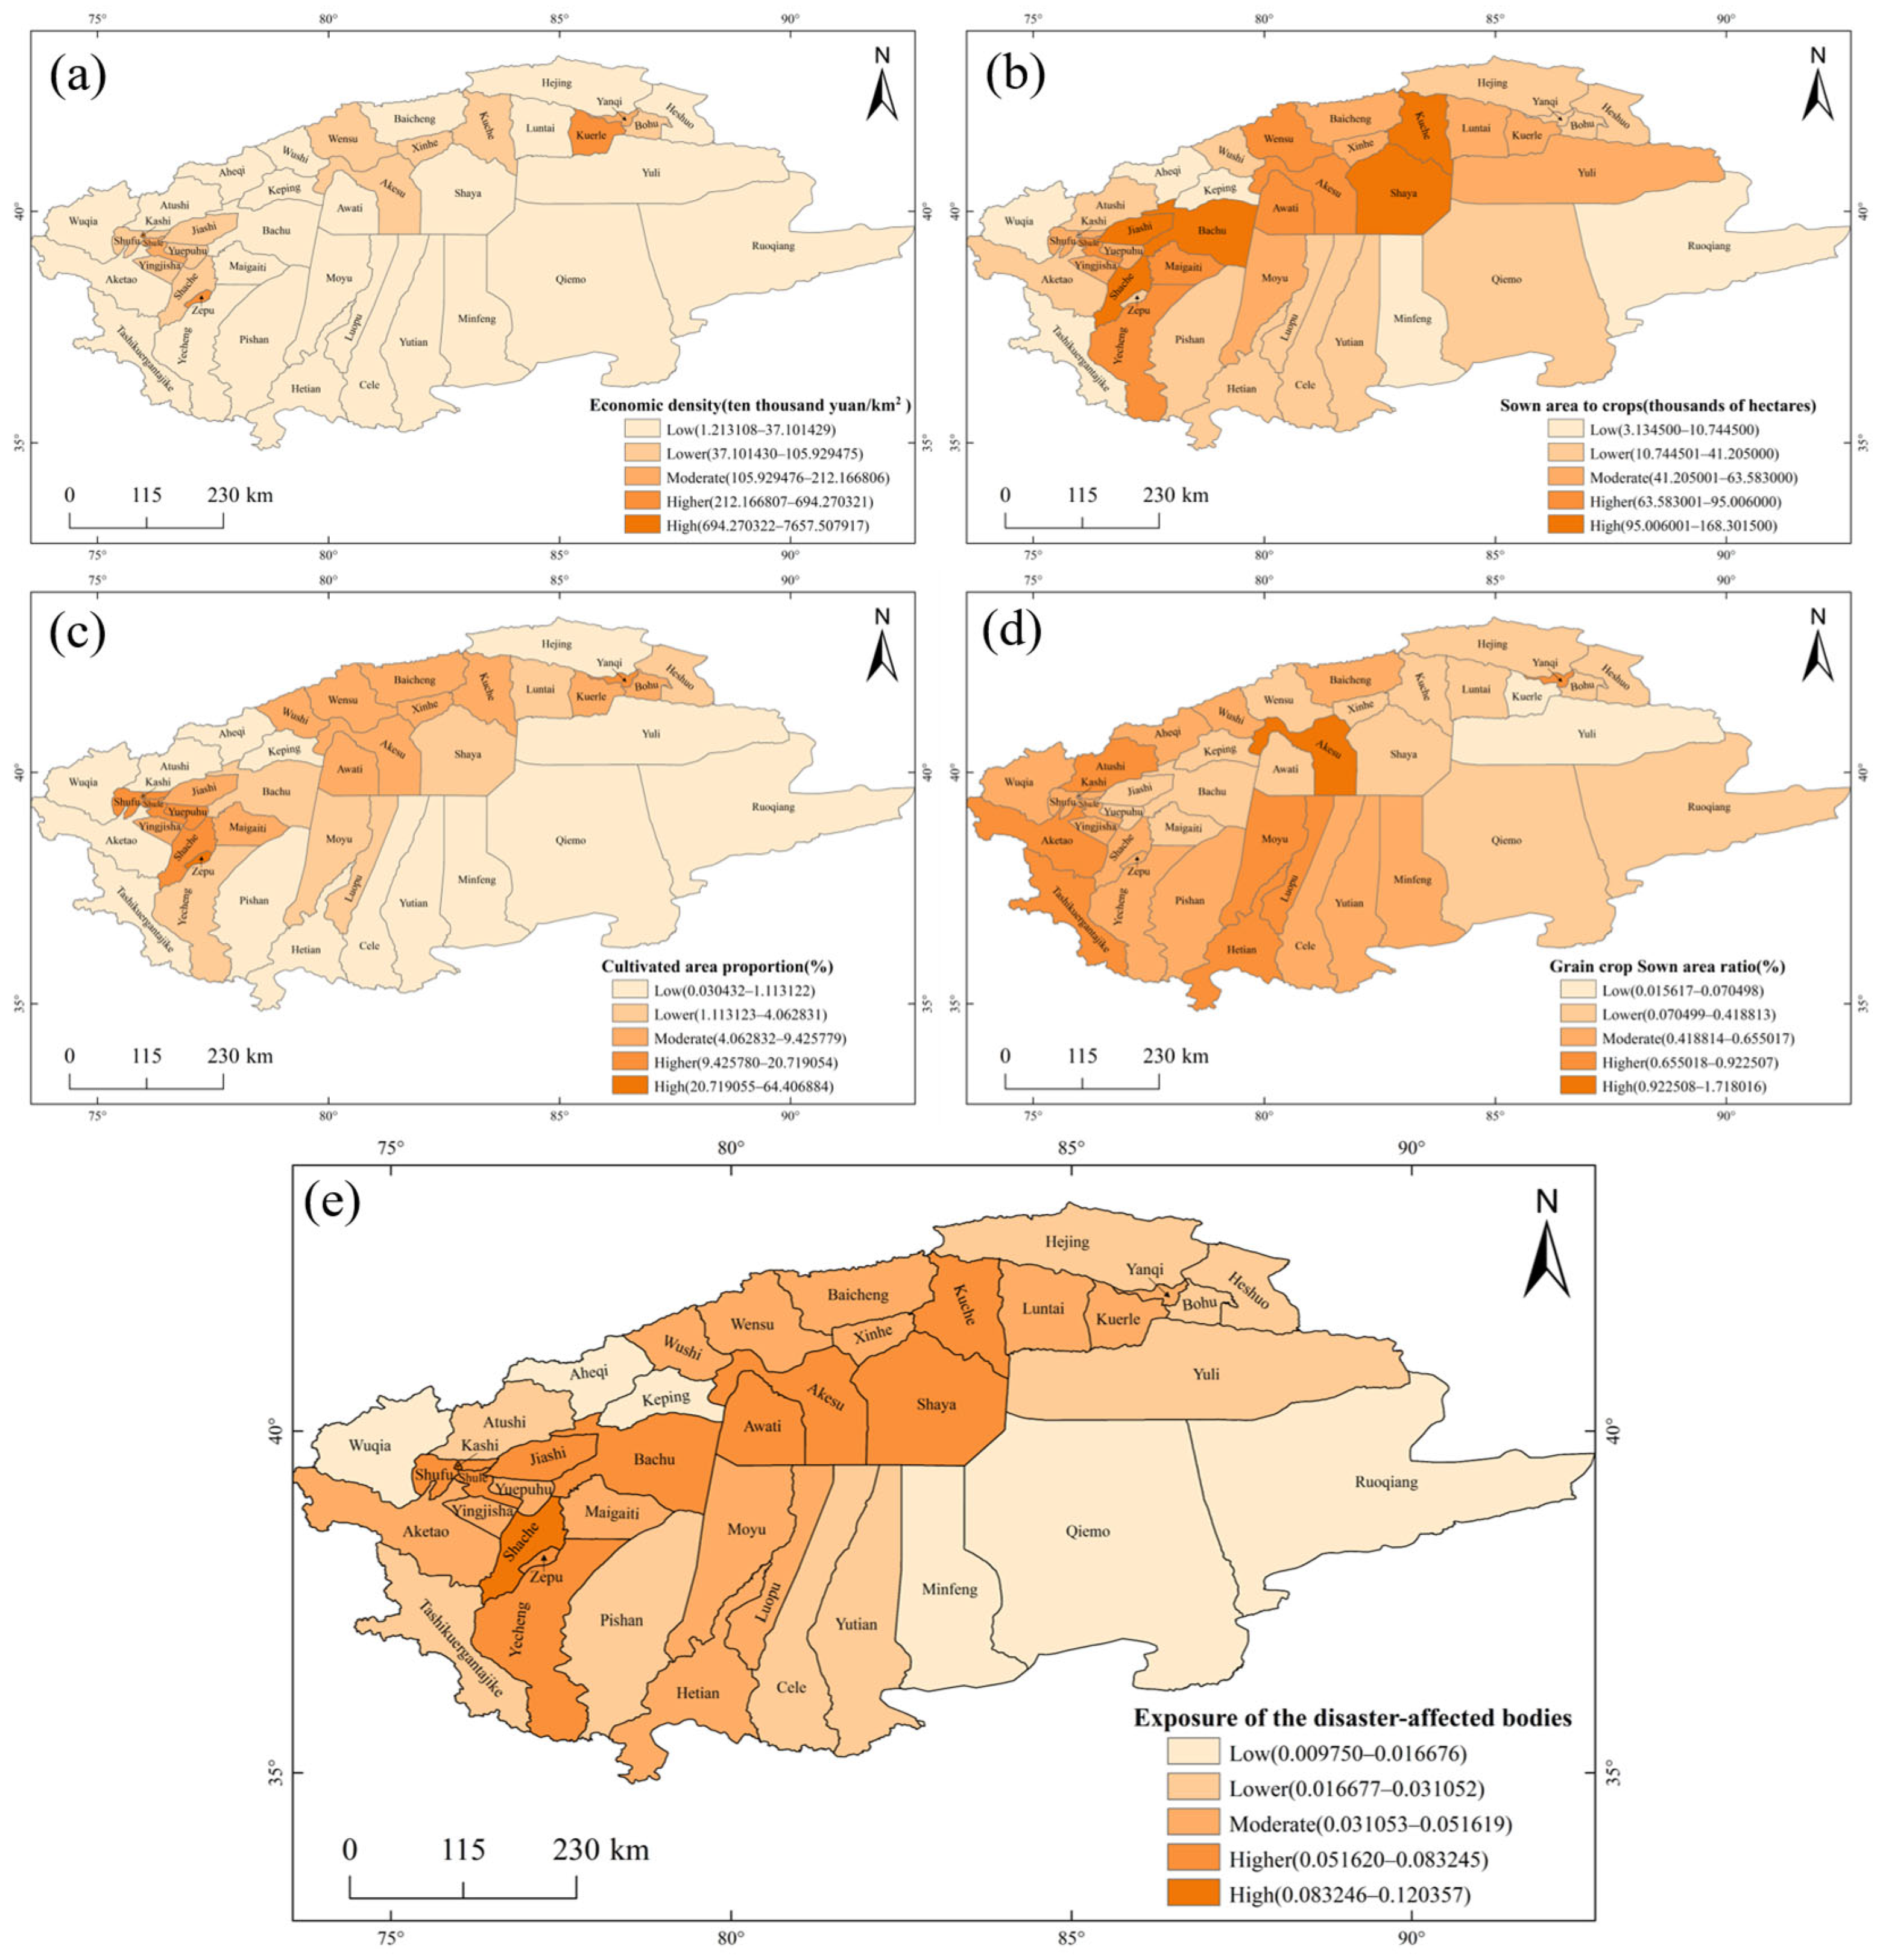
3.5. Exposure Analysis of the Disaster-Affected Bodies
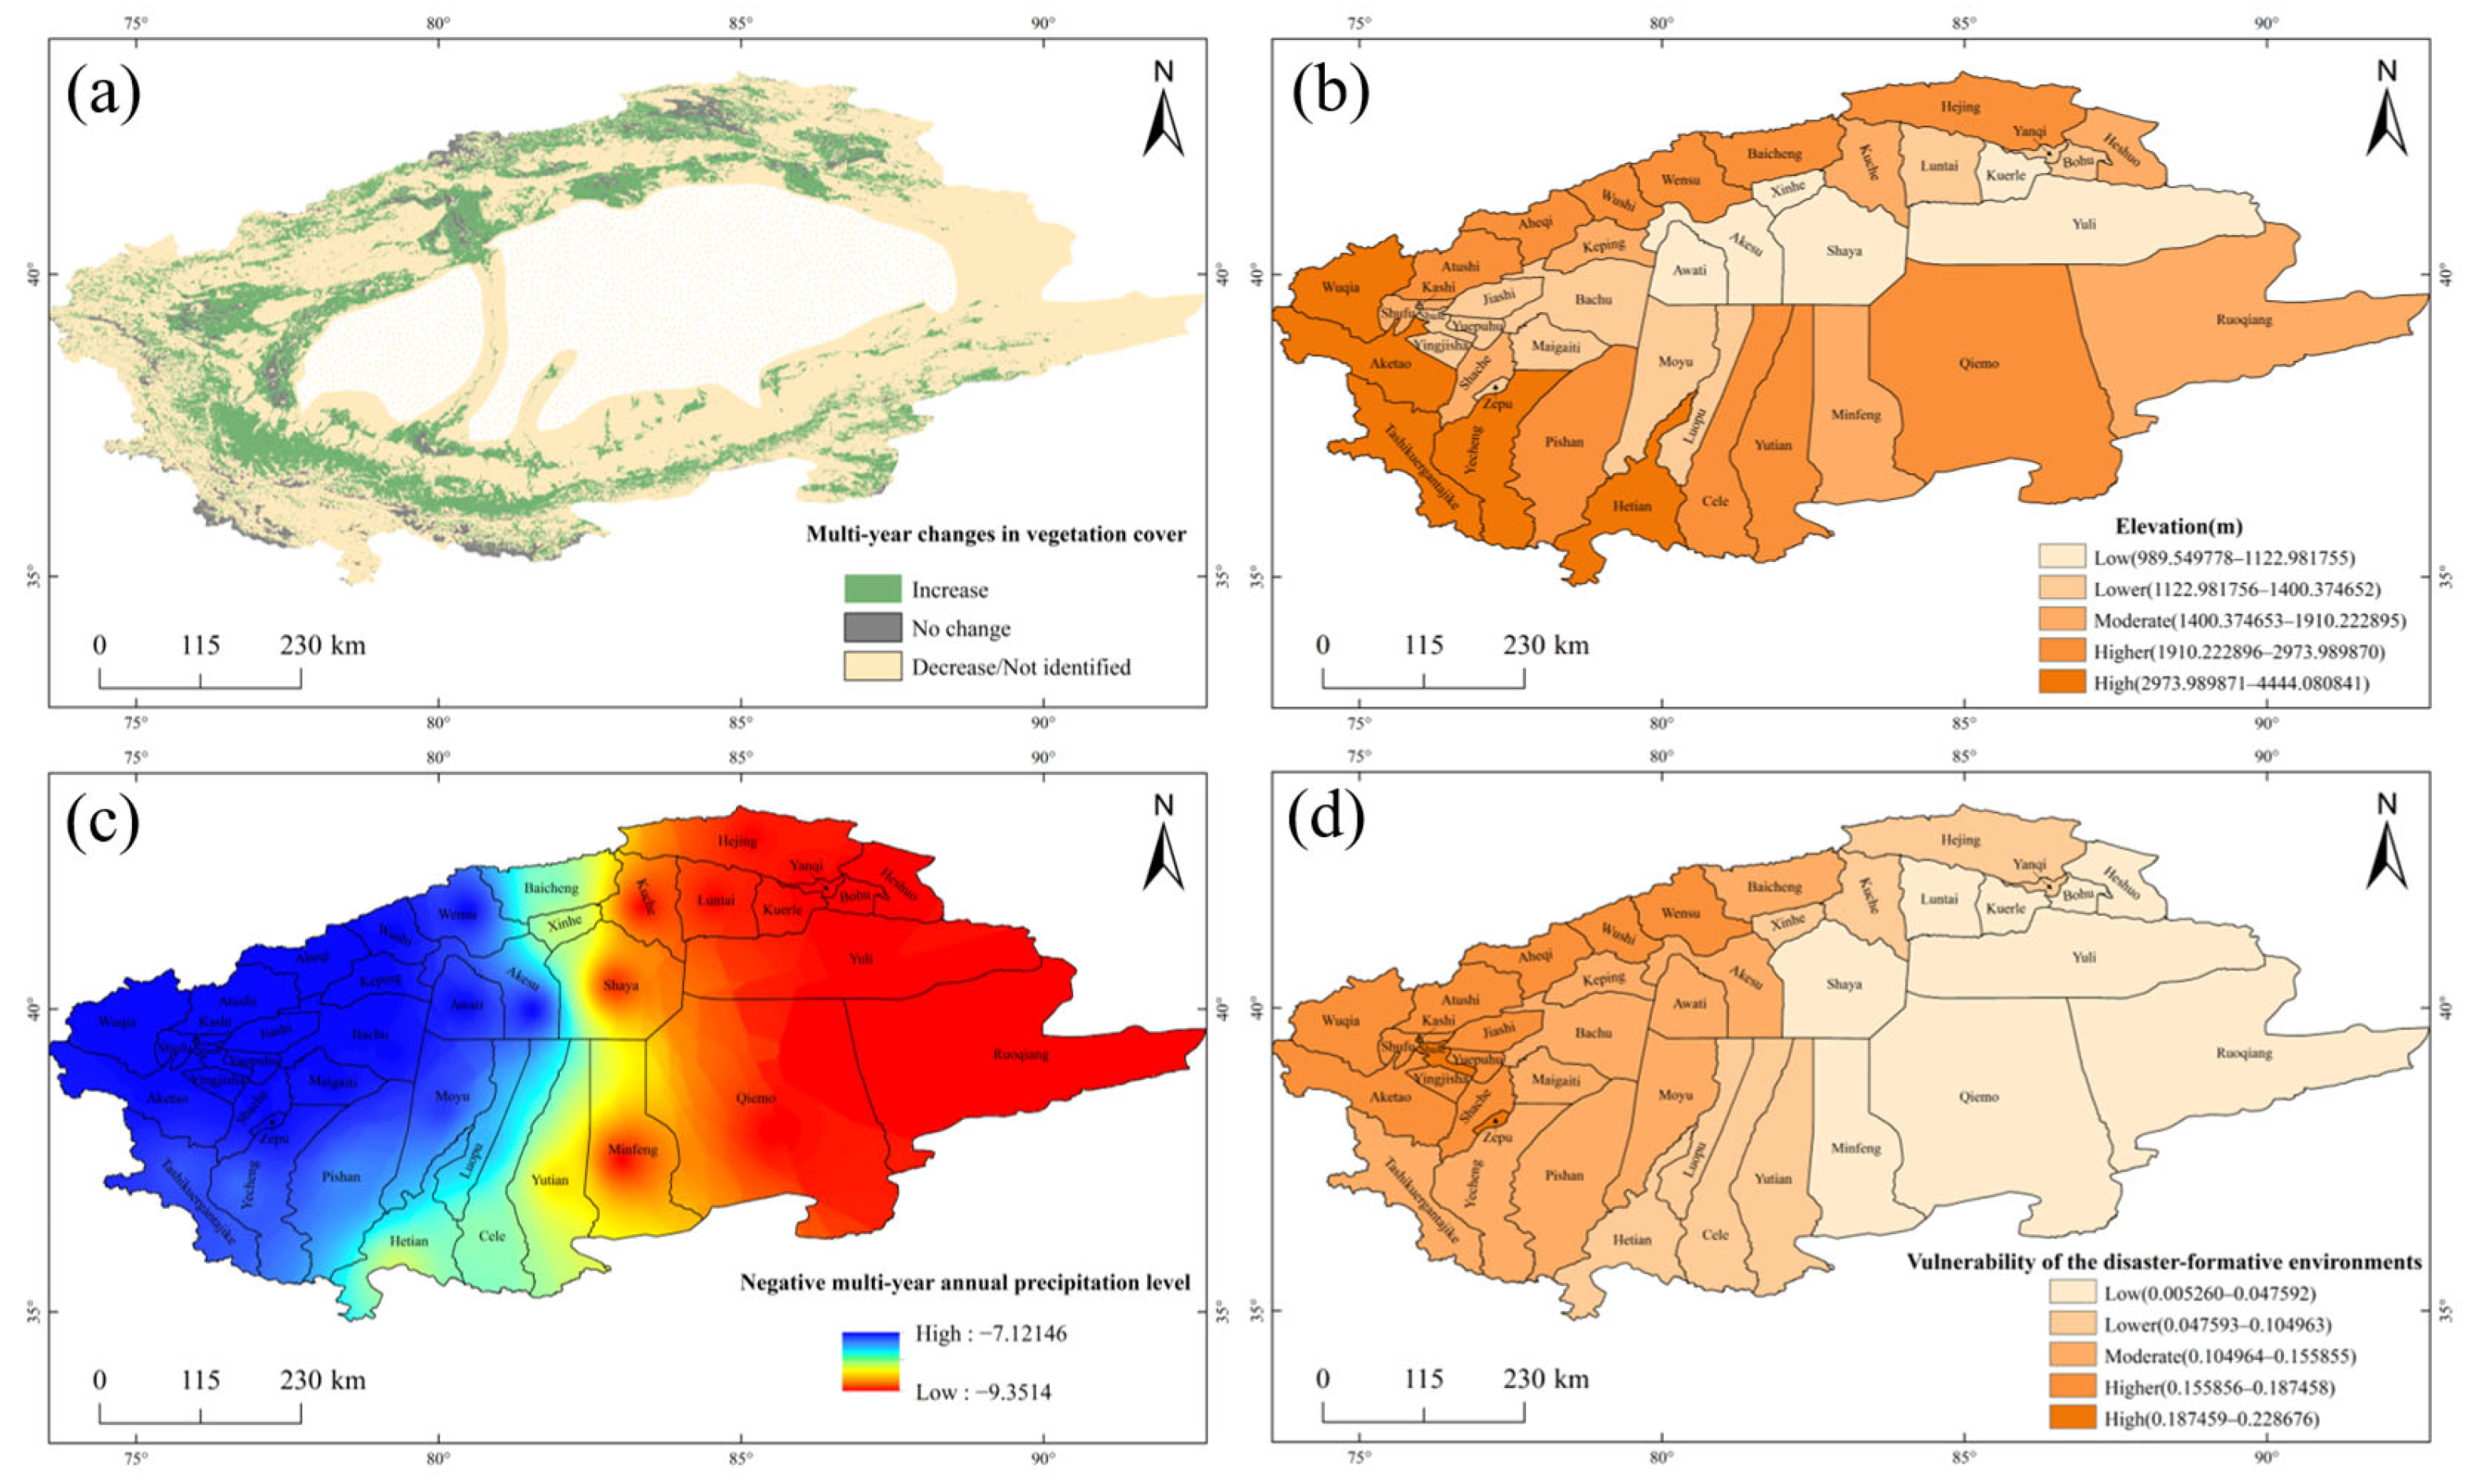
3.6. Vulnerability Analysis of the Disaster-Formative Environments
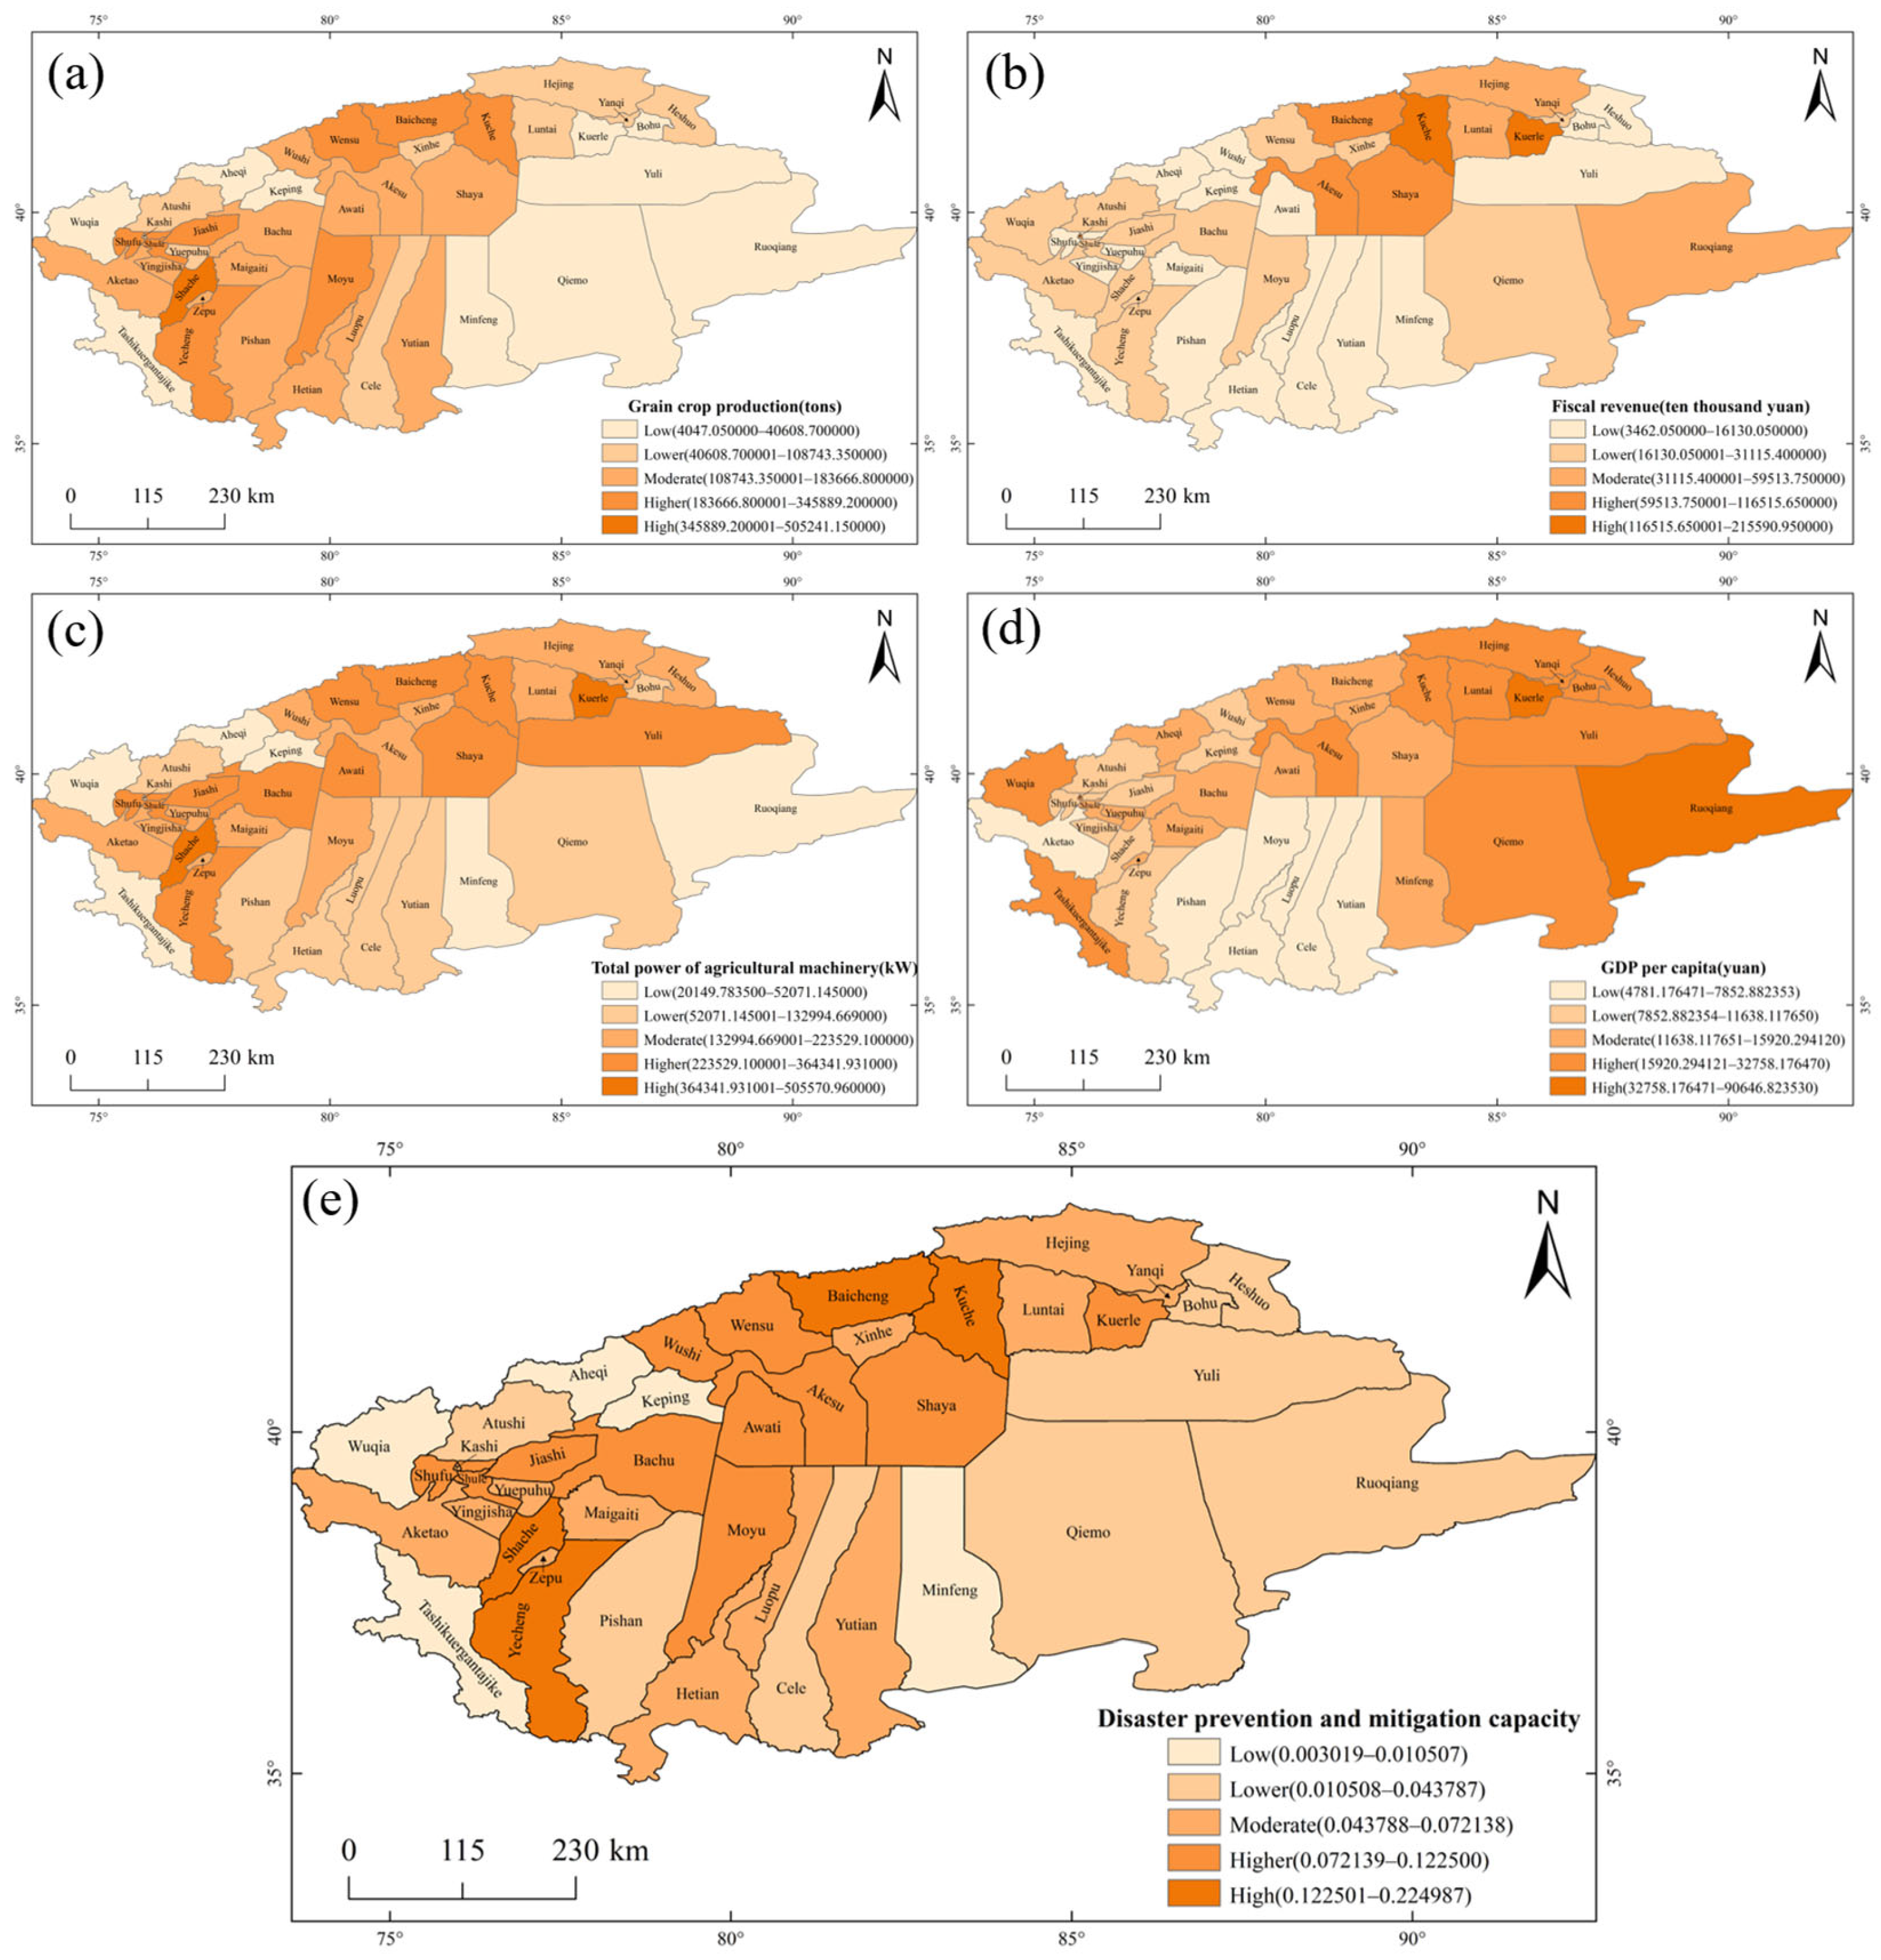
3.7. Analysis of Disaster Prevention and Mitigation Capacity
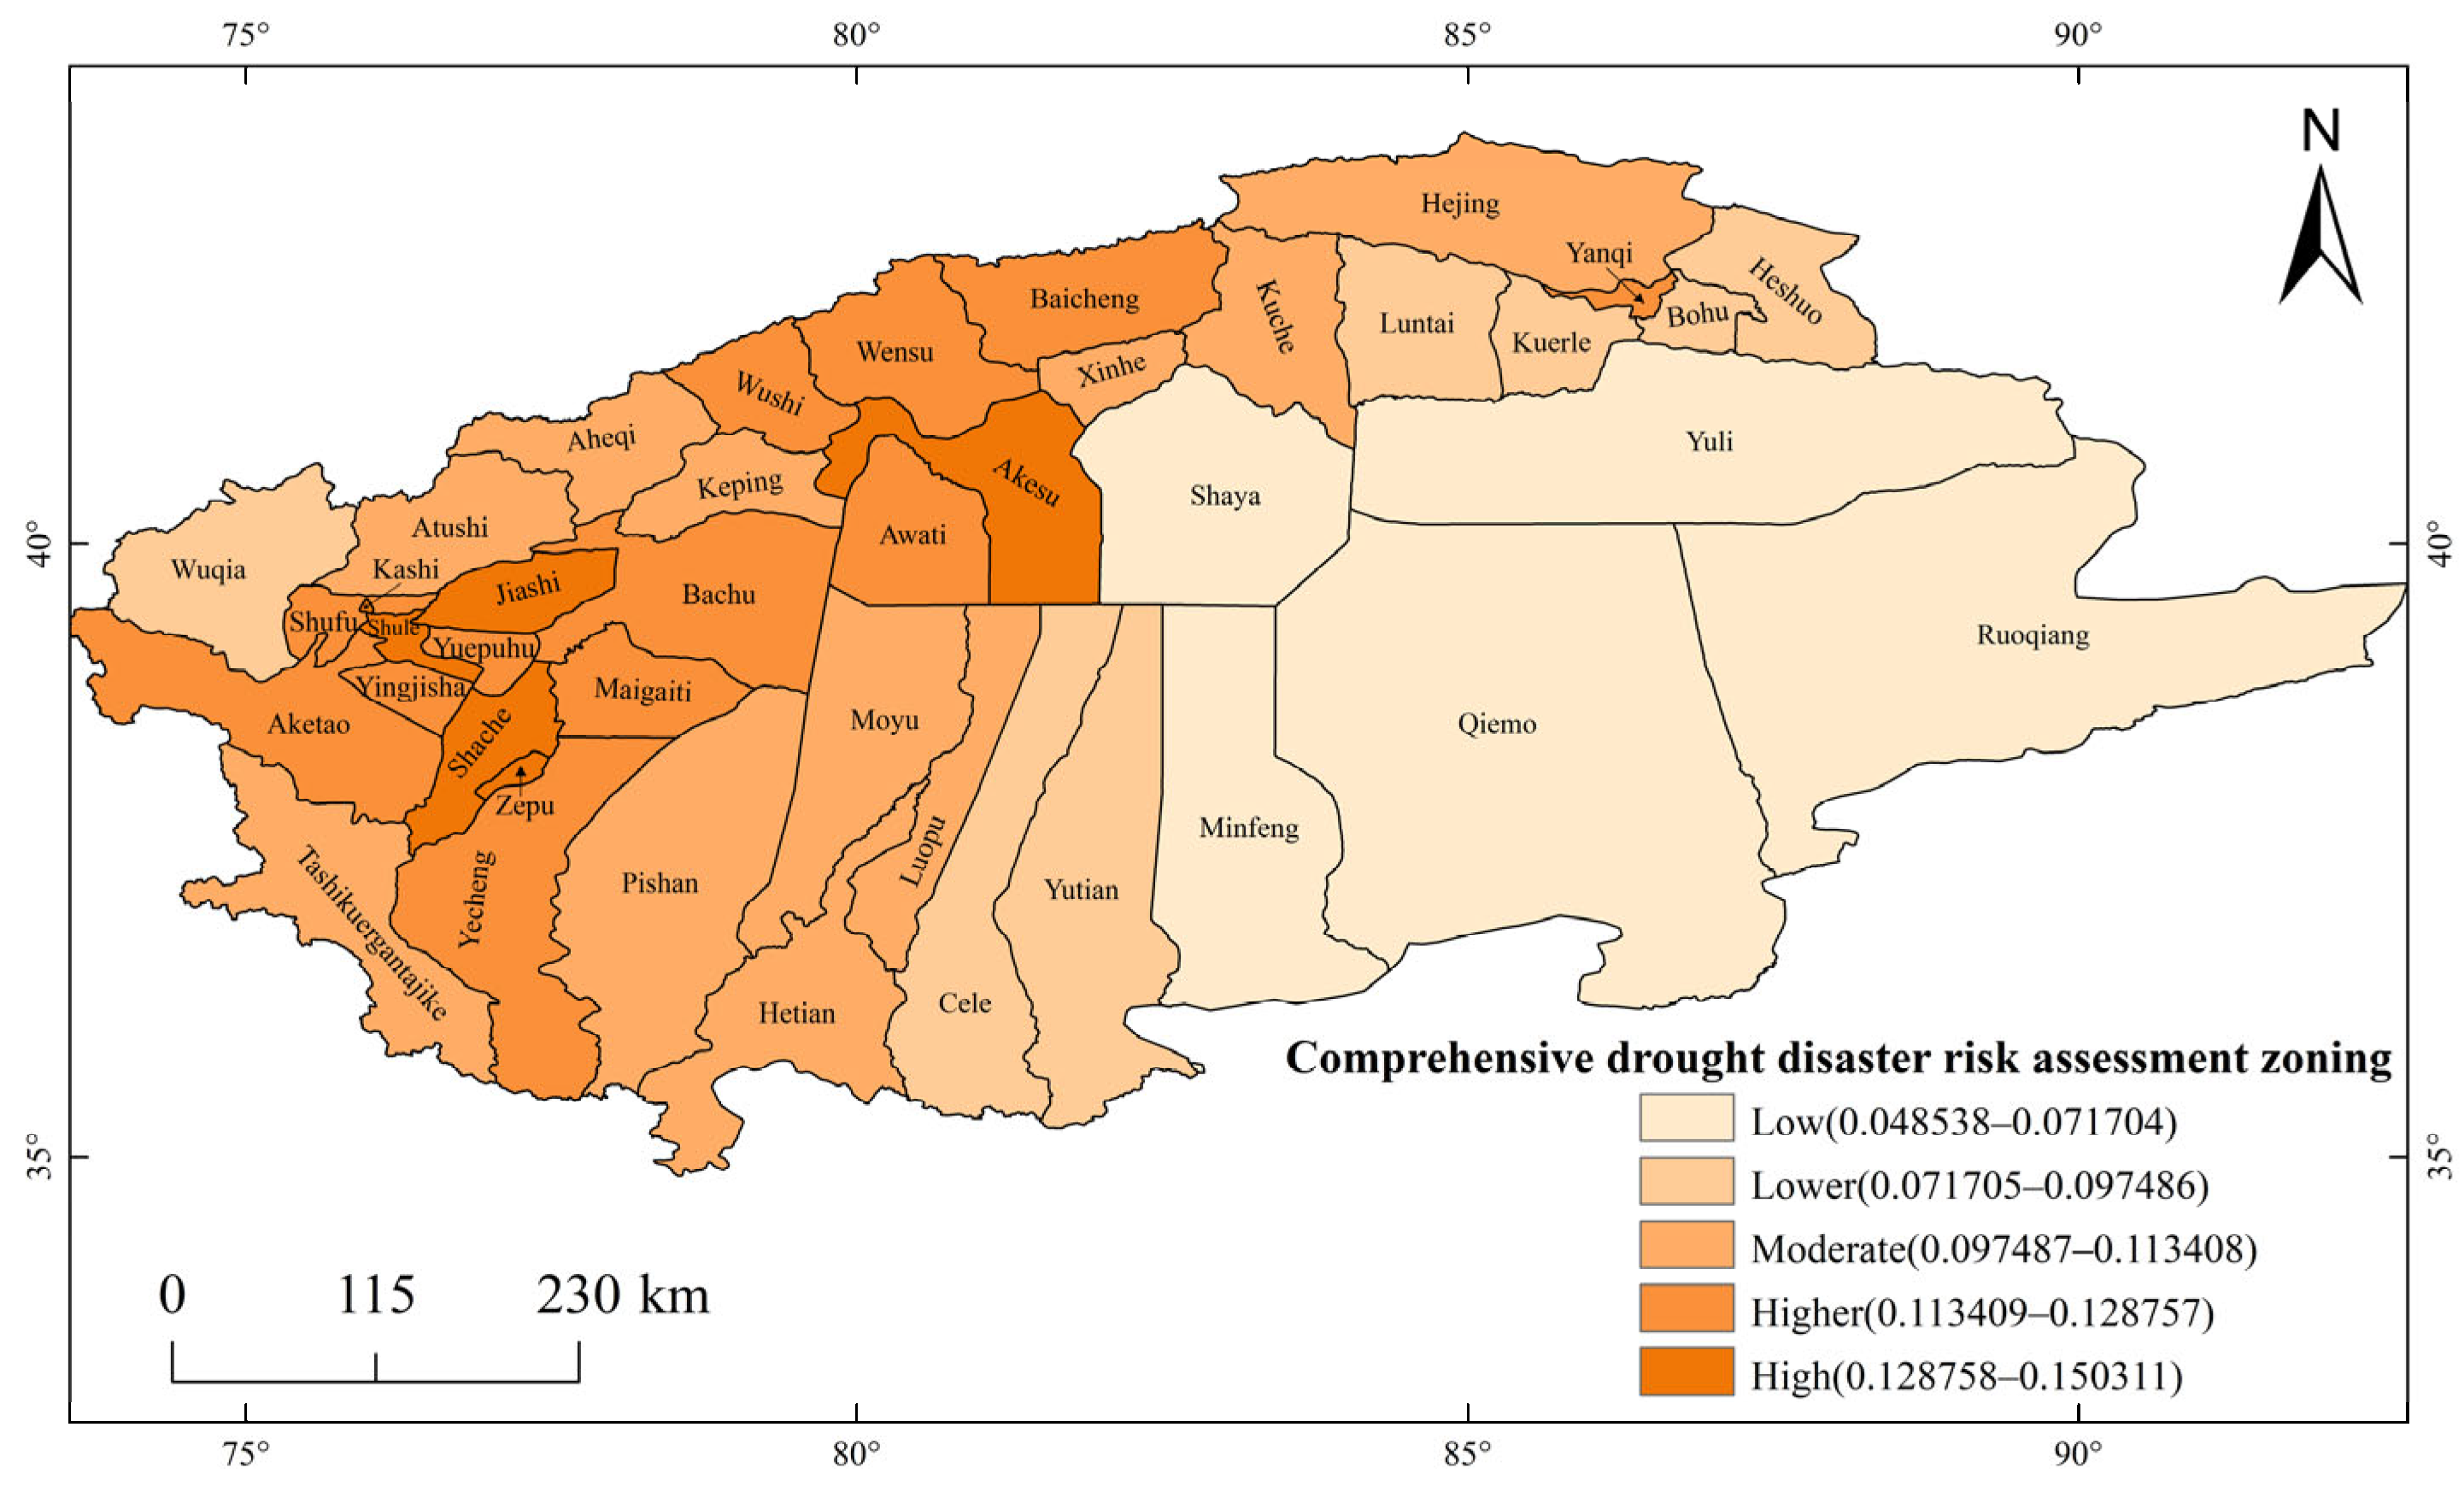
3.8. Drought Disaster Risk Assessment and Zoning
4. Discussion
5. Conclusions
- (1)
- The Tarim River Basin is characterized by low precipitation amounts. The greatest and lowest overall performance was observed mainly in the western part of the basin, which is consistent with the spatial distribution of the hazard level of the drought-disaster-causing factors. Indeed, an aridification trend was found in the western and eastern parts of the basin. In general, the study area exhibited a spatial aridification trend. The results highlighted an increase in the vegetation cover in the Tarim River basin by 25.7% from 2000 to 2023 and remained unchanged at 4.5%. On the other hand, a decreasing trend of the vegetation cover was found in the remaining parts of the study area.
- (2)
- The light drought class exhibited high frequencies in the western, central, and northeastern regions of the Tarim River Basin. On the other hand, the highest frequencies of the moderate drought class were found in the northwestern, northeastern, and southeastern parts, while those of the severe drought class were observed in the northeastern and southwestern parts. In contrast, the highest frequencies of the exceptional drought class were observed only in the northeastern part of the basin. The drought risk-causing factors were high in the northeastern part of the Tarim River Basin. The greatest disaster-affected bodies exposure exhibited a decreasing trend from the northwest to the eastern part. The greatest disaster prevention/mitigation capacity was found in the northern and southwestern parts of the basin. On the other hand, the vulnerability level of the disaster-conceiving environment had a decreasing trend from the northwestern to the southeastern parts of the study area.
- (3)
- The western and northern parts of the Tarim River Basin exhibited the highest drought risk levels, followed, respectively, by the northeastern and southeastern parts.
Author Contributions
Funding
Institutional Review Board Statement
Informed Consent Statement
Data Availability Statement
Conflicts of Interest
References
- Feng, L.C.; Wang, Y.J. Study on the Spatiotemporal Evolution Characteristics of Meteorological Drought in the Tarim River Basin. China Water Power Electrif. 2020, 11, 26–29+17. [Google Scholar] [CrossRef]
- Zhang, L.; Guo, F.Q.; Wei, G.H. Research on Emergency Strategies for Drought Mitigation in the Tarim River Basin, Xinjiang. Groundwater 2024, 46, 217–219+313. [Google Scholar] [CrossRef]
- Sun, P.; Zhang, Q.; Deng, X.Y.; Bai, Y.G.; Zhang, J.H. Drought Risk Assessment and Regionalization in the Tarim River Basin. J. Sun Yat-sen Univ. (Nat. Sci. Ed.) 2014, 53, 121–127. [Google Scholar] [CrossRef]
- Tsakiris, G. Drought risk assessment and management. Water Resour. Manag. 2017, 31, 3083–3095. [Google Scholar] [CrossRef]
- Cheng, Y.P. Agricultural Drought Risk Assessment and Regionalization in Henan Province. Master’s Thesis, North China University of Water Resources and Electric Power, Zhengzhou, China, 2016. [Google Scholar]
- Wu, D.; Zhang, H.T.; He, B.; Wang, Q.; Zhou, B. Agricultural Drought Risk Assessment and Regionalization in Shaanxi Province Based on Fuzzy Clustering Iterative Model. Agric. Res. Arid Areas 2018, 36, 230–241. [Google Scholar]
- Jia, J.Y.; He, N.; Han, L.Y.; Zhang, Q.; Zhang, Y.F.; Hu, J.M. Drought Risk Analysis of Maize in Southwest China Based on Natural Disaster Risk Theory and ArcGIS. Trans. Chin. Soc. Agric. Eng. 2015, 31, 152–159. [Google Scholar]
- Wu, Z.Y.; Fan, S.Q.; He, H.; Li, Y. Risk Regionalization of Agricultural Drought Disaster in Hunan Province. Water Resour. Prot. 2023, 39, 31–39. [Google Scholar] [CrossRef]
- Zheng, F.; Ma, L.W. Agricultural Drought Risk Assessment and Regionalization in Ningxia. J. Agric. Disaster Res. 2021, 11, 152–155. [Google Scholar]
- Dong, T.T. Research on Agricultural Drought Risk Assessment in Liaoning Province. Water Resour. Dev. Res. 2017, 17, 54–56+60. [Google Scholar] [CrossRef]
- Huang, Z.L.; Cheng, K.; Ruan, X.L. Fire Safety Assessment of Urban Utility Tunnels Based on Analytic Hierarchy Process. Urban Archit. 2025, 22, 65–67. [Google Scholar] [CrossRef]
- Feng, Y.T.; Li, C.X.; Chen, S.L. Comprehensive Evaluation and Ranking Analysis of Urban Digital Economy Development in Guangdong Province Based on Entropy Method. Mod. Bus. 2025, 4, 161–164. [Google Scholar] [CrossRef]
- Liu, X.F.; Zhu, X.F.; Pan, Y.Z.; Xia, X.S. Framework and Application of Agricultural Drought Risk Assessment in Henan Province. J. Beijing Norm. Univ. (Nat. Sci.) 2015, 51 (Suppl. S1), 8–12. [Google Scholar] [CrossRef]
- Li, H.J.; Jiang, Z.H.; Bai, Y.G. Improvement and Evaluation of Palmer Drought Severity Index in the Tarim River Basin. Plateau Meteorol. 2015, 34, 1057–1064. [Google Scholar]
- Li, C.J.; Bo, Y.P.; An, M.Y.; Peng, Y. Evolution of Drought Characteristics in Guizhou Province Based on SPI. Haihe Water Resour. 2025, 2, 82–88. [Google Scholar]
- Tang, M.; Zhang, B.; Zhang, Y.Z.; Wang, G.Q.; Ma, B.; Jia, Y.Q. Assessment of Spring and Summer Meteorological Drought Characteristics in Eastern Agricultural Regions of Qinghai Province Based on SPEI and SPI. J. Nat. Resour. 2017, 32, 1029–1042. [Google Scholar] [CrossRef]
- Zhang, Y.; Wang, X.J.; Zhang, X.; Yi, Z.B.; Zhao, Y.J. Determination of Meteorological Drought Indices and Analysis of Drought Characteristics in the Oasis Agricultural Region of Northern Xinjiang. Desert Oasis Meteorol. 2024, 18, 133–142. [Google Scholar]
- Turghun, A. Characteristics and Causes of Drought Disasters in the Tarim River Basin (Characterization and Causes of Drought Disasters in the Tahe River Basin). Water Resour. Plan. Des. 2015, 11, 18–21. [Google Scholar] [CrossRef]
- Musha, R.Z. Characteristics and Causes of Drought Disasters in the Tarim River Basin (Characteristics of Drought Disaster in the Tarim River Basin and Analysis of Its Causes). Master’s Thesis, Xinjiang Agricultural University, Urumqi, China, 2013. [Google Scholar]
- Feng, Y.; Xue, L.Q.; Zhang, L.C. Comparative Analysis of Three Meteorological Drought Indices in the Tarim River Basin. Water Resour. Power 2018, 36, 23–26+142. [Google Scholar] [CrossRef]
- Wang, Y.L.; Wang, R.; Shan, F.J.; Zhang, X.X.; Zhao, Y.; Sun, Y. Analysis of Drought Characteristics of Maize in Liaoning Province Based on SPEI Index. J. Liaoning Univ. Technol. (Nat. Sci. Ed.) 2024, 44, 273–280. [Google Scholar] [CrossRef]
- GB/T 20481-2017; Classification of Meteorological Drought. Standards Press of China: Beijing, China, 2017.
- Wang, Y.D. Calculation of Regional Average Rainfall Using Thiessen Polygon Method Based on ArcGIS. Jilin Water Resour. 2014, 6, 58–60+63. [Google Scholar] [CrossRef]
- Wang, Y.; Jin, M.J.; Ding, W.; Li, X.; Zhao, Y. Construction of Competency Index System for Hospital Infection Prevention and Control Personnel Based on Analytic Hierarchy Process-Entropy Method. China Med. Her. 2024, 21, 134–138. [Google Scholar] [CrossRef] [PubMed]
- Yang, W.; Zhang, L.; Liang, C. Agricultural Drought Disaster Risk Assessment in Shandong, China; Springer: Berlin, Germany, 2022. [Google Scholar] [CrossRef]
- Shi, Q. Risk Assessment and Regionalization of Drought Disasters in Heilongjiang Province. Master’s Thesis, Heilongjiang University, Harbin, China, 2024. [Google Scholar] [CrossRef]
- Mu, Z.X.; Tian, X.J.; Zhang, Y.X.; Ding, Z.L. Drought Disaster Risk Assessment and Regionalization in the Ili River Basin Based on ERA5 Reanalysis Data. Water Resour. Power 2024, 42, 28–32. [Google Scholar] [CrossRef]
- He, B.; Wang, Q.J.; Wu, D.; Su, L.J.; Shan, Y.Y. Agricultural Drought Risk Assessment in Shaanxi Province Based on Principal Component Analysis and Analytic Hierarchy Process. Agric. Res. Arid Areas 2017, 35, 219–227. [Google Scholar]
- Ren, W.; Qiu, M.J.; Tan, Y.J.; Chen, B.W. Drought Risk Analysis of Summer Maize at Main Growth Stages in Zhumadian City Based on Precipitation Anomaly Percentage. J. Hunan Ecol. Sci. 2024, 11, 85–91. [Google Scholar] [CrossRef]
- Tian, Y.; Ji, Z.W.; Wang, D.W.; Xie, Y.Q. Vegetation Coverage and Ecological Water Requirement in the Yellow River Delta. Res. Soil Water Conserv. 2025, 32, 168–175+188. [Google Scholar] [CrossRef]
- Wang, T.T. Study on Potential Evapotranspiration and Drought Characteristics in the Tarim River Basin. Master’s Thesis, Shanghai Normal University, Shanghai, China, 2022. [Google Scholar] [CrossRef]


| Station Name | District Station Number | Longitude/° | Latitude/° | Elevation/m |
|---|---|---|---|---|
| Baluntai | 51,467 | 86.3333 | 42.7667 | 1732.4 |
| Bayinbuluike | 51,542 | 84.1500 | 43.0333 | 2458.0 |
| Kuche | 51,644 | 82.9667 | 41.7167 | 1081.9 |
| Kuerle | 51,656 | 85.8167 | 41.7333 | 899.8 |
| Kashi | 51,709 | 75.7500 | 39.4833 | 1385.6 |
| Aheqi | 51,711 | 78.4500 | 40.9333 | 1985.1 |
| Bachu | 51,716 | 78.5667 | 39.8000 | 1116.5 |
| Alaer | 51,730 | 81.2667 | 40.5500 | 1012.2 |
| Tieganlike | 51,765 | 87.7000 | 40.6333 | 846.0 |
| Ruoqiang | 51,777 | 88.1667 | 39.0333 | 887.7 |
| Shache | 51,811 | 77.2667 | 38.4333 | 1231.2 |
| Pishan | 51,818 | 78.2833 | 37.6167 | 1375.4 |
| Hetian | 51,828 | 79.9333 | 37.1333 | 1375.0 |
| Aheqi | Alaer | Bachu | Baluntai | Bayinbuluke | Hetian | Kashi | Kuche | Kuerle | Pishan | Ruoqiang | Shache | Tieganlike | |
|---|---|---|---|---|---|---|---|---|---|---|---|---|---|
| W | 0.048 | 0.070 | 0.037 | 0.033 | 0.030 | 0.176 | 0.103 | 0.044 | 0.032 | 0.081 | 0.215 | 0.076 | 0.054 |
| Particular Year | Drought Degrees | SPI Index/% | SPEI Index/% | nSPEI Index/% | ||||||
|---|---|---|---|---|---|---|---|---|---|---|
| Mild | Moderate | Severe to Exceptional | Mild | Moderate | Severe to Exceptional | Mild | Moderate | Severe to Exceptional | ||
| 1973 | Mild | 23.08 | 23.08 | 7.69 | 15.38 | 23.08 | 7.69 | 23.08 | 23.08 | 0.00 |
| 1978 | Mild | 0.00 | 0.00 | 0.00 | 23.08 | 0.00 | 0.00 | 7.69 | 0.00 | 0.00 |
| 1985 | Severe | 15.38 | 30.77 | 53.85 | 46.15 | 23.08 | 0.00 | 30.77 | 38.46 | 23.08 |
| 1999 | Exceptional | 0.00 | 0.00 | 100.00 | 15.38 | 30.77 | 53.85 | 0.00 | 0.00 | 100.00 |
| 2005 | Exceptional | 7.69 | 0.00 | 0.00 | 0.00 | 0.00 | 7.69 | 0.00 | 0.00 | 7.69 |
| 2007 | Exceptional | 23.08 | 15.38 | 15.38 | 0.00 | 7.69 | 61.54 | 7.69 | 23.08 | 30.77 |
| 2008 | Severe | 38.46 | 7.69 | 0.00 | 15.38 | 30.77 | 38.46 | 15.38 | 46.15 | 7.69 |
| 2011 | Severe | 23.08 | 15.38 | 7.69 | 38.46 | 7.69 | 23.08 | 23.08 | 7.69 | 23.08 |
| 2020 | Severe | 7.69 | 7.69 | 0.00 | 15.38 | 0.00 | 7.69 | 15.38 | 0.00 | 7.69 |
| 2022 | Severe | 38.46 | 30.77 | 0.00 | 7.69 | 0.00 | 76.92 | 15.38 | 23.08 | 46.15 |
| Target Levels | Standardized Layers | Weighting | Indicators | Weighting | Correlations |
|---|---|---|---|---|---|
| Drought risk | Hazard of the disaster-formative factors | 0.493 | Light drought | 0.020 | Positive |
| Moderate drought | 0.064 | Positive | |||
| Severe drought | 0.066 | Positive | |||
| Exceptional drought | 0.102 | Positive | |||
| Exposure of the disaster-affected bodies | 0.162 | Grain cropSown area ratio | 0.041 | Positive | |
| Sown area to crops | 0.082 | Positive | |||
| Economic density | 0.029 | Positive | |||
| Cultivated area proportion | 0.068 | Positive | |||
| Vulnerability of the disaster-formative environments | 0.267 | Proportion of negative annual precipitation level | 0.120 | Positive | |
| Vegetation cover | 0.105 | Negative | |||
| Elevation | 0.039 | Positive | |||
| Disaster prevention and mitigation capacity | 0.078 | Fiscal revenue | 0.024 | Positive | |
| Grain crop production | 0.150 | Positive | |||
| Total power of agricultural machinery | 0.071 | Positive | |||
| GDP per capita | 0.019 | Positive |
Disclaimer/Publisher’s Note: The statements, opinions and data contained in all publications are solely those of the individual author(s) and contributor(s) and not of MDPI and/or the editor(s). MDPI and/or the editor(s) disclaim responsibility for any injury to people or property resulting from any ideas, methods, instructions or products referred to in the content. |
© 2025 by the authors. Licensee MDPI, Basel, Switzerland. This article is an open access article distributed under the terms and conditions of the Creative Commons Attribution (CC BY) license (https://creativecommons.org/licenses/by/4.0/).
Share and Cite
Kong, X.; Li, Q.; Tao, H.; Aihemaiti, M. Drought Risk Assessment and Zoning in the Tarim River Basin, Xinjiang, China. Agriculture 2025, 15, 1287. https://doi.org/10.3390/agriculture15121287
Kong X, Li Q, Tao H, Aihemaiti M. Drought Risk Assessment and Zoning in the Tarim River Basin, Xinjiang, China. Agriculture. 2025; 15(12):1287. https://doi.org/10.3390/agriculture15121287
Chicago/Turabian StyleKong, Xiangzhi, Qiao Li, Hongfei Tao, and Mahemujiang Aihemaiti. 2025. "Drought Risk Assessment and Zoning in the Tarim River Basin, Xinjiang, China" Agriculture 15, no. 12: 1287. https://doi.org/10.3390/agriculture15121287
APA StyleKong, X., Li, Q., Tao, H., & Aihemaiti, M. (2025). Drought Risk Assessment and Zoning in the Tarim River Basin, Xinjiang, China. Agriculture, 15(12), 1287. https://doi.org/10.3390/agriculture15121287