Article

Effects of Tillage Systems and Bacterial Inoculation on Enzyme Activities and Selected Soil Chemical Properties

1
Department of Pedotechnics, Faculty of Agriculture, “Ion Ionescu de la Brad” Iasi University of Life Sciences, 3, Mihail Sadoveanu Alley, 700490 Iasi, Romania
2
Research Institute for Agriculture and Environment, “Ion Ionescu de la Brad” Iasi University of Life Sciences, 700789 Iasi, Romania
3
Institute of Biological Research, 700107 Iasi, Romania
*
Author to whom correspondence should be addressed.
Agriculture 2025, 15(12), 1285; https://doi.org/10.3390/agriculture15121285
Submission received: 28 May 2025 / Revised: 11 June 2025 / Accepted: 12 June 2025 / Published: 14 June 2025
(This article belongs to the Special Issue Land Use Change Impacts on Crop Yield and Agricultural Soils)

Abstract

Excessive tillage and chemical fertilization are the primary attributes of conventional farming and the main causes of soil degradation. This research focused on the comparative study of two tillage systems: conventional (CT) and no-tillage (NT), as well as on the effect of chemical fertilizers and different Bacillus megaterium var. phosphaticum inoculum rates (75, 100 and 125%) on soil properties. This short-term experiment was conducted under field conditions in Northeastern Romania from 2023 to 2024. Soil dehydrogenase, catalase, acid, and alkaline phosphatase activities, pH, organic carbon content (SOC), total nitrogen (TN), total phosphorus, and available phosphorus (TP and AP) were determined. Bacillus treatments generally inhibited soil enzyme activity by 0.35 to 57%, depending on the enzyme type. Under NT, activity increased by up to 59% for dehydrogenase, 43% for acid phosphatase, and 70% for alkaline phosphatase compared to the CT system. An opposite trend was found for catalase, along with a negative correlation with the other enzymes. There were positive differences in TP concentration at 125% Ecofertil + N in both CT (0.0577 ppm) and NT (0.0578 ppm) in 2023 compared to the control (0.0346–0.0374 ppm). In the same year, after the first inoculation, AP increased significantly with bacterial treatments in CT, from 32.34% (T0) to 47.94% (T4), and at crop harvest in NT in 2024, from 34.18% (T0) to 91.06% (T3). The results suggest that enzymatic activities and soil chemical properties were more influenced by soil management than the interaction between inoculated bacteria and chemical fertilizers.

1. Introduction

The importance of soil as the basis of life on Earth makes it interesting both in terms of quality, with an influence on living conditions, and fertility, in terms of food supply. Soil quality reflects the potential of a given soil to function and to maintain biological productivity, sustain water and air quality, and to protect human health [1,2]. Soil fertility is the capacity to provide an optimal environment for plant growth and development as a result of soil chemical, physical, and biological processes [3]. Appropriate soil management can protect and/or improve these soil attributes [4], but this requires adequate optimization of farming practices according to soil and climate specificity, the crops grown, and their implementation with the least possible negative impact on the ecosystem. Although conventional tillage (CT) provides the optimal environment for the development of the plant root system and the balanced distribution of nutrients in the soil profile, its long-term practice has been shown to have adverse effects on soil properties [5]. Thus, the need for conservative practices is increasing, as they create favorable conditions for plant growth in terms of physical characteristics (water stable aggregates, porosity) [6,7,8], soil organic carbon (SOC) storage capacity, and promoting key macronutrient availability (N, P, K) [5,9]. Due to the absence of disturbance and residues retained on the soil surface, the no-tillage system (NT) has the potential to conserve soil and store water [10], promote diversity and activity of microbiota [11], increase organic matter content [12], stimulate enzymatic activities [13], and improve nutrient status [14].
Regardless of soil management, increasing amounts of chemical fertilizers have many negative consequences, threatening the environment and human health. Therefore, researchers have proposed the appropriate utilization of genetic resources and soil functions, which means, among other actions, isolating and inoculating beneficial microorganisms [15,16]. Biofertilizers contain microbial strains capable of fixing, solubilizing nutrients, or producing compounds such as amino acids, hormones [17], stress enzymes, exopolysaccharides, and siderophores [18], promoting crop performance.
Phosphorus (P) is an essential nutrient for plant viability, and its uptake from the soil can be promoted by microbial inoculation. P is involved in the mechanisms of photosynthesis, respiration, and protein and complex carbohydrate biosynthesis, it plays a major role in the composition of nucleic acids [19,20], and it regulates the physiological response of plants to stress [21]. P is widely distributed in the lithosphere, but the inorganic orthophosphate (Pi) needed by plants is largely insoluble, and the rate of diffusion in soil is very low [22]. Microbial communities are responsible for the availability of an important fraction of soil P. Isolation and utilization of phosphate-solubilizing bacteria (PSB) can provide the absorbed form to plants, allowing for efficient use of applied mineral fertilizers and soil P stocks [23,24]. This group of microorganisms contains numerous genera that are currently being studied and used as biofertilizers [20]. Many Bacillus species have been studied over the years due to their adaptability to different climatic and pedological conditions [25] and their mechanisms of P solubilization and mobilization, such as organic acid secretion [26,27] or enzymatic hydrolysis [28,29].
Chemical indicators are used to assess their ability to provide a favorable environment for plant growth. Of these, pH, SOC, P, and N content are often used because of their important role in soil processes, plant nutrition, and support of microbial populations [30].
Enzymes are natural mediators and catalysts in many key processes, such as soil organic matter (SOM) decomposition and the flow of nutrients involved in plant life cycles (N, C, P, K) [4]. Microbiota and plant roots are the main sources of enzymes, and their activity depends on environmental conditions and agricultural management [31]. Soil enzymatic activity is a much more sensitive tool for detecting soil changes than chemical and physical properties [32], and it is one of the components of soil quality. The connection between NT and soil enzyme activity has been described in several studies, which suggests that NT can increase enzymatic activity due to reduced soil disturbance, improved aggregation, and moisture retention [33,34]. Bielińska and Mocek-Płóciniak [34] emphasize that CT negatively affects soil enzymes, leading to a decrease in their activity (dehydrogenases, acid and alkaline phosphatases, proteases). The explanation for this phenomenon is that this practice often disrupts SOM and soil structure, resulting in decreased microbial activity, which is essential for enzyme activity and nutrient cycling in the soil [35]. Mijangos et al. [36] found, in general, higher activity for a group of enzymes, including β-dehydrogenase, in conservative plots versus CT, although the differences were not significant in all cases. On the other hand, Seifert et al. [37] found that the CT system, due to a high aeration level of the tilled soil, enhanced the SOM oxidation and increased soil microbial and enzymatic activity.
The aim of our research was to contribute to the understanding of the effects of implementing conservative systems and applying biofertilizers on selected soil enzymatic activities and chemical properties. Although numerous studies have been conducted on the effects of microbial inoculation on soil properties, previous results are often contradictory and do not clearly reflect their influence. The large-scale expansion of conservative tillage systems requires investigation of their influence under different soil and climatic conditions, as well as their interaction with other efficient technologies in crop nutrition and production. We hypothesized that bacterial treatments would stimulate soil enzymatic activity and induce positive changes in chemical parameters, especially in P solubilization. Another hypothesis was that the NT system would improve soil properties, both biochemical and chemical.

2. Materials and Methods

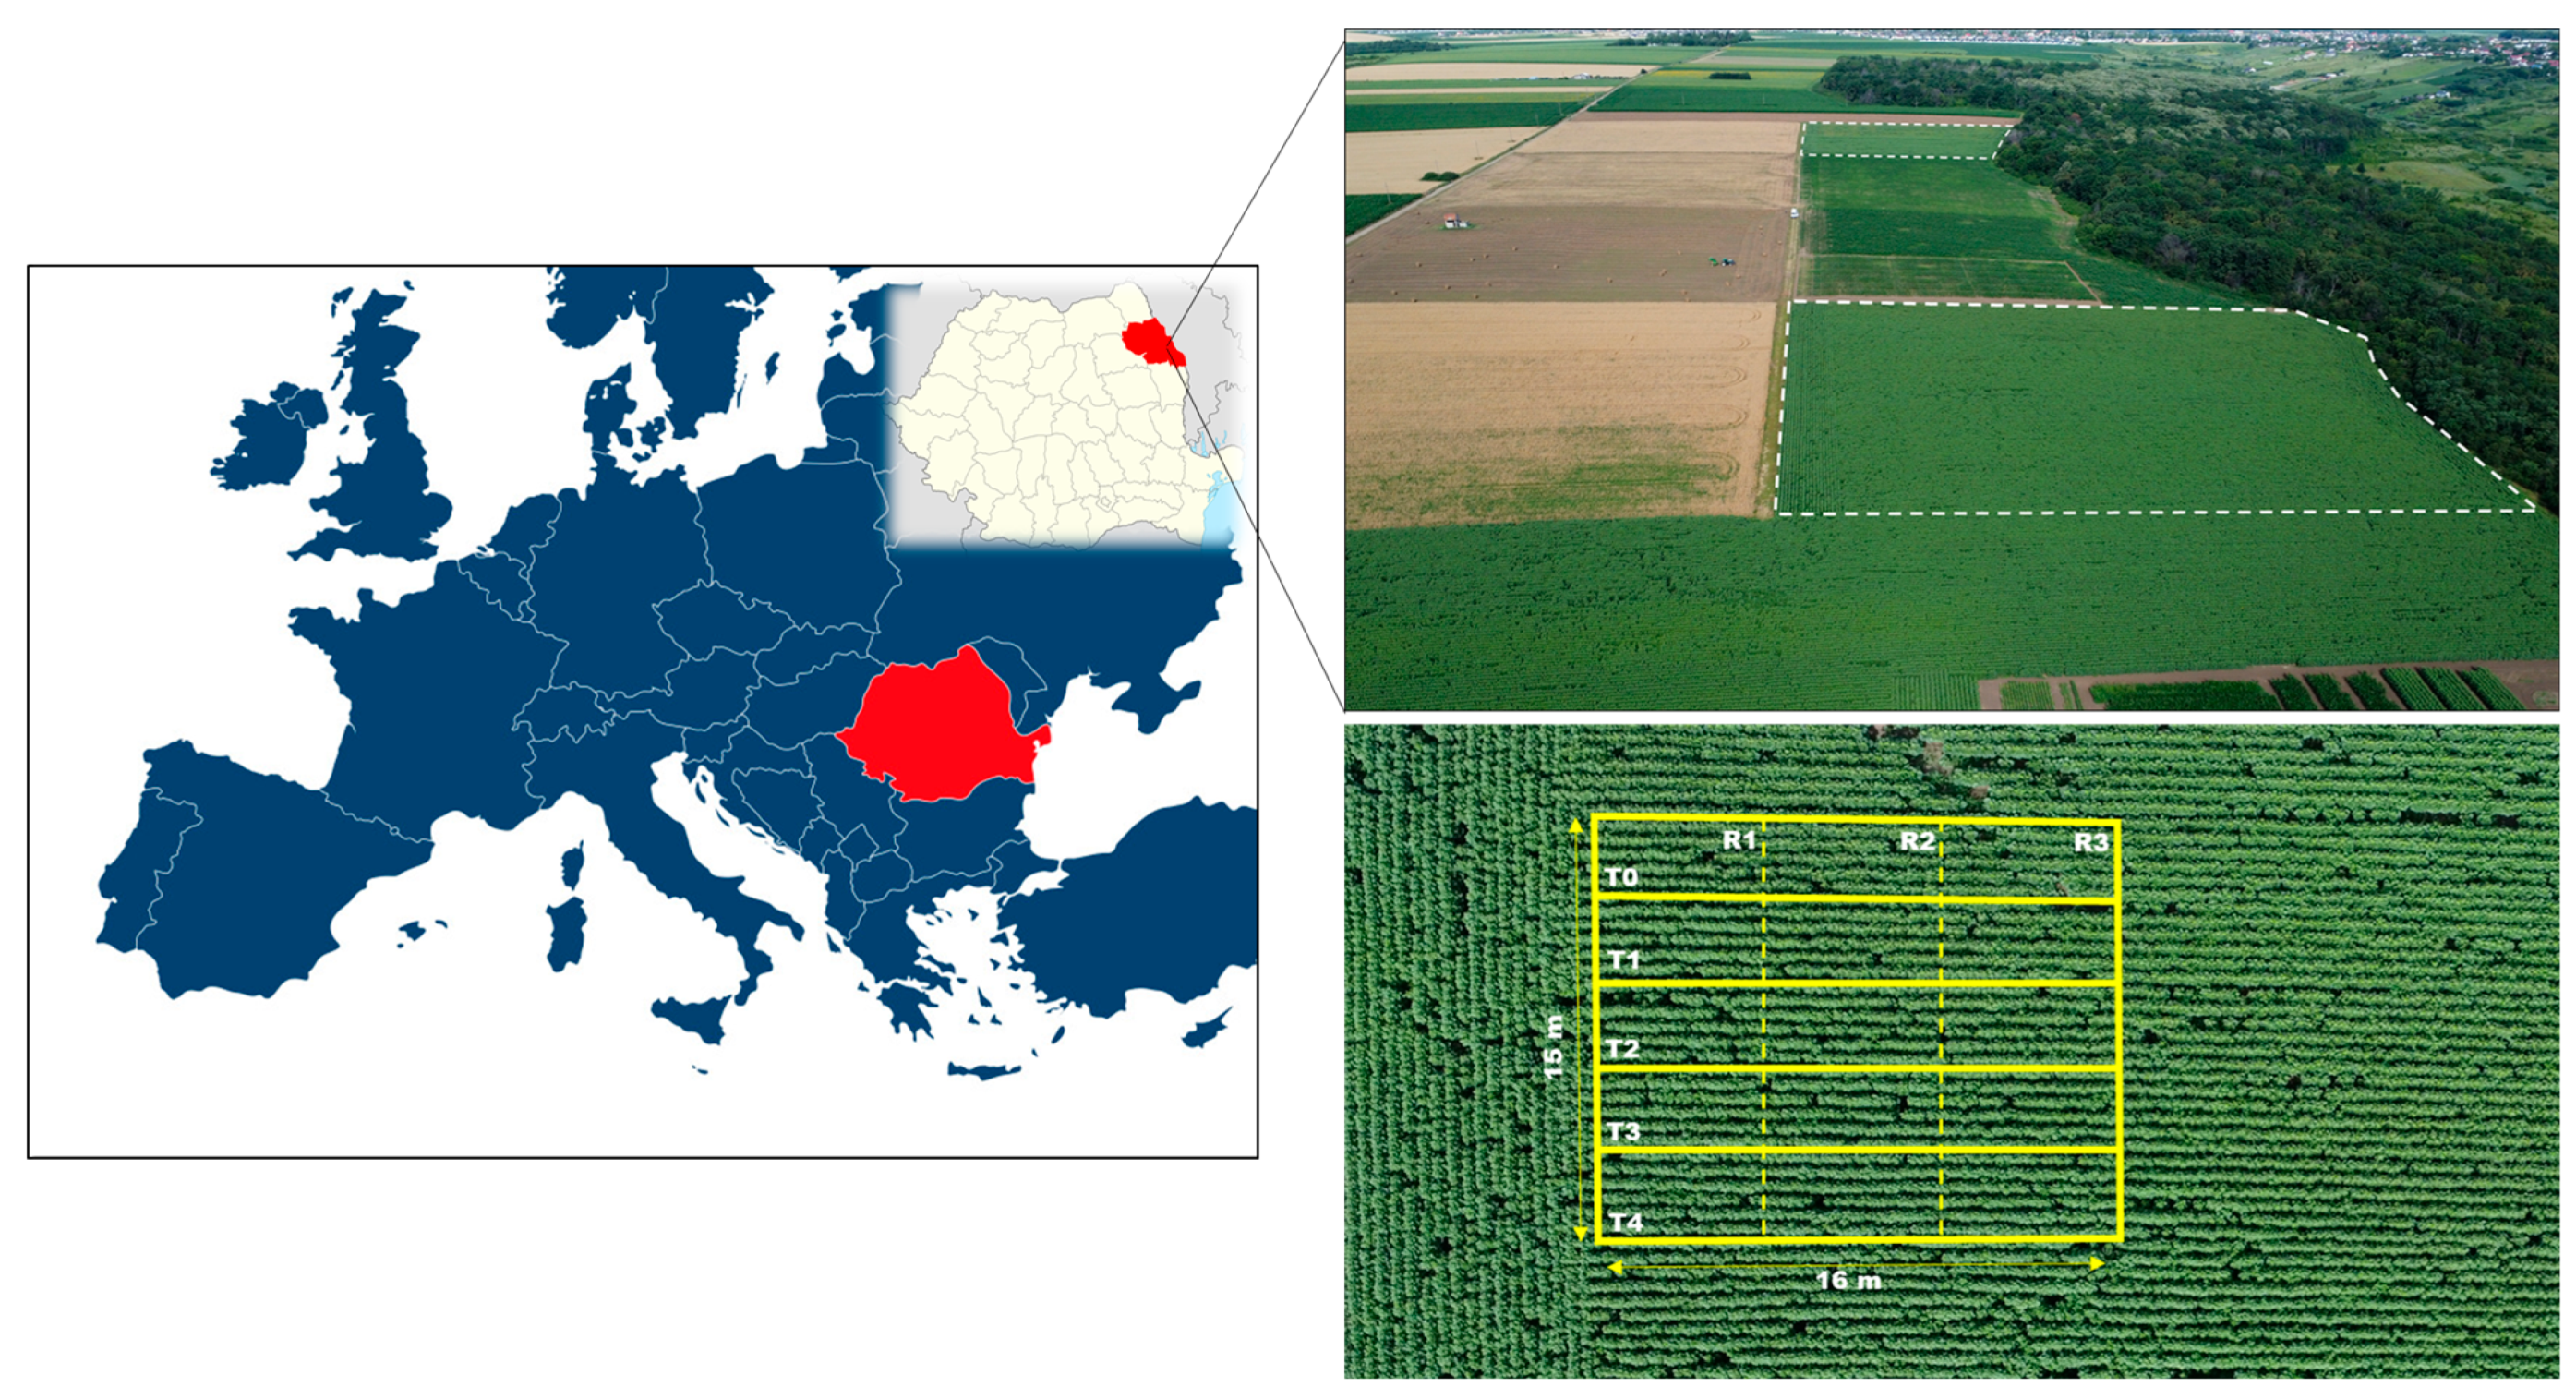
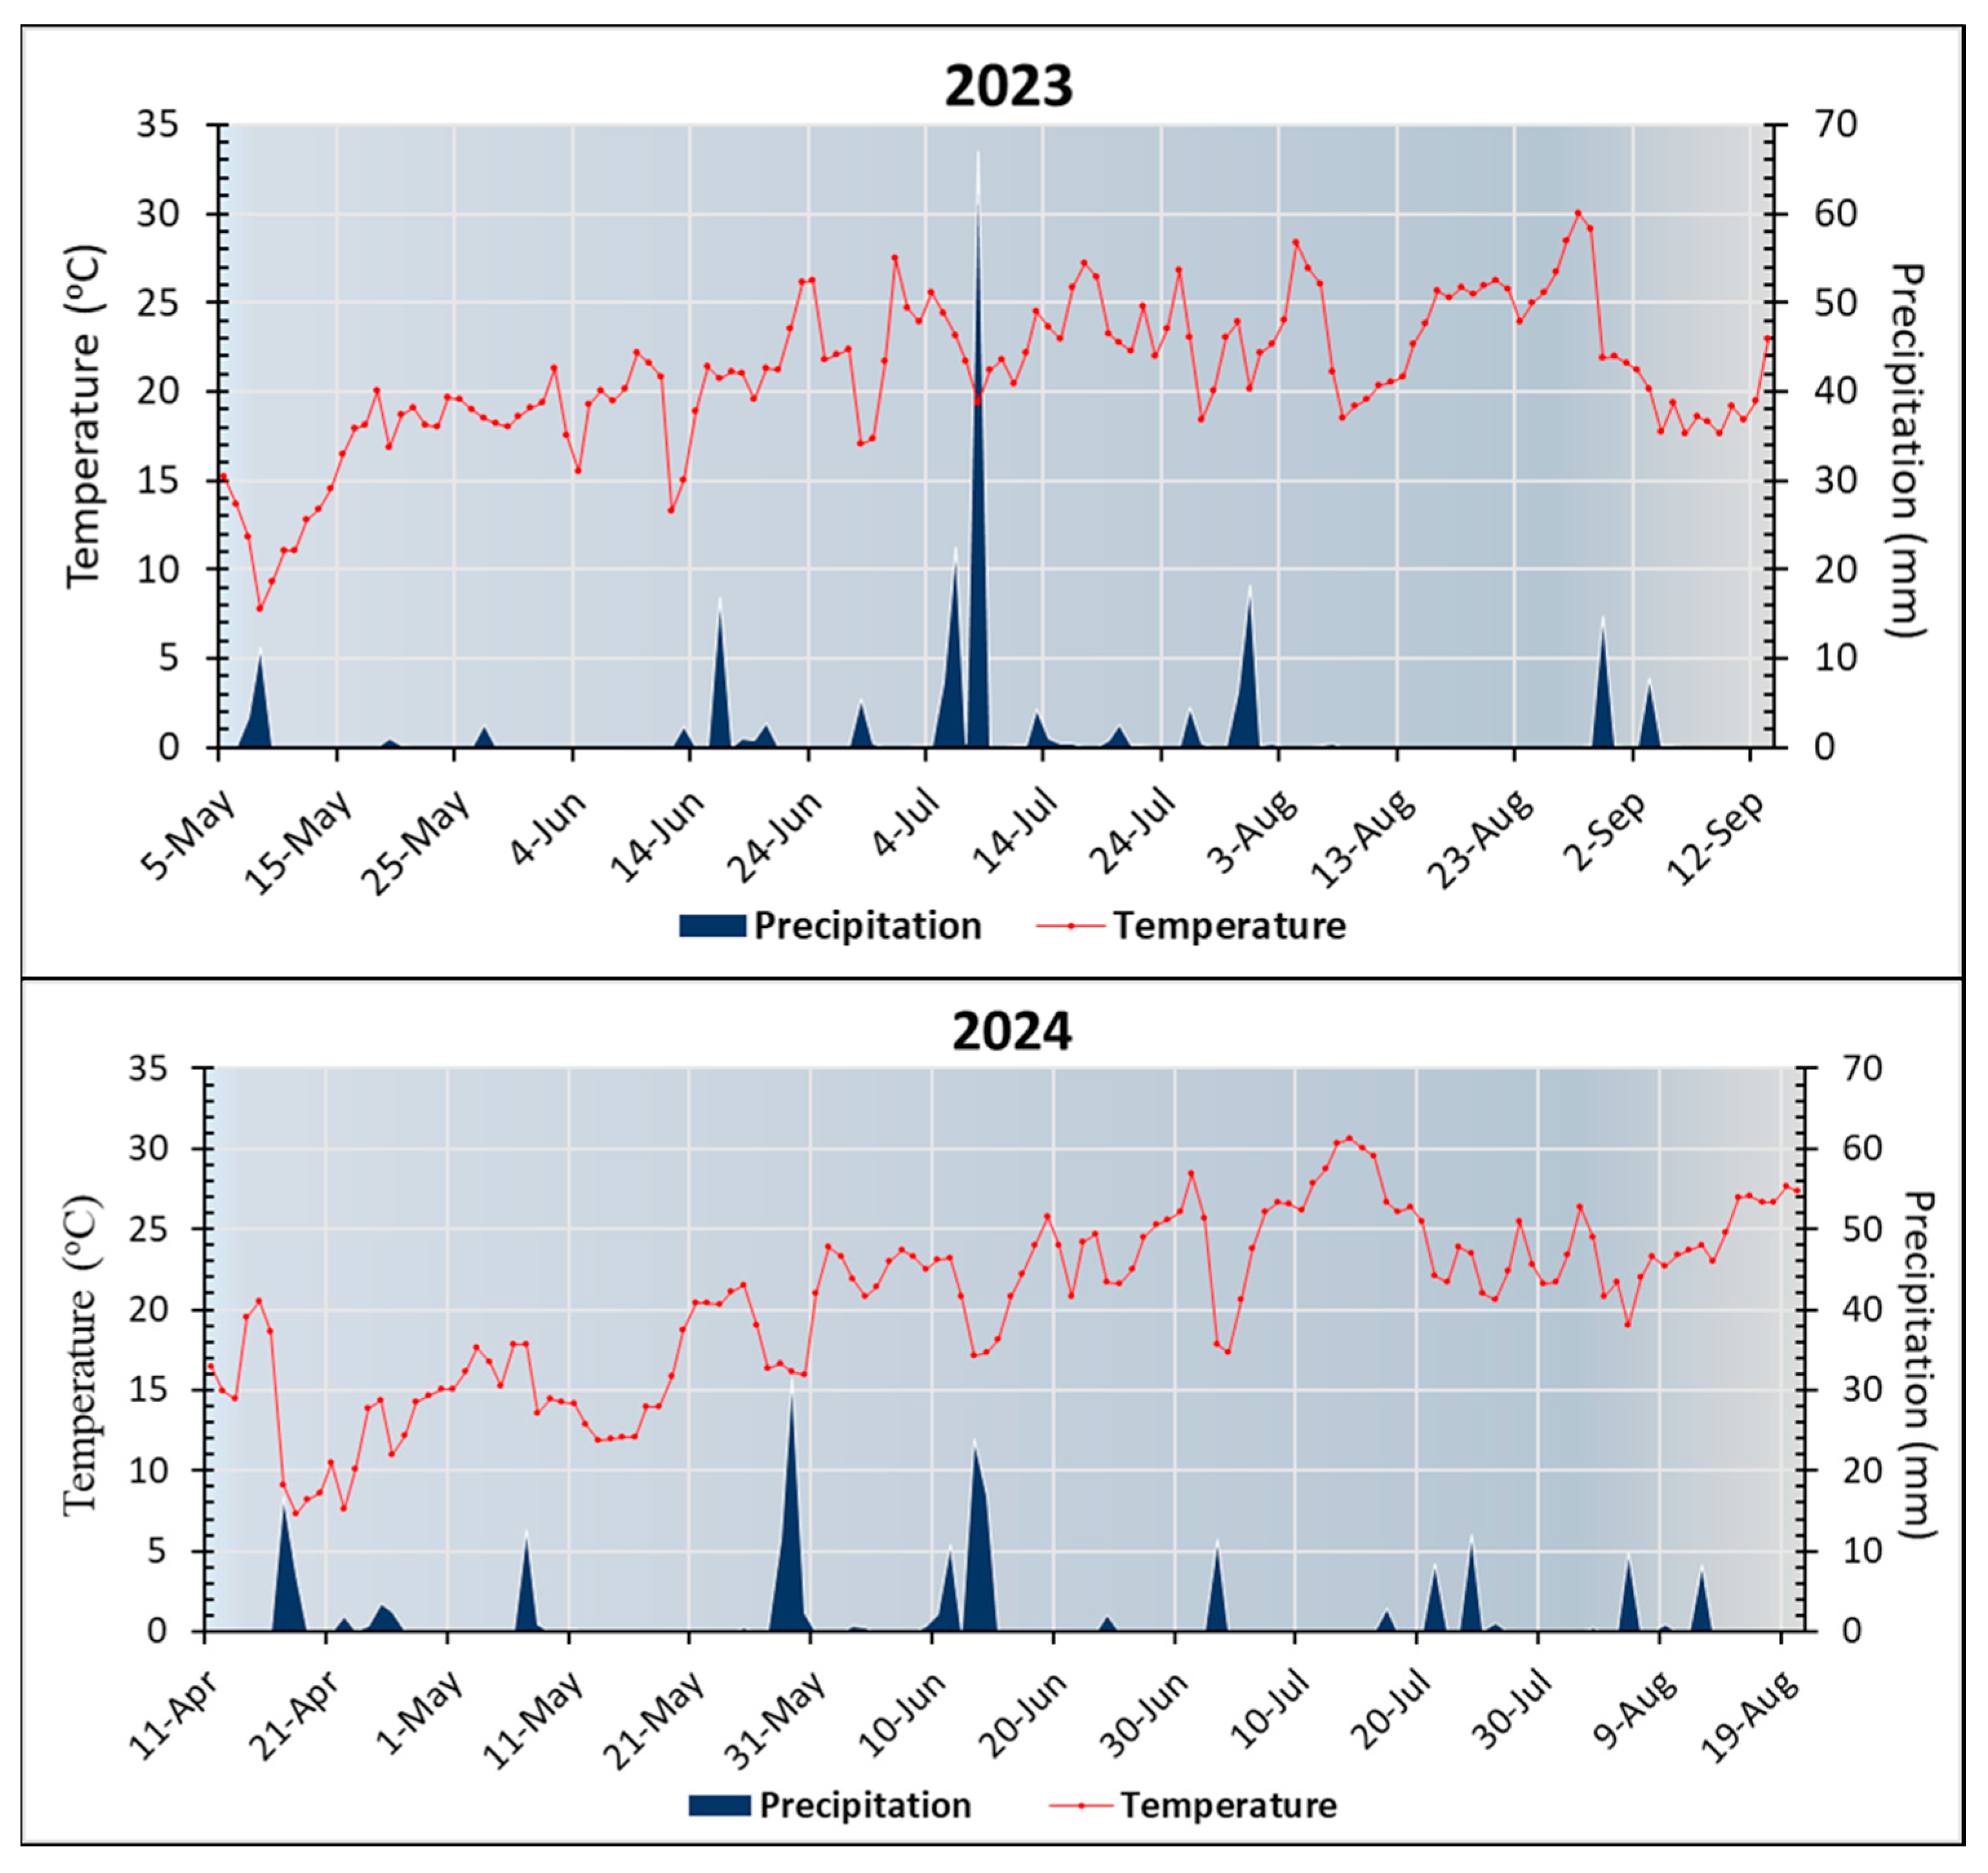
2.1. Experimental Site and Field Experiment Design

The experiment was conducted in 2023–2024 in Northeastern Romania (Figure 1) (latitude: 47°7′24.6″ N, longitude: 27°30′59.76″ E) at the Ezăreni Student Research and Practice Station of the Iasi University of Life Sciences (IULS). For the preceding 10 years, the experimental field had been cultivated in a crop rotation with winter wheat, maize, sunflower, and winter peas, both in conventional (CT) and conservation tillage–no-tillage (NT) systems. The experimental field has a 3% slope with NE exposition at an elevation of 136 m above sea level.
Long-term weather reports for the study area placed it in a temperate-continental climate [6], with average temperatures of 12.2–12.4 °C and annual rainfall of 460–465 mm in 2023 and 2024, respectively. Data collected from the IULS weather station at www.fieldclimate.com (accessed on 12 March 2025) [38] showed, from sowing to harvest of the studied crop, average temperatures of 20.94 °C in 2023 and 20.42 °C in 2024, as well as rainfall of 209.40 mm in 2023 and 207.20 mm in 2024 (Figure 2). The rainfall distribution was more balanced in the second year of the experiment, ensuring optimal moisture for both crop plants and soil biota.
According to WRB classification, the soil is a cambic chernozem, with a clay–loam texture and slightly acidic pH. Soil type identification and texture characterization were carried out when implementing the two tillage systems. Given that this study was conducted with a crop rotation, with crops cultivated on a different plot each year, soil bulk density and chemical analyses of the experimental field were carried out annually to better highlight the changes resulting from inoculation with Bacillus megaterium var. phosphaticum (Table 1). Soil bulk density was obtained as described by Mihu et al. [7], and the chemical properties were determined using the sampling and analytical methods presented in this paper. These determinations were performed for the entire plot on which the experiment was to be conducted.
In the autumn, after harvesting the previous crop in the rotation (maize), the soil was plowed to a depth of 25–30 cm in the CT plot, incorporating plant residues. In early spring, the seedbed was prepared via a single pass at a depth of 8–10 cm. In NT, the plant debris from the previous crop were retained at the soil surface, and sowing was carried out directly with the seed drill FABIMAG FG-01, without any prior tillage. The selected crop for research was sunflower (Helianthus annuus L.), and the hybrid P 64 LE 99 was sown in both tillage systems at a density of 58,500 seeds ha−1.
In each tillage system, the experiment was conducted on 240 m2, each treatment covering 48 m2 (3 m × 16 m), with three replications (Figure 1). The entire experimental area was fertilized with NPK, including the control (T0). Ecofertil with bacterial strains was applied twice, in four different treatments (T1, T2, T3, T4) at rates of 75, 100, and 125% with or without N fertilizer. Ecofertil is a commercial product containing Bacillus megaterium var. phosphaticum, counting 1 × 10¹⁰ colony-forming units per milliliter, in liquid suspension, manufactured and provided by Antbiotice S.A. Iasi, Romania. It is packed in 5 L containers and has a shelf life of six months from the date of manufacture. Details of the fertilization treatments are presented in Table 2.

2.2. Soil Sampling

To assess enzymatic activities, after the crop harvest, five soil samples of 1.5 kg from each treatment were randomly collected at a depth of 0–25 cm in plastic bags. Samples were air-dried, sieved through a 2 mm mesh sieve, and stored at 4 °C. Catalase and dehydrogenase were assayed within the first two weeks after soil sampling. Air drying of samples leads to a stabilization of enzymatic activity and can better reflect the direction of change when different soil management practices are introduced [39].
Soil sampling for chemical analysis followed two stages: first at 45 days after sowing (DAS), between the two biofertilizer treatments, when plants were in vegetative phase V6, and a second stage at crop harvest. The samples were randomly collected from 20 points in the 0–15 cm soil layer and mixed in a 0.5 kg composite sample for each experimental plot. After transfer to the laboratory, the soil was conditioned by air-drying, removal of plant residues, sieving, and storage until the assay. All soil samples were processed in triplicate.

2.3. Soil Analysis

The dehydrogenase assay was conducted according to Casida et al. [40] and Furtak and Gajda [41] by incubating 1 g of soil for 24 h at 37 °C. 2,3,5-triphenyl-tetrazolium chloride (TTC) 3%, distilled water, and methanol were used for this analysis. The measurement of released 1,3,5-triphenylformazan (TPF) was carried out with the HELIOS EPSILON (Thermo SCIENTIFIC) spectrophotometer at 485 nm, and the calibration curve equation was used to calculate the results, expressed as μg TPF g−1 h−1.
Catalase activity analysis was performed using the permanganometric titration method [42] using 2 g of soil, distilled water, 0.3% H2O2, 1.5 mol/L H2SO4, and 0.02 mol/L KMnO4 for titration. The results were expressed as µmol H2O2 g−1 h−1.
Acid and alkaline phosphatases were measured by the determination of p-nitrophenol released after incubation for 1 h at 37 °C. For incubation, 1 g of soil was used, to which toluene, modified universal buffer (MUB), and the substrate p-nitrophenyl phosphate were added. For acid phosphatase analysis, the MUB was adjusted to pH 11, and for alkaline phosphatase, it was adjusted to pH 6.5. Spectrophotometric quantification was performed at an optical density of 420 nm. Results were calculated from the calibration curve equations and expressed as µg p-nitrophenol g−1 h−1 [43,44,45].
Soil enzymatic activity was also evaluated based on the geometric mean (GME) of the studied enzymes according to the following equation [46]:
G M E = c a t a l a s e × d e h y d r o g e n a s e × a c i d   p h o s p h a t a s e × a l k a l i n e   p h o s p h a t a s e 4
Soil chemical analyses were performed according to standardized methodology. Determination of pH values was carried out using the potentiometric method in aqueous suspension at a ratio msoil:Vwater = 1:2.5 and a pH meter. The modified Walkley–Black titrimetric method was used to determine the soil organic carbon (SOC) content. The Kjeldahl method was applied to assess the total nitrogen (TN) [6]. For total phosphorus (TP) analysis, soil samples were digested with a mixture of H2SO4 and HClO4 (ISO 7184/14-79, Romanian Association for Standardization) [47]. TP and available phosphorus (AP) were measured using the molybdenum blue colorimetric method [48], with ascorbic acid reduction for AP to which stannous chloride was added for TP. The spectrophotometric quantification was performed with a Specord Plus UV–Vis at 715 nm for AP [49] and at 660 nm for TP.

2.4. Statistical Data Processing

The datasets collected were analyzed to estimate the effect of tillage systems and fertilization on the soil properties considered. SPSS Statistics 20 software was used to perform analysis of variance (ANOVA) for individual factors (year, tillage system, and fertilizer treatments), followed by Tukey’s post hoc test for indicators with significance of p < 0.05. For factors interactions, a two-way ANOVA was performed. The relationship of enzymes to each other and to GME, as well as the relationships between soil chemical properties, were evaluated based on the Pearson correlation. The figures were generated in Excel and OriginPro 8.1. based on the means and standard errors (SEs).

3. Results

3.1. Soil Enzymatic Activity

3.1.1. Dehydrogenase Activity

The mean, minimum, and maximum values of dehydrogenase activity are presented in Table 3. Fluctuation in the results suggests the influence of fertilization as well as tillage systems on the soil microbiome and, consequently, on dehydrogenase activity. In the NT system, the amplitude between maximum and minimum values was larger (0.54–2.39) compared to the CT (0.16–0.95), where the activity seemed to be more uniform. In both growing seasons, the mean values were higher in the NT system than in the CT system, reflecting a higher natural microbial population density. In the CT system, T3 (2023) and T1 (2024) were higher than the control, but with insignificant differences of 0.04 and 0.02 µg TPF g−1 h−1, respectively. The trend in mean dehydrogenase activity was T3 > T0 > T4 > T1 > T2 in the first year, and T1 > T0 > T4 > T2 > T3 in the second year. In NT, T1 and T2 significantly outperformed the control in 2023, but all Bacillus megaterium var. phosphaticum treatments were antagonistic for dehydrogenase in 2024, with the control measuring 33–57% higher activity.

3.1.2. Catalase Activity

Investigations over two years reported catalase activity ranging from 1.19 to 2.32 µmol H2O2 g−1 h−1 (Table 4). The results exhibited variability between both fertilization treatments and tillage practices, with fluctuations between the minimum and maximum highlighting a more stable and intense activity in the CT system. There were also some large fluctuations in PSB treatments that could signal an unbalanced biofertilizer distribution and heterogeneous activity in the soil. In the CT system, catalase showed a significant increase in PSB treatments in 2023 and also in 2024 with the exception of T1. Across the Bacillus megaterium var. phosphaticum treatments, the mixture of 100% PSB with N (T3) reached the greatest values, followed by 75% and 125% PSB + N (T2 and T4). For the NT system, inoculations of 125% PSB + N (2023) and 100% PSB (2024) resulted in the most intense activity.

3.1.3. Acid Phosphatase Activity

Overall, the NT showed significantly higher acid phosphatase activity than the CT system (Table 5). This enzyme exhibited grater variability under NT (0.40–1.01 µg p-nitrophenol g−1 h−1) compared to the CT system (0.12–0.37 µg p-nitrophenol g−1 h−1) in both years. In 2023, CT treatments with Bacillus megaterium were significantly lower than the control, following the order T3 > T1 > T2 > T4. However, in the second year, only T3 decreased (1.06 µg p-nitrophenol g−1 h−1) compared to the control (1.10 µg p-nitrophenol g−1 h−1). In the NT system, significantly higher values were recorded for 100% PSB without N, with all other treatments showing no statistically significant differences, while in 2024, the control outperformed the biological treatments, with 100% PSB + N resulting in greater activity among them.

3.1.4. Alkaline Phosphatase Activity

Similar to acid phosphatase, alkaline phosphatase expressed more intense activity in NT (0.30–0.60 µg p-nitrophenol g−1 h−1) than in the CT system (0.14–0.19 µg p-nitrophenol g−1 h−1) (Table 6). From year to year in the CT system, mean alkaline phosphatase values were quite close, ranging between 0.14 and 0.19 µg p-nitrophenol g−1 h−1. In both experimental years, T3 reached maximum activity, but close to T4 (2023) and to the control and T1 (2024). Under NT, T2 stands out in 2023, while in 2024, the control significantly exceeds the PSB treatments.

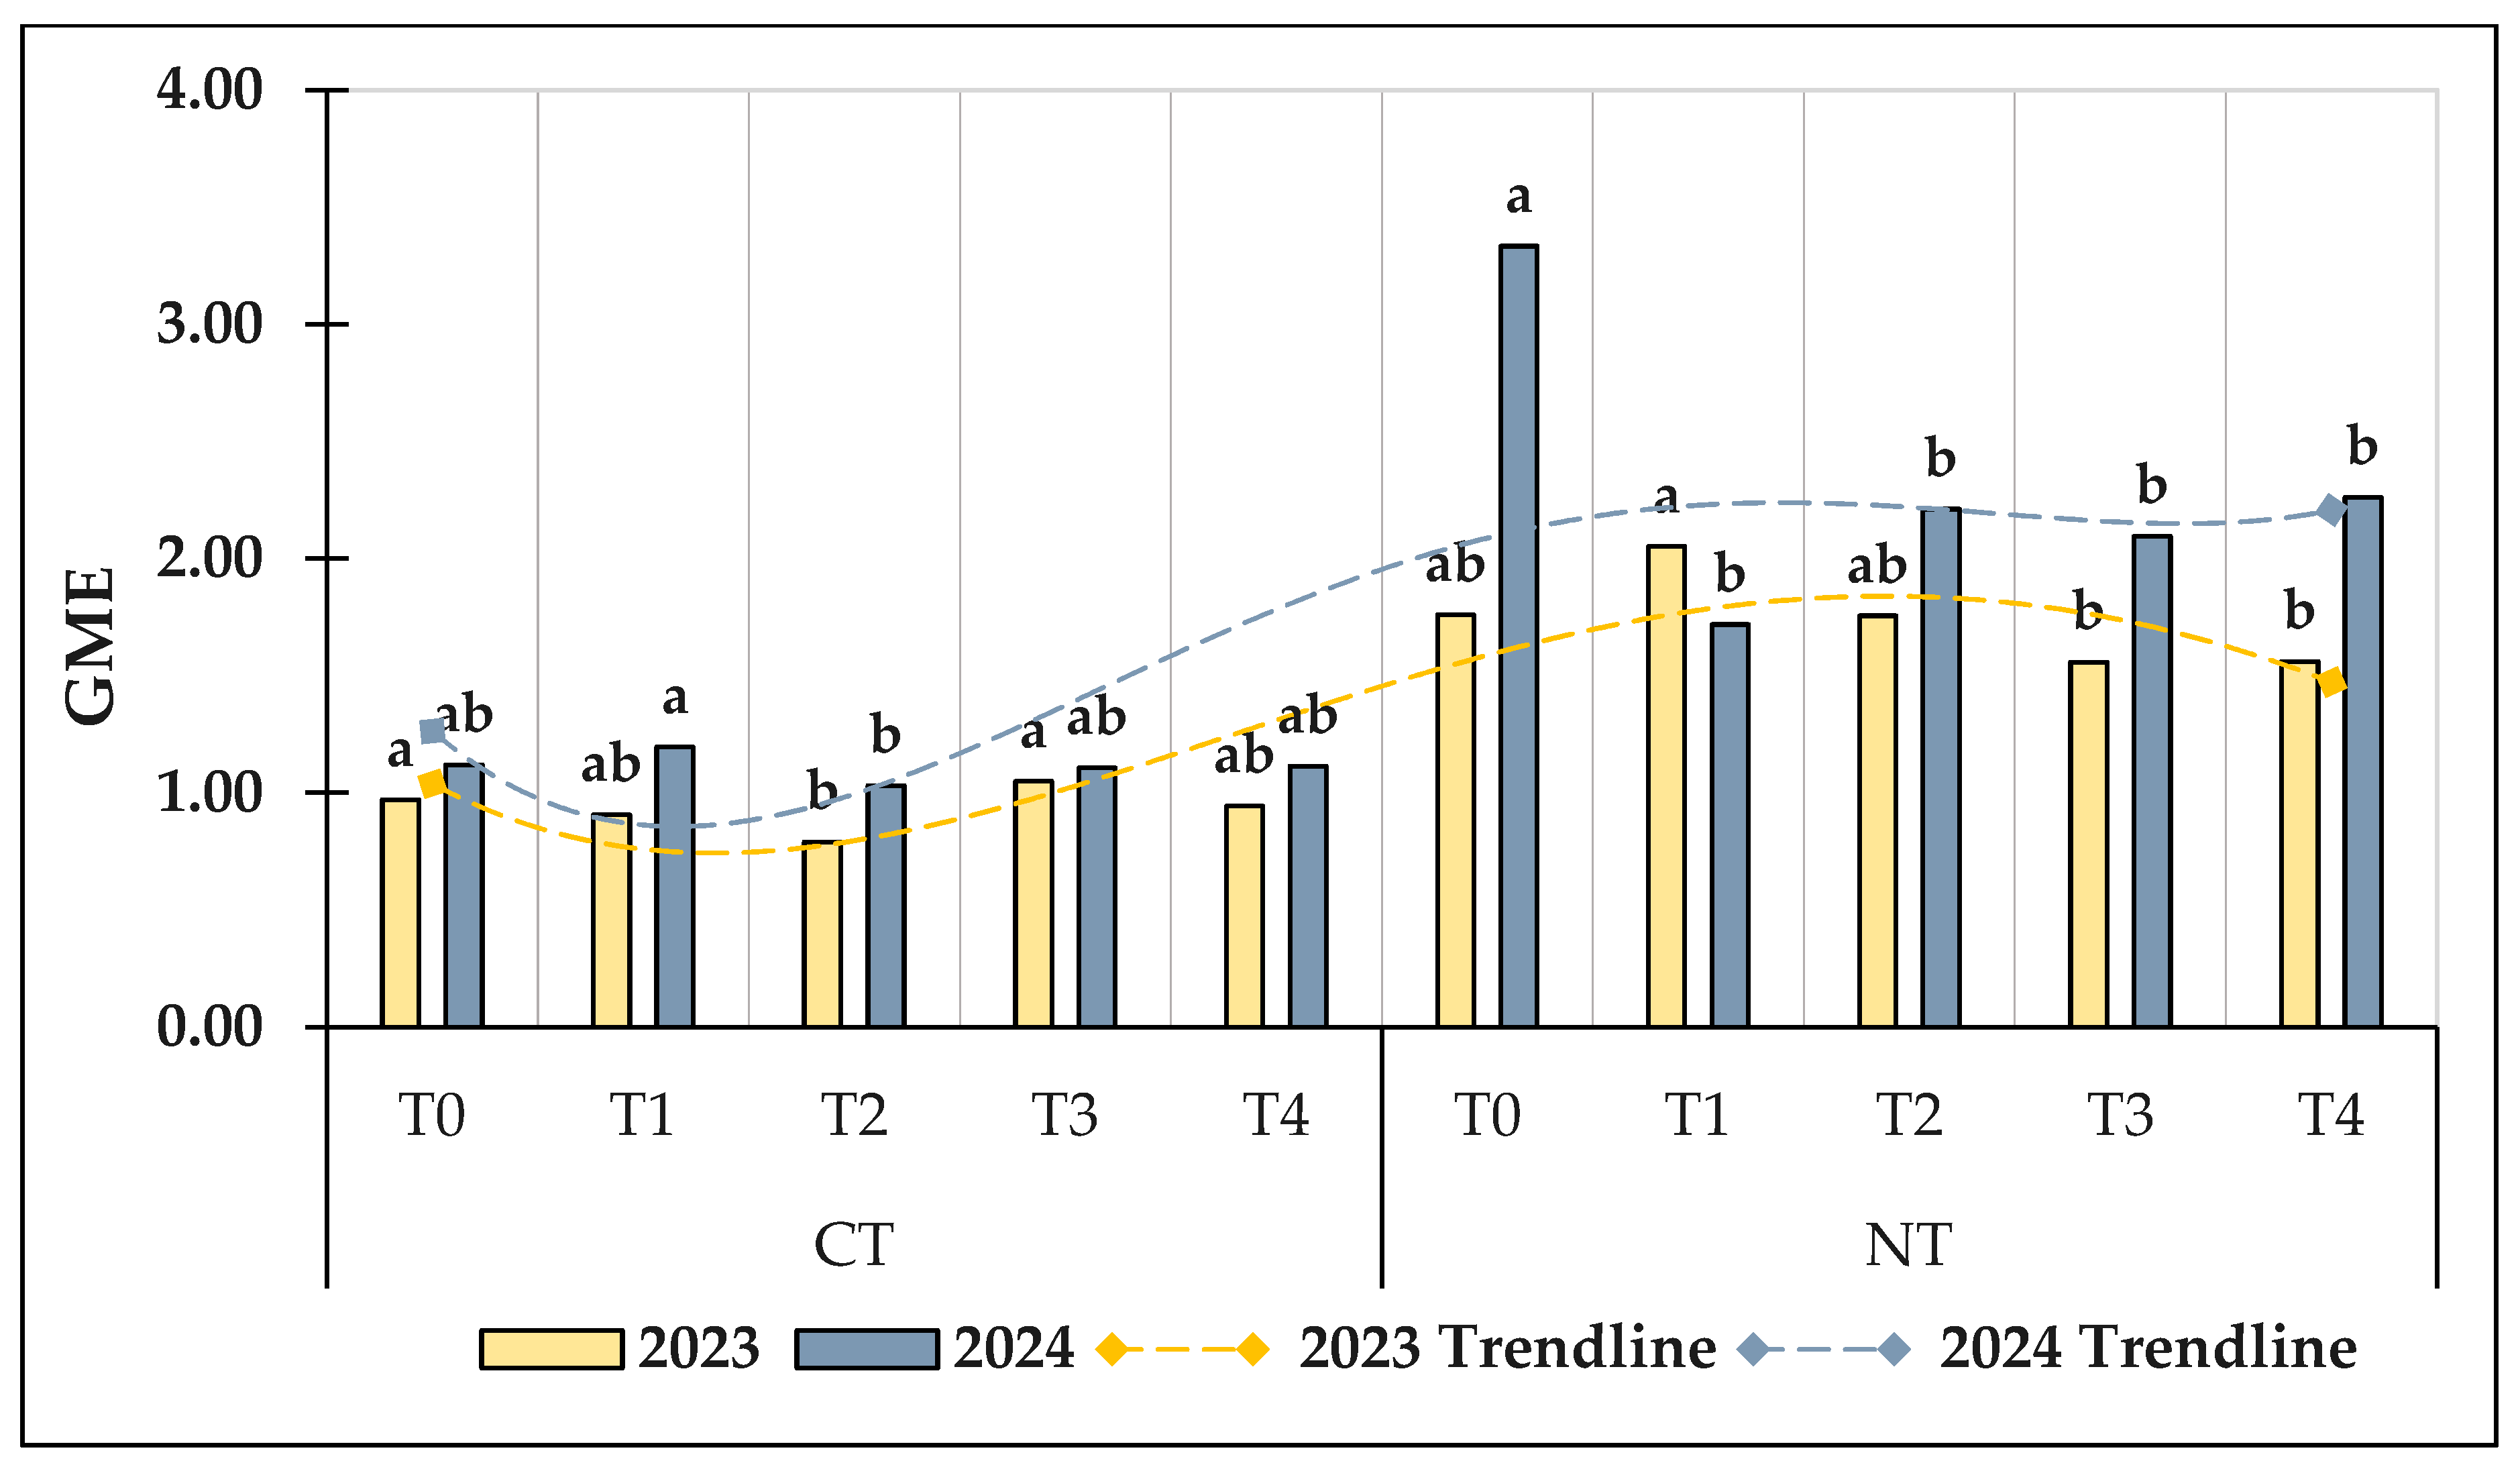
3.1.5. Geometric Mean of Studied Enzymes (GME)

Overall, the GME increased from the first to the second year and from the CT (0.79–1.19) to the NT system (1.56–3.33) (Figure 3). Biological fertilization treatments generally decreased this index, suggesting a potential inhibitory effect on soil enzymatic activities. The differences between fertilization treatments were moderate; the NT control plot GME was significantly higher than in the PSB inoculations only in 2024.

3.1.6. Effects of Tillage, Fertilization, and Their Interaction on Soil Enzymatic Activity

Analysis of soil enzymatic activity intensity highlighted that it depended on both fertilization treatments and tillage systems (p < 0.001), as well as on the interaction between the two (Table 7). However, there was one exception, acid phosphatase, where the system alone caused variations.

3.1.7. Soil Enzyme Activity Correlation

Among the enzymes investigated, dehydrogenases, acid and alkaline phosphatases were found to be positive correlated with GME and with each other, whereas catalase activity was negatively correlated with the other variables (Table 8).

3.2. Soil Chemical Properties

3.2.1. Soil pH, Organic Carbon (SOC), and Total Nitrogen (TN)

In the first year, in both tillage systems, there were no significant changes in soil pH between fertilizer treatments (Table 9), although slight acidification was found in the CT Bacillus inoculations. Mean SOC values were higher in NT than in CT at both time points of the analysis. At 45 DAS, the trend of values was T0 > T3 > T2 > T4 > T1 in CT and T4 > T0 > T3 > T2 > T1 in NT. At crop harvest, the highest level of SOC was found at T0 in both systems (2.13% in CT and 2.56% in NT). From 45 DAS until crop harvest, a decrease in SOC was observed under the NT system.
At 45 DAS, in the CT system, TN varied slightly in 2023, while in NT, the highest level was measured in the 125% Ecofertil + N (T4) treatment and the lowest in the 100% Ecofertil without N. At the end of the growing season, TN ranged from 0.196 to 0.244% in NT, exceeding the CT system (0.151 and 0.185%), and in both systems, the maximum TN was recorded in the control treatment.
Similarly, bacterial inoculations did not significantly affect soil pH in 2024 (Table 10). Under CT, at 45 DAS, the highest SOC content was recorded in T2, while at harvest in T0, T1, and T4, with very close values, while T2 and T3 decreased significantly. At 45 DAS, all PSB treatments exceeded the control in NT, and at harvest, T3 and T4 were significantly higher. Higher SOC values were measured in NT than in CT at both soil assessment times except for T2. In the first soil analyses, TN ranged from 0.148 to 0.175% in CT and from 0.182 to 0.196% in the NT system. The trend of fertilization treatments for this nutrient was T2 > T0 > T3 > T1 > T4 in CT and T1 > T2 > T3 > T4 > T0 in NT. At sunflower harvest, these were changed as follows: T4 > T0 > T1 > T2 > T3 in CT practice and T4 > T3 > T1 > T0 > T2 in NT.

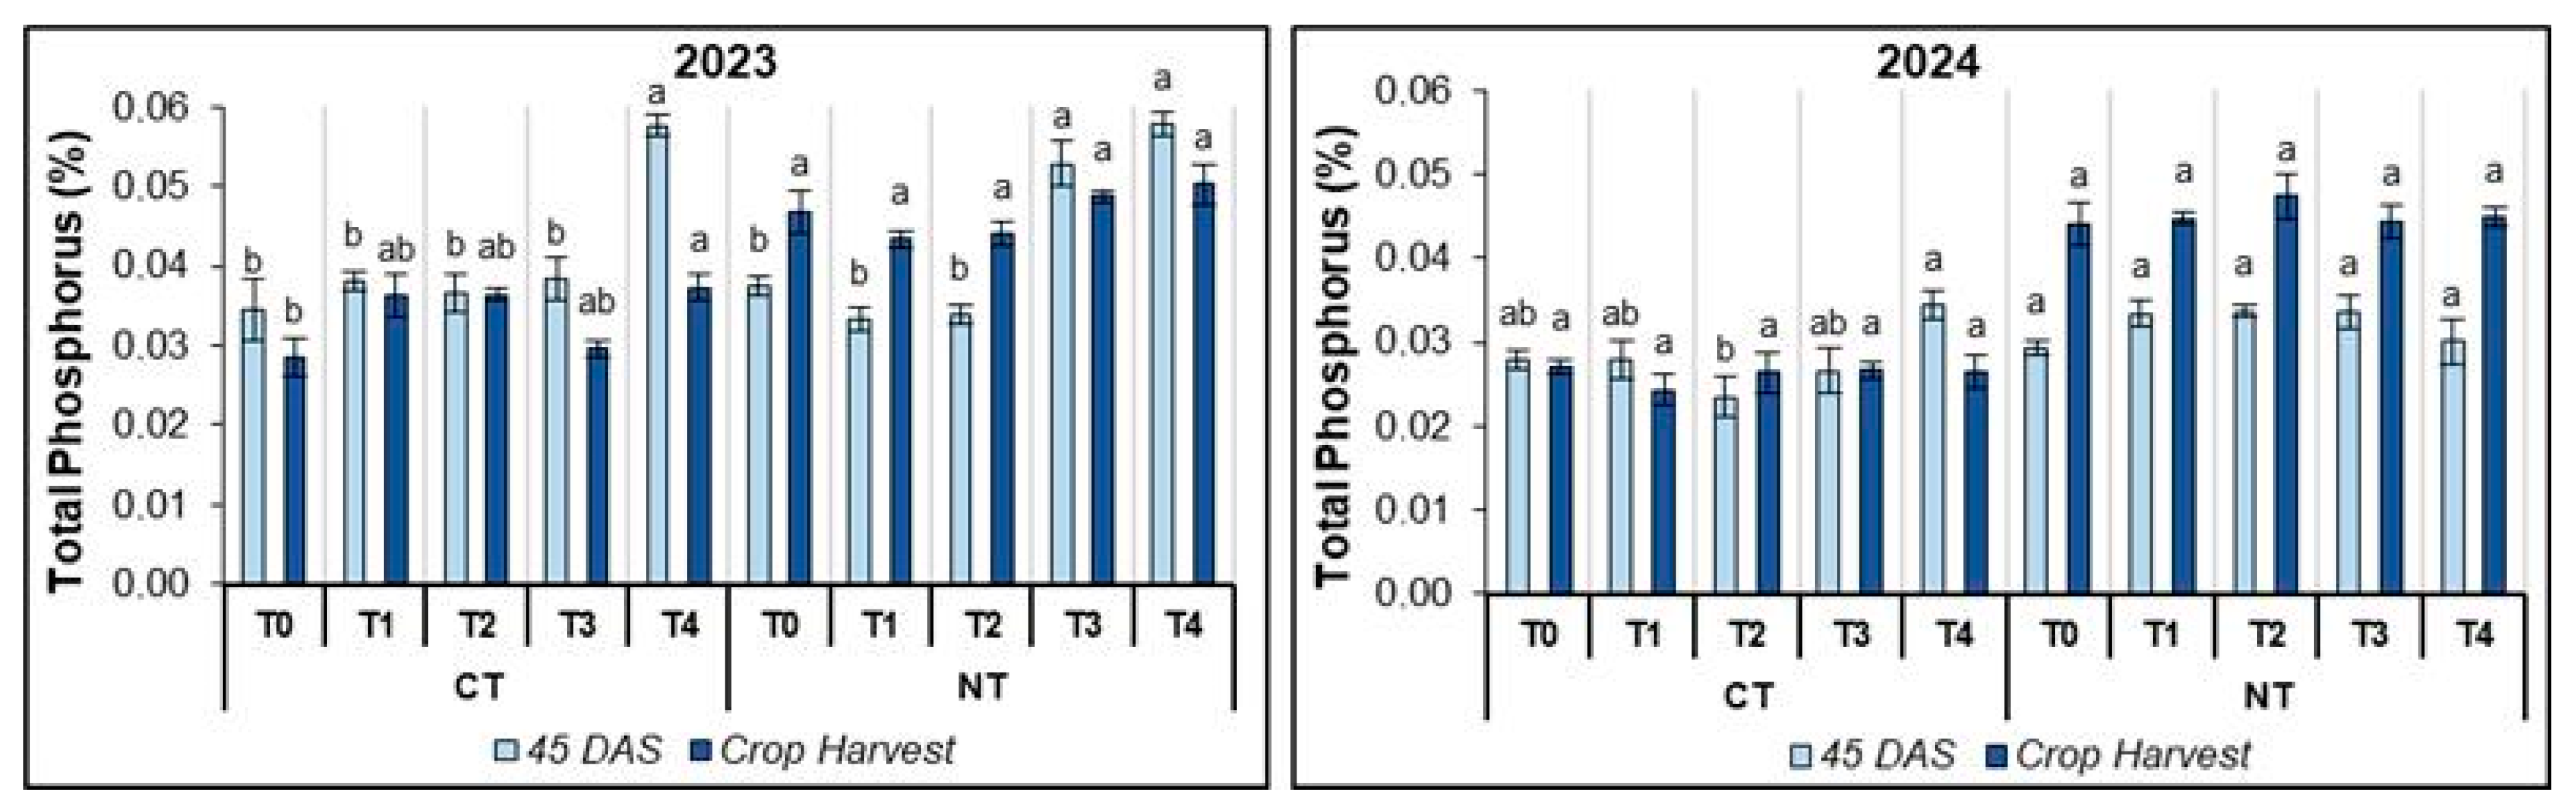
3.2.2. Soil Total Phosphorus (TP)

The soil TP content at the two times of analysis (45 DAS and at crop harvest) is depicted in Figure 4. In 2023, in both tillage systems, the highest TP content was recorded in T4, regardless of sampling time (0.0373–0.0578%). In both experimental years, at crop harvest, there were slight differences between PSB treatments in both CT and NT systems. Overall, TP decreased from the first to the second analysis in CT, but an opposite trend was observed in NT.

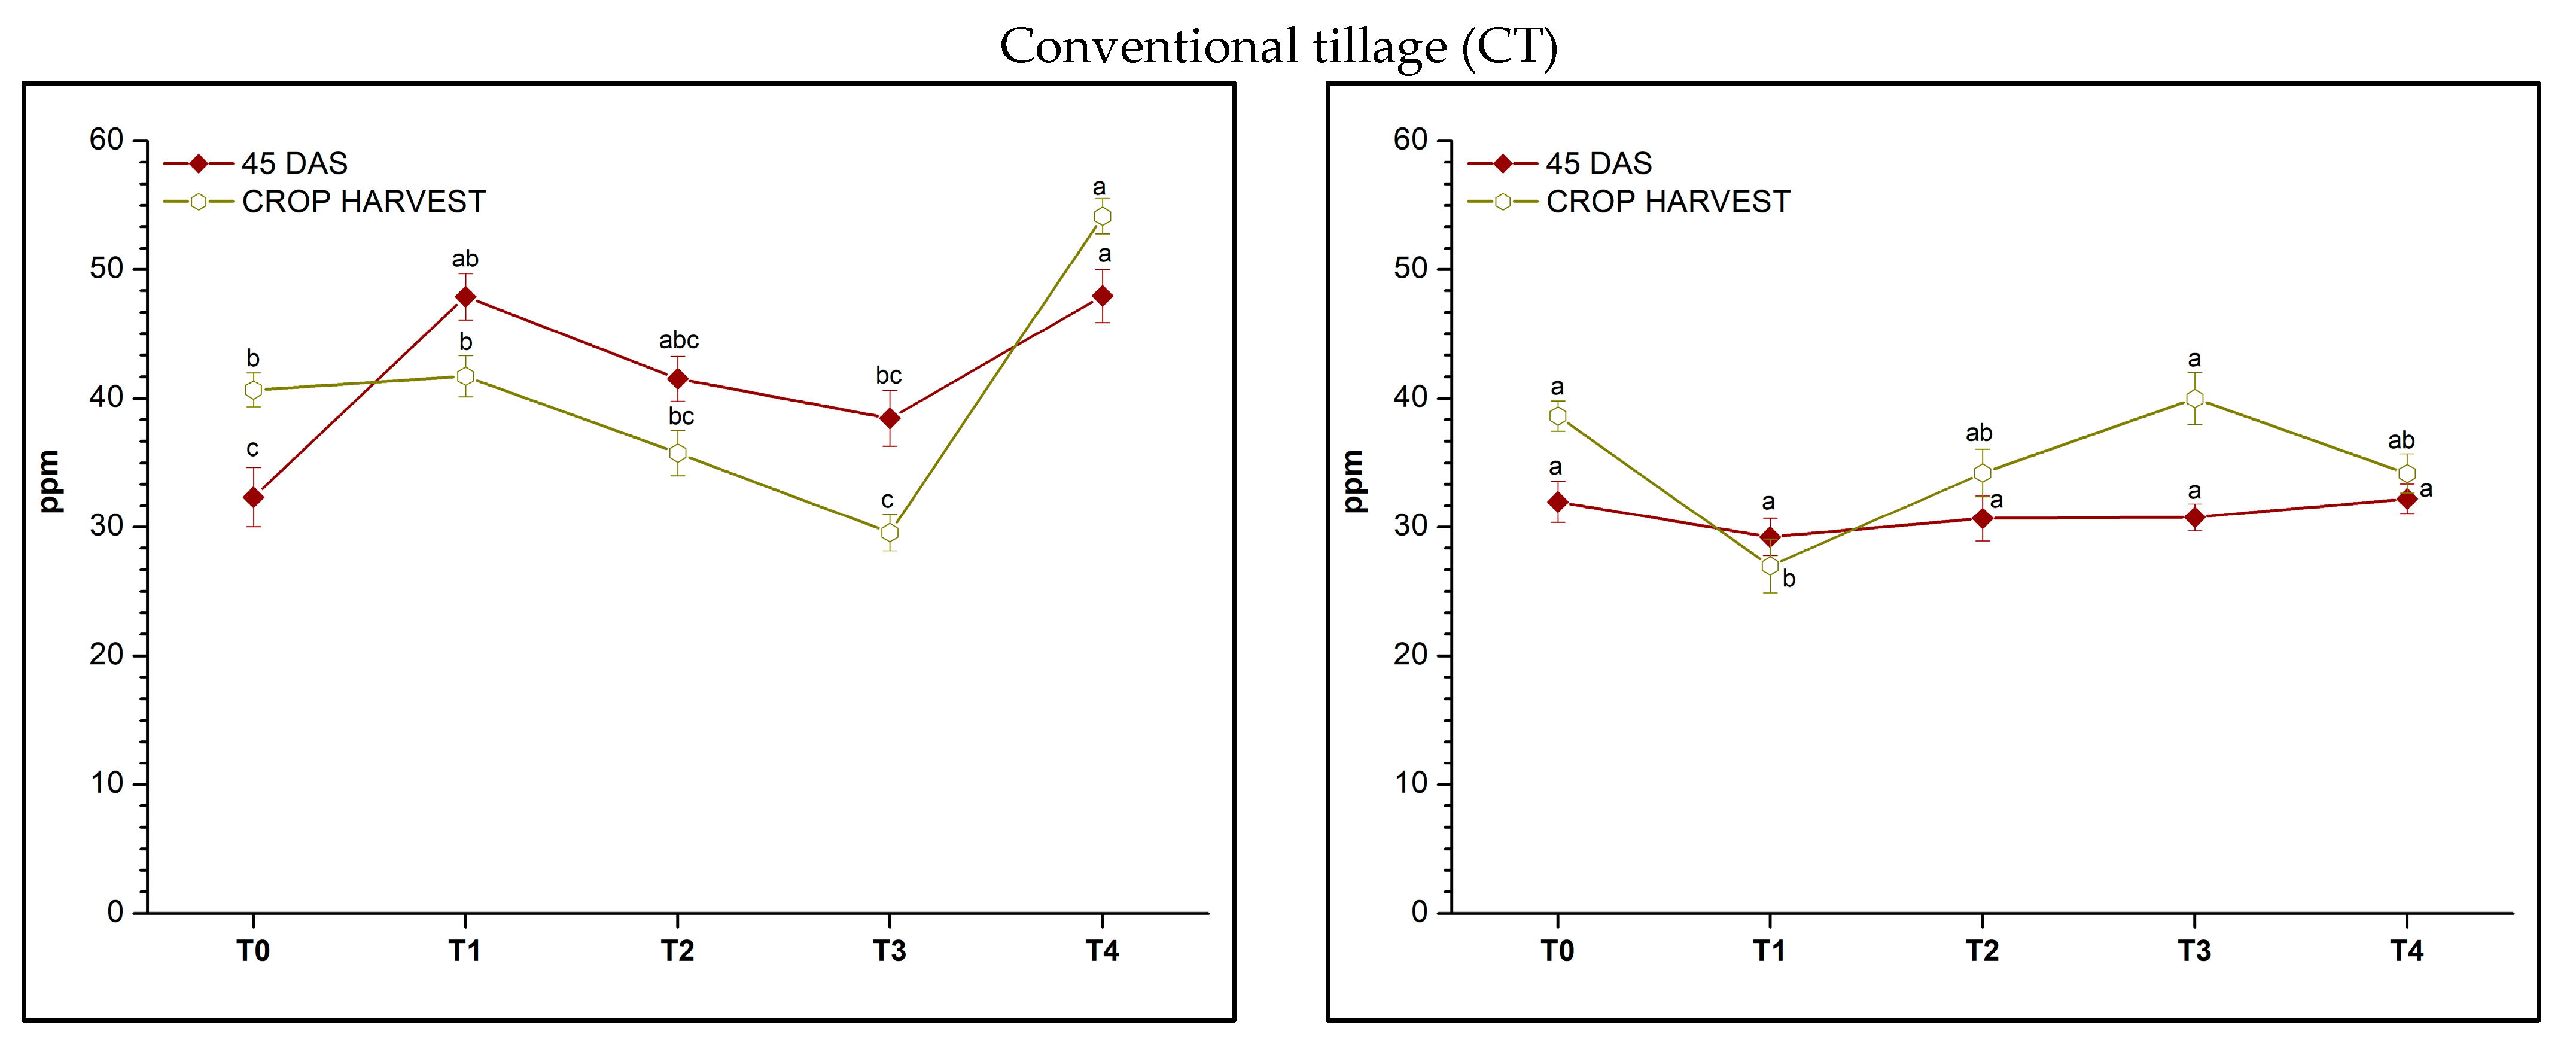
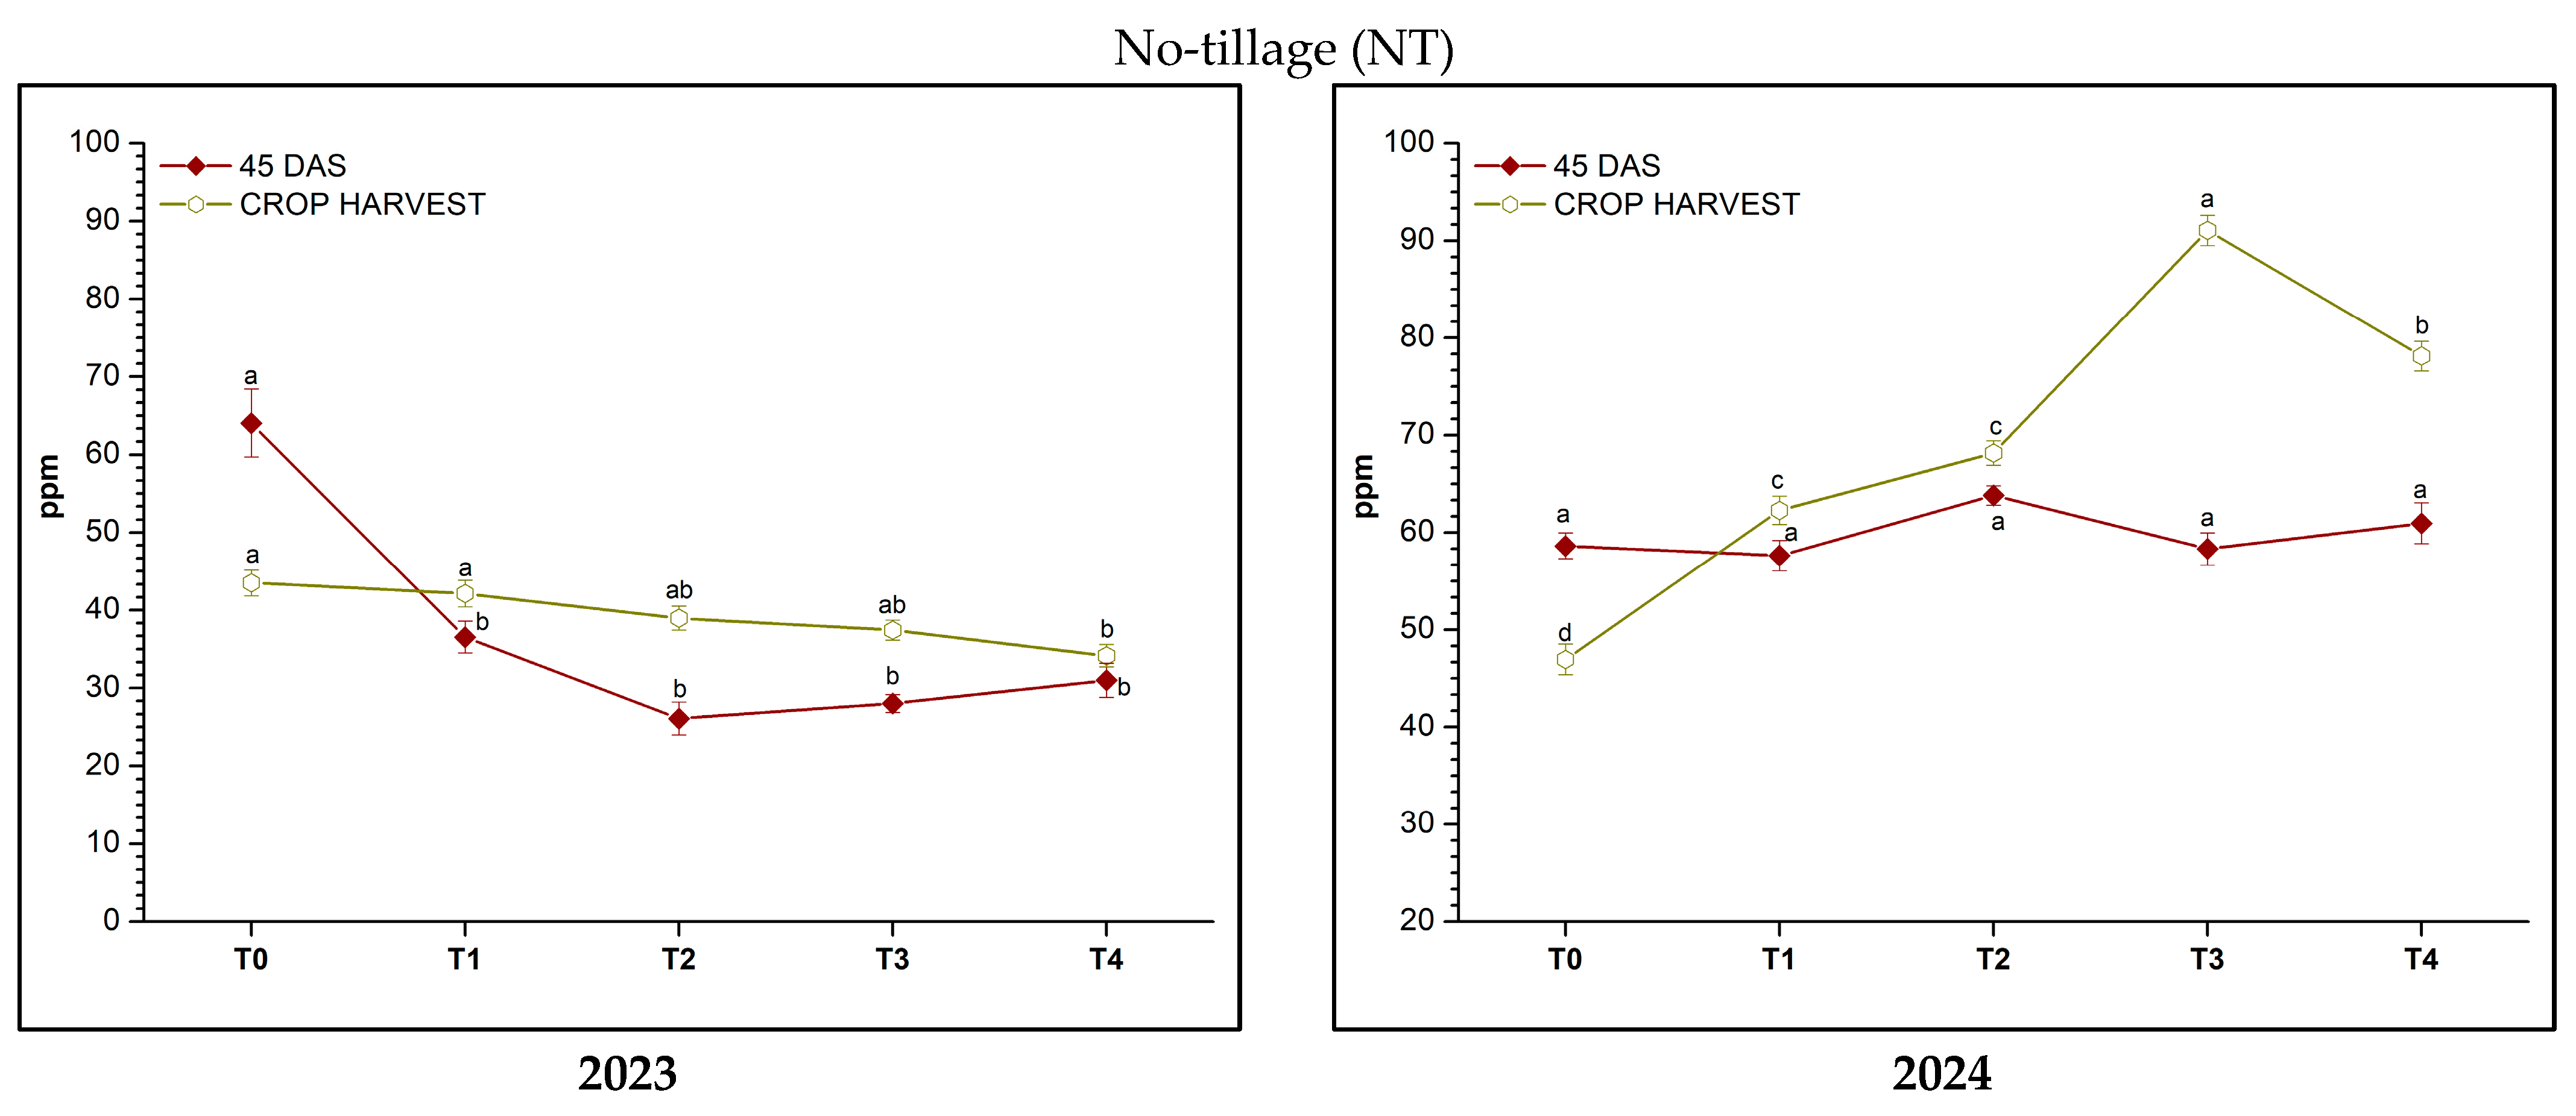
3.2.3. Soil Available Phosphorus (AP)

In CT (2023), increased AP concentrations were found in Bacillus treatments at 45 DAS. At the two time points of analysis, the highest content was reported in T1 and T4 (Figure 5). In the second year, differences between treatments were only found at crop harvest.
In the NT system, in the first year, the control exhibited significantly higher AP (64.04 ppm) compared to PSB treatments (26.10–36.52 ppm) at 45 DAS. However, at harvest, these differences were reduced by decreasing values for the control and increasing for the Bacillus treatments compared to the first determination. In contrast, in the second year, no significant differences in AP were found among fertilizer treatments at 45 DAS (57.62–63.80 ppm), while at crop harvest, microbial inoculations lead to increased AP.

3.2.4. Effects of Tillage, Fertilization, and Their Interaction on Soil Chemical Properties

The evaluation of fertilization treatment effects showed an influence on SOC and TP as well as tillage system on TN and AP (Table 11). This further analysis showed that soil pH does not change during the two years as a result of fertilization or tillage systems, and the interaction of the two factors has no impact on the investigated chemical indicators.

3.2.5. Soil Chemical Properties Correlation

The correlation of soil chemical properties indicates a strong relationship between SOC and TN, and TP was moderately correlated with TN and SOC (Table 12). This analysis also shows that, for both years, soil pH is not significantly correlated with other chemical properties.

4. Discussion

4.1. Soil Enzyme Responses to Fertilization and Tillage Systems

Enzymes are widely reported as sensitive soil quality, fertility, and microbial activity markers due to their fast response to environmental changes and management practices [50]. Dehydrogenase and catalase are two important oxidoreductases involved in SOM oxidation [51], used as indicators of soil global and respiratory activity [52]. Dehydrogenase is useful in soil environment quality assessment [53,54] and is considered to be a measure of microbial metabolism intensity [55,56]. According to previous research, Bacillus megaterium var. phosphaticum and rock phosphate cause changes in soil biology, leading to an increase in dehydrogenase activity by an average of 35% [57]. In our study, inhibition of this enzyme was associated with most biofertilizer treatments in both tillage systems, with only the 75% PSB + N treatment reflecting significantly higher metabolic activity in 2023 under the NT system. Our findings suggest that the recommended bacterial inoculum or a lower dose can slightly stimulate soil biological activity and disrupt the native microbiome. In addition, large variations in dehydrogenase emphasize an unstable adaptation of this species in soil. Our data disagree with those obtained by Bai et al. [58], who found increased activity when Bacillus cereus and Pseudomonas fluorescens were inoculated. Given the higher amount of organic matter [59]—the oxidation of which involves dehydrogenase [60]—we found higher values in the NT system. Burns RG et al. [61] reported increased activity under NT conditions and stated that dehydrogenase is sensitive to the tillage system practiced, related to its association with viable microbial populations. A different response was found for catalase activity, which was enhanced by the addition of bacterial inoculum and nitrogen in the CT system in both experimental years, possibly as a result of catalase production by this bacterium [62,63], but also to the stimulation of aerobic biological activity by nitrogen, which is consistent with Su-mei et al. [64] and Ihsan Muhammad et al. [65]. In NT, the 125% PSB + N treatment catalase was significantly higher than the control in 2023, but all of the inoculated treatments reached more intense activity in 2024. In addition to microbiota abundance and activity, enzymes are also related to plant root exudates [66,67], climatic conditions, and soil properties [68]. For example, catalase activity depends on TN, SOC [69], and the production of organic acids that lower pH and improve nutrient availability [70], which may explain the increased activity in the PSB treatments. Moreover, in the CT system, the optimal soil air flow regime, enhanced by mechanical tillage, creates an environment favorable for colonization with aerobic and facultatively anaerobic microorganisms. On the contrary, in NT, the absence of soil disturbance increases bulk density, leading to a more suitable habitat for anaerobic microorganisms [71]. The negative correlation identified between catalase and dehydrogenase is in agreement with other research [72] and can be explained by the involvement of dehydrogenase in soil organic substrate reduction processes [73] under anaerobic conditions, while catalase is present in aerobic environments [74]; all the more since in our analysis, the two soil tillage systems were considered together. It should be mentioned that air-drying of soil samples can reduce enzyme activity by about 16–29%, depending on soil type [75], and the dehydrogenase and catalase in this research—although not accurately reflecting soil activity—capture differences between fertilization treatments and tillage systems.
Similar to the two oxidoreductases, phosphatases—enzymes of extracellular origin—are important measures of soil biochemical status, being involved in catalyzing the conversion of organic P to inorganic forms ready for uptake by plants and microorganisms [76], acting as a sensitive signal of AP deficiency [77]. It has been reported that alkaline phosphatase is largely synthesized by plants, whereas acid phosphatase is generally of microbial origin [78]. Alkaline phosphatase released by microorganisms has a higher affinity for organic P conversion [79]; hence, PSB present possible utility. Research on biofertilizers has provided conflicting results regarding their influence on the activity of these enzymes. For example, Długosz [80] identified inhibition of both acid and alkaline phosphatases when inoculating Lactobacillus spp., Pseudomonas spp., Penicilium, and Actinomycetes spp. on Gleyic Cambisol. These results are in line with those obtained in this study, with PSB reducing or slightly increasing the activity. Phosphatase inhibition occurs as a result of high levels of P in inorganic forms [81] as a result of mixing of PSB with mineral fertilizers in our treatments, even though Bacillus megaterium var. phosphaticum has the ability to produce these enzymes [82]. Investigation of the enzyme response of soil PSB communities to fertilization [83] indicates an increase in phosphatase activity when N is applied, particularly acid phosphatase as a result of pH decrease [84], but our results reflect a significant increase only in the NT system in 2024 in treatments where N was additionally supplied. Regarding the impact of soil disturbance on phosphomonoesterases, Khosro Mohammadi et al. [85] found distinct differences between the CT with soil mobilization and the conservative system with minimal tillage or NT, practiced on Inceptisol soil type and under extreme continental climate conditions. The results of our research highlight this significantly higher level of both phosphomonoesterases in the NT system compared to CT. The absence of soil disturbance led to increased SOM content [86], improved structure, aeration, and moisture [87] and therefore to an enrichment of microbial community [88] and enzymatic activity [89] in the NT system. In sunflower, lower phosphatase activity was detected in the first 15 cm in the CT compared to the NT system [90]. For all the enzymes investigated, the sampling depth is relevant; collecting at 0–25 cm depth is likely to have resulted in lower activity values, which is explained by the loss of organic matter by mixing soil horizons [91]. Although phosphomonoesterases respond to soil pH, our results highlight a positive correlation between them, emphasizing the positive feedback relationship between the two and their changes in the same direction. Correlation analysis between enzymes showed a negative correlation of acid phosphatase with catalase, as found by Samuel et al. [54] in a typical chernozemic soil, but in contrast to the results of the same study, alkaline phosphatase also correlated negatively with catalase in our investigation. It has been suggested that the enzymes behave similarly in reaction to land use, which explains the positive correlation between acid phosphatase, alkaline phosphatase, dehydrogenase, and GME. Other studies have also reported a positive correlation of soil enzymes, so any individual enzyme may reflect the intensity of activity of other enzymes [92]. Enzymatic activity is affected by soil management, with acid phosphatase being very sensitive to it and oxidoreductases (catalase and dehydrogenase) being more stable to anthropogenic influences [92]. Enzymatic activity may not provide a full reflection of soil quality overall; a comprehensive evaluation should include chemical, physical, and biological parameters to accurately measure soil quality and tillage impacts [93].

4.2. Soil Chemical Properties in Response to Fertilization and Tillage Systems

Soil pH plays an important role in the mobility and availability of nutrients to plants, as well as in the dynamics of biological communities and the intensity of their activity [94]. PSB inoculation did not significantly alter pH, even with additional N, which is in agreement with other studies [95]. However, slight soil acidification was recorded in the CT system at 45 DAS in the Bacillus megaterium var. phosphaticum treatments in the two years of research due to the secretion of organic acids [96]. In the NT system, the absence of relevant changes in pH may be attributed to the high buffering capacity of the soil as a function of the rich SOC level [97].
The performance of inoculated soil bacteria depends on nutrient availability, especially C and N [98]. SOC influences soil aggregation, water and air movement, microbial dynamics, enzymatic activities, and nutrient cycling [97]. Studies on the relationship between microbial inoculation with Enterobacter sakazakii J129 [99], Bacillus megaterium KBA–10 + Pantoea agglomerans RK–134 + Pseudomonas fluorescens FDG–37, Bacillus subtilis PA1 + Paenibacillus azotofixans PA2, and SOC content support a positive correlation between them [100]. However, our results are reversed, at least in the first crop season, when only T4 (125% PSB) in the NT system (45 DAS) outperformed the no inoculated control. The absence of a significant influence of PSB (Pseudomonas spp. and Thiobacillus spp.) on soil C content was reported by Just et al. [101]. The constant or decreased SOC may be attributed to the fact that microbes use C as a necessary energy source [102]. Given mulching and the undisturbed soil environment in the NT, SOC was higher compared to the CT system [103,104], where the uniform distribution on profile of organic matter from plant residues and its faster oxidation were favored by tillage, resulting in a reduced SOC sequestration rate. The PSB bacteria can indirectly stimulate N uptake by improving root system development and soil microbiological activity, providing nutrient access [105]. Inoculation of Bacillus megaterium var. phosphaticum and 75% of the recommended chemical fertilizer rate on an Alfisol soil type was found to promote N uptake by sunflower plants [106]. A reduction in TN was evident in the PSB treatments in 2023 in both tillage systems, likely due to plant uptake, leaching, and use as a nutrient for microorganisms. In terms of tillage systems, NT provided higher TN concentrations compared to CT, consistent with other studies on different nutrient levels and soil management [71]. There is a positive relationship between SOC content and TN dynamics [31] as a result of organic matter decomposition and mineralization activity. Soil N and P concentrations are interdependent, with N input enhancing the P cycle, thus achieving a balance in plant nutrition [107]. However, in our investigation, TP did not differ significantly by N application in treatments with the same PSB dose. In CT, the overall trend in TP was a slight increase in the Bacillus treatments or no significant decrease over the two years, whereas in NT, only in 2023, at 45 DAS, the 100 and 125% bacterial inoculum and N reached a maximum content; otherwise, the differences were very small. Investigating the relationships between PSB, N, and P under grassland conditions, it was found that the addition of N or its combination with P negatively influences the PSB community, reducing it by 18–41%, but P alone does not significantly affect PSB abundance [83]. The conversion of P from insoluble to soluble forms by PSB has been highlighted in other studies [108] via different mechanisms such as organic acid release [109,110], ion exchange reactions, or enzyme production [96,111,112]. Bacillus megaterium var. phosphaticum solubilizes phosphorus mainly by producing organic acids such as citric, lactic, and propionic acids [113]. The PSB rate positively influenced the AP content at the recommended or higher dose in the CT system in 2023, but in the second season, the differences were not substantial. However, in NT, a significant decrease in AP levels was observed in the first year of the study at 45 DAS, irrespective of inoculum dose, whereas in 2024, high concentrations were found in Bacillus treatments at crop harvest, especially when N was also supplied. Managed nutrient application of NPK with PSB will contribute to maintaining optimal microbial activity, improving P availability and plant growth [114].
This study highlights the advantages of practicing NT on soil chemical properties and enzymatic activity, but there are some limitations regarding the influence of fertilization. The inconsistencies in our results can be explained by the fact that inoculation with Bacillus megaterium var. phosphaticum can negatively influence the native soil microbiome, thus disrupting its activity and nutrient cycling [115]. Furthermore, the lack of information on the resistance and multiplication in the soil of inoculated bacteria and their effect on the abundance and diversity of soil microbial populations is a limitation. The fact that the experiment was carried out in a field where crop rotation in time and space is practiced hinders the estimation of the efficiency of inoculated microorganisms over time.

5. Conclusions

In conclusion, NT is associated with significantly higher enzymatic activity compared to CT, except for catalase. This suggests a more dynamic and diverse edaphon, supported by straw retention, its buffering capacity, and the presence of a rich substrate that promotes enzymatic processes, such as those catalyzed by phosphomonoesterases. Additionally, the absence of mechanical tillage helps to maintain a stable soil pore structure, which is essential for sustaining soil biodiversity. However, under CT, the soil tends to favor aerobic microorganisms due to increased aeration and organic matter incorporation, which explains the typically intense catalase activity. With the mixed chemical and biological fertilization, inoculation of 100% and 125% PSB and N promote catalase activity, but this had a negative impact on dehydrogenase and phosphomonoesterases, contrary to our expectations. While PSB and N enhance oxidative stress response through catalase activity, they may suppress microbial processes associated with OM degradation and phosphorus cycling. Additionally, this response of soil enzymes to bacterial inoculation is reflected by GME values close to or significantly lower than those of the control (T0) where only mineral fertilizer was applied. This study highlights the underlying role of tillage systems on soil enzymatic activity and chemical properties rather than a particular influence of Bacillus megaterium var. phopshaticum. A dynamic investigation of soil enzymatic activity would be needed, as our analyses only reflect their status at the end of the growing season.
Over the two years of investigation, soil pH was not affected by bacterial inoculation, and SOC and TN showed no clear response to mixed fertilization. In both experimental years, 125% PSB + N treatment increased TP with the two tillage systems. In 2023, in CT, PSB increased AP concentration in all biological treatments and only in T4 at harvest, while in 2024, there were no significant differences. At the same time, in NT, significant increases in AP were found at crop harvest (2024). Thus, these results raise the possibility of using the studied species to increase P mobility, but the mechanisms of action leading to this need to be better understood. Higher levels of TN, SOC, TP, and AP were found under NT compared to CT soil management, likely to the absence of disturbance and greater accumulation of OM at the soil surface.
These findings suggest that, under similar climatic and pedological conditions, the NT system is more effective for improving and preserving soil properties, as we hypothesized, whereas the efficiency of combined mineral and chemical fertilization requires further investigations.

Author Contributions

Conceptualization, A.U.; methodology, I.G.C., G.B., and M.R.; software, S.S.C. and G.D.M.; validation, I.G.C. and G.J.; formal analysis, A.U., I.G.C., M.R., and G.B.; investigation, A.U., I.G.C., M.R., G.B., and G.D.M.; resources, G.B., D.Ț., and G.J.; data curation, A.U. and S.S.C.; writing—original draft preparation, A.U.; writing—review and editing A.U., I.G.C., G.B., M.R., and G.J.; visualization, D.Ț. and G.J.; project administration, G.J.; funding acquisition, G.J.; supervision, G.J. All authors have read and agreed to the published version of the manuscript.

Funding

This research received no external funding.

Institutional Review Board Statement

Not applicable.

Data Availability Statement

The original contributions presented in the study are included in the article. Further inquiries can be directed to the corresponding author.

Conflicts of Interest

The authors declare no conflicts of interest.

References

  1. Karlen, D.L.; Mausbach, M.J.; Doran, J.W.; Cline, R.G.; Harris, R.F.; Schuman, G.E. Soil quality: A concept, definition, and framework for evaluation. Soil Sci. Soc. Am. J. 1997, 61, 4–10. [Google Scholar] [CrossRef]
  2. Garrigues, E.; Corson, M.S.; Angers, D.A.; van der Werf, H.M.; Walter, C. Soil quality in Life Cycle Assessment: Towards development of an indicator. Ecol. Indic. 2012, 18, 434–442. [Google Scholar] [CrossRef]
  3. Stockdale, E.A.; Shepherd, M.A.; Fortune, S.; Cuttle, S.P. Soil fertility in organic farming systems—Fundamentally different? Soil Use Manag. 2002, 18, 301–308. [Google Scholar] [CrossRef]
  4. Szostek, M.; Szpunar-Krok, E.; Pawlak, R.; Stanek-Tarkowska, J.; Ilek, A. Effect of Different Tillage Systems on Soil Organic Carbon and Enzymatic Activity. Agronomy 2022, 12, 208. [Google Scholar] [CrossRef]
  5. Lv, L.; Gao, Z.; Liao, K.; Zhu, Q.; Zhu, J. Impact of conservation tillage on the distribution of soil nutrients with depth. Soil Tillage Res. 2023, 225, 105527. [Google Scholar] [CrossRef]
  6. Topa, D.; Cara, I.G.; Jităreanu, G. Long term impact of different tillage systems on carbon pools and stocks, soil bulk density, aggregation and nutrients: A field meta-analysis. Catena 2021, 199, 105102. [Google Scholar] [CrossRef]
  7. Mihu, G.-D.; Aostăcioaei, T.G.; Ghelbere, C.; Calistru, A.-E.; Țopa, D.C.; Jităreanu, G. Exploring Soil Hydro-Physical Improvements Under No-Tillage: A Sustainable Approach for Soil Health. Agriculture 2025, 15, 981. [Google Scholar] [CrossRef]
  8. Cakpo, S.S.; Aostăcioaei, T.G.; Mihu, G.-D.; Molocea, C.-C.; Ghelbere, C.; Ursu, A.; Țopa, D.C. Long-Term Effect of Tillage Practices on Soil Physical Properties and Winter Wheat Yield in North-East Romania. Agriculture 2025, 15, 989. [Google Scholar] [CrossRef]
  9. da Silva, M.F.; Fernandes, M.M.H.; Fernandes, C.; da Silva, A.M.R.; Ferraudo, A.S.; Coelho, A.P. Contribution of tillage systems and crop succession to soil structuring. Soil Tillage Res. 2021, 209, 104924. [Google Scholar] [CrossRef]
  10. Zhang, Y.; Dalal, R.C.; Bhattacharyya, R.; Meyer, G.; Wang, P.; Menzies, N.W.; Kopittke, P.M. Effect of long-term no-tillage and nitrogen fertilization on phosphorus distribution in bulk soil and aggregates of a Vertisol. Soil Tillage Res. 2021, 205, 104760, ISSN 0167-1987. [Google Scholar] [CrossRef]
  11. Zhang, S.; Li, Q.; Lü, Y.; Zhang, X.; Liang, W. Contributions of soil biota to C sequestration varied with aggregate fractions under different tillage systems. Soil Biol. Biochem. 2013, 62, 147–156. [Google Scholar] [CrossRef]
  12. Zikeli, S.; Gruber, S. Reduced Tillage and No-Till in Organic Farming Systems, Germany—Status Quo, Potentials and Challenges. Agriculture 2017, 7, 35. [Google Scholar] [CrossRef]
  13. Sadiq, M.; Rahim, N.; Tahir, M.M.; Alasmari, A.; Alqahtani, M.M.; Albogami, A.; Ghanem, K.Z.; Abdein, M.A.; Ali, M.; Mehmood, N.; et al. Conservation tillage: A way to improve yield and soil properties and decrease global warming potential in spring wheat agroecosystems. Front. Microbiol. 2024, 15, 1356426. [Google Scholar] [CrossRef] [PubMed]
  14. Luo, Y.; Iqbal, A.; He, L.; Zhao, Q.; Wei, S.; Ali, I.; Ullah, S.; Yan, B.; Jiang, L. Long-term no-tillage and straw retention management enhances soil bacterial community diversity and soil properties in southern China. Agronomy 2020, 10, 1233. [Google Scholar] [CrossRef]
  15. Qiu, Z.; Egidi, E.; Liu, H.; Kaur, S.; Singh, B.K. New frontiers in agriculture productivity: Optimised microbial inoculants and in situ microbiome engineering. Biotechnol. Adv. 2019, 37, 107371. [Google Scholar] [CrossRef]
  16. Kavadia, A.; Omirou, M.; Fasoula, D.; Ioannides, I.M. The importance of microbial inoculants in a climate-changing agriculture in eastern Mediterranean region. Atmosphere 2020, 11, 1136. [Google Scholar] [CrossRef]
  17. Muniswami, D.M.; Chinnadurai, S.; Sachin, M.; Jithin, H.; Ajithkumar, K.; Narayanan, G.S.; Gopinath, B.S.; Rasheeq, A.A.; Preethi, B.A.; Dineshkumar, R. Comparative study of biofertilizer/biostimulant from seaweeds and seagrass in Abelmoschus esculentus crop. Biomass Convers. Biorefin. 2023, 13, 11005–11022. [Google Scholar] [CrossRef]
  18. Chauhan, A.; Siani, R.; Sharma, J.C. Plant growth promoting rhizobacteria and their biological properties for soil enrichment and growth promotion. J. Plant Nutr. 2021, 45, 273–299. [Google Scholar] [CrossRef]
  19. Bechtaoui, N.; Rabiu, M.K.; Raklami, A.; Oufdou, K.; Hafidi, M.; Jemo, M. Phosphate-Dependent Regulation of Growth and Stresses Management in Plants. Front. Plant Sci. 2021, 12, 679916. [Google Scholar] [CrossRef]
  20. Pang, F.; Li, Q.; Solanki, M.K.; Wang, Z.; Xing, Y.-X.; Dong, D.-F. Soil phosphorus transformation and plant uptake driven by phosphate-solubilizing microorganisms. Front. Microbiol. 2024, 15, 1383813. [Google Scholar] [CrossRef]
  21. Khan, F.; Siddique, A.B.; Shabala, S.; Zhou, M.; Zhao, C. Phosphorus Plays Key Roles in Regulating Plants’ Physiological Responses to Abiotic Stresses. Plants 2023, 12, 2861. [Google Scholar] [CrossRef] [PubMed]
  22. Paz-Ares, J.; Puga, M.I.; Rojas-Triana, M.; Martinez-Hevia, I.; Diaz, S.; Poza-Carrión, C.; Miñambres, M.; Leyva, A. Plant Adaptation to Low Phosphorus Availability: Core Signaling, Crosstalks, and Applied Implications. Mol. Plant 2022, 15, 104–124. [Google Scholar] [CrossRef] [PubMed]
  23. Yadav, A.N. Plant microbiomes for sustainable agriculture: Current research and future challenges. In Plant Microbiomes for Sustainable Agriculture; Yadav, A., Singh, J., Rastegari, A., Yadav, N., Eds.; Springer: Cham, Switzerland, 2020; pp. 475–482. [Google Scholar]
  24. Yadav, A.N.; Kumar, R.; Kumar, S.; Kumar, V.; Sugitha, T.; Singh, B.; Chauhan, V.; Dhaliwal, H.S.; Saxena, A.K. Beneficial microbiomes: Biodiversity and potential biotechnological applications for sustainable agriculture and human health. J. Appl. Biol. Biotechnol. 2017, 5, 45–57. [Google Scholar]
  25. Biedendieck, R.; Knuuti, T.; Moore, S.J.; Jahn, D. The “beauty in the beast”—The multiple uses of Priestia megaterium in biotechnology. Appl. Microbiol. Biotechnol. 2021, 105, 5719–5737. [Google Scholar] [CrossRef]
  26. Biswas, J.K.; Banerjee, A.; Rai, M.; Naidu, R.; Biswas, B.; Vithanage, M.; Dash, M.C.; Sarkar, S.K.; Meers, E. Potential application of selected metal resistant phosphate solubilizing bacteria isolated from the gut of earthworm (Metaphire posthuma) in plant growth promotion. Geoderma 2018, 330, 117–124. [Google Scholar] [CrossRef]
  27. Aliyat, F.Z.; Maldani, M.; El Guilli, M.; Nassiri, L.; Ibijbijen, J. Phosphate-solubilizing bacteria isolated from phosphate solid sludge and their ability to solubilize three inorganic phosphate forms: Calcium, iron, and aluminum phosphates. Microorganisms 2022, 10, 980. [Google Scholar] [CrossRef]
  28. Singh, P.; Banik, R.M. Effect of purified alkaline phosphatase from Bacillus licheniformis on growth of Zea mays L. Plant Sci. Today 2019, 6, 583–589. [Google Scholar]
  29. Shrivastava, M.; Srivastava, P.C.; D’souza, S.F. Phosphate-solubilizing microbes: Diversity and phosphates solubilization mechanism. In Role of Rhizospheric Microbes in Soil: Volume 2: Nutrient Management and Crop Improvement; Springer: Singapore, 2018; pp. 137–165. [Google Scholar]
  30. Maurya, S.; Abraham, J.S.; Somasundaram, S.; Toteja, R.; Gupta, R.; Makhija, S. Indicators for assessment of soil quality: A mini-review. Environ. Monit. Assess. 2020, 192, 604. [Google Scholar] [CrossRef]
  31. Kobierski, M.; Lemanowicz, J.; Wojewódzki, P.; Kondratowicz-Maciejewska, K. The Effect of Organic and Conventional Farming Systems with Different Tillage on Soil Properties and Enzymatic Activity. Agronomy 2020, 10, 1809. [Google Scholar] [CrossRef]
  32. Gajda, A.M.; Przewloka, B.; Gawryjolek, K. Changes in soil quality associated with tillage system applied. Int. Agrophys. 2013, 27, 133–141. [Google Scholar] [CrossRef]
  33. Erdel, E.; Şimşek, U.; Kesimci, T.G. Effects of Fungi on Soil Organic Carbon and Soil Enzyme Activity under Agricultural and Pasture Land of Eastern Türkiye. Sustainability 2023, 15, 1765. [Google Scholar] [CrossRef]
  34. Bielińska, E.J.; Mocek-Płóciniak, A. Impact of the tillage system on the soil enzymatic activity. Arch. Environ. Prot. 2012, 38, 75–82. [Google Scholar] [CrossRef]
  35. Zhu, B.; Gu, H.; He, J.; Li, F.; Yu, J.; Liu, W.; Chen, Q.; Lai, Y.; Yu, S. The impact of smash-ridge tillage on agronomic traits of tobacco plants, soil enzymatic activity, microbial community structure, and functional diversity. Plant Signal. Behav. 2023, 18, 2260640. [Google Scholar] [CrossRef] [PubMed]
  36. Mijangos, I.; Pérez, R.; Albizu, I.; Garbisu, C. Effects of fertilization and tillage on soil biological parameters. Enzyme Microb. Technol. 2006, 40, 100–106. [Google Scholar] [CrossRef]
  37. Seifert, S.; Shaw, D.R.; Zablatowicz, R.M.; Wesley, R.A.; Kingery, W.L. Effect of tillage on microbial characteristics and herbicide degradation in a Sharkey clay soil. Weed Sci. 2001, 49, 685–693. [Google Scholar] [CrossRef]
  38. Available online: www.fieldclimate.com (accessed on 12 March 2025).
  39. Lorenz, N.; Dick, R.P. Sampling and pretreatment of soil before enzyme analysis. Methods Soil Enzymol. 2011, 9, 85–101. [Google Scholar]
  40. Casida Jr, L.E.; Klein, D.A.; Santoro, T. Soil dehydrogenase activity. Soil Sci. 1964, 98, 371–376. [Google Scholar] [CrossRef]
  41. Furtak, K.; Gajda, A.M. Activity of dehydrogenases as an indicator of soil environment quality. Pol. J. Soil Sci. 2017, 50, 33–40. [Google Scholar] [CrossRef]
  42. Johnson, J.L.; Temple, K.L. Some variables affecting the measurement of “catalase activity” in soil. Soil Sci. Soc. Am. J. 1964, 28, 207–209. [Google Scholar] [CrossRef]
  43. Tabatabai, M.A.; Bremner, J.M. Use of p-nitrophenyl phosphate for assay of soil phosphatase activity. Soil Biol. Biochem. 1969, 1, 301–307. [Google Scholar] [CrossRef]
  44. Eivazi, F.; Tabatabai, M.A. Phosphatases in soils. Soil Biol. Biochem. 1977, 9, 167–172. [Google Scholar] [CrossRef]
  45. Aruna Kumari, J.; Rao, P.C.; Padmaja, G.; Madhavi, M. Effect of Temperature on Soil Enzyme Acid Phosphatase. Int. J. Curr. Microbiol. Appl. Sci. 2018, 7, 1234–1240. [Google Scholar]
  46. Hinojosa, M.; Carreira, J.A.; Garcła-Rułz, R. Soil moisture pre-treatment effects on enzyme activities as indicators of heavy metal-contaminated and reclaimed soils. Soil Biol. Biochem. 2004, 36, 1559–1568. [Google Scholar] [CrossRef]
  47. ISO 7184/14-79; Soils. Determination of total phosphorus. Romanian Association for Standardization (ASRO): Bucharest, Romania, 1979.
  48. Rusu, M.; Cara, I.-G.; Stoica, F.; Țopa, D.; Jităreanu, G. Quality Parameters of Plum Orchard Subjected to Conventional and Ecological Management Systems in Temperate Production Area. Horticulturae 2024, 10, 907. [Google Scholar] [CrossRef]
  49. Calistru, A.E.; Filipov, F.; Cara, I.G.; Cioboată, M.; Topa, D.; Jităreanu, G. Tillage and Straw Management Practices Influences Soil Nutrient Distribution: A Case Study from North-Eastern Romania. Land 2024, 13, 625. [Google Scholar] [CrossRef]
  50. Lee, S.-H.; Kim, M.-S.; Kim, J.-G.; Kim, S.-O. Use of Soil Enzymes as Indicators for Contaminated Soil Monitoring and Sustainable Management. Sustainability 2020, 12, 8209. [Google Scholar] [CrossRef]
  51. Niewiadomska, A.; Płaza, A.; Wolna-Maruwka, A.; Budka, A.; Głuchowska, K.; Rudziński, R.; Kaczmarek, T. Consortia of plant growth-promoting rhizobacteria and selected catch crops for increasing microbial activity in soil under spring barley grown as an organic farming system. Appl. Sci. 2023, 13, 5120. [Google Scholar] [CrossRef]
  52. Utobo, E.B.; Tewari, L. Soil enzymes as bioindicators of soil ecosystem status. Appl. Ecol. Environ. Res. 2015, 13, 147–169. [Google Scholar]
  53. Gil-Sotres, F.; Trasar-Cepeda, C.; Leirós, M.C.; Seoane, S. Different approaches to evaluating soil quality using biochemical properties. Soil Biol. Biochem. 2005, 37, 877–887. [Google Scholar] [CrossRef]
  54. Samuel, A.D.; Mondici, S.; Brejea, R. Evaluation of soil enzyme activities under different croplands. Rom. Agric. Res. 2021, 38, 271–279. [Google Scholar] [CrossRef]
  55. Błońska, E.; Lasota, J.; Zwydak, M. The Relationship Between Soil Properties, Enzyme Activity and Land Use; Poland Forest Research Institute: Sekocin Stary, Poland, 2017. [Google Scholar]
  56. Wolińska, A.; Stępniewska, Z. Dehydrogenase activity in the soil environment. Dehydrogenases 2012, 10, 183–210. [Google Scholar]
  57. Bayraklı, B. Effect of Bacillus megaterium var. phosphaticum applied together with rock phosphate on wheat yield and some soil properties in a calcareous soil. Eurasian J. Soil Sci. 2022, 11, 198–205. [Google Scholar]
  58. Bai, B.; Yang, X.; Zhao, Q.; Liu, R.; Ren, J. Inoculations with Pseudomonas fluorescens and Bacillus cereus affect the soil enzyme activity, growth and rhizosphere microbial diversity of Taxus chinensis var. mairei. Plant Soil 2020, 455, 41–52. [Google Scholar] [CrossRef]
  59. Mohammadi, K.; Heidari, G.; Javaheri, M.; Karimi Nezhad, M.T. Soil microbial response to tillage systems and fertilization in a bac rhizosphere. Arch. Agron. Soil Sci. 2012, 59, 899–910. [Google Scholar] [CrossRef]
  60. Furtak, K.; Gałązka, A. Enzymatic activity as a popular parameter used to determine the quality of the soil environment. Pol. J. Agron. 2019, 37, 22–30. [Google Scholar]
  61. Burns, R.G.; Dick, R.P. Enzymes in the Environment: Activity, Ecology, and Applications; Marcel Dekker Inc.: New York, NY, USA, 2002; p. 614. [Google Scholar]
  62. Dunca, S.; Ștefan, M.; Nimițan, E.; Ailiesei, O. Microbiological Study of a Bacillus megaterium Strain with Soil Phosphorus Solubilization Potential. Rom. J. Biol.—Plant Biol. 2005, 49–50, 31–39. [Google Scholar]
  63. Saeed, S.W.Z.; Naseer, I.; Zahir, Z.A.; Hilger, T.; Shahid, S.; Iqbal, Z.; Ahmad, M. Bacillus Strains with Catalase Enzyme Improve the Physiology and Growth of Rice (Oryza sativa L.). Stresses 2023, 3, 736–748. [Google Scholar] [CrossRef]
  64. Su-mei, Z.; Man, Z.; Ke-ke, Z.; Xi-wen, Y.; De-xian, H.; Jun, Y.; Chen-yang, W. Effects of reduced nitrogen and suitable soil moisture on wheat (Triticum aestivum L.) rhizosphere soil microbiological, biochemical properties and yield in the Huanghuai Plain, China. J. Integr. Agric. 2020, 19, 234–250. [Google Scholar]
  65. Muhammad, I.; Yang, L.; Ahmad, S.; Zeeshan, M.; Farooq, S.; Ali, I.; Khan, A.; Zhou, X.B. Irrigation and Nitrogen Fertilization Alter Soil Bacterial Communities, Soil Enzyme Activities, and Nutrient Availability in Maize Crop. Front. Microbiol. 2022, 13, 833758. [Google Scholar] [CrossRef]
  66. Szczepanek, M.; Siwik-Ziomek, A.; Lemańczyk, G.; Lamparski, R.; Graczyk, R. Effect of Reduced Tillage on Soil Enzyme Activity, Pests Pressure and Productivity of Organically Grown Spring Wheat Species. Agronomy 2023, 13, 287. [Google Scholar] [CrossRef]
  67. Chen, Y.; Wei, T.; Sha, G.; Zhu, Q.; Liu, Z.; Ren, K.; Yang, C. Soil enzyme activities of typical plant communities after vegetation restoration on the Loess Plateau, China. Appl. Soil Ecol. 2022, 170, 104292. [Google Scholar] [CrossRef]
  68. Ren, C.; Kang, D.; ping Wu, J.; Zhao, F.; Yang, G.; Han, X.; Ren, G. Temporal variation in soil enzyme activities after afforestation in the Loess Plateau, China. Geoderma 2016, 282, 103–111. [Google Scholar] [CrossRef]
  69. Ge, G.F.; Li, Z.J.; Zhang, J.; Wang, L.G.; Xu, M.G.; Zhang, J.B.; Wang, J.K.; Xie, X.L.; Liang, Y.C. Geographical and climatic differences in long-term effect of organic and inorganic amendments on soil enzymatic activities and respiration in field experimental stations of China. Ecol. Complex. 2009, 6, 421–431. [Google Scholar] [CrossRef]
  70. Khatun, M.R.; Mukta, R.H.; Islam, M.A.; Hud, A.N. Insight into Citric Acid-Induced Chromium Detoxification in Rice (Oryza sativa L). Int. J. Phytoremediat. 2019, 21, 1234–1240. [Google Scholar] [CrossRef]
  71. Habbib, H.; Verzeaux, J.; Nivelle, E.; Roger, D.; Lacoux, J.; Catterou, M.; Hirel, B.; Dubois, F.; Tétu, T. Conversion to No-Till Improves Maize Nitrogen Use Efficiency in a Continuous Cover Cropping System. PLoS ONE 2016, 11, e0164234. [Google Scholar] [CrossRef]
  72. Tan, X.; Xie, B.; Wang, J.; He, W.; Wang, X.; Wei, G. County-Scale spatial distribution of soil enzyme activities and enzyme activity indices in agricultural land: Implications for soil quality assessment. Sci. World J. 2014, 2014, 535768. [Google Scholar] [CrossRef]
  73. Suh, J.S.; Kim, S.J.; Noh, H.J.; Kwon, J.S.; Jung, W.K. Long-term Composting and Fertilization Impact on Dehydrogenase-producing Bacteria and Dehydrogenase Activity in Rice Paddy Soil. Korean J. Soil Sci. Fertil. 2007, 40, 229–233. [Google Scholar]
  74. Micuți, M.M.; Bădulescu, L.; Burlacu, A.; Israel-Roming, F. Activity of peroxidase and catalase in soils as influenced by some insecticides and fungicides. AgroLife Sci. J. 2018, 7. Available online: https://agrolifejournal.usamv.ro/index.php/agrolife/article/view/232 (accessed on 12 March 2025).
  75. Piotrowska-Długosz, A.; Kobierski, M.; Długosz, J. Enzymatic Activity and Physicochemical Properties of Soil Profiles of Luvisols. Materials 2021, 14, 6364. [Google Scholar] [CrossRef]
  76. Dotaniya, M.L.; Aparna, K.; Dotaniya, C.K.; Singh, M.; Regar, K.L. Role of soil enzymes in sustainable crop production. In Enzymes in Food Biotechnology: Production, Applications, and Future Prospects; Elsevier: Amsterdam, The Netherlands, 2018; pp. 569–589. [Google Scholar]
  77. Piotrowska Długosz, A.; Charzyński, P. The impact of the soil sealing degree on microbial biomass, enzymatic activity, and physicochemical properties in the Ekranic Technosols of Toruń (Poland). J. Soils Sediments 2015, 15, 47–59. [Google Scholar] [CrossRef]
  78. Criquet, S.; Ferre, E.; Farner, E.M.; Le Petit, J. Annual dynamics of phosphatase activities in an evergreen oak litter—Influence of biotic and abiotic factors. Soil Biol. Biochem. 2004, 36, 1111–1118. [Google Scholar] [CrossRef]
  79. Tarafdar, J.C.; Yadav, R.S.; Meena, S.C. Comparative efficiency of acid phosphatase originated from plant and fungal sources. J Plant Nutr. Soil Sci. 2001, 164, 279–282. [Google Scholar] [CrossRef]
  80. Długosz, J. Different Response of Carbon and P-Related Soil Properties toward Fertilization in Red Soil. Agronomy 2023, 13, 2751. [Google Scholar] [CrossRef]
  81. Janes-Bassett, V.; Blackwell, M.S.; Blair, G.; Davies, J.; Haygarth, P.M.; Mezeli, M.M.; Stewart, G. A meta-analysis of phosphatase activity in agricultural settings in response to phosphorus deficiency. Soil Biol. Biochem. 2022, 165, 108537. [Google Scholar] [CrossRef]
  82. Ibarra-Galeana, J.A.; Castro-Martínez, C.; Fierro-Coronado, R.A.; Armenta-Bojórquez, A.D.; Maldonado-Mendoza, I.E. Characterization of phosphate-solubilizing bacteria exhibiting the potential for growth promotion and phosphorus nutrition improvement in maize (Zea mays L.) in calcareous soils of Sinaloa, Mexico. Ann. Microbiol. 2017, 67, 801–811. [Google Scholar] [CrossRef]
  83. Widdig, M.; Schleuss, P.M.; Weig, A.R.; Guhr, A.; Biederman, L.A.; Borer, E.T.; Crawley, M.J.; Kirkman, K.P.; Seabloom, E.W.; Wragg, P.D.; et al. Nitrogen and Phosphorus Additions Alter the Abundance of Phosphorus-Solubilizing Bacteria and Phosphatase Activity in Grassland Soils. Front. Environ. Sci. 2019, 7, 185. [Google Scholar] [CrossRef]
  84. Kalembasa, S.; Symanowicz, B. Enzymatic activity of soil after applying various waste organic materials, ash, and mineral fertilizers. Pol. J. Environ. Stud. 2012, 21, 1635–1641. [Google Scholar]
  85. Mohammadi, K.; Heidari, G.; Karimi Nezhad, M.T.; Ghamari, S.; Sohrabi, Y. Contrasting soil microbial responses to fertilization and tillage systems in canola rhizosphere. Saudi J. Biol. Sci. 2012, 19, 377–383. [Google Scholar] [CrossRef]
  86. Avasilcai, L.; Bireescu, G.; Vieriu, M.; Bibire, N.; Crivoi, F.; Cioanca, O.; Morariu, I.D. Study on the Enzymatic Activity of the Soil in Racos Protected Area from Brasov. Rev. Chim. 2020, 71, 358–366. [Google Scholar] [CrossRef]
  87. Silva, A.; Babujia, L.; Franchini, J.; Ralisch, R.; Hungria, M.; Guimar, E. Soil structure and its influence on microbial biomass in different soil and crop management systems. Soil Till. Res. 2014, 142, 42–53. [Google Scholar] [CrossRef]
  88. Heidari, G.; Mohammadi, K.; Sohrabi, Y. Responses of soil microbial biomass and enzyme activities to tillage and fertilization systems in soybean (Glycine max L.) production. Front. Plant Sci. 2016, 7, 1730. [Google Scholar] [CrossRef] [PubMed]
  89. Huang, N.; Zhao, X.; Guo, X.; Sui, B.; Liu, J.; Wang, H.; Li, J. Tillage Methods Change Nitrogen Distribution and Enzyme Activities in Maize Rhizosphere and Non-Rhizosphere Chernozem in Jilin Province of China. Processes 2023, 11, 3253. [Google Scholar] [CrossRef]
  90. Nugroho, P.A. Indicative Soil Biological Parameters in Long-Term Conventional and Conservation Tillage Experiment. Ph.D. Thesis, Magyar Agrár-és Élettudományi Egyetem, Gödöllő, Hungary, 2024. [Google Scholar]
  91. Carter, M.R. Microbial biomass as an index for tillage-induced changes in soil biological properties. Soil Tillage Res. 1986, 7, 29–40. [Google Scholar] [CrossRef]
  92. Lemanowicz, J. Activity of selected enzymes as markers of ecotoxicity in technogenic salinization soils. Environ. Sci. Pollut. Res. 2019, 26, 13014–13024. [Google Scholar] [CrossRef]
  93. Teslya, A.V.; Iashnikov, A.V.; Poshvina, D.V.; Stepanov, A.A.; Vasilchenko, A.S. Extracellular Enzymes of Soils Under Organic and Conventional Cropping Systems: Predicted Functional Potential and Actual Activity. Agronomy 2024, 14, 2634. [Google Scholar] [CrossRef]
  94. Maphuhla, N.G.; Lewu, F.B.; Oyedeji, O.O. The effects of physicochemical parameters on analysed soil enzyme activity from Alice landfill site. Int. J. Environ. Res. Public Health 2021, 18, 221. [Google Scholar] [CrossRef]
  95. López-Valdez, F.; Fernández-Luqueño, F.; Ceballos-Ramírez, J.M.; Marsch, R.; Olalde-Portugal, V.; Dendooven, L. A strain of Bacillus subtilis stimulates sunflower growth (Helianthus annuus L.) temporarily. Sci. Hortic. 2011, 128, 499–505. [Google Scholar] [CrossRef]
  96. Nosheen, S.; Ajmal, I.; Song, Y. Microbes as Biofertilizers, a Potential Approach for Sustainable Crop Production. Sustainability 2021, 13, 1868. [Google Scholar] [CrossRef]
  97. Blanco-Canqui, H.; Shapiro, C.A.; Wortmann, C.S.; Drijber, R.A.; Mamo, M.; Shaver, T.M.; Ferguson, R.B. Soil organic carbon: The value to soil properties. J. Soil Water Conserv. 2013, 68, 129A–134A. [Google Scholar] [CrossRef]
  98. Raimi, A.; Adeleke, R.; Roopnarain, A. Soil fertility challenges and Biofertiliser as a viable alternative for increasing smallholder farmer crop productivity in sub-Saharan Africa. Cogent Food Agric. 2017, 3, 1400933. [Google Scholar] [CrossRef]
  99. Javeed, H.M.R.; Qamar, R.; Rehman, A.U.; Ali, M.; Rehman, A.; Farooq, M.; Zamir, S.I.; Nadeem, M.; Cheema, M.A.; Shehzad, M.; et al. Improvement in Soil Characteristics of Sandy Loam Soil and Grain Quality of Spring Maize by Using Phosphorus Solublizing Bacteria. Sustainability 2019, 11, 7049. [Google Scholar] [CrossRef]
  100. Yilmaz, E.; Sönmez, M. The role of organic/bio–fertilizer amendment on aggregate stability and organic carbon content in different aggregate scales. Soil Tillage Res. 2017, 168, 118–124. [Google Scholar] [CrossRef]
  101. Just, B.S.; Marks, E.A.N.; Roquer-Beni, L.; Llenas, L.; Ponsà, S.; Vilaplana, R. Biofertilization increases soil organic carbon concentrations: Results of a meta-analysis. Int. J. Agric. Sustain. 2024, 22, 2361578. [Google Scholar] [CrossRef]
  102. Goswami, L.; Gorai, P.S.; Mandal, N.C. Microbial fortification during vermicomposting: A brief review. In Recent Advancement in Microbial Biotechnology; Academic Press: Cambridge, MA, USA, 2021; pp. 99–122. [Google Scholar]
  103. Oorts, K.; Garnier, P.; Findeling, A.; Mary, B.; Richard, G.; Nicolardot, B. Modeling soil carbon and nitrogen dynamics in no-till and conventional tillage using PASTIS model. Soil Sci. Soc. Am. J. 2007, 71, 336–346. [Google Scholar] [CrossRef]
  104. Andruschkewitsch, R.; Geisseler, D.; Koch, H.J.; Ludwig, B. Effects of tillage on contents of organic carbon, nitrogen, water-stable aggregates and light fraction for four different long-term trials. Geoderma 2013, 192, 368–377. [Google Scholar] [CrossRef]
  105. Masrahi, A.S.; Alasmari, A.; Shahin, M.G.; Qumsani, A.T.; Oraby, H.F.; Awad-Allah, M.M.A. Role of Arbuscular Mycorrhizal Fungi and Phosphate Solubilizing Bacteria in Improving Yield, Yield Components, and Nutrients Uptake of Barley under Salinity Soil. Agriculture 2023, 13, 537. [Google Scholar] [CrossRef]
  106. Amalraj, E.L.D.; Maiyappan, S.; Peter, A.J. In vivo and in vitro studies of Bacillus megaterium var. phosphaticum on nutrient mobilization, antagonism and plant growth promoting traits. J. Ecobiotechnol. 2012, 4. Available online: https://updatepublishing.com/journal/index.php/jebt/article/view/165 (accessed on 12 March 2025).
  107. Marklein, A.R.; Houlton, B.Z. Nitrogen inputs accelerate phosphorus cycling rates across a wide variety of terrestrial ecosystems. New Phytol. 2012, 193, 696–704. [Google Scholar] [CrossRef]
  108. Liang, J.L.; Liu, J.; Jia, P.; Yang, T.T.; Zeng, Q.W.; Zhang, S.C.; Liao, B.; Shu, W.S.; Li, J.T. Novel phosphate-solubilizing bacteria enhance soil phosphorus cycling following ecological restoration of land degraded by mining. ISME J. 2020, 14, 1600–1613. [Google Scholar] [CrossRef]
  109. Cheng, J.; Zhuang, W.; Li, N.N.; Tang, C.L.; Ying, H.J. Efficient biosynthesis of d-ribose using a novel co-feeding strategy in Bacillus subtilis without acid formation. Lett. Appl. Microbiol. 2017, 64, 73–78. [Google Scholar] [CrossRef]
  110. Itelima, J.; Bang, W.; Onyimba, I.; Oj, E. A review: Biofertilizer; a key player in enhancing soil fertility and crop productivity. J. Microbiol. Biotechnol. Rep. 2018, 2, 22–28. [Google Scholar]
  111. Rodríguez, H.; Fraga, R. Phosphate solubilizing bacteria and their role in plant growth promotion. Biotechnol. Adv. 1999, 17, 319–339. [Google Scholar] [CrossRef] [PubMed]
  112. Patel, D.; Goswami, D. Phosphorus solubilization and mobilization: Mechanisms, current developments, and future challenge. In Advances in Plant Microbiome and Sustainable Agriculture: Functional Annotation and Future Challenges; Springer: Singapore, 2020; pp. 1–20. [Google Scholar]
  113. Saeid, A.; Prochownik, E.; Dobrowolska-Iwanek, J. Phosphorus Solubilization by Bacillus Species. Molecules 2018, 23, 2897. [Google Scholar] [CrossRef] [PubMed]
  114. Bhat, M.A.; Mishra, A.K.; Shah, S.N.; Bhat, M.A.; Jan, S.; Rahman, S.; Baek, K.-H.; Jan, A.T. Soil and Mineral Nutrients in Plant Health: A Prospective Study of Iron and Phosphorus in the Growth and Development of Plants. Curr. Issues Mol. Biol. 2024, 46, 5194–5222. [Google Scholar] [CrossRef]
  115. Tian, J.; Ge, F.; Zhang, D.; Deng, S.; Liu, X. Roles of Phosphate Solubilizing Microorganisms from Managing Soil Phosphorus Deficiency to Mediating Biogeochemical P Cycle. Biology 2021, 10, 158. [Google Scholar] [CrossRef]
Figure 1. The geographic location of the research plot on a map of Europe and the layout of the experimental area.
Agriculture 15 01285 g001
Figure 2. Temperature and rainfall distribution during the sunflower cropping period (www.fieldclimate.com accessed on 12 March 2025).
Agriculture 15 01285 g002
Figure 3. Geometric mean of enzymatic activities. Different letters indicate significant differences between fertilizer treatments at the 0.05 level. GME: geometric mean of enzymatic activities; CT: conventional tillage; NT: no-tillage; T0: control; T1: 100% Ecofertil; T2: 75% Ecofertil + N; T3: 100% Ecofertil + N; T4: 125% Ecofertil + N.
Agriculture 15 01285 g003
Figure 4. Effect of bacterial inoculation on total phosphorus (TP) content (%) in each tillage system. Results are presented as means and standard errors; different letters mean that within the same tillage system in the same year, there are significant differences (p < 0.05) between fertilizer treatments; DAS: days after sowing; CT: conventional tillage; NT: no-tillage; T0: control; T1: 100% Ecofertil; T2: 75% Ecofertil + N; T3: 100% Ecofertil + N; T4: 125% Ecofertil + N.
Agriculture 15 01285 g004
Figure 5. Effect of bacterial inoculation on soil available P (AP) content (ppm) in CT and NT systems. Results are presented as means and standard errors; different letters mean that within the same tillage system in the same year, there are significant differences (p < 0.05) between fertilizer treatments; DAS: days after sowing; T0: control; T1: 100% Ecofertil; T2: 75% Ecofertil + N; T3: 100% Ecofertil + N; T4: 125% Ecofertil + N.
Agriculture 15 01285 g005aAgriculture 15 01285 g005b
Table 1. Some of the main physical–chemical soil properties.
Tillage SystemCTNT
Experimental Year2023202420232024
Bulk density (g/cm3)1.291.231.441.35
pH5.795.805.955.87
Organic C1.691.632.632.38
Total N (%)0.1480.1450.2290.207
Total P (%)0.03120.03580.03890.0339
Available P (ppm)58.3729.0669.8358.56
Soil TypeCambic Chernozem
TextureClay–Loam
CT: conventional tillage; NT: no-tillage.
Table 2. Fertilization treatment concentrations, rates, and timing.
Fertilizer TreatmentsInitial FertilizationSecond Fertilization
05 May 2023 and 11 April 202420 June 2023 and 26 May 2024
NPK 20:10:5
(240 kg ha−1)
Ecofertil (1 × 10¹⁰ CFU)
(15 L ha−1 year−1)
Corona N
(3 kg ha−1)
T0-control+
T1+100%100%
T2+75%75%+
T3+100%100%+
T4+125%125%+
+: fertilizer has been applied in the treatment, : fertilizer was not applied in the treatment; CFU: colony-forming unit; NPK: 20% N, 10% P2O5, 5% K2O; Corona N: 21% N; CT: conventional tillage; NT: no-tillage; T0: control; T1: 100% Ecofertil; T2: 75% Ecofertil + N; T3: 100% Ecofertil + N; T4: 125% Ecofertil + N.
Table 3. Dehydrogenase activity under different tillage practices and PSB inoculation rates in 2023–2024.
EnzymeDehydrogenase
(µg TPF g −1 h−1)
Tillage SystemCTNT
YearTreatmentMeanMin.Max.MeanMin.Max.
2023T00.94 ± 0.03 a B0.741.151.05 ± 0.07 c A0.751.56
T10.78 ± 0.03 b B0.581.031.29 ± 0.21 b A0.402.79
T20.67 ± 0.27 c B0.510.841.46 ± 0.05 a A1.061.70
T30.98 ± 0.03 a ns0.801.190.92 ± 0.05 d ns0.561.13
T40.82 ± 0.03 b B0.641.051.00 ± 0.04 cd A0.751.29
2024T00.82 ± 0.07 ab B0.511.462.03 ± 0.16 a A1.133.18
T10.84 ± 0.04 a ns0.671.400.87 ± 0.04 d ns0.641.22
T20.71 ± 0.05 cd B0.411.091.13 ± 0.09 c A0.781.63
T30.70 ± 0.02 d B0.590.841.06 ± 0.07 c A0.681.50
T40.73 ± 0.01 bcd B0.650.811.34 ± 0.08 b A0.981.96
Results represent mean values ± SE: standard error (n = 3); different lower-case letters mean that within the same tillage system in the same year, there are significant differences (p < 0.05) between fertilization treatments; different upper-case letters mean that within the same fertilization treatment in the same year, there are significant differences (p < 0.05) between tillage systems. ns: not significant; Min. and Max.: minimum and maximum individual values; CT: conventional tillage; NT: no-tillage; T0: control; T1: 100% Ecofertil; T2: 75% Ecofertil + N; T3: 100% Ecofertil + N; T4: 125% Ecofertil + N.
Table 4. Catalase activity under different tillage practices and PSB inoculation rates in 2023–2024.
EnzymeCatalase
(µmol H2O2 g−1 h−1)
Tillage SystemCTNT
YearTreatmentMeanMin.Max.MeanMin.Max.
2023T01.43 ± 0.05 d ns1.211.791.38 ± 0.07 b ns1.001.75
T11.50 ± 0.09 c A1.172.171.19 ± 0.08 e B0.831.67
T21.56 ± 0.15 b A0.462.121.34 ± 0.04 c B1.131.63
T31.91 ± 0.10 a A1.332.541.23 ± 0.05 d B0.881.42
T41.89 ± 0.08 a A1.632.501.53 ± 0.03 a B1.331.75
2024T02.06 ± 0.05 c A1.772.401.21 ± 0.06 d B0.941.62
T11.94 ± 0.06 d A1.682.311.89 ± 0.05 a B1.662.13
T22.17 ± 0.07 b A1.812.481.56 ± 0.08 c B1.151.96
T32.32 ± 0.04 a A2.062.531.58 ± 0.10 c B0.882.15
T42.16 ± 0.04 b A1.942.401.76 ± 0.09 b B1.182.10
Results represent mean values ± SE: standard error (n = 3); different lower-case letters mean that within the same tillage system in the same year, there are significant differences (p < 0.05) between fertilization treatments; different upper-case letters mean that within the same fertilization treatment in the same year, there are significant differences (p < 0.05) between tillage systems. ns: not significant; Min. and Max.: minimum and maximum individual values; CT: conventional tillage; NT: no-tillage; T0: control; T1: 100% Ecofertil; T2: 75% Ecofertil + N; T3: 100% Ecofertil + N; T4: 125% Ecofertil + N.
Table 5. Acid phosphatase activity under different tillage practices and PSB inoculation rates in 2023–2024.
EnzymeAcid Phosphatase
(µg p-Nitrophenol g−1 h−1)
Tillage SystemCTNT
YearTreatmentMeanMin.Max.MeanMin.Max.
2023T01.12 ± 0.02 a B0.971.241.21 ± 0.03 b A0.981.38
T11.01 ± 0.02 c B0.841.121.52 ± 0.05 a A1.151.78
T20.93 ± 0.03 d B0.691.061.22 ± 0.04 b A0.991.49
T31.07 ± 0.02 b B0.951.201.22 ± 0.04 b A0.991.52
T40.90 ± 0.01 d B0.780.981.20 ± 0.05 b A0.951.47
2024T01.10 ± 0.01 c B1.041.161.96 ± 0.05 a A1.692.40
T11.17 ± 0.02 b B1.031.341.49 ± 0.05 d A1.281.81
T21.13 ± 0.01 bc B1.031.221.64 ± 0.04 c A1.311.83
T31.06 ± 0.03 d B0.911.191.84 ± 0.08 b A1.272.28
T41.27 ± 0.01 a B1.191.361.61 ± 0.04 c A1.371.88
Results represent mean values ± SE: standard error (n = 3); different lower-case letters mean that within the same tillage system in the same year, there are significant differences (p < 0.05) between fertilization treatments; different upper-case letters mean that within the same fertilization treatment in the same year, there are significant differences (p < 0.05) between tillage systems. Min. and Max.: minimum and maximum individual values; CT: conventional tillage; NT: no-tillage; T0: control; T1: 100% Ecofertil; T2: 75% Ecofertil + N; T3: 100% Ecofertil + N; T4: 125% Ecofertil + N.
Table 6. Alkaline phosphatase activity under different tillage practices and PSB inoculation rates in 2023–2024.
EnzymeAlkaline Phosphatase
(µg p-Nitrophenol g−1 h−1)
Tillage SystemCTNT
YearTreatmentMeanMin.Max.MeanMin.Max.
2023T00.16 ± 0.01 bc B0.110.210.46 ± 0.03 b A0.310.62
T10.18 ± 0.01 a B0.130.240.52 ± 0.04 a A0.320.77
T20.16 ± 0.01 bc B0.090.230.33 ± 0.02 c A0.230.43
T30.14 ± 0.01 c B0.090.220.45 ± 0.02 b A0.360.59
T40.17 ± 0.01 ab B0.100.240.34 ± 0.01 c A0.280.43
2024T00.18 ± 0.004 a B0.140.200.60 ± 0.04 a A0.420.84
T10.19 ± 0.01 a B0.140.240.30 ± 0.01 e A0.230.38
T20.15 ± 0.004 b B0.130.180.45 ± 0.04 b A0.310.68
T30.18 ± 0.005 a B0.160.220.38 ± 0.03 c A0.230.65
T40.16 ± 0.002 b B0.140.170.36 ± 0.03 d A0.260.60
Results represent mean values ± SE: standard error (n = 3); different lower-case letters mean that within the same tillage system in the same year, there are significant differences (p < 0.05) between fertilization treatments; different upper-case letters mean that within the same fertilization treatment in the same year, there are significant differences (p < 0.05) between tillage systems. Min. and Max.: minimum and maximum individual values; CT: conventional tillage; NT: no-tillage; T0: control; T1: 100% Ecofertil; T2: 75% Ecofertil + N; T3: 100% Ecofertil + N; T4: 125% Ecofertil + N.
Table 7. Analysis of the effects of tillage system, fertilization treatments, and their interaction on soil enzymatic activity.
SourcedfMSFSignificance
Dependent variable: Catalase
Tillage system113.631105.2590.000 ***
Fertilizer treatment40.8966.9220.000 ***
Tillage system × Fertilizer treatment40.5374.1500.003 **
Error2900.129
Dependent variable: Dehydrogenase
Tillage system112.996105.6820.000 ***
Fertilizer treatment40.8196.6560.000 ***
Tillage system × Fertilizer treatment40.7105.7760.000 ***
Error2900.123
Dependent variable: Acid phosphatase
Tillage system112.888216.1160.000 ***
Fertilizer treatment40.1342.2540.063
Tillage system × Fertilizer treatment40.0590.9840.416
Error2900.060
Dependent variable: Alkaline phosphatase
Tillage system14.795507.6970.000 ***
Fertilizer treatment40.0798.3730.000 ***
Tillage system × Fertilizer treatment40.0687.2450.000 ***
Error2900.009
df: Degrees of freedom, MS: means square, F: F-statistic. p > 0.05; **: p < 0.01; ***: p < 0.001.
Table 8. Correlation analysis of the investigated soil enzymatic activities.
ParameterGMECatalaseDehydrogenaseAcid PhosphataseAlkaline Phosphatase
GME1
Catalase−0.460 **1
Dehydrogenase0.860 **−0.572 **1
Acid phosphatase0.858 **−0.330 **0.604 **1
Alkaline phosphatase0.892 **−0.638 **0.731 **0.703 **1
**: correlation is significant at the 0.01 level (2-tailed); GME: geometric mean of enzymatic activities.
Table 9. Soil pH, SOC, and TN reported in 2023 at the two soil analysis stages.
Tillage System45 DAS
CTNT
Fertilization TreatmentT0T1T2T3T4T0T1T2T3T4
Indicator
pH6.0 a5.8 a5.8 a5.7 a5.8 a5.7 a5.7 a5.7 a5.7 a5.7 a
SE0.0950.0840.1180.0910.0690.1010.1600.1040.1240.111
SOC (%)1.91 a1.76 d1.86 bc1.91 ab1.85 c2.76 ab2.54 d2.67 c2.75 b2.82 a
SE0.0070.0120.0170.0030.0050.0070.0080.0170.0170.010
TN (%)0.168 a0.155 a0.162 a0.165 a0.162 a0.239 ab0.221 c0.234 b0.240 ab0.244 a
SE0.0020.0030.0020.0030.0040.0000.0030.0010.0010.001
Crop Harvest
pH5.5 a5.3 a5.5 a5.6 a5.3 a5.7 a5.9 a5.8 a5.8 a5.7 a
SE0.0740.0920.1050.1150.1270.1000.0730.0760.0850.065
SOC (%)2.13 a1.98 b1.73 c1.89 b2.07 a2.56 a2.29 c2.31 bc2.34 b2.24 d
SE0.0230.0340.0100.0070.0100.0030.0100.0030.0080.010
TN (%)0.185 a0.174 ab0.151 c0.168 b0.177 ab0.224 a0.198 b0.201 b0.205 b0.196 b
SE0.0030.0020.0030.0010.0020.0020.0000.0020.0000.003
Results represent mean values; SE: standard error (n = 3); different letters mean that within the same tillage system in the same year, there are significant differences (p < 0.05) between fertilizer treatments. DAS: days after sowing; CT: conventional tillage; NT: no-tillage; SOC: soil organic carbon; TN: total nitrogen; T0: control; T1: 100% Ecofertil; T2: 75% Ecofertil + N; T3: 100% Ecofertil + N; T4: 125% Ecofertil + N.
Table 10. Soil pH, SOC, and TN reported in 2024 at the two soil analysis stages.
Tillage System45 DAS
CTNT
Fertilization TreatmentT0T1T2T3T4T0T1T2T3T4
Indicator
pH5.9 a5.9 a5.8 a5.8 a5.7 a5.7 a5.7 a5.7 a5.6 a5.6 a
SE0.1000.0910.1150.0930.1340.1210.1040.0740.0750.058
SOC (%)1.84 b1.74 cd2.00 a1.78 bc1.70 d2.08 c2.26 a2.23 ab2.21 ab2.20 b
SE0.0070.0270.0130.0120.0030.0100.0170.0100.0100.017
TN (%)0.157 ab0.153 b0.175 a0.156 ab0.148 b0.182 b0.196 a0.190 ab0.188 ab0.185 ab
SE0.0040.0050.0030.0050.0050.0040.0030.0010.0010.002
Crop Harvest
pH5.8 a5.8 a5.7 a5.8 a5.7 a5.6 a5.8 a5.8 a5.6 a5.8 a
SE0.0450.0500.0720.1130.0620.0690.0870.1340.0830.066
SOC (%)1.84 a1.84 a1.65 b1.61 b1.91 a2.26 c2.35 bc1.42 d2.45 ab2.52 a
SE0.0170.0230.0100.0100.0100.0200.0150.0150.0340.035
TN (%)0.157 a0.156 a0.144 b0.137 b0.161 a0.190 b0.200 ab0.126 c0.207 a0.212 a
SE0.0020.0020.0030.0010.0020.0030.0010.0010.0030.004
Results represent mean values; SE: standard error (n = 3); different letters mean that within the same tillage system in the same year, there are significant differences (p < 0.05) between fertilizer treatments. DAS: days after sowing; CT: conventional tillage; NT: no-tillage; SOC: soil organic carbon; TN: total nitrogen; T0: control; T1: 100% Ecofertil; T2: 75% Ecofertil + N; T3: 100% Ecofertil + N; T4: 125% Ecofertil + N.
Table 11. Analysis of the effects of tillage system, fertilization treatments, and their interaction on soil chemical properties.
SourcedfMSFSignificance
Dependent variable: pH
Tillage system10.0010.0250.876
Fertilizer treatment40.0230.5950.667
Tillage system × Fertilizer treatment40.0481.2230.305
Error1100.039
Dependent variable: SOC
Tillage system17.874153.4210.000 ***
Fertilizer treatment40.1372.6660.036 *
Tillage system × Fertilizer treatment40.0701.3710.249
Error1100.051
Dependent variable: TN
Tillage system10.056136.9090.000 ***
Fertilizer treatment40.0011.9110.114
Tillage system × Fertilizer treatment40.0001.1070.357
Error1100.000
Dependent variable: TP
Tillage system10.00342.5900.000 ***
Fertilizer treatment40.0004.0970.004 **
Tillage system × Fertilizer treatment45.909 × 10−50.9480.439
Error1106.233 × 10−5
Dependent variable: AP
Tillage system18247.05832.9880.000 ***
Fertilizer treatment4226.4800.9060.463
Tillage system × Fertilizer treatment4323.5851.2940.277
Error110249.998
df: Degrees of freedom, MS: means square, F: F-statistic; *: p < 0.05; **: p < 0.01; ***: p < 0.001; SOC: soil organic carbon; TN: total nitrogen; TP: total phosphorus; AP: available phosphorus.
Table 12. Correlation analysis of the investigated soil chemical indicators.
ParameterpHSOCTNTPAP
pH1
SOC−0.0801
TN−0.0640.992 **1
TP0.0910.461 **0.482 **1
AP−0.0800.292 **0.262 **0.223 *1
**: correlation is significant at the 0.01 level (2-tailed); *: correlation is significant at the 0.05 level (2-tailed); SOC: soil organic carbon; TN: total nitrogen; TP: total phosphorus; AP: available phosphorus.
Disclaimer/Publisher’s Note: The statements, opinions and data contained in all publications are solely those of the individual author(s) and contributor(s) and not of MDPI and/or the editor(s). MDPI and/or the editor(s) disclaim responsibility for any injury to people or property resulting from any ideas, methods, instructions or products referred to in the content.

