Article

Stable and Mobile (Water-Extractable) Forms of Organic Matter in High-Latitude Volcanic Soils Under Various Land Use Scenarios in Southeastern Iceland

by
Aleksandra Kot
1,
Urszula Norton
2,3,
Grzegorz Kulczycki
1,
Jón Guðmundsson
4,
Agnieszka Medyńska-Juraszek
1,
Chloe M. Mattilio
2,
Szymon Jędrzejewski
1 and
Jarosław Waroszewski
1,*
1
Institute of Soil Science, Plant Nutrition and Environmental Protection, Wroclaw University of Environmental and Life Sciences, Grunwaldzka 53, 50-357 Wroclaw, Poland
2
Plant Sciences Department, University of Wyoming, Department 3354, 1000 East University Avenue, Laramie, WY 82071, USA
3
Program in Ecology and Evolution, University of Wyoming, 1000 East University Avenue, Laramie, WY 82071, USA
4
Faculty of Environmental and Forest Sciences, Agricultural University of Iceland, Árleyni 22, 112 Reykjavik, Iceland
*
Author to whom correspondence should be addressed.
Agriculture 2025, 15(12), 1255; https://doi.org/10.3390/agriculture15121255
Submission received: 14 April 2025 / Revised: 4 June 2025 / Accepted: 6 June 2025 / Published: 10 June 2025
(This article belongs to the Section Ecosystem, Environment and Climate Change in Agriculture)

Abstract

High-latitude regions store substantial amounts of soil organic matter (SOM). Icelandic volcanic soils have exceptional capabilities for SOM accumulation, but recent changes in land use can significantly impact it. Water-extractable organic matter (WEOM) represents a labile SOM pool and serves as a reliable index of SOM dynamics. We assessed the stable carbon (C), stable nitrogen (N), and WEOC (water-extractable organic carbon), as well as WETN (water-extractable total nitrogen), concentrations in soils under different land uses—semi-natural habitats (tundra and wetland) and human-managed areas (intensively and extensively grazed pasturelands and formerly and presently fertilized meadows)—in southeastern Iceland. The results suggest that human-managed sites contain more total C and N but less WEOM per unit of total C or N than semi-natural habitats, except for wetlands. Wetlands exhibited the highest WEOM content. Extensive pasturelands and fertilized meadows are becoming more common in local ecosystems, highlighting the direction of changes in Icelandic grasslands management.

1. Introduction

Volcanic soils (Andosols), the dominant soil type in Iceland, store 5% of the global soil carbon (C) [1,2]. These soils are formed from volcanic ejecta, mainly tephra, and the process of rapid weathering forms ‘short-range-order’ clay minerals and ‘metal–humus complexes’ [3]. These new compounds play a crucial role in the stabilization of soil organic matter (SOM) by making the SOM less accessible to microbes [4]. Other factors, such as a cold climate, slow soil drainage, and aeolian/tephra soil surface deposits further improve SOM sequestration [3,5].
There has been a growing interest in better understanding water-extractable organic matter (WEOM) concentrations in the cold soils of the Arctic and subarctic regions (e.g., in Alaska [6,7,8] or Spitsbergen [9]), but little information exists about WEOM in cold volcanic soils, such as Iceland [10,11,12,13,14,15,16]. It is known that WEOM plays a key role in the transport of soil minerals formed through the processes of weathering and pedogenesis [17]. As a readily available C source for soil microbes, it has a positive feedback on the mineralization of SOM [6]. WEOM, which is often separated into water-extractable total nitrogen (WETN) and water-extractable organic carbon (WEOC), is the most mobile SOM fraction [18]. It comprises SOM fragments smaller than 0.45 μm in diameter and small-sized molecules that originate from organic matter deposition (for example, plants’ above- and belowground residues and root exudation); thus, it is an important indicator of soil quality [18,19]. WEOM is often sorbed on amorphous and weakly crystalline aluminum (Al) and iron (Fe) oxides and hydroxides, clay minerals, and goethite, such as those found in volcanic soils [20].
Icelandic grasslands store large amounts of SOM and are one of the few remaining semi-natural grassland habitats in Northern Europe [21]. Historically, they were established on formerly drained peatlands often augmented with animal manures and, nowadays, also with inorganic fertilizers. Over the past decades, high-latitude cold regions have been challenged by climate warming and land use pressures and, hence, SOM loss due to accelerated decomposition [9,22,23]. In Iceland, the rapidly increasing tourist industry requires more areas to be opened for livestock grazing [24]. Grasslands are used either for seasonal grazing or for hay production. Such a series of land management scenarios provides a unique opportunity to assess the relationship between land use and SOM, as under field conditions the net effect of management practices often remains unclear due to interactions and the counterbalancing of many properties. The main objective of this research was to compare stable and mobile forms of soil carbon and nitrogen across a variety of land use scenarios in comparison to native, undisturbed sites.

2. Materials and Methods
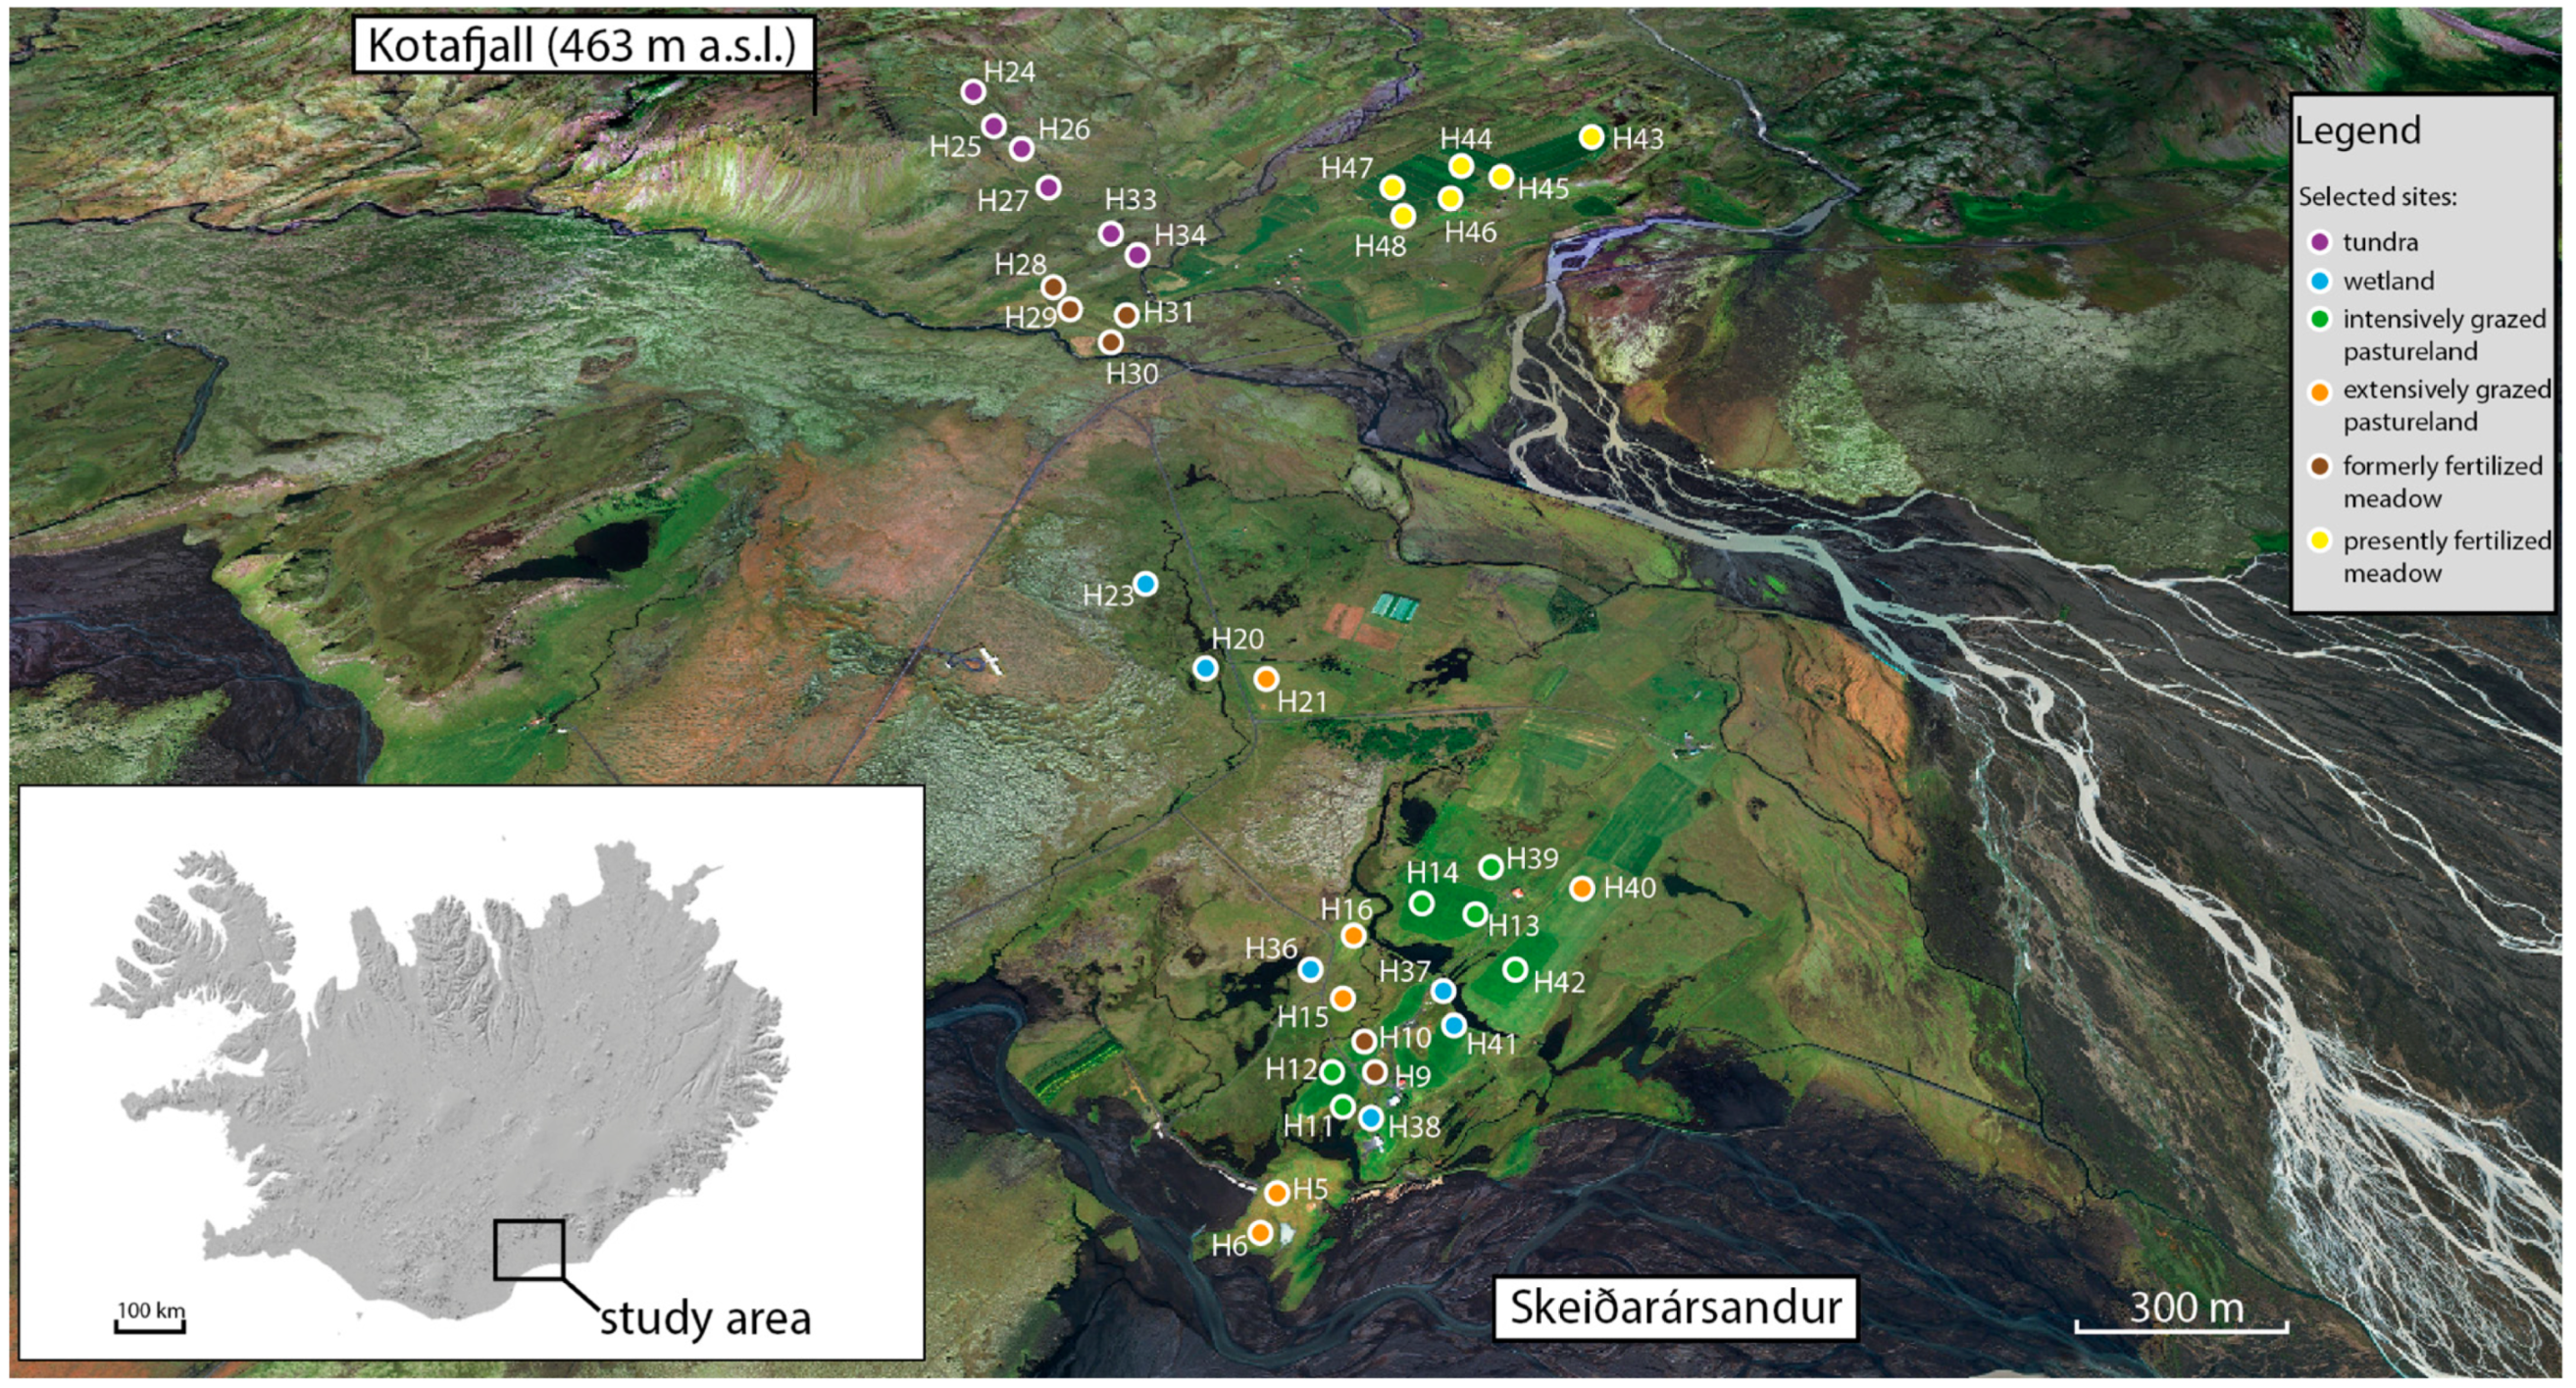
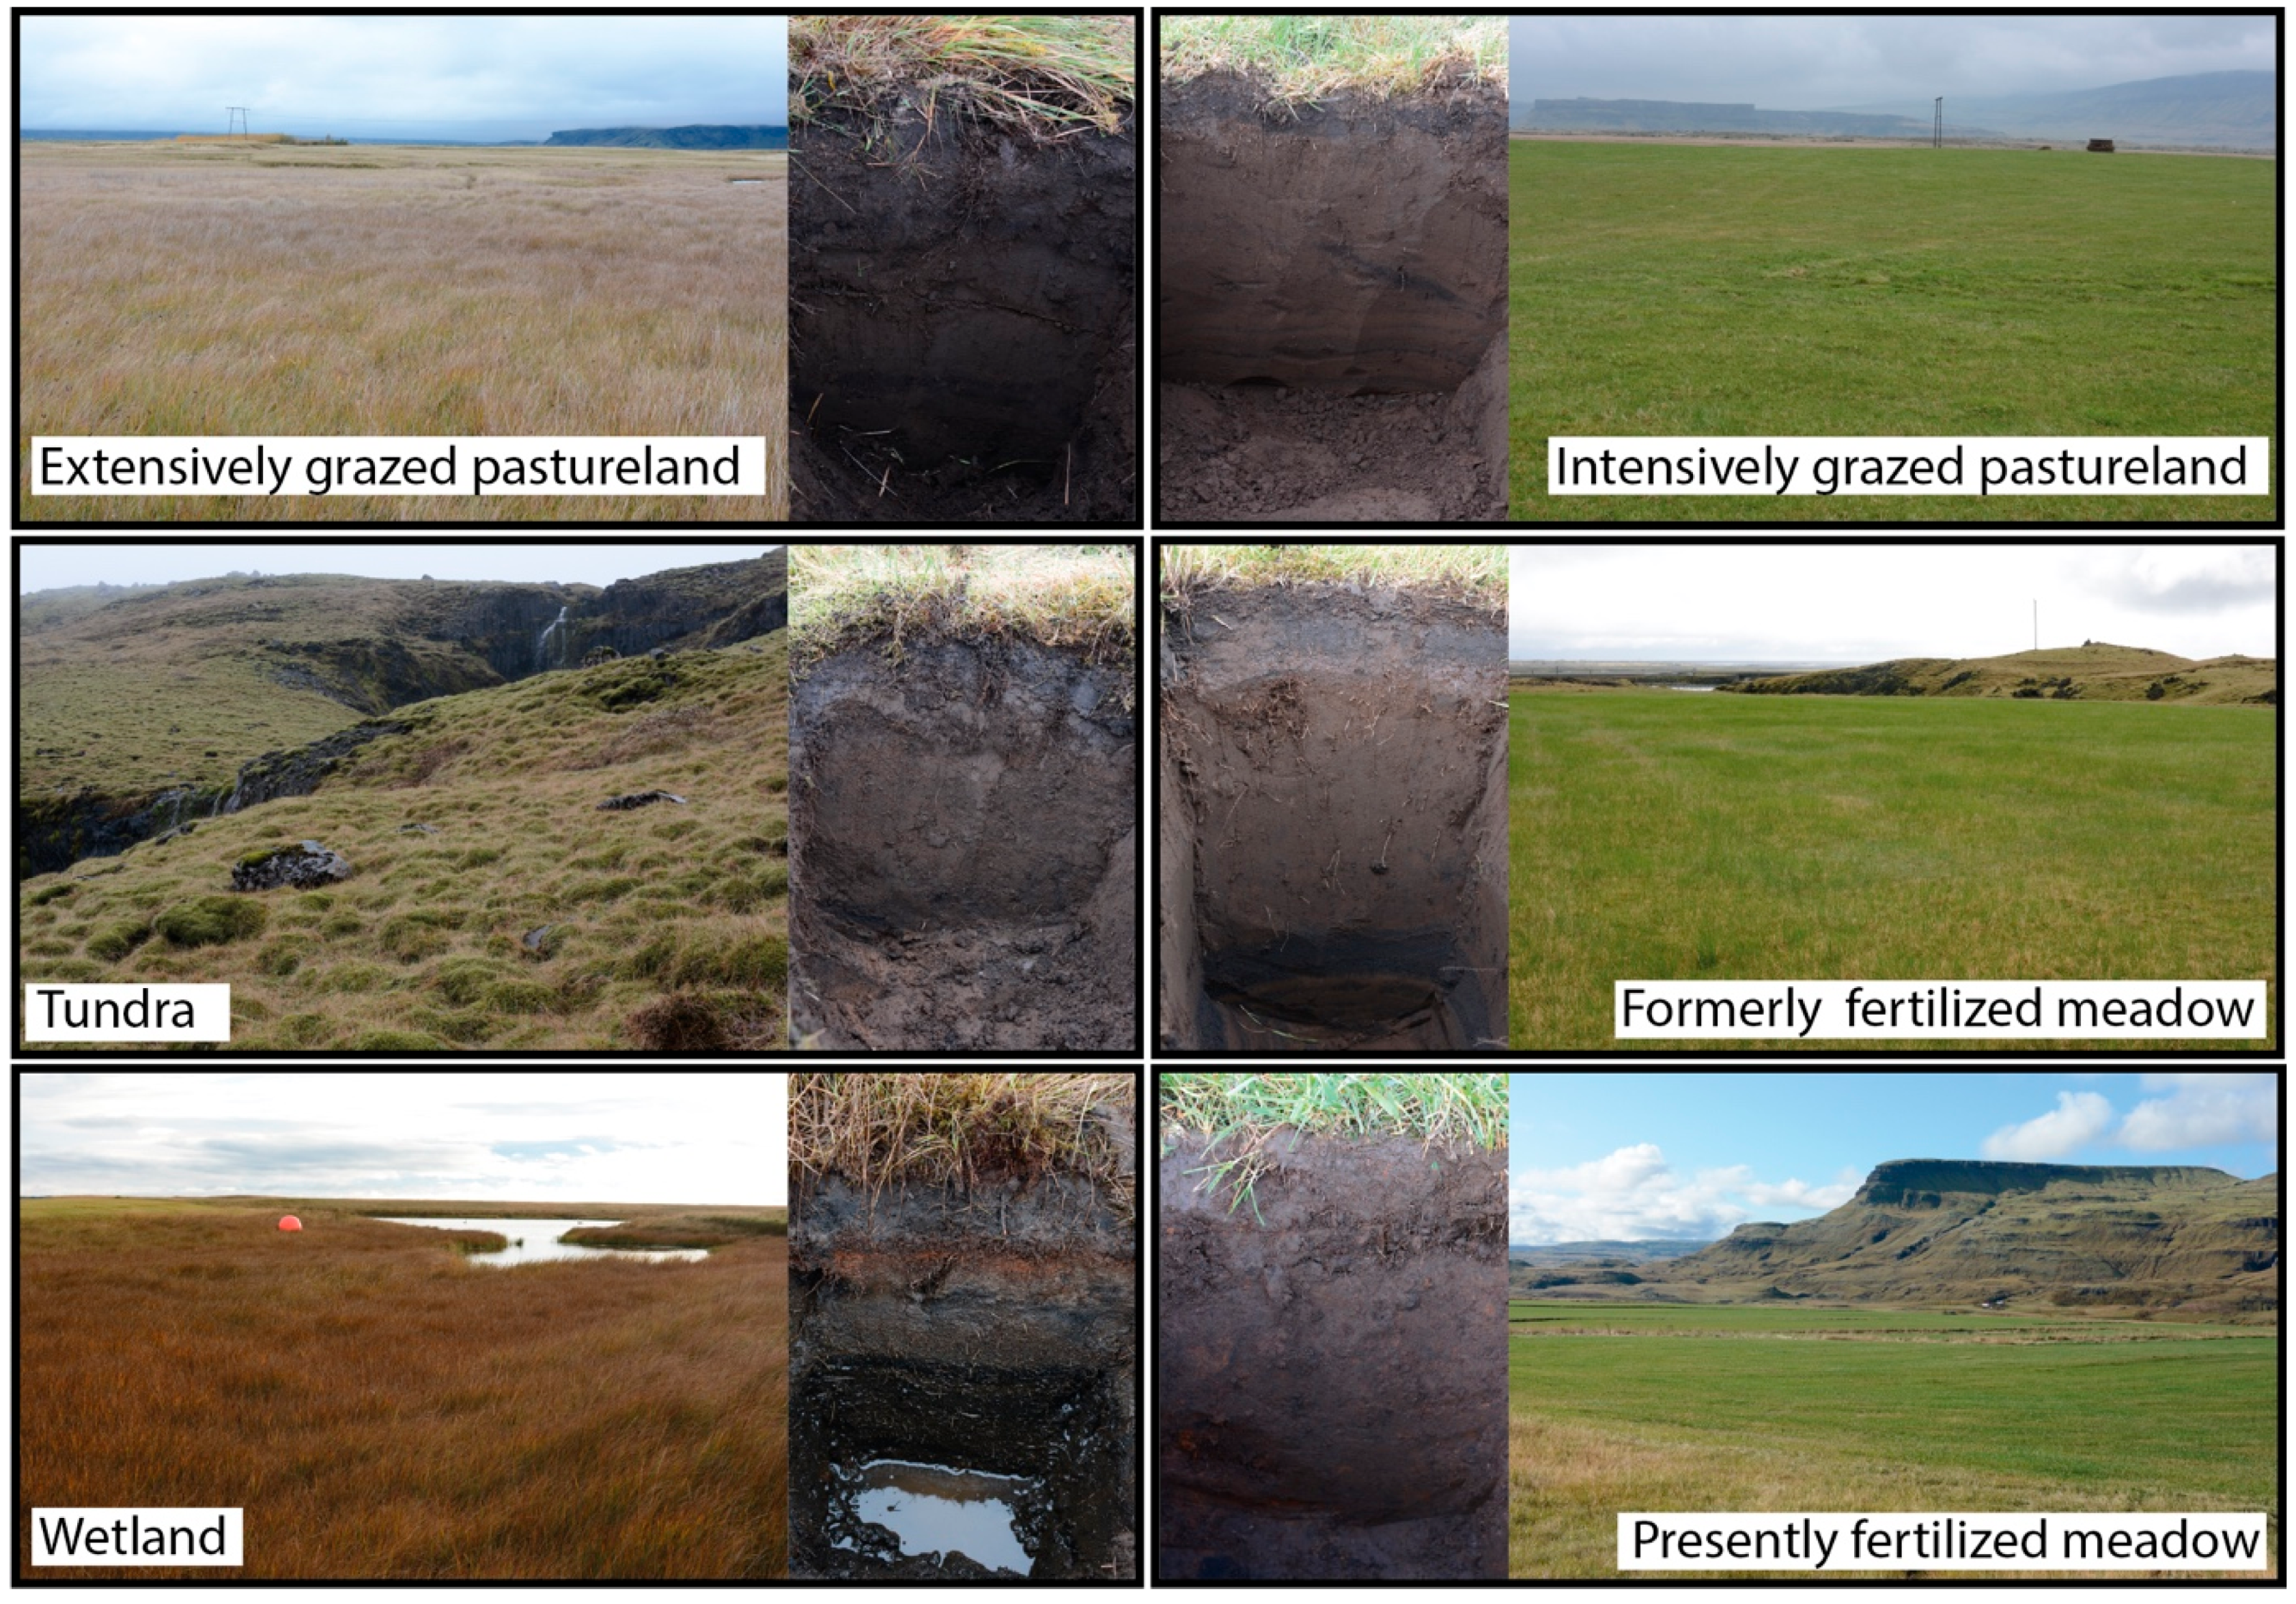
2.1. Study Area

The study area was established in southeastern Iceland, between Kotafjall and the Skeiðarársandur outwash plain within the Brunná and Djúpá watersheds southwest of the Vatnajökull ice cap (Figure 1). The northern area overlays an exposure of paleo-sea cliffs of Plio–Pleistocene ages, in Siða-Fljotshverfi District, composed of basaltic lava, hyaloclastite sediments, and diamictite [25,26]. The rest of the area constitutes the past sea bottom, southerly becoming a flat, vast outwash plain built of volcanic glass, palagonite block, and hydrothermally altered clasts [27,28]. The northern and central parts reveal post-glacial lava flows estimated for ca. 7–10 ka (Hannes Jónsson, personal communication). The sandur-lava field–wetland complex exhibits springs [29]. The soils developed from tephra (volcanic ash) and aeolian deposits [30]. Nearly all soils are classified as andosols [31]. The oldest tephra (H4, Hekla) was dated to 3.8 ka [32] and is considered to be a defining point of modern soil formation [32]. The climate is maritime with cool summers and mild winters [33]. The mean annual air temperature is 4.9 °C, and the mean annual precipitation is 1775 mm [30] (Kirkjubæjarklaustur Weather Station; Icelandic Meteorological office). The frost-free period is 158 days, starting on 4 May and ending on 9 October [34]. The vegetation comprises heathlands, bogs, and grasslands.
This area was selected for study due to the close proximity of various land uses to partially human-influenced habitats, henceforth referred to as ‘semi-natural’ habitats. All sites came with accurate historical information about fertilization provided by the landowners. According to Icelandic habitat-type classifications [35], the human-managed sites selected for this research belong to type L14.2 (isl. ‘Tún og akurlendi’), which is defined as follows: I. “Regularly or recently cultivated agricultural, horticultural and domestic habitats” (the European Nature Information System) [36]. The human-managed sites were named in accordance with the specific land use and natural habitat, which are as follows: (1) intensively grazed pastureland (IP), (2) extensively grazed pastureland (EP), (3) formerly fertilized meadow (FFM), (4) presently fertilized meadow (PFM), (5) tundra (TU), and (6) wetland (WE). More information on the study sites is provided in Table 1.

2.2. Field Sampling

At each site, six shallow soil pits (0–40 cm) were excavated, and soil samples were collected from 0 to 20 cm and 20 to 40 cm soil depths (Figure 2). Coarse fragments were field estimated, and bulk density was assessed on samples obtained by inserting steel cylinders at each soil depth. The soil samples were homogenized and placed in plastic bags for transportation to the lab. Under laboratory conditions, the samples were air-dried, ground up with pestle and mortar, and sieved through a 2 mm sieve. A total of 72 soil samples were obtained. The vegetation coverage and plant species at each site were collected from 4 m2 plots replicated three times (Table 1).

2.3. Laboratory Analyses

The soils were analyzed for the following indices: (1) organic carbon (Corg), (2) total nitrogen (Nt), (3) pH, (4) clay, (5) silicone (Sio), (6) iron (Feo), (7) bulk density and (8) WEOC, and (9) WETN. The Corg and Nt contents were measured by dry combustion in a Vario MACROcube (Elementar Analysensysteme GmbH, Langenselbold, Germany). Corg is a measure of the total C due to negligent to no inorganic C concentrations in the Icelandic soils [37]. The Corg and Nt stocks were calculated using the same equation, as follows:
Corg or Nt [Mg ha−1] = lCorg ⋅ BDl ⋅ (1 − cfl) ⋅ tl ⋅ 0.1
where the following definitions apply:
Corg or Nt (Mg ha−1)—soil organic carbon stock of a particular depth layer (l);
lCorg or Nt (mg g−1)—organic carbon content of the fine earth fraction (<2 mm);
BDl (g cm−3)—bulk density;
cfl—coarse fragments content;
tl—soil l thickness (cm);
0.1—conversion factor from mg cm−2 to Mg ha−1.
The soil pH was analyzed potentiometrically in water (1:5 v/v) (pH-meter, Mettler Toledo, Warsaw, Poland). The clay content was determined based on calculations for short-range-order clays (allophane and ferrihydrite) [30]. The allophane content was calculated as Siox × 5 [38], while the ferrihydrite content was as Feox × 1.7 [39]. Si and Fe were analyzed by ammonium oxalate extraction (according to Tamm [40] and Schwertmann [41]) using AAS-MP and ICP-MS, respectively. The bulk density was calculated by drying and weighing steel cylinders containing undisturbed soil material.
The WEOM extraction was performed using a modified method by He et al. [42]. And, specifically, extracts were obtained by adding 100 mL of MilliQ water (Millipore, Ultrapure Water System, Sigma-Aldrich, Saint Louis, MO, USA) to 10 g of soil (soil/solution ratio of 1:10) and placed for 30 min on a rotational shaker. Extracts were filtered using qualitative pure cellulose filters (MUNKTELL-FILTRAK GmbH, Niederschlag, Germany), and afterwards they were filtered through a 0.45 μm polyethersulphone (PES) membrane. The water-extractable organic carbon (WEOC) and water-extractable total nitrogen (WETN) concentrations were analyzed as the main constituents of the WEOM. The WEOC concentrations were determined by infrared detection of carbon dioxide (CO2), and the WETN concentrations were determined by chemiluminescence detection of nitrogen oxides (NOx) using an EnviroTOC analyzer (Elementar Analysensysteme GmbH, Langenselbold, Germany).

2.4. Statistical Analyses

The statistical program R (R Core Team, 2023) version 4.4.2 was used. One-way analysis of variance (ANOVA) was applied to compare the physical and chemical properties of the soils. Before the analysis of variance, its assumptions were checked. The Shapiro–Wilk normality test was used for checking whether the residuals were normally distributed. Bartlett’s terst for homogeneity of variances and the Durbin–Waston statistic for independence of error were employed. The Tukey HSD test was used for post hoc analyses, with a significance level of p ≤ 0.05. Principal component analysis (PCA) was carried out to identify the relationships among the variables and to visualize the differences among the soil samples from different locations. The PCA allowed the dimensionality of the dataset—describing the physical and chemical properties of the Icelandic soils—to be reduced, as well as the main components explaining the variability in the observed characteristics to be identified. The PCA was conducted in the R (4.4.2) environment using the prcomp() function, with prior centering and standardization of the variables. Before applying the PCA, its assumptions were verified through a correlation matrix, Bartlett’s test of sphericity, and the Kaiser–Meyer–Olkin criterion. The number of significant components was determined by the scree plot criterion. All results in further sections are the averaged values from the n of six replicates.

3. Results

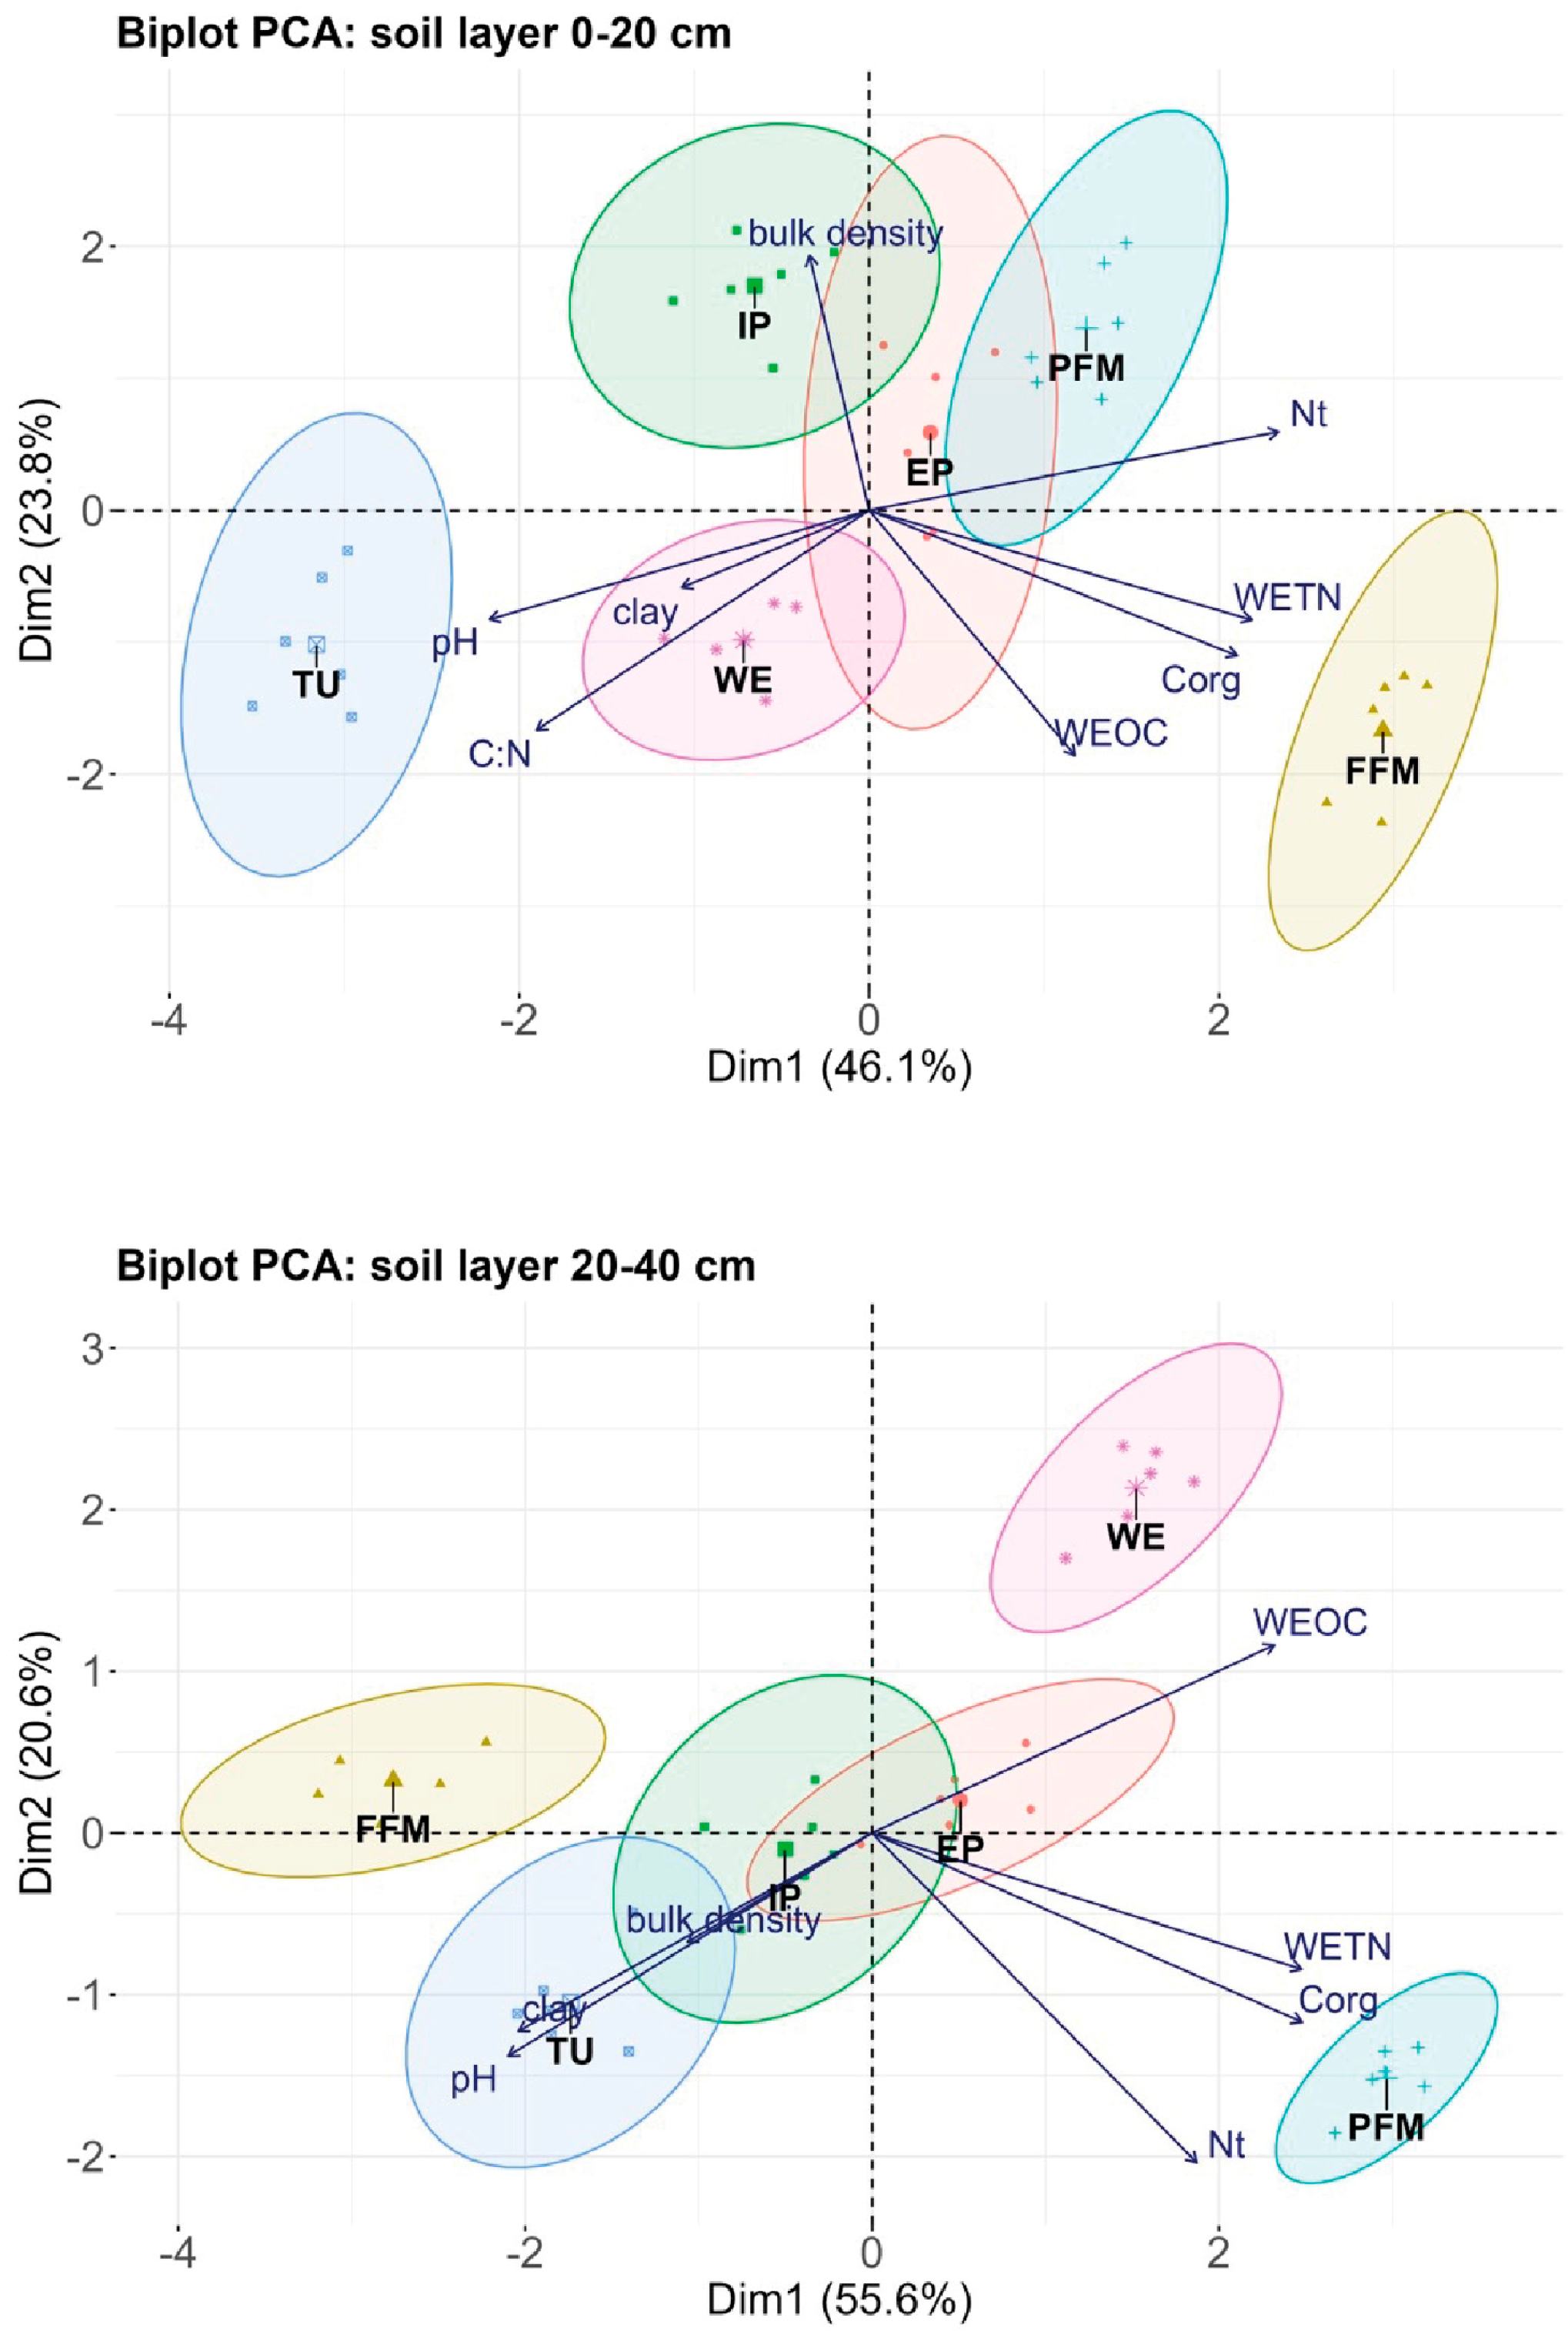
3.1. Texture, Bulk Density, and pH
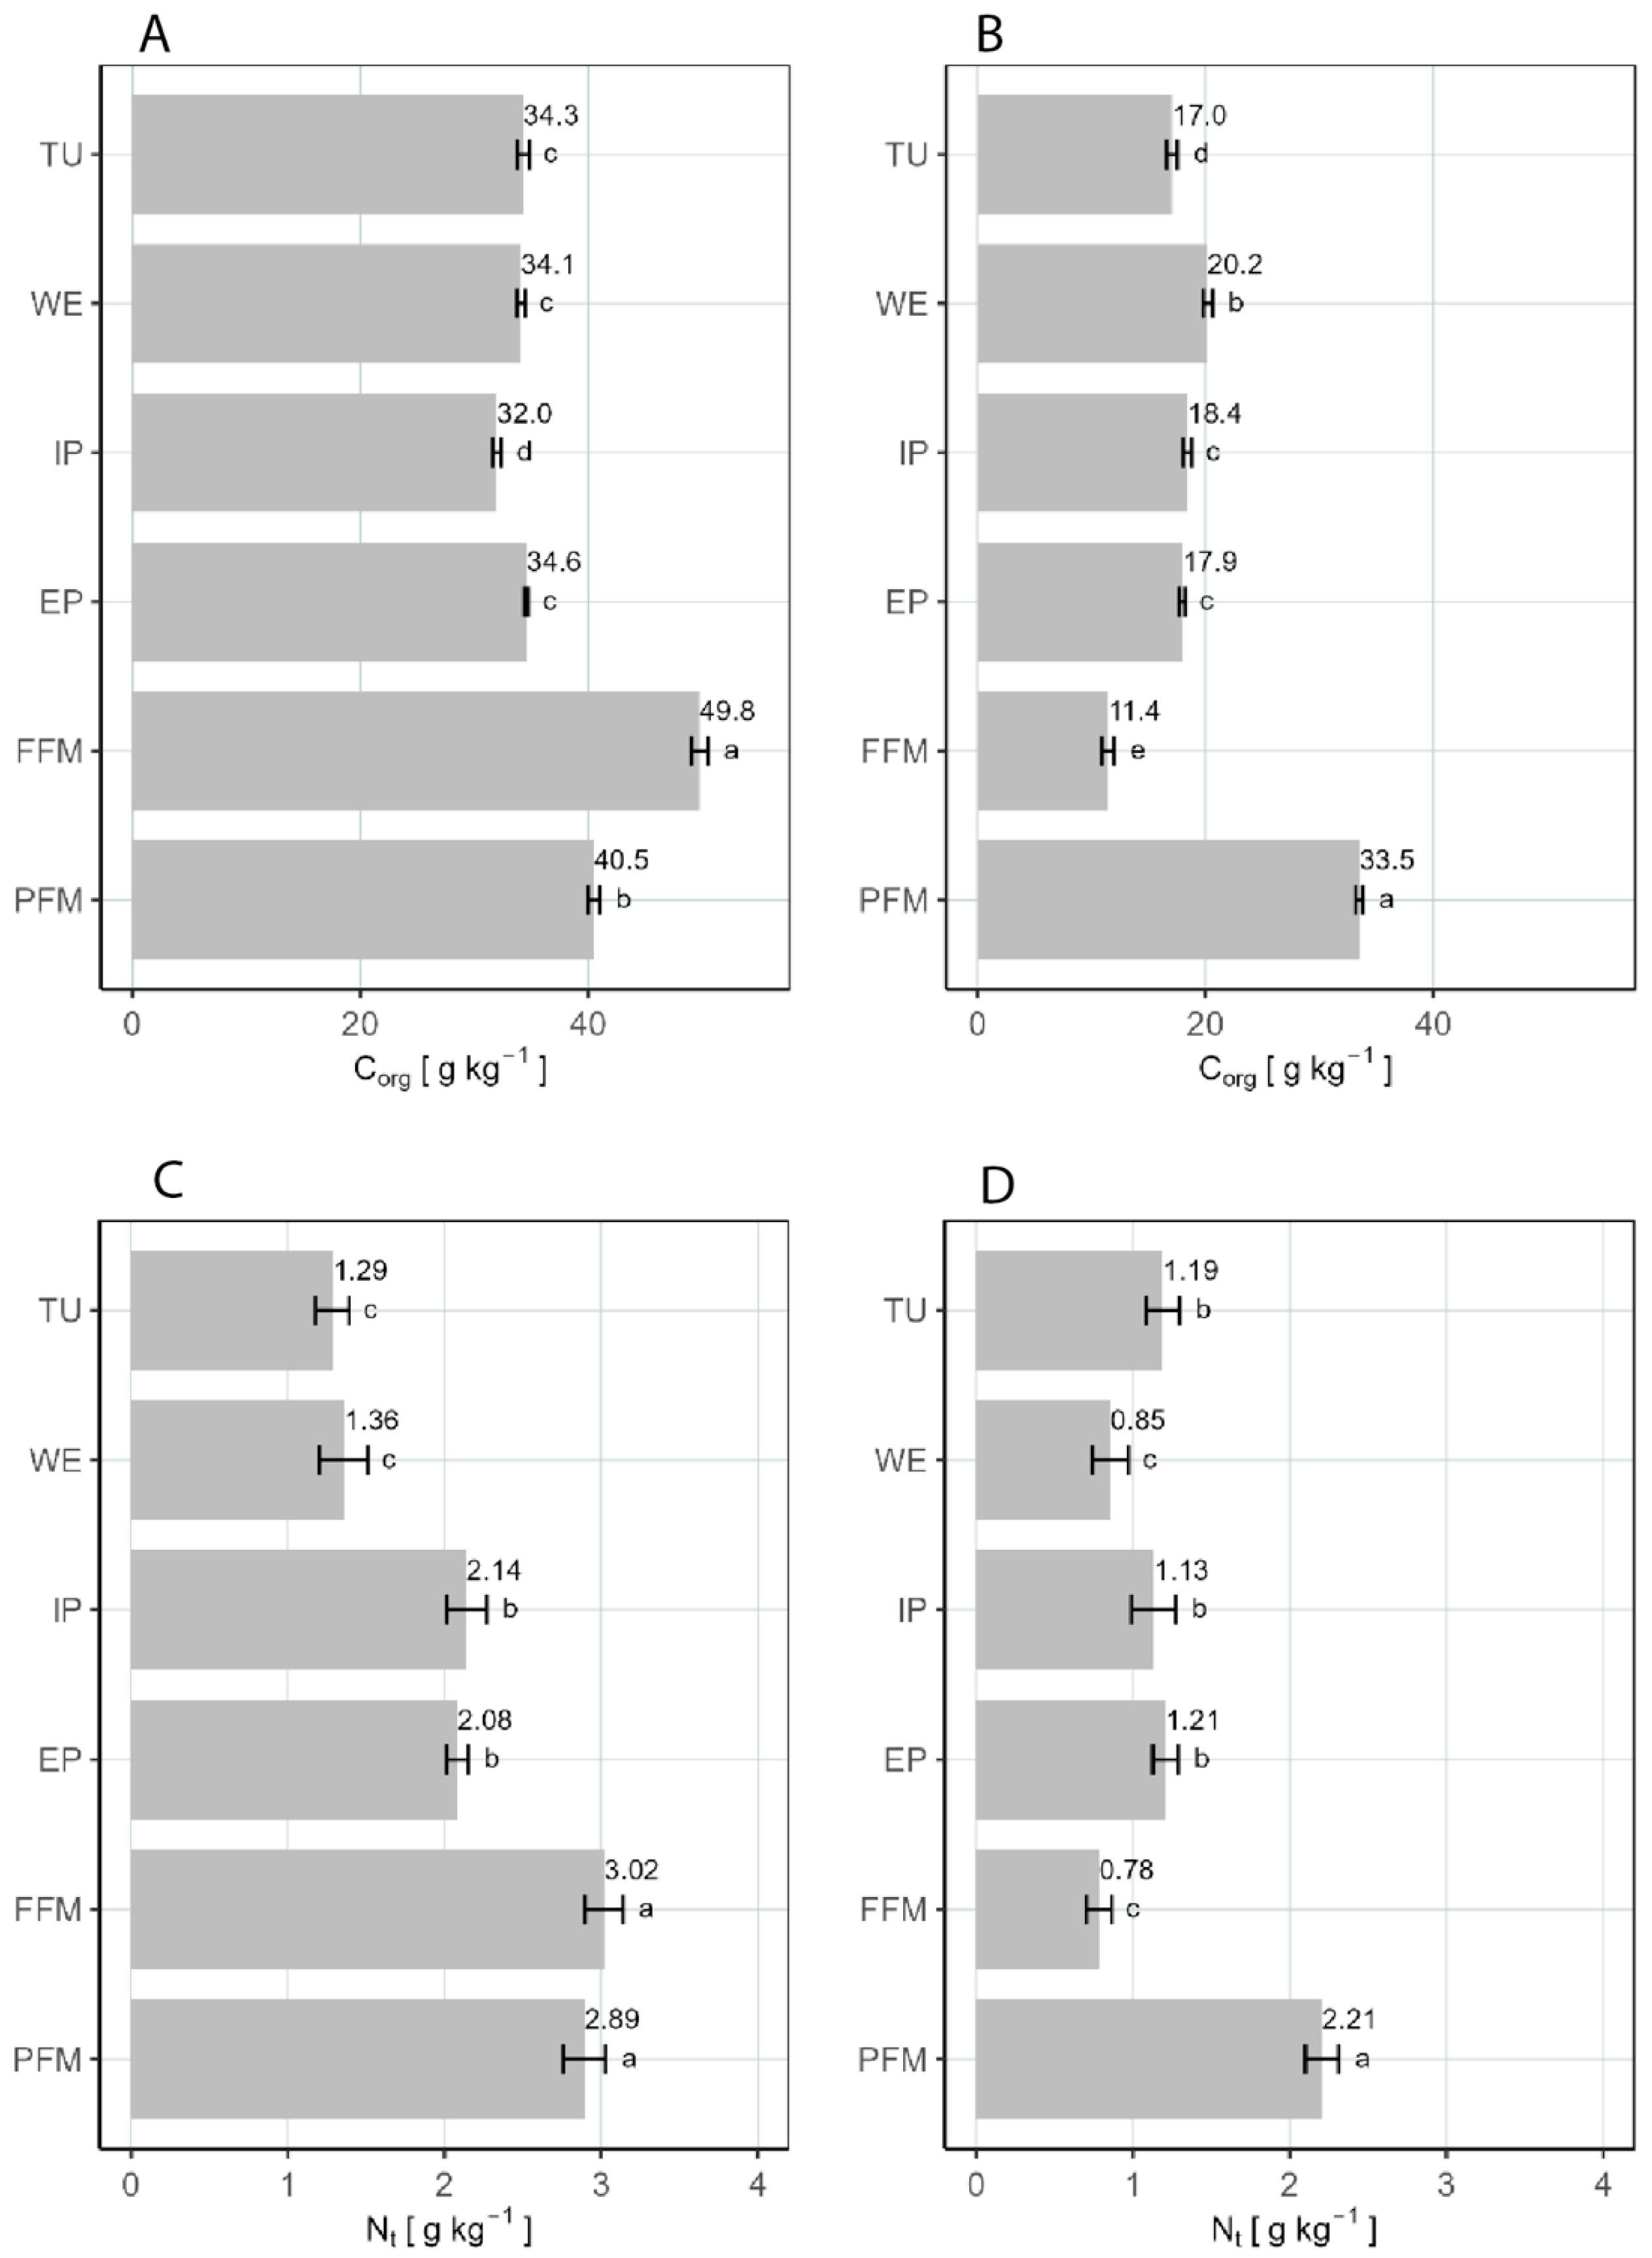
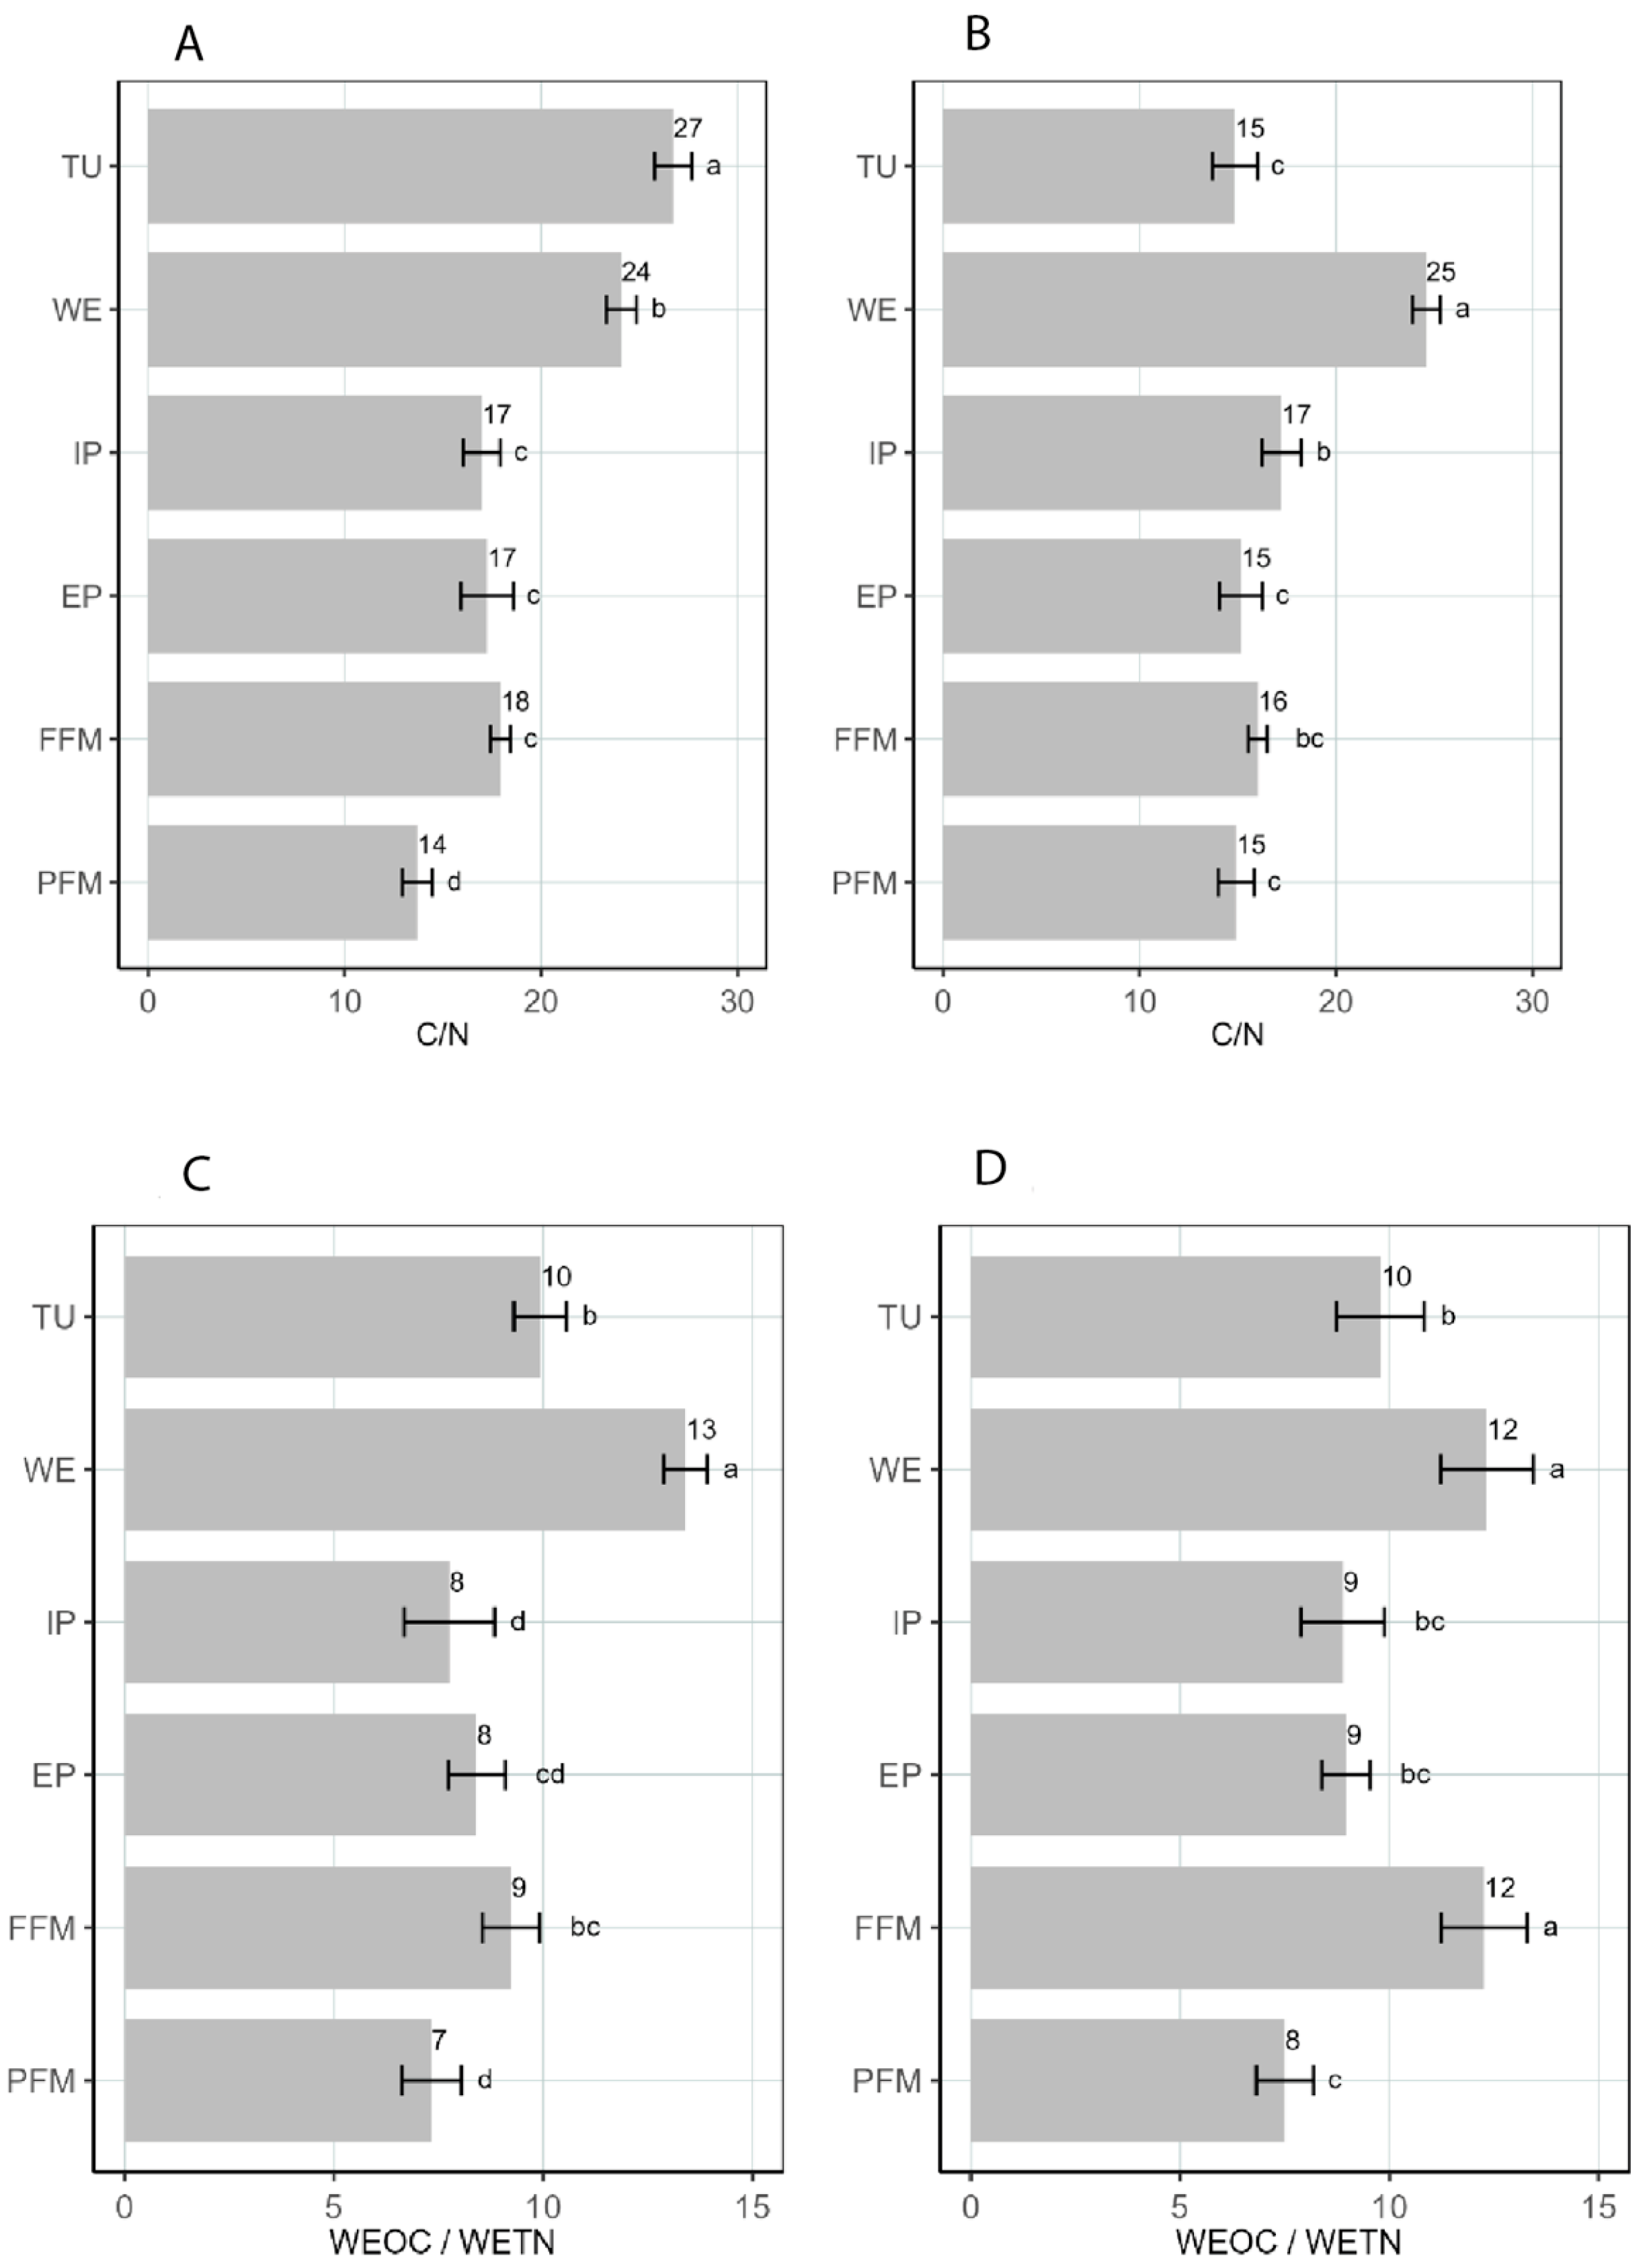
Coarse fragments greater than 2 mm were absent in most soils at all depths, except for TU soils, where they averaged 25% in the subsoil only. The TU soils also had the highest clay contents at both depths, which amounted to 14.1% and 16.3%, respectively. The clay content in the topsoil was below 10% for the remaining sites. The subsoils in the FFM and EP had higher clay contents compared to other sites (Supplementary Table S2). The pH values ranged from 5.97 to 6.33 in the topsoil and from 5.91 to 6.90 in the subsoil (Supplementary Table S2). Overall, the pH was lower in the human-managed areas than in the semi-natural sites, except for WE. The bulk density fluctuated between the sites and depth. Soils in the IP and EP sites had the highest topsoil bulk densities. The subsoil of the IP, together with the FFM and PFM, was denser than the other sites (Table 1).

3.2. Organic Matter

The total organic C ranged from 32.0 g kg−1 to 49.8 g kg−1 in the topsoil and from 11.4 g kg−1 to 33.5 g kg−1 in the subsoil (Figure 3). The values for the topsoil were the highest in the FFM and PFM and the lowest in the IP. The sharpest decline in Corg was observed in the FFM’s subsoil. The SOC was negatively correlated with the bulk density, and no relationship with the clay content was observed (Supplementary Figure S8). The carbon stock arrangement was similar to the SOC pattern. The highest Corg stocks were in the FFM’s topsoil (82.6 Mg ha−1) and subsoil (65.9 Mg ha−1). The Corg stocks in the FFM and TU exhibited the largest differences between depth layers (Supplementary Figure S1).
The total N content (Figure 3) and Nt stocks (Supplementary Figure S3) in the topsoil followed a consistent pattern with clear differences between semi-natural and human-managed sites in the following order: fertilized > non-fertilized grazed > semi-natural. The relationship to land use was also confirmed by the close dependence on pH (statistically significant: −0.71). Comparing both of the depths in terms of Nt stocks, half sites had more than 70% of the topsoil’s Nt stock in the subsoil (Supplementary Figure S4).

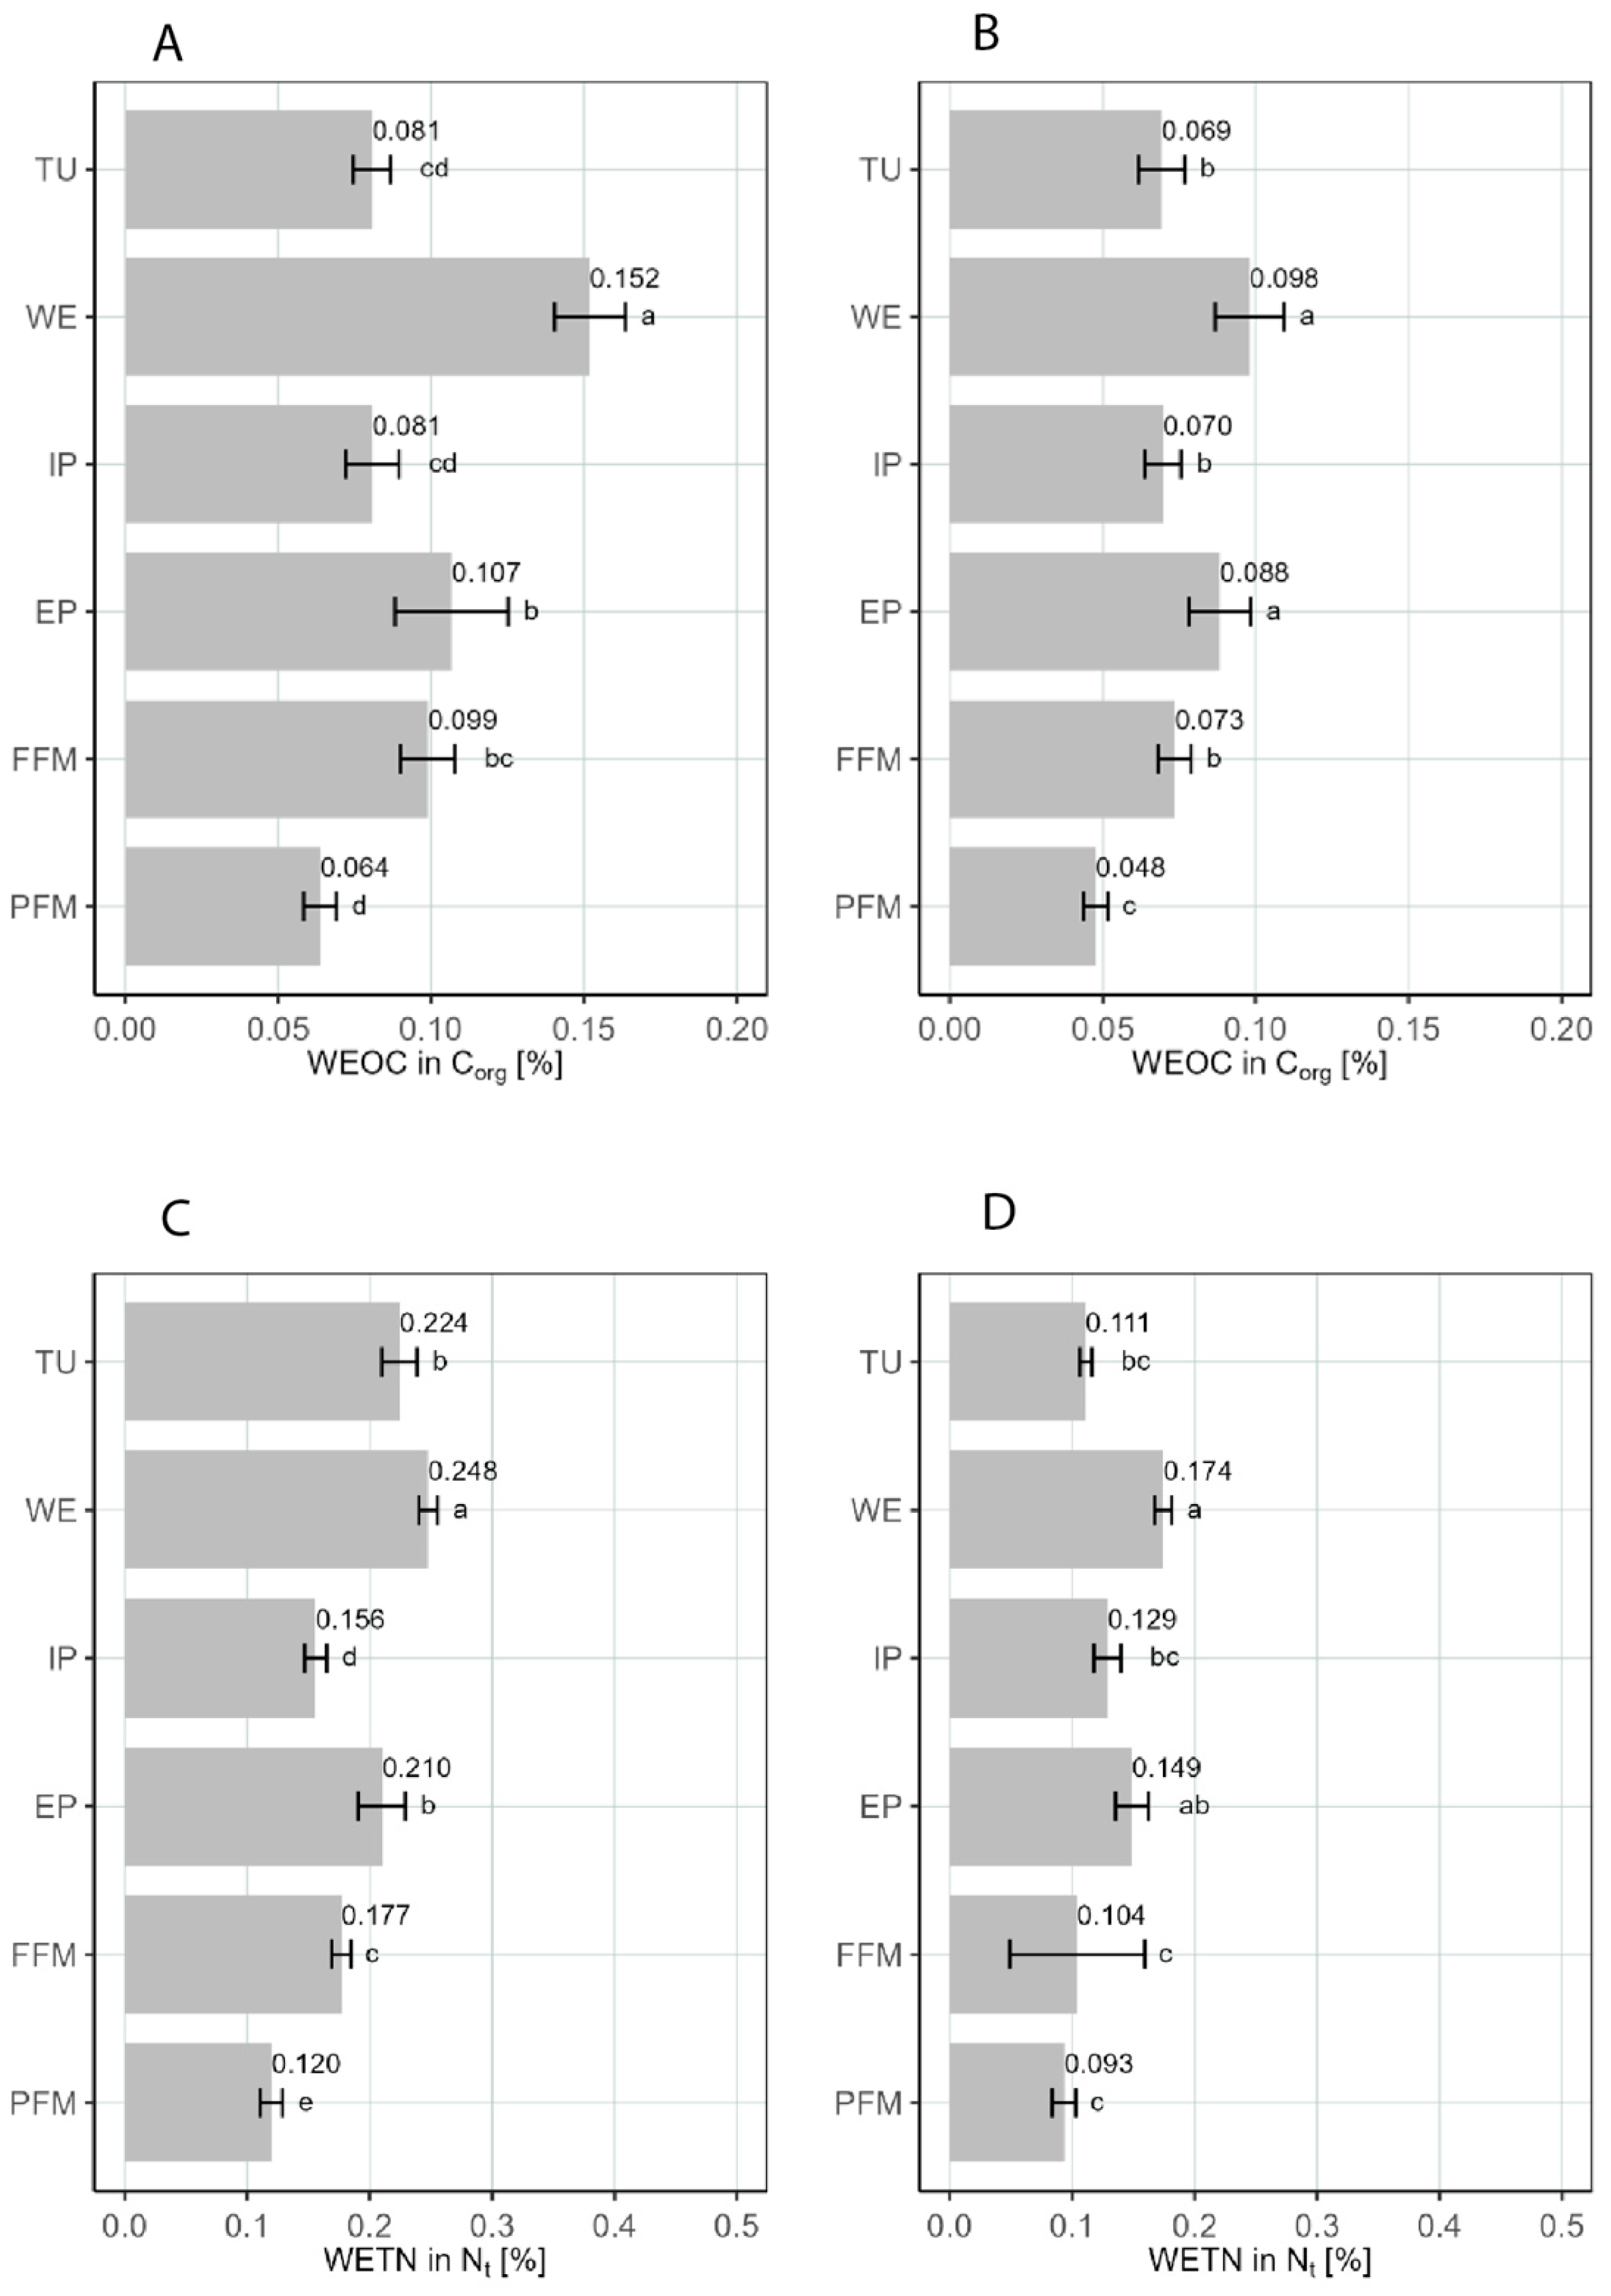
3.3. Water-Extractable Organic Matter

In the topsoil, FFM and WE exhibited the highest WEOC content (46.3 mg kg−1 and 44.5 mg kg−1, respectively). In the subsoil, the contents of WEOC were reduced by 50%. The sharpest WEOC decline was observed in the FFM. The stocks of WEOC were the highest in the PFM.
The highest WETN content was found in the FFM (topsoil) and PFM (subsoil), while the EP came in second place, supporting the data on nitrogen fertilization and its role in N cycling. The WETN stocks accumulated efficiently under extensive land use (EP sites). Within the analyzed sites, the WEOM constituted a very low part of the SOM (Figure 4).
The WEOC/WETN ratios followed a different pattern than the C/N ratios (Figure 5). It ranged from 7 to 13 in the topsoil and from 7 to 12 in the subsoil, distributing similarly across both depths. The WE displayed the highest WEOC/WETN ratio for both depths, while for the FFM it was only in the subsoil, exhibiting relatively low values in the topsoil.

4. Discussion

A few studies have reported on WEOM in Icelandic soils; however, most of them focus on organically and conventionally managed farms [11] or fertilized and unfertilized grazing fields [10]. The Corg stocks reported in those studies for the topsoil (11.8 kg ha−1 to 65.2 kg ha−1) correspond very well with our results. As such, our three selected sites—WE, FFM, and EP—fit well within the range of C values, which is still much lower compared with the high levels found in hay meadows in the US [43]. The human-managed sites reflect fertilization and grazing. It should be noted that in Iceland nitrogen is the most limiting nutrient for land reclamation and agriculture. Therefore, fertilizers are widely used in fields for hay production [30]. The fertilizer application rates vary from 100 to 140 kg ha−1, and farmers also apply additional animal manure [44]. The fertilized sites (FFM and PFM) had a significantly higher Nt content in the topsoil (in the subsoil, only PFM). It was similar in the case of Corg, but the PFM had a markedly lower content compared with the FFM. A similar pattern was reflected in the Corg and Nt stock diagrams. Thorhallsdottir and Gudmundsson [45] observed that the highest Corg was present in intensively grazed sites, while the lowest Corg values were measured in non-grazed grasslands (both unfertilized). This is different from the results in our study, where the IP and EP did not show significant differences in Corg contents at both depths. Mowing practices and livestock trampling caused the higher bulk densities of the EP and IP, which may lead to overestimation of the C and N stocks [46]. However, they are also responsible for destruction of the soil structure (aggregates) and exposure of the soil organic matter to decomposition processes [47]. The PCA diagrams (Figure 6) distinguished the PFM, based on the Nt, which confirms its recent fertilization, and the FFM based on the WETN, WEOC, and Corg, highlighting the longevity of carbon and nitrogen. According to information obtained from local farmers, the soil at the FFM sites has been used as a hay meadow for several decades (since the 1960s). It has been fertilized with liquid manure and mineral fertilizers. In recent years, some of the mown vegetation has been left in place, which may have increased the stocks of organic matter. Soil tillage ceased approximately 50 years ago. However, the very high disproportion between the topsoil’s and subsoil’s WEOC, WETN, Corg, and Nt contents may be related to the extreme quantities of applied fertilizer and/or its recent application combined with high fertilizer retention in the topsoil, supported by allophane–imogolite-like phases. The other explanation for the higher Nt and WETN contents in the PFM is the effect of drainage, which supports N retention. Changing its management to grazing may also speed up the N circulation.
Although the EP sites are in limited use nowadays (sporadically grazed and mown), they revealed high concentrations of WEOC and WETN, even exceeding fertilized sites in some cases. High contents of WEOC and WETN were found, probably due to the regular supply of plant residues occurring naturally, as well as the occasional mowing and leaving of residues, on the soil surface. In the case of the WEOC and WETN stocks, the EP’s and FFM’s topsoil showed the highest and almost the same values (among the human-managed sites), which may indicate a similar type of vegetation, a higher biodiversity than in the presently used grasslands, and the impact of plant remnants on the stocks [18]. Additionally, fresh plant inputs in the mineral soils of the Arctic regions play a more important role in Corg accumulation than the low mineralization rates themselves [48]. EP, which is characterized by the most diversified vegetation among the other human-managed areas, stands as a buffer between tundra and intensive pastureland, as confirmed by its location in the PCA diagram (Figure 6). The high WEOM values reflect a slow and stable decomposition of the labile forms. Therefore, we may assume that the long-term changes in the WEOM content at the EP sites are driven by the effects of plant remains and vegetation type rather than management practices [49]. This is an extremely important finding, as extensive pastureland has been the prevailing type of land use. Therefore, its role in the sequestration of organic carbon and nitrogen will grow. Although many studies (e.g., Thorhallsdottir and Gudmundsson, 2022 [45]) prove that grazing maintains or even increases C storage, our study shows that extensive use has a stronger impact on the longevity of SOC in soils.
The saturated soil conditions are common in Icelandic ecosystems. Approximately 45% of the Icelandic cultivated land in use consists of drained wetlands, with around 90% of it being grasslands [50]. The PFM’s subsoil showed the highest values for the WEOC and WETN stocks. This area consists of peat bogs that were drained during the 1960s and 1970s. It is now intensively fertilized (twice a year with both liquid manure and mineral fertilizers) and used for hay production and as fodder meadows. This area also exhibited the smallest proportion of all tested organic compounds between the two analyzed depths. It is known that organic fertilization affects the growth of WEOM in soil, which is attributed to the soluble substances contained in these fertilizers [49]. For instance, in the WE, high stocks of WETN are strictly connected with the long-term accumulation of organic matter under anaerobic conditions [51]. Wetlands always start with a higher budget of carbon, and slow biological degradation of WETN in such water-saturated soils is expected. The selected WE sites were not drained; however, they revealed the highest WEOC concentrations among all sites. Partially, this could be attributed to a short dry period, leading to intensification of the organic matter mineralization [52], as well as to the limited sorption and desorption processes from the peat material [53], with a large input of tephra, which result in fast exportation of the labile forms by flowing streams, cutting local wetlands.
In Icelandic soils (andosols or soils with andic properties), Corg stocks vary from 150 t ha−1 to 800 t ha−1 [30]. However, the soils investigated in this study exhibited, at most, an average of 83 t ha−1 (FFM). This is likely due to their location near the Skeiðarársandur outwash plain, where very intense winds are responsible for the high input of aeolian material poor in organic materials, but partly also due to the transportation of post-flood sediments and eroded materials from the highlands. Additionally, the eruption of the Grímsvötn volcano, in 2011, had a great impact on the studied area, as the uppermost ca. 5 cm of the soil usually still consists mainly of basaltic ash from the eruption. The incorporation of fresh volcanic tephra into the topsoil of organic or mineral soils always results in a strong dilution of the organic matter content [54]. Icelandic farmers improve soil conditions after volcanic eruptions by mixing ash with soil and adding manure, reducing the recovery time from decades to weeks [55]. In the case of our sites, ploughing was performed mostly on the PFM sites after the Grímsvötn eruption. In general, Iceland experiences a very high activity of aeolian processes (with both volcanic ash and eroded soil material involved), not only in the southeast part but also widely in the highlands located in the central part of the country; thus, we assume that the results presented in this study may extend to a larger part of Iceland.
Arctic soils contain significant amounts of labile forms of SOM [48]. The values of the WEOC in this study, however, were much lower than those in similar studies from other comparable regions, which may be attributed to the strong and irreversible WEOC sorption to metal–humus complexes, goethite, or clay minerals (like allophane or imogolite) and, thus, stabilization in the volcanic soil environment. For example, Szymański [9] observed up to 8% WEOC in Corg at 0–10 cm in tundra soils on Spitsbergen. The highest values were found in wet moss and ornithocoprophilous tundra vegetation, with lower values in the lichen-heath and polygonal tundra vegetation types. The same study showed 1.5% WETN in Nt, which is notably higher than in our study but less vast than in the case of the WEOC and Corg relationship. Typically, WETN accounts for approximately 0.75% of soil Nt [56].

5. Conclusions

Regular manure application in Iceland enhances soil fertility; however, long-term fertilization may lead to the accumulation of excess N in soil. When the soil’s N retention capacity is reached, it may leach into the environment [57], which may be exacerbated by climate change. It has also been proven that climate warming is impacting soil Corg stocks’ decrease, predominantly by enhancing soil microbial activity [58]. Therefore, farmers’ awareness of how to carry out sustainable farming is very important. Our study proves that human-managed sites contain more total C and N but less WEOM per unit of total C or N than semi-natural habitats (except for wetlands). It is predicted that Nordic countries, in the face of climate change, will experience temperature increases more strongly in winter than in summer and more precipitation in the form of rain [59]. With the parallel increase in extensive rangeland areas, as well as C and N stocks, it is crucial to monitor the pathways of organic matter decomposition and greenhouse gas emissions in subarctic volcanic soils.

Supplementary Materials

The following supporting information can be downloaded at: https://www.mdpi.com/article/10.3390/agriculture15121255/s1, Table S1. Habitat types classification of the chosen research areas. Table S2. Soil physical and chemical characteristics across the eight analyzed sites at 0–20 cm and 20–40 cm depths (values indicated by the same letter are not significantly different (α = 0.05). Stocks of Corg [Mg ha−1] in 0–20 cm (A) and 20–40 cm (B) in each of the six analyzed sites (TU tundra, WE wetland, IP intensive pastureland, EP extensive pastureland, FFM formerly fertilized meadow, PFM presently fertilized meadow). Values indicated by the same letter are not significantly different (α = 0.05). Figure S2. Stocks of Corg in subsoil (20–40 cm) compared to the ones in topsoil (0–20 cm) [%] in each of the six analyzed sites (TU tundra, WE wetland, IP intensively grazed pastureland, EP extensively grazed pastureland, FFM formerly fertilized meadow, PFM presently fertilized meadow). Values indicated by the same letter are not significantly different (α = 0.05). Figure S3. Stocks of Nt [Mg ha−1] in 0-20 cm (A) and 20–40 cm (B) in each of the six analyzed sites (TU tundra, WE wetland, intensively grazed pastureland, EP extensively grazed pastureland, FFM formerly fertilized meadow, PFM presently fertilized meadow). Values indicated by the same letter are not significantly different (α = 0.05). Figure S4. Mean Nt pools in subsoil (20–40 cm) compared to the ones in topsoil (0–20 cm) [%] in each of the six analyzed sites (TU tundra, WE wetland, intensively grazed pastureland, EP extensively grazed pastureland, FFM formerly fertilized meadow, PFM presently fertilized meadow). Values indicated by the same letter are not significantly different (α = 0.05). Figure S5. Content of WEOC [mg kg−1] in 0–20 cm (A) and 20–40 cm (B) in each of the six analyzed sites (TU tundra, WE wetland, IP intensively grazed pastureland, EP extensively grazed pastureland, FFM formerly fertilized meadow, PFM presently fertilized meadow). Values indicated by the same letter are not significantly different (α = 0.05). Figure S6. Content of WETN [mg kg−1] in 0–20 cm (A) and 20–40 cm (B) in each of the six analyzed sites (TU tundra, WE wetland, IP intensively grazed pastureland, EP extensively grazed pastureland, FFM formerly fertilized meadow, PFM presently fertilized meadow). Values indicated by the same letter are not significantly different (α = 0.05). Figure S7. The WEOC (I) and WETN (II) stocks [kg ha−1] in 0–20 cm (A, C) and 20–40 cm (B, D) in each of the six analyzed sites (TU tundra, WE wetland, IP intensive pastureland, EP extensive pastureland, FFM formerly fertilized meadow, PFM presently fertilized meadow). Values indicated by the same letter are not significantly different (α = 0.05). Figure S8. Pearson correlation coefficient between selected soil properties from the 0–20 cm (A) and 20–40 cm (B) (n = 48 for each depth).

Author Contributions

A.K. and J.W. acquired the funding, performed the fieldwork, collected and prepared the samples, conducted the analyses, analyzed and interpreted the results, and designed the figures. A.K. wrote the original draft and prepared the final manuscript. J.W. designed and coordinated the study, contributed to the writing of the original draft, reviewed and edited the manuscript, and provided supervision. G.K. carried out the statistical analyses, designed the figures, and contributed to the writing of the manuscript. U.N., J.G. and A.M.-J. reviewed and edited the manuscript. U.N. contributed to the results’ analysis. C.M.M. analyzed the vegetation and reviewed and edited the manuscript. S.J. contributed to conducting the analyses. All authors have read and agreed to the published version of the manuscript.

Funding

This study was financed by the National Science Center (Poland), project nr. 2020/39/B/ST10/02971 and 2021/41/N/ST10/01990.

Data Availability Statement

The original contributions presented in the study are included in the article; further inquiries can be directed to the corresponding author.

Acknowledgments

The authors are grateful to Hannes Jónsson for enabling the fieldwork and for his invaluable support and help in obtaining information about the area. We would also like to thank all Icelandic landowners who gave their permission to conduct research on their properties and shared information about their fields.

Conflicts of Interest

The authors declare no conflicts of interest.

Abbreviations

The following abbreviations are used in this manuscript:
WEOMWater-extractable organic matter
TUTundra
WEWetland
IPIntensively grazed pastureland
EPExtensively grazed pastureland
FFMFormerly fertilized meadow
PFMPresently fertilized meadow
WEOCWater-extractable organic carbon
WETNWater-extractable total nitrogen

References

  1. Eswaran, H.; Van Den Berg, E.; Reich, P. Organic Carbon in Soils of the World. Soil Sci. Soc. Am. J. 1993, 57, 192–194. [Google Scholar] [CrossRef]
  2. Matus, F.; Rumpel, C.; Neculman, R.; Panichini, M.; Mora, M.L. Soil Carbon Storage and Stabilisation in Andic Soils: A Review. Catena 2014, 120, 102–110. [Google Scholar] [CrossRef]
  3. Dahlgren, R.A.; Saigusa, M.; Ugolini, F.C. The Nature, Properties and Management of Volcanic Soils. Adv. Agron. 2004, 82, 113–182. [Google Scholar] [CrossRef]
  4. Arnalds, O. Volcanic Soils of Iceland. Catena 2004, 56, 3–20. [Google Scholar] [CrossRef]
  5. Tonneijck, F.H.; Jansen, B.; Nierop, K.G.J.; Verstraten, J.M.; Sevink, J.; De Lange, L. Towards Understanding of Carbon Stocks and Stabilization in Volcanic Ash Soils in Natural Andean Ecosystems of Northern Ecuador. Eur. J. Soil Sci. 2010, 61, 392–405. [Google Scholar] [CrossRef]
  6. Herndon, E.M.; Mann, B.F.; Roy Chowdhury, T.; Yang, Z.; Wullschleger, S.D.; Graham, D.; Liang, L.; Gu, B. Pathways of Anaerobic Organic Matter Decomposition in Tundra Soils from Barrow, Alaska. J. Geophys. Res. G Biogeosci. 2015, 120, 2345–2359. [Google Scholar] [CrossRef]
  7. Shibata, H.; Petrone, K.C.; Hinzman, L.D.; Boone, R.D. Effect of Fire on Dissolved Organic Carbon and Inorganic Solutes in Spruce Forest in the Permafrost Region of Interior Alaska. Soil Sci. Plant Nutr. 2003, 49, 25–29. [Google Scholar] [CrossRef]
  8. Zhao, A.; Zhang, M.; He, Z. Spectroscopic Characteristics and Biodegradability of Cold and Hot Water-Extractable Soil Organic Matter under Different Land Uses in Subarctic Alaska. Commun. Soil Sci. Plant Anal. 2013, 44, 3030–3048. [Google Scholar] [CrossRef]
  9. Szymański, W. Quantity and Chemistry of Water-Extractable Organic Matter in Surface Horizons of Arctic Soils under Different Types of Tundra Vegetation—A Case Study from the Fuglebergsletta Coastal Plain (SW Spitsbergen). Geoderma 2017, 305, 30–39. [Google Scholar] [CrossRef]
  10. Lehtinen, T.; Gísladóttir, G.; Lair, G.J.; van Leeuwen, J.P.; Blum, W.E.H.; Bloem, J.; Steffens, M.; Ragnarsdóttir, K.V. Aggregation and Organic Matter in Subarctic Andosols under Different Grassland Management. Acta Agric. Scand. Sect. B Soil Plant Sci. 2015, 65, 246–263. [Google Scholar] [CrossRef]
  11. Van Leeuwen, J.P.; Lehtinen, T.; Lair, G.J.; Bloem, J.; Hemerik, L.; Ragnarsdóttir, K.V.; Gísladóttir, G.; Newton, J.S.; De Ruiter, P.C. An Ecosystem Approach to Assess Soil Quality in Organically and Conventionally Managed Farms in Iceland and Austria. Soil 2015, 1, 83–101. [Google Scholar] [CrossRef]
  12. van Leeuwen, J.P.; Lair, G.J.; Gísladóttir, G.; Sandén, T.; Bloem, J.; Hemerik, L.; de Ruiter, P.C. Soil Food Web Assembly and Vegetation Development in a Glacial Chronosequence in Iceland. Pedobiol. J. Soil Ecol. 2018, 70, 12–21. [Google Scholar] [CrossRef]
  13. Hunziker, M.; Arnalds, O.; Kuhn, N.J. Evaluating the Carbon Sequestration Potential of Volcanic Soils in Southern Iceland after Birch Afforestation. Soil 2019, 5, 223–238. [Google Scholar] [CrossRef]
  14. Marañón-Jiménez, S.; Peñuelas, J.; Richter, A.; Sigurdsson, B.D.; Fuchslueger, L.; Leblans, N.I.W.; Janssens, I.A. Coupled Carbon and Nitrogen Losses in Response to Seven Years of Chronic Warming in Subarctic Soils. Soil Biol. Biochem. 2019, 134, 152–161. [Google Scholar] [CrossRef]
  15. Poeplau, C.; Kätterer, T.; Leblans, N.I.W.; Sigurdsson, B.D. Sensitivity of Soil Carbon Fractions and Their Specific Stabilization Mechanisms to Extreme Soil Warming in a Subarctic Grassland. Glob. Change Biol. 2017, 23, 1316–1327. [Google Scholar] [CrossRef]
  16. Poeplau, C.; Sigurdsson, P.; Sigurdsson, B.D. Depletion of Soil Carbon and Aggregation after Strong Warming of a Subarctic Andosol under Forest and Grassland Cover. Soil 2020, 6, 115–129. [Google Scholar] [CrossRef]
  17. Zsolnay, Á. Dissolved Organic Matter: Artefacts, Definitions, and Functions. Geoderma 2003, 113, 187–209. [Google Scholar] [CrossRef]
  18. McDowell, W.H. Dissolved Organic Matter in Soils—Future Directions and Unanswered Questions. Geoderma 2003, 113, 179–186. [Google Scholar] [CrossRef]
  19. Kleber, M.; Eusterhues, K.; Keiluweit, M.; Mikutta, C.; Mikutta, R.; Nico, P.S. Mineral-Organic Associations: Formation, Properties, and Relevance in Soil Environments. Adv. Agron. 2015, 130, 1–140. [Google Scholar] [CrossRef]
  20. Guggenberger, G.; Kaiser, K. Dissolved Organic Matter in Soil: Challenging the Paradigm of Sorptive Preservation. Geoderma 2003, 113, 293–310. [Google Scholar] [CrossRef]
  21. Þórhallsdóttir, A.G.; Júlíusson, A.D.; Ögmundardóttir, H. The Sheep, the Market and the Soil: Environmental Destruction in the Icelandic Highlands 1880–1910. In Northscapes: History, Technology and the Making of Northern Environments; Jørgensen, D., Sorlin, S., Eds.; University of British Columbia Press: Vancouver, BC, Canada, 2013; pp. 153–173. [Google Scholar]
  22. Heslop, J.K.; Winkel, M.; Walter Anthony, K.M.; Spencer, R.G.M.; Podgorski, D.C.; Zito, P.; Kholodov, A.; Zhang, M.; Liebner, S. Increasing Organic Carbon Biolability with Depth in Yedoma Permafrost: Ramifications for Future Climate Change. J. Geophys. Res. Biogeosci. 2019, 124, 2021–2038. [Google Scholar] [CrossRef]
  23. Poeplau, C.; Dechow, R. The Legacy of One Hundred Years of Climate Change for Organic Carbon Stocks in Global Agricultural Topsoils. Sci. Rep. 2023, 13, 7483. [Google Scholar] [CrossRef] [PubMed]
  24. Gewin, V. Climate Change is a Boon to Tourism in Iceland—The Atlantic. Available online: https://www.theatlantic.com/science/archive/2017/03/we-all-scream-for-iceland-cream/520980/ (accessed on 23 March 2025).
  25. Bergh, S.G.; Sigvaldason, G.E. Pleistocene Mass-Flow Deposits of Basaltic Hyaloclastite on a Shallow Submarine Shelf, South Iceland. Bull. Volcanol. 1991, 53, 597–611. [Google Scholar] [CrossRef]
  26. Banik, T.J. Mechanisms of Magma Disaggregation on a Cooler Host: Volcanic, Plutonic, and Theoretical Considerations; Vanderbilt University: Nashville, TN, USA, 2008. [Google Scholar]
  27. Robinson, Z. The Geochemistry and Behaviour of Shallow Groundwater in an Icelandic Sandur, Skeidararsandur, SE Iceland. Ph.D. Thesis, Keele University, Newcastle, UK, 2003. [Google Scholar]
  28. Law, A.C.; Robinson, Z.; Szkornik, K.; Waller, R.I. Diatom Assemblages from Short-Lived Jökulhlaup-Formed Kettle Lakes in a Proglacial Outwash Plain, South-East Iceland. Geogr. Ann. Ser. A Phys. Geogr. 2020, 102, 162–181. [Google Scholar] [CrossRef]
  29. Aggarwal, A.; Young, K.L. Surface-Groundwater Exchange between a Wetland, Sandur, and Lava Field in Southeastern Iceland. Hydrol. Res. 2023, 54, 14–30. [Google Scholar] [CrossRef]
  30. Arnalds, O. The Soils of Iceland; Springer: Berlin/Heidelberg, Germany, 2015; Volume 91, ISBN 9789401796200. [Google Scholar]
  31. Vilmundardóttir, O.K.; Gísladóttir, G.; Lal, R. Early Stage Development of Selected Soil Properties along the Proglacial Moraines of Skaftafellsjökull Glacier, SE-Iceland. Catena 2014, 121, 142–150. [Google Scholar] [CrossRef]
  32. Dugmore, A.J. Geochemical Stability of Fine-Grained Silicic Holocene Tephra in Iceland and Scotland. J. Quat. Sci. 1992, 7, 173–183. [Google Scholar] [CrossRef]
  33. Einarsson, M.A. Climate of Iceland. In Climates of the Oceans, World Survey of Climatology; Van Loon, H., Ed.; Elsevier Science Publishers: Amsterdam, The Netherlands, 1984; Volume 15, pp. 673–697. [Google Scholar]
  34. Bjornsson, H.; Olason, E.O.; Jónsson, T.; Henriksen, S. Analysis of a Smooth Seasonal Cycle with Daily Resolution and Degree Day Maps for Iceland. Meteorol. Z. 2007, 16, 57–69. [Google Scholar] [CrossRef]
  35. Ottosson, J.; Sveinsdottir, A.; Hardardottir, M. Fjölrit Náttúrufræðistofnunar; Icelandic Institute of Natural History: Garðabær, Iceland, 2016; Volume 54. [Google Scholar]
  36. EEA EUNIS (the European Nature Information System) Database. Available online: http://eunis.eea.europa.eu/ (accessed on 4 February 2025).
  37. Mankasingh, U.; Gísladóttir, G. Early Indicators of Soil Formation in the Icelandic Sub-Arctic Highlands. Geoderma 2019, 337, 152–163. [Google Scholar] [CrossRef]
  38. Parfitt, R.L. Allophane in New Zealand—A Review. Aust. J. Soil Res. 1990, 28, 343–360. [Google Scholar] [CrossRef]
  39. Parfitt, R.L.; Childs, C.W. Estimation of Forms of Fe and Al: A Review, and Analysis of Contrasting Soils by Dissolution and Moessbauer Methods. Aust. J. Soil Res. 1988, 26, 121–144. [Google Scholar] [CrossRef]
  40. Tamm, O. Om Bestämning Av de Oorganiska Komponenterna i Markens Gelcomplex. Rep. Swed. Inst. Emeriment. For. 1922, 19, 385–404. [Google Scholar]
  41. Schwertmann, U. Use of Oxalate for Fe Extraction from Soils. Can. J. Soil Sci. 1973, 53, 244–246. [Google Scholar] [CrossRef]
  42. He, Z.; Zhang, M.; Zhao, A.; Olanya, O.M.; Larkin, R.P.; Honeycutt, C.W. Quantity and Nature of Water-Extractable Organic Matter from Sandy Loam Soils with Potato Cropping Management. Agric. Environ. Lett. 2016, 1, 160023. [Google Scholar] [CrossRef]
  43. Adamson, D.M.; Norton, U.; Norton, J.B.; Albeke, S.E.; Sebade, B.M.; van Diepen, L.T.A. Soil Carbon and Nitrogen Responses to Long-Term Flood Irrigation and Fertilization in High-Elevation Hay Meadows. Rangel. Ecol. Manag. 2025, 98, 283–292. [Google Scholar] [CrossRef]
  44. Helgadóttir, Á.; Frankow-Lindberg, B.E.; Seppänen, M.M.; Søegaard, K.; Østrem, L. European Grasslands Overview: Nordic Region. In EGF at 50: The Future of European Grassland, Proceedings of the 25th General Meeting of the European Grassland Federation, Aberystwyth, Wales, 7–11 September 2014; European Grassland Federation: Leeuwarden, The Netherlands, 2014; pp. 15–28. [Google Scholar]
  45. Thorhallsdottir, A.G.; Gudmundsson, J. Carbon Dioxide Fluxes and Soil Carbon Storage in Relation to Long-Term Grazing and No Grazing in Icelandic Semi-Natural Grasslands. Appl. Veg. Sci. 2023, 26, e12757. [Google Scholar] [CrossRef]
  46. Mayel, S.; Jarrah, M.; Kuka, K. How Does Grassland Management Affect Physical and Biochemical Properties of Temperate Grassland Soils? A Review Study. Grass Forage Sci. 2021, 76, 215–244. [Google Scholar] [CrossRef]
  47. Li, W.; Sun, Q.; Zhang, S.; Hu, X.; Asiya, M.; Xiong, J.; Wang, M.; Wang, X.; Long, R.; Jin, G. Trampling and Dung and Urine Addition of Livestock Increase the Soil Organic Carbon in Mountain Meadows by Augmenting the Organic Carbon in Different Aggregates. Agronomy 2025, 15, 843. [Google Scholar] [CrossRef]
  48. Paré, M.C.; Bedard-Haughn, A. Soil Organic Matter Quality Influences Mineralization and GHG Emissions in Cryosols: A Field-Based Study of Sub- to High Arctic. Glob. Change Biol. 2013, 19, 1126–1140. [Google Scholar] [CrossRef]
  49. Chantigny, M.H. Dissolved and Water-Extractable Organic Matter in Soils: A Review on the Influence of Land Use and Management Practices. Geoderma 2003, 113, 357–380. [Google Scholar] [CrossRef]
  50. Hallsdóttir, B.S.; Wöll, C.; Guðmundsson, J.; Snorrason, A.; Þórsson, J. Emissions of Greenhouse Gases in Iceland from 1990 to 2010; National Inventory Report 2012; Environment Agency of Iceland: Reykjavik, Iceland, 2012.
  51. Kalbitz, K.; Popp, P.; Geyer, W.; Hanschmann, G. β-HCH Mobilization in Polluted Wetland Soils as Influenced by Dissolved Organic Matter. Sci. Total Environ. 1997, 204, 37–48. [Google Scholar] [CrossRef]
  52. Ju, W.; Ma, D.; Chen, M.; Sardans, J.; Zhu, B.; Liu, J.; Chen, J.; Peñuelas, J.; Liu, X. Soil-Derived Dissolved Organic Matter in Inland Wetlands along A Temperate River: Insights from Spectroscopic Characteristics Coupled with Machine Learning Methods. Water Res. X 2025, 29, 100339. [Google Scholar] [CrossRef]
  53. Kurek, M.R.; Wickland, K.P.; Nichols, N.A.; McKenna, A.M.; Anderson, S.M.; Dornblaser, M.M.; Koupaei-Abyazani, N.; Poulin, B.A.; Bansal, S.; Fellman, J.B.; et al. Linking Dissolved Organic Matter Composition to Landscape Properties in Wetlands Across the United States of America. Glob. Biogeochem. Cycles 2024, 38, 7917. [Google Scholar] [CrossRef]
  54. Saputra, D.D.; Sari, R.R.; Hairiah, K.; Widianto; Suprayogo, D.; van Noordwijk, M. Recovery after Volcanic Ash Deposition: Vegetation Effects on Soil Organic Carbon, Soil Structure and Infiltration Rates. Plant Soil 2022, 474, 163–179. [Google Scholar] [CrossRef]
  55. Saputra, D.D.; Sari, R.R.; Sari, I.N.; Suprayogo, D.; van Noordwijk, M. Water Repellency by Volcanic Ash Interacting with Organic Matter: Incubation Response and Effect on Infiltration. Geoderma 2023, 436, 116535. [Google Scholar] [CrossRef]
  56. Curtin, D.; Wright, C.E.; Beare, M.H.; McCallum, F.M. Hot Water-Extractable Nitrogen as an Indicator of Soil Nitrogen Availability. Soil Sci. Soc. Am. J. 2006, 70, 1512–1521. [Google Scholar] [CrossRef]
  57. Sharifi, M.; Zebarth, B.J.; Burton, D.L.; Rodd, V.; Grant, C.A. Long-Term Effects of Semisolid Beef Manure Application to Forage Grass on Soil Mineralizable Nitrogen. Soil Sci. Soc. Am. J. 2011, 75, 649–658. [Google Scholar] [CrossRef]
  58. García-Palacios, P.; Crowther, T.W.; Dacal, M.; Hartley, I.P.; Reinsch, S.; Rinnan, R.; Rousk, J.; van den Hoogen, J.; Ye, J.S.; Bradford, M.A. Evidence for Large Microbial-Mediated Losses of Soil Carbon under Anthropogenic Warming. Nat. Rev. Earth Environ. 2021, 2, 507–517. [Google Scholar] [CrossRef]
  59. Björnsson, H.; Pálsson, F. Icelandic Glaciers. Jökull 2008, 58, 365–386. [Google Scholar] [CrossRef]
Figure 1. Study sites in SE Iceland (drawn in Adobe Illustrator 29.5.1, based on www.mapy.cz—accessed on 26 May 2019).
Agriculture 15 01255 g001
Figure 2. Human–managed and semi-natural sites with the corresponding soils.
Agriculture 15 01255 g002
Figure 3. Total organic carbon (Corg) at (A) 0–20 cm and (B) 20–40 cm and total nitrogen (Nt) at (C) 0–20 cm (D) and 20–40 cm [g kg−1] for each of the six analyzed sites (TU, tundra; WE, wetland; IP, intensively grazed pastureland; EP, extensively grazed pastureland; FFM, formerly fertilized meadow; and PFM, presently fertilized meadow). Lowercase letters indicate statistical differences among the sites (α = 0.05).
Agriculture 15 01255 g003
Figure 4. Relative concentrations of WEOC in Corg and WETN in Nt [%] at (A,B) 0–20 cm and (C,D) 20–40 cm, respectively, for each of the six analyzed sites (TU, tundra; WE, wetland; IP, intensively grazed pastureland; EP, extensively grazed pastureland; FFM, formerly fertilized meadow; and PFM, presently fertilized meadow). Values indicated by the same letter are not significantly different (α = 0.05).
Agriculture 15 01255 g004
Figure 5. Mean C/N and WEOC/WETN ratios at (A,B) 0–20 cm and (C,D) 20–40 cm, respectively, for each of the six analyzed sites (TU, tundra; WE, wetland; IP, intensively grazed pastureland; EP, extensively grazed pastureland; FFM, formerly fertilized meadow; and PFM, presently fertilized meadow). Values indicated by the same letter are not significantly different (α = 0.05).
Agriculture 15 01255 g005
Figure 6. PCA diagrams for the analyzed soil sampling sites (TU, tundra; WE, wetland; IP, intensively grazed pastureland; EP, extensively grazed pastureland; FFM, formerly fertilized meadow; and PFM, presently fertilized meadow) at 0–20 cm and 20–40 cm.
Agriculture 15 01255 g006
Table 1. Main site characteristics.
Site NameSymbolVegetation—Dominant SpeciesLandformAltitude (m a.s.l.)Soil Classification (WRB, 2022)
Semi-natural habitats
TundraTUbog bilberry (Vaccinium uliginosum L.)
heather (Calluna vulgaris L.)
moss (Racomitrium lanuginosum)
three-leaved rush (Oreojuncus trifidus L.)
wavy hair-grass (Deschampsia flexuosa L.)
Moderately steep (15–30% slope)145–260Skeletic Andosol
WetlandWEArctic rush (Juncus arcticus ssp. arcticus Willd.)
common sedge (Carex nigra L.)
moss (Racomitrium lanuginosum)
moss (Sphagnum teres)
moss (Rhytidiadelphus triquetrus)
narrow small-reed (Calamagrostis stricta Timm.)
three-flowered rush (Juncus triglumis L.)
River valley, flat (0.5–1% slope)42–48Gleyic Andosol
Human-managed sites
Intensively grazed pasturelandIPcommon bent (Agrostis capillaris L.)
moss (Rhytidiadelphus triquetrus)
rough meadow-grass (Poa trivialis L.)
smooth meadow-grass (Poa pratensis L.)
Plain, flat (0.5–1% slope)29–38Cambisol/Andosol
Extensively grazed pasturelandEPalpine cat’s-tail (Phleum alpinum L.)
common bent (Agrostis capillaris L.)
moss (Rhytidiadelphus triquetrus)
moss (Sanionia uncinata)
smooth meadow-grass (Poa pratensis L.)
Plain, flat (0.5–1% slope)40–44Andosol
Formerly fertilized meadowFFMannual meadow-grass (Poa annua L.)
common bent (Agrostis capillaris L.)
smooth meadow-grass (Poa pratensis L.)
timothy (Phleum pratense L.)
Medium steep (5–10% slope)38–69Andosol
Presently fertilized meadowPFMcommon bent (Agrostis capillaris L.)
moss (Sanionia uncinata)
smooth meadow-grass (Poa pratensis L.)
timothy (Phleum pretense L.)
Plateau, flat (0.2–0.5% slope)110–139Andosol (Drainic)
Disclaimer/Publisher’s Note: The statements, opinions and data contained in all publications are solely those of the individual author(s) and contributor(s) and not of MDPI and/or the editor(s). MDPI and/or the editor(s) disclaim responsibility for any injury to people or property resulting from any ideas, methods, instructions or products referred to in the content.

