Abstract
The FAO estimates that 1660 million hectares globally are degraded due to human activities, with over 60% of this degradation affecting agricultural lands, including croplands and pastures. Given that 95% of global food production depends on land, this widespread degradation presents significant challenges to agrifood systems. This study compares patterns of human-induced land degradation in Arab countries with global and regional averages, examining drivers, impacts on agrifood systems, current yield gaps, and restoration opportunities. The results indicate that in the Arab region, two-thirds of the 70 million hectares affected by human-induced degradation—over 46 million hectares—are agricultural land, with croplands particularly impacted. However, with less than 4% of land in the Arab region designated for restoration, the region lags behind global targets. Restoring 26 million hectares of degraded cropland could reduce the yield gap by up to 50% for oil crops and help cereal, root, and tuber crops approach their potential yields. These findings underscore the pressing need for a regional initiative specifically targeting agricultural land degradation to enhance food security, reduce poverty, and support sustainable and resilient agrifood systems.
1. Introduction
The mutual interactions between land and water resources and societal changes form the foundation of food production and the entire agrifood system, shaping their dynamics across time and space [1]. Human-induced land degradation has significantly impacted agrifood systems [2], driving their productive capacity in unsustainable directions and putting global food security, nutrition, environmental sustainability, and social stability at risk [3,4,5]. Recognition and action are needed to refocus attention on land, soil, and water resources, which produce over 95 percent of the world’s food [6] and support other essential ecosystem services such as feed, fiber, clean water, and air [7]. The FAO estimates that more than 1660 million hectares (Mha) of global land area are degraded due to unsustainable land use and management practices—referred to as human-induced land degradation [1]. The impacts of this degradation are particularly severe for the livelihoods of those who depend on natural resources [8,9].
Addressing the degradation of agricultural land through improved and sustainable management solutions is critical. This degradation directly threatens the sustainability and resilience of agrifood systems, undermining their ability to achieve food security and nutrition, as well as their capacity to meet future demands. For example, the FAO estimates that by 2050, agriculture will need to produce 50 percent more food, feed, and biofuel than was produced in 2012 [1]. Societal and environmental pressures on agrifood systems are intensifying. Climate change is already reducing rainfed and irrigated agricultural production, worsening risks from decades of unsustainable land and water use [1]. Human-induced land degradation, water scarcity, and climate change are heightening risks for agriculture and ecosystem services—especially at times and in places where economic growth is most needed. Increased evapotranspiration and altered rainfall patterns are changing land and crop suitability and making water supplies more variable; some regions will see less water, others more. Future scenarios further highlight the need to adapt cropping patterns and management practices as crop and land suitability shifts and to invest in breeding crop varieties tolerant to rising temperature, salinity, wind, and evaporation changes [1]. In 2024, the FAO estimated that 5.4 billion people—67% of the global population—lived in countries experiencing temperatures exceeding 1.5 °C above their baseline and that 3.5 billion hectares, representing 73 percent of the agricultural area, were also exposed to this level of warming [10,11]. These numbers have continued to grow in recent years. Droughts have affected more people worldwide than any other natural hazard over the past 40 years, with expected increases in intensity, duration, frequency, and spatial extent due to climate change and rising temperatures. Reports submitted to the United Nations Convention to Combat Desertification (UNCCD) from over 100 countries indicated that 1.84 billion people were drought-stricken during the 2022–2023 biennium [12]. This has been affecting land productivity, food and water security, and the livelihoods of primarily vulnerable communities, especially in countries with limited capacity to absorb such shocks. Country studies highlight the widespread impact of drought on food consumption, nutritional intake, and labor markets [13,14].
Agriculture is both affected by land degradation and contributes to it through unsustainable land and water management practices. For example, direct emissions from manure and nitrogen applications to agricultural soils represent the largest single source of nitrous oxide (N2O), a potent greenhouse gas and an ozone-depleting substance [15]. Agricultural pesticide use contaminates soil and water, posing potential risks to the environment and human health that are not yet fully understood [16,17].
Most global patterns and trends are also observed in the Arab countries included in this analysis, which form the focus of this study. The analysis aims to provide valuable insights to support regional organizations, including the Arab League, in their efforts and decision-making processes to combat land degradation and desertification effectively. This paper compares the main patterns of human-induced degradation in the agricultural lands of the Arab region with global averages and other regions. The region is particularly vulnerable to land degradation, as natural endowments already limit the availability of productive land. The study examines the drivers and implications of land degradation on agrifood systems and highlights opportunities for restoring agricultural lands, including an analysis of yield gaps and agrosilvopastoral systems.
2. Materials and Methods
2.1. Key Concepts
To ensure clarity, this section defines the key concepts used in the analysis, covering land degradation, its impacts, the concept of land degradation neutrality (LDN), and sustainable management practices to address these issues.
Land degradation arises from various pressures, notably unsustainable land use and poor management practices. It manifests as a decline in the productivity and ecological complexity of diverse landscapes—including rainfed and irrigated croplands, rangelands, and pastures, as well as forests and woodlands [18]. We acknowledge that global estimates of land degradation vary widely due to differences in definitions, the scope of data collection, and specific nuances in reporting processes. This study focuses specifically on human-induced land degradation by analyzing changes resulting from direct human pressures on agricultural lands [2].
The impacts of land degradation are multifaceted, including reduced agricultural productivity and significant biodiversity loss. It damages ecosystems and habitats and contributes to climate change feedback loops, as degraded lands emit more greenhouse gases and sequester less carbon. Additionally, land degradation impairs watershed health, leading to decreased water retention and increased water scarcity. Rural and smallholder communities are particularly affected, facing heightened vulnerability to natural disasters such as droughts, floods, and sand and dust storms [1].
At the Conference of the Parties (COP.12) in 2015, the UNCCD endorsed the definition of land degradation neutrality (LDN) as “a state whereby the amount and quality of land resources necessary to support ecosystem functions and services and enhance food security remain stable or increase within specified temporal and spatial scales and ecosystems”.
Sustainable land management (SLM) practices involve the use of land resources—including soil, water, animals, and plants—to produce goods that meet evolving human needs while simultaneously safeguarding the long-term productive capacity of soil, land, and water resources and maintaining their environmental functions [19].
2.2. Study Area
The study area encompasses 20 countries in the Arab region, primarily located in the subregions of Northern Africa and Western Asia. The total area of these regions is approximately 1316 million hectares (Mha), representing about 10% of the global land area. Agricultural land accounts for roughly 40% of this area, totaling 525 Mha, with pastures making up the largest share (Table 1) [20]. All these countries are members of the Arab League, a regional organization established to strengthen and coordinate political, cultural, economic, and social programs among its member states. The group is economically diverse, encompassing Least Developed and Low-Income Food-Deficit countries such as Djibouti, Mauritania, and Sudan, as well as more advanced economies like Kuwait, Oman, Qatar, Saudi Arabia, and the United Arab Emirates. The 2024 Arab Sustainable Development Goals (SDGs) report highlights that progress towards the SDGs varies across Arab countries, with an average regional score of 60.5 out of 100—below the global average. Countries such as Algeria, Egypt, Jordan, Morocco, Tunisia, and the United Arab Emirates lead in key areas including education, renewable energy, and climate action, while more fragile states like Somalia and Yemen continue to face significant challenges and lag behind.

Table 1.
Countries in the study area and extent of agricultural land components (in million ha) in 2022. Adapted from the FAOSTAT Land Use database [20].
Countries in this group are characterized by a predominantly arid to semi-arid climate, featuring high temperatures and low precipitation. Nearly 80% of the land area is classified as bare land, while grasslands, sparse vegetation cover, and cropland suitable for rainfed agriculture together account for up to 5% (Figure 1) [2]. Five major farming systems predominate in the region: irrigated, highland mixed, rainfed mixed, dryland mixed, and pastoral. Sparse and arid land—primarily used for nomadic pastoralism—covers 62% of the region. For example, in Mauritania, livestock provides employment for 60% of the population. In this context, upscaling silvopastoralism—an agroforestry technique that integrates trees, pasture, and livestock—is of particular interest to the region [21,22,23].
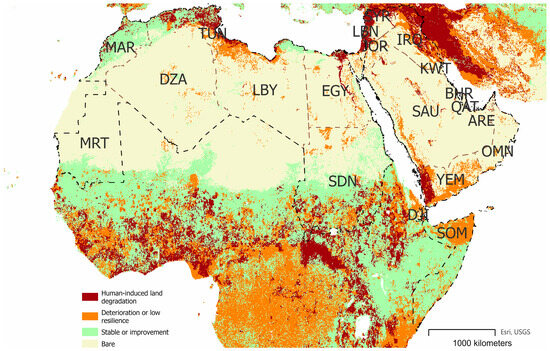
Figure 1.
Human-induced land degradation in the countries of the Arab region. Original elaboration from data of human-induced degradation published by FAO SOLAW 2021 [1] and Coppus [2]. ISO 3 codes: Algeria = DZA; Bahrain = BHR; Djibouti = DJI; Egypt = EGY; Iraq = IRQ; Jordan = JOR; Kuwait = KWT; Lebanon = LBN; Libya = LBY; Mauritania = MRT; Morocco = MAR; Oman = OMN; Qatar = QAT; Saudia Arabia = SAU; Somalia = SOM; Sudan = SDN; Syrian Arab Republic = SYR; Tunisia = TUN; United Arab Emirates = ARE; Yemen = YEM. The map was prepared using ArcGIS PRO software, Redlands, CA, USA: Environmental Systems Research Institute (ESRI); 2023.
2.3. Analysis of the Degradation in Agricultural Land
The FAO publishes the flagship report State of the World’s Land and Water Resources for Food and Agriculture (SOLAW), which analyzes trends in land degradation and assesses pressures arising from human activities [1]. The FAO has a long-standing history of assessing and monitoring land degradation through initiatives such as the Land Degradation Assessment in Drylands (LADA) program [24] and the Global Land Degradation Information System (GLADIS) [25]. These efforts have developed robust methodologies for diagnosing land degradation, mapping its impacts, and identifying areas at greatest risk. LADA, in particular, highlights the role of land use systems as major drivers of degradation, integrating both biophysical and socio-economic factors to assess the status, trends, and root causes of degradation at global, regional, and local scales using the Drivers–Pressures–State–Impact–Response (DPSIR) conceptual framework.
Building on these foundational efforts, Coppus [2] conducted an integrated analysis for a technical background report for SOLAW 2021 [1], focusing on the human-induced aspects of land degradation. This analysis combined biophysical trends with direct anthropogenic drivers—such as agricultural expansion, deforestation, fire extent, grazing density, and population density—and estimated that 1.66 billion hectares of land have already been degraded by human activities. The SOLAW approach has provided deeper insights into the distribution, causes, and processes of human-induced land degradation.
In addition, countries regularly report national land use information to the Food and Agriculture Organization (FAO) through a long-established statistical process, utilizing the annual Land Use, Irrigation and Agricultural Practices Questionnaire. The resulting data are published in the Land Use database within FAOSTAT [20], where agricultural land is defined as land used for crop cultivation and animal husbandry. Specifically, agricultural land includes the total land area under “cropland” and “permanent meadows and pastures”{ (see Data Availability Statement).
Leveraging the results of these analyses, this study generates country- and regional-level statistics on human-induced land degradation, with a focus on agricultural land, as follows. First, we extracted degradation statistics by land cover class using a spatial overlay of the Coppus human-induced land degradation layer [2] across countries of the Arab region (Figure 1) and the newly released land cover layer from the Global Agro-Ecological Zoning v5 (GAEZ v5) [26]. Next, we used the land cover/land use mapping presented in Table 2 to calculate human-induced degradation by the corresponding land use class. Land cover maps derived from remote sensing are commonly used as proxies for land use, since directly mapping land use presents greater challenges [27,28]. The results are made publicly available for reuse (see Data Availability Statement).
Table 2.
Mapping table elaborated for this study showing correspondence between GAEZ v5 land cover classes [26] and FAO land use categories [20].
The GAEZ v5 land cover layer provides detailed pixel-level shares of 11 land cover classes, generated by integrating agreement maps from six global high-resolution land cover products [29,30]. This integration process helps reduce uncertainties inherent in land cover mapping. Additionally, the GAEZ v5 land cover includes estimates of irrigated areas [31] and has undergone calibration to ensure that the total extents of cropland and tree-covered areas (forests) align with the average values reported by FAOSTAT for the period 2019–2021. This calibration hence supports the direct and practical mapping between GAEZ v5 land cover classes and FAO land use categories, as applied in this analysis.
More specifically, we represented the FAO land use categories [20]—including cropland, permanent meadows and pastures, and forest—using corresponding land cover classifications from GAEZ v5 [26]. Mapping pastures proved less straightforward than mapping cropland and forest due to limitations in remote sensing detection and ambiguities in their definitions [32,33]. As a solution, grassland and shrub-covered areas were used as proxies for pastures, consistent with recent high-resolution global grassland mapping approaches [33]. It is important to note that alternative mapping strategies, such as including flooded herbaceous vegetation or sparsely vegetated areas, may also be considered. Table 3 illustrates global data for GAEZ v5 and FAO corresponding land cover/land use categories.
Table 3.
Global land areas, extracted geospatially from the GAEZ v5 land cover data [26] and from FAOSTAT land use statistics [20], 2020.
2.4. Computation of Yield Gaps
The GAEZ v5 dataset [34] provides pixel-level information on agro-ecological land suitability, production, and attainable yields for 52 crops. Within the GAEZ framework, attainable yield is defined as the maximum yield achievable under specific agro-ecological conditions, combining agro-climatic potential yields with evaluations of soil and terrain [35]. To calculate yield gaps, GAEZ v5 attainable yields are compared with actual yields from FAOSTAT, averaged over the reference period 2001–2020 [36]. For each of the three crop groups—cereals, roots and tubers, and oil crops (Table 4)—country and crop-specific information is extracted from the GAEZ crop summary tables, and the average yields are computed from both rainfed and irrigated simulations. Following the GAEZ methodology, attainable yields are first converted to fresh matter before being compared to the FAOSTAT actual yields for each crop, averaged over the 2001–2020 period.
Table 4.
Crops and crop groups in the analysis as defined in GAEZ v5 [34]. Crop classification codes are derived from the United Nations Central Product Classification codes (CPC v2.1) and were used to match crops in GAEZ v5 with FAOSTAT production data [36].
3. Results
3.1. Global and Regional Degradation of Agricultural Lands
Globally, our study estimates that 480 Mha—over one-third of the world’s cropland area—is degraded. Regarding pastureland, we find that 560 Mha, or about 14 to 17% of the world’s total pastureland, is degraded (see Figure 2). Taken together, degraded agricultural land (cropland and pasture) totals 1040 Mha. This means that over 60% of the total estimated human-induced land degradation—1660 Mha—occurs on agricultural land, while nearly 30% (460 Mha) occurs in forests.
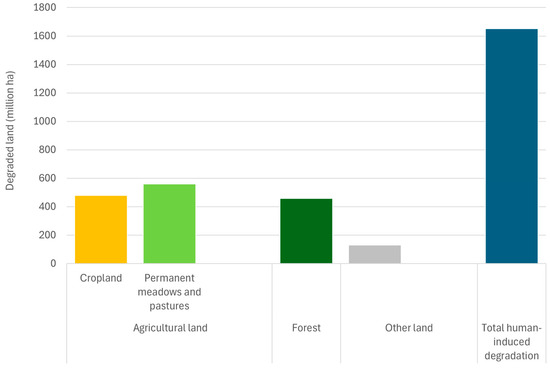
Figure 2.
Global estimates of human-induced land degradation by land use.
Our analysis aggregated country-level data on human-induced land degradation to produce regional statistics. We found that, at the regional level, Asian countries account for about 600 Mha of human-induced land degradation, followed by the Americas with 470 Mha and Africa with approximately 350 Mha (see Figure 3). Europe and Oceania contribute 140 Mha and 95 Mha of degraded land, respectively. These figures reflect the overall extent of degradation in each region, but it is important to note that agricultural land constitutes the largest share of degradation across all regions. Specifically, agricultural land contributes between 57% (in the Americas) and 69% (in Europe) of the total regional degradation, with Africa, Asia, and Oceania showing intermediate values of 63%, 66%, and 60%, respectively. Within the Americas, degradation in tree-covered areas and forests is particularly prominent, accounting for 37% of the total human-induced degradation. Additionally, our analysis reveals regional variations in the relative contributions of cropland and pastures to agricultural land degradation. In Asia and Europe, cropland represents the largest share of agricultural degradation (64% and 56%, respectively), while in Africa and the Americas, pastures make up a larger share (61% and 70%, respectively). Notably, in Oceania, pastures account for almost all (90%) of the degraded agricultural land.
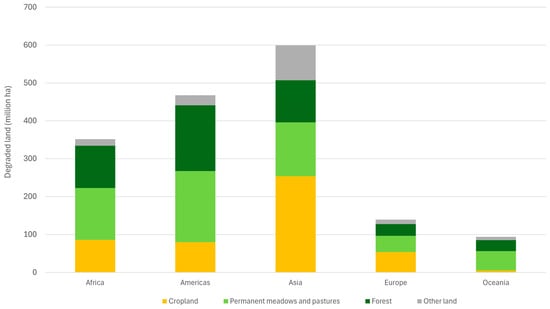
Figure 3.
Regional distribution of human-induced land degradation by land use. The composition of countries within each region is based on the regional aggregates from the FAOSTAT Land Use database [20].
3.2. Human-Induced Land Degradation in the Agricultural Land of the Arab Region
Our analysis estimates that the total human-induced land degradation in the countries of the Arab region amounts to approximately 70 Mha. Of this, about two-thirds—roughly 46.5 Mha—occurs on agricultural land, with cropland being particularly affected. We identified over 26 Mha of degraded cropland, representing 38% of the region’s total cropland area—a figure higher than the global average of 31% (see Figure 4). In addition, nearly 120 Mha of land in the region is deteriorating (Figure 1). Our findings also highlight significant variability across countries in the region. The analysis reveals that the Arab region includes countries with lower-than-average shares of degraded cropland as well as others with percentages double the global average. These disparities underscore the need for tailored strategies to address land degradation in specific national contexts.
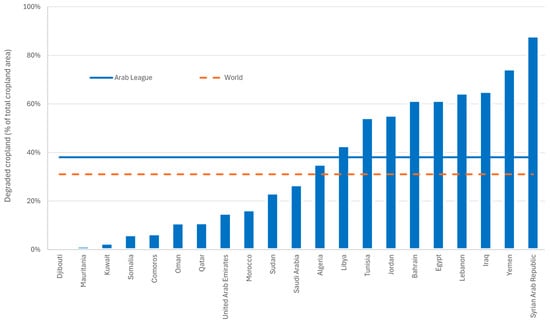
Figure 4.
Share (%) of degraded cropland relative to total cropland area for countries of the Arab region, with regional and global averages.
3.3. Suitable Areas and Yield Gaps for Cereals, Oil Crops, and Roots and Tubers in the Arab Region
The total area suitable for crop cultivation in the Arab region is limited because prevailing arid and hyper-arid conditions are common in many countries. Land suitability was determined by totaling areas classified by GAEZ as having very high, high, and moderate suitability for cultivation [35]. Among the three crop groups analyzed—cereals, oil crops, and root and tuber crops—GAEZ v5 estimates indicate that the largest suitable area is for cereal cultivation, at roughly 92 million hectares (Mha), or about 7% of the region’s total land area. Around two-thirds of this cereal-suitable area (62 Mha) is suitable for oil crops, and half (46 Mha) is suitable for roots and tubers.
Regarding yield potential, oil crops present the most significant opportunity for improvement in the Arab region (see Figure 5). Findings show that current actual yields for oil crops reach only 50% of their attainable yield, compared to a global average of 66%. For cereals and roots and tubers, actual yields in the region achieve 60% and 62% of their attainable yields, respectively. Notably, these regional figures exceed the corresponding global averages, likely due to the extensive use of irrigated agriculture in major producing countries such as Egypt.
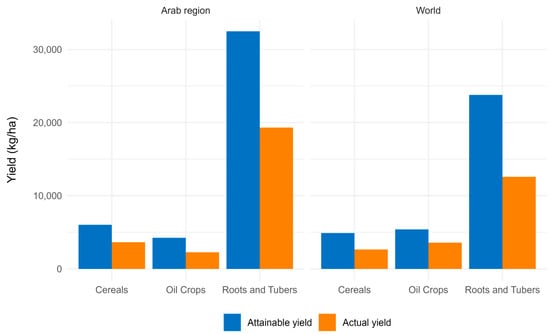
Figure 5.
Averaged attainable and actual yields (kg/ha) by crop group for countries in the Arab region and globally.
Wheat, olives, and potatoes are the leading crops within the cereal, oil crop, and root and tuber crop groups, respectively [36]. In 2023, the area harvested for wheat in the Arab region reached nearly 10 Mha, while olives covered about 5 Mha and potatoes 0.6 Mha [36]. The average yield of wheat in the region was 2.6 t/ha, with national yields ranging from 0.4 t/ha in Somalia to 7.2 t/ha in Egypt. For olives, the regional average yield was 4.4 t/ha, with substantial variation across countries—from 0.6 t/ha in Tunisia to over 12 t/ha in Kuwait. The average potato yield in the region was 25 t/ha; Jordan recorded the highest yield at over 40 t/ha, while Mauritania had the lowest [36].
This study further analyzes yield gaps for these three crops, as shown in Figure 6. Our methodology defines five levels of yield gaps: 0–20% (limited), 20–40% (moderate), 40–60% (significant), 60–80% (severe), and 80–100% (very severe). Olive trees are cultivated in 12 countries of the Arab region. Except for Egypt, Iraq, Kuwait, and Saudi Arabia, the remaining countries show severe to very severe yield gaps. In contrast, potato cultivation is more widespread, occurring in all 20 countries of the region. This study finds that the distribution of yield gaps for potatoes is relatively balanced across categories, with no instances of the largest yield gaps identified for this crop. For wheat, our analysis reveals that among the 19 countries that grow wheat, 11 recorded yield gaps exceeding 60%. The most severe conditions were observed in Libya and Somalia, highlighting these countries as priority areas where strategies to mitigate yield gaps and promote crop diversification may be especially beneficial.
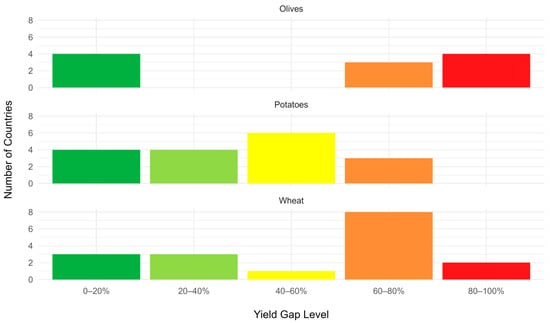
Figure 6.
Number of countries by yield gap level for olives, potatoes, and wheat. Yield gap categories: 0–20% (limited), 20–40% (moderate), 40–60% (significant), 60–80% (severe), and 80–100% (very severe).
4. Discussion
4.1. Drivers of Land Degradation in the Arab Region
In 2022, cropland availability per capita in the countries of the Arab region (0.12 ha/cap) was lower than the global average (0.2 ha/cap) and has been gradually declining over recent decades (Figure 7) [20]. Values within the region ranged from less than 0.05 ha/cap in Bahrain, Kuwait, Djibouti, Qatar, the United Arab Emirates, Jordan, Egypt, and Yemen to more than 0.4 ha/cap in Tunisia and Sudan—more than twice the global average. Our analysis reveals that more than 26 Mha of the region’s cropland is degraded, further intensifying the scarcity of suitable land for cultivation due to inherent natural constraints and the region’s geographical location. Over the past two decades, land degradation rates in the Middle East and North Africa have escalated from 40 percent to 70 percent, and three-quarters of the region’s 30 million hectares of rainfed cropland were estimated to be degraded [21]. Recent studies suggest that land degradation in the region incurs an economic cost of USD 9 billion annually, equivalent to 2–7 percent of individual countries’ GDP [37].
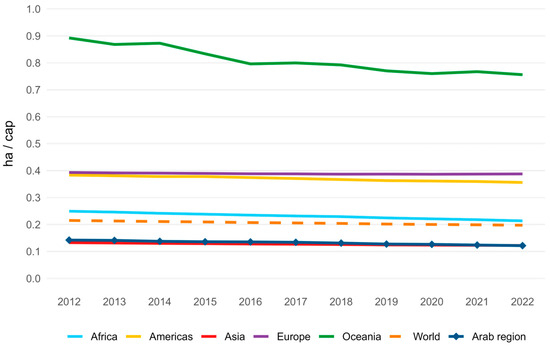
Figure 7.
Global and regional availability of cropland area per capita (ha/cap), 2012–2022. Adapted from the FAOSTAT Land Use database [20].
The Arab region is among the most water-scarce areas in the world. According to FAO AQUASTAT data, the average total renewable water resources per capita in the region (520 m3/cap) is more than thirty times lower than the estimated global average (15,900 m3/cap), and this figure has been declining since 2019 [38]. Sustainable Development Goal (SDG) 6.4.2 measures water stress as the ratio of freshwater withdrawals to available freshwater resources, accounting for environmental flow requirements. In 2022, countries in the Arab region experienced a level of water stress nearly seven times higher (440%) than the global average (68%) [38]. On average, agriculture accounts for 69% of the total water withdrawals in the region—a value close to the global average (71%). However, there are large differences among countries: agricultural water use ranges from 15–35% in Bahrain, Djibouti, and Qatar (consistent with limited cropland availability) to over 95% in Sudan and Somalia. Our analysis also recorded 7.5 Mha of degraded irrigated land in the region. Simultaneously, data from AQUASTAT [38] indicate that an average of 4.2 Mha of irrigated land was salinized due to irrigation practices over the period 2019–2022. Although incomplete reporting makes it challenging to draw definitive conclusions, this information suggests that salinization resulting from unsustainable irrigation practices may be a significant cause of land degradation in the Arab region.
In 2022, the total per capita greenhouse gas (GHG) emissions from agrifood systems in the Arab region were estimated at 1.7 tons of CO2 equivalent (t CO2eq) per capita (see Figure 8)—a value slightly lower than the global average of 2.0 t CO2eq per capita and equal to the per capita emissions for Africa as a whole [39]. Per capita emissions in the region show considerable variation, ranging from 0.6 t CO2eq in Yemen to 5.1 t CO2eq in Qatar. Emissions from pre- and post-production activities account for over 60% of agrifood systems emissions, indicating that sustainable land management approaches should be complemented by actions across the entire agrifood value chain. In the Arab region, agrifood systems account for 30% of all emissions—a share that is consistent with the global average [39]. Across countries, however, this proportion varies widely: in the United Arab Emirates, agrifood systems contribute only 6% of GHG emissions from the entire economy, while in Somalia their share exceeds 80%, primarily due to methane emissions from ruminant livestock.
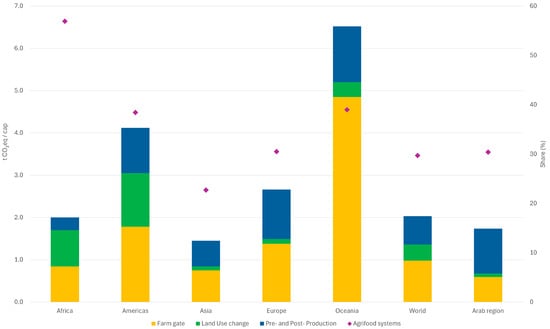
Figure 8.
Per capita greenhouse gas emissions (GHG) by component of agrifood systems (farm gate, land use, and pre- and post-production), with the share of agrifood systems in total economy-wide emissions shown on the secondary axis—averaged by region for 2022. Adapted from the FAOSTAT Emissions totals database [39].
Figure 9 compares three pesticide use indicators for the Arab region and the world in 2022: total pesticide use per area of cropland, total pesticide use per capita, and total pesticide use per value of agricultural production [40]. Pesticide use per area of cropland reflects the pressure exerted on land resources by these agricultural inputs, while the other two indicators measure the efficiency of pesticide utilization. In 2022, countries in the Arab region recorded an average pesticide use per cropland area (3.9 kg/ha) higher than the global average (2.4 kg/ha), suggesting a potential contribution to agricultural land degradation, including risks of soil and water pollution [15]. Notably, pesticide use rates in Djibouti (4.7 kg/ha), Lebanon (6.5 kg/ha), and Qatar (35 kg/ha) far exceeded the regional average, while Iraq, Sudan, and the Syrian Arab Republic applied less than 0.5 kg/ha [39]. Conversely, average pesticide use per capita in the region was below the global average (0.2 kg/cap versus 0.5 kg/cap), and pesticide use per value of agricultural production was closely aligned with the global average (0.9 g per international dollar).
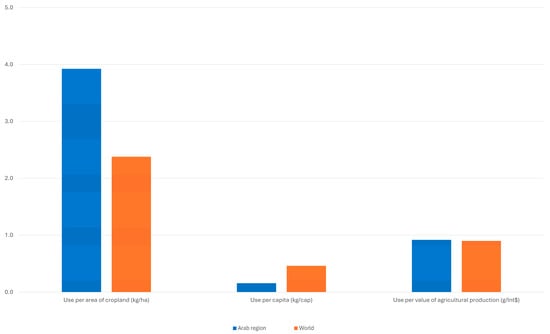
Figure 9.
Pesticide use indicators—total pesticide use per area of cropland (kg/ha), per capita (kg/cap), and per value of agricultural production (g/Int$)—averaged for the Arab region and the world, 2022. Adapted from the FAOSTAT Pesticides Use database [40].
The global use of chemical fertilizers has increased by 40% since 2000, significantly contributing to the growth in crop and livestock production [41]. This trend, driven by rising food and feed demand, has also led to environmental challenges in many regions. Over-application and non-optimal use of fertilizers in some areas have caused nutrient runoff, leading to water and soil pollution and associated risks for ecosystems and human health. Conversely, insufficient fertilizer use in other regions has contributed to soil nutrient depletion and declining productivity [42].
Figure 10 illustrates the substantial disparities in the cropland nitrogen balance [43,44] among Arab countries in 2022. The regional average nitrogen balance was 80 kg/ha—about 50% higher than the global average of 52 kg/ha. However, this average masks significant heterogeneity. For example, countries such as Kuwait and Qatar exhibit extremely high nitrogen surpluses (well above 100 kg/ha), reflecting intensive fertilizer use in irrigated agriculture systems. These surpluses are largely driven by policies that encourage high-input production, such as generous fertilizer subsidies in several countries of the region [45]. In contrast, countries like Yemen, Sudan, Mauritania, and Somalia have low or even negative nitrogen balances, reflecting limited access to fertilizers and less supportive policies, which can lead to nutrient depletion and declining soil fertility. Tailoring interventions to local conditions and policy frameworks will be crucial for achieving both productivity and sustainability across the diverse agricultural systems of the Arab region [22].
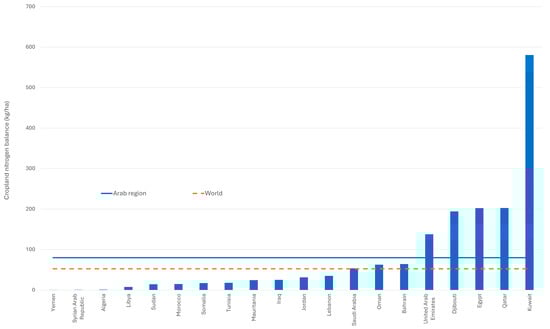
Figure 10.
Cropland nitrogen (N) balances per hectare (kg/ha) for countries in the Arab region, with regional and global averages, 2022. Adapted from the FAOSTAT Cropland Nutrient Balance database [42].
Drylands across several countries in the Arab region are frequently impacted by sand and dust storms (SDSs), either as local events or as part of transboundary pathways [46]. SDS events significantly reduce the yield and productivity of crops, trees, pastures, and livestock [46,47]. In pasturelands, grasslands can be buried under sand, while thick dust clouds endanger livestock health, increasing both mortality and productivity losses. On agricultural land, SDS events strip away fine soil particles and organic matter, degrading soil structure. Essential nutrients, seeds, fertilizers, pesticides, and beneficial microorganisms are also removed, further reducing soil fertility and accelerating land degradation.
Unsustainable agricultural practices are a major driver of SDSs, particularly in areas where vegetative land cover is lost. Sand and dust storms typically lead to a decline in land productivity, and wind-driven soil erosion rapidly depletes soil organic carbon stocks. These processes create self-reinforcing cycles: SDS events cause land degradation, which in turn increases the likelihood of further SDSs, resulting in a downward spiral of declining land quality. Breaking this cycle requires more sustainable management and use of agricultural resources [46].
Importantly, peri-urban and rural farmlands are under constant pressure from urbanization and degradation in the countries of the region where the infrastructure development often happens at the expense of agricultural land, leading to land fragmentation [48]. In 2023, the urban population in the Arab region was 4.6 billion people and accounted for more than 60 percent of the total population. The urban population grew by 23 percent since 2012 [49].
4.2. Impacts of Land Degradation on Agrifood Systems
Food systems encompass the full spectrum of actors and their interconnected value-adding activities involved in producing, aggregating, processing, distributing, consuming, and disposing of food products derived from agriculture, forestry, or fisheries. These systems are embedded within broader economic, societal, and natural environments that influence and are influenced by food-related activities. The food system itself is composed of various sub-systems—such as farming, waste management, and input supply systems—and interacts with other key systems, including energy, trade, and health [50].
Within the agrifood system, food production—primarily from agricultural land—serves as the starting point for the core value chain. In the Arab region, we found that approximately two-thirds of human-induced land degradation—totaling about 46.4 million hectares—occurs on agricultural land, especially cropland. This degradation threatens food productivity and heightens risks to food security and nutrition, particularly for vulnerable populations.
Reducing land degradation through agricultural land restoration is essential for transitioning to more sustainable agrifood systems, which can support increased and improved food production. However, land degradation is a complex phenomenon, perceived differently at local, national, and global scales. The multitude of interconnected variables makes it challenging to quantify the precise relationships between land degradation and yield gaps [51]. Addressing these challenges requires locally tailored solutions that account for specific agro-ecological conditions and the diversity of production systems [52]. Closing yield gaps without expanding cropland area demands the design of sustainable intensification pathways, along with careful consideration of the trade-offs between yield increases and the degradation of soil and water resources that underpin agricultural productivity [53].
4.3. Restore and Prevent the Degradation of Agricultural Lands
Multiple, tailored solutions and SLM practices can be adopted to avoid, reduce, and restore degraded agricultural land in the countries of the Arab region. These practices could emphasize integrated agrosilvopastoral systems that combine trees, crops, and livestock to enhance productivity, biodiversity, and resilience in arid and semi-arid landscapes. In some countries, agroforestry can play a vital role by improving soil fertility, reducing erosion, and providing shade and fodder, which may support both crops and livestock. Integrated livestock management could promote sustainable grazing through rotational practices and the use of improved forage species, helping to prevent overgrazing and land degradation. Improved water management, continuous crop cover, crop rotations with legumes, diversification, and adaptation strategies—including the use of drought-tolerant and locally adapted crop varieties—can help counter salinization, enhance soil fertility, reduce erosion, mitigate climate risks, and improve food security [54].
Although several Arab countries have set voluntary land degradation neutrality (LDN) targets focused on restoring croplands and pasturelands, progress remains slow. As of 2020, less than 4% of the region’s land was committed to restoration—far below what is needed given rising food insecurity, with 66.1 million people facing hunger [55]. While these commitments show national recognition of land degradation and dedication to sustainable land management (SLM) https://www.unccd.int/our-work/country-profiles/voluntary-ldn-targets (accessed on 30 May 2025), the region lags significantly behind global restoration goals.
Examples of land restoration commitments in the Arab region include Egypt’s targets to avoid, minimize, and reverse land degradation by rehabilitating and enhancing the productivity of approximately 20,000 km2 of cropland and 8000 km2 of rangeland using model agricultural techniques and sustainable land management (SLM) practices. Egypt also aims to rationalize water use by cultivating low-water-requirement crops and adopting modern irrigation systems on about 1000 km2 by 2030. Somalia has pledged to restore and improve the productivity of nearly 45 million hectares of agricultural land through SLM practices by 2030. Meanwhile, Jordan and Sudan focus on enhancing the productivity of rangelands and pastoral systems. Lebanon is committed to promoting sustainable agricultural practices on at least 80,000 hectares, while Saudi Arabia plans to rehabilitate 2.4 million hectares of rangelands by improving vegetation cover and implementing organized grazing to ensure long-term sustainability.
Furthermore, most countries’ Nationally Determined Contributions (NDCs) to the Paris Agreement https://unfccc.int/NDCREG (accessed on 28 May 2025) highlight droughts, forest dieback, shifts in community composition, expansion of drier biomes into marginal lands, habitat degradation, and species loss as major climate change impacts. As part of their adaptation and sustainable development strategies, countries such as Jordan, Lebanon, Morocco, Sudan, and Tunisia are increasing green land area by restoring degraded forest ecosystems and combating land degradation through nature-based solutions like silvopastoralism. These approaches can improve fodder availability for livestock, support forest protection and reforestation, and diversify income sources for communities affected by climate change. In the dryland countries of the Arab region, priority should be given to restoring degraded pastures and rangelands, which are vital for the livelihoods and resilience of populations dependent on agrosilvopastoral systems [56].
This study highlights the potential of restoring 26 million hectares of degraded cropland to reduce the yield gap by up to 50% for oil crops and improve yields of cereals, roots, and tubers. This aligns with previous research suggesting the region could achieve up to a 10% increase in crop yields by 2050 through soil and ecosystem restoration—contrasting sharply with scenarios lacking restoration efforts [57].
The FAO is calling for a global increase in efforts to restore degraded agricultural land, recognizing this as a key step toward transforming agrifood systems. The transformation must reshape the global food system to be more productive, inclusive of poor and marginalized populations, environmentally sustainable, resilient, and capable of delivering healthy and nutritious diets to all. In the Arab region, success in this endeavor depends crucially on the active participation and empowerment of agrosilvopastoral communities in all decision-making and implementation processes [58].
A central challenge of land restoration is deciding at which stage of land degradation to intervene and how much financial investment is required, as these choices directly impact both the cost and effectiveness of actions. The first stage is prevention, aimed at averting degradation before it starts. The second stage is reduction, which addresses ongoing degradation. The third stage is restoration, which deals with land that has already been degraded. Intervening earlier—at the prevention or reduction stages—typically leads to lower costs and better outcomes, while waiting until land is severely degraded leaves only the costly option of restoration [59].
5. Limitations and Uncertainties
The analysis of the spatial distribution of human-induced land degradation is based on multiple input layers, primarily derived from global datasets that assess the biophysical status of the land, its trends, and key drivers. These layers have been developed independently and each contains inherent uncertainties and inaccuracies, challenges that may be further intensified by difficulties in accurately mapping vegetation—especially in arid environments such as those found across the Arab region [60]. While this approach provides an estimate of human impacts on land, it may not fully align with national reporting to the UN Convention to Combat Desertification (UNCCD) or with the statistical processes used by countries to measure and report land degradation. Furthermore, estimates of human-induced degradation in agricultural land can vary significantly depending on the land use/land cover classification and the mapping methodologies applied.
The analysis of land suitability and yield gaps by crop group should be interpreted with caution due to uncertainties in the GAEZ data layers—especially in arid environments—and limitations in FAOSTAT reporting. The accuracy of FAOSTAT agricultural statistics relies on individual countries’ assessments and their response rates to FAO questionnaires, which can vary considerably by region.
These challenges underscore the critical need for close collaboration between FAO and relevant government ministries and agencies in Arab countries to ensure the availability of high-quality data. Such efforts are essential for accurately assessing and effectively combating land degradation in agricultural areas.
6. Conclusions
This paper underscores the alarming rates of agricultural land degradation globally and especially in the Arab region, where two-thirds of the 70 million hectares affected by human-induced degradation—46.5 million hectares—are agricultural land, with cropland particularly vulnerable. This is especially concerning given the region’s already low cropland availability per capita. Key drivers include excessive fertilizer and pesticide use, soil salinization from irrigation, sand and dust storms, rising temperatures, and water scarcity linked to climate change. These factors collectively degrade agricultural lands, undermining agrifood systems and worsening food insecurity and malnutrition. Some countries already face high yield gaps, signaling the urgent need for intervention.
Despite these challenges, opportunities exist to reverse the trend by restoring degraded lands, optimizing land use, and closing yield gaps. Integrated solutions that prevent, reduce, and reverse degradation are essential, with sustainable planning and management of soil, land, and water at the heart of agrifood system transformation.
The international community must prioritize agrifood system changes that achieve land degradation neutrality (LDN), boost productivity, preserve biodiversity, and adapt to climate change and shifting demands. This requires integrated land use planning based on land and crop suitability, yield gap analysis, responsible governance, and secure land tenure. Efficient, inclusive, resilient, and sustainable agrifood systems are critical to advancing climate action, biodiversity conservation, LDN targets, and broader sustainable development goals.
The current land restoration efforts fall short of meeting regional needs. It is vital to establish an initiative in the Arab region focused on agricultural land restoration and tailored to regional specificities. This paper’s findings can support such an initiative, enabling countries to enhance food security, reduce poverty, and contribute to LDN—while also increasing productivity, preserving biodiversity, and strengthening climate adaptation. Building on regional and global momentum—including the Riyadh Action Agenda launched at the UNCCD COP16 (Conference of the Parties)—this initiative should reinforce collaborative efforts to advance land restoration, drought and water resilience, and sustainable agrifood systems, while also helping to prevent further degradation.
Author Contributions
Conceptualization, F.Z. and G.C.; Formal analysis, G.C.; Methodology, F.Z., G.C. and A.B.; Supervision, L.L.; Validation, Visualization, G.C.; Writing—original draft, F.Z. and G.C.; Writing—review and editing, F.Z., G.C., F.H., J.N., M.D., A.B. and L.L. All authors have read and agreed to the published version of the manuscript.
Funding
This research received no external funding.
Institutional Review Board Statement
Not applicable.
Data Availability Statement
The original data presented in the study are openly available at https://zenodo.org/records/15283478 (accessed on 30 May 2025). Country-level information was extracted spatially using the United Nations Administrative Boundaries, version 2023 https://geohub.un.org/webapps/geohub/ (accessed on 30 May 2025). The FAO Land Use, Irrigation and Agricultural Practices Questionnaire, including definitions, can be found at https://www.fao.org/statistics/data-collection/general/en (accessed on 30 May 2025). The Questionnaire is openly available in English, French, Spanish, and Russian.
Acknowledgments
We wish to express our gratitude to the Arab Land and Climate Forum for the opportunity to present part of this work at its third edition, titled “The Road to COP16: Enhancing the Resilience of Arab Lands” (Riyadh, 8–9 October 2024). We thank the two anonymous reviewers for their insightful comments, which significantly contributed to the improvement of the original manuscript.
Conflicts of Interest
The authors declare no conflicts of interest. The views expressed in this work are the authors’ only and cannot be taken to represent the FAO’s views or policy on the subject matter.
Abbreviations
The following abbreviations are used in this manuscript:
| FAO | Food and Agriculture Organization of the United Nations |
| LDN | Land Degradation Neutrality |
| GAEZ | Global Agro-ecological Zoning |
| UNCCD | United Nations Convention to Combat Desertification |
References
- FAO. The State of the World’s Land and Water Resources for Food and Agriculture—Systems at Breaking Point; Main Report; Food and Agriculture Organization (FAO): Rome, Italy, 2022; p. 393. [Google Scholar] [CrossRef]
- Coppus, R. The Global Distribution of Human-Induced Land Degradation and Areas at Risk; SOLAW21 Technical Background Report; Food and Agriculture Organization (FAO): Rome, Italy, 2023; p. 60. [Google Scholar] [CrossRef]
- Smith, P.; Nkem, J.; Calvin, K.; Campbell, D.; Cherubini, F.; Grassi, G.; Korotkov, V.; Le Hoang, A.; Lwasa, S.; McElwee, P.; et al. Interlinkages Between Desertification, Land Degradation, Food Security and Greenhouse Gas Fluxes: Synergies, Trade-Offs and Integrated Response Options. In Climate Change and Land: IPCC Special Report on Climate Change, Desertification, Land Degradation, Sustainable Land Management, Food Security, and Greenhouse Gas Fluxes in Terrestrial Ecosystems; Cambridge University Press: Cambridge, UK, 2019; Chapter 6; pp. 551–672. [Google Scholar] [CrossRef]
- Gerten, D.; Heck, V.; Jägermeyr, J.; Bodirsky, B.L.; Fetzer, I.; Jalava, M.; Kummu, M.; Lucht, W.; Rockström, J.; Schaphoff, S.; et al. Feeding Ten Billion People Is Possible Within Four Terrestrial Planetary Boundaries. Nat. Sustain. 2020, 3, 200–208. [Google Scholar] [CrossRef]
- Ahmed, F.; Shakeel, A.; Ahmad, S.; Kaur, N. Exploring the Linkages Between Land Degradation and Food Insecurity. Asia-Pac. J. Rural. Dev. 2025. Available online: https://journals.sagepub.com/doi/pdf/10.1177/10185291241307272 (accessed on 10 April 2025). [CrossRef]
- FAO. Healthy Soils Are the Basis for Healthy Food Production. 2015 International Year of Soils; Food and Agriculture Organization of the United Nations: Rome, Italy, 2015; p. 4. Available online: https://openknowledge.fao.org/server/api/core/bitstreams/4fb89216-b131-4809-bbed-b91850738fa1/content (accessed on 28 May 2025).
- Borrelli, P.; Robinson, D.A.; Fleischer, L.R.; Lugato, E.; Ballabio, C.; Alewell, C.; Meusburger, K.; Modugno, S.; Schütt, B.; Ferro, V.; et al. An Assessment of the Global Impact of 21st Century Land Use Change on Soil Erosion. Nat. Commun. 2017, 8, 2013. [Google Scholar] [CrossRef]
- Huang, J.; Zhang, G.; Zhang, Y.; Guan, X.; Wei, Y.; Guo, R. Global Desertification Vulnerability to Climate Change and Human Activities. Land Degrad. Dev. 2020, 31, 1380–1391. [Google Scholar] [CrossRef]
- Nkonya, E.; Mirzabaev, A.; Von Braun, J. (Eds.) Economics of Land Degradation and Improvement—A Global Assessment for Sustainable Development; Springer Nature: Washington, DC, USA, 2016; p. 682. Available online: https://library.oapen.org/bitstream/id/f08b4a3f-6ab0-4b20-89f5-73aca59b2bf6/1001884.pdf (accessed on 28 May 2025).
- FAO. Temperature Change Statistics 1961–2024—Global, Regional and Country Trends; FAOSTAT Analytical Briefs, No. 101; FAO: Rome, Italy, 2025; p. 12. [Google Scholar] [CrossRef]
- FAO. FAOSTAT: Temperature Change on Land. Available online: https://www.fao.org/faostat/en/#data/ET (accessed on 28 May 2025).
- UNCCD. Global Drought Snapshot 2023: The Need for Proactive Action; United Nations Convention to Combat Desertification (UNCCD). 2023, p. 38. Available online: https://www.unccd.int/sites/default/files/2023-12/Global%20drought%20snapshot%202023.pdf (accessed on 28 May 2025).
- Nasrnia, F.; Ashktorab, N. Sustainable Livelihood Framework-Based Assessment of Drought Resilience Patterns of Rural Households of Bakhtegan Basin, Iran. Ecol. Indic. 2021, 128, 107817. [Google Scholar] [CrossRef]
- Alfani, F.; Pallante, G.; Palma, A.; Talhaoui, A. When the Rain Stops Falling. Effects of Droughts on the Tunisian Labor Market; Policy Research Working Paper 10766; World Bank—Poverty and Equity Global Practice: Washington, DC, USA, 2024; p. 33. Available online: https://documents1.worldbank.org/curated/en/099212205072411678/pdf/IDU17a7c9a48121f714d881aa161861bb79f46e4.pdf (accessed on 28 May 2025).
- Tian, H.; Bian, Z.; Shi, H.; Qin, X.; Pan, N.; Lu, C.; Pan, S.; Tubiello, F.N.; Chang, J.; Conchedda, G.; et al. History of Anthropogenic Nitrogen Inputs (HaNi) to the Terrestrial Biosphere: A 5-Arcmin Resolution Annual Dataset from 1860 to 2019. Earth Syst. Sci. Data Discuss. 2022, 2022, 1–32. [Google Scholar] [CrossRef]
- Maggi, F.; Tang, F.H.; Tubiello, F.N. Agricultural Pesticide Land Budget and River Discharge to Oceans. Nature 2023, 620, 1013–1017. [Google Scholar] [CrossRef]
- Tang, F.H.; Malik, A.; Li, M.; Lenzen, M.; Maggi, F. International Demand for Food and Services Drives Environmental Footprints of Pesticide Use. Commun. Earth Environ. 2022, 3, 272. [Google Scholar] [CrossRef]
- UNCCD. The Global Land Outlook, Second Edition; United Nations Convention to Combat Desertification (UNCCD): Bonn, Germany, 2022; p. 176. Available online: https://www.unccd.int/sites/default/files/2022-04/UNCCD_GLO2_low-res_2.pdf (accessed on 28 May 2025).
- UNCCD; WOCAT The Land Story. Country Experiences with Reporting on Land Degradation and Drought; United Nations Convention to Combat Desertification (UNCCD) and World Overview of Conservation Approaches and Technologies (WOCAT): Bonn, Germany; WOCAT and Centre for Development and Environment (CDE), University of Bern: Bern, Switzerland, 2024; p. 95. Available online: https://www.unccd.int/sites/default/files/2024-11/58214%20The%20Land%20Story_web.pdf (accessed on 28 May 2025).
- FAO. FAOSTAT: Land Use. Available online: https://www.fao.org/faostat/en/#data/RL (accessed on 28 May 2025).
- Crumpler, K.; Gagliardi, G.; Wong, T.; Monem, M.A.; Federici, S.; Dasgupta, S.; Meybeck, A.; Buto, O.; Toepper, J.; Salvatore, M.; et al. Regional Analysis of the Nationally Determined Contributions in the Near East and North Africa: Opportunities and Gaps in the Agriculture, Water and Land Use Sectors; Environment and Natural Resources Management WORKING Paper; Food and Agriculture Organization (FAO): Rome, Italy, 2022; p. 117. [Google Scholar] [CrossRef]
- FAO. Repurposing Agricultural Subsidies for Sustainable and Resilient Agrifood Systems in the Near East and North Africa Region—Key Issues and Future Agenda; Food and Agriculture Organization (FAO): Cairo, Egypt, 2024; p. 115. [Google Scholar] [CrossRef]
- FAO. Near East Forestry and Range Commission (NEFRC) Forest and Agriculture Linkages: Strengthening Forest and Rangeland Resilience Through Restoring Silvopastoral Systems for Better Drought and Economic Management—NEFRC/2023/4; Near East Forestry and Range Commission (NEFRC) 26th Session; Food and Agriculture Organization (FAO): Rome, Italy, 2023; p. 10. Available online: https://openknowledge.fao.org/handle/20.500.14283/cc7544en (accessed on 28 May 2025).
- FAO. Land Degradation Assessment in Drylands (LADA). In Methodology and Results; Food and Agriculture Organization of the United Nations (FAO): Rome, Italy, 2013; p. 56. Available online: https://www.fao.org/4/i3241e/i3241e.pdf (accessed on 28 May 2025).
- Nachtergaele, F.; Petri, M.; Biancalani, R. Land Degradation. In World Soil Resources and Food Security; Lal, R., Stewart, B.A., Eds.; Advances in Soil Science; CRC Press: Boca Raton, FL, USA, 2011; Chapter 10; pp. 471–498. [Google Scholar]
- FAO. IIASA Share of Land Cover Class (Global ~ 1km)—GAEZ V5 2025. Available online: https://data.apps.fao.org/catalog/iso/f7bee2f1-3a48-4e86-a1d2-387023dec04619 (accessed on 28 May 2025).
- Fritz, S.; See, L.; Perger, C.; McCallum, I.; Schill, C.; Schepaschenko, D.; Duerauer, M.; Karner, M.; Dresel, C.; Laso-Bayas, J.-C.; et al. A Global Dataset of Crowdsourced Land Cover and Land Use Reference Data. Sci. Data 2017, 4, 1–8. [Google Scholar] [CrossRef]
- Potapov, P.; Hansen, M.C.; Pickens, A.; Hernandez-Serna, A.; Tyukavina, A.; Turubanova, S.; Zalles, V.; Li, X.; Khan, A.; Stolle, F.; et al. The Global 2000–2020 Land Cover and Land Use Change Dataset Derived from the Landsat Archive: First Results. Front. Remote Sens. 2022, 3, 856903. [Google Scholar] [CrossRef]
- Tubiello, F.N.; Conchedda, G.; Casse, L.; Hao, P.; Zhongxin, C.; De Santis, G.; Fritz, S.; Muchoney, D. High Resolution Cropland Agreement Map (30 m) circa 2020. 2022. Available online: https://zenodo.org/records/7244124 (accessed on 28 May 2025).
- Tubiello, F.N.; Conchedda, G.; Casse, L.; Pengyu, H.; Zhongxin, C.; De Santis, G.; Fritz, S.; Muchoney, D. Measuring the World’s Cropland Area. Nat. Food 2023, 4, 30–32. [Google Scholar] [CrossRef] [PubMed]
- Mehta, P.; Siebert, S.; Kummu, M.; Deng, Q.; Ali, T.; Marston, L.; Xie, W.; Davis, K.F. Half of Twenty-First Century Global Irrigation Expansion Has Been in Water-Stressed Regions. Nat. Water 2024, 2, 254–261. [Google Scholar] [CrossRef]
- Oliveira, J.; Campbell, E.E.; Lamparelli, R.A.; Figueiredo, G.K.; Soares, J.R.; Jaiswal, D.; Monteiro, L.A.; Vianna, M.S.; Lynd, L.R.; Sheehan, J.J. Choosing Pasture Maps: An Assessment of Pasture Land Classification Definitions and a Case Study of Brazil. Int. J. Appl. Earth Obs. Geoinf. 2020, 93, 102205. [Google Scholar] [CrossRef]
- Parente, L.; Sloat, L.; Mesquita, V.; Consoli, D.; Stanimirova, R.; Hengl, T.; Bonannella, C.; Teles, N.; Wheeler, I.; Hunter, M.; et al. Annual 30-m Maps of Global Grassland Class and Extent (2000–2022) Based on Spatiotemporal Machine Learning. Sci. Data 2024, 11, 1–22. [Google Scholar] [CrossRef] [PubMed]
- FAO. IIASA Global Agro-Ecological Zoning Version 5 (GAEZ v5) Model Documentation 2025. Available online: https://github.com/un-fao/gaezv5/wiki (accessed on 28 May 2025).
- Fischer, G.; Nachtergaele, F.; van Velthuizen, H.; Chiozza, F.; Franceschini, G.; Henry, M.; Muchoney, D.; Tramberend, S. Global Agro-Ecological Zones v4—Model Documentation; Food and Agriculture Organization of the United Nations (FAO): Rome, Italy, 2021; p. 288. Available online: https://openknowledge.fao.org/server/api/core/bitstreams/6b7b9b4a-dbac-4af4-a2cb-26aff33a30e5/content (accessed on 28 May 2025).
- FAO. FAOSTAT: Crops and Livestock Products. Available online: https://www.fao.org/faostat/en/#data/QCL (accessed on 28 May 2025).
- ESCWA. Her Land. Her Rights. Equal Land Rights: A Pathway to Combating Desertification in the Arab Region 2023. 12p. Available online: https://www.unescwa.org/sites/default/files/pubs/pdf/factsheet-her-land-her-right-english.pdf (accessed on 28 May 2025).
- FAO. AQUASTAT Core Database. Available online: https://data.apps.fao.org/aquastat/?lang=en (accessed on 28 May 2025).
- FAO. FAOSTAT: Emissions Totals. Available online: https://www.fao.org/faostat/en/#data/GT (accessed on 28 May 2025).
- FAO. FAOSTAT: Pesticides Use. Available online: https://www.fao.org/faostat/en/#data/RP (accessed on 28 May 2025).
- FAO. FAOSTAT: Fertilizers by Nutrients. Available online: https://www.fao.org/faostat/en/#data/RFN (accessed on 28 May 2025).
- Nguyen, T.H.; Tang, F.H.; Conchedda, G.; Casse, L.; Obli-Laryea, G.; Tubiello, F.N.; Maggi, F. NPKGRIDS: A Global Georeferenced Dataset of N, P2O5, and K2O Fertilizer Application Rates for 173 Crops. Sci. Data 2024, 11, 1179. [Google Scholar] [CrossRef]
- FAO. FAOSTAT: Cropland Nutrient Balance. Available online: https://www.fao.org/faostat/en/#data/ESB (accessed on 28 May 2025).
- Ludemann, C.I.; Wanner, N.; Chivenge, P.; Dobermann, A.; Einarsson, R.; Grassini, P.; Gruere, A.; Jackson, K.; Lassaletta, L.; Maggi, F.; et al. A Global FAOSTAT Reference Database of Cropland Nutrient Budgets and Nutrient Use Efficiency (1961–2020): Nitrogen, Phosphorus and Potassium. Earth Syst. Sci. Data 2024, 16, 525–541. [Google Scholar] [CrossRef]
- Abay, K.A.; Abdelfattah, L.; El-Enbaby, H.; Mahmoud, M.; Breisinger, C. Plot Size and Sustainable Input Intensification in Smallholder Irrigated Agriculture: Evidence from Egypt. Agric. Econ. 2022, 53, 792–810. [Google Scholar] [CrossRef]
- FAO. Sand and Dust Storms (SDS): A Transboundary Issue of Growing Concern; Food and Agriculture Organization (FAO): Rome, Italy, 2022; p. 4. Available online: https://openknowledge.fao.org/handle/20.500.14283/cc0109en (accessed on 28 May 2025).
- FAO. Sand and Dust Storms A Guide to Mitigation, Adaptation, Policy and Risk Management Measures in Agriculture; Food and Agriculture Organization (FAO): Rome, Italy, 2023; p. 150. [Google Scholar] [CrossRef]
- Zdruli, P.; Zucca, C. Restoring Land and Soil Health to Ensure Sustainable and Resilient Agriculture in the Near East and North Africa Region—State of Land and Water Resources for Food and Agriculture Thematic Paper; FAO: Cairo, Egypt, 2023; p. 80. [Google Scholar] [CrossRef]
- FAO. FAOSTAT: Annual population. Available online: https://www.fao.org/faostat/en/#data/OA (accessed on 28 May 2025).
- Nguyen, H. Sustainable Food Systems: Concept and Framework; FAO: Cairo, Egypt, 2018; p. 8. Available online: https://openknowledge.fao.org/server/api/core/bitstreams/b620989c-407b-4caf-a152-f790f55fec71/content (accessed on 28 May 2025).
- Sonneveld, B.; Keyzer, M.; Ndiaye, D. Quantifying the Impact of Land Degradation on Crop Production: The Case of Senegal. Solid Earth 2016, 7, 93–103. [Google Scholar] [CrossRef]
- Bindraban, P.S.; van der Velde, M.; Ye, L.; Van den Berg, M.; Materechera, S.; Kiba, D.I.; Tamene, L.; Ragnarsdóttir, K.V.; Jongschaap, R.; Hoogmoed, M.; et al. Assessing the Impact of Soil Degradation on Food Production. Curr. Opin. Environ. Sustain. 2012, 4, 478–488. [Google Scholar] [CrossRef]
- Smerald, A.; Fuchs, K.; Kraus, D.; Butterbach-Bahl, K.; Scheer, C. Significant Global Yield-Gap Closing Is Possible without Increasing the Intensity of Environmentally Harmful Nitrogen Losses. Front. Sustain. Food Syst. 2022, 6, 736394. [Google Scholar] [CrossRef]
- Liniger, H.P.; Mekdaschi Studer, R.; Hauert, C.; Gurtner, M. Sustainable Land Management in Practice—Guidelines and Best Practices for Sub-Saharan Africa Field Application; TerrAfrica, World Overview of Conservation Approaches and Technologies (WOCAT) and Food and Agriculture Organization of the United Nations (FAO): Cairo, Egypt, 2011; p. 243. Available online: https://www.fao.org/4/i1861e/i1861e.pdf (accessed on 28 May 2025).
- Sewell, A.; van der Esch, S.; Löwenhardt, H. Goals and Commitments for the Restoration Decade: A Global Overview of Countries’ Restoration Commitments under the Rio Conventions and Other Pledges; PBL Netherlands Environmental Assessment Agency: The Hague, The Netherlands, 2020; p. 37. Available online: https://www.pbl.nl/uploads/default/downloads/pbl-2020-goals-and-commitments-for-the-restoration-decade-3906.pdf (accessed on 28 May 2025).
- Haddad, F.F.; Herrera, P.M.; Besbes, B. Grazing with Trees: A Silvopastoral Approach to Managing and Restoring Drylands; FAO Forestry Paper; Food and Agriculture Organization of the United Nations (FAO): Rome, Italy, 2022; Volume 187, p. 180. ISBN 978-92-5-136956-2. [Google Scholar]
- van der Esch, S.; Sewell, A.; Bakkenes, M.; Doelman, J.; Stehfest, E.; Langhans, C.; Bouwman, A.; ten Brink, B.; Berkhout, E.; Fleskens, L. The Global Potential for Land Restoration: Scenarios for the Global Land Outlook 2; PBL Netherlands Environmental Assessment Agency: The Hague, The Netherlands, 2022; p. 190. Available online: https://www.pbl.nl/sites/default/files/downloads/pbl-2022-the-global-potential-for-land-restoration-glo2-4816.pdf (accessed on 28 May 2025).
- Haddad, F.F.; Ariza, C.; Malmer, A. Building Climate-Resilient Dryland Forests and Agrosilvopastoral Production Systems: An Approach for Context-Dependent Economic, Social and Environmentally Sustainable Transformations; Forestry Working Paper; Food and Agriculture Organization of the United Nations (FAO): Rome, Italy, 2021; Volume 22, p. 80. ISBN 978-92-5-134119-3. [Google Scholar]
- Ziadat, F.; Zdruli, P.; Christiansen, S.; Caon, L.; Abdel Monem, M.; Fetsi, T. An Overview of Land Degradation and Sustainable Land Management in the near East and North Africa. Sustain. Agric. Res. 2022, 11, 11–24. [Google Scholar] [CrossRef]
- Almalki, R.; Khaki, M.; Saco, P.M.; Rodriguez, J.F. Monitoring and Mapping Vegetation Cover Changes in Arid and Semi-Arid Areas Using Remote Sensing Technology: A Review. Remote Sens. 2022, 14, 5143. [Google Scholar] [CrossRef]
Disclaimer/Publisher’s Note: The statements, opinions and data contained in all publications are solely those of the individual author(s) and contributor(s) and not of MDPI and/or the editor(s). MDPI and/or the editor(s) disclaim responsibility for any injury to people or property resulting from any ideas, methods, instructions or products referred to in the content. |
© 2025 by the authors. Licensee MDPI, Basel, Switzerland. This article is an open access article distributed under the terms and conditions of the Creative Commons Attribution (CC BY) license (https://creativecommons.org/licenses/by/4.0/).