Article

A Recognition Method for Adzuki Bean Rust Disease Based on Spectral Processing and Deep Learning Model

College of Information and Electrical Engineering, Heilongjiang Bayi Agricultural University, Daqing 163319, China
*
Author to whom correspondence should be addressed.
Agriculture 2025, 15(12), 1246; https://doi.org/10.3390/agriculture15121246
Submission received: 11 April 2025 / Revised: 1 June 2025 / Accepted: 5 June 2025 / Published: 7 June 2025
(This article belongs to the Section Digital Agriculture)

Abstract

:
Adzuki bean rust disease is an important factor restricting the yield of the adzuki bean. Late prevention and control at the early stage of the disease will lead to crop failure. Traditional diagnosis methods of adzuki bean rust disease mainly rely on field observations and laboratory tests, which are inefficient, time-consuming, highly dependent on professional knowledge, and cannot meet the requirements of modern agriculture for rapid and accurate diagnosis. To address this issue, a diagnosis method of adzuki bean rust disease was proposed using spectroscopy and deep learning methods. First, visible/near-infrared (UV/VNIR) spectroscopy was used to extract the spectral information of leaves, and discrete wavelet transform (DWT) was applied to preprocess and smooth the original canopy spectral data to effectively reduce the impact of noise interference. Second, the competitive adaptive reweighted sampling (CARS) algorithm was implemented in the range of 425–825 nm to determine the optimal characteristic wavenumbers, thereby reducing data redundancy. Finally, 51 characteristic wavenumbers were selected and imported into the LeNet-5 deep learning model for simulation and evaluation. The results showed that the accuracy, precision, recall, and F1 score on the test set were 99.65%, 98.04%, 99.01%, and 98.52%, respectively. The proposed DWT-CARS-LeNet-5 model can diagnose adzuki bean rust quickly, accurately, and non-destructively. This method can provide a cutting-edge solution for improving the accuracy of prevention and control of adzuki bean rust disease in agricultural practice.

1. Introduction

Rust is one of the most serious diseases in adzuki bean production. It is caused by the parasitic fungus Uromyces vignae Barclay [1]. It has a long incubation period, and the summer spores of the pathogen are mainly spread by air currents. It can infect multiple times in a growing season, causing large-scale outbreaks and crop damage [2]. The disease begins to destroy the chloroplast structure of mesophyll cells during the incubation period (3–5 days after inoculation). At this time, the leaves only show chlorotic spots with diameters ranging from 0.1 to 0.5 mm. Traditional visual detection, while reliant on professional expertise, is also inefficient [3]. At present, rust infection is generally detected by traditional chemical methods, and there is a lack of diagnostic systems for adzuki bean rust. As a result, it is very easy to miss the best prevention and control period in production, leading to large-scale outbreaks and epidemics of the disease, causing serious yield losses and quality declines in adzuki beans [4]. Therefore, the development of early rapid diagnosis technology for adzuki bean rust can provide technical support for timely and effective disease prevention and control in production, reduce losses, and prevent environmental hazards caused by repeated use of pesticides.
With the rise of smart agriculture, the deep integration of the non-destructive analytical capability inherent in spectroscopy technology and machine learning has become a hot topic in crop disease diagnosis research. In the field of crop disease diagnosis, when plants become infected, their photosynthetic processes on the leaf surfaces are directly impaired [5]. As photosynthesis changes, the chlorophyll content of cells inside plant leaves will change, which in turn affects the reflectivity of diseased leaves under UV/VNIR light, producing different spectral characteristics [6]. In recent years, machine learning methods such as random forests (RFs), support vector machines (SVMs), and decision trees (DTs) have become effective tools for spectral data analysis. However, traditional machine learning methods have limitations such as strong reliance on feature engineering and bottlenecks in small sample modeling. Deep learning, with its advantage of adaptive learning of large samples, has gradually become a new engine for agricultural spectral analysis. Convolutional neural network (CNN) and deep learning models based on or improved from convolutional networks have shown unique advantages in plant disease spectral analysis. Some scholars have used improved deep convolutional neural networks to train and test comprehensive data sets of multiple plant species and disease categories, with a model accuracy rate of 98% [7]. Jixuehan et al. used Raman spectroscopy combined with CNN to detect rice bacterial blight in living organisms. The accuracy of early disease detection in this study was 87.02% [8]. Dengjie et al. achieved early detection of stripe rust in 1520 local wheat varieties by improving the structure, loss function, and evaluation index of CNN [9]. Zhangke et al. introduced an object detection module before CNN, which improved the network speed and efficiency while detecting early pepper rust [10]. Yuxincai et al. applied a residual network (ResNet) based on CNN to detect citrus fungal diseases [11]. These breakthroughs confirm the advantages of deep learning in the field of agricultural spectroscopy, but there is a lack of deep analysis models suitable for UV/VNIR spectral data after adzuki bean rust infection, especially the low diagnostic accuracy in the early stage of the disease. Therefore, this study applied deep learning to construct an adzuki bean rust diagnosis model and proposed an adzuki bean rust diagnosis method based on the combination of spectroscopy technology and deep learning.
Thus, in this study, a diagnostic method for adzuki bean rust disease was proposed by integrating spectroscopy with a one-dimensional convolutional neural network (1D-CNN). First, the canopy of adzuki bean plants was selected as the research subject, and the spectral data of the canopy was preprocessed using wavelet transform. Next, feature extraction was performed on the preprocessed data. Finally, the extracted features were input into the developed model for the accurate diagnosis of adzuki bean rust disease. The proposed method can provide an intelligent, efficient, and rapid method for automated disease detection.

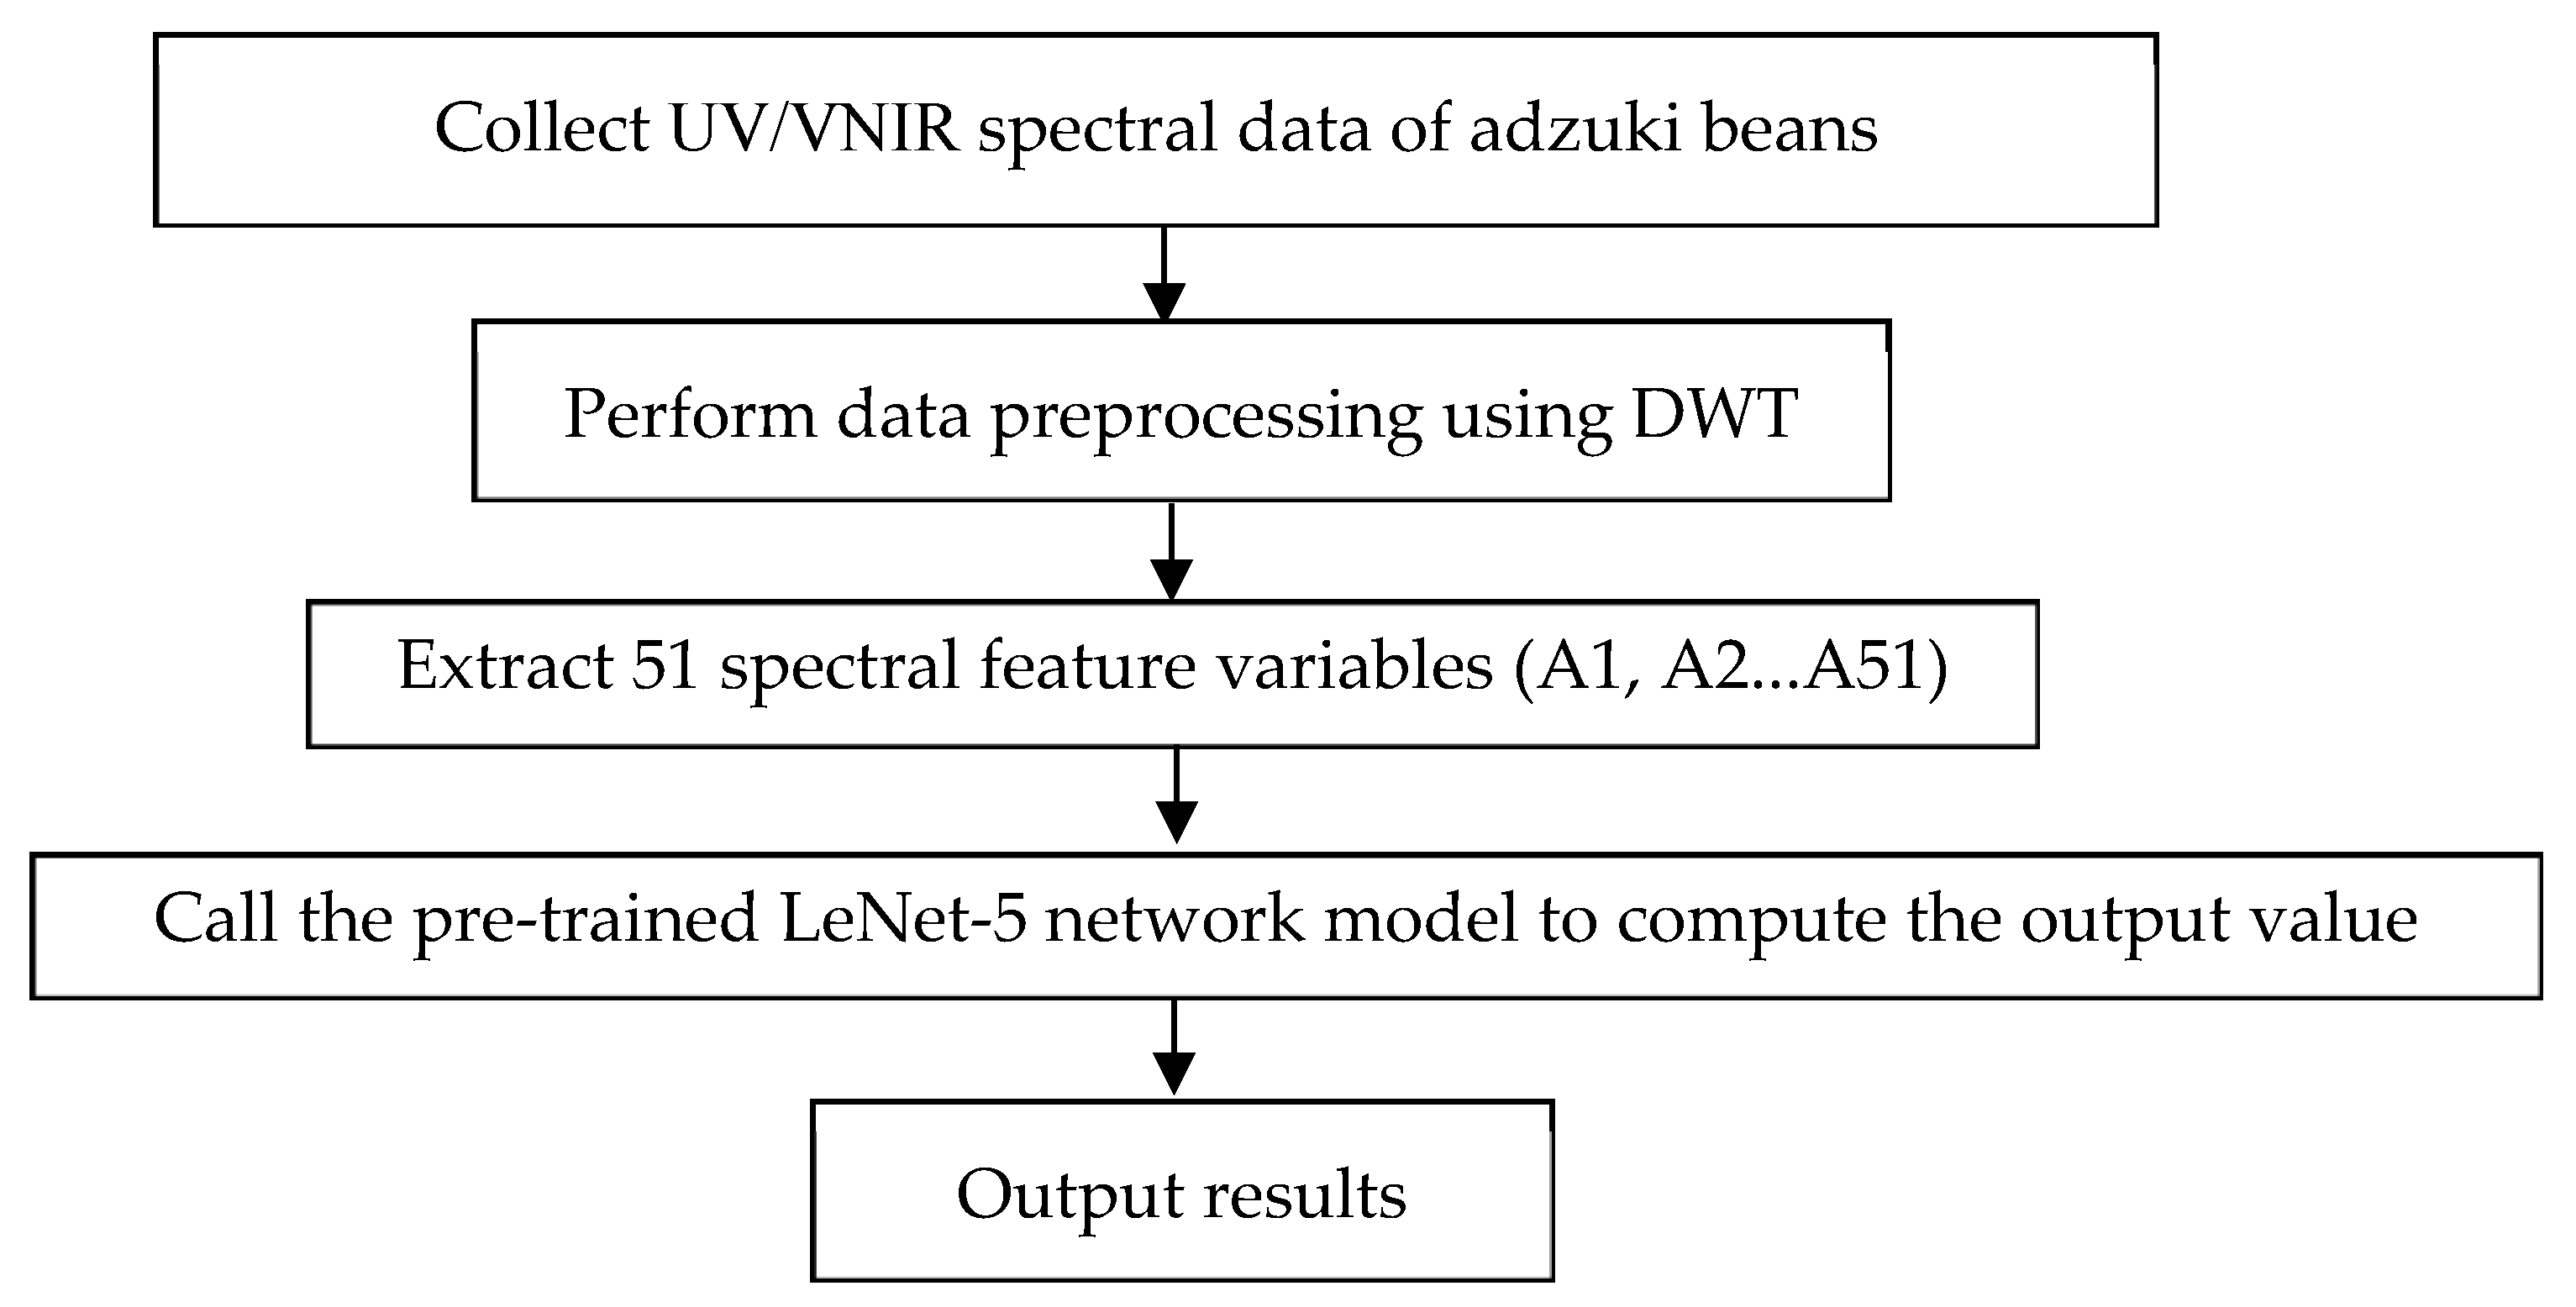
2. Materials and Methods

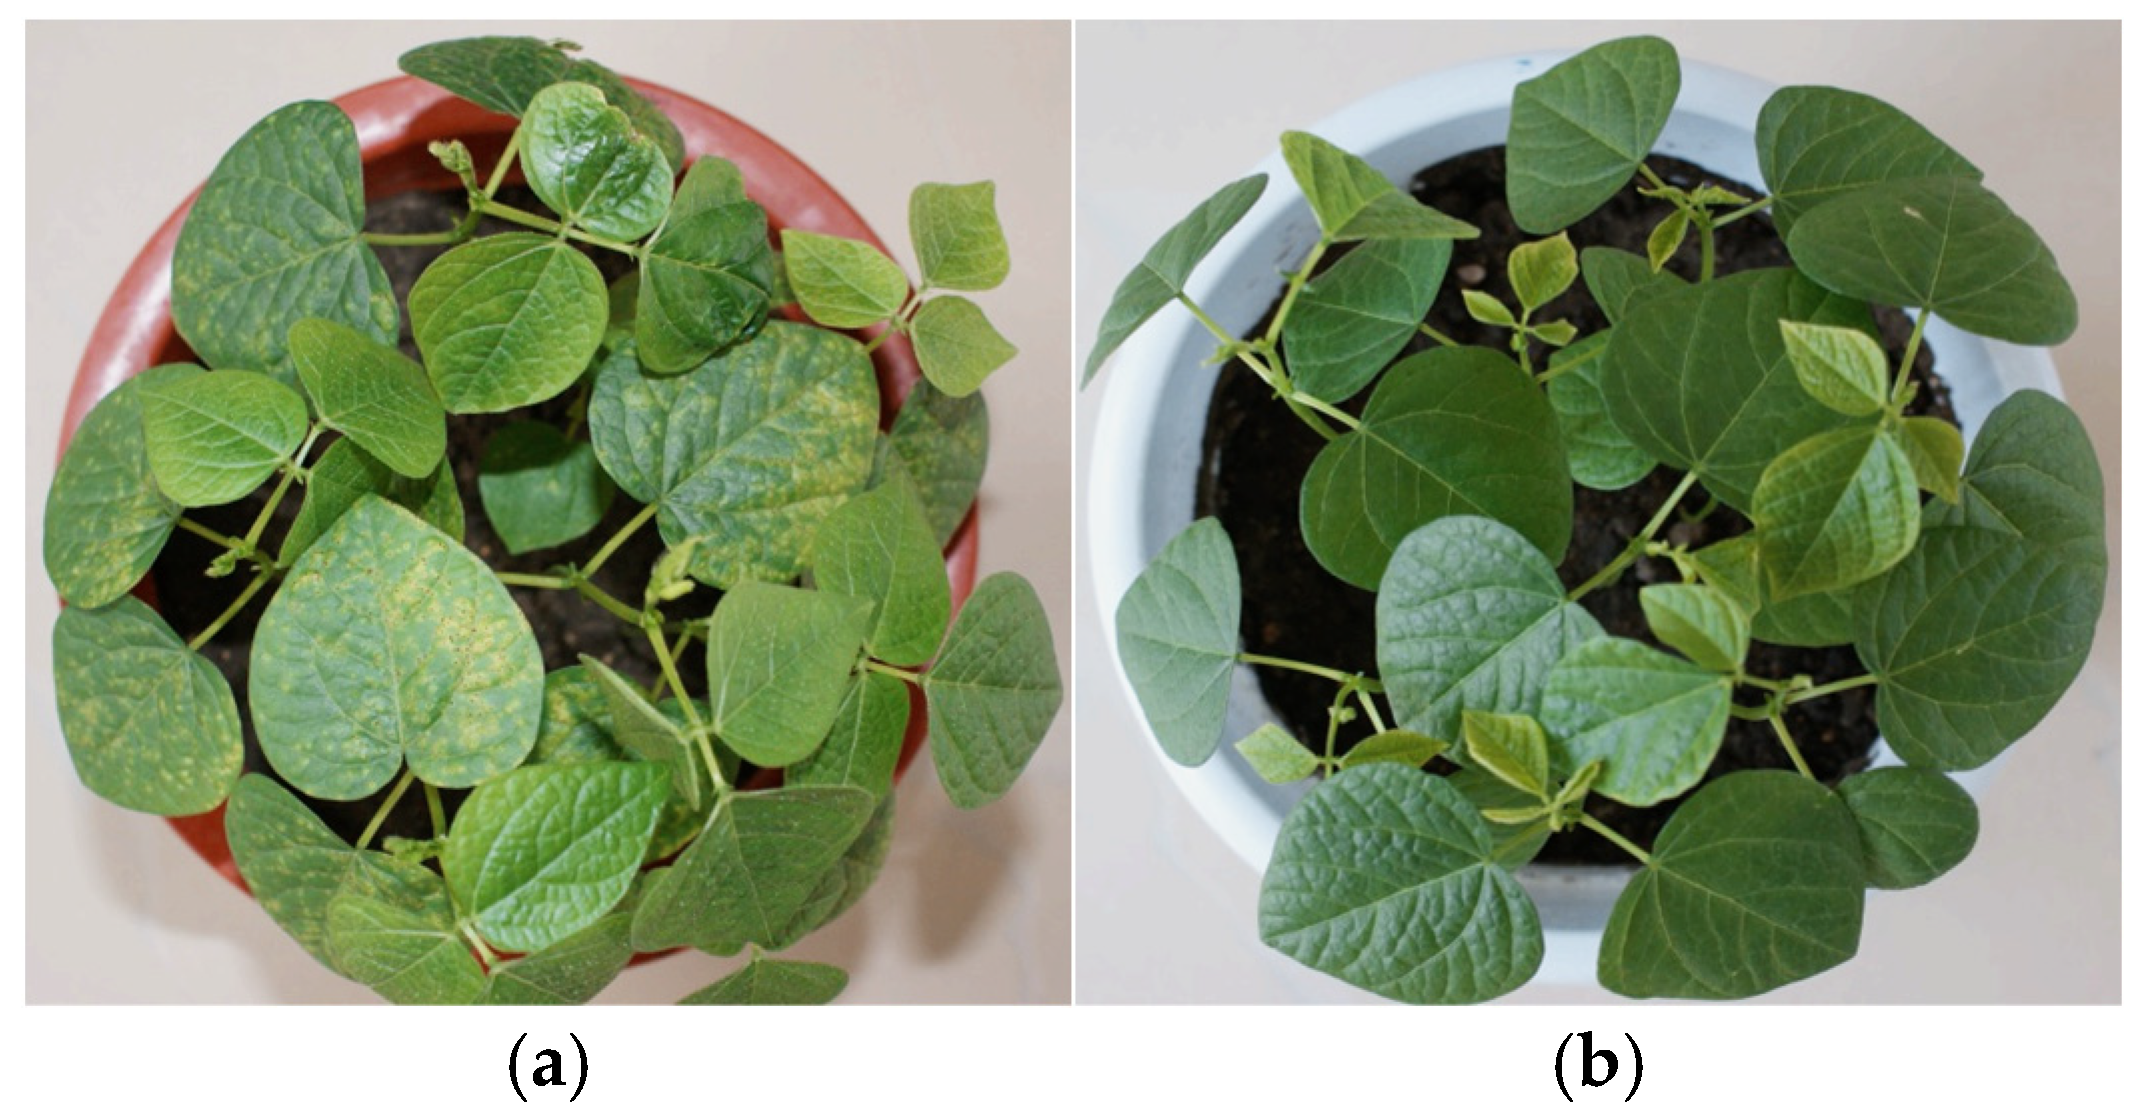
2.1. Preparation of Adzuki Bean Samples

The cultivation and data collection for this experiment were conducted in Heilongjiang Bayi Agricultural University, Heilongjiang Province, China (46°35′ N, 125°10′ E). In this study, Baqing adzuki beans were selected as the research subject and cultivated under controlled conditions in an artificial climate laboratory in Heilongjiang Bayi Agriculture University. After carefully selecting high-quality disinfecting, the seeds were sown in pots, with eight plants in each pot. Once each seedling had developed at least three fully expanded leaves, it was inoculated with rust fungus hyphae. The infected group was treated with a uniform spray of rust spore suspension, while the control group (healthy group) was sprayed uniformly with distilled water. Based on the inoculation success rate and plant growth characteristics (phenotypic traits such as plant height, canopy width, and leaf area), three representative plants were selected from each pot for data acquisition. In total, 30 pots of healthy plants and 50 pots of infected plants were selected for this experiment. The experimental period lasted for 10 days. The spectral characteristics of healthy and diseased plants are presented in Figure 1.

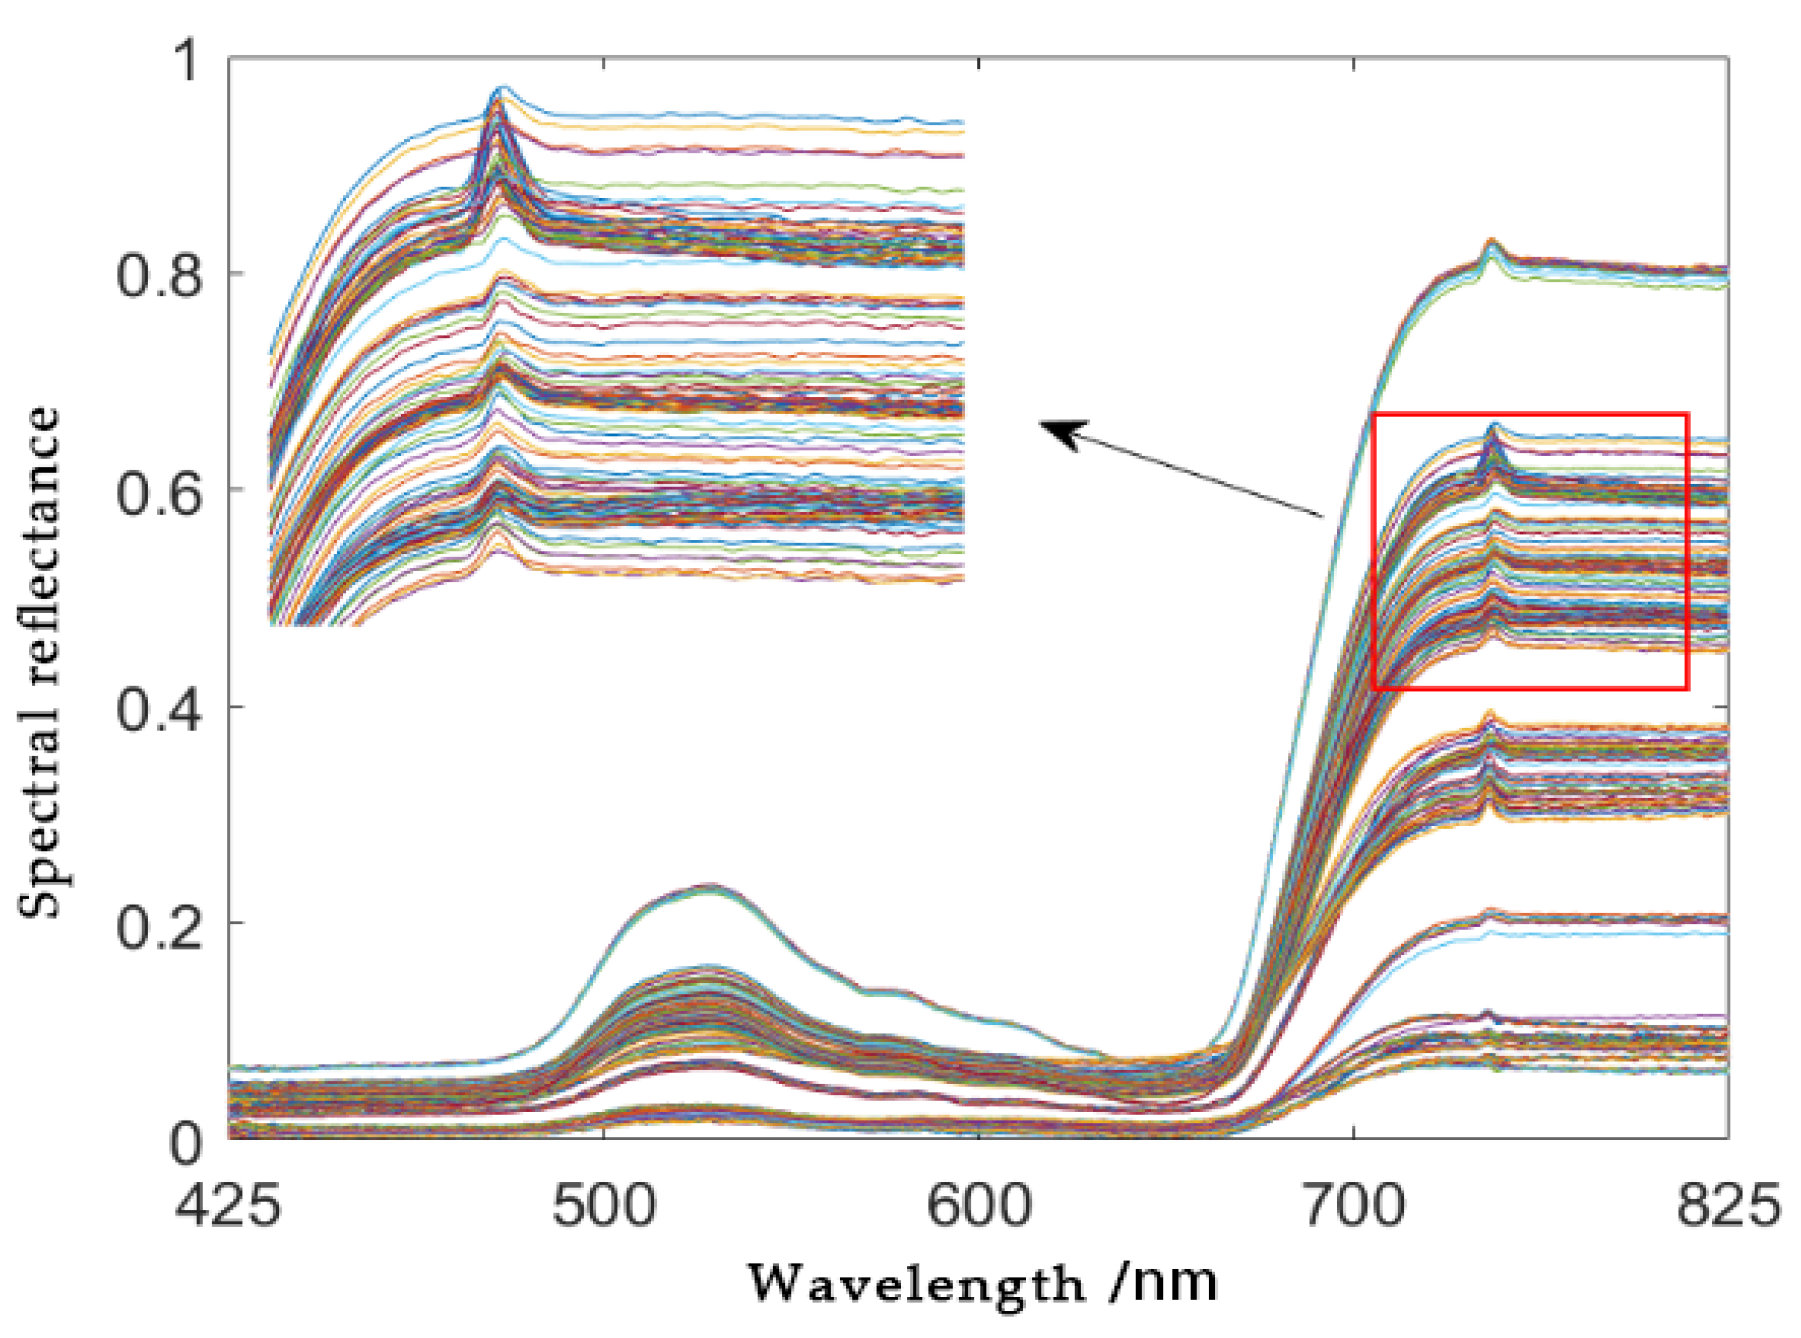
2.2. Spectral Data Acquisition for Adzuki Beans

A handheld UV/VNIR spectrometer (FieldSpec UV/VNIR, ASD Inc., USA) was used to scan both diseased and healthy adzuki bean plants. The measurement range is from 325 nm to 1075 nm, with a sampling interval of 3 nm and 32 scans per measurement. To minimize the interference from external environmental factors, the experiment was conducted in a controlled greenhouse environment, with a fixed acquisition time set at 10:30 a.m. per day. Vertical scanning was performed at a distance of 20 cm above the canopy for the adzuki bean plants. Prior to each measurement, full white calibration was performed using a standard white board with 100% reflectance. Visible/NIR spectral data were systematically acquired from the canopies of both healthy and diseased adzuki bean plants.
To prevent potential data leakage and overfitting in subsequent modeling, the three plants in each pot were uniquely numbered and marked during the initial spectral data acquisition. Two plants were randomly selected and assigned the same number (A), while the remaining plant was assigned a different number (B). Three sets of spectral data were acquired for each plant; thus, nine sets of spectral data per pot were obtained. Consequently, in the entire acquisition period, 2700 sets of spectral data for healthy plants and 4500 sets for diseased plants were acquired. Finally, 4800 sets and 2400 sets were used for training and test, respectively, according to the ratio of 2:1. The UV/VNIR spectral data of adzuki beans collected in this study are presented in Figure 2.
In Figure 2, within the wavenumbers range of 325–1075 nm, the spectral curves from 325 to 424 nm and 826 to 1075 nm were significantly impacted by noise due to solar interference, leading to the occurrence of spectral line wing artifacts. Consequently, data within the 425–825 nm spectral band was selected as the foundation for subsequent analyses.

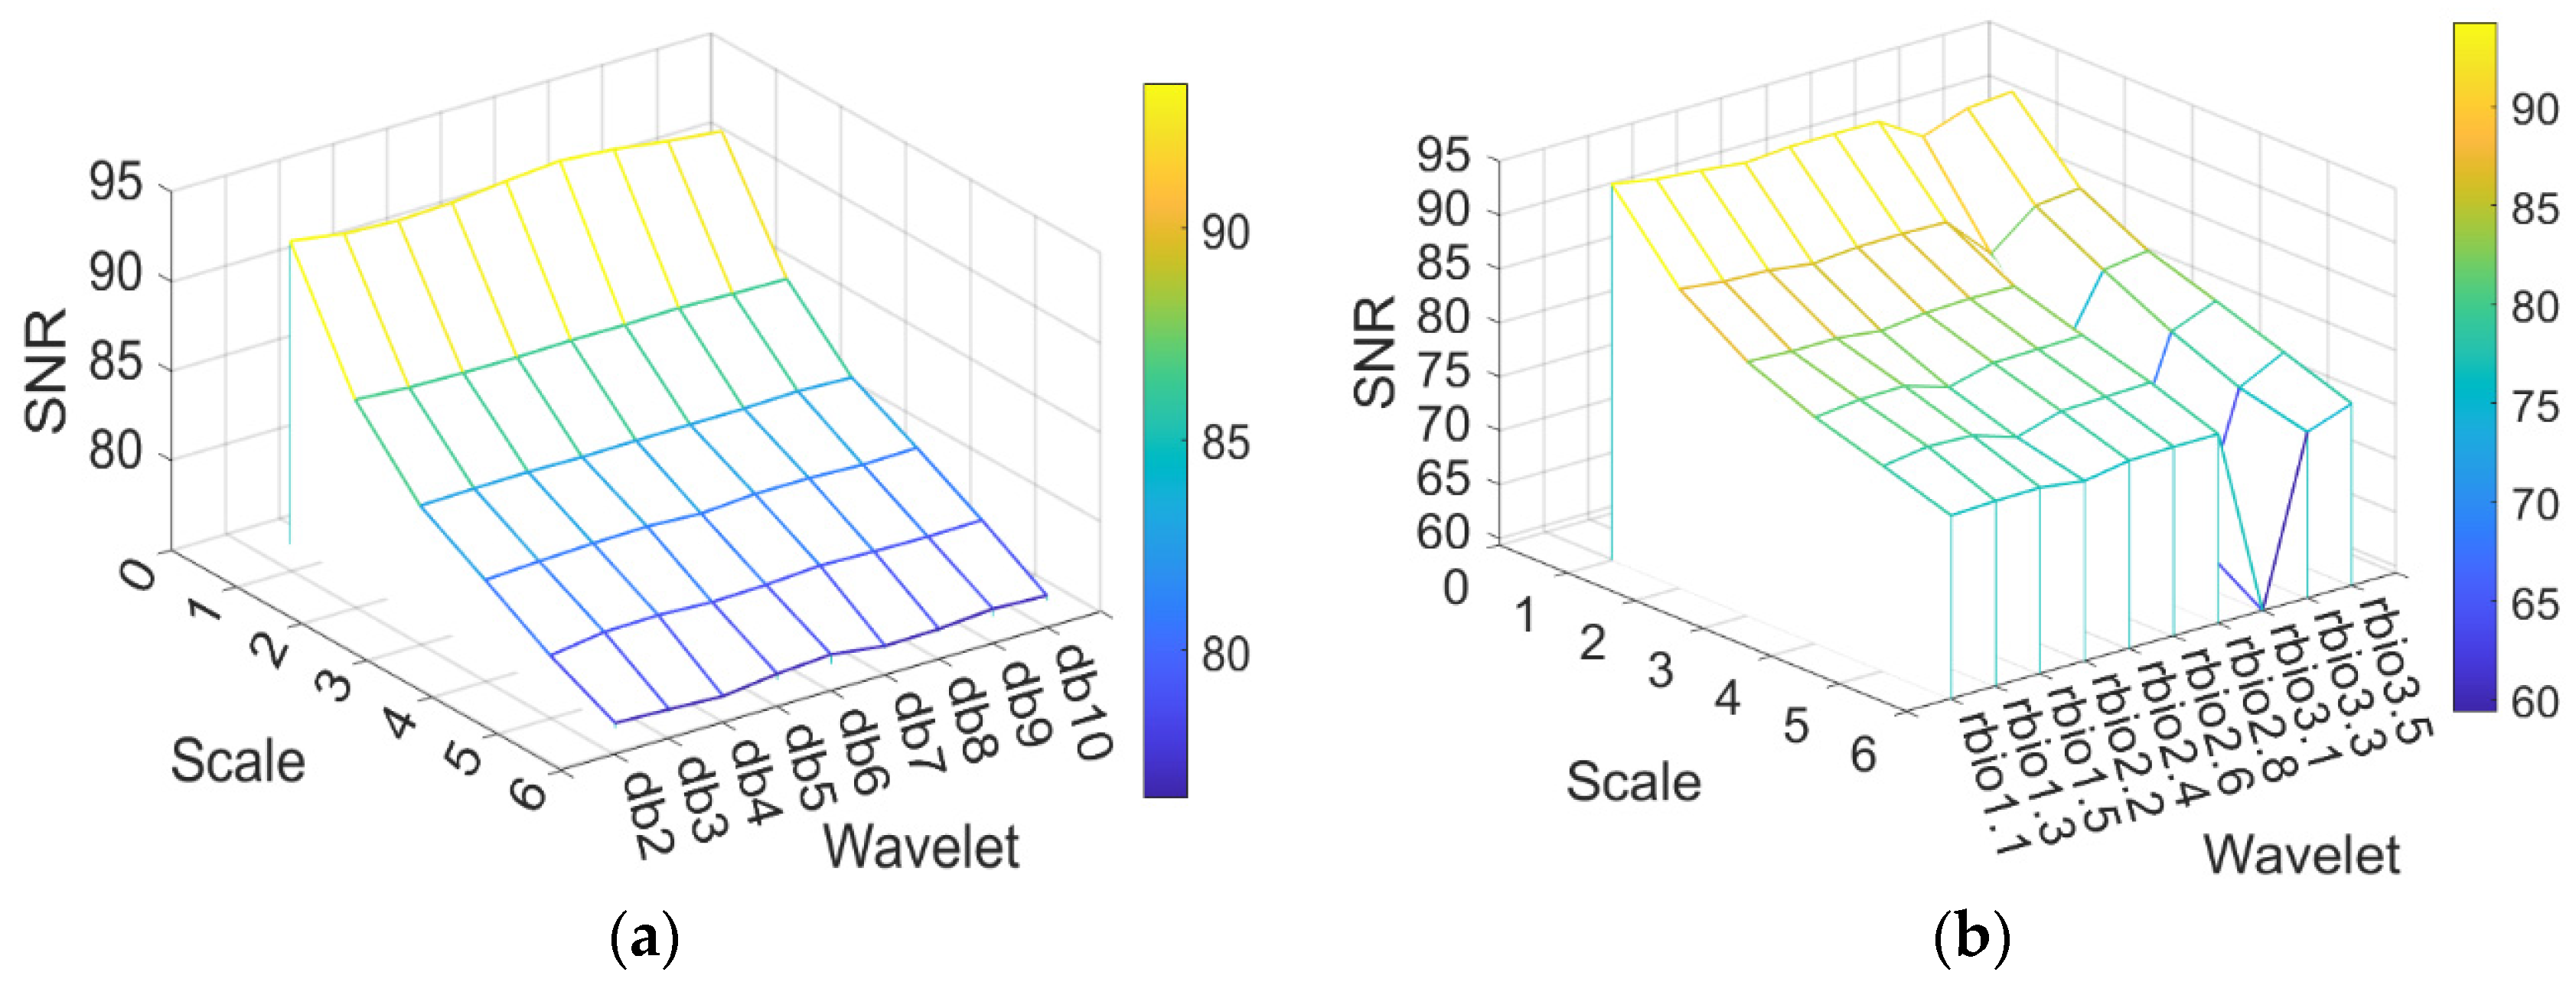
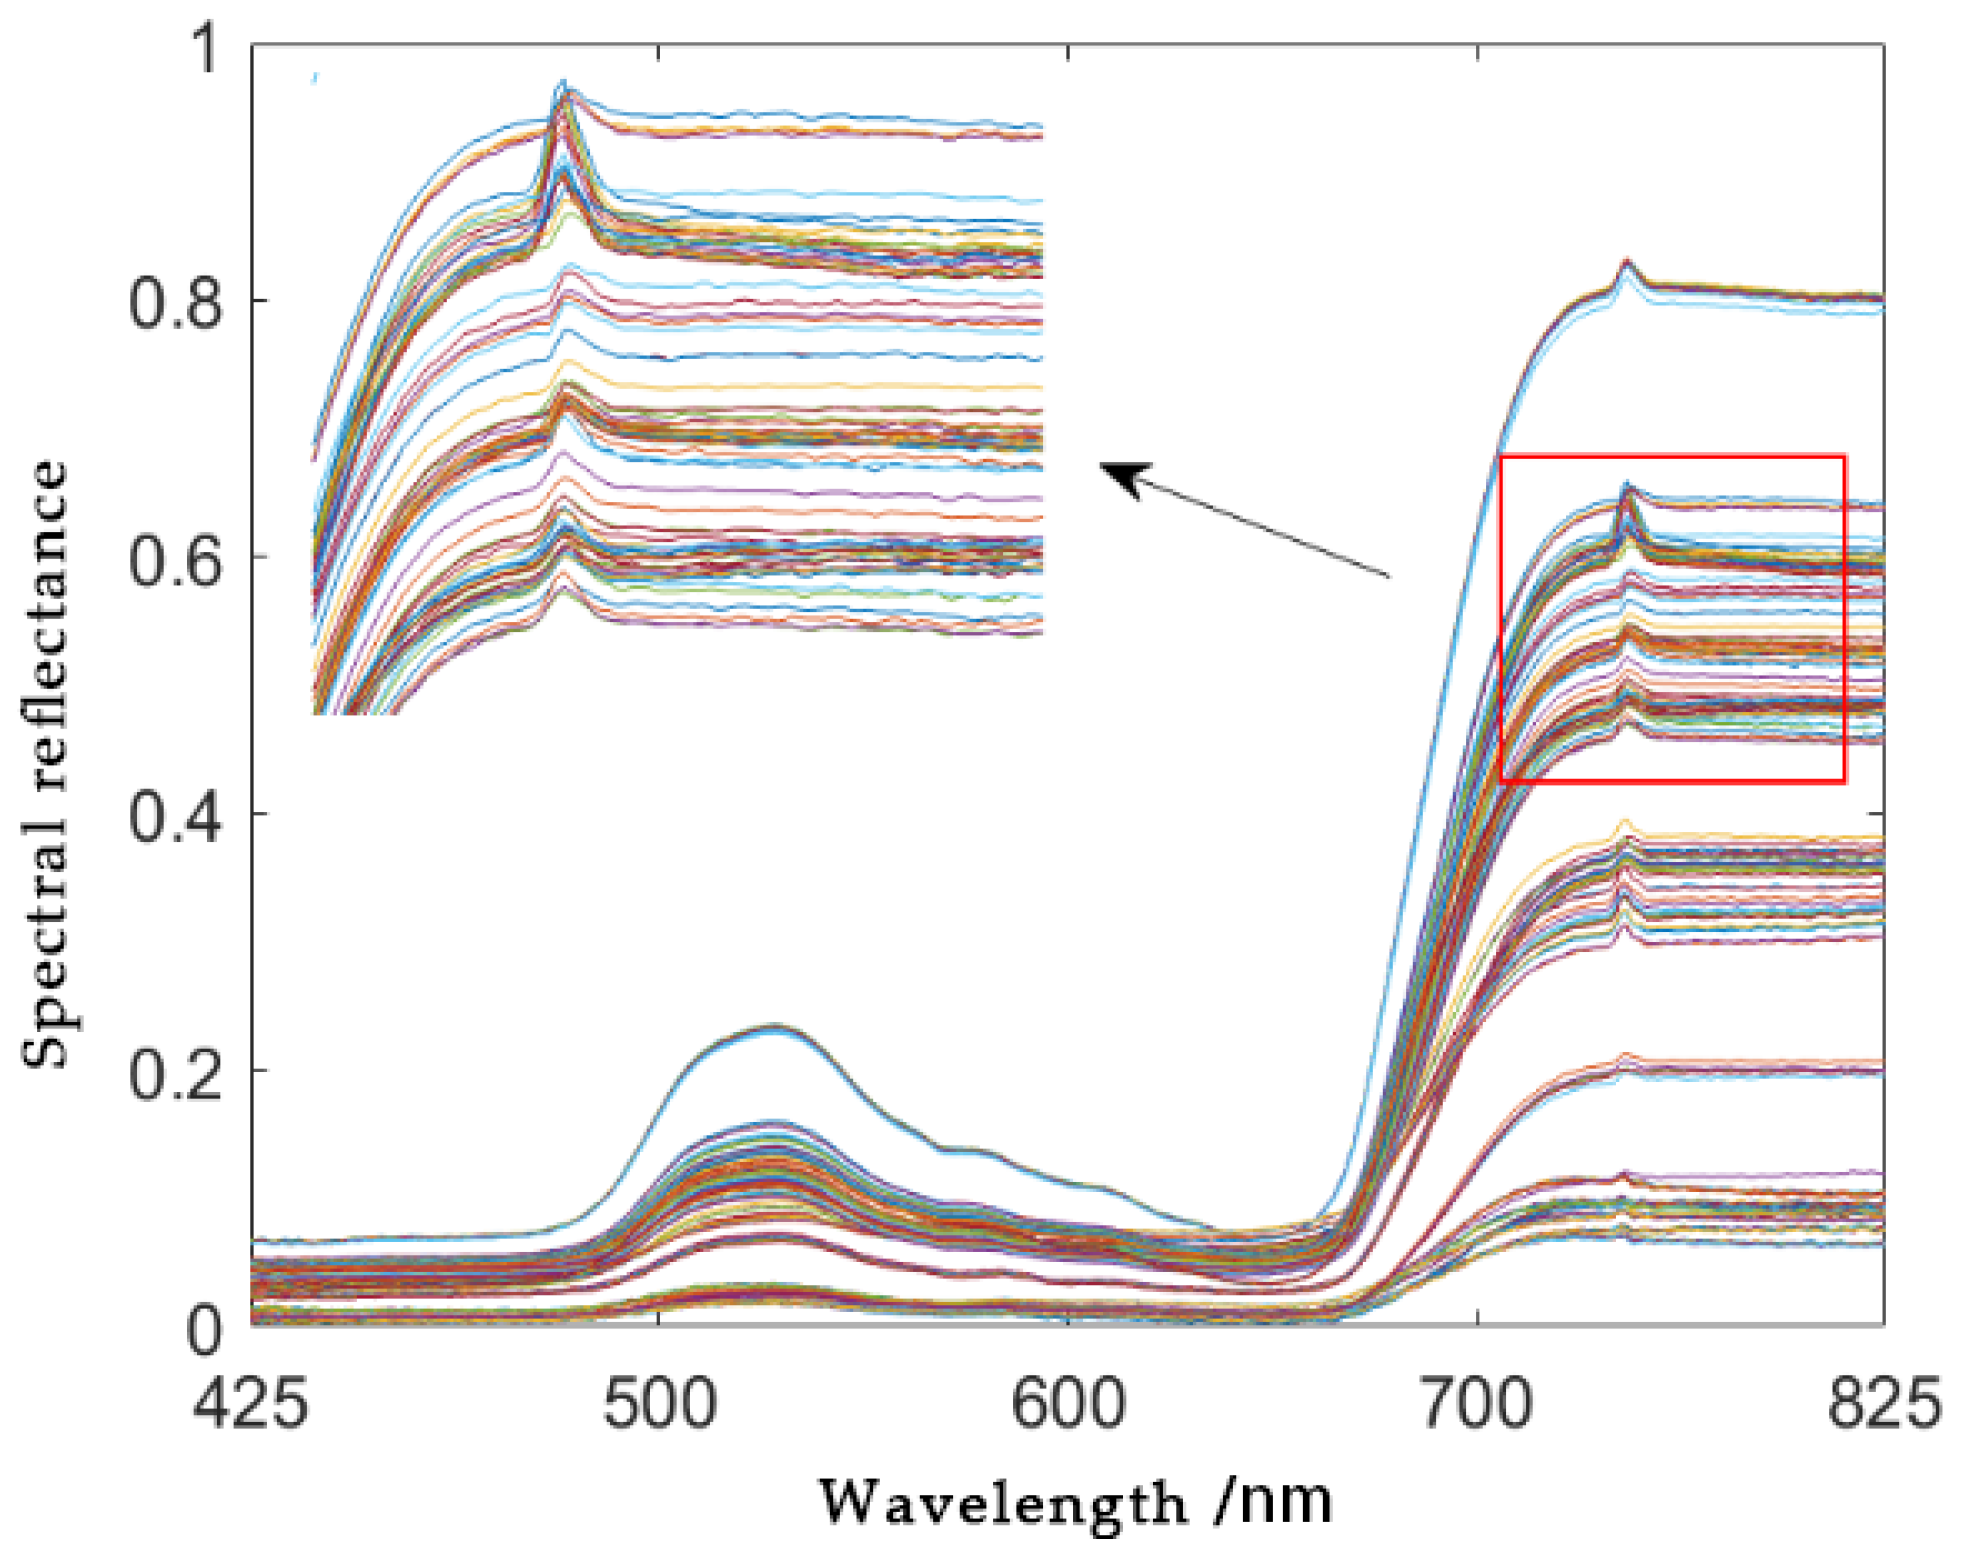
2.3. Spectral Data Preprocessing

The UV/VNIR spectroscopy, a globally recognized tool for crop quality assessment, is widely used due to its simplicity, rapid analysis, and non-destructive sampling [12]. In this study, the wavelet transform method was applied to reduce the noise caused by device or environmental interference during sample preparation. This approach can enhance data efficiency, minimize experimental errors, and improve the model diagnostic accuracy of the adzuki bean rust disease.
The wavelet transform, derived from Fourier transform principles, is a widely used signal analysis tool with extensive applications in signal processing, including denoising, feature extraction, and image enhancement [13]. In this study, discrete wavelet transform (DWT) was applied to preprocess the original spectral data, effectively reducing noise while preserving the intrinsic feature information relevant to sample characteristics [14].
The key steps of the wavelet transform were as follows:
  • Wavelet Decomposition
Appropriate wavelet basis functions and decomposition levels were selected to perform wavelet decomposition on the NIR spectral data of adzuki bean samples. Two commonly used wavelet families—Daubechies (db) and Reverse Biorthogonal (rbio)—were applied, with decomposition levels ranging from 1 to 6 [15]. The optimal wavelet basis function and decomposition level were determined by evaluating denoising performance metrics, specifically the mean square error (MSE) and signal-to-noise ratio (SNR) [16]. The wavelet decomposition formula was defined by Equation (1):
A m , n = < x t , ϕ m , n t > = k h k 2 n A m 1 , k D m , n = < x t , ψ m , n t > = k g k 2 n A m 1 , k ,
where x t represents the spectral signal of the adzuki bean sample, while A m , n and D m , n denote the approximation and detail coefficients, respectively, where m indicates the decomposition scale. h and g represent the low-pass and high-pass filters, both of which were orthogonal mirror filters. Furthermore, ϕ t and ψ t correspond to the scaling function and wavelet function, respectively.
2.
Threshold Selection
The wavelet coefficients obtained through decomposition were modified using a thresholding function. In this study, a soft thresholding function was applied to shrink the wavelet coefficients: coefficients below the predefined threshold were set to zero, while those exceeding or equaling the threshold had their magnitudes reduced by the threshold value. This method enhanced the continuity of wavelet coefficients, resulting in a cleaner, denoised signal representation [17]. Additionally, the level-specific thresholds and the number of retained coefficients for each wavelet decomposition layer were determined using the Birgé–Massart strategy [18]. The threshold calculation formula under this strategy was expressed by Equation (2):
t h r = 2 log n σ
where n and σ are signal length and signal strength, respectively.
3.
Wavelet Coefficient Reconstruction
The reconstructed spectral signal was obtained by combining the threshold-processed wavelet coefficients using the inverse discrete wavelet transform (IDWT). The denoised signal can be mathematically expressed by Equation (3):
x t = n = + A n ϕ n t + n = + m = 0 + D m , n ψ m , n t

2.4. Extraction of Characteristic Wavenumberss

Feature extraction plays a crucial role in eliminating redundant data from samples, enhancing the model’s predictive accuracy, and reducing computational complexity. In this study, the original spectral dataset contained 401 wavenumbers variables. After preprocessing with the CARS algorithm, additional feature extraction was performed to further optimize the model’s performance.

Competitive Adaptive Reweighted Sampling Algorithm

The CARS algorithm is a feature selection method that integrates Monte Carlo sampling with the regression coefficients of the Partial Least Squares (PLS) model. Its fundamental principle is derived from the “survival of the fittest” concept in Darwin’s theory of evolution [19]. During each iteration of the CARS algorithm, variables with larger absolute regression coefficient values in the PLS model were selected to form a new subset through adaptive reweighted sampling, while those with smaller weights were excluded. A new PLS model was then reconstructed based on the refined subset. After multiple iterations, the wavenumbers within the subset that yield the smallest root mean square error of cross-validation (RMSECV) were identified as the characteristic wavenumbers [20].
  • Monte Carlo Sampling
A predetermined proportion of samples was extracted from the sample matrix via the Monte Carlo sampling method to construct the PLS regression model. The mathematical representation of the PLS model was expressed by Equation (4):
y = X b + e
where b and e are coefficient vector and prediction residual matrix, respectively.
2.
Weight Calculation in the PLS Model
In the PLS model, the weight, w j , corresponding to each wavenumbers point was determined using Equation (5):
w j = a j j = 1 o a j , j = 1 , 2 , , n
where O represents the total number of variables in the model, while a j corresponds to the regression coefficient associated with the j wavenumbers point.
3.
Exponential Decreasing Function (EDF) Filtering
The EDF was applied to filter all wavenumbers points, with selection determined based on the retention ratio r j . The calculation method of r j was expressed by Equation (6):
r j = a e k j
where a and k are constants. After N sampling iterations, the calculation process was shown by Equations (7) and (8):
a = o 2 1 N 1
k = ln o 2 N 1
4.
Wavenumbers Selection Using the CARS Algorithm
The CARS algorithm was applied to filter wavenumbers, and ultimately the subset with the lowest RMSECV value was selected as the optimal set of feature variables for adzuki bean rust disease recognition.

2.5. Construction of Diagnostic Model for the Adzuki Bean Rust Disease

In recent years, deep learning algorithms have achieved significant breakthroughs across multiple interdisciplinary fields, including bioinformatics and agricultural monitoring. Feature learning methods based on deep learning can adaptively extract discriminative features from high-dimensional data through end-to-end training mechanisms, thereby enabling the development of predictive models with strong generalization capabilities.

2.5.1. LeNet-5 Network Architecture

The fundamental architecture of LeNet-5 consists of convolutional layers (Conv), subsampling layers (utilizing average pooling operations), and fully connected (FC) layers [21]. In Figure 3, a soft   max classifier was implemented in the final layer to perform binary classification between healthy and rust-infected plants. The output layer neurons generated normalized probability mappings of disease occurrence. All hidden layers employed the hyperbolic tangent (tanh) activation function [22], which enhanced feature representation robustness through its saturating nonlinearity.
The LeNet-5 deep learning model was used for processing one-dimensional NIR spectral data. The fundamental principle and computational procedure of LeNet-5 were as follows:
First, the input data, with dimensions of 7200 × 41, was input into the first convolutional block (Block 1) for the initial spectral feature extraction. The LeNet-5 architecture comprised three sequentially connected convolutional blocks, each consisting of a convolutional layer followed by a max-pooling layer [23]. Specifically, the input data underwent feature mapping computation in the convolutional layer, where the convolution operation was mathematically expressed by Equation (9):
c j = f i k i j x i + b j
where c j and x i are the i-th input feature and j-th output feature, respectively. The operator signifies the convolution operation, while k i j represents the convolution kernel connecting x i and b j . Additionally, b j is the bias term for the j-th output feature.
Second, the feature data, c j , extracted by the convolutional layer, was then passed into the max-pooling layer for dimensionality reduction [24]. The corresponding calculation method was expressed by Equation (10):
s j l + 1 = f α j l d o w n c j l + b j l + 1
where d o w n . is defined as the subsampling function, with α j l and b j l + 1 representing the weight coefficient and bias term of the j-th layer, respectively.
Third, the output features from the first convolutional module were input into the second convolutional module (Block 2) for hierarchical feature extraction. These features were then passed through the third convolutional module (Block 3), completing the feature extraction process. Finally, the extracted feature data was forwarded to the fully connected layer for classification. The fully connected layer was defined by Equation (11):
y h j = σ m = 1 M a m j 1 v m , h j + n h j
where y h j is the weight coefficient at position ( m , h ) in the connection weight matrix v , n h j is the h -th element of the bias vector in the j-th FC layer, and a m j 1 is the m -th element received as input by the j-th FC layer.
Finally, the output features from the fully connected layer were mapped to a 2D feature vector via the soft   max function, which was defined by Equation (12):
soft   max = exp y i j exp y j
The above process describes a LeNet-5 model with an 8-layer network structure, composed of three convolutional modules (Block 1, Block 2, Block 3), one global average pooling layer, and one fully connected layer. Each convolutional module consisted of a convolutional layer followed by a pooling layer. To ensure consistent input and output feature map sizes across all network layers, in this study, the strategy of padding = ‘same’ was employed. Additionally, the number of convolutional kernels in C1, C3, and C5 was set to 32, 64, and 128, with corresponding kernel dimensions of 7 × 7, 4 × 4, and 4 × 4, respectively. To mitigate the risk of overfitting in the network, the dropout rate was configured to 0.3. The training process ceases upon the network reaching the pre-specified number of iterations.

2.5.2. Optimizer

Adam is a deep neural network optimization algorithm that adaptively adjusts the learning rate during training. The key advantage lies in the parameter bias correction mechanism, which ensures that the learning rate remains within a well-defined range throughout each iteration. This feature not only enhances the stability of parameter updates significantly but also reduces the negative impact of gradient scaling on model convergence [25]. The detailed steps for the parameter update process in the Adam algorithm were expressed as follows:
  • First, compute the gradient g t at the current time step, set the initial time step as t = 1 , and then proceed with iterative training over t time steps. During each iteration, the system automatically adjusts the model parameters based on the computed gradient values.
  • g t = f t θ t 1
  • Compute the exponentially weighted moving average m t of the gradient and initialize it to m =0. The coefficient β 1 is the exponential decay rate that regulates the weight distribution. Typically, its value is set close to 1; β 1 is set to 0.9.
    m t = β 1 m t 1 + 1 β 1 g t
  • Compute the exponentially weighted moving average v t of the squared gradients, initializing it to v 0 = 0. Here, β 2 is an exponential decay rate that regulates the influence of prior squared gradients. In this research, β 2 is set to 0.99.
    v t = β 2 v t 1 + 1 β 2 g t 2
  • Given that m 0 = 0, this initialization may cause m t biased towards 0 during the early stages of training. To mitigate the influence of this bias on the initial phase, bias correction must be applied to the gradient mean m t .
    m ^ t = m t 1 β 1 t
  • Similar to m 0 , bias correction must also be applied to v t .
    v ^ t = v t 1 β 2 t
  • Update the parameters by setting the learning rate to α = 0.001 and ε = 10−8.
    θ t = θ t 1 α m ^ t ε + v ^ t

2.5.3. Model Evaluation

The cross-entropy loss function measures the divergence between the predicted probability distribution from the LeNet-5 network and the ground-truth distribution. The cross-entropy loss was defined by Equation (19):
L = 1 N i y i log p i + 1 y i log 1 p i
where N is the total number of samples, i indexes individual samples, y i signifies the true distribution of the sample, and p i corresponds to the predicted distribution generated by the model. As the predicted probabilities align more closely with the true labels, the cross-entropy loss decreases, directly indicating an improved classification accuracy.
Accuracy is a widely used evaluation metric in deep learning, quantifying the fraction of correctly predicted samples out of the total samples. It provides a direct measure of a model’s classification capability on the dataset. The accuracy was defined by Equation (20):
a c c u r a c y = T P + T N T P + F P + F N + T N
In this study, the model’s classification results are defined as follows: True Positive (TP) refers to positive samples correctly identified as positive, while False Positive (FP) represents negative samples incorrectly classified as positive. False Negative (FN) denotes positive samples misclassified as negative, and True Negative (TN) corresponds to negative samples accurately identified as negative.

3. Result

3.1. Analysis of Preprocessing Results

To determine the optimal wavelet basis function and decomposition level, the denoising efficacy was evaluated using standard wavelet-based metrics, including SNR and MSE. The performance comparisons are presented in Figure 4 and Figure 5.
The SNR and MSE metrics from the first- to the sixth-layer decompositions using Daubechies (db) and Reverse Biorthogonal (rbio) wavelet families indicated that the db family outperformed rbio overall, with an average SNR 3.2% higher (μ = 92.4 ± 1.8) and an MSE 19.7% lower (μ = 2.1 × 10⁴ ± 0.4 × 10⁴) across all decomposition levels. Notably, the rbio1.1 wavelet exhibited exceptional first-layer decomposition performance, achieving the highest SNR (94.2937) and the lowest MSE (1.32 × 10⁴), surpassing db7’s corresponding values of 93.4481 and 1.60 × 104 by 0.85 SNR units and a 17.5% MSE reduction, respectively. This performance advantage led to the selection of rbio1.1 for first-layer decomposition in spectral preprocessing of infected and healthy leaf samples for the adzuki bean. The raw reflectance and denoised spectral result are presented in Figure 6 and Figure 7, respectively.
Figure 6 and Figure 7 reveal a significant improvement in signal fidelity at the characteristic 758 nm. The original spectral data curve in Figure 6 exhibits greater irregularities and reduced smoothness, with noticeable noise interference. In contrast, the wavelet-transformed spectral data curve in Figure 7 demonstrates markedly enhanced smoothness and a substantial reduction in irregularities. These findings indicated that the DWT effectively mitigated noise interference, thereby improving the quality and representativeness of the spectral data and enhancing the reliability of the subsequent diagnostic model for adzuki bean rust disease.

3.2. Analysis of Feature Extraction Results

In Figure 8, the procedural steps of the CARS algorithm for extracting characteristic wavenumbers are detailed. Specifically, Figure 8a depicts the trend in the number of selected variables from the original 401 variables, Figure 8b shows the fluctuations in RMSECV values during the selection process, and Figure 8c illustrates the dynamic evolution of regression coefficient paths throughout the execution of the CARS algorithm.
The trend in the number of variables shown in Figure 8a indicates that as the number of sampling iterations increases, the initial 401 variables gradually decrease, with the reduction rate slowing over time. This observation suggested that the CARS algorithm operates in two distinct phases—coarse selection and fine selection—during the sampling process. Figure 8b shows that when the number of sampling iterations reached 20, the RMSECV value attained its minimum. Beyond this point, the RMSECV value steadily increased, signifying a decline in model performance. Figure 8c illustrates the dynamic evolution of the 401 variables across the sampling iterations. At 20 sampling iterations, 51 effective characteristic wavenumbers variables were recognized (Table 1).

3.3. Analysis of the Results Output from the LeNet-5 Model

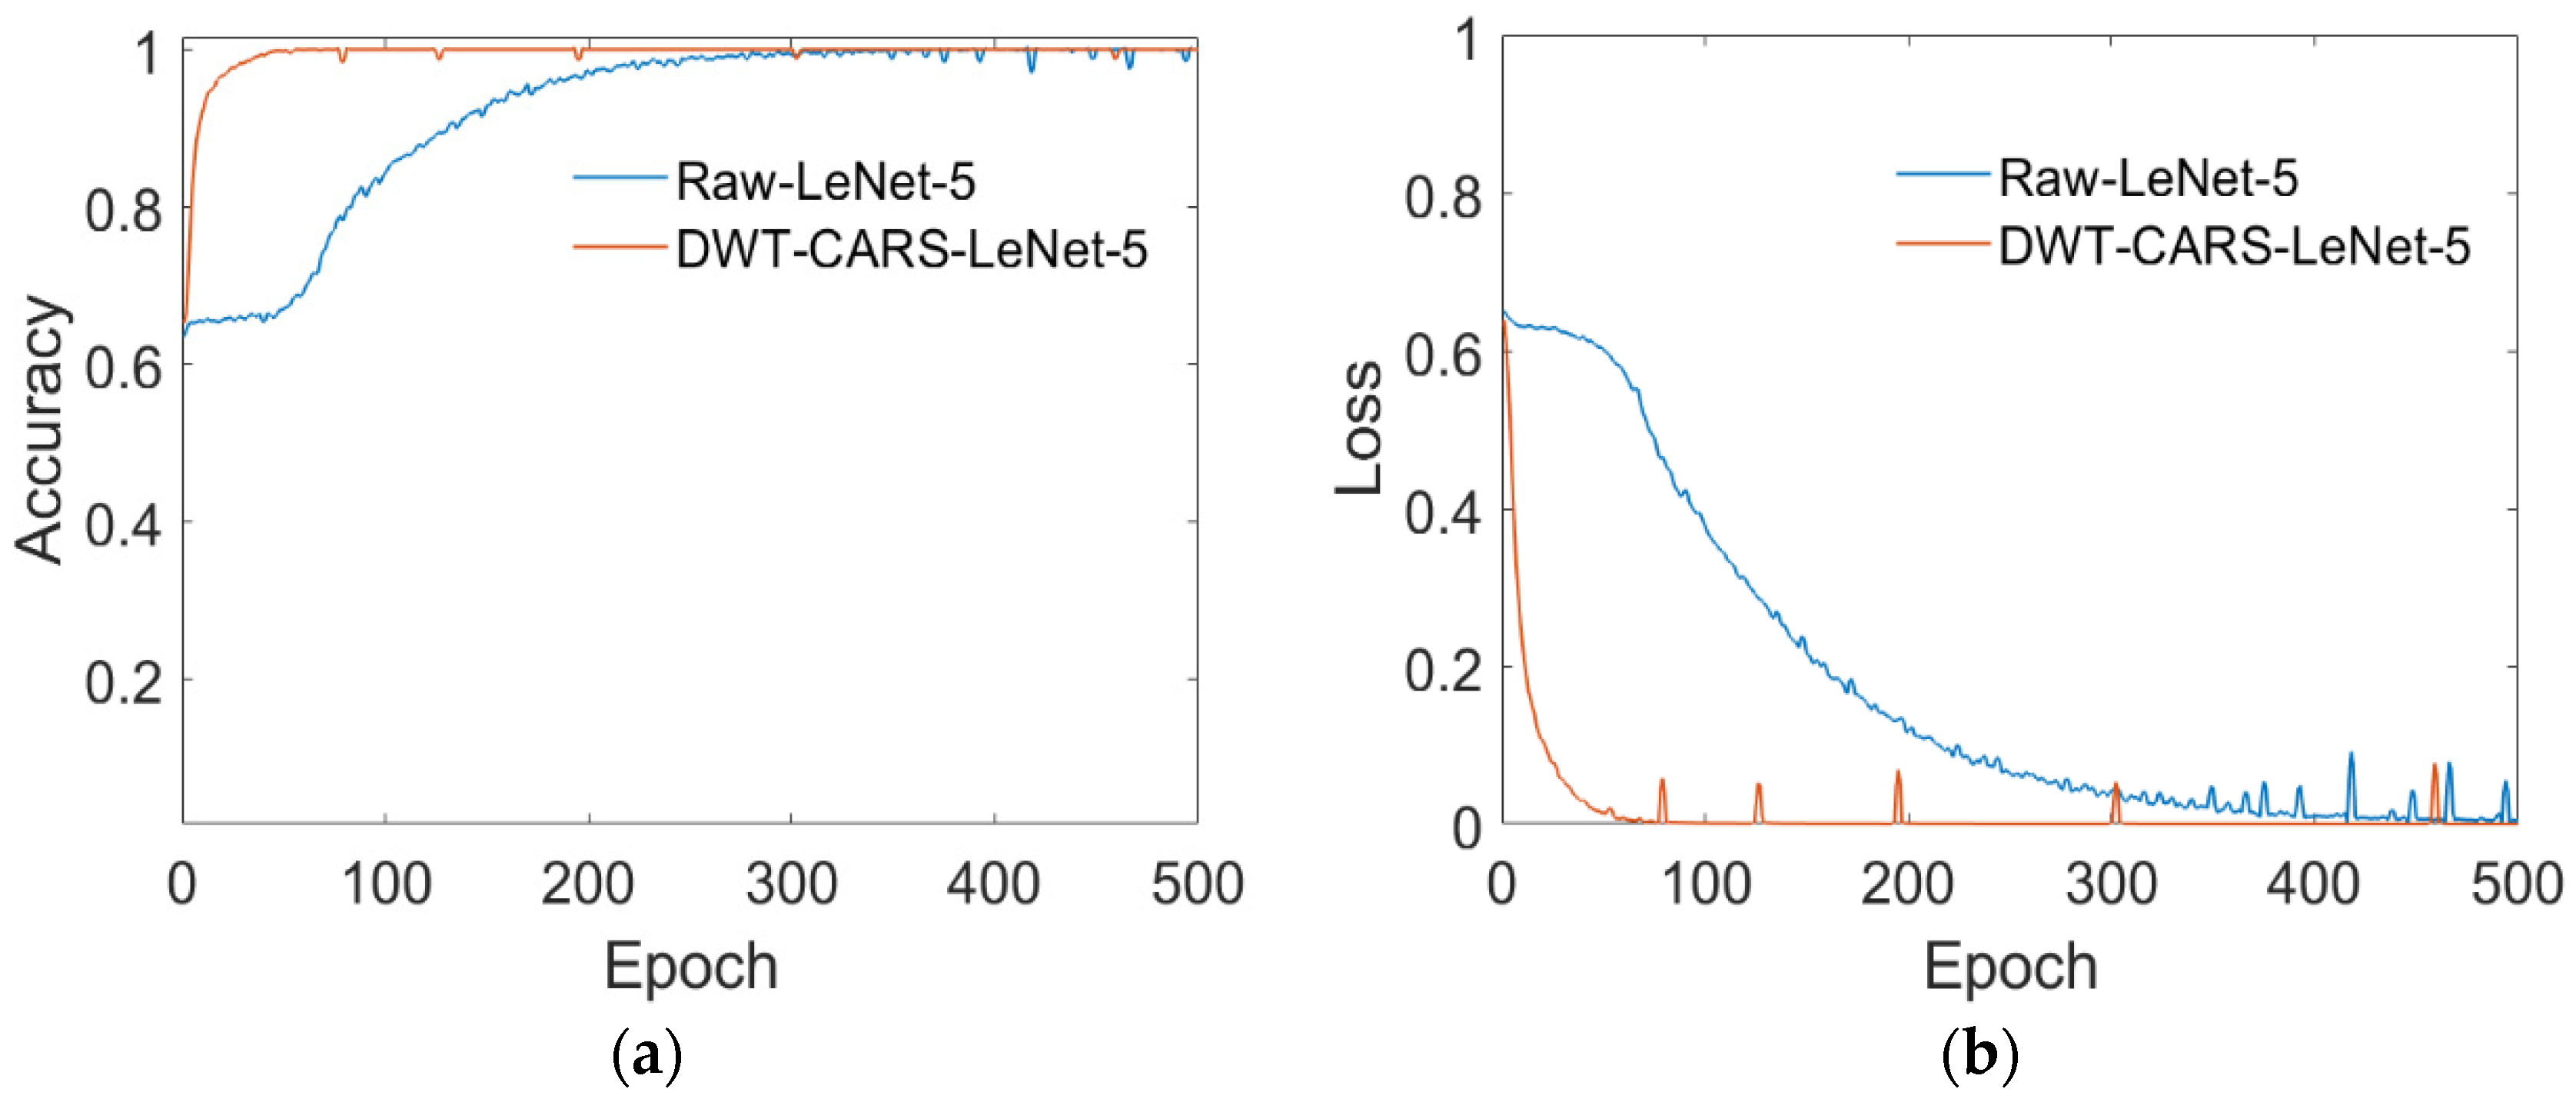
3.3.1. Model Training

In this study, along with the original spectral data sample, the preprocessed and feature-extracted spectral data samples were input into the LeNet-5 convolutional neural network for training. This approach was undertaken to systematically assess the efficacy of the preprocessing and feature extraction techniques utilized in this research.
The classification labels for the adzuki bean samples were encoded using one-hot encoding, with detailed definitions provided in Table 2.
In this study, preprocessing and characteristic wavenumbers extraction were implemented using MatlabR2023a software. The TensorFlow framework and Python were utilized to implement the LeNet-5 model. The experimental setup was configured as follows:
  • Hardware: NVIDIA GeForce GTX 1050 Ti GPU (4 GB VRAM).
  • Software: Windows 10 (64-bit), Anaconda3, CUDA 10.2, Python 3.7, TensorFlow 2.3.0.
As shown in Figure 9, after 500 iterations of training, both accuracy and loss values for the DWT-CARS-LeNet-5 model converged. Accuracy stabilized at the 56th iteration, while loss stabilized at the 21st iteration. In contrast, the Raw-LeNet-5 model stabilized much later, at the 361st and 215th iterations for accuracy and loss, respectively. These findings confirmed the effectiveness of DWT preprocessing and CARS feature selection, as they removed noise and collinear variables, significantly accelerated convergence, and enhanced model performance.

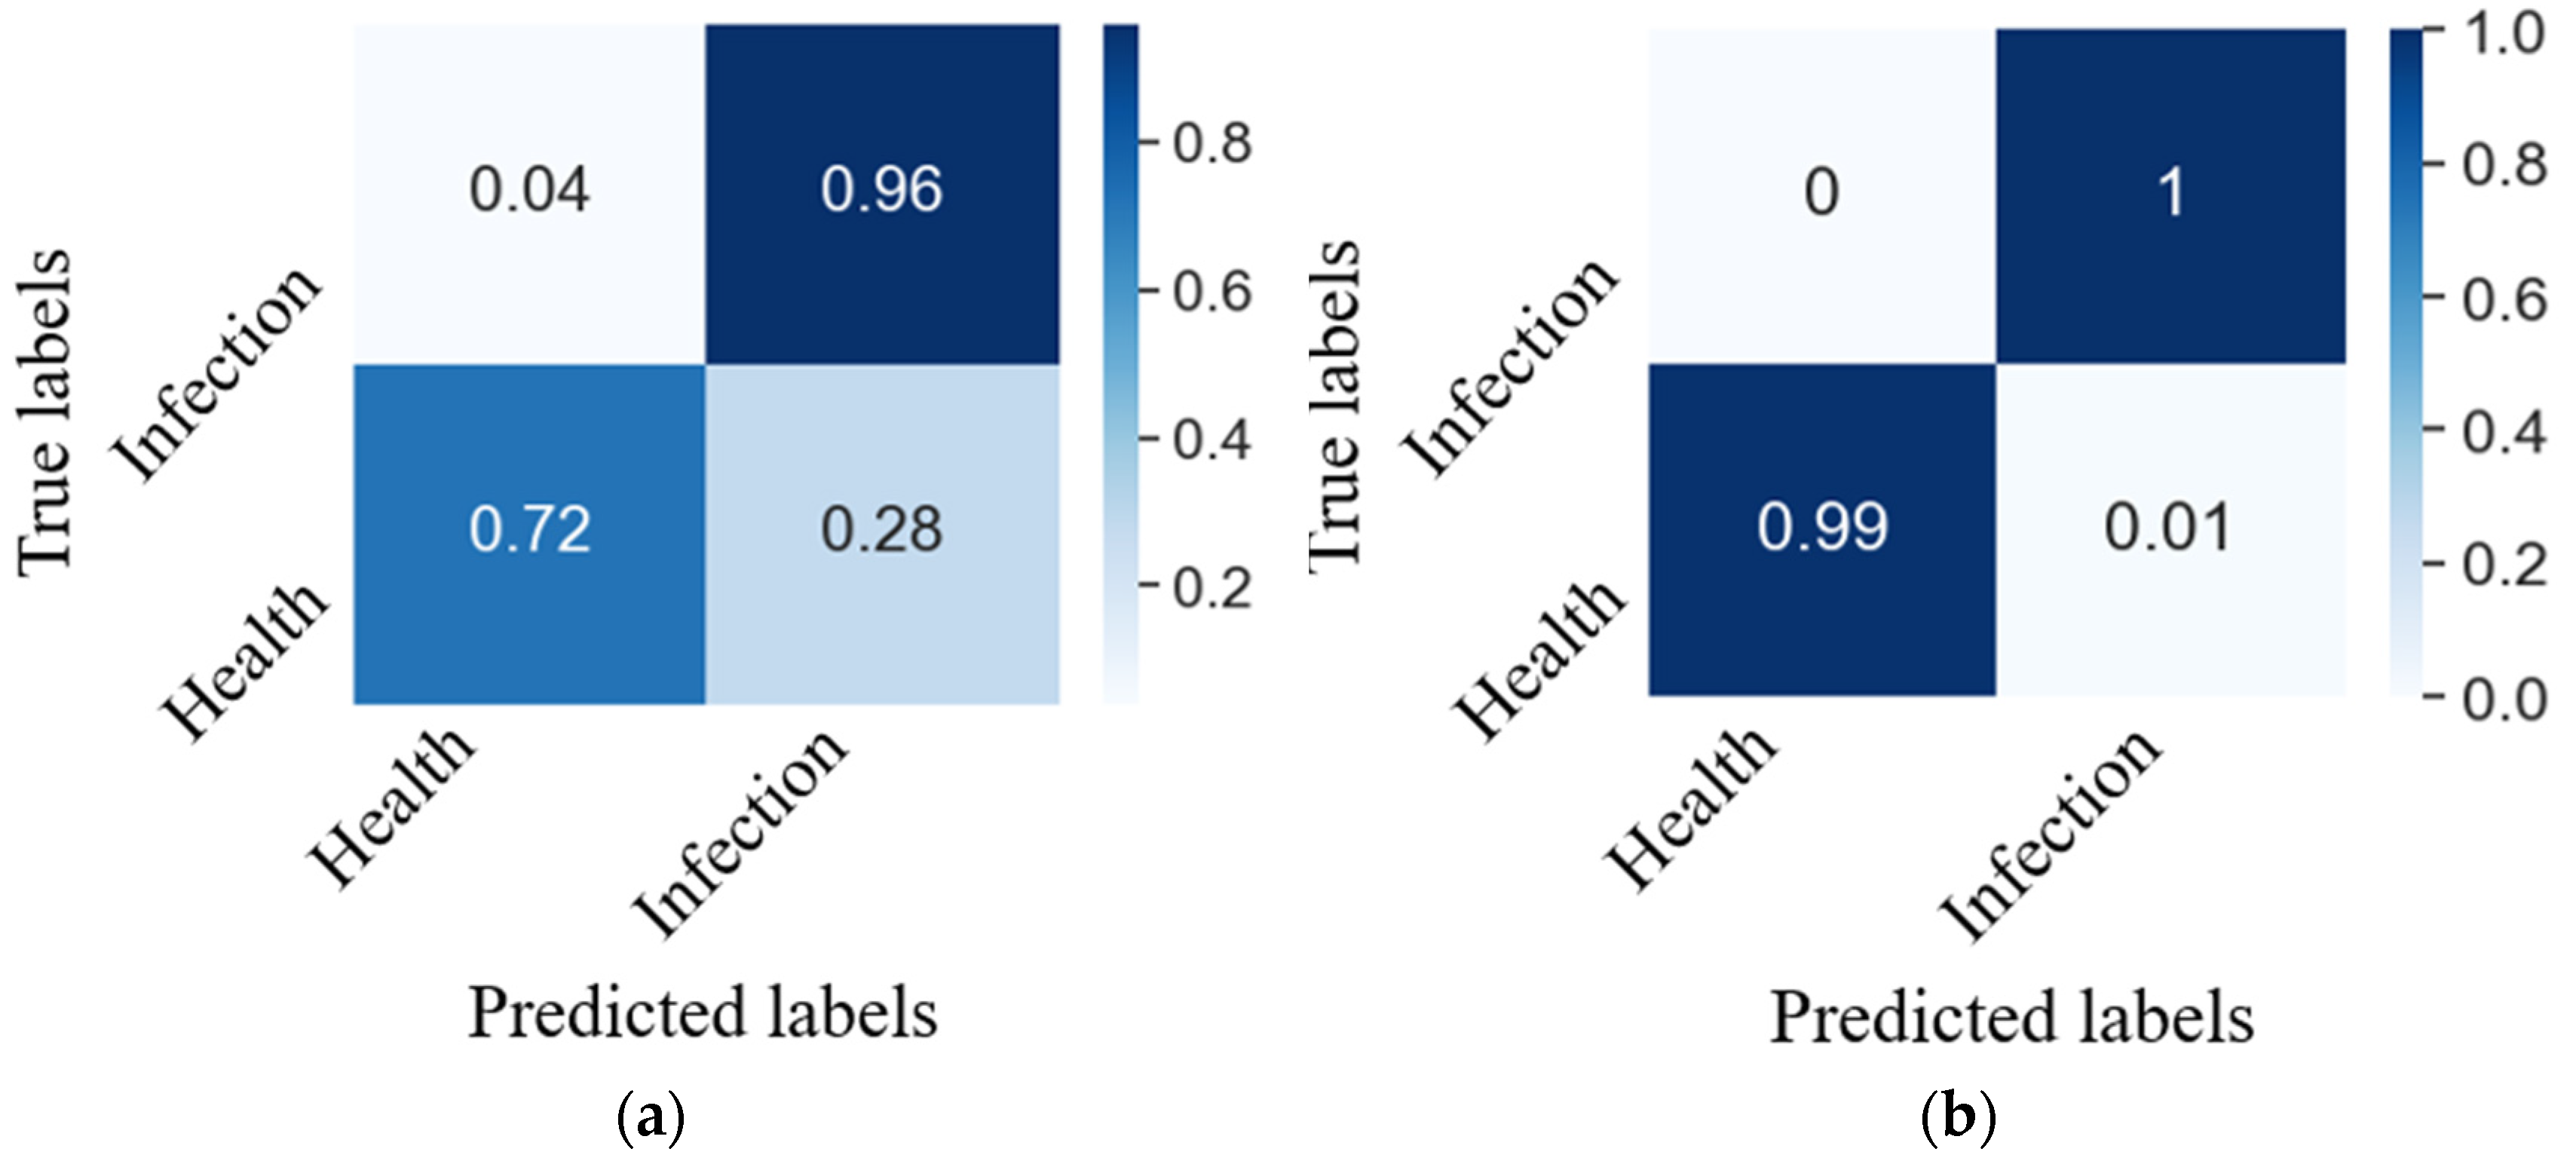
3.3.2. Model Testing

A diagnosis model for adzuki bean rust disease was constructed based on 1D-CNNs, with the following steps: Spectral Denoising: DWT was used to remove noise from raw spectral data. Wavenumbers Selection: The CARS algorithm selected 51 optimal features from 401 original wavenumberss. Model Training: A 1D-adapted LeNet-5 network was trained on these selected features for classification.
The workflow of the proposed diagnostic model is illustrated in Figure 10.
To assess the effectiveness of the proposed preprocessing and feature selection methods, raw data were directly input into the baseline LeNet-5 model for comparison. Experimental results showed that the DWT-CARS-LeNet-5 model achieved a test accuracy of 99.65%, significantly outperforming the baseline model (89.63%). This substantial improvement validated the superiority of the proposed methodology. Additionally, a confusion matrix analysis was conducted to visually confirm the model’s reliability and classification performance.
In Figure 11, the confusion matrix presented the predicted labels on the x-axis and the true labels on the y-axis, with diagonal values representing correctly classified samples. Figure 11a,b demonstrate that the DWT-CARS-LeNet-5 model achieved 99.65% accuracy in adzuki bean rust disease classification. Notably, only 0.01% of healthy samples (out of 900) were misclassified, compared to a 0.28% error rate using raw data, underscoring the severe ambiguity in non-preprocessed spectral analysis. These results confirmed that the DWT preprocessing and CARS feature extraction significantly enhanced classification reliability.
To further assess the performance and limitations of the model, the output of the diagnosis model was presented by mapping the maximum value of the network’s actual output to the adzuki bean plant status categories (healthy or rust-infected). The mapping rule was formalized as follows: y = max (y1, y2). Specifically, when y1 attained the maximum value, it was assigned a value of 1, while all other y values were assigned 0. Leveraging the one-hot encoding rule outlined in Table 2 of the original text, the results were decoded into the two adzuki bean plant status categories (healthy or rust-infected). The actual output results of the constructed LeNet-5 network model are depicted in Figure 12.
In Figure 12, the two distinct colors correspond to the healthy and rust disease states of adzuki beans, forming two columns of nodes. Within each column, only the actual output value for the category correctly classified by the model reached its maximum. The proposed diagnosis model achieved a test accuracy rate of 99.65%, with 8 samples misclassified. In Figure 12a, purple represents healthy adzuki bean samples, while blue represents rust disease samples, which display the actual output values calculated for healthy adzuki beans (y1) using the LeNet-5 network. Only the samples correctly diagnosed by the model exhibited an actual output value of 1, whereas the others were assigned 0. Consequently, it was evident that 8 purple points in Figure 12a did not reach the maximum value of 1, indicating that 8 samples were misclassified. Similarly, 8 blue points in Figure 12b also failed to achieve the maximum value of 1. By visualizing the actual output values of the diagnosis model, the 8 misclassified samples in the test set can be more intuitively identified.
Additionally, the confusion matrix revealed that these 8 misclassified samples were healthy adzuki beans incorrectly identified as rust disease samples. Diagnostic errors may arise due to environmental interference causing significant fluctuations in the spectral reflectance of healthy adzuki beans. Alternatively, during the acquisition period, healthy adzuki beans might have experienced water deficiency, aging, or disease, leading to changes in chlorophyll within leaf cells and resulting in abnormal spectral reflectance. These anomalies hindered the model’s ability to effectively learn from abnormal healthy samples.
To verify the proposed LeNet-5 model, four established classifiers were compared: K-Nearest Neighbor (KNN) [26], Back Propagation (BP) [27], and SVM [28]. Linear regression (PLS) and lightweight deep learning networks, such as MobileNet, 1D-ResNet, TCN, and InceptionTime, were utilized to classify and predict NIR spectral curves after DWT-CARS preprocessing. The predictive performance of the four models were presented in Table 3.
In Table 3, The training performance of all models was satisfactory. However, upon analyzing the test results of the different models, it was evident that the classical convolutional neural network LeNet-5 model utilized in this study achieved the highest test accuracy, with a test accuracy rate of 99.65%. The BP neural network exhibited slightly lower test accuracy, with a test set accuracy rate of 90.30%. Furthermore, the three lightweight neural networks—MobileNet, 1D-ResNet, and InceptionTime—demonstrated the lowest test accuracies, all approximately around 50%. This may be attributed to the fact that these three networks were primarily designed for 2D image data, leading to relatively weaker feature extraction capabilities when handling one-dimensional continuous spectral data. Moreover, the suboptimal performance of these lightweight models could also stem from insufficient adaptation to the specific characteristics of the spectral dataset used in this study. Moreover, the LeNet-5 network demonstrated sub-second per-sample inference latency (<1 s) while maintaining exceptional accuracy. These results confirmed the superiority of the proposed model over traditional machine learning approaches (KNN, BP, SVM, PLS-R), establishing an efficient and precise solution for the automated diagnosis of adzuki bean rust disease.

4. Discussion

4.1. Model Performance Analysis

This study pioneers the integration of spectroscopy with deep learning to develop the DWT-CARS-LeNet-5 model for disease diagnosis of adzuki bean rust. To our knowledge, this constitutes the first implementation of deep learning algorithms coupled with UV/VNIR technology in plant phytopathology diagnostics. Compared with conventional visual inspection methods [29,30,31], the intelligent learning model proposed herein not only eliminated the need for destructive sampling during laboratory testing but also significantly enhanced diagnostic efficiency, enabling early detection of adzuki bean rust disease. Moreover, within the context of plant disease diagnosis, the deep learning model employed in this study demonstrated the ability to perform nonlinear data learning. Unlike the PLS model [32], it did not require manual feature extraction, thereby simplifying the modeling process. Additionally, compared with the SVM model described [33], this model effectively reduced memory consumption and mitigates the complexity of hyperparameter optimization, thus showcasing robust self-learning capabilities and superior adaptability.

4.2. Research Limitations

The proposed diagnostic model of adzuki bean rust disease attained 99.65% test accuracy, with residual errors (0.35%) highlighting opportunities for perfect classification. In future work, we aim to further standardize the selection of experimental conditions and incorporate the optimization algorithm [34] to enhance spectral preprocessing techniques and feature wavenumbers extraction algorithms, thereby reducing error-related impacts to the greatest extent possible. Furthermore, to address the challenge of indistinct early-stage symptoms of the disease, we will investigate methods [35,36] and utilize multimodal data fusion or structural model optimization to further elevate diagnostic accuracy and overall model performance. Additionally, we plan to enrich the diversity of the adzuki bean rust disease dataset by acquiring samples across diverse regions and environmental conditions, thereby strengthening the model’s generalization capability.
Although the proposed adzuki bean rust diagnosis model achieved a relatively low misjudgment rate (0.35%), it should be noted that the experimental samples were obtained from artificial climate chambers. Consequently, the performance evaluation of the current model relies on spectral datasets collected under controlled conditions, where plant infections were induced by a single rust pathogen. However, the field environment is inherently complex and diverse, often involving simultaneous occurrences of multiple diseases. The disease diagnosis method developed in this study does not account for potential interactions among multiple diseases. To address these limitations, in the next phase of the research, we aim to collect near-infrared spectral data from adzuki beans of various varieties, ages, and infection statuses grown under field conditions. We will employ two strategies: applying appropriate preprocessing algorithms [37] to enhance data quality and utilizing transfer learning techniques [38] to adapt the model to field data. These approaches will help mitigate errors arising from factors such as natural environmental variability and disease diversity, thereby improving the accuracy and generalization ability of the proposed adzuki bean rust diagnosis model. This work will establish a solid theoretical basis and technical framework for the practical application of the model in agricultural settings.

4.3. Future Work Outlook

In future work, we will focus on lightweight optimization of the DWT-CARS-LeNet-5 model and develop an intuitive user interface, aiming to ensure its seamless integration with embedded systems and software platforms. Additionally, we plan to select compatible hardware platforms and sensors, interface the NIR spectroscopy sensor with the chosen hardware, and deploy the optimized model on edge computing terminals for the real-time field diagnosis of adzuki bean rust disease. Moreover, the performance requirements for model deployment on devices will be taken into account; we aim to enhance the model by reducing its complexity and optimizing its computational efficiency. Specifically, we will leverage model compression techniques, such as pruning and knowledge distillation, to minimize the model size and computational cost. Furthermore, we will refine the model deployment process through advanced memory management and energy-efficient strategies, ensuring compatibility with ultra-low-power devices. This approach is designed to provide robust technical support for the rapid diagnosis of adzuki beans rust disease and other field diseases. Concurrently, data augmentation techniques will be utilized to mitigate the issue of sample imbalance in the dataset, thereby enhancing the stability and reliability of the model.

5. Conclusions

In this study, a novel framework was established combining NIRS and deep learning for diagnosing adzuki bean rust disease. A total of 2700 spectral data were collected from healthy plants and 4500 from infected specimens using an NIR spectrometer. To reduce noise interference, the DWT was applied for spectral preprocessing. Next, CARS was employed to identify 51 critical wavenumberss from an initial set of 401 variables. These selected features were then fed into a 1D-CNN for automatic disease diagnosis. The proposed DWT-CARS-LeNet-5 model, trained on processed spectral tensors, achieved a detection accuracy of 99.65% on the test set—significantly outperforming traditional models. This output not only validated the high-precision capability of the proposed method for adzuki bean rust disease diagnosis but also provided a solid theoretical foundation and robust technical support for its rapid detection and practical application.

Author Contributions

Conceptualization, H.G.; data curation, L.L. and J.Y.; investigation, L.L. and J.Y.; methodology, L.L. and H.G.; resources, H.G.; writing—original draft, L.L.; writing—review and editing, H.G. All authors have read and agreed to the published version of the manuscript.

Funding

This research received no external funding.

Institutional Review Board Statement

Not applicable.

Informed Consent Statement

Not applicable.

Data Availability Statement

The original contributions presented in this study are included in the article. Further inquiries can be directed to the corresponding author.

Conflicts of Interest

The authors declare that they have no conflicts of interest.

References

  1. Yin, L.; Zhang, J.; Zhang, G.; Liu, G.; Ke, X.; Zuo, Y. Construction and application of molecular detectionsystem for adzuki bean rust. Agric. Res. Arid Areas 2023, 41, 238–244. [Google Scholar]
  2. Liu, S.; Ding, X.; Li, Y.; Yin, L.; Ke, X.; Zuo, Y. Genome-wide identification of the NAC family genes of adzuki bean and their roles in rust resistance through jasmonic acid signaling. BMC Genom. 2025, 26, 283. [Google Scholar] [CrossRef]
  3. Velez, M.H.; Lopezrosa, J.; Freytag, G.F. Determination of yield loss caused by rust (Uromyces phaseoli (Reben) Wint.) in common bean (Phaseolus vulgaris L.) in Puerto Rico. Hum Genet. 1989, 80, 224–234. [Google Scholar] [CrossRef]
  4. Ke, X.; Wang, J.; Xu, X.; Guo, Y.; Zuo, Y.; Yin, L. Histological and molecular responses of Vigna angularis to Uromyces vignae infection. BMC Plant Biol. 2022, 22, 489. [Google Scholar] [CrossRef]
  5. Yang, C.; Ma, X.; Guan, H.; Li, L.; Fan, B. A rapid recognition method of auricularia auricula varieties based on near-infrared spectral characteristics. Infrared Phys. Technol. 2022, 125, 104239. [Google Scholar] [CrossRef]
  6. Peñuelas, J.; Filella, I. Visible and near-infrared reflectance techniques for diagnosing plant physiological status. Trends Plant Sci. 1998, 3, 151–156. [Google Scholar] [CrossRef]
  7. Ashurov, A.Y.; Al-Gaashani, M.S.A.M.; Samee, N.A.; Alkanhel, R.; Atteia, G.; Abdallah, H.A. Enhancing plant disease detection through deep learning: A Depthwise CNN with squeeze and excitation integration and residual skip connections. Front. Plant Sci. 2024, 15, 1505857. [Google Scholar] [CrossRef]
  8. Ji, X.; Xue, J.; Shi, J.; Wang, W.; Zhang, X.; Wang, Z.; Xu, N. Noninvasive Raman spectroscopy for the detection of rice bacterial leaf blight and bacterial leaf streak. Talanta 2025, 282, 126962. [Google Scholar] [CrossRef]
  9. Deng, J.; Zhang, X.; Yang, Z.; Zhou, C.; Wang, R.; Zhang, K.; Lv, X.; Yang, L.; Wang, Z.; Li, P. Pixel-level regression for UAV hyperspectral images: Deep learning-based quantitative inverse of wheat stripe rust disease index. Comput. Electron. Agric. 2023, 215, 108434. [Google Scholar] [CrossRef]
  10. Zhang, K.; Deng, J.; Zhou, C.; Liu, J.; Lv, X.; Wang, Y.; Sun, E.; Liu, Y.; Ma, Z.; Shang, J. Using UAV hyperspectral imagery and deep learning for Object-Based quantitative inversion of Zanthoxylum rust disease index. Int. J. Appl. Earth Obs. Geoinf. 2024, 135, 104262. [Google Scholar] [CrossRef]
  11. Yu, X.; Liu, S.; Wang, C.; Jiao, B.; Huang, C.; Liu, B.; Liu, C.; Yin, L.; Wan, F.; Qian, W. Detection of fungal disease in citrus fruit based on hyperspectral imaging. Inf. Process. Agric. 2025, in press. [Google Scholar] [CrossRef]
  12. Zheng, X.; Dong, Y.; Yang, Q.; Yu, M.; Zhao, Z.; Li, P.; Zheng, Y. Non-destructive Authentication of Dried Tangerine Peel Powder Based on Near-Infrared Spectroscopy Technology. China Fruits Veg. 2022, 42, 36–41. [Google Scholar]
  13. Zhang, F.; Liu, J.; Lin, J.; Wang, Z. Detection of Oil Yield from Oil Shale Based on Near-Infrared Spectroscopy Combined with Wavelet Transform and Least Squares Support Vector Machines. Infrared Phys. Technol. 2019, 97, 224–228. [Google Scholar] [CrossRef]
  14. Wang, F.; Chen, L.; Duan, D.; Cao, Q.; Zhao, Y.; Lan, W. Hyperspectral Monitoring of Total Nitrogen Content in Fresh Tea Leaves Based on Wavelet Analysis. Spectrosc. Spectr. Anal. 2022, 42, 3235–3242. [Google Scholar]
  15. Kumar, A.; Tomar, H.; Mehla, V.K.; Komaragiri, R.; Kumar, M. Stationary wavelet transform based ECG signal denoising method. ISA Trans. 2021, 114, 251–262. [Google Scholar] [CrossRef]
  16. Gao, J.; Wang, B.; Wang, Z.; Wang, Y.; Kong, F. A wavelet transform-based image segmentation method. Opt.-Int. J. Light Electron Opt. 2019, 208, 164123. [Google Scholar] [CrossRef]
  17. Zheng, R.; Wang, T.; Cao, J.; Vidal, P.P.; Wang, D. Multi-modal physiological signals based fear of heights analysis in virtual reality scenes. Biomed. Signal Process. Control 2025, 70, 102988. [Google Scholar] [CrossRef]
  18. Wu, G.; He, Y. Application Research of Wavelet Threshold Denoising Model in Infrared Spectral Signal Processing. Spectrosc. Spectr. Anal. 2009, 29, 3246–3249. [Google Scholar]
  19. Xu, T.; Jin, Z.; Guo, Z.; Yang, L.; Bai, J.; Feng, S.; Yu, F. Cooperative Inversion Method of Nitrogen and Phosphorus Content in Rice Leaves Based on CARS-RUN-ELM Algorithm. Trans. Chin. Soc. Agric. Eng. 2022, 38, 148–155. [Google Scholar]
  20. Yang, C.; Ma, X.; Guan, H.; Fan, B. Rapid detection method of Pleurotus eryngii mycelium based on near infrared spectral characteristics. Spectrochim. Acta Part A Mol. Biomol. Spectrosc. 2022, 271, 120919. [Google Scholar] [CrossRef]
  21. Sony, S.; Dunphy, K.; Sadhu, A.; Capretz, M. A systematic review of convolutional neural network-based structural condition assessment techniques. Eng. Struct. 2021, 226, 111347. [Google Scholar] [CrossRef]
  22. Yang, J.; Ma, X.; Guan, H.; Yang, C.; Zhang, Y.; Li, G.; Li, Z. A recognition method of corn varieties based on spectral technology and deep learning model. Infrared Phys. Technol. 2023, 128, 104533. [Google Scholar] [CrossRef]
  23. Zhai, N.; Yun, L.; Ye, Z.; Wang, Y.; Li, Y. Research on Prediction Method of Tobacco Mold in Storage Based on One-Dimensional Convolutional Neural Network. Comput. Eng. Sci. 2021, 43, 1833–1837. [Google Scholar]
  24. Li, G.; Yao, Q.; Fan, C.; Zhou, C.; Wu, G.; Zhou, Z.; Fang, X. An explainable one-dimensional convolutional neural networks based fault diagnosis method for building heating, ventilation and air conditioning systems. Build. Environ. 2021, 203, 108057. [Google Scholar] [CrossRef]
  25. Geetha, B.T.; Kumar, P.S.; Bama, B.S.; Neelakandan, S.; Dutta, C.; Babu, D.V. Green energy aware and cluster based communication for future load prediction in IoT. Sustain. Energy Technol. Assess. 2022, 52, 102244. [Google Scholar] [CrossRef]
  26. Dai, Z.; Li, D.; Zhou, Z.; Zhou, S.; Liu, W.; Liu, J.; Wang, X.; Ren, X. A strategy for high performance of energy storage and transparency in KNN-based ferroelectric ceramics. Chem. Eng. J. 2022, 427, 131959. [Google Scholar] [CrossRef]
  27. Deng, Y.; Zhou, X.; Shen, J.; Xiao, G.; Liao, B.Q. New methods based on back propagation (BP) and radial basis function (RBF) artificial neural networks (ANNs) for predicting the occurrence of haloketones in tap water. Sci. Total Environ. 2021, 772, 145534. [Google Scholar] [CrossRef]
  28. Blanco, V.; Japón, A.; Puerto, J. A Mathematical Programming Approach to SVM-Based Classification with Label Noise. Comput. Ind. Eng. 2022, 172, 108611. [Google Scholar] [CrossRef]
  29. Han, D.; Song, X.; Zhang, D. Occurrence and Integrated Control Techniques of Major Diseases and Pests of Adzuki Beans in Heilongjiang Province. Mod. Agric. 2018, 5, 2–5. [Google Scholar]
  30. Shen, X. Control Methods for Common Rust and Root Rot Diseases of Adzuki Beans in Heilongjiang Province. Heilongjiang Agric. Sci. 2017, 7, 132–133. [Google Scholar]
  31. Zhao, L.; Liu, C.; Xiao, Z. Occurrence and Control of Common Diseases and Pests of Adzuki Beans in Qinggang County. Mod. Agric. Sci. Technol. 2017, 6, 138+142. [Google Scholar]
  32. Fassio, A.S.; Restaino, E.A.; Cozzolino, D. Determination of oil content in whole corn (Zea mays L.) seeds by means of near infrared reflectance spectroscopy. Comput. Electron. Agric. 2015, 110, 171–175. [Google Scholar] [CrossRef]
  33. Wang, Z.; Huang, W.; Li, J.; Liu, S.; Fan, S. Assessment of protein content and insect infestation of maize seeds based on on-line near-infrared spectroscopy and machine learning. Comput. Electron. Agric. 2023, 211, 107969. [Google Scholar] [CrossRef]
  34. Abdel-Basset, M.; Mohamed, R.; Abouhawwash, M. Crested Porcupine Optimizer: A new nature-inspired metaheuristic. Knowl. -Based Syst. 2024, 284, 111257. [Google Scholar] [CrossRef]
  35. Chen, W.; Shi, C.; Ma, C. Crop Disease Recognition Method Based on Multi-modal Data Fusion. Comput. Appl. 2025, 45, 840–848. [Google Scholar]
  36. Hassanin, M.; Anwar, S.; Radwan, I.; Khan, F.S.; Mian, A. Visual attention methods in deep learning: An in-depth survey. Inf. Fusion 2024, 108, 102417. [Google Scholar] [CrossRef]
  37. Rinnan, Å.; Van Den Berg, F.; Engelsen, S.B. Review of the most common pre-processing techniques for near-infrared spectra. TrAC Trends Anal. Chem. 2009, 28, 1201–1222. [Google Scholar] [CrossRef]
  38. Shao, S.; McAleer, S.; Yan, R.; Baldi, P. Highly accurate machine fault diagnosis using deep transfer learning. IEEE Trans. Ind. Inform. 2018, 15, 2446–2455. [Google Scholar] [CrossRef]
Figure 1. Comparison of canopy characteristics between healthy and diseased adzuki bean. (a) Diseased adzuki bean plant. (b) Healthy adzuki bean plant.
Agriculture 15 01246 g001
Figure 2. UV-Vis-NIR spectral data of adzuki bean.
Agriculture 15 01246 g002
Figure 3. LeNet-5 network architecture.
Agriculture 15 01246 g003
Figure 4. SNR variation during wavelet decomposition. (a) Daubechies. (b) Reverse Biorthogonal.
Agriculture 15 01246 g004
Figure 5. MSE evolution across wavelet scales. (a) Daubechies. (b) Reverse Biorthogonal.
Agriculture 15 01246 g005
Figure 6. Raw reflectance spectra of adzuki bean leaves.
Agriculture 15 01246 g006
Figure 7. Denoised spectral characteristics from wavelet reconstruction.
Agriculture 15 01246 g007
Figure 8. Extraction of original characteristic wavenumbers using the CARS algorithm. (a) The trend of changes in sample size. (b) The trend of variation in root mean square error. (c) The dynamic trend of variations in the regression coefficient paths.
Agriculture 15 01246 g008
Figure 9. Curve of accuracy and loss value changes in the training set. (a) Accuracy rate variation curve. (b) Loss value variation curve.
Agriculture 15 01246 g009
Figure 10. Flowchart of constructing diagnostic model of adzuki bean rust disease.
Agriculture 15 01246 g010
Figure 11. Confusion matrix for the test set. (a) Raw-LeNet-5 model. (b) DWT-CARS-LeNet-5 model.
Agriculture 15 01246 g011
Figure 12. The computational outputs of the LeNet-5 network model. (a) The value of y1. (b) The value of y2.
Agriculture 15 01246 g012
Table 1. Feature wavenumbers variables for spectral data analysis of adzuki bean plant.
No.Wavenumbers (nm)No.Wavenumbers (nm)No.Wavenumbers (nm)No.Wavenumbers (nm)No.Wavenumbers (nm)
14302441344544495450
645374658466946710475
1149312494135181452915530
1653117534185361954520548
2154922551235522456625567
2656827570285712957330577
3157832579335833459235593
3659437611386123961640622
4162342677436844469645703
4672247742487614977750809
51812
Table 2. Coding rules.
Plant ConditionTraining SetTest SetEncoded Labels
Health1800900[1, 0]
Infection30001500[0, 1]
Table 3. Analysis of prediction outputs for the four classic models.
ModelTraining SetTesting Set
Accuracy Training Duration/sAccuracySimulation Duration/s
BP92.00%0.2090.30%0.15
KNN95.30%0.2578.00%0.09
SVM85.00%0.3675.70%0.11
LeNet5100.00%0.3599.65%0.10
TCN98.60%0.7585.00%0.09
MobileNet100.00%0.6755.92%0.09
1D-ResNet99.96%1.5451.38%0.23
InceptionTime99.69%0.7954.42%0.09
PLS90.10%0.1489.70%0.05
Disclaimer/Publisher’s Note: The statements, opinions and data contained in all publications are solely those of the individual author(s) and contributor(s) and not of MDPI and/or the editor(s). MDPI and/or the editor(s) disclaim responsibility for any injury to people or property resulting from any ideas, methods, instructions or products referred to in the content.

