Article

Genetic Diversity of Olive (Olea europaea L.) Cultivars Assessed by Genotyping-by-Sequencing in Southern Peru

by
Martín Eloy Casilla García
1,*,
Rina Alvarez Becerra
2,
José Cotrado Cotrado
1,
Juan Iván Casilla Rondán
1,
Janet Libertad Huatuco Coaquira
1 and
Edgar Virgilio Bedoya Justo
3
1
Faculty of Agricultural Sciences, Universidad Nacional Jorge Basadre Grohmann, Tacna 23000, Peru
2
Faculty of Health Sciences, Universidad Nacional Jorge Basadre Grohmann, Tacna 23000, Peru
3
Faculty of Engineering, Universidad Nacional de Moquegua, Moquegua 18001, Peru
*
Author to whom correspondence should be addressed.
Agriculture 2025, 15(12), 1237; https://doi.org/10.3390/agriculture15121237
Submission received: 27 March 2025 / Revised: 14 May 2025 / Accepted: 15 May 2025 / Published: 6 June 2025
(This article belongs to the Special Issue Advancements in Genotype Technology and Their Breeding Applications)

Abstract

:
The genetic diversity of the olive tree (Olea europaea L.) is critical for enhancing crop resilience and productivity under changing climatic conditions. Peru’s southern region, particularly Tacna, hosts over 30 olive cultivars, yet their genetic structure remains poorly characterized. This study aimed to evaluate the morphological and genomic diversity of ten economically important olive varieties cultivated in 15 sectors across Tacna and Jorge Basadre provinces. A total of 92 mother plants were selected for morphological assessment using 25 standardized descriptors. Additionally, genomic DNA was extracted from 30 samples and subjected to genotyping-by-sequencing (GBS). Quality metrics confirmed the efficiency of a modified 6h-DNA extraction protocol. Bioinformatic analysis identified hundreds of thousands of SNPs per variety, with a high transition/transversion ratio (∼2.1), indicating reliable variant calls. Phylogenetic clustering revealed three diversity groups, with the olive cultivars Ascolana and Frantoio exhibiting high genetic variability, and Arbequina and Leccino—also olive cultivars—showing reduced diversity. The integration of phenotypic and genomic data highlights hidden variability and supports informed selection and conservation strategies. These findings provide a genomic baseline for breeding programs and genetic resource management in emerging olive-growing regions such as southern Peru.

1. Introduction

The olive tree (Olea europaea L.) is one of the oldest cultivated species in the world, with domestication believed to have originated in the Eastern Mediterranean approximately 6000 years ago. The olive is the most emblematic tree of the Mediterranean basin [1]. Since then, olive cultivation has spread widely across Mediterranean climates with human migrations [2,3], contributing significantly to the cultural, economic, and ecological identity of the regions in which it is grown. Despite extensive global cultivation, the evolutionary history and genetic structure of many olive cultivars remain complex and partially unresolved [4]. Multiple studies suggest that olive domestication may have occurred independently in different regions, driven by the coexistence of wild relatives and extensive gene flow between populations [4,5].
Extra virgin olive oil production is expanding in South America, led by Argentina (over 60% of the cultivated area), followed by Chile (second place in recent growth), Peru (a traditional producer), and Uruguay (a recent entrant in olive cultivation) [6]. Olive oil production in Peru is mainly concentrated in the southern region of the country, with Tacna being the area with the highest growth, particularly in the zones of La Yarada, Los Palos, Magollo, and Sama [7]. Within this region, more than 30 olive varieties have been identified, yet little is known about their genetic diversity and structure. Understanding the genetic composition of these cultivars is essential for germplasm conservation, breeding programs, and maintaining the sustainability of olive production under changing environmental conditions.
Traditional morphological descriptors have been widely used for varietal identification; however, these are often influenced by environmental conditions and human observation, leading to variable interpretations. Molecular markers, especially single-nucleotide polymorphisms (SNPs) [8], have revolutionized plant genetics by enabling high-throughput, reproducible, and genome-wide evaluations of genetic variability. Genotyping-by-sequencing (GBS) is a cost-effective technique that facilitates SNP discovery through genome reduction and next-generation sequencing and has been widely applied to assess genetic diversity in a range of crop species [9].
The genome of the olive tree (Olea europaea) has an estimated size of approximately 1.32 to 1.38 Gb, exhibits high heterozygosity (5.4%), and contains more than 60% repetitive elements, making it a structurally complex and challenging genome for sequencing and assembly [10]. Recent advances in sequencing technologies and bioinformatics have improved the resolution of genome-wide analyses, enabling deeper insights into cultivar differentiation, phylogenetic relationships, and domestication events [10,11,12]. Comparative genomic analyses have shown that cultivated olives tend to exhibit lower genetic diversity than their wild relatives, likely due to the limited genetic base used during domestication and the widespread use of clonal propagation, which may constrain their adaptive capacity [13].
In Peru, the genetic basis of cultivated olives remains underexplored. This study addresses this knowledge gap by integrating morphological and genomic data to evaluate the diversity of ten olive cultivars of economic importance in southern Peru. We hypothesize that these cultivars, despite their shared cultivation environment, possess distinct genetic profiles reflecting their geographic origins and historical selection.
The main objective of this study was to assess the morphological traits and genetic diversity of ten olive cultivars in the Tacna Region using GBS-derived SNP markers. The integration of phenotypic and genotypic analyses aims to provide a foundational understanding for cultivar characterization, conservation strategies, and future breeding programs. Our findings highlight the value of molecular tools for uncovering hidden diversity and guiding the sustainable management of olive genetic resources in emerging production zones.
Based on the diverse origins and phenotypic differences among the cultivars, we formulated the following hypothesis: olive varieties cultivated in southern Peru exhibit distinguishable genetic groupings, and these groups partially correspond to their known geographic origins or shared morphological traits. This hypothesis guided the comparative analysis between genetic structure (SNP-based) and the evaluated morphological descriptors.

2. Materials and Methods

2.1. Study Area and Plant Material Collection

The research was carried out in the Tacna Region of southern Peru, specifically in the provinces of Jorge Basadre and Tacna, which are notable for extensive olive cultivation. A purposive non-probabilistic sampling strategy was applied. A total of 92 mother plants representing 10 olive cultivars of economic importance—Sevillana, Ascolana Tenera, Pendolino, Frantoio, Leccino, Hojiblanca, Empeltre, Manzanilla, Arbequina, and Picual—were sampled across 15 olive-growing sectors. The producers were distributed as follows: La Yarada–Los Palos District (25 producers), Tacna District (4 producers), and Ite, Inclán, and Las Yaras Districts (5 producers). Data collection was carried out from 1 to 25 March 2024 in the Tacna Region.
While the selected cultivars do not represent the full genetic or geographic diversity of olives cultivated nationwide, they reflect the diversity present in southern Peru, particularly in the Tacna region, which accounted for 86.54% of the country’s olive production in 2020 [14].

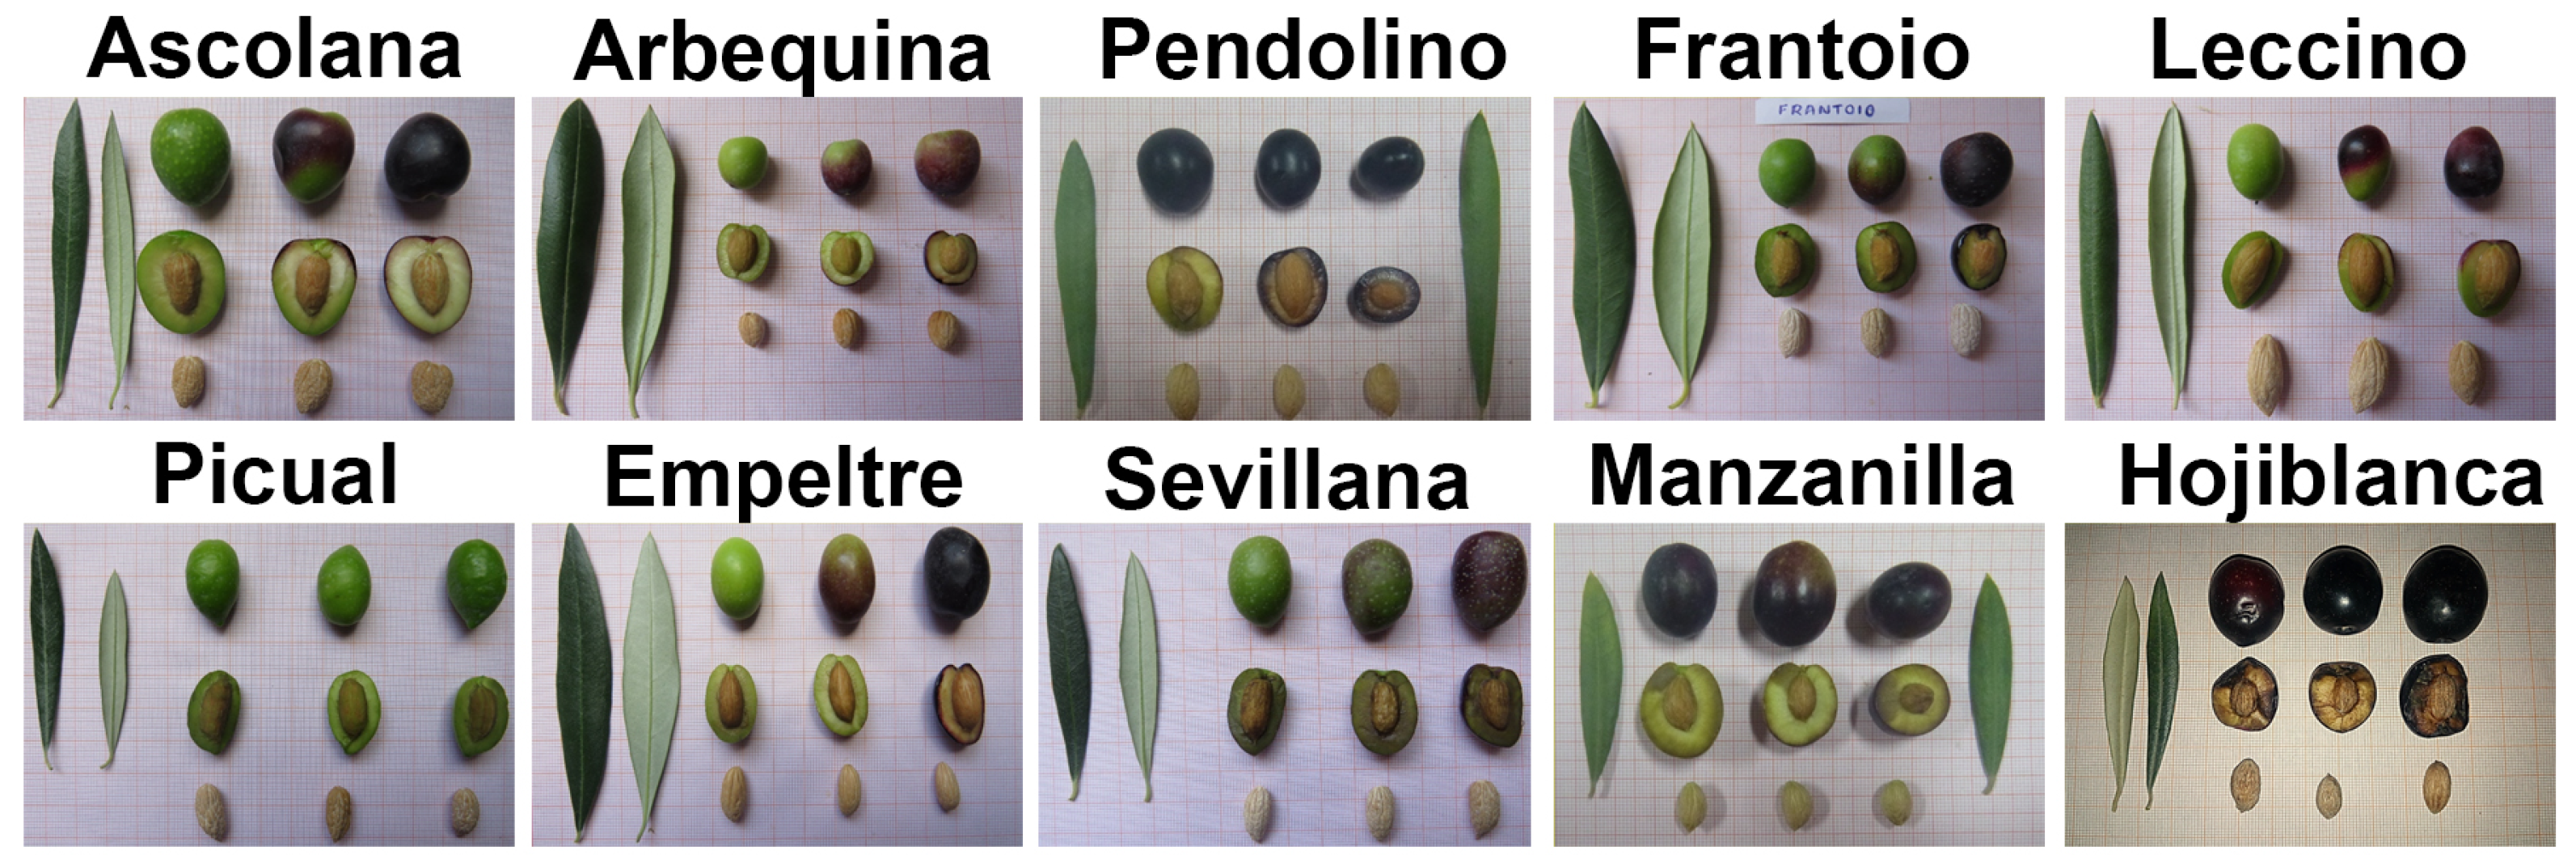
2.2. Morphological Characterization

Morphological characterization was performed using 25 qualitative and quantitative descriptors according to the guidelines of the International Union for the Protection of New Varieties of Plants (UPOV) [15]. The traits evaluated included the following:
  • Tree traits (3): vigor, growth habit, canopy density.
    Tree vigor refers to the overall abundance of vegetative growth, encompassing canopy development in both height and volume [15]. Vigor was classified into three categories based on tree height and trunk diameter, measured at the time of phenotypic evaluation:
    -
    Low: trees with a height < 2.5 m and trunk diameter < 10 cm;
    -
    Medium: trees with a height between 2.5 and 3.5 m and diameter between 10 and 15 cm;
    -
    High: trees with a height > 3.5 m and trunk diameter > 15 cm.
    The classification was performed during the same phenotypic evaluation period, and only trees at least 5 years old were considered to minimize the influence of developmental stage.
    Growth habit describes the natural orientation and structure of branches and shoots [15]. Growth habit was classified into two categories based on branch orientation and canopy architecture:
    -
    Open: characterized by an initially orthogeotropic branching pattern, where primary branches develop outward or at oblique angles, resulting in a spreading canopy structure.
    -
    Upright: defined by branches that grow predominantly in a vertical direction, with strong apical dominance and a compact, vertical canopy form.
    Canopy density refers to the overall abundance of canopy vegetation and was assessed visually based on the extent of foliage coverage and light penetration [15]. It was classified into three categories:
    -
    Sparse: Associated with fast-growing cultivars with long internodes. Gaps in the canopy allow visible light to pass through from multiple angles.
    -
    Middle: Typical of the species; while vegetation is abundant, internode length allows some light diffusion and partial shading inside the canopy.
    -
    Dense: Typical of cultivars with short internodes and abundant branching. The canopy appears compact, with inner parts deeply shaded due to foliage density.
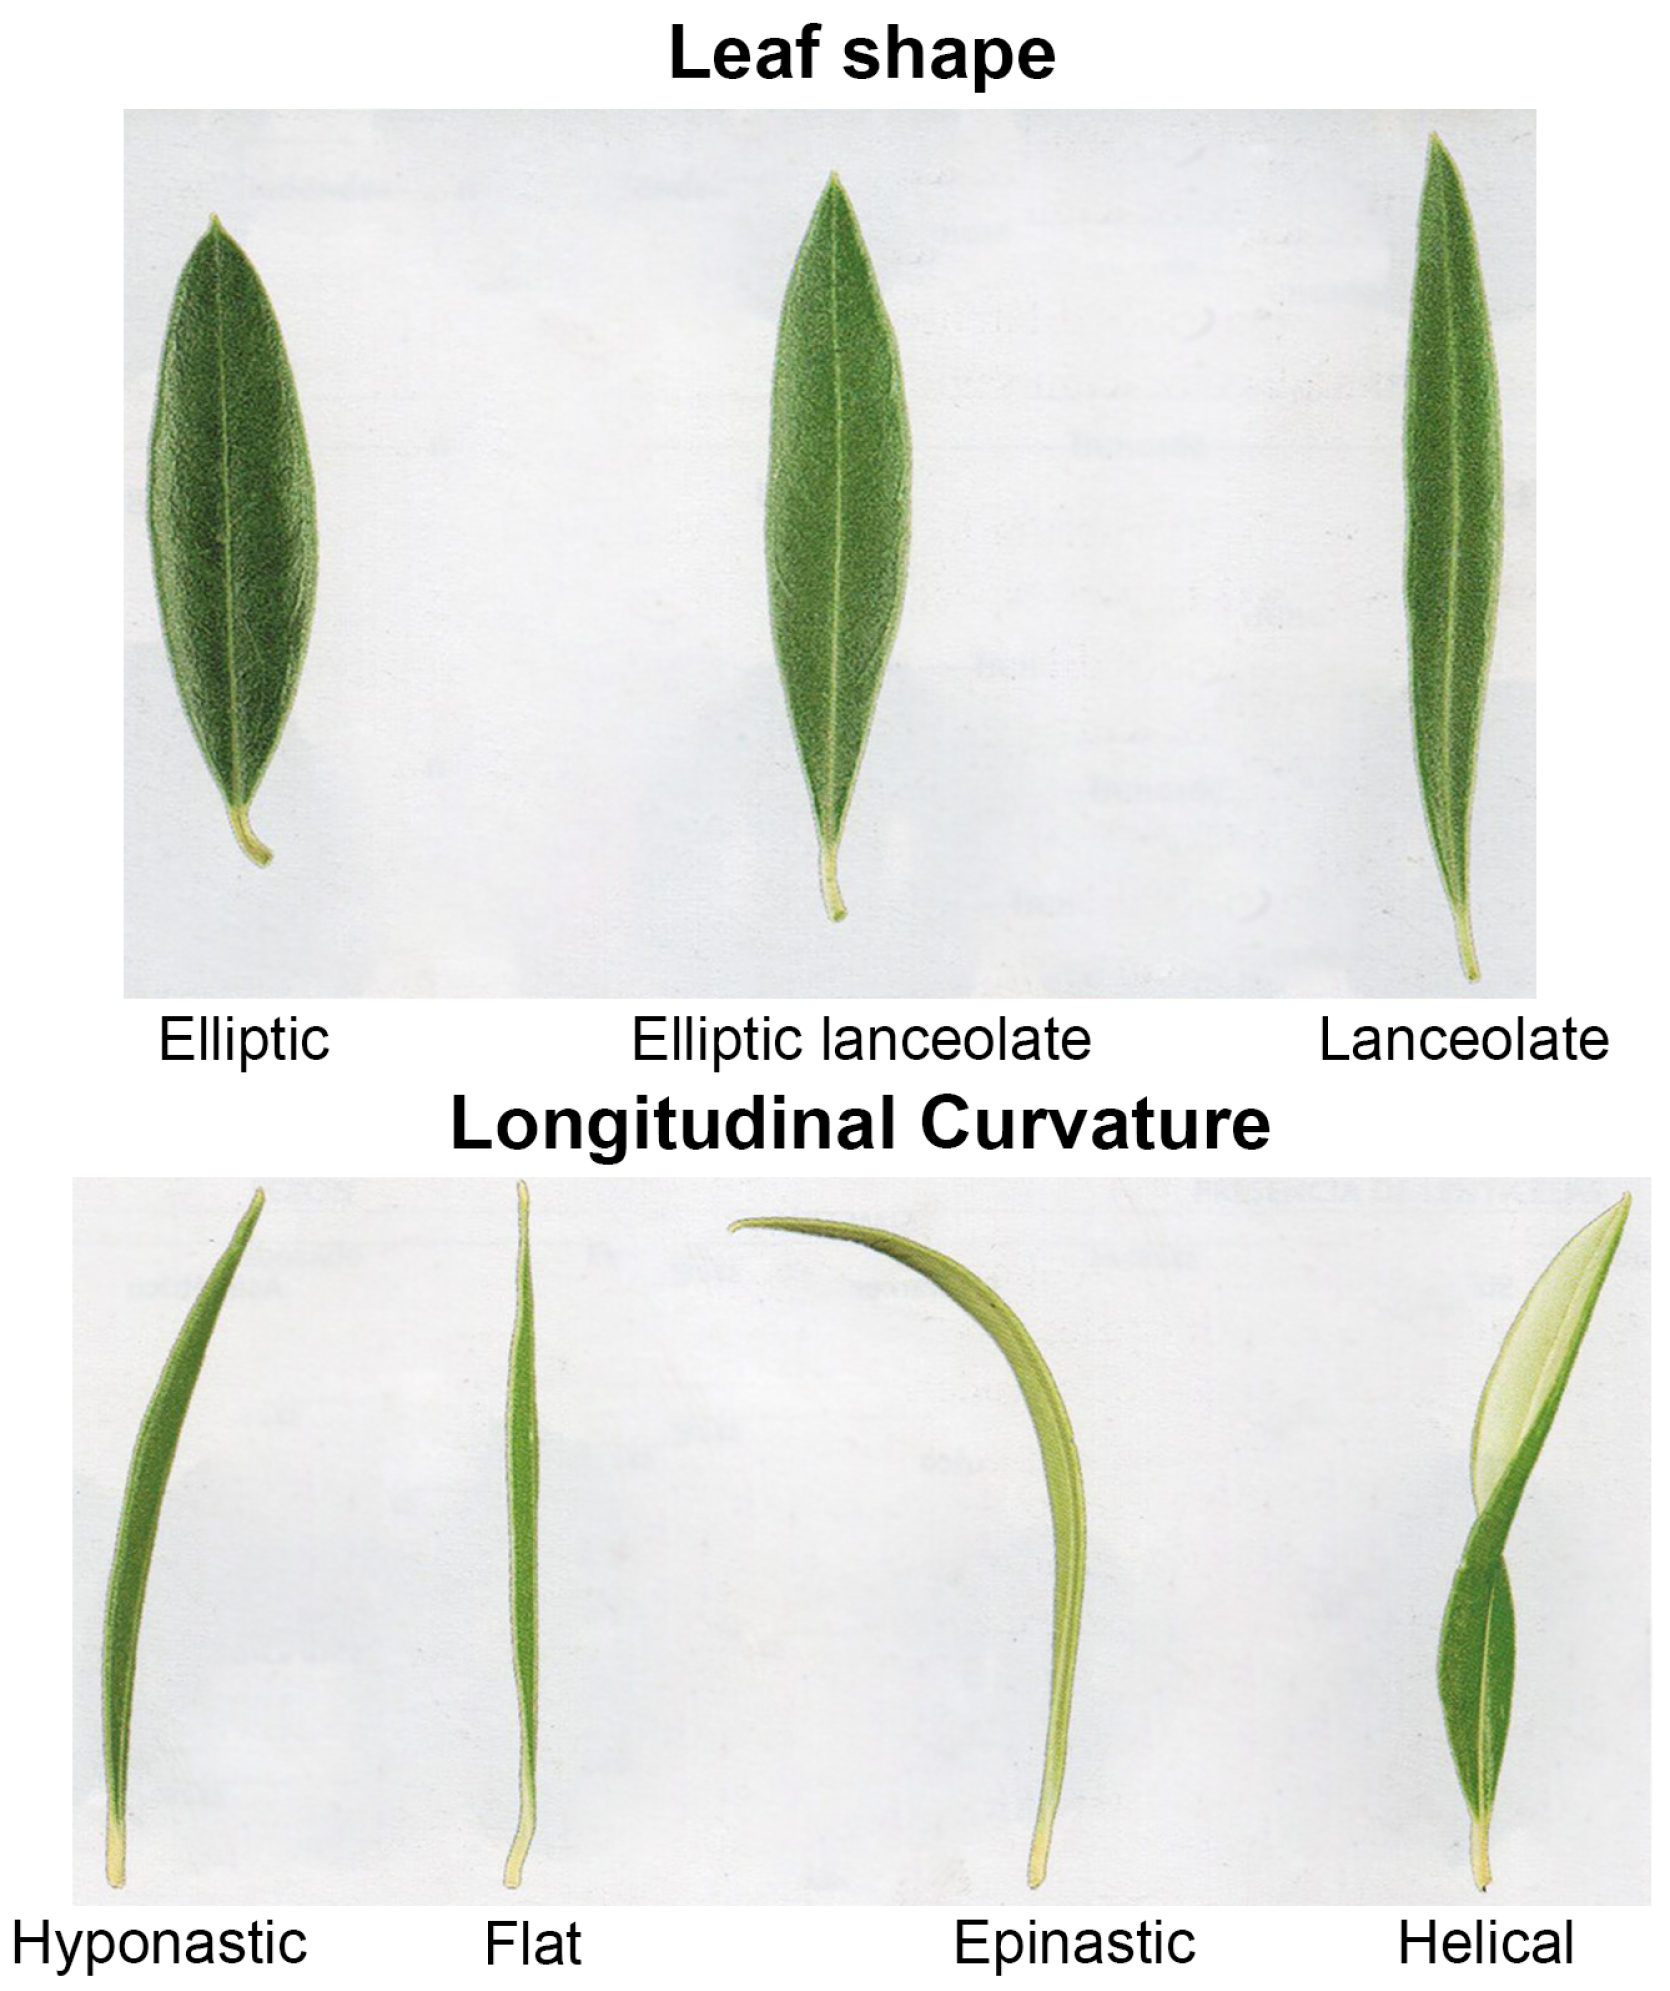
  • Leaf traits (4): shape, length, width, longitudinal curvature.
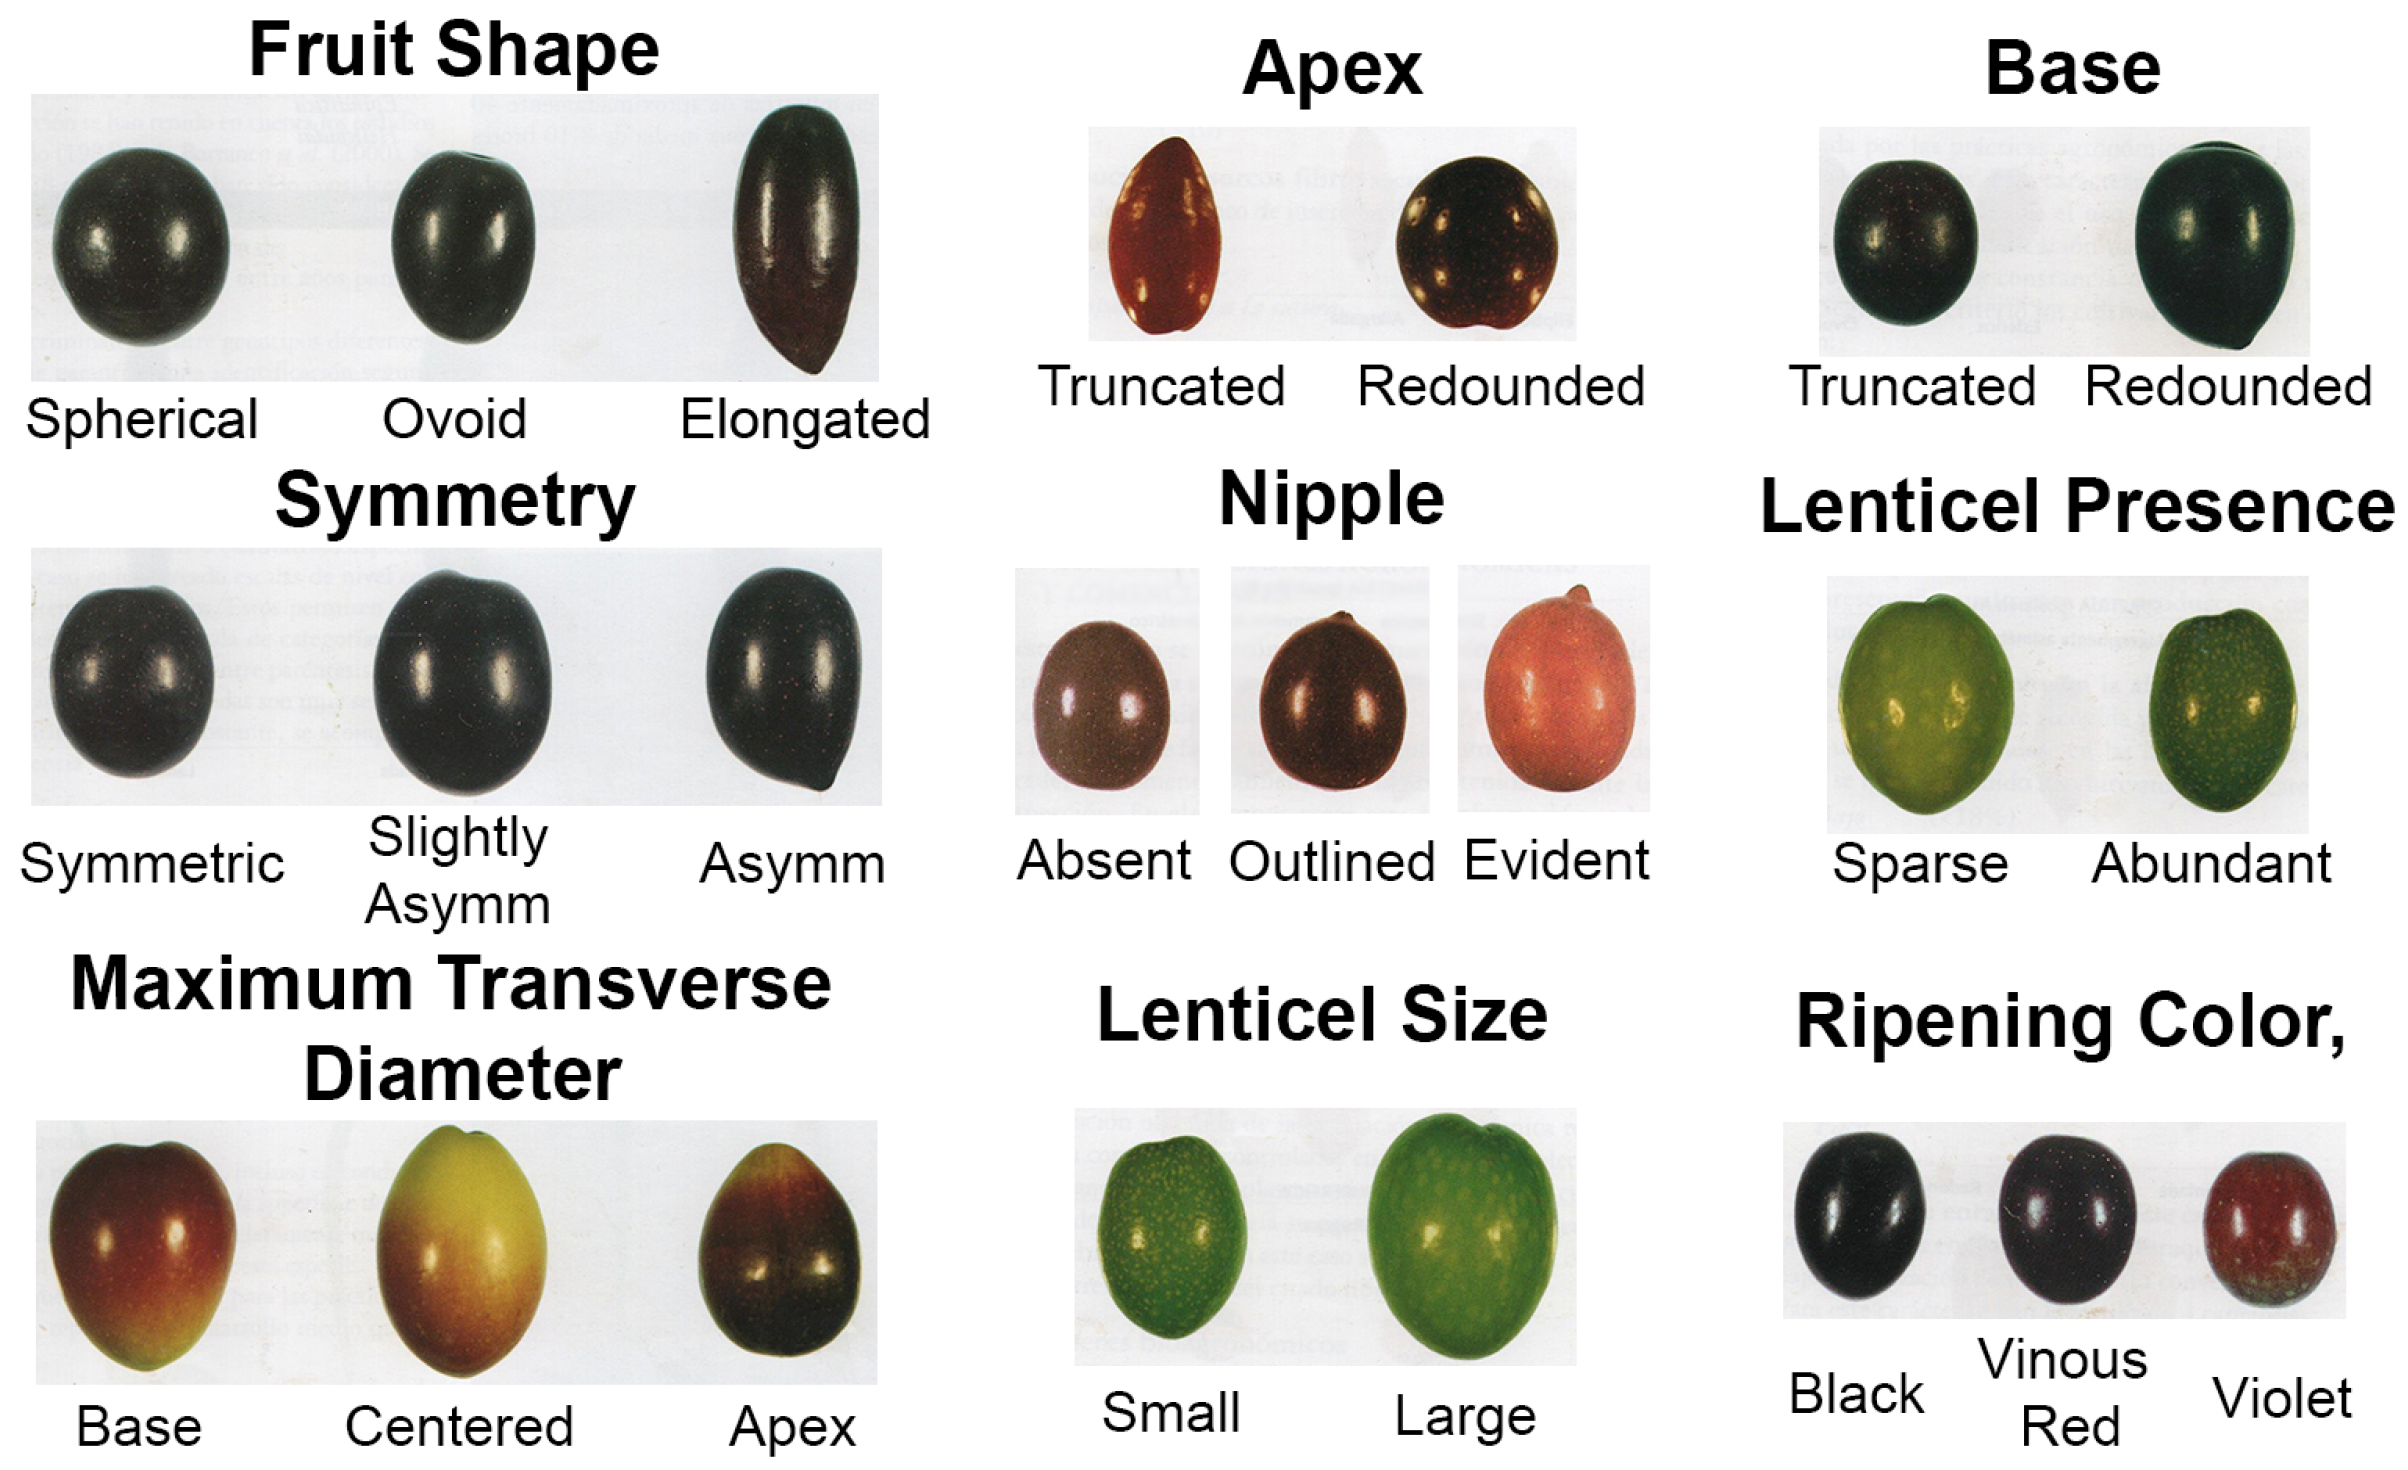
  • Fruit traits (10): weight, shape, symmetry (position A), apex, base, nipple presence, lenticel presence and size, ripening color, maximum transverse diameter (position B).
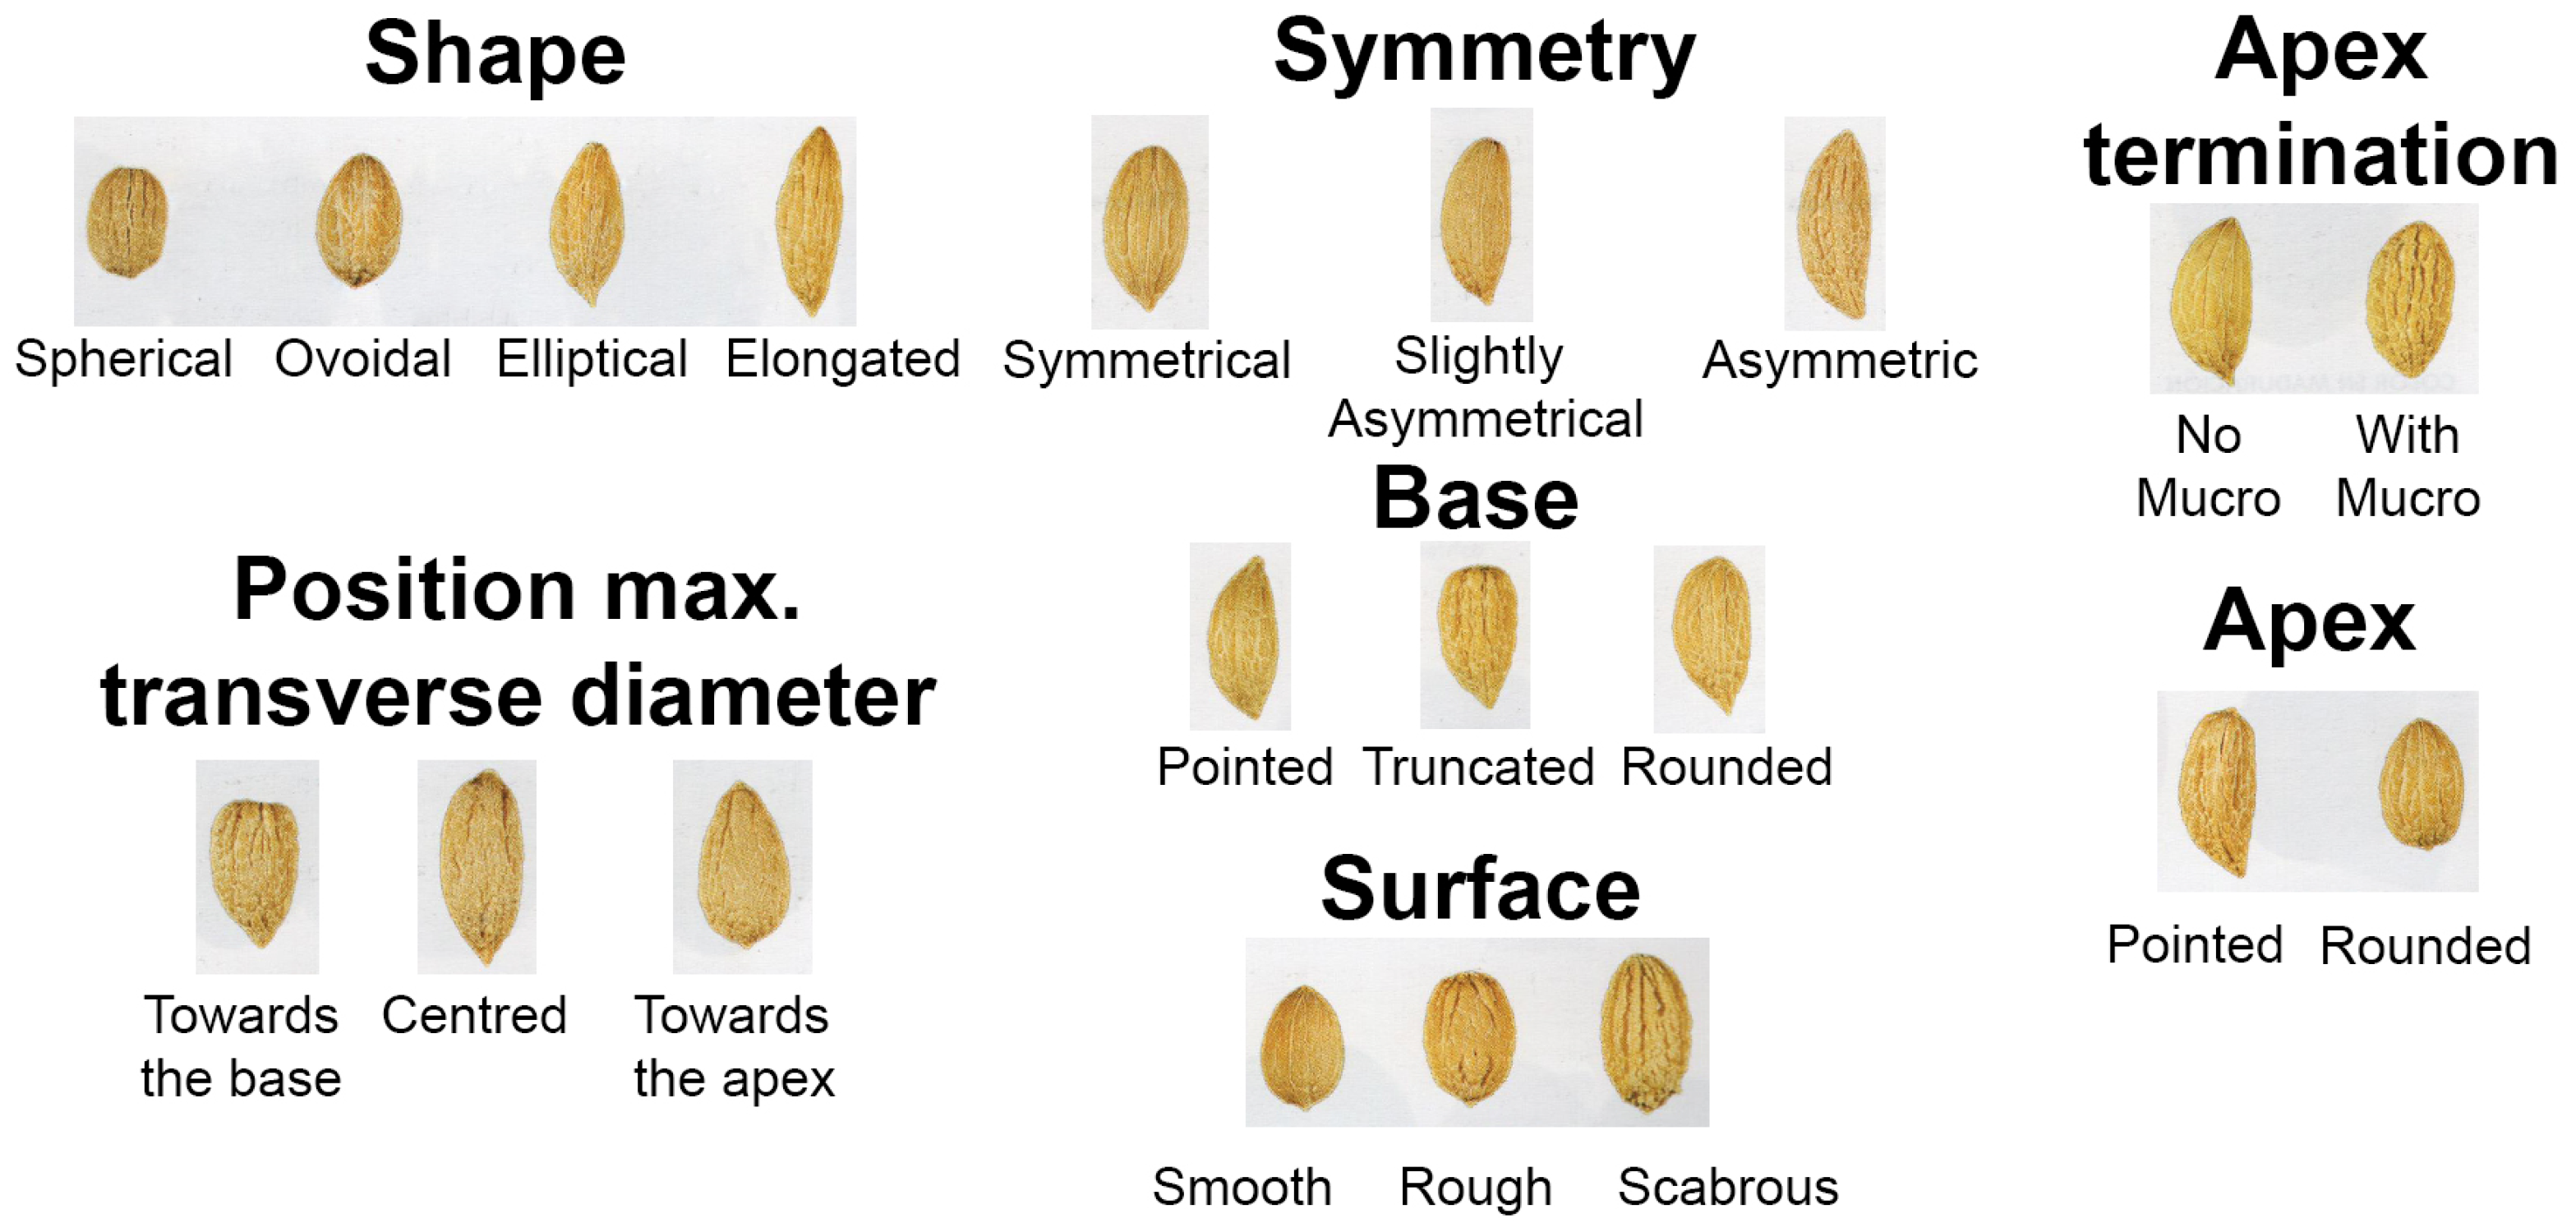
  • Endocarp traits (8): shape, symmetry (positions A and B), apex, base, surface texture, number of fibrovascular grooves, apex termination.
Morphological data were collected from 40 fruits and 40 leaves per tree, sampled from the middle section of the canopy.
Endocarp measurements were taken from six representative fruits per cultivar, and the values presented correspond to the mean of those samples.
For leaf traits, mature leaves aged between 6 months and 1 year were selected to ensure consistency in morphological measurements.
The Shannon–Weaver diversity index was used to quantify the morphological diversity between cultivars. The index considers both the abundance and evenness of trait categories. It is calculated using the proportion of each trait state relative to the total, as follows:
H = i = 1 s p i ln p i
where s is the total number of trait categories, and p i is the proportion of observations in the ith category relative to the total. This method provides a measure of diversity that increases with both the number of categories and the evenness of their distribution [16].
Figure 1, Figure 2 and Figure 3 illustrate the positional and measurement references for leaf, fruit, and endocarp traits, respectively.

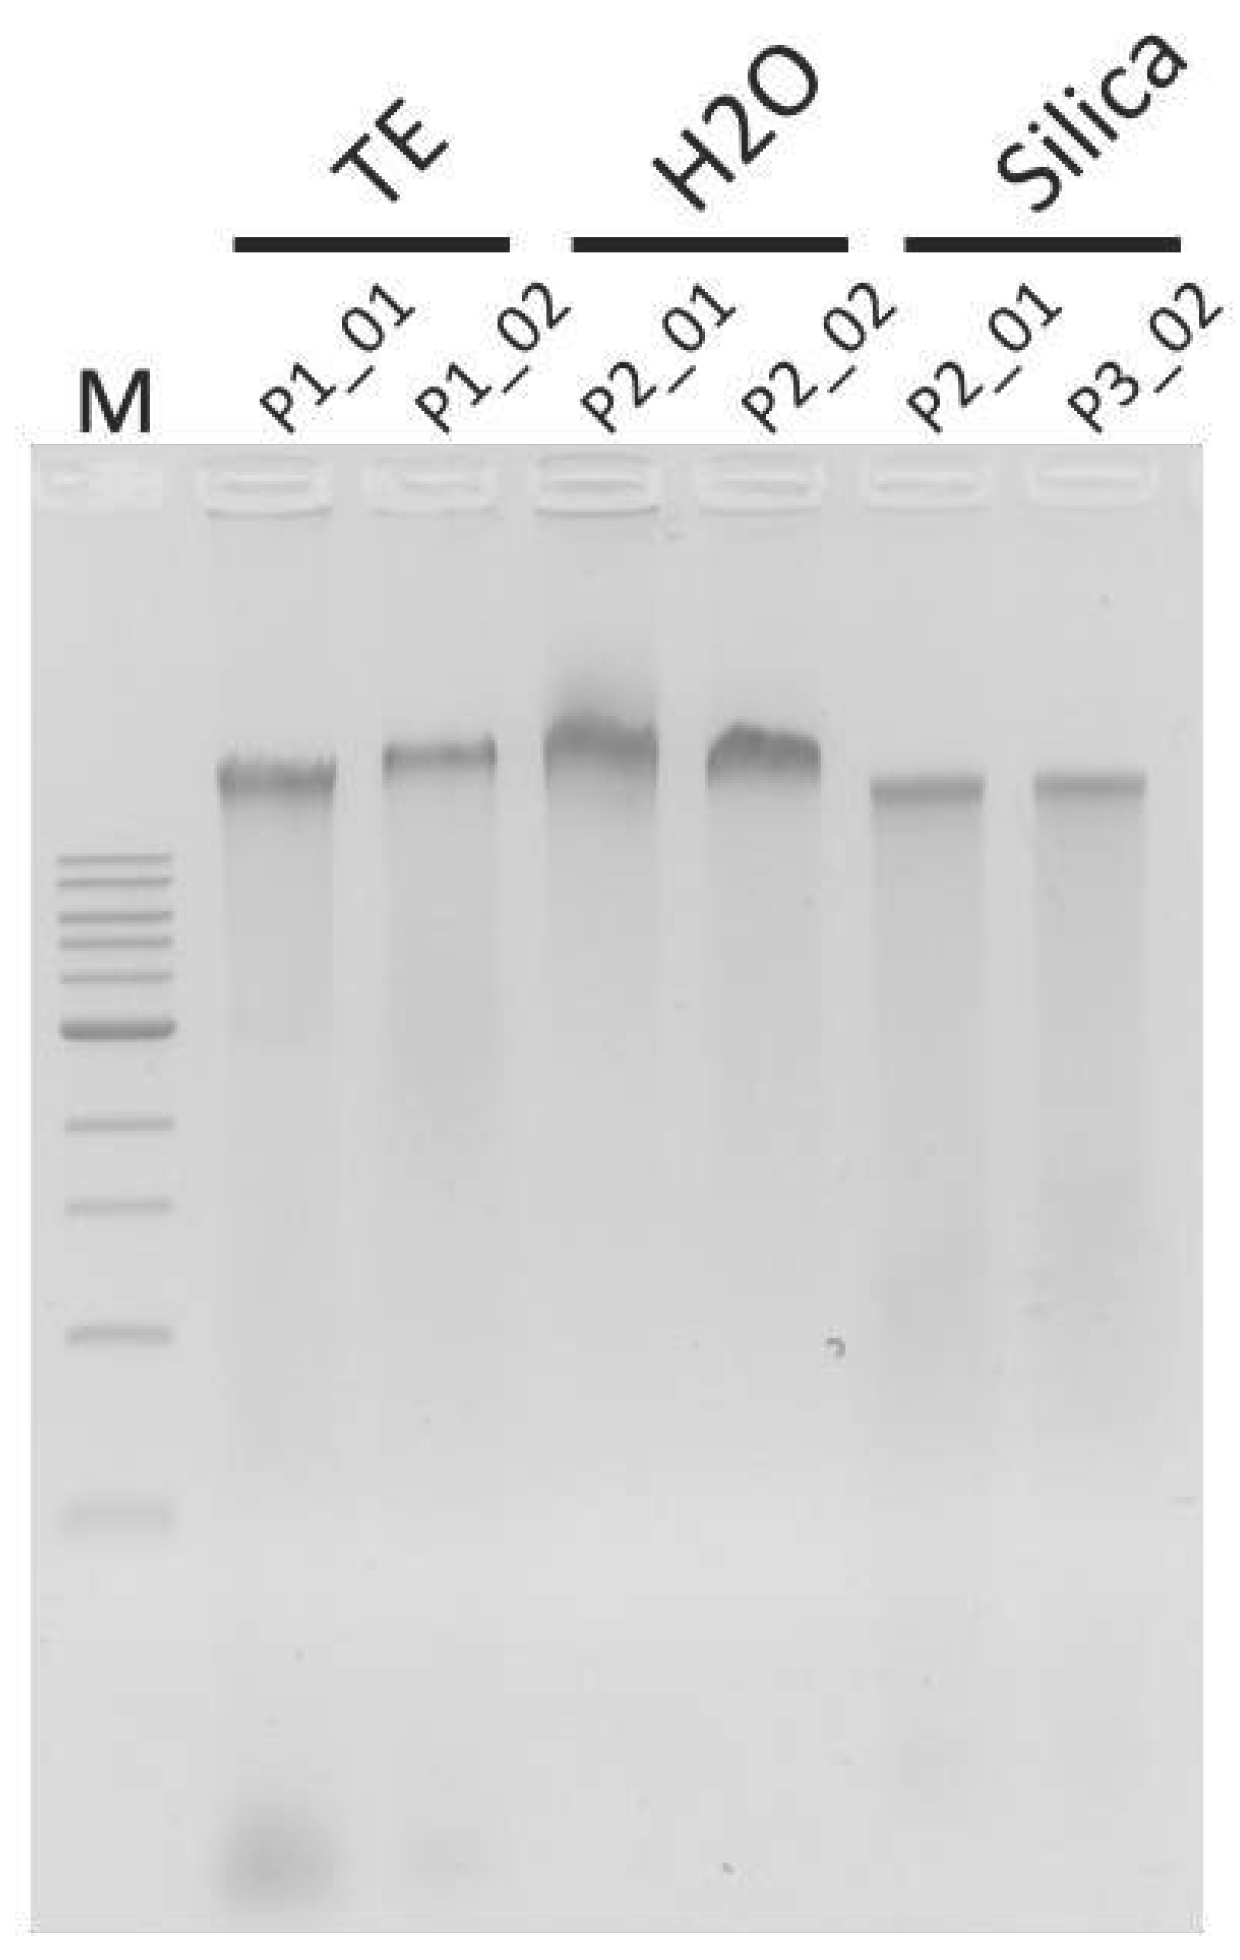
2.3. DNA Extraction and Quality Assessment

Young apical shoots from each tree were sampled for DNA extraction. Three biological replicates per cultivar were used, yielding a total of 30 composite samples. The samples (100 mg each) (Figure 4) were stored in sterile plastic bags on dry ice and later preserved at −80 °C.
Genomic DNA was extracted following a modified 6h-DNA method. This method involves organic extractions with chloroform: isoamyl alcohol (24:1) and phenol: chloroform: isoamyl alcohol (25:24:1), followed by treatment with RNase. All centrifugation steps were performed at room temperature. The extraction buffer consisted of 1.42 M NaCl, 100 mM Tris-HCl (pH 8.0), 200 mM EDTA (pH 8.0), 1% (w/v) RRP, 3% (w/v) CTAB, and 0.2% (v/v) β -mercaptoethanol.
Three protocol modifications were tested to optimize yield: (i) DNA resuspension in TE buffer, (ii) resuspension in H2O, and (iii) DNA precipitation using silica. DNA quantity and purity were assessed using a NanoDrop™ 1000 spectrophotometer (Thermo Scientific, Waltham, MA, USA) and a Qubit™ 2.0 fluorometer (Invitrogen, Carlsbad, CA, USA). Integrity was verified by 1% agarose gel electrophoresis stained with GelRed™ (Biotium, Fremont, CA, USA).

2.4. Genotyping by Sequencing (GBS) and Bioinformatics Analysis

Genotyping-by-sequencing (GBS) was selected for this study due to its ability to generate a large number of SNP markers rapidly and cost-effectively, without requiring prior genomic information. This makes it particularly suitable for genetic diversity studies in large and poorly characterized collections, such as the one evaluated here. Unlike SSR markers or commercial SNP arrays, GBS enables broader genome coverage and higher resolution for detecting population structure and genotype–phenotype associations.
GBS libraries were prepared from the 30 DNA samples and sequenced using Illumina paired-end technology. Sequence quality control was conducted using FastQC (v 0.11.9) [17], and trimming and filtering were performed using fastp (v 0.23.4) [18].
Reads were aligned to the reference genome of the Picual olive cultivar (available at https://denovo.cnag.cat/olive, accessed on 24 July 2024) using the Burrows–Wheeler Aligner (BWA) [19], and SAM/BAM file manipulations were carried out with SAMtools [20]. The reference genome has a total length of approximately 1.31 Gb, with a scaffold N50 of 734.4 kb and 94.4% complete BUSCO genes. Variant calling was conducted using both the Genome Analysis Toolkit (GATK) HaplotypeCaller [21] and FreeBayes [22]. Duplicate reads were identified and marked using GATK MarkDuplicates. Coverage and sequencing depth metrics were calculated with Mosdepth [23]. Variant annotation and summary statistics, including SNPs, haplotypes, indels, and transition/transversion (Ts/Tv) ratios, were derived using bcftools (v 1.17) [24].A phylogenetic tree was generated based on SNP data to elucidate the genetic relationships among the 10 olive cultivars studied.

3. Results

3.1. Morphological Variation Among Olive Varieties

The morphological characterization revealed significant qualitative and quantitative variation among the ten olive cultivars evaluated (Sevillana, Ascolana Tenera, Pendolino, Frantoio, Leccino, Hojiblanca, Empeltre, Manzanilla, Arbequina, and Picual). Regarding tree traits, Frantoio, Leccino, Hojiblanca, and Sevillana displayed high vigor, while Picual and Manzanilla exhibited medium vigor. Ascolana Tenera, Pendolino, and Arbequina showed low vigor. The tree growth habit was predominantly open, except for Empeltre and Hojiblanca, which exhibited upright growth. Leaf shape was predominantly lanceolate, except for Arbequina and Manzanilla, which exhibited an elliptic morphology. Fruit shape varied across cultivars: elliptical forms predominated in Manzanilla and Arbequina, while Empeltre was the only variety with elongated fruits. All cultivars lacked fruit nipple structures. Figure 5 shows the representative phenotype of each olive cultivar evaluated in this study. The image includes typical leaf shapes, fruit forms, and endocarp structures, which illustrate the morphological variation described in this section.
The qualitative morphological traits used to describe the ten olive cultivars are summarized in Table 1.
The endocarp traits evaluated across the ten olive cultivars are detailed in Table 2.
Endocarp (stone) morphology revealed further distinctions. Empeltre exhibited an elongated endocarp, while Arbequina and Manzanilla showed ovoid shapes, and the remaining cultivars presented elliptical forms. The base shape was consistently truncated across cultivars, apart from Frantoio, which had a rounded base. Variability in endocarp weight was also observed, ranging from 3.01 g in Ascolana Tenera to 0.84 g in Empeltre and 0.95 g in Sevillana. Table 3 summarizes the quantitative variation in endocarp traits across the ten olive cultivars evaluated.
The number of fibrovascular grooves varied notably, with Frantoio having only six, while Manzanilla, Picual, Arbequina, and Pendolino had ten, and Ascolana Tenera and Sevillana showed the highest counts.
The Shannon–Weaver diversity index for morphological traits indicated moderate to high variability, particularly in endocarp and fruit descriptors. The index ranged from 2.13 to 2.30 across traits such as endocarp weight, shape, symmetry, and groove characteristics. Detailed values of the Shannon–Weaver index for each morphological trait are presented in Table 4.
At the varietal level, the overall Shannon index was 2.24, with Sevillana (0.2957) and Empeltre (0.2765) exhibiting the highest contributions to morphological diversity. Table 5 shows the Shannon–Weaver diversity index values calculated for each of the ten olive cultivars.
Table 6 presents the results of discriminant analysis (Wilks’ lambda), highlighting the morphological traits that most strongly differentiate the olive cultivars.
To further assess statistical assumptions, a Levene’s test and multiple comparisons were performed to evaluate variance homogeneity across morphological traits according to plant part and commercial purpose. Results are shown in Table 7.

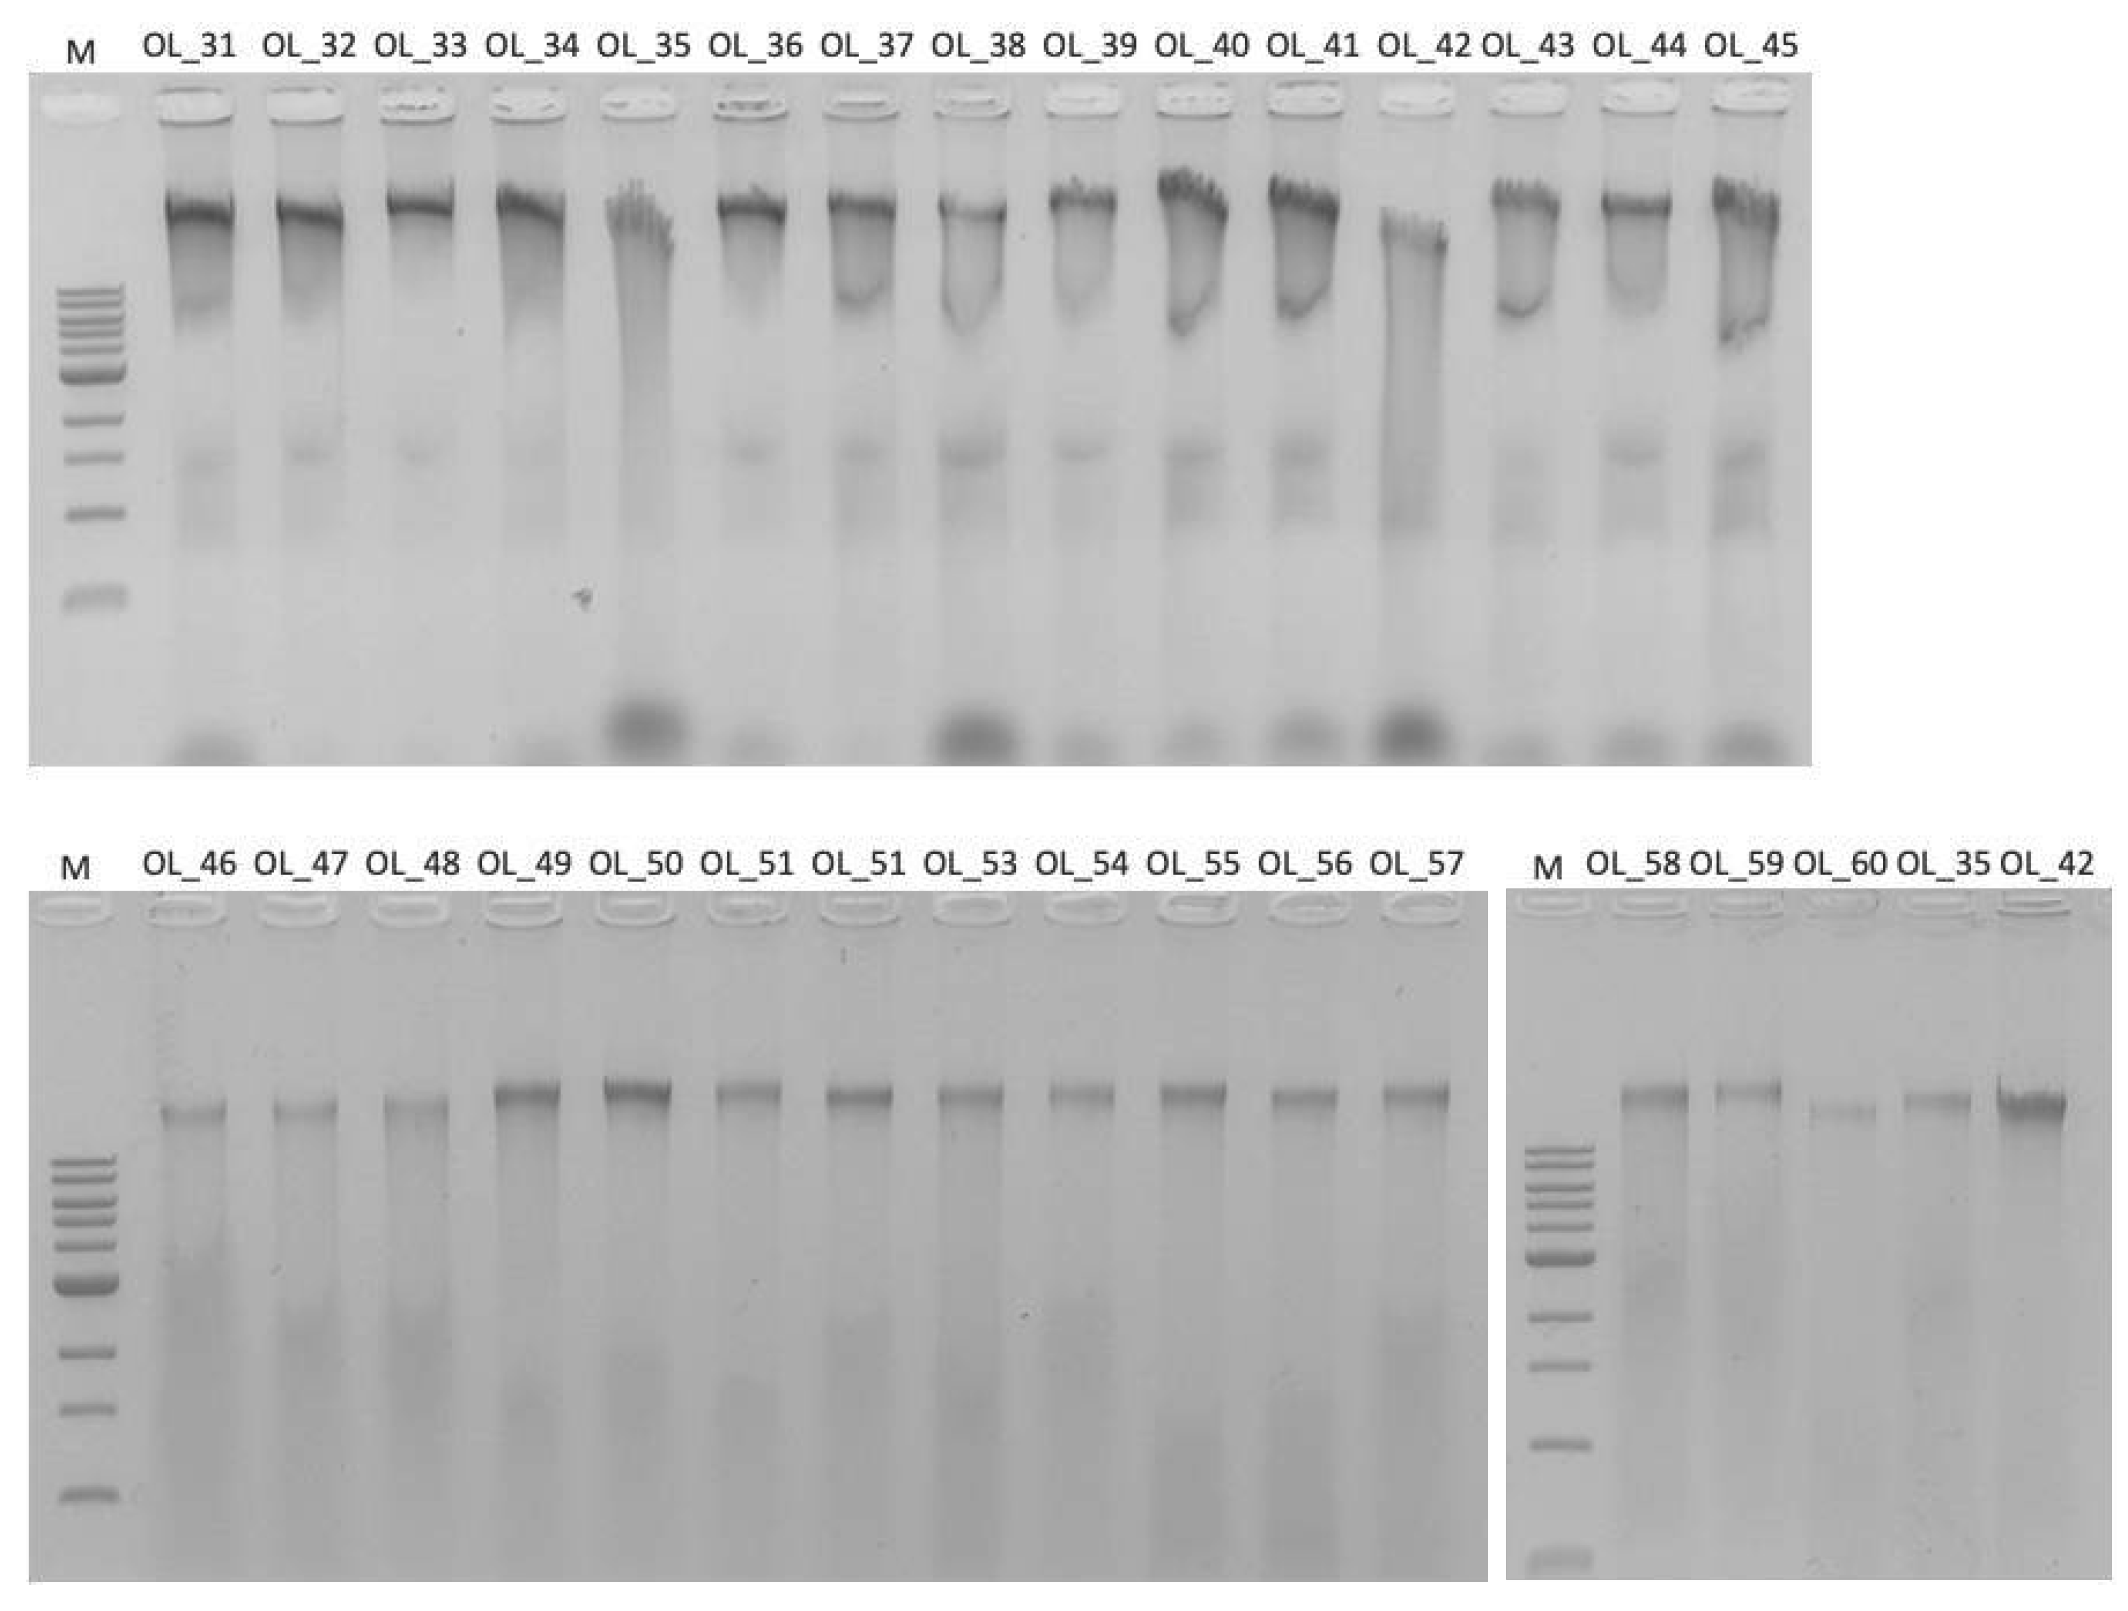
3.2. DNA Extraction and Protocol Optimization

To achieve the minimum requirement of 500 ng of total DNA per sample for GBS, three modifications of the 6h-DNA protocol were tested: (i) DNA resuspension in TE buffer, (ii) resuspension in distilled water (H2O), and (iii) DNA precipitation using silica. Each variation was performed in duplicate.
To further compare the performance of these modifications, the integrity of the extracted DNA was verified by 1% agarose gel electrophoresis, as shown in Figure 6. The figure shows that the samples resuspended in TE buffer (P1_01 and P1_02) exhibited more defined and intense bands compared to the other variants, supporting the selection of this modification as the most efficient for subsequent analyses.
Figure 7 shows the results of agarose gel electrophoresis used to evaluate DNA integrity in the 30 samples extracted using the 6h-DNA protocol.
The use of TE buffer for DNA resuspension resulted in superior DNA concentration (21.4–38.2 ng/µL) compared to resuspension in H2O or DNA precipitation with silica. Based on yield and quality, the modified 6h-DNA protocol using TE buffer was selected for processing the 30 leaf tissue samples.
Table 8 summarizes the DNA yield obtained from the three tested modifications of the 6h-DNA extraction protocol.
DNA concentrations varied among samples, with the highest concentrations observed in Ascolana Tenera (up to 2333.1 ng/µL) and Hojiblanca (up to 1086.7 ng/µL), while Picual yielded lower values (as low as 91.9 ng/µL). The list of olive cultivars and the respective tissue weights used for DNA extraction with the 6h-DNA protocol are summarized in Table 9.
Table 10 provides the absorbance (A260) and DNA concentration values for each of the 30 leaf tissue samples evaluated, organized by cultivar and sampling location.

3.3. Sequencing and Quality Control

All 30 samples were successfully sequenced in paired-end mode. FastQC reports confirmed high-quality reads across all samples, with read counts ranging from ∼3.2 million to ∼4.9 million and GC contents between 34% and 38%. Post-processing with fastp (v 0.23.4) involved trimming, adapter removal, quality filtering, and error correction. Filtered read data retained over 95% of the original sequencing volume with high sequence quality.

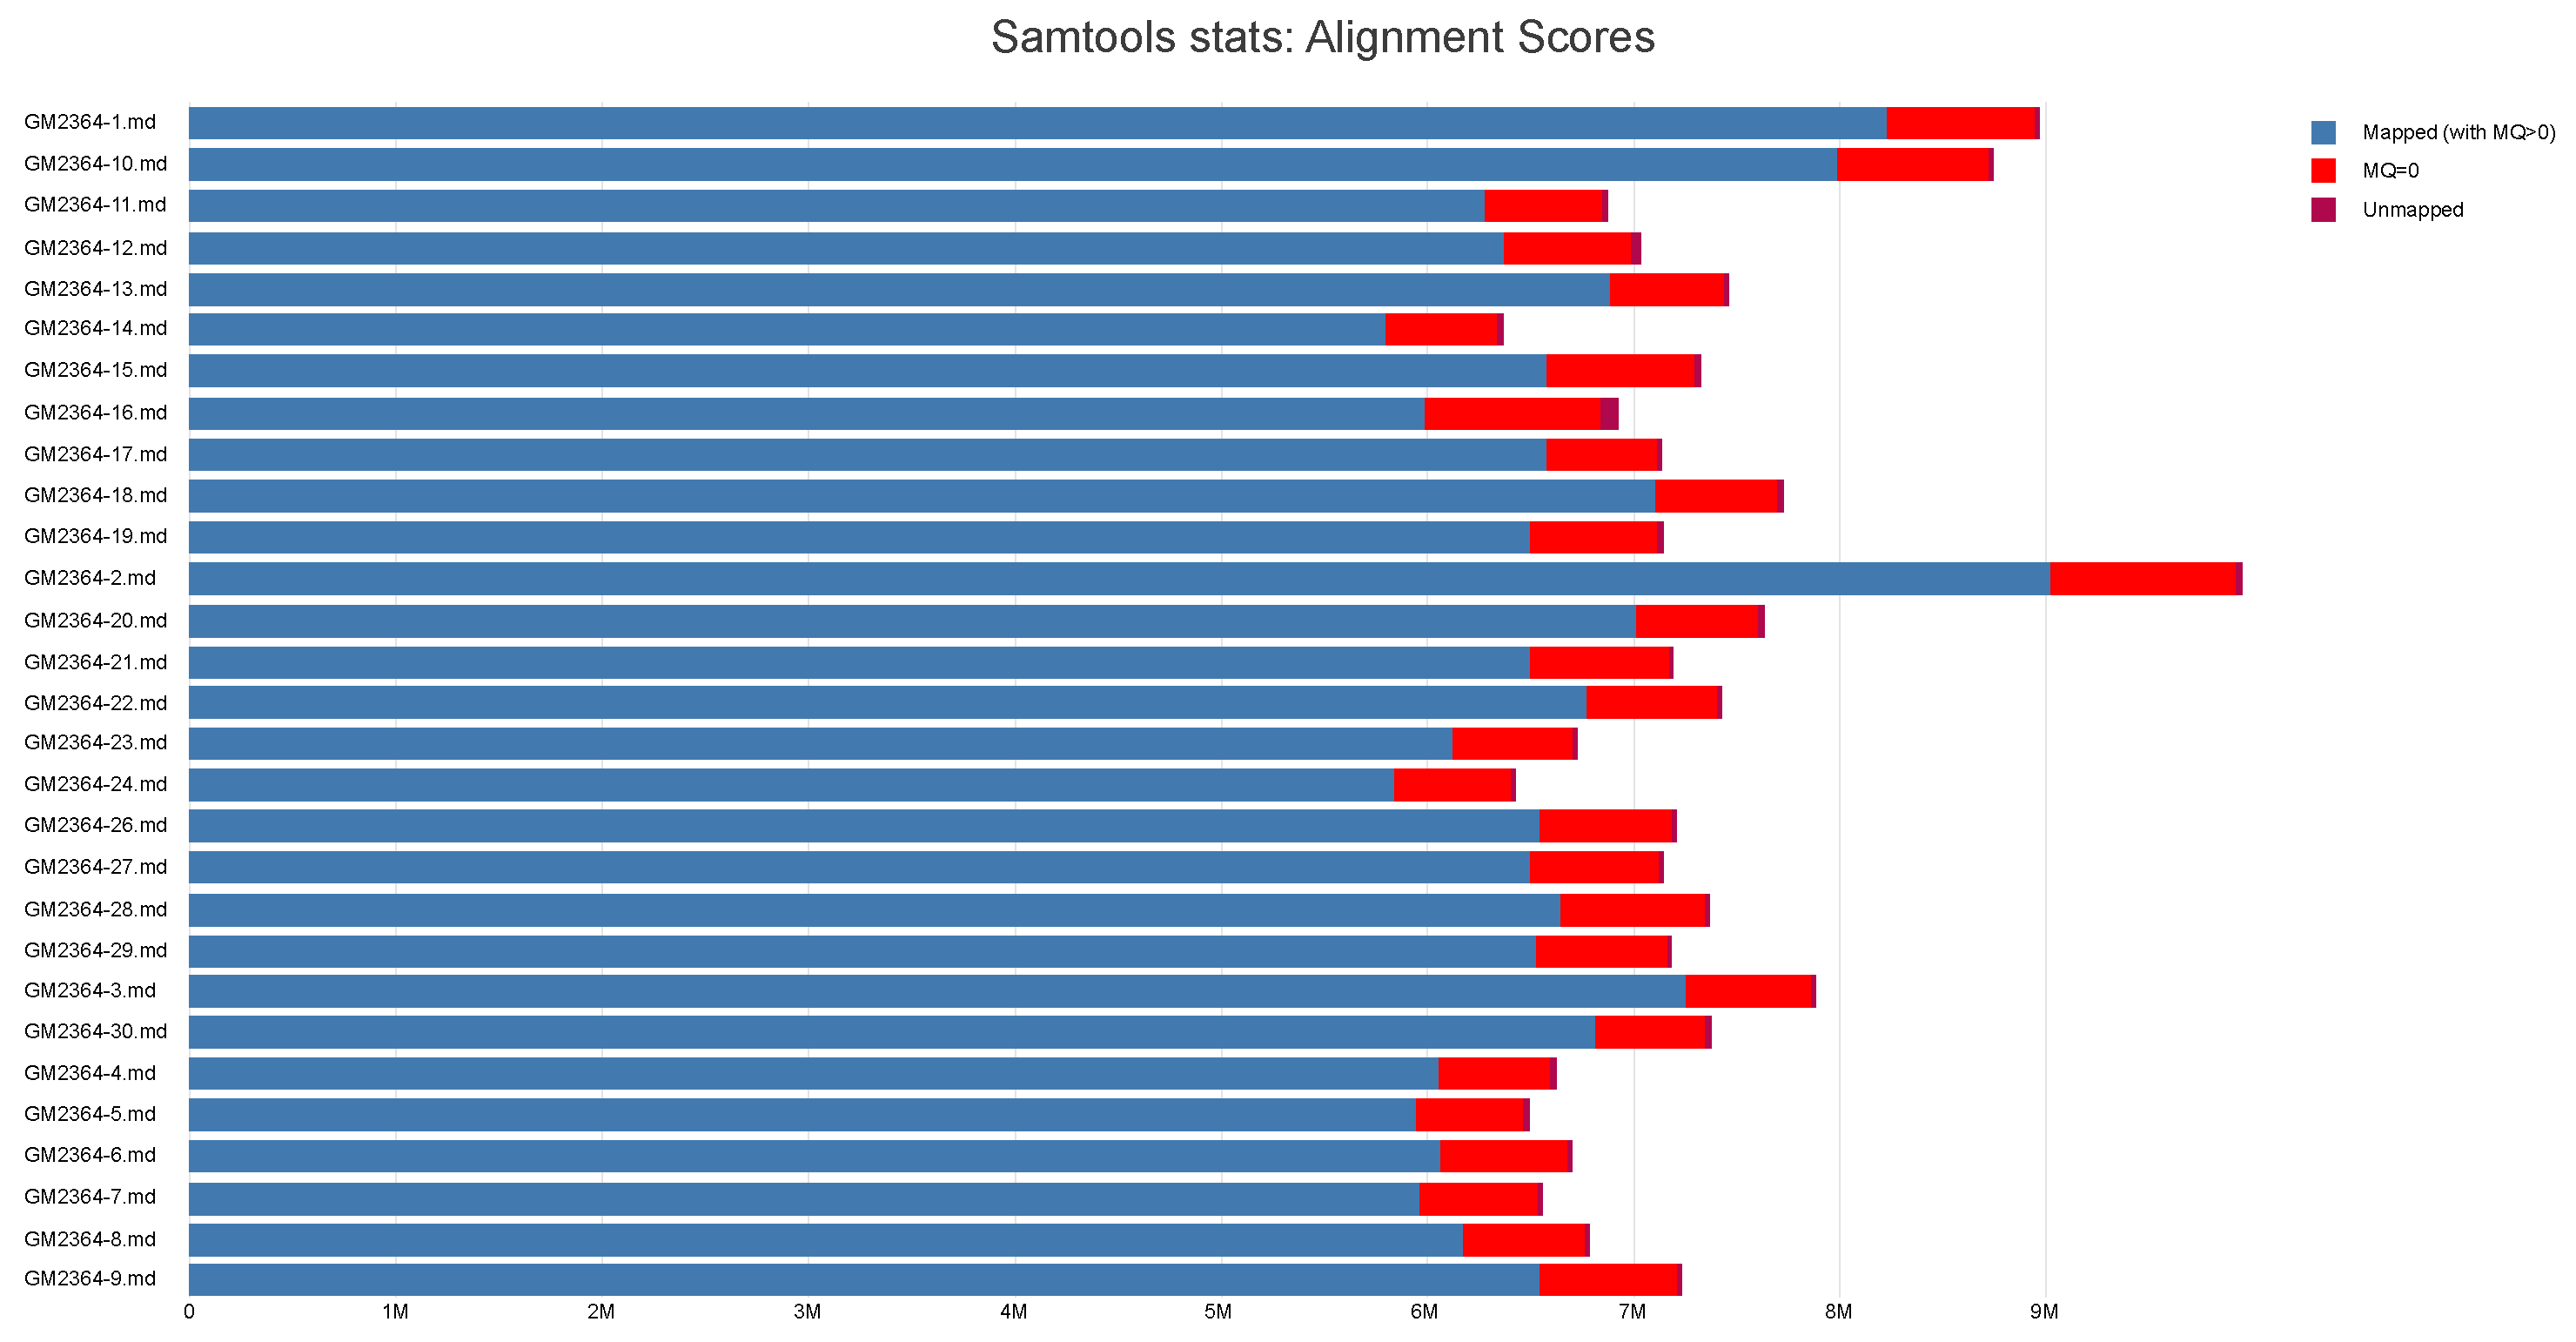
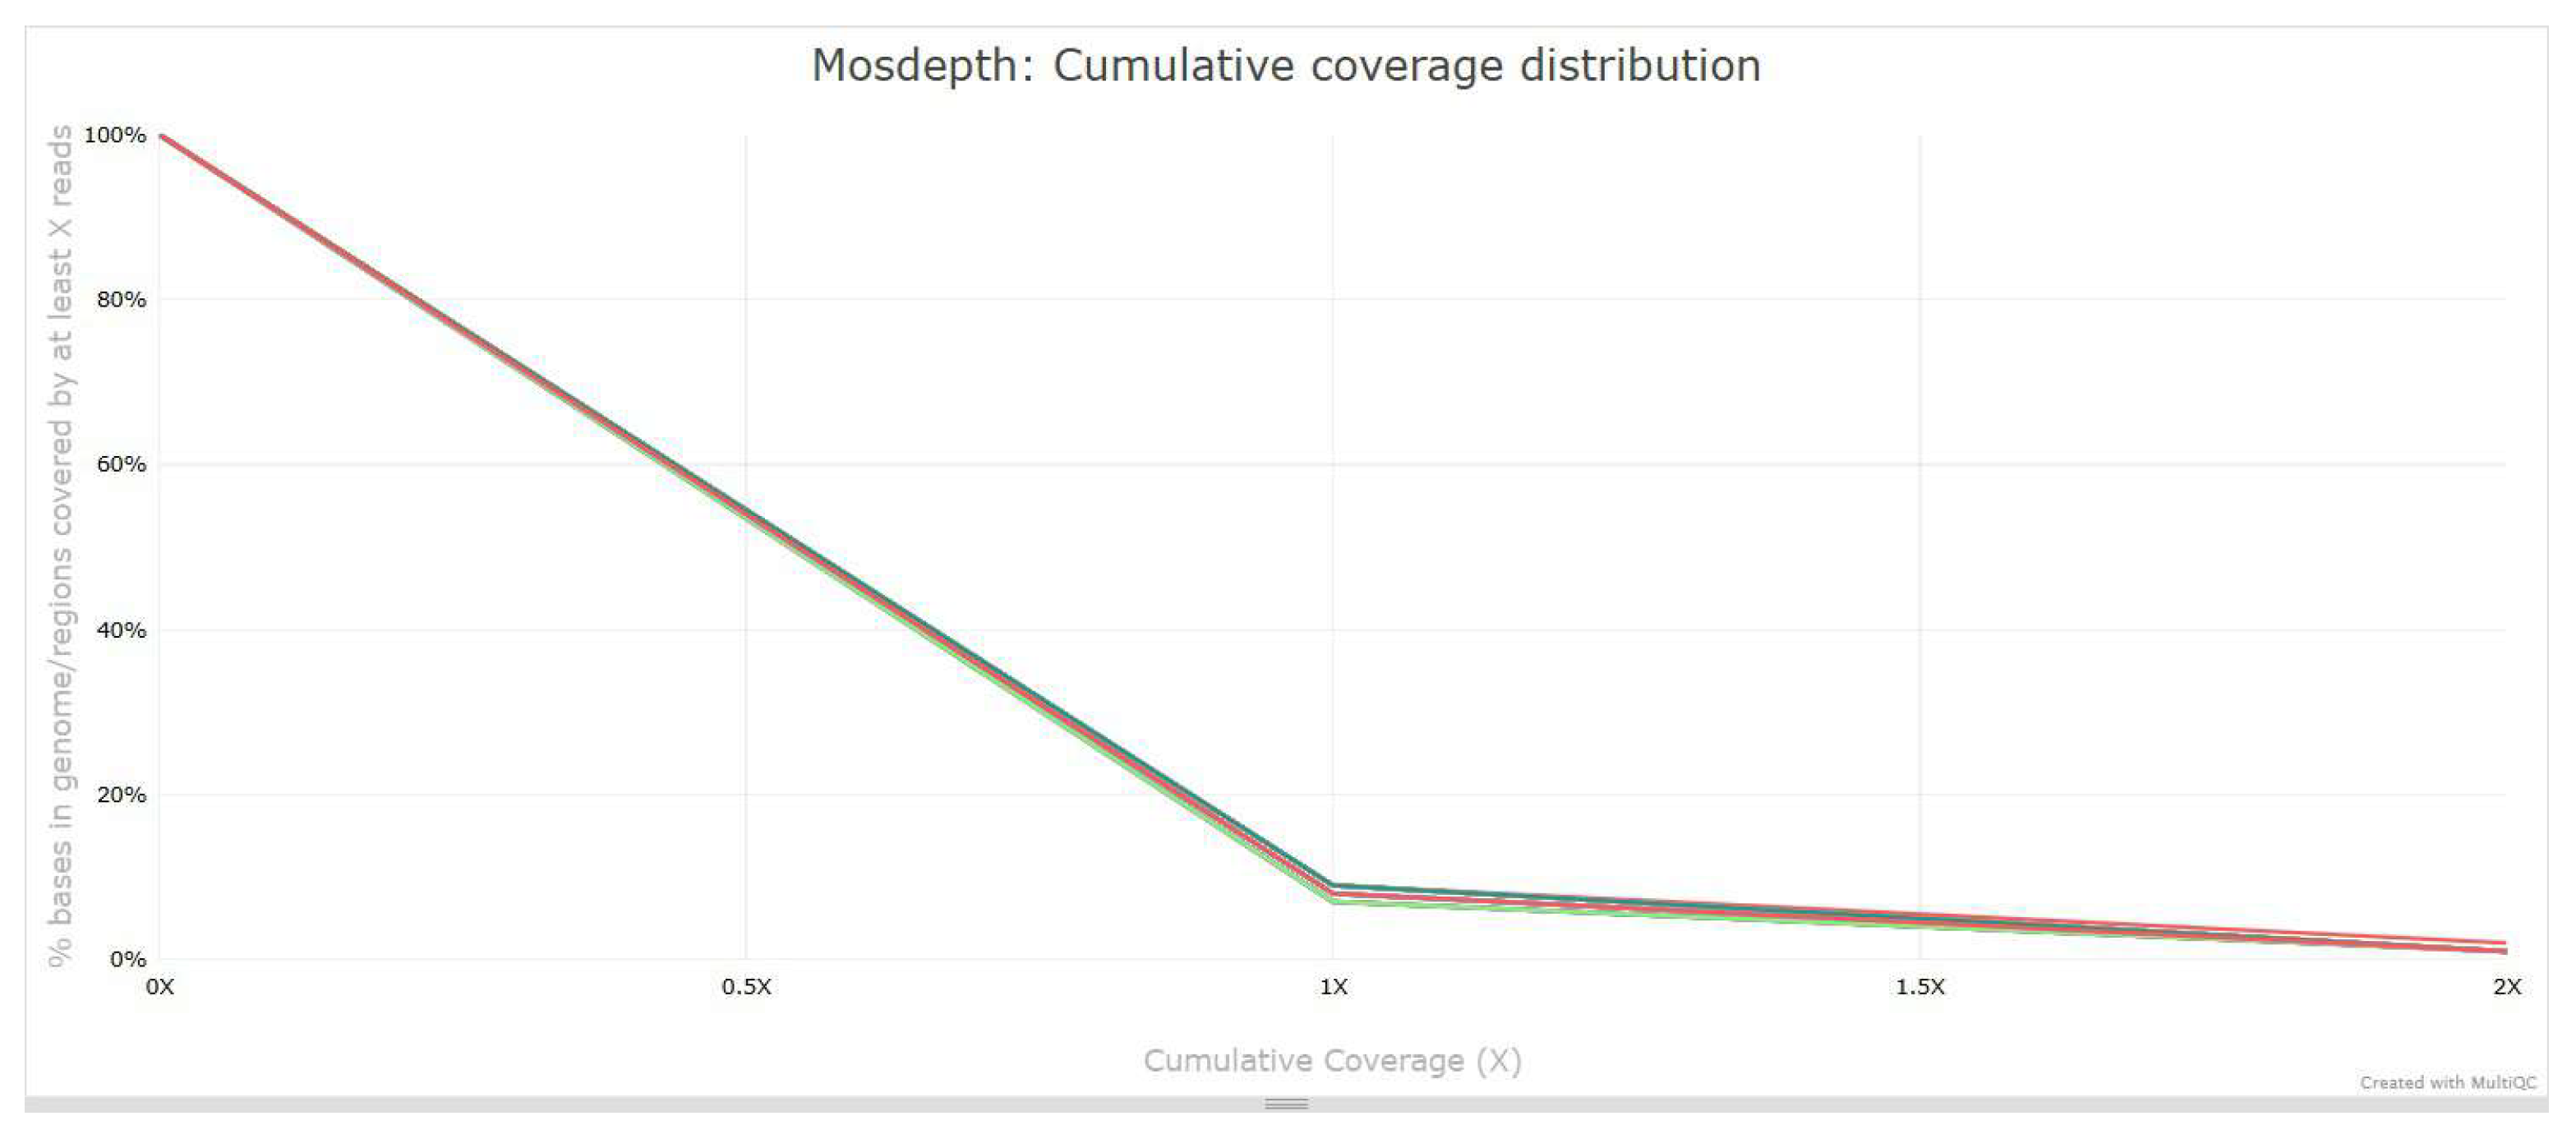
3.4. Alignment and Coverage Analysis

Reads were aligned to the Picual reference genome using BWA and SAMtools. Over 95% of reads mapped successfully across all samples. Coverage analysis using Mosdepth revealed that more than 80% of the genome had sequencing depth between 0 and 1×, indicating successful, albeit shallow, genome-wide coverage suitable for diversity studies.
In Figure 8, the bars labeled “Mapped (with MQ > 0)” represent reads that were correctly aligned to the reference genome with a mapping quality greater than zero. In contrast, the bars labeled “MQ = 0” indicate reads that were aligned with a mapping quality of zero, suggesting they may be incorrectly aligned or mapped to multiple locations in the reference genome.
Figure 9 illustrates the cumulative coverage distribution across all samples as calculated by Mosdepth. Each colored line in Figure 9 represents the cumulative genomic coverage of an individual sample. Colors are automatically assigned by Mosdepth/MultiQC and are used to distinguish the coverage profiles across the 30 DNA samples.

3.5. Duplicate Read Analysis

MarkDuplicates (GATK) revealed a high proportion of duplicate reads across most samples, with unique reads often below 20%. Despite this, a low percentage of unmapped reads was observed, suggesting overall alignment efficiency. However, the high duplication rates indicate potential bias introduced during library preparation and should be addressed in future sequencing workflows.

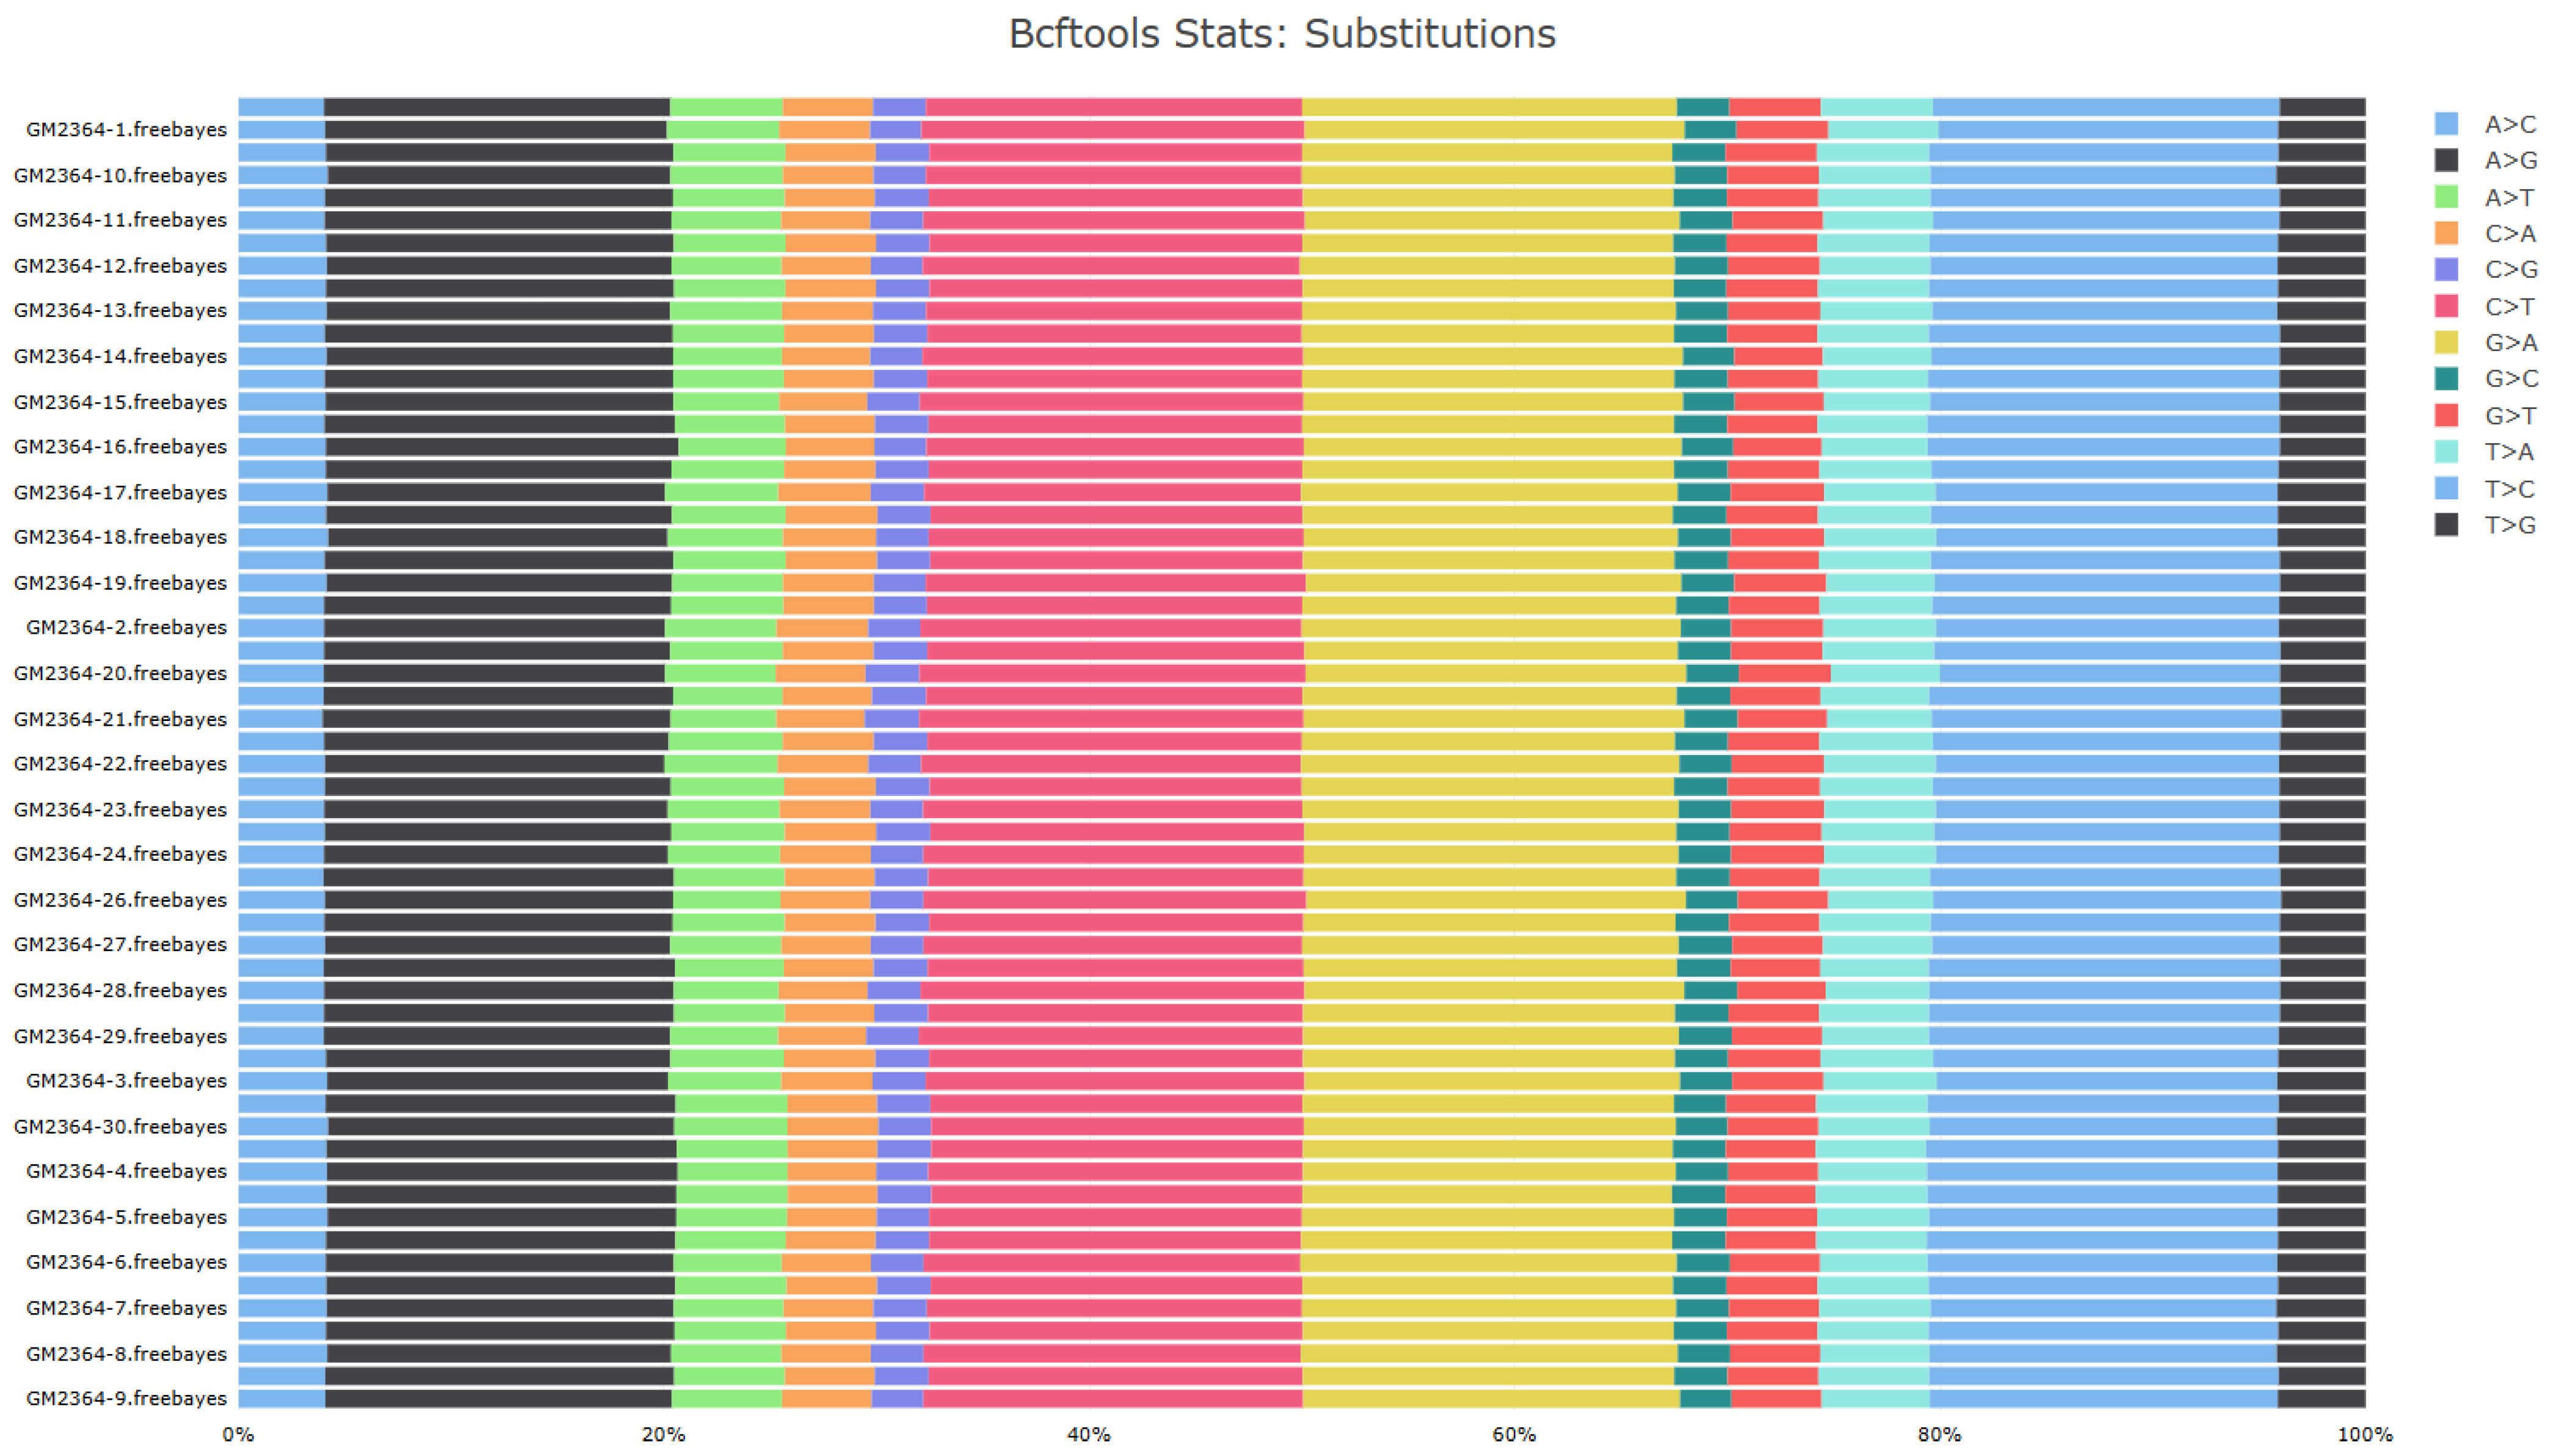
3.6. Genetic Variant Identification and Diversity Analysis

Variant calling using GATK HaplotypeCaller and FreeBayes detected substantial genetic variation among the cultivars. SNPs ranged from 882,702 (Arbequina) to 1,210,426 (Ascolana), with corresponding variation in haplotype counts and indels. The transition/transversion (Ts/Tv) ratio was consistently high (2.07–2.15), indicating high-quality variant calls. Figure 10 presents the distribution of substitution types per sample, highlighting the relative frequency of each base change as reported by bcftools.
Within-variety comparisons showed variability, with Frantoio GM2364-3 having higher SNP and indel counts than its replicates. Ascolana GM2364-4 displayed the highest overall SNPs and haplotypes, while Arbequina GM2364-21 had the highest Ts/Tv ratio (2.15).

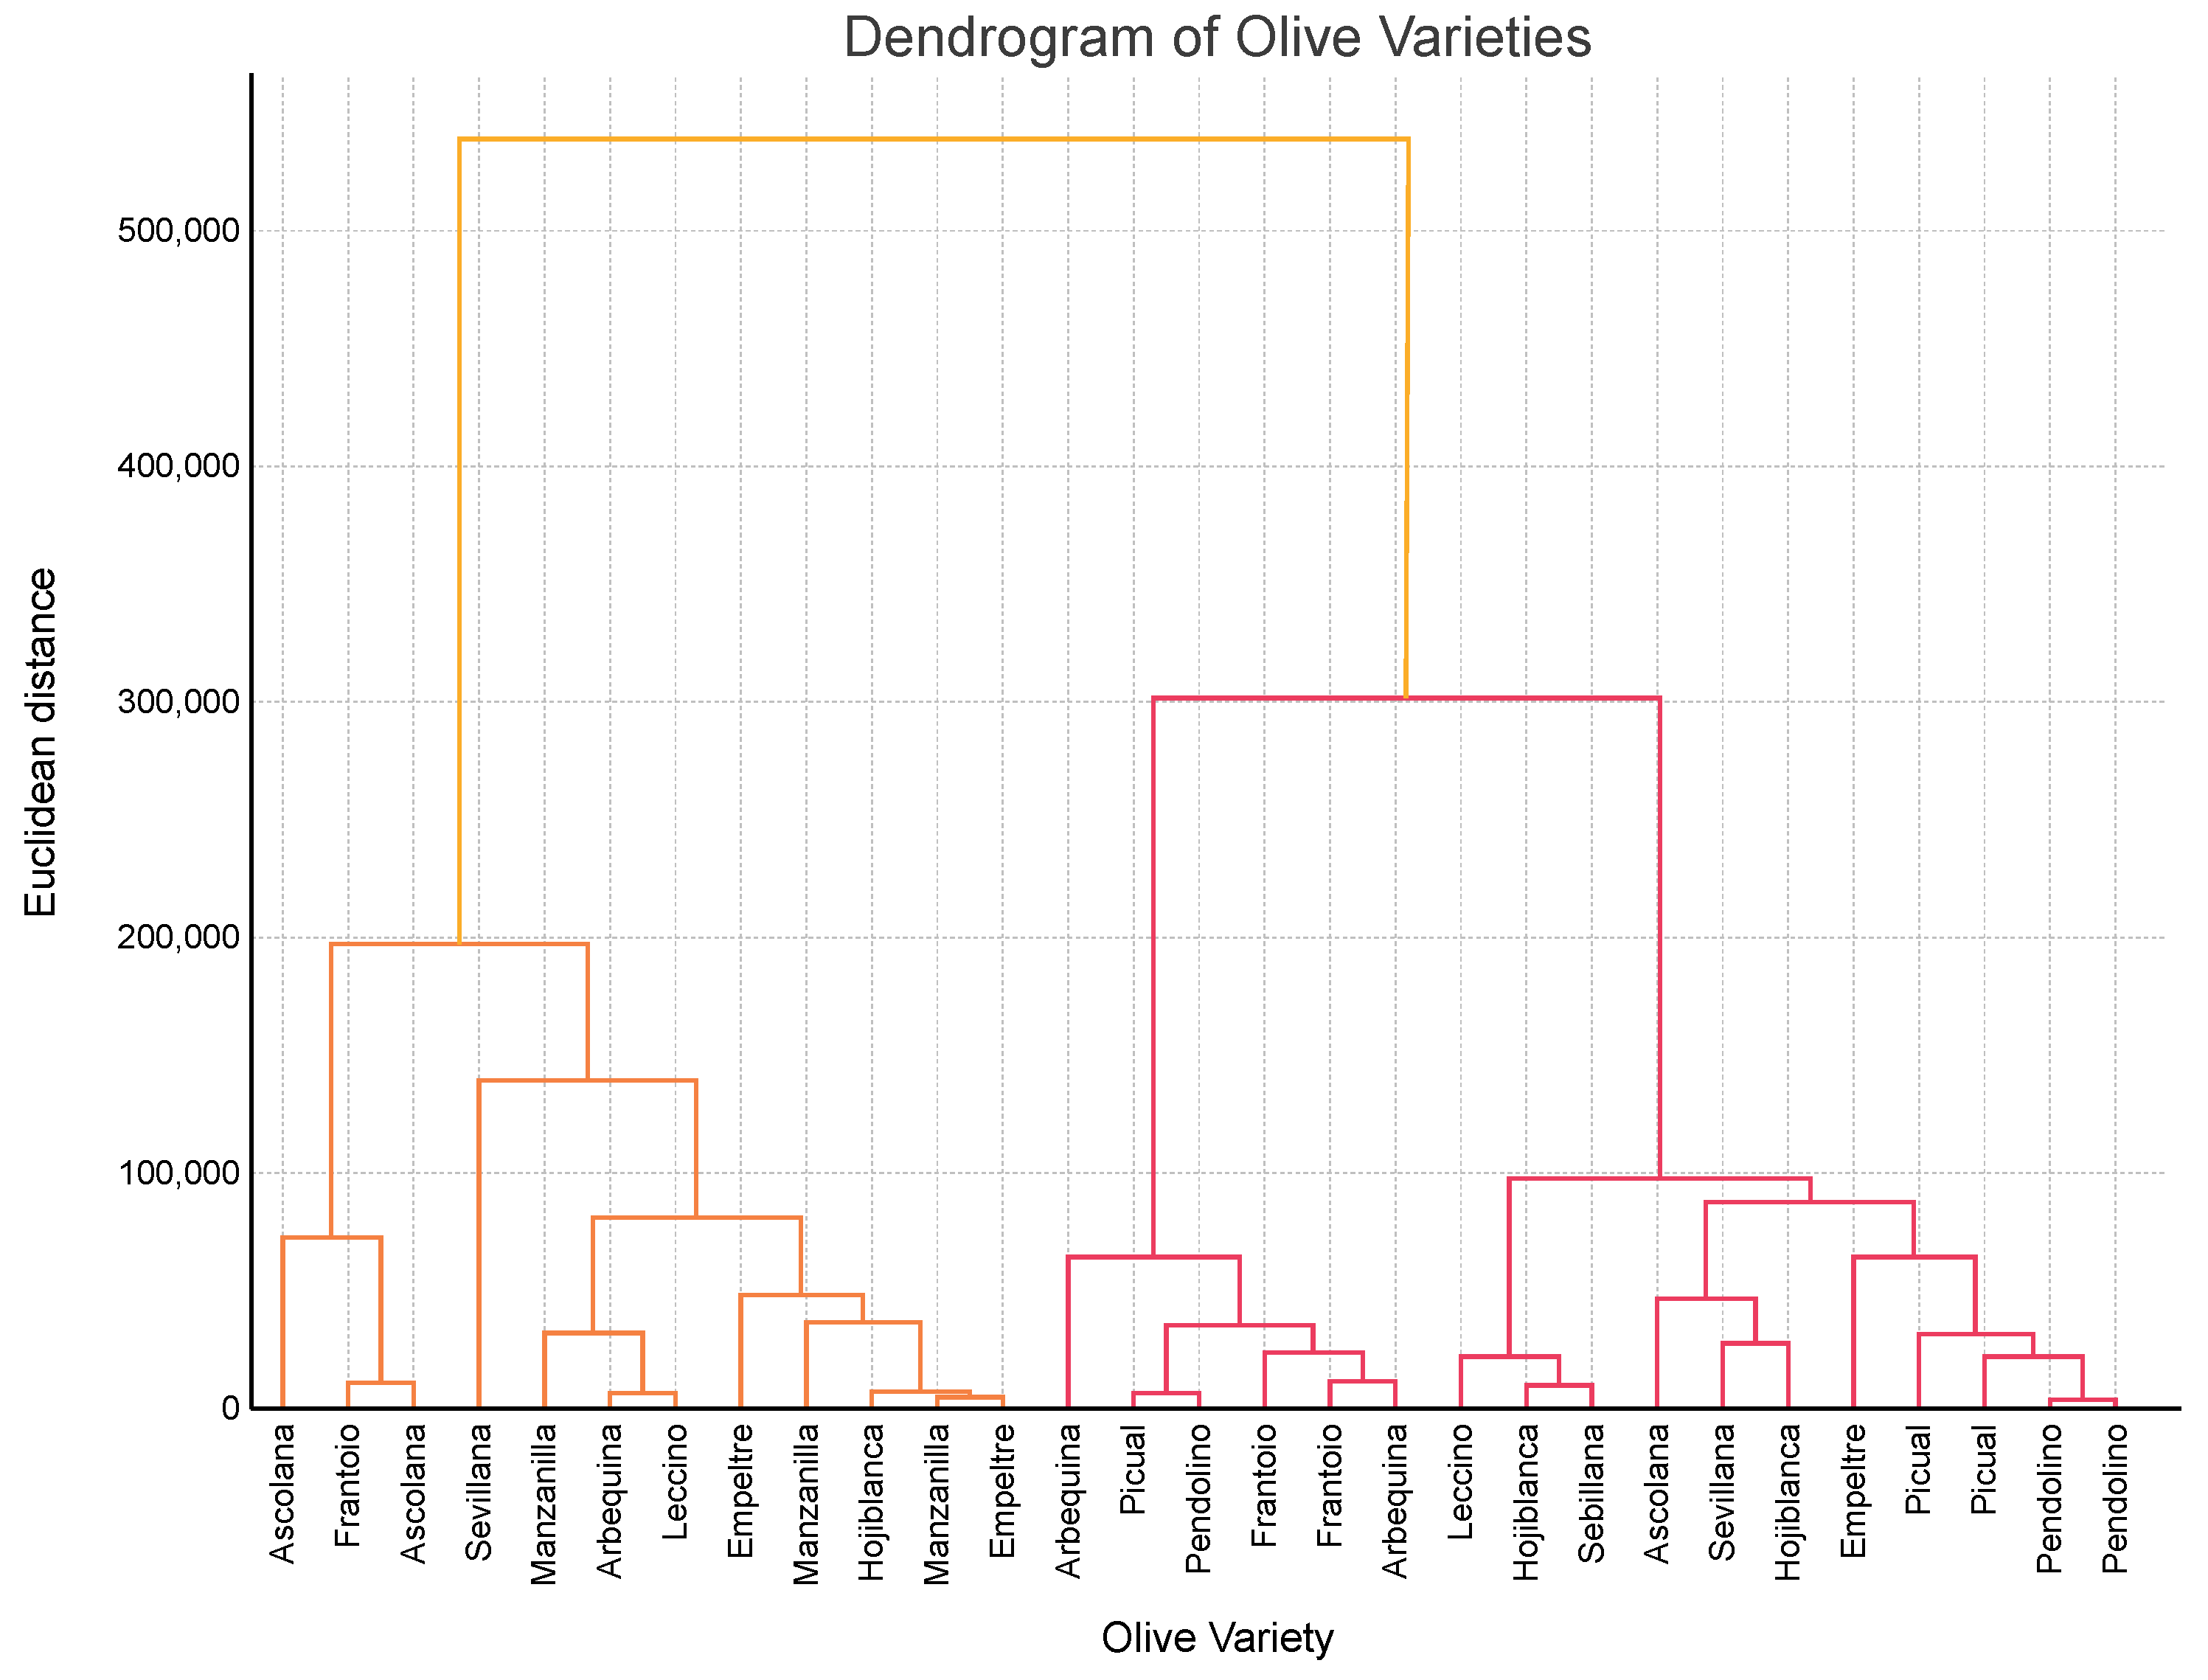
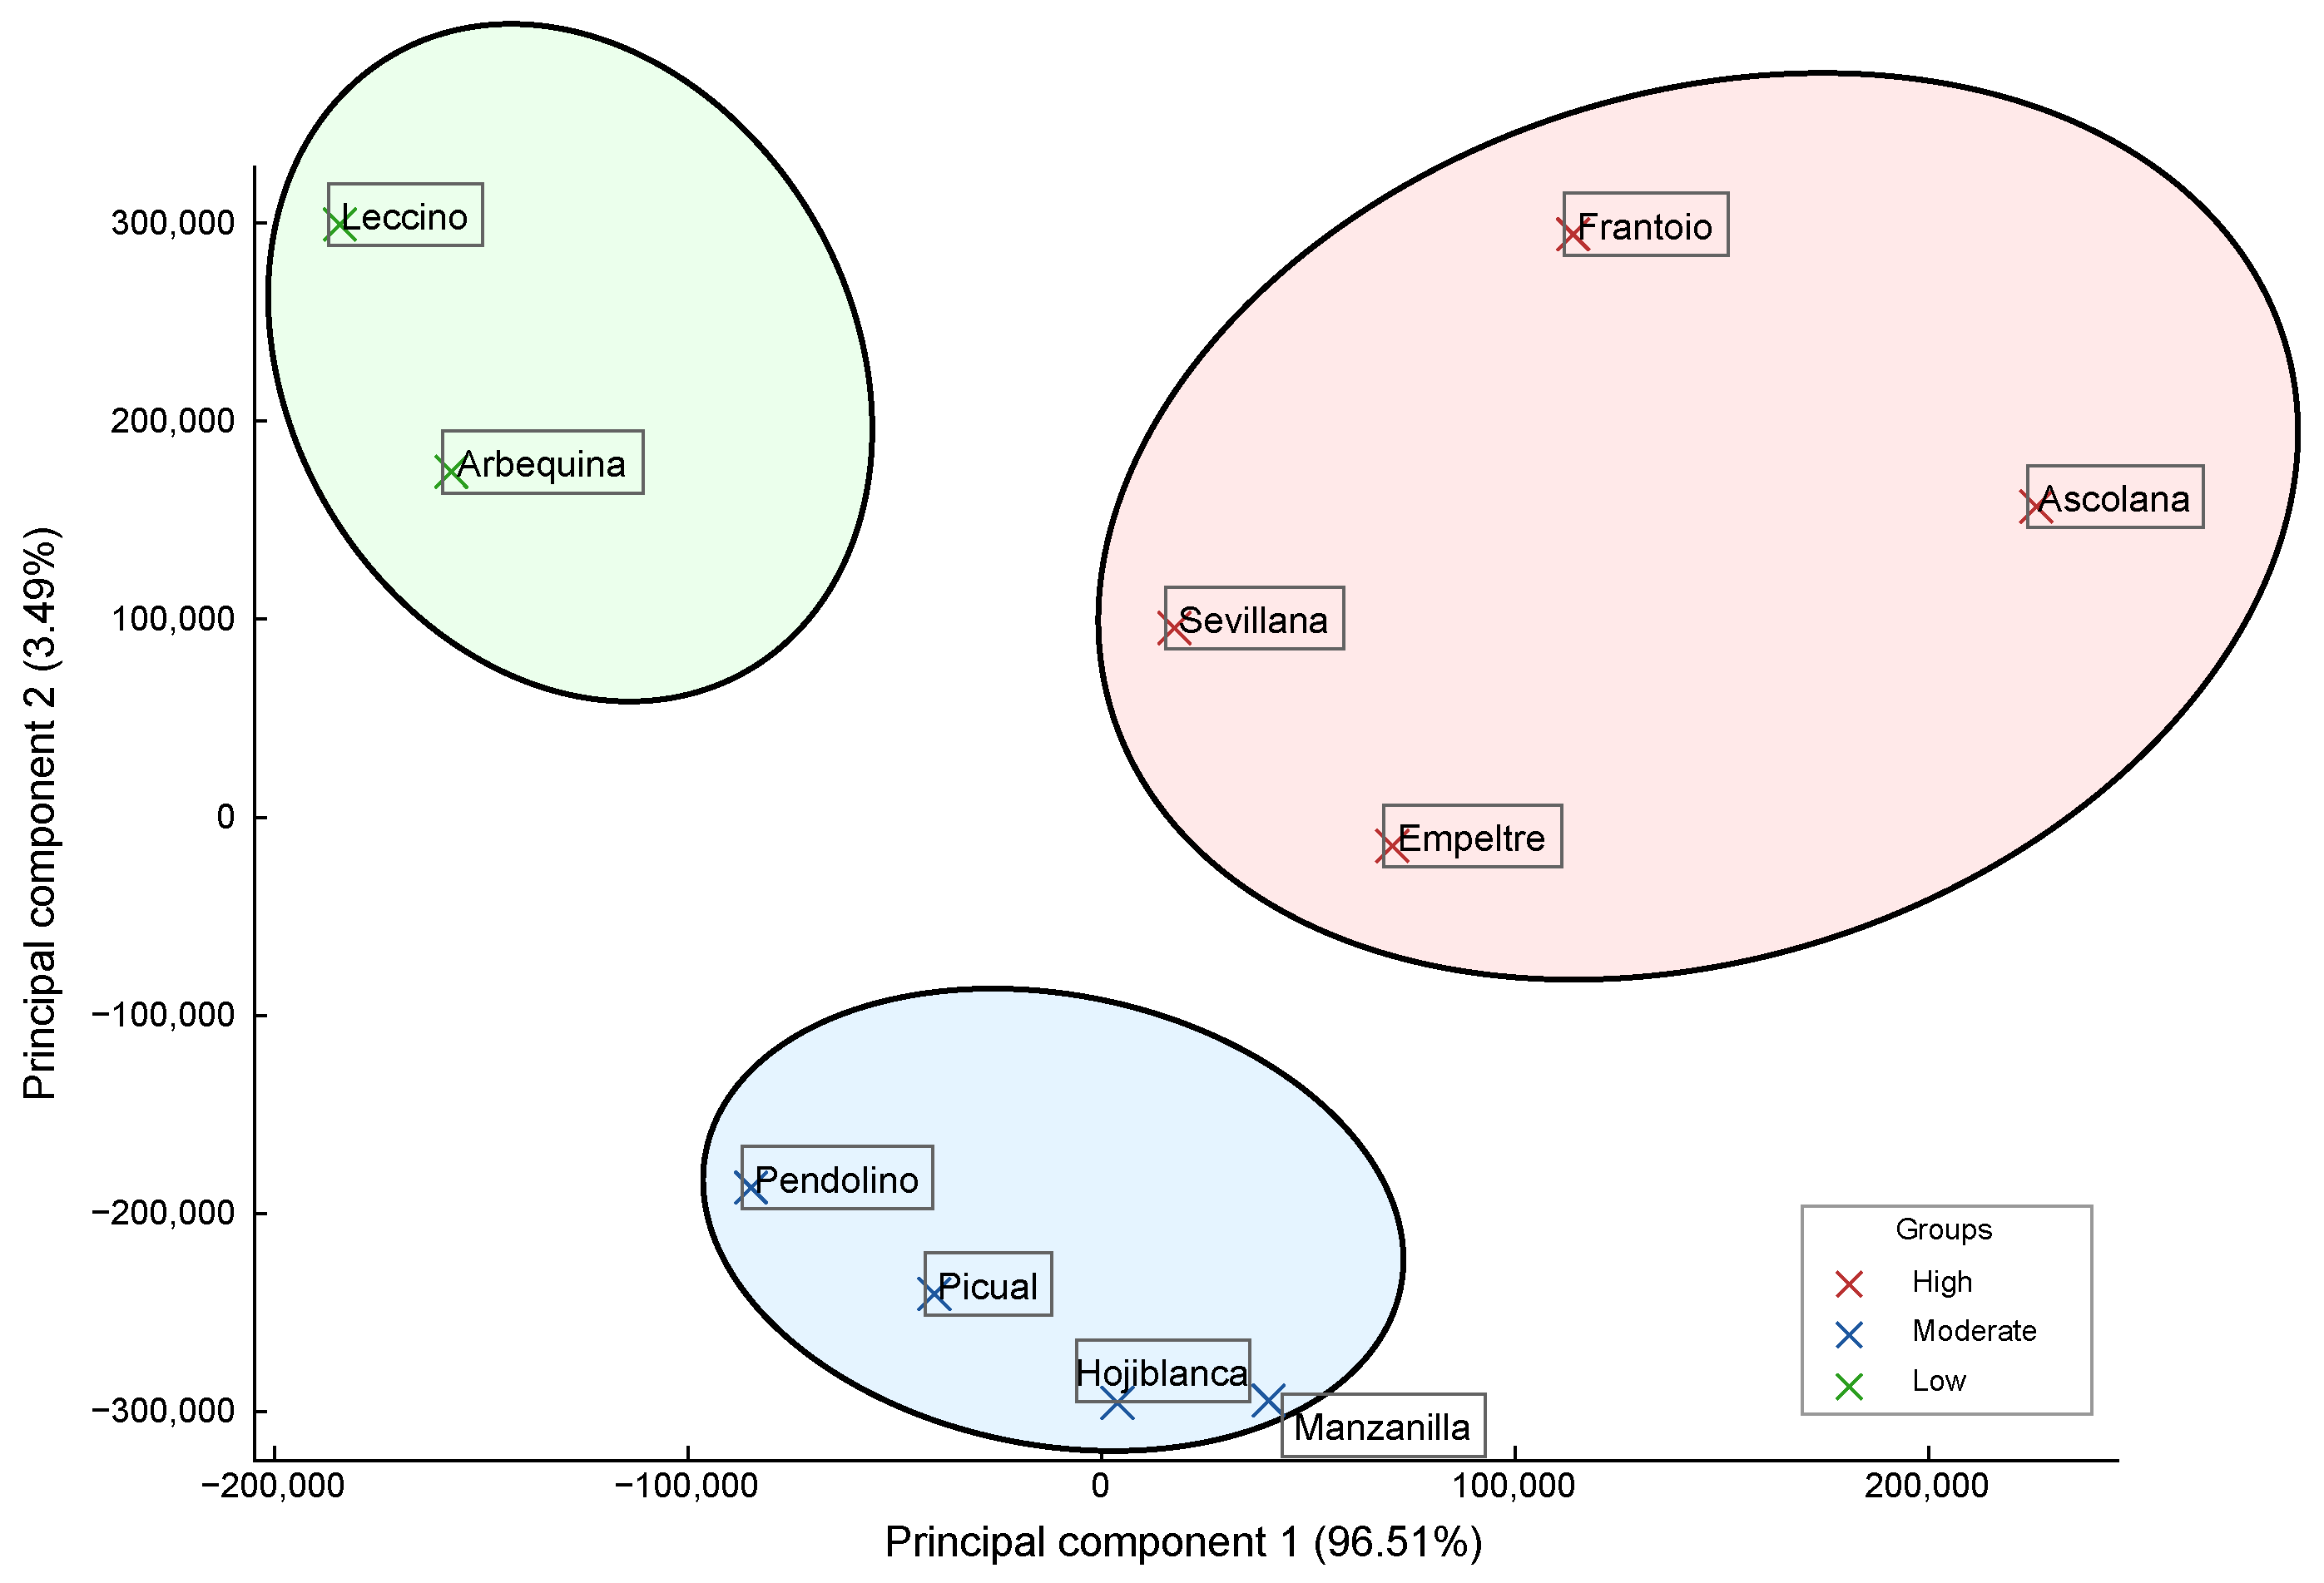
3.7. Clustering of Genetic Diversity

An SNP-based phylogenetic clustering grouped the cultivars into three categories:
  • Group 1—High Genetic Variability: Ascolana, Frantoio, Empeltre, and Sevillana, characterized by high SNPs, haplotypes, and indels.
  • Group 2—Moderate Genetic Variability: Manzanilla, Hojiblanca, Picual, and Pendolino, with intermediate genetic parameters.
  • Group 3—Low Genetic Variability: Arbequina and Leccino, showing lower SNP and indel counts.
These results provide a genomic framework for the conservation and selection of olive cultivars in southern Peru. Figure 11 shows the SNP-based dendrogram that visualizes the genetic distances and hierarchical clustering among the ten olive cultivars.
The principal component analysis (PCA) allowed the visualization of the genetic structure of the ten olive cultivars evaluated, based on SNP data. Figure 12 shows the two-dimensional projection of the first two principal components, which together explain 100% of the captured genetic variability (96.51% by PC1 and 3.49% by PC2).
Three well-defined genetic groups were identified. Group 1 (high genetic variability), shown in red, included Ascolana, Frantoio, Empeltre, and Sevillana, which were scattered along the PC1 axis, indicating a high degree of internal diversity. Group 2 (moderate genetic variability), in light blue, grouped Manzanilla, Hojiblanca, Pendolino, and Picual, with a more compact distribution in the lower area of the plot, suggesting intermediate diversity. Finally, Group 3 (low genetic variability), in green, included Arbequina and Leccino, which were located in the upper left quadrant, separate from the other groups and with low dispersion—consistent with the SNP-based analysis.
This PCA-based grouping aligns with the previous phylogenetic analysis and supports the classification of the cultivars into three levels of genetic variability. These results confirm that Ascolana and Frantoio exhibit greater genetic heterogeneity, while Arbequina and Leccino have a more uniform genetic background, likely due to intensive clonal propagation.
The results of this study, through the characterization of olive accessions using SNP markers, provide valuable information for multiple strategic applications. First, the identification of genetically diverse cultivars offers potential parent material for breeding programs focused on improving adaptation, productivity, or oil quality. Additionally, the molecular characterization supports both in situ and ex situ conservation strategies by facilitating the preservation of unique or regionally valuable germplasm. Finally, understanding the genetic structure of the cultivated varieties enables more informed decisions regarding the expansion of olive cultivation in Peru, promoting the selection of varieties suited to diverse agroecological zones and encouraging a more resilient and sustainable crop diversification.

4. Discussion

This study provides a comprehensive insight into the morphological diversity and genomic variation among ten economically important olive cultivars grown in southern Peru. By integrating phenotypic descriptors and genotyping-by-sequencing (GBS), we explored both the observable and genetic dimensions of variability, with implications for germplasm conservation, cultivar authentication, and breeding.
The morphological analysis confirmed varietal traits that align with previous characterizations of Mediterranean-origin cultivars. For example, the lanceolate leaf shapes in Hojiblanca, Frantoio, and Leccino and the elliptical fruits in Manzanilla and Arbequina agree with descriptors reported in earlier studies [15,25]. Additionally, distinctive endocarp traits, such as the high number of fibrovascular grooves in Ascolana and Sevillana, highlight their potential as morphological markers for cultivar discrimination.
The morphological variability observed among the cultivars may influence agronomic performance. High-vigor trees such as Frantoio and Hojiblanca tend to develop larger canopies that require more pruning but may offer higher yields under proper management. In contrast, low-vigor cultivars like Arbequina and Pendolino are better suited for high-density systems. Leaf shape may relate to water-use efficiency, with lanceolate leaves favoring adaptation to arid environments.
Fruit size and shape also impact oil yield and processing efficiency. Larger fruits generally contain more pulp, while elongated endocarps, like those in Empeltre, may hinder extraction.
Despite morphological similarities, genetic data revealed significant variation across cultivars. Ascolana, Frantoio, Empeltre, and Sevillana were found to harbor the highest levels of genomic diversity, as measured by SNPs, haplotypes, and indels. These findings are consistent with studies that have highlighted the high allelic richness of ancient Mediterranean cultivars, possibly resulting from millennia of selection and gene flow [5,26].
On the other hand, Arbequina and Leccino exhibited low genomic diversity and clustered into a distinct group, which may reflect the extensive use of clonal propagation in commercial orchards. This genetic uniformity has been reported previously and is associated with both advantages (e.g., phenotypic stability) and vulnerabilities (e.g., susceptibility to environmental stress) [27].
Interestingly, the phenotypic variation observed was not always predictive of genetic clustering. For instance, varieties like Manzanilla and Pendolino showed moderate morphological variability yet grouped closely with genetically uniform cultivars. This suggests that environmental adaptation and epigenetic regulation may influence morphological traits independently of underlying genomic divergence, a phenomenon also noted in olive cultivars from Spain and North Africa [28,29].
Although morphological and genetic data were analyzed separately, we recognize that this represents a methodological limitation of the current study. A combined statistical analysis could have provided additional insights into the concordance or divergence between phenotypic traits and genetic structure. Due to time and resource constraints, this integrative analysis was not performed. However, we consider it an important direction for future research aiming to achieve a more comprehensive understanding of olive cultivar diversity.
Most olive cultivars are propagated clonally through cuttings, leading to genetically homogeneous individuals within each variety. This may explain the low intra-varietal diversity observed in Arbequina and Leccino. Additionally, environmental conditions can induce phenotypic variation without genomic differences, highlighting the role of plasticity. Some cultivars may also share recent ancestry, resulting in subtle genomic differentiation that is difficult to detect, especially under shallow sequencing depth. These factors should be considered when interpreting the clustering patterns observed in our study.
The high Ts/Tv ratio (∼2.1) and mapping rate (>95%) across all samples support the quality and reliability of the GBS data. However, the high levels of duplicate reads—especially non-optical duplicates—signal the need for refinement in library preparation protocols to reduce PCR amplification bias.
The high duplication rate observed—particularly non-optical duplicates—may have reduced the effective coverage across the genome and impacted SNP discovery by inflating read counts for non-unique fragments. This could lead to underrepresentation of true variant calls, particularly in regions with low initial coverage. The duplication is likely due to over-amplification during the library preparation process, a common issue in low-input GBS protocols. Future studies may benefit from incorporating Unique Molecular Identifiers (UMIs) to distinguish true duplicates from PCR artifacts and improve variant calling accuracy. Additionally, optimizing library preparation protocols to reduce PCR cycles could help mitigate this effect.
The identification of genetically diverse cultivars such as Ascolana and Frantoio is particularly relevant for local breeding programs, as they offer a broader genetic base for selecting traits related to fruit quality, stress tolerance, and oil composition.
Cultivars exhibiting high genetic diversity, such as Ascolana and Frantoio, represent valuable resources for breeding programs in the region. Their variability increases the likelihood of identifying alleles associated with desirable agronomic traits, such as drought tolerance, disease resistance, or improved oil quality. Incorporating these cultivars as genetic base material in future crosses could enhance the resilience of new varieties adapted to the agroecological conditions of southern Peru.
In contrast, the low diversity observed in cultivars such as Arbequina and Leccino underscores the need to implement conservation strategies aimed at preventing genetic erosion. While these cultivars offer commercial advantages due to their phenotypic stability and suitability for intensive production systems, they may be more vulnerable to environmental changes or emerging pathogens. Therefore, both in situ and ex situ conservation measures, as well as ongoing genetic monitoring, are crucial to ensuring the long-term sustainability of olive cultivation in the region.
A limitation of this study was the relatively shallow sequencing depth (coverage mostly <1×), which may have restricted the detection of rare alleles and affected the accuracy of genotype calls in low-coverage regions. This coverage level was due to budget constraints and the selection of a GBS strategy aimed at broad genomic sampling across multiple cultivars at low cost. We acknowledge that this decision involves trade-offs, particularly in the sensitivity to detect low-frequency alleles. For future studies, we recommend implementing higher-depth resequencing strategies (ideally >10×), exploring complementary methods such as high-density GBS or capture-seq, and designing experiments with larger population sizes to improve genomic resolution and diversity estimates.
Our results are consistent with findings from Zhu et al. [30], who conducted a GBS-based diversity analysis on 57 olive cultivars from multiple countries. In both studies, phylogenetic and population structure analyses revealed the existence of major cultivar groupings that were not strictly associated with geographic origin. Notably, Zhu et al. reported that cultivars from Italy displayed higher genetic variability than those from Spain, a pattern echoed in our results, where Italian-origin cultivars such as Frantoio and Ascolana exhibited the highest SNP counts and haplotype diversity. Furthermore, both studies underscore the usefulness of GBS as a robust method for distinguishing cultivars and inferring genetic relationships even at shallow sequencing depth. However, while Zhu et al. achieved an average sequencing depth of ∼49× per SNP, our dataset was characterized by lower coverage (∼0–1×), highlighting the need for deeper sequencing in future efforts to capture rare alleles and improve variant calling precision.
Although our study did not calculate classical population genetic indices such as observed and expected heterozygosity or FST, the levels of genetic variability inferred from SNP counts and haplotype diversity align with those reported in GBS-based studies of Mediterranean olives. Future research will incorporate these population-level metrics to enable more direct comparisons with germplasm from other olive-growing regions.

5. Conclusions

This study demonstrates the utility of combining morphological descriptors and genotyping-by-sequencing (GBS) to assess genetic diversity in olive cultivars from southern Peru. High intra- and inter-varietal variability was detected, with Ascolana and Frantoio showing the greatest genomic diversity. Arbequina and Leccino presented lower diversity, reflecting potential clonal bottlenecks. Phylogenetic clustering revealed genetic relationships not evident from morphological traits alone. GBS proved effective for SNP discovery in complex genomes. The results provide a genomic baseline for breeding and conservation. This work supports strategic decision-making in olive germplasm management.

Author Contributions

Conceptualization, M.E.C.G.; methodology, M.E.C.G., J.C.C. and E.V.B.J.; software, E.V.B.J.; validation, M.E.C.G. and E.V.B.J.; formal Analysis, M.E.C.G. and E.V.B.J.; investigation, J.L.H.C. and J.I.C.R.; resources, M.E.C.G.; data curation, E.V.B.J.; writing—original draft preparation, R.A.B.; writing—review and editing, R.A.B.; visualization, R.A.B.; supervision, M.E.C.G.; project administration, M.E.C.G.; funding acquisition, M.E.C.G. All authors have read and agreed to the published version of the manuscript.

Funding

This research was funded by the Universidad Nacional Jorge Basadre Grohmann through Canon, Sobrecanon and Mining Royalties Funds, under Rectoral Resolution No. 10979-2023-UNJBG dated 8 February 2023. The APC was funded by the same institution.

Institutional Review Board Statement

The study was conducted in accordance and approved by the Institutional Review Board (or Ethics Committee) of Universidad Nacional Jorge Basadre Grohmann, Tacna, Perú (protocol code 2023-029-CEIUNJBG).

Data Availability Statement

The raw data supporting the conclusions of this article will be made available by the authors on request.

Conflicts of Interest

The authors declare no conflicts of interest.

References

  1. Breton, C.; Guerin, J.; Ducatillion, C.; Médail, F.; Kull, C.A.; Bervillé, A. Taming the Wild and ‘Wilding’ the Tame: Tree Breeding and Dispersal in Australia and the Mediterranean. Plant Sci. 2008, 175, 197–205. [Google Scholar] [CrossRef]
  2. Laval, H.; Leveau, P.; Marinval, P.; Medus, J. L’olivier et sa culture en Provence. Donnees historiques, palynologiques et carpologiques [archéobotanique]. Ecol. Mediterr. 1990, 16, 427–435. [Google Scholar]
  3. Leveau, P.; Heinz, C.; Laval, H.; Marinval, P.; Medus, J. Les origines de l’oléiculture en Gaule du Sud. Revue d’Archéométrie 1991, 15, 83–94. [Google Scholar] [CrossRef]
  4. Diez, C.M.; Trujillo, I.; Martinez-Urdiroz, N.; Barranco, D.; Rallo, L.; Marfil, P.; Gaut, B.S. Olive Domestication and Diversification in the Mediterranean Basin. New Phytol. 2015, 206, 436–447. [Google Scholar] [CrossRef]
  5. Besnard, G.; Khadari, B.; Navascués, M.; Fernández-Mazuecos, M.; El Bakkali, A.; Arrigo, N.; Baali-Cherif, D.; Brunini-Bronzini de Caraffa, V.; Santoni, S.; Vargas, P.; et al. The Complex History of the Olive Tree: From Late Quaternary Diversification of Mediterranean Lineages to Primary Domestication in the Northern Levant. Proc. R. Soc. B 2013, 280, 20122833. [Google Scholar] [CrossRef]
  6. Turcato, A.; Mattar, S. Olive oils from South America. In Olive Oil Sensory Science; Willett, W., Ed.; Wiley: Hoboken, NJ, USA, 2014; pp. 337–357. [Google Scholar]
  7. León, L.; Casanova, D.; Palma, J.; González, J. Caracterización agromorfológica de plantas madre del banco de germoplasma de “olivo” Olea europaea (Oleaceae) en la región Tacna. Arnaldoa 2021, 28, 593–612. [Google Scholar]
  8. Morgil, H.; Gercek, Y.C.; Tulum, I. Single Nucleotide Polymorphisms (SNPs) in Plant Genetics and Breeding. In The Recent Topics in Genetic Polymorphisms; InTech: London, UK, 2020; p. 53. [Google Scholar]
  9. Elshire, R.J.; Glaubitz, J.C.; Sun, Q.; Poland, J.A.; Kawamoto, K.; Buckler, E.S.; Mitchell, S.E. A Robust, Simple Genotyping-by-Sequencing (GBS) Approach for High Diversity Species. PLoS ONE 2011, 6, e19379. [Google Scholar] [CrossRef]
  10. Cruz, F.; Julca, I.; Gómez-Garrido, J.; Loska, D.; Marcet-Houben, M.; Cano, E.; Galán, B.; Frias, L.; Ribeca, P.; Derdak, S.; et al. Genome Sequence of the Olive Tree, Olea europaea. Gigascience 2016, 5, 29. [Google Scholar] [CrossRef]
  11. Gómez-Gálvez, F.J.; Ninot, A.; Rodríguez, J.C.; Compañ, S.P.; Andreva, J.U.; Rubio, J.A.G.; Aragón, I.P.; Viñuales-Andreu, J.; Casanova-Gascón, J.; Šatović, Z.; et al. New Insights in the Spanish Gene Pool of Olive (Olea europaea L.) Preserved Ex Situ and In Situ Based on High-Throughput Molecular Markers. Front. Plant Sci. 2023, 14, 1267601. [Google Scholar] [CrossRef]
  12. Unver, T.; Wu, Z.; Sterck, L.; Turktas, M.; Lohaus, R.; Li, Z.; Yang, M.; He, L.; Deng, T.; Escalante, F.J.; et al. Genome of Wild Olive and the Evolution of Oil Biosynthesis. Proc. Natl. Acad. Sci. USA 2017, 114, E9413–E9422. [Google Scholar] [CrossRef]
  13. Besnard, G.; Hernández, P.; Khadari, B.; Dorado, G.; Savolainen, V. Genomic Profiling of Plastid DNA Variation in the Mediterranean Olive Tree. BMC Plant Biol. 2011, 11, 80. [Google Scholar] [CrossRef] [PubMed]
  14. Ministerio de Agricultura. Aceituna: Un Campo fértil Para Sus Inversiones y el Desarrollo de Sus Exportaciones; Gobierno del Perú: Lima, Peru, 2020. Available online: https://www.midagri.gob.pe/portal/download/pdf/herramientas/cendoc/manuales-boletines/aceituna/aceituna_feb11.pdf (accessed on 10 January 2025).
  15. International Union for the Protection of New Varieties of Plants. Olive UPOV Code: OLEAA_EUR Olea europaea L. Guidelines for the Conduct of Tests for Distinctness, Uniformity and Stability. 2011. Available online: https://www.upov.int/edocs/tgdocs/en/tg099.pdf (accessed on 23 September 2024).
  16. Nolan, K.A.; Callahan, J.E. Beachcomber Biology: The Shannon-Weiner Species Diversity Index. Proc. Workshop ABLE 2006, 27, 334–338. [Google Scholar]
  17. Andrews, S. FastQC: A Quality Control Tool for High Throughput Sequence Data. 2010. Available online: https://www.scienceopen.com/book?vid=45ad53d9-9259-4c9a-b773-54a1bd5f0287 (accessed on 12 September 2024).
  18. Chen, S.; Zhou, Y.; Chen, Y.; Gu, J. fastp: An Ultra-fast All-in-one FASTQ Preprocessor. Bioinformatics 2018, 34, i884–i890. [Google Scholar] [CrossRef]
  19. Li, H.; Durbin, R. Fast and Accurate Short Read Alignment with Burrows–Wheeler Transform. Bioinformatics 2009, 25, 1754–1760. [Google Scholar] [CrossRef]
  20. Danecek, P.; Bonfield, J.K.; Liddle, J.; Marshall, J.; Ohan, V.; Pollard, M.O.; Whitwham, A.; Keane, T.; McCarthy, S.A.; Davies, R.M.; et al. Twelve Years of SAMtools and BCFtools. Gigascience 2021, 10, giab008. [Google Scholar] [CrossRef]
  21. McKenna, A.; Hanna, M.; Banks, E.; Sivachenko, A.; Cibulskis, K.; Kernytsky, A.; Garimella, K.; Altshuler, D.; Gabriel, S.; Daly, M.; et al. The Genome Analysis Toolkit: A MapReduce Framework for Analyzing Next-Generation DNA Sequencing Data. Genome Res. 2010, 20, 1297–1303. [Google Scholar] [CrossRef]
  22. Garrison, E.; Marth, G. Haplotype-based Variant Detection from Short-read Sequencing. arXiv 2012, arXiv:1207.3907. [Google Scholar]
  23. Pedersen, B.S.; Quinlan, A.R. Mosdepth: Quick Coverage Calculation for Genomes and Exomes. Bioinformatics 2018, 34, 867–868. [Google Scholar] [CrossRef]
  24. Danecek, P.; Auton, A.; Abecasis, G.; Albers, C.A.; Banks, E.; DePristo, M.A.; Handsaker, R.E.; Lunter, G.; Marth, G.T.; Sherry, S.T.; et al. The Variant Call Format and VCFtools. Bioinformatics 2011, 27, 2156–2158. [Google Scholar] [CrossRef]
  25. Bartolini, G.; Prevost, G.; Messeri, C.; Carignani, G. Olive Germplasm: Cultivars and World-Wide Collections; FAO Library: Rome, Italy, 1998; 459p. [Google Scholar]
  26. Trujillo, I.; Ojeda, M.A.; Urdiroz, N.M.; Potter, D.; Barranco, D.; Rallo, L.; Diez, C.M. Identification of the Worldwide Olive Germplasm Bank of Córdoba (Spain) Using SSR and Morphological Markers. Tree Genet. Genomes 2014, 10, 141–155. [Google Scholar] [CrossRef]
  27. Belaj, A.; Muñoz-Díez, C.; Baldoni, L.; Satovic, Z.; Barranco, D. Genetic Diversity and Relationships of Wild and Cultivated Olives at Regional Level in Spain. Sci. Hortic. 2010, 124, 323–330. [Google Scholar] [CrossRef]
  28. Baldoni, L.; Cultrera, N.G.; Mariotti, R.; Ricciolini, C.; Arcioni, S.; Vendramin, G.G.; Buonamici, A.; Porceddu, A.; Sarri, V.; Ojeda, M.A.; et al. A Consensus List of Microsatellite Markers for Olive Genotyping. Mol. Breed. 2009, 24, 213–231. [Google Scholar] [CrossRef]
  29. Besnard, G.; Terral, J.-F.; Cornille, A. On the Origins and Domestication of the Olive: A Review and Perspectives. Ann. Bot. 2018, 121, 587–603. [Google Scholar] [CrossRef]
  30. Zhu, S.; Niu, E.; Shi, A.; Mou, B. Genetic Diversity Analysis of Olive Germplasm (Olea europaea L.) with Genotyping-by-Sequencing Technology. Front. Genet. 2019, 10, 755. [Google Scholar] [CrossRef]
Figure 1. Leaf traits.
Agriculture 15 01237 g001
Figure 2. Fruit traits.
Agriculture 15 01237 g002
Figure 3. Endocarp traits.
Agriculture 15 01237 g003
Figure 4. Photograph showing the sprout and young leaves of olive tree used for the extraction of DNA.
Agriculture 15 01237 g004
Figure 5. Representative phenotypes of the ten olive cultivars evaluated in this study, showing typical leaf, fruit, and endocarp morphology for each variety.
Agriculture 15 01237 g005
Figure 6. Comparison of three modifications of the 6h-DNA protocol for genomic DNA extraction from olive using agarose gel electrophoresis.
Agriculture 15 01237 g006
Figure 7. DNA extraction using the 6h-DNA protocol in 10 olive varieties.
Agriculture 15 01237 g007
Figure 8. Reads of alignment statistics. Proportion of mapped, mismapped, and unmapped reads per sample.
Agriculture 15 01237 g008
Figure 9. Cumulative distribution of genomic coverage in different samples using mosdepth.
Agriculture 15 01237 g009
Figure 10. Distribution of gene substitutions per sample: bcftools statistics.
Agriculture 15 01237 g010
Figure 11. Snp-based differences according to distances.
Agriculture 15 01237 g011
Figure 12. Principal component analysis (pca) of olive varieties according to genetic variability groups.
Agriculture 15 01237 g012
Table 1. Qualitative characterization of 10 varieties of olive tree through the use of characters in tree, leaf, and fruit.
VarietyVigorGrowth HabitCanopy DensityLeaf ShapeLengthWidthLongitudinal
Curvature
of the Leaf
WeightFruit ShapeDegree of
Symmetry
(Position A)
Diameter
Transverse
Maximum
(Position B)
ApexBaseNipplePresence
of
Lenticels
Size
of
Lenticels
Maturing
Color
1Ascolana teneralowopenmiddlelanceolatelargemiddleepinasticvery elevatedovoidslightly asymm.centeredpointedtruncatedabsentabundantlargeviolet
2Arbequinalowopenmiddleellipticshortmiddleepinasticlowsphericalsymmetricbaseredoundedtruncatedabsentsparsesmallblack
3Pendolinolowopenmiddleelliptic lanceolatemiddlenarrowflatmiddleovoidslightly asymm.centeredredoundedtruncatedabsentabundantsmallblack
4Frantoiohighopenmiddleelliptic lanceolatemiddlemiddleepinasticmiddleovoidslightly asymm.apexredoundedredoundedabsentabundantsmallviolet
5Leccinohighopenmiddleelliptic lanceolatemiddlemiddleflatmiddleovoidslightly asymm.centeredredoundedtruncatedabsentabundantsmallblack
6Picualmiddleopendenseelliptic lanceolatemiddlemiddlehyponasticmiddleovoidasymm.centeredroundedtruncatedabsentabundantsmallblack
7Empeltremiddleuprightdenseelliptic lanceolatemiddlemiddleflatmiddleelongatedslightly asymm.centeredroundedtruncatedabsentabundantsmallblack
8Sevillanahighopendenselanceolatelargemiddleflatvery highovoidasymm.centeredpointedtruncatedabsentabundantsmallblack
9Manzanillamiddleopenmiddleellipticmiddlemiddleflatraisedsphericalsymmetriccenteredroundedtruncatedabsentabundantsmallblack
10Hojiblancahighuprightmiddlelanceolatelargemiddleflatraisedovoidsymm.centeredroundedtruncatedabsentabundantsmallviolet
Table 2. Characterization of 10 olive varieties through endocarp characteristics.
Commercial UseVarietyShapeSymmetry (A and B)Position Max.
Transverse Diameter
ApexBaseSurfaceFibrovascular
Grooves
Apex
Termination
TableAscolana teneraellipticalslightly asymmetricalcenteredpointedpointedscabroushighwith mucro
OilArbequinaovoidalsymmetricalcenteredroundedroundedroughmediumwith mucro
Pendolinoellipticalsymmetricaltowards the apexroundedroundedsmoothmediumwith mucro
Frantoioellipticalsymmetricalcenteredroundedroundedsmoothlowwith mucro
Leccinoellipticalasymmetriccenteredroundedroundedroughhighwith mucro
Picualellipticalasymmetriccenteredpointedroundedscabrousmediumwith mucro
Double aptitude
(table and oil)
Empeltreelongatedasymmetrictowards the apexpointedpointedroughhighwith mucro
Sevillanaellipticalasymmetrictowards the basepointedtruncatedroughhighwith mucro
Manzanillaovoidalslightly asymmetricaltowards the apexroundedpointedroughmediumwith mucro
Hojiblancaellipticalslightly asymmetricalcenteredroundedroundedroughmediumwith mucro
Table 3. Quantitative characterization of the endocarp (stone).
Commercial DestinationVarietiesWeight (g)Length (mm)Diameter (mm)Number of
Fibrovascular Grooves
TableAscolana tenera3.0118.168.5114
OilArbequina0.3610.927.2510
Pendolino0.4814.597.5110
Frantoio0.4614.427.316
Leccino0.7918.107.2211
Picual2.9818.017.2310
Double option
(table and oil)
Empeltre0.8420.928.7112
Sevillana0.9518.938.3114
Manzanilla0.5513.857.5510
Hojiblanca0.6615.327.369
Table 4. Shannon–Weaver index of morphological characteristics in olive cultivation.
Morphological CharacteristicsCharacteristic to Be EvaluatedNumber of ParametersShannon Index
Endocarp (Stone)Weight42.13
Shape42.30
Degree of symmetry32.23
Transverse diameter32.28
Apex22.27
Base32.29
Surface32.26
Furrows32.28
Furrow distribution22.27
Apex termination22.27
FruitWeight42.18
Shape32.30
Degree of symmetry32.23
Maximum transverse diameter32.28
Apex22.27
Base22.27
Nipple32.30
Color32.15
LeafLength32.28
Width32.29
Shape32.29
Body curvature42.26
TreeVigor32.22
Growth habit22.25
Canopy density32.28
Table 5. Shannon–Weaver index in 10 olive varieties.
Number of Mother PlantsVariety StudiedPiPi×log2Pi
12Ascolana Ternera0.1304−0.2657
08Arbequina0.0870−0.2124
10Pendolino0.1087−0.2412
08Frantoio0.0870−0.2124
05Leccino0.0543−0.1583
06Picual0.0652−0.1780
13Empeltre0.1413−0.2765
15Sevillana0.1630−0.2957
10Manzanilla0.1087−0.2412
05Hojiblanca0.0543−0.1583
Shannon index2.239705132
Table 6. Determination of discriminant analysis (Wilks’ lambda) in morphological traits of olive cultivation.
Morphological TraitsCharacteristic to EvaluateNumber of ParametersDiscriminating Power
Endocarp (Stone)Weight40.08
Shape40.01
Degree of Symmetry30.06
Transverse Diameter30.08
Apex20.09
Base30.05
Surface30.08
Grooves30.06
Groove Distribution20.03
Apex Termination20.02
FruitWeight40.07
Shape40.09
Degree of Symmetry30.33
Maximum Transverse Diameter30.35
Apex20.06
Base20.16
Nipple30.09
Color30.78
LeafLength30.06
Width30.05
Shape30.09
Limb Curvature40.13
TreeVigor30.21
Growth Habit20.38
Canopy Density30.24
Table 7. Analysis of variance equality.
Plant PartCommercial PurposeEvaluation MethodTest Statisticp-Value
EndocarpOilMultiple Comparisons0.793
Levene0.060.831
Dual PurposeMultiple Comparisons0.912
Levene0.110.941
TableMultiple Comparisons0.995
Levene0.081.000
FruitOilMultiple Comparisons0.891
Levene0.310.733
Dual PurposeMultiple Comparisons1.000
Levene0.061.000
TableMultiple Comparisons0.996
Levene0.141.000
LeafOilMultiple Comparisons0.869
Levene0.070.992
Dual PurposeMultiple Comparisons1.000
Levene0.031.000
TableMultiple Comparisons0.998
Levene0.011.000
Table 8. DNA quantification of the three modifications of the 6h-DNA protocol.
SampleDNA Concentration (ng/µL)
P1_0121.4
P1_0238.2
P2_0116.8
P2_022.24
P3_014.14
P3_021.72
Table 9. Olive varieties and weight used for DNA extraction, using protocol No1, 6h-DNA.
Sample CodeOlive VarietySample Weight (mg)
OL31Frantoio_P1103
OL32Frantoio_P2120
OL33Frantoio_P3126
OL34Ascolana_P1114
OL62Ascolana_P289
OL36Ascolana_P3124
OL37Manzanilla_P1118
OL38Manzanilla_P2122
OL39Manzanilla_P3123
OL40Hoji Blanca_P1123
OL41Hoji Blanca_P2123
OL61Hoji Blanca_P395
OL43Sevillana_P1119
OL44Sevillana_P2118
OL45Sevillana_P3112
OL46Picual_P1100
OL47Picual_P290
OL48Picual_P392
OL49Empeltre_P192
OL50Empeltre_P292
OL51Empeltre_P3100
OL52Arbequina_P191
OL53Arbequina_P293
OL54Arbequina_P394
OL55Leccino_P196
OL56Leccino_P296
OL57Leccino_P391
OL58Pendolino_P195
OL59Pendolino_P292
OL60Pendolino_P398
Table 10. DNA concentration obtained in 10 olive varieties.
SourceVarietySampleAbsorbance
A260
DNA
Concentration
(ng/µL)
Los PalosFrantoioOL3125.5511277.5
Los PalosFrantoioOL329.758487.9
Los PalosFrantoioOL339.973498.6
MagolloAscolana teneraOL3425.4311271.6
MagolloAscolana teneraOL6213.735686.7
MagolloAscolana teneraOL3613.981699.1
La YaradaManzanillaOL3711.725586.3
La YaradaManzanillaOL3828.7891439.5
La YaradaManzanillaOL3917.207860.4
La YaradaHojiblancaOL4019.003950.2
La YaradaHojiblancaOL4121.7341086.7
La YaradaHojiblancaOL619.77488.5
Sama Las YarasSevillanaOL4325.5761278.8
Sama Las YarasSevillanaOL4417.626881.3
Sama Las YarasSevillanaOL4523.3451167.3
UNJBG-TACNAPicualOL465.202260.1
UNJBG-TACNAPicualOL475.015250.8
UNJBG-TACNAPicualOL481.83891.9
Para GrandeEmpeltreOL496.501325.1
Para GrandeEmpeltreOL505.171258.5
Para GrandeEmpeltreOL515.742287.1
Los PalosArbequinaOL525.241262.1
Los PalosArbequinaOL536.798339.9
Los PalosArbequinaOL544.708235.4
Los PalosLeccinoOL556.777338.9
Los PalosLeccinoOL566.51325.5
Los PalosLeccinoOL576.705335.3
InclánPendolinoOL587.602380.1
InclánPendolinoOL594.433221.7
InclánPendolinoOL608.96448
MagolloAscolanaOL3546.6622333.1
La YaradaHojiblancaOL4215.654782.7
Disclaimer/Publisher’s Note: The statements, opinions and data contained in all publications are solely those of the individual author(s) and contributor(s) and not of MDPI and/or the editor(s). MDPI and/or the editor(s) disclaim responsibility for any injury to people or property resulting from any ideas, methods, instructions or products referred to in the content.

