Article

Spider Web DNA Metabarcoding Provides Improved Insight into the Prey Capture Ability of the Web-Building Spider Tetragnatha keyserlingi Simon (Araneae: Tetragnathidae)

1
Key Laboratory of Southwest China Wildlife Resources Conservation (Ministry of Education), China West Normal University, Nanchong 637009, China
2
Sichuan Wildlife Rehabilitation and Breeding Research Center, Institute of Ecology, China West Normal University, Nanchong 637009, China
3
State Key Laboratory of Biocatalysis and Enzyme Engineering, Hubei University, Wuhan 430062, China
4
Centre for Behavioral Ecology and Evolution, School of Life Sciences, Hubei University, Wuhan 430062, China
*
Authors to whom correspondence should be addressed.
These authors contributed equally to this work.
Agriculture 2025, 15(12), 1235; https://doi.org/10.3390/agriculture15121235
Submission received: 28 April 2025 / Revised: 4 June 2025 / Accepted: 5 June 2025 / Published: 6 June 2025
(This article belongs to the Special Issue Advances in Biological Pest Control in Agroecosystems)

Abstract

:
Spiders play a crucial role as predators in terrestrial ecosystems, particularly in controlling insect populations. Tetragnatha keyserlingi Simon (Araneae: Tetragnathidae) is a dominant species in rice field ecosystems, where it builds webs amidst rice clusters to capture prey. Despite its known predation on major rice pests like rice planthoppers, comprehensive field reports on its prey composition are scarce. Herein, we performed a field investigation to explore the population dynamic relationships between T. keyserlingi and major rice pests. Additionally, we employed DNA metabarcoding to analyze the prey spectrum of this spider from both the spider’s opisthosoma and its web. The results showed that the population dynamics of T. keyserlingi and Nilaparvata lugens (Stål) displayed synchrony. Dietary DNA metabarcoding analysis revealed that, compared with the opisthosoma, DNA extracted from spider webs exhibited a higher abundance of prey reads and yielded a higher diversity of identified prey species. Phytophagous pests were the dominant prey group identified in both sample types. In web samples, the most abundant prey reads were from Chironomidae, followed by Delphacidae, Ceratopogonidae, Aleyrodidae, Muscidae, Coenagrionidae, and other prey families. Notably, Delphacidae constituted the predominant prey reads identified from the spider’s opisthosoma, and the corresponding positive rate for Delphacidae was 86.7%. These results indicate that the web of T. keyserlingi can capture a diverse range of prey in rice fields. Among the prey captured by the spider web, rice planthoppers appear to be a primary dietary component of T. keyserlingi, emphasizing its potential as a biocontrol agent for rice planthoppers in integrated pest management strategies. Leveraging spider web DNA metabarcoding enhances our understanding of T. keyserlingi’s prey capture ability, as the residual prey DNA in webs provides critical insights into the foraging dynamics and ecological interactions of web-building spiders.

1. Introduction

Predators play a crucial role as biological control agents in agricultural ecosystems [1]. As the predominant invertebrate predators in terrestrial ecosystems [2], spiders play a vital role in the natural regulation of pest populations [3]. Recent advancements in molecular techniques, especially DNA metabarcoding, have facilitated comprehensive identification of spider dietary composition, revealing their predation on key crop pests such as planthoppers, whiteflies, inchworms, and leafhoppers [4,5,6,7]. To date, a total of 51,939 spider species have been described worldwide [8], and abundant spider species have been recorded in agroecosystems [9,10,11]. Therefore, assessing the pest control potential of spiders is essential to promote their use in biological control programs. The prey capture ability represents one of the key metrics for evaluating the efficacy of spiders in pest control within agricultural systems, primarily encompassing predation rates, predation quantities, and prey compositions of spider species [6]. Although predation metrics have often been assessed through laboratory feeding trials, there are still many aspects of spider (particularly web-building spiders) trophic interactions and trophic ecology that remain unknown under field conditions.
Tetragnatha keyserlingi Simon (Araneae: Tetragnathidae) is a dominant species in rice field ecosystems, characterized by its slender body, elongated legs, and chelicerae, often crafting webs amidst rice clusters to capture prey (Figure S1a) [12,13]. Its distribution spans Central America, the Caribbean, Brazil, Africa, Asia, New Hebrides, and Polynesia [8]. Among these distribution regions, Asia is the main region for rice cultivation and consumption [14]. Therefore, it is important to evaluate the potential of T. keyserlingi to control rice pests. Wang et al. used quantitative PCR (qPCR) to detect the predation patterns of several dominant spider species, including T. keyserlingi, on rice planthoppers (including Laodelphax striatellus (Fallén), Nilaparvata lugens (Stål), and Sogatella furcifera (Horváth)) based on prey-specific primers [4,15]. Their results showed that field-collected T. keyserlingi indeed preyed upon these three planthopper species, with positive rates exhibiting a positive correlation with planthopper population density. However, although previous studies have shown that T. keyserlingi preys on several major rice pests, such as rice planthoppers, its prey composition has seldom been reported under field conditions. The analysis of the prey composition of this spider has important implications for elucidating its prey capture efficacy and potential role in biological control [16,17,18].
Most spiders feed by extracting liquefied tissue from prey [19], making morphological gut content analysis difficult. The traditional diet analysis method for web-building spiders involves direct observation and prey identification based on remnants found on the web [20]. However, these approaches face challenges in accurately identifying prey species due to the absence of crucial taxonomic features in prey remains, rendering identifications only feasible at a broad taxonomic level [21]. Therefore, the observation and identification of prey remains on webs is effective only for freshly captured prey, as most prey left within the web are incomplete remnants after spider consumption, making species identification challenging. Additionally, prey entirely consumed or discarded by the spider evade observation, potentially underestimating spider prey capture capabilities when relying solely on web inspection.
To overcome these limitations, DNA metabarcoding has emerged as a powerful tool for studying the prey composition of spiders [22,23,24]. This approach is helpful for revealing wide range of trophic interactions in complex food webs [25,26,27]. The method uses a targeted or universal primer to amplify conserved regions of prey taxa from the gut or feces of predators, after which this region is amplified through PCR and sequenced via a high-throughput sequencing (HTS) platform. The identification of prey species is accomplished by aligning sequencing reads with DNA barcode reference libraries available in public repositories, such as GenBank and BOLD, which are freely accessible. Owing to the continuous reduction in HTS costs, DNA metabarcoding has emerged as an increasingly prominent approach for analyzing dietary compositions derived from predator digestive tracts and fecal samples. PCR is capable of amplifying such degraded DNA. A feeding experiment revealed that the detectable half-life of prey DNA in a spider’s gut lasts up to seven days following prey consumption [6]. This approach proves particularly suitable for identifying prey that are challenging or impossible to discern morphologically [28].
Previous DNA metabarcoding studies on spider diet have mainly used the opisthosoma, whole body, or gut of spiders for DNA extraction and sequencing [29,30]. However, because spiders and their prey are mostly arthropods, it is difficult to avoid amplification of spider DNA using universal primers [31]. Although blocking primers for predators may also be used to minimize the co-amplification of predator-derived barcode sequences [32], their effectiveness is limited to cases where the predator and prey are distantly related. This, however, poses a challenge in instances involving arthropods (such as spiders and their prey), where predators and prey are often closely related [29,33]. Spider webs can act as passive biofilters and capture many local small animals (especially arthropods) and environmental DNA (eDNA) produced by local vertebrates [34]. In recent years, sampling of eDNA from spider webs has been recognized to be useful in studying the community compositions of a broad range of organisms [35]. However, this technique has rarely been applied in agroecosystems for evaluating the predation of predators on pests [36]. Thus, this study aimed to analyze the prey DNA present in both the opisthosoma and webs of T. keyserlingi, to compare the differences in prey composition between the two types of DNA samples, and to explore the potential use of spider webs for DNA metabarcoding to supplement insights into the prey capture abilities of T. keyserlingi.

2. Materials and Methods

2.1. Field Investigation

The study site was located Luxi town, Shunqing District, Nanchong city, Sichuan Province, China, an area characterized by intensive rice cultivation during the summer growing season. Two sampling sites were selected: Site A (30.98° N, 106.11° E) and Site B (31.08° N, 106.12° E). The two sampling sites were approximately 20 km apart, with an area of approximately two hectares sampled at each site. At each sampling site, five quadrats of 20 m × 20 m (length × width) were established, ensuring a minimum distance of at least 20 m between adjacent quadrats. Field investigations commenced following rice transplantation in early June 2023 and concluded until the end of the rice harvest in late August 2023. Sampling was performed at approximately 15-day intervals, encompassing the tillering, elongation, earing, flowering, grain-filling, and ripening stages of rice growth. At each sampling event, the same trained operator conducted arthropod sampling using a sweep net. Within each quadrat, 50 sweeps were performed. Subsequently, all arthropods within the net were collected either by hand or using a homemade suction device. Finally, all collected specimens were immediately preserved in anhydrous ethanol, transported to the laboratory, and stored at −20 °C. Herbicide was applied once during the land preparation phase for rice field cultivation. Thereafter, no chemical pesticides were applied for pest control throughout the entire rice-growing period. Sampling was avoided on rainy days whenever possible.
Taxonomic identification was conducted based on morphological characteristics, with reference to the established taxonomic literature. Specimens were identified to the species level whenever possible. For those that could not be identified to the species level, they were assigned to their respective families and labeled as sp. 1, sp. 2, etc., for differentiation. Following identification, the individual numbers for each species were recorded.

2.2. Collection of T. keyserlingi and Its Webs

Tetragnatha keyserlingi appeared abundantly in rice fields during the tillering, elongation, and earing in the sampling site. Specimens were collected at both sites between June and July 2023, at approximately 15-day intervals. During this period, T. keyserlingi was most active. For each site, specimens were taken from both the edges and interiors of the rice fields. Typically, both female and male T. keyserlingi construct a new web at each sunset and either remain on the web or rest on nearby vegetation, except when they are seeking new web habitats or searching for a mate. Sampling was conducted between 8:00 a.m. and 11:00 a.m., as numerous prey remains can be observed on the web during this period. Selection of spider webs for specimen collection focused on those actively occupied by spiders. For each spider web, both the spider and the web were collected separately to avoid cross-contamination. During collection, the spiders were first carefully removed from the spider web by hand and preserved in 1.5 mL microcentrifuge tubes filled with absolute ethyl alcohol. Subsequently, the entire spider web, including any prey remaining within, was collected using sterilized tweezers and stored in another 1.5 mL microcentrifuge tube filled with absolute ethyl alcohol. Finally, the spider and spider web were numbered accordingly. During the tillering, elongation, and earing stages, 12, 10, and 8 individuals of adult spiders (comprising 18 females and 12 males) and their webs were collected, respectively. All the collected specimens were transported to the laboratory and stored at −20 °C for further analysis.

2.3. Specimen Preprocessing and DNA Extraction

Genomic DNA extraction was performed both on the collected T. keyserlingi and their webs. To maximize prey DNA recovery, the entire opisthosoma of spiders were used for spider DNA extraction, as it harbors a higher concentration of prey DNA compared to the cephalothorax [37]. Prior to DNA extraction, the spider’s body underwent thorough cleaning with ultrapure water to minimize contamination. Then, the spider opisthosoma was cut off using sterilized tweezers and blades and placed into new 1.5 mL microcentrifuge tubes. For the spider web, to prevent DNA loss during the sample transfer, the alcohol used for soaking the spider web was completely evaporated using a drying oven at approximately 40 °C and was subsequently extracted in the collection tubes. The genomic DNA of each opisthosoma and web was extracted separately using an animal genomic DNA extraction kit (Beijing Dingguo Changsheng Biotechnology Co., Ltd., Beijing, China) in accordance with the manufacturer’s protocols. Each extraction process included a negative control (no specimen included). Finally, the DNA was eluted in 50 μL of the manufacturer’s elution buffer and subsequently used for library preparation and sequencing. The quantity and quality (Table S1, Figure S2) of the extracted DNA were measured using a NanoDrop ND-1000 spectrophotometer (Thermo Fisher Scientific, Waltham, MA, USA) and agarose gel electrophoresis.

2.4. DNA Amplification and Sequencing Protocol

The target DNA region was amplified using the primer pair mlCOIintF (GGWACWGGWTGAACWGTWTAYCCYCC) and Fol-degen-rev (TANACYTCNGGRTGNCCRAARAAYCA) [38,39], targeting a 363 bp fragment within the cytochrome c oxidase subunit I (COI) barcode region, which is widely used as a molecular marker for arthropod identification [11,29]. To facilitate multiplex sequencing, unique 7 bp identifier tags were incorporated into the primers. Amplification was performed in a 2720 Thermal Cycler (Applied Biosystems, Foster City, CA, USA) with the following PCR mixture (total volume of 25 µL): 2 µL (2.5 mM) dNTPs, 0.25 µL Q5® High-Fidelity DNA Polymerase (5 U/µL, New England Biolabs, Ipswich, MA, USA), 5 µL Q5® reaction buffer (5×), 5 µL Q5® High-Fidelity GC buffer (5×), 1 µL (10 µM) of each primer (forward and reverse), 2 µL of DNA template, and 8.75 µL of ddH2O. The thermal cycling protocol comprised an initial denaturation at 98 °C for 5 min, followed by 27 cycles involving denaturation at 98 °C for 30 s, annealing at 50 °C for 30 s, and an extension at 72 °C for 45 s, and concluded with a final extension step at 72 °C for 5 min. A no-template negative control was included in each run. PCR products were validated via agarose gel electrophoresis (Figure S3), purified using VAHTSTM DNA Clean Beads (Vazyme, Nanjing, China), and quantified using the Quant-iT PicoGreen dsDNA Assay Kit (Invitrogen, Waltham, MA, USA). Following individual quantification (Table S2), equimolar pooled libraries were prepared and sequenced on an Illumina NovaSeq PE250 platform (2 × 250 bp) using a NovaSeq 6000 SP Reagent Kit (500 cycles) at Shanghai Personal Biotechnology Co., Ltd. (Shanghai, China), with an expected output of approximately 60,000 reads per sample.

2.5. Sequence Analysis

Sequence processing was performed in QIIME2 (v2023.9) following the standard pipeline with minor modifications [40]. Initially, raw sequencing reads were demultiplexed by exact matching to sample-specific barcodes, retaining only high-confidence sequences. Subsequent preprocessing steps included read merging, quality filtering, and dereplication, which were performed using VSEARCH (specific functions: fastq_mergepairs, fastq_filter, and derep_fulllength) [41]. Chimeric sequences were identified and removed using VSEARCH’s de novo chimera detection approach. Operational taxonomic unit (OTU) clustering was conducted at 97% similarity using UCLUST [42], with a representative sequence selected for each OTU. Taxonomic assignment was performed using the BROCC algorithm, with the NCBI-nt database serving as the reference. Finally, an OTU abundance table was generated, summarizing the distribution and taxonomy of OTUs across all samples.

2.6. Data Analysis

The diversity of arthropods obtained from spider opisthosoma and spider webs was quantitatively evaluated using Shannon’s diversity index (H′) [43]. This ecological metric was calculated based on the following mathematical expressions:
H = i = 1 S ( P i l n P i )
Pi = ni/N
In this formulation, Pi represents the relative abundance of reads of prey species i within a given sample; ni represents the read count detected for species i; N represents the total read count across all prey species in the sample.
All statistical analyses were conducted using GraphPad Prism (v10, GraphPad Software Inc., San Diego, CA, USA). Data normality was checked initially via the Shapiro–Wilk test. To compare the read abundances of unassigned, predator, non-prey, and prey reads obtained from spider opisthosoma and spider web samples, a Kruskal–Wallis test with Dunn’s post hoc correction was conducted. Prey species were classified into four functional groups at the family level based on their feeding habits [44]: pests (phytophagous), predators (carnivorous), parasitoids, and other arthropods (including saprophagous and fungivorous species with minimal impacts on rice plants). The same Kruskal–Wallis test framework, with Dunn’s post hoc correction, was employed to compare the diversity and read abundance of pests versus other prey groups. A Mann–Whitney U test was conducted to compare the number of prey species per sample type (opisthosoma versus webs). One-way ANOVA with Dunnett’s T3 correction was used to compare the differences in read abundance among prey families. Fisher’s exact test was used to assess differences in detection rates (presence/absence) across prey families.

3. Results

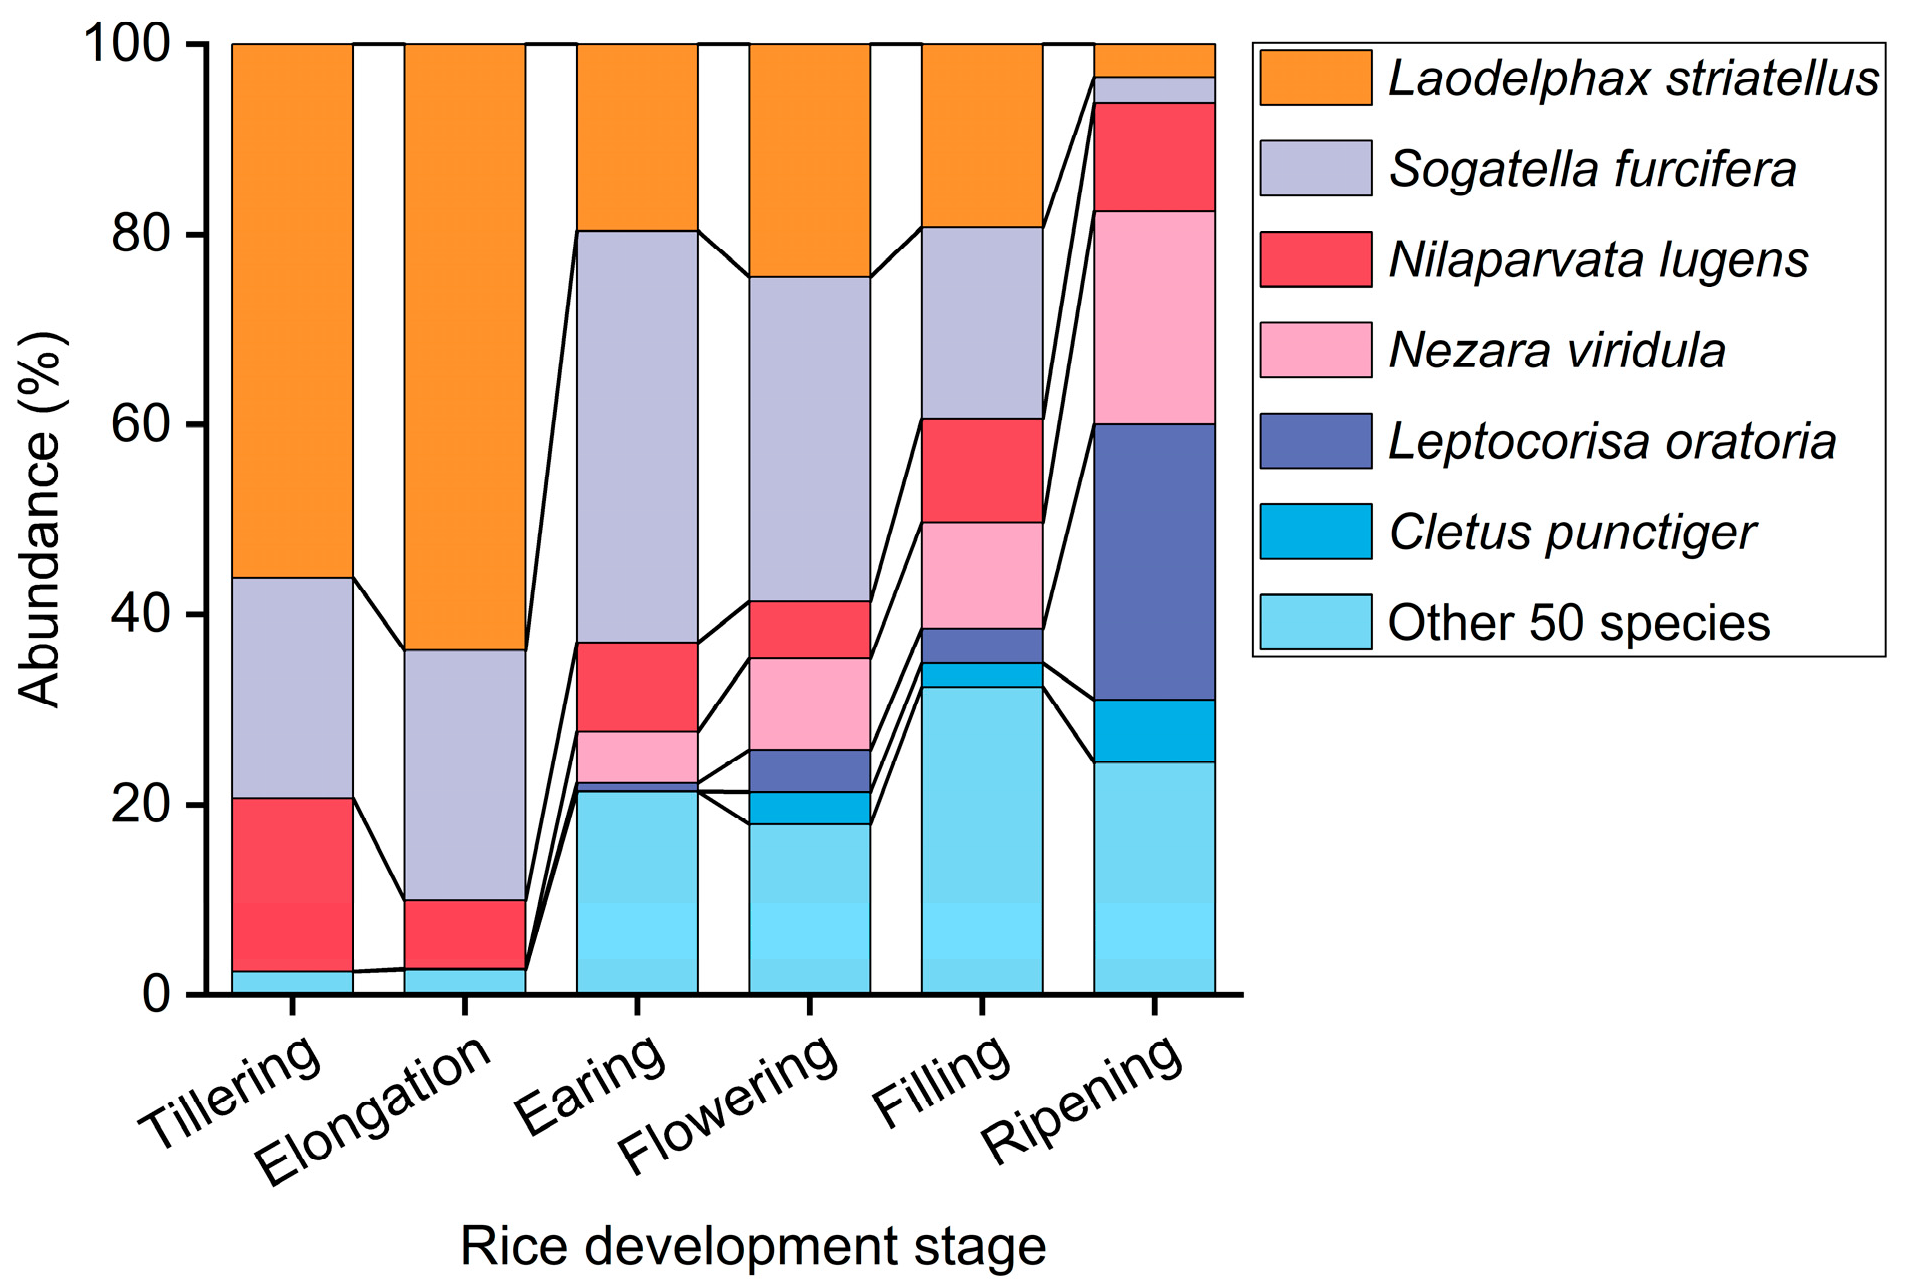
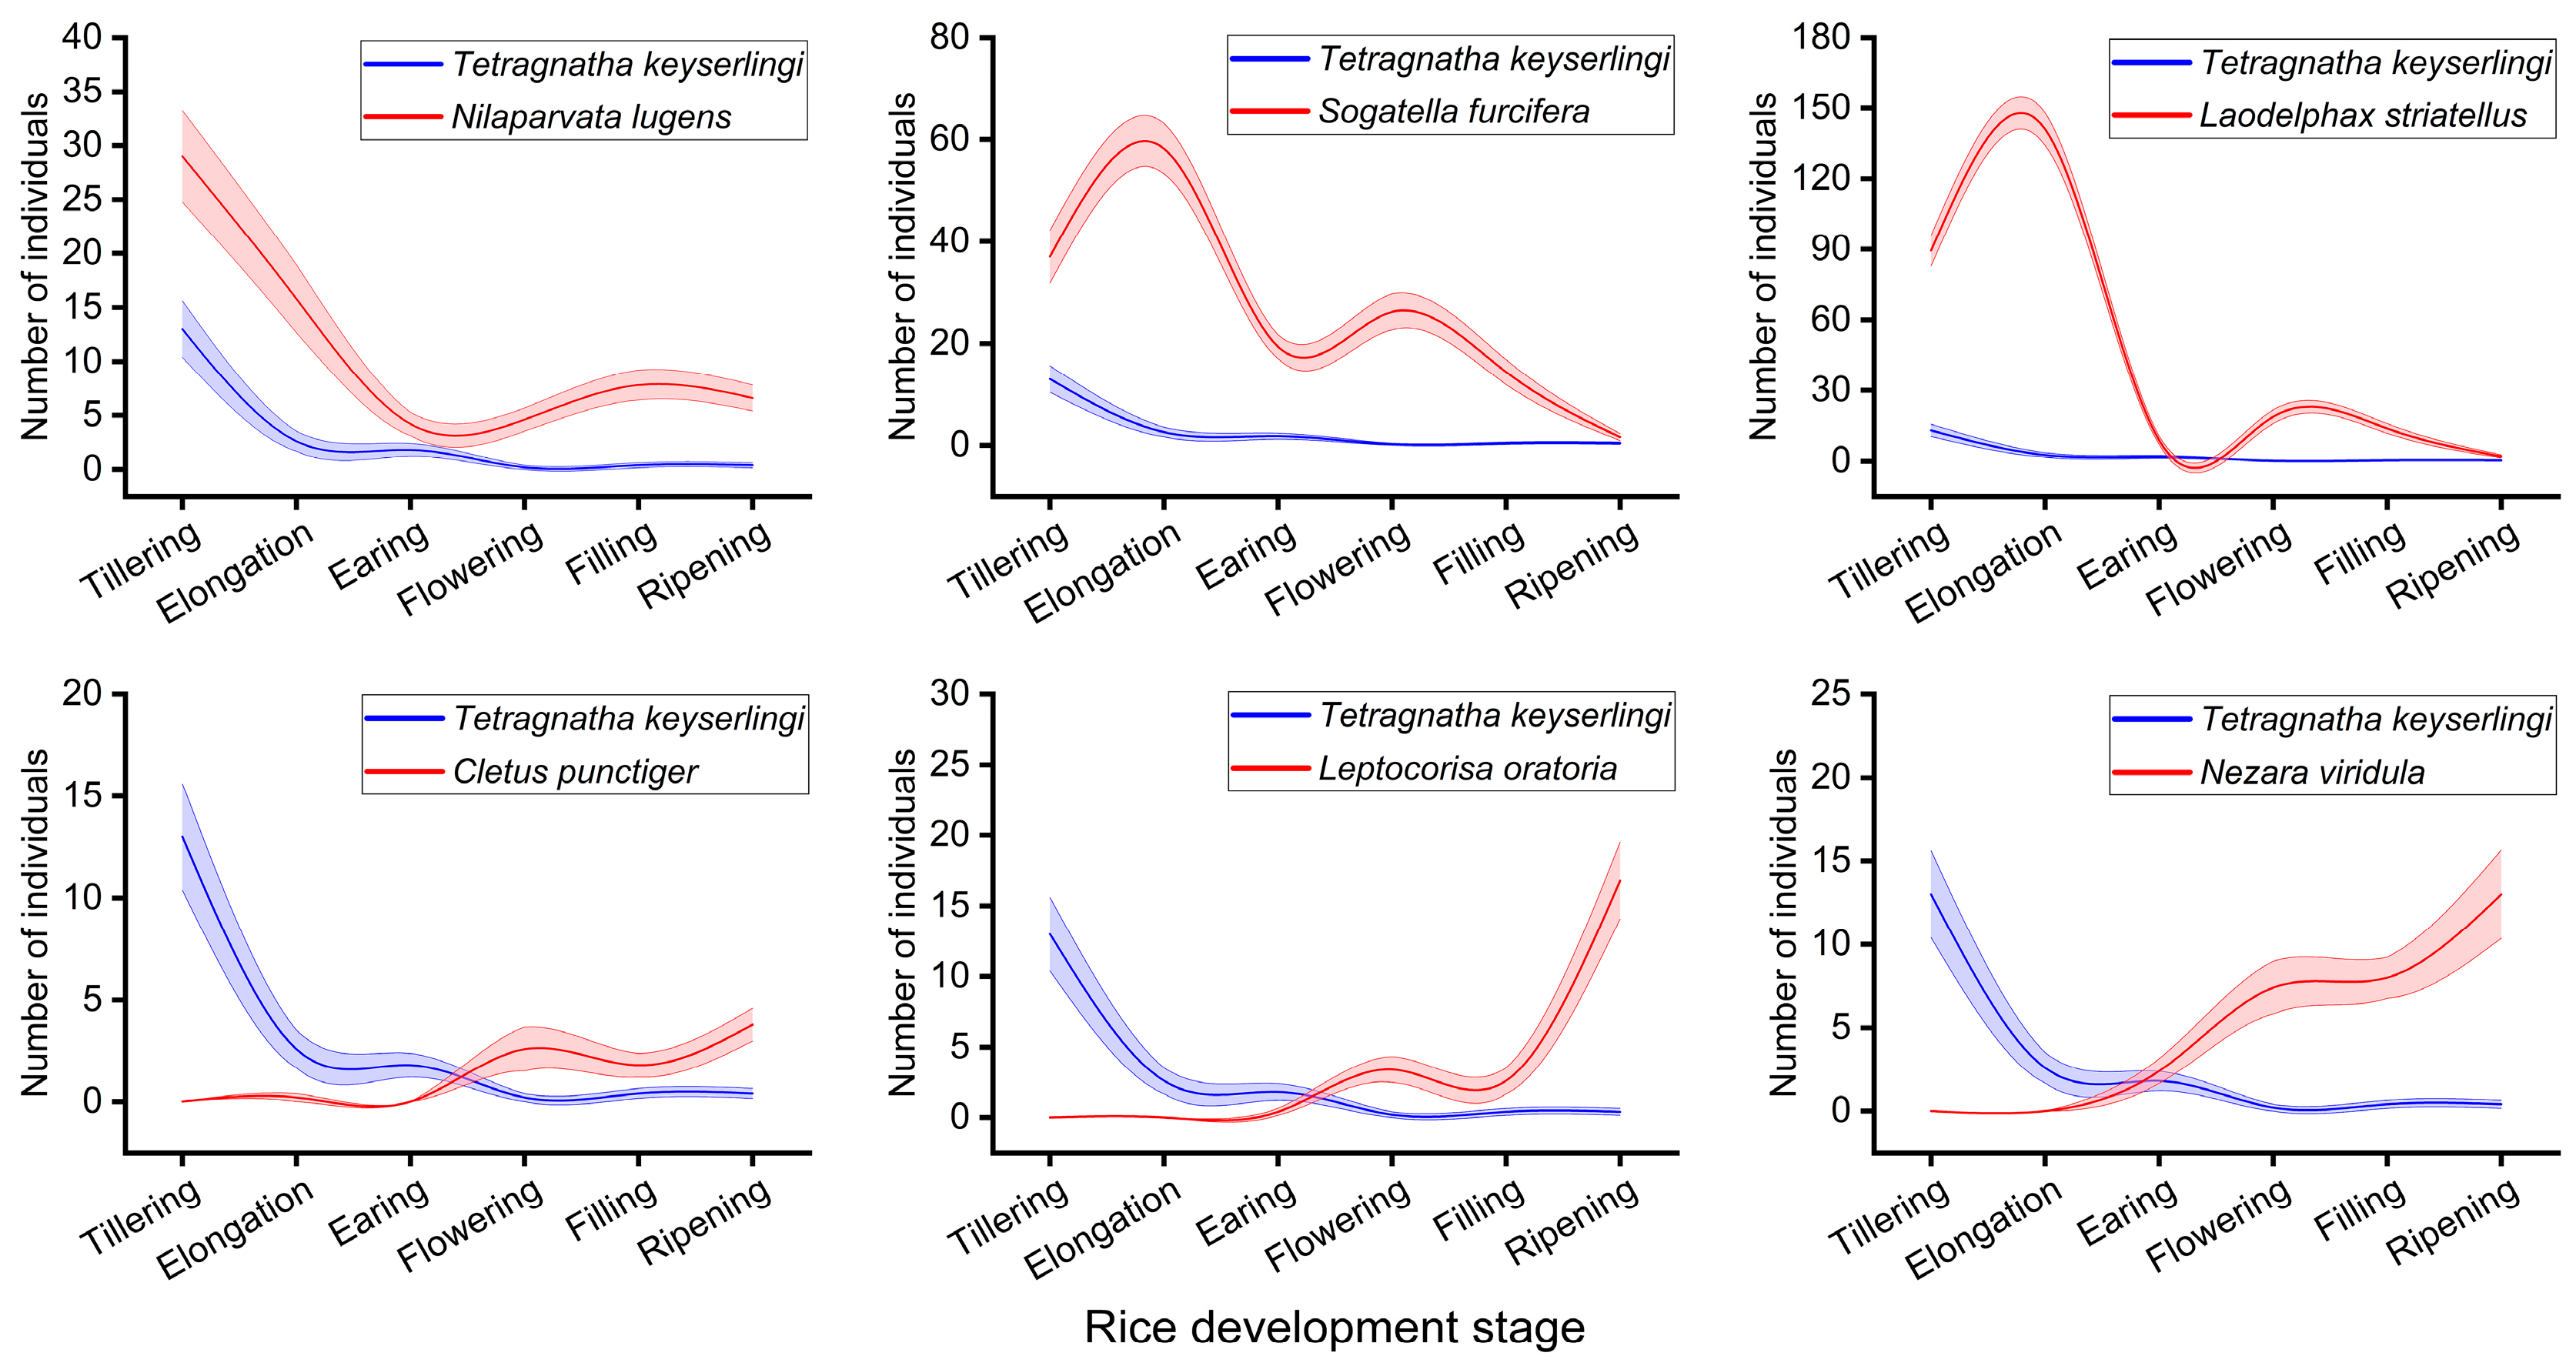
3.1. Population Dynamic Relationships Between T. keyserlingi and Major Rice Pests

Through continuous sweep net sampling conducted from the tillering stage to the ripening stage of rice, a total of 3 classes, 13 orders, 73 families, and 179 arthropod species were collected from the study site. All arthropod species were further categorized into four functional groups based on their feeding habits: phytophagous pests (plant-feeding organisms), carnivorous predators (insectivorous species), parasitoids (parasitic wasps and flies), and other arthropods (including saprophagous and fungivorous species with minimal impacts on rice plants). Among the predators, T. keyserlingi, Pardosa pseudoannulata (Bösenberg and Strand) (Araneae: Lycosidae), Mendoza canestrinii (Ninni) (Araneae: Salticidae), Ummeliata insecticeps (Bösenberg and Strand) (Araneae: Linyphiidae), Tetragnatha nitens (Audouin) (Araneae: Tetragnathidae), and Micraspis discolor (Fabricius) (Coleoptera: Coccinellidae) were identified to be the most abundant species in the study site. As the growth period of rice progresses, the population dynamics of each predator species undergo dynamic changes. Notably, T. keyserlingi exhibits relatively high population abundance during the tillering, elongation, and earing stages of rice (Figure 1). Among the pest species, Laodelphax striatellus (Fallén), (Hemiptera: Delphacidae), Sogatella furcifera (Horváth) (Hemiptera: Delphacidae), Nilaparvata lugens (Stål) (Hemiptera: Delphacidae), Nezara viridula (L.) (Hemiptera: Pentatomidae), Leptocorisa oratoria (Fabricius) (Hemiptera: Alydidae), and Cletus punctiger (Dallas) (Hemiptera: Coreidae) were identified as the most abundant in the study site. As the growth period of rice progresses, the population dynamics of these pest species also undergo dynamic changes (Figure 2). To further explore the population dynamic relationships between T. keyserlingi and the major rice pest species, we analyzed and plotted the population dynamics of T. keyserlingi alongside those of six predominant rice pest species. As illustrated in Figure 3, the population dynamics of T. keyserlingi and N. lugens display synchrony, with the former tending to follow the fluctuations in the latter.

3.2. Dietary DNA Metabarcoding Analysis of T. keyserlingi

3.2.1. Species Taxon Assignment

On average, each DNA sample from the spider opisthosoma yielded 95,587 ± 2267 (mean ± standard error) raw reads initially. After performing quality control procedures, including read merging, filtering, and chimera removal, the final dataset comprised 91,569 ± 2153 high-quality sequences. For each DNA sample from the spider web, an average of 89,255 ± 1336 raw reads were generated, resulting in 84,998 ± 1270 high-quality reads following the same processing steps. Taxonomic assignment showed that all DNA samples successfully amplified the DNA of the prey, while the relative abundance of prey reads retrieved from the opisthosoma was relatively low, and the relative abundance of the predator itself was significantly greater than that of the prey (H = 99.67, p < 0.0001) (Figure 4a). On the contrary, the spider web had the largest relative abundance of prey reads, surpassing those of the spider itself (H = 80.80, p < 0.0001) (Figure 4b).

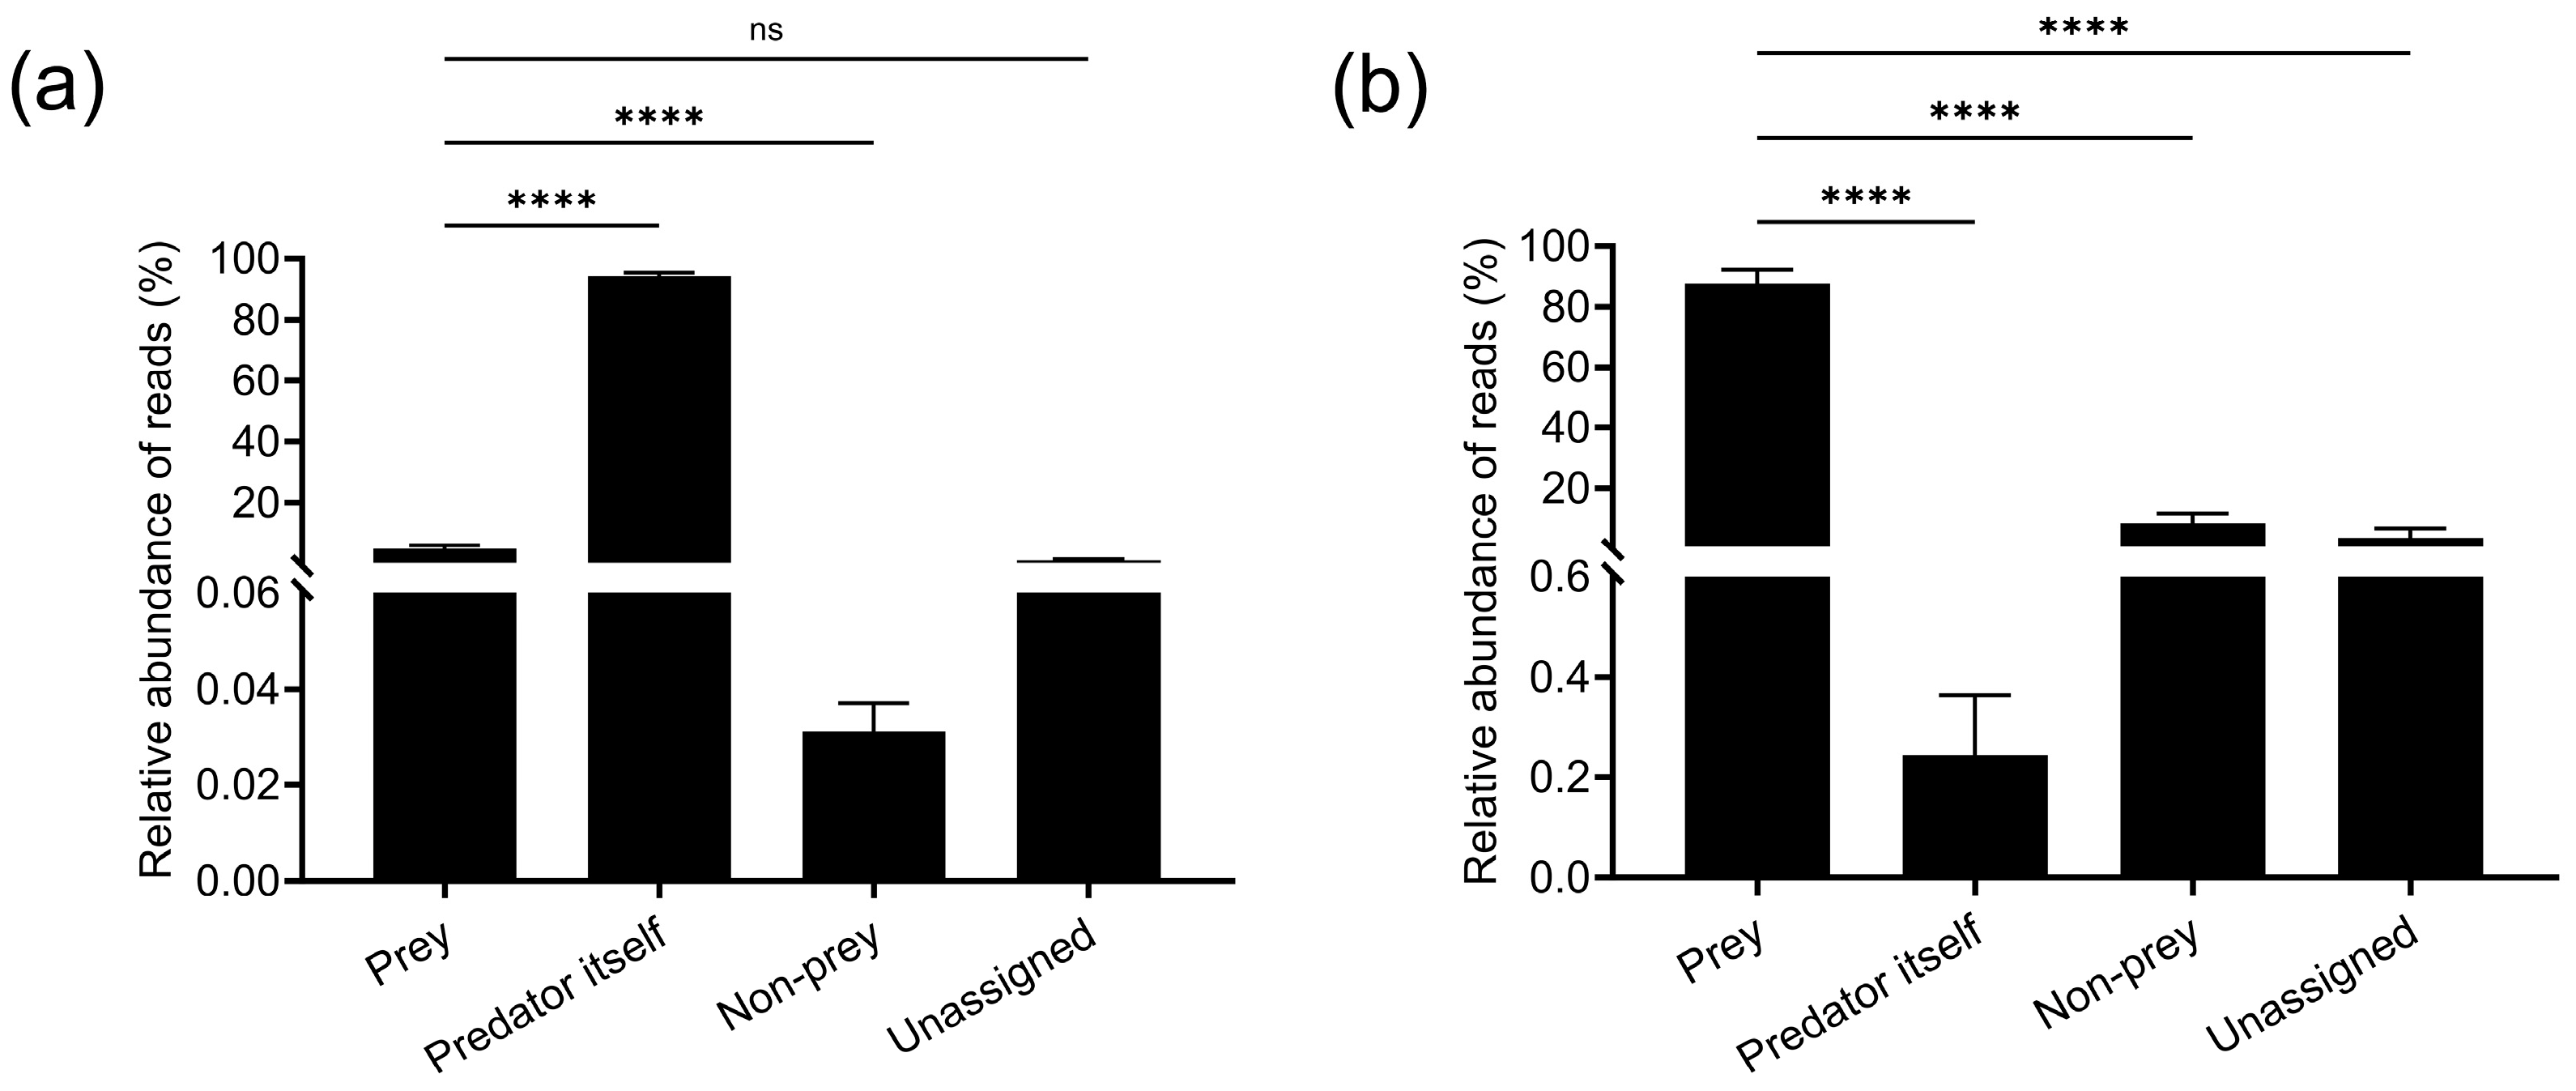
3.2.2. Evaluation of Prey Taxon Assignment Efficiency

To evaluate the sufficiency of prey taxon assignment, we calculated the percentage of the number of prey OTU assignments to each taxonomic level in the total number of prey OTUs. For the spider opisthosoma samples, a total of 73 OTUs were identified following the assignment of prey reads. Specifically, 73, 71, 58, and 33 OTUs were identified at the order, family, genus, and species levels, respectively. For the spider web samples, a total of 81 OTUs were identified after assigning prey reads. Of these, 81, 80, 66, and 38 OTUs were identified at the order, family, genus, and species levels, respectively. These results indicate that the majority of prey reads were successfully assigned to the family level. Although approximately 50% of the OTUs were resolved to the species level, conducting subsequent analyses primarily at the family level proved practical for the present study.

3.2.3. Comparison of Prey Species Richness Between Spider Opisthosoma and Spider Webs

We compared the prey species richness identified from spider opisthosoma and spider webs. A total of 73 prey species were obtained from spider opisthosoma, and 81 prey species were obtained from spider webs, of which 35 prey species were shared by the two materials (Figure 5a). On average, 7.8 ± 0.7 (mean ± standard error) prey species were obtained from each DNA sample of the spider opisthosoma, and 13.0 ± 1.2 prey species were obtained from each DNA sample of the spider web. This difference in species richness was statistically significant (Mann–Whitney U test, U = 197.5, p < 0.001; Figure 5b), indicating that web samples harbored a more diverse prey spectrum per sampling unit.

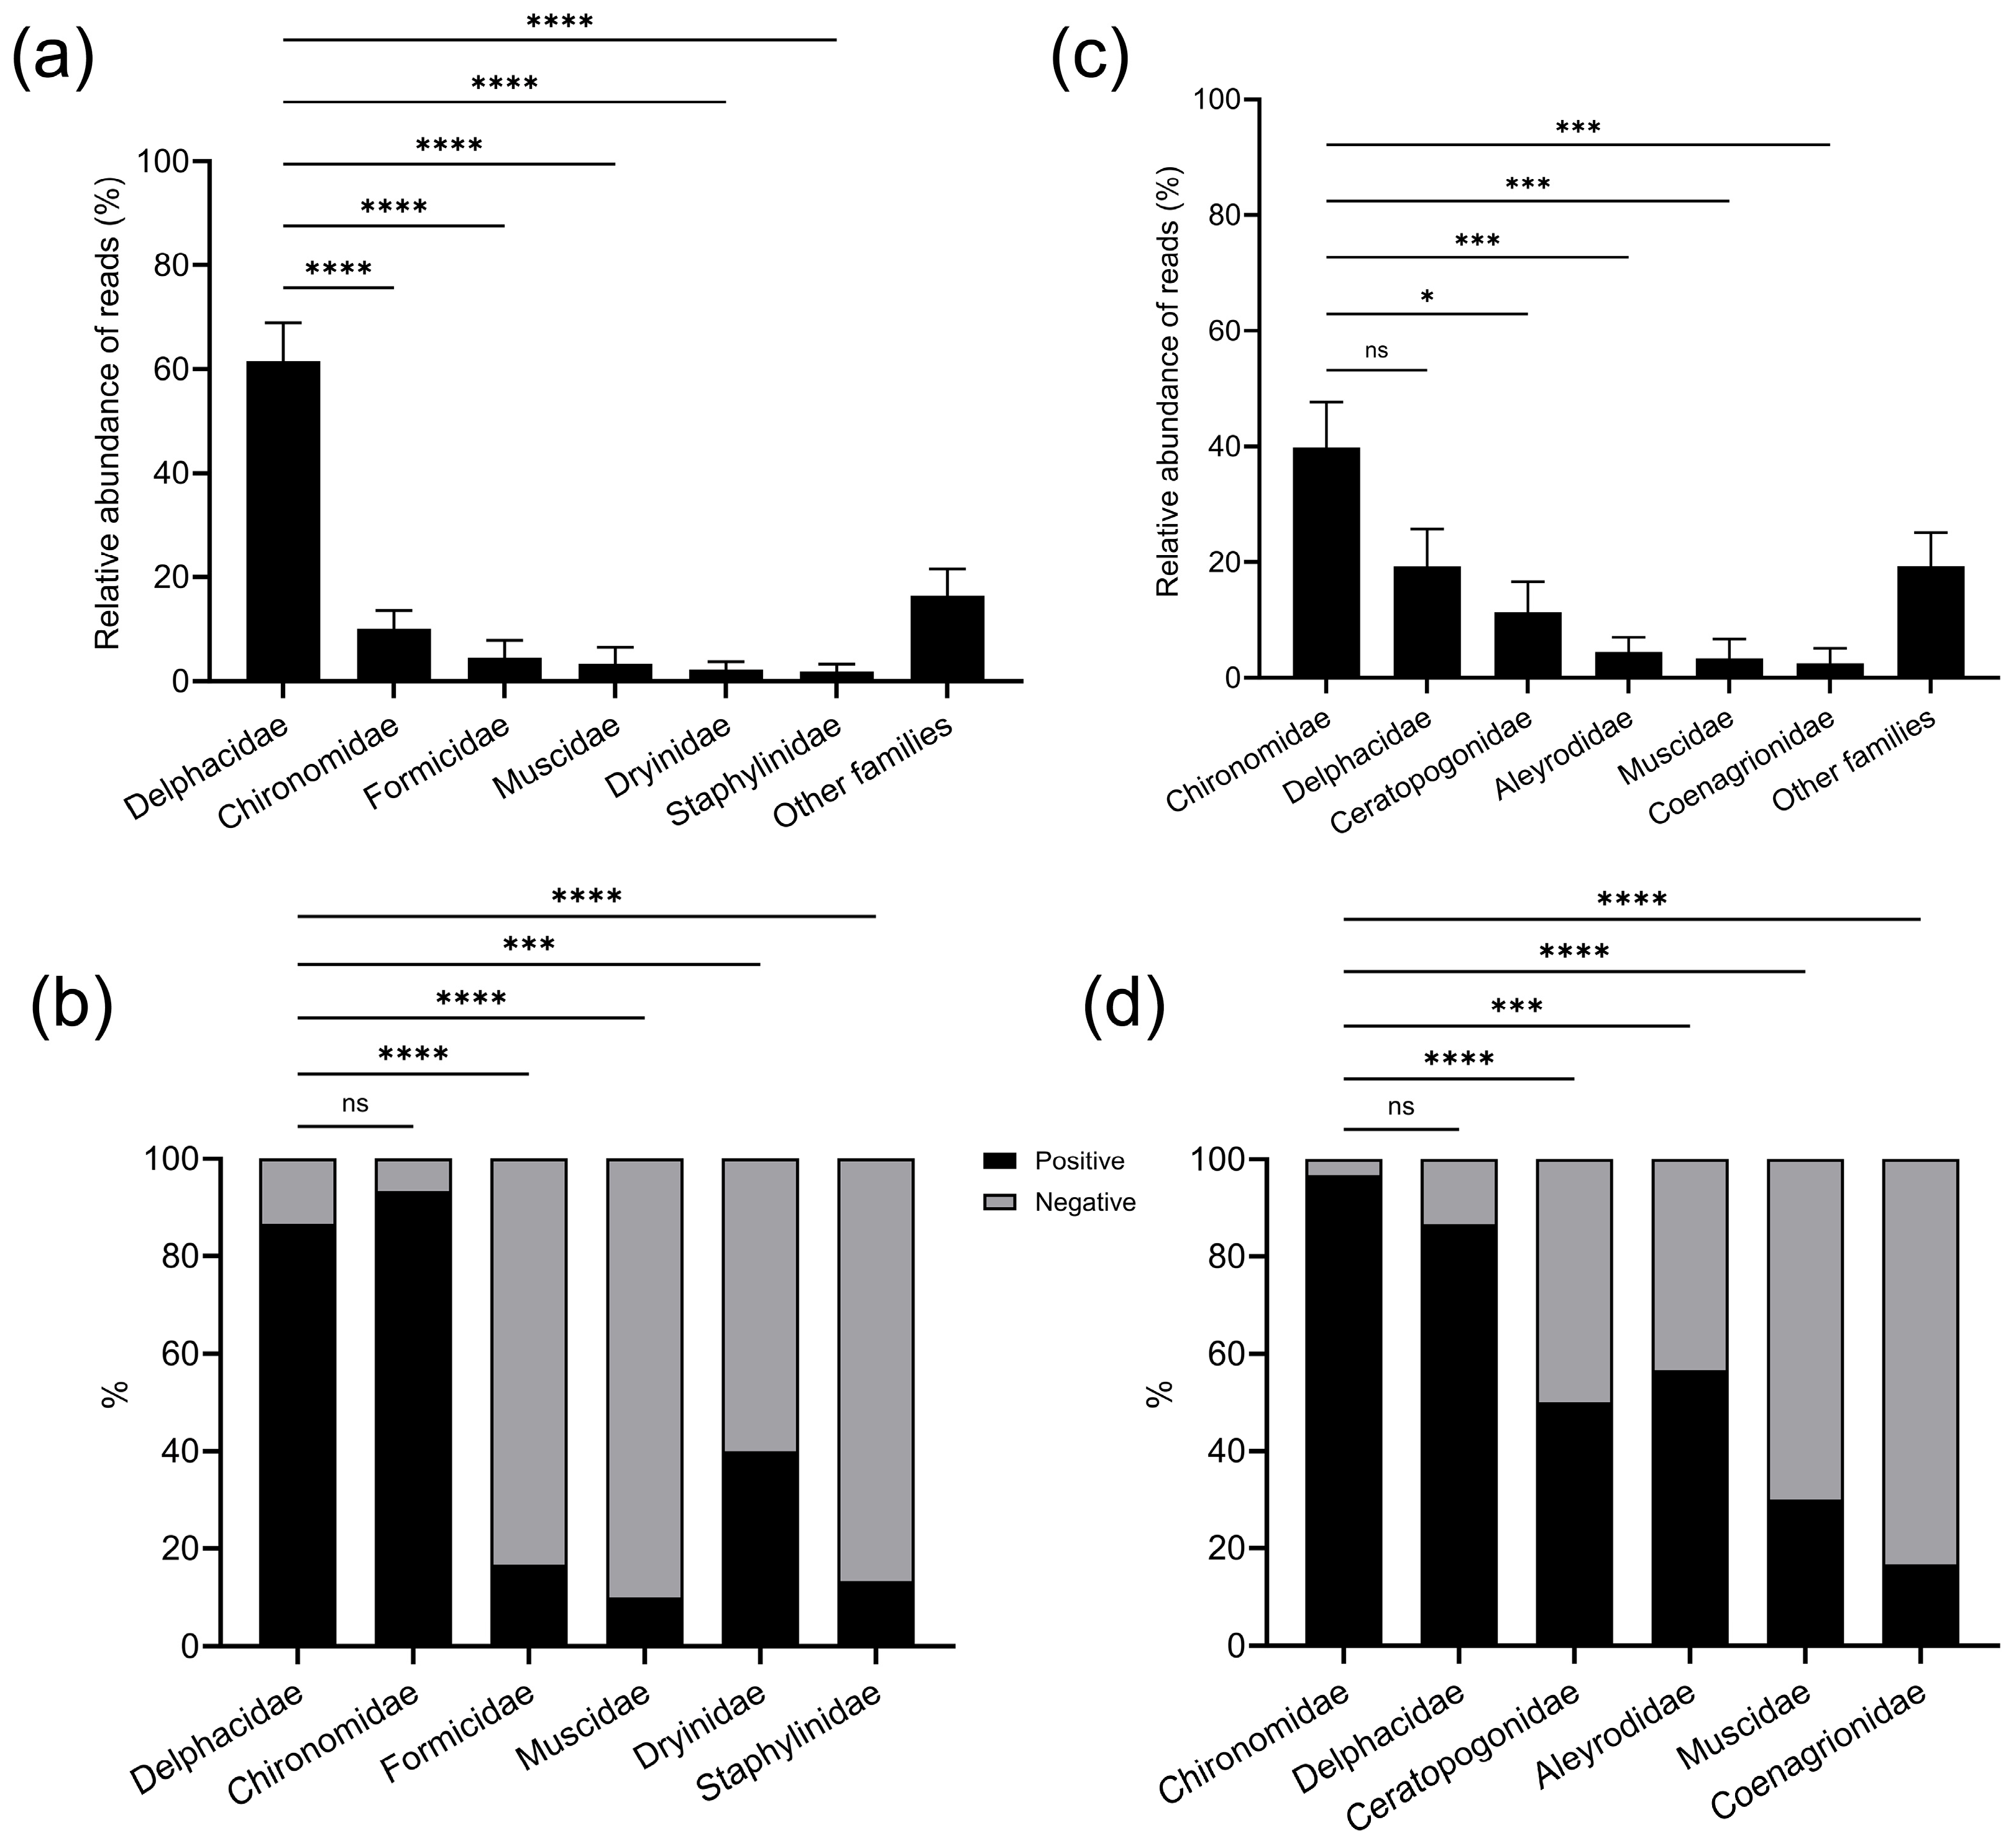
3.2.4. Composition of Prey Identified from Spider Opisthosoma and Spider Webs

Non-prey reads (including those of fungi and vertebrates) were excluded based on the results of the negative control and the fact that spiders predominantly feed on arthropods. All identified prey belonged to arthropods. As detailed in Section 3.1, the identified prey species were further classified into four functional groups based on their feeding habits: phytophagous pests, carnivorous predators, parasitoids, and other arthropods. As illustrated in Figure 6a,b, spider opisthosoma exhibited the highest diversity and read abundance of pests, which was significantly greater than that in predators and parasitoids (Shannon’s diversity index: H = 52.45, p < 0.0001; read abundance: H = 59.41, p < 0.0001). Although the highest read abundance of spider webs was other arthropods, spider webs also had a greater diversity and read abundance of pests, which was significantly greater than that of predators and parasitoids (Shannon’s diversity index: H = 59.89, p < 0.0001; read abundance: H = 67.44, p < 0.0001) (Figure 6c,d). We further calculated the positive rates and read abundances of prey identified at the family level from spider opisthosoma samples and spider web samples. For spider webs, the highest relative abundance of prey reads was observed in Chironomidae, which did not differ significantly from that of Delphacidae (t = 2.0, df = 55.92, p = 0.26), but was significantly higher than that of other prey families (F = 6.54, DFn = 6.0, DFd = 133.5, p < 0.0001) (Figure 7c). The corresponding positive rate for Chironomidae was 96.7%, which did not differ significantly from that of Delphacidae (Fisher’s exact test, N = 30, p = 0.35), but was significantly higher than that of other prey families (Fisher’s exact test, N = 30, p < 0.001) (Figure 7d). Conversely, the highest relative abundance of prey reads obtained from spider opisthosoma samples was attributed to Delphacidae, which was significantly higher than that of other prey families (F = 27.25, DFn = 6.0, DFd = 102.5, p < 0.0001) (Figure 7a). The corresponding positive rate for Delphacidae was 86.7%, which did not differ significantly from that of Chironomidae (Fisher’s exact test, N = 30, p = 0.67), but was significantly higher than that of other prey families (Fisher’s exact test, N = 30, p < 0.001) (Figure 7b).

4. Discussion

Understanding animal diets is essential for deciphering the intricacies of food webs within agroecosystems. Dietary analyses provide critical insights into the impact of agricultural practices or policies on animal diet behavior and to evaluate ecosystem services for wild animals, such as biological control of crop pests [45,46,47,48]. Spiders, as common predators in agroecosystems, inhabit various niches including the ground, crop surfaces, and intercropping spaces (particularly in the case of web-building species) [49]. Most spider species are generalist arthropod predators feeding primarily arthropods, especially springtails and insects [50], and thus contribute to natural pest suppression [51,52]. In recent years, researchers in the fields of agriculture and ecology have increasingly emphasized the role of spiders in pest control within agricultural ecosystems [53,54]. Tetragnatha keyserlingi, a prevalent species in rice field ecosystems, coexists in substantial numbers with rice pests [12,55]. Our field investigation further confirmed that T. keyserlingi was the predominant predatory arthropod in the study site. Additionally, our study revealed that the population dynamics of T. keyserlingi and N. lugens display synchrony (Figure 3). Further analysis focused on the dietary composition of T. keyserlingi, providing insights into its predation patterns on pests and its potential contributions to sustainable pest management in rice farming systems.
Spiders are fluid feeders, and the prey remaining in the gut or feces of spiders cannot be identified by morphology. Consequently, DNA metabarcoding stands as the preferred approach for studying spider prey composition [30,56]. Nevertheless, due to the high sensitivity of PCR and the broad-spectrum nature of universal primers, non-target amplification can occur [57]. The negative control sample, which was specifically designed for this study, resulted in a measurable quantity of DNA in the PCR product (2.1 ng/μL; Table S2). Subsequent sequencing analysis identified the presence of fungal or vertebrate-derived reads. Avoiding non-prey DNA contamination is challenging, as it may originate from the spider itself or its surroundings during DNA extraction and PCR amplification [58]. Because spiders are known to feed almost exclusively on arthropods [19], sequences derived from non-arthropod taxa were excluded from dietary interpretation in this study. Consistent with previous findings [11,24], this study also revealed a small portion of unassigned reads, with approximately 50% of prey OTUs remaining unassigned at the species level. This could be attributed to the absence of COI gene data for these species in the database (e.g., GenBank and BOLD), resulting in reads that do not align with existing entries [31]. Nonetheless, almost all of prey reads were successfully categorized at the family level, prompting us to focus our subsequent analysis on the prey composition of T. keyserlingi at this taxonomic level.
Dissecting the spider’s gut is challenging because of its extensive branched structure [19]. In this study, our methodology focused exclusively on the opisthosoma of spiders for DNA extraction [29]. The extracted DNA was subsequently amplified using universal primer pairs. Consistent with previous findings, DNA metabarcoding of spider opisthosoma revealed a predominant presence of spider-derived reads, with only a limited number of prey reads detected (Figure 4). This is a recurring issue when employing the entire or parts of a predator’s body for molecular dietary analysis, as the predator’s DNA may interfere with primer amplification of its prey [32,59]. This phenomenon arises from the high abundance of predator DNA, which may restrict primer amplification of low-abundance prey DNA, potentially rendering some low-abundance prey undetectable. In the current study, the high abundance of spider DNA may ultimately lead to an underestimation of the prey capture ability of spiders when utilizing spider opisthosoma for DNA metabarcoding. In contrast, the spider web exhibited the highest relative abundance of prey reads, exceeding that of the spider itself. These results indicate that DNA metabarcoding of spider opisthosoma obtained mostly reads belonging to the spider itself, while DNA metabarcoding of spider webs revealed abundant prey reads.
We employed DNA metabarcoding techniques to analyze the dietary composition of T. keyserlingi, a web-building spider species collected from rice fields. The results showed that there were abundant prey reads extracted from the spider web, with only a minor portion originating from the spider itself (Figure 4). Further analysis revealed 73 prey species from spider opisthosoma and 81 from the spider web, with 35 species shared between both sources (Figure 6a). These results indicate that the prey compositions obtained by DNA metabarcoding of spider opisthosoma and spider webs were both similar and complementary. This finding is consistent with the predatory characteristics of orb-weaving spiders, which typically immediately seize prey with chelicerae, wrap them with silk, and consume them following web capture [19]. After feeding, the remaining prey may be left on the web or discarded from the web by the spider. However, not all prey caught on the web will be eaten immediately by the spider. Our field observations showed that some prey on the web were living and had not been eaten by the spider from rice fields (Figure S1b,c). Therefore, using only spider opisthosoma or spider webs for DNA metabarcoding may lead to an underestimation of the prey capture ability of spiders. Overall, the spider web exhibited the highest diversity and read abundance of prey according to DNA metabarcoding (Figure 4 and Figure 6).
Our field collection revealed Chironomidae and Delphacidae as the primary prey taxa ensnared on the web when T. keyserlingi appeared in large numbers in the rice fields (Figure S1b,c). Saksongmuang et al. collected webs of the genus Tetragnatha from different growth stages of rice and identified prey species based on morphology [20]. Chironomidae and Delphacidae were also the dominant prey taxa on Tetragnatha webs. Our DNA metabarcoding analysis of spider webs confirmed that the dominant prey reads were Chironomidae and Delphacidae (Figure 7c), consistent with direct observations of prey taxa on spider webs. These results indicated that our optimized PCR approach was impossible to amplify high-abundance prey DNA into low-abundance prey reads.
Wang et al. identified the predation patterns of field-collected T. keyserlingi by using prey-specific primers targeting planthoppers and found that T. keyserlingi preyed on three planthopper species (S. furcifera, N. lugens, and L. striatellus) in rice fields [4,15]. Building on that, our study investigated the prey composition of T. keyserlingi by using DNA metabarcoding. The results showed that DNA metabarcoding of spider opisthosoma and spider webs revealed a high read abundance and positive rates for Delphacidae (including S. furcifera, N. lugens, Nilaparvata muiri China, and L. striatellus) (Figure 7, Table S3). Notably, Delphacidae exhibited the highest read abundance in the opisthosoma samples of spiders (Figure 7a). Although read abundance does not directly equate to actual prey biomass or the number of individuals consumed, a high read abundance and positive detection rates for rice planthoppers may imply that T. keyserlingi frequently captures and/or eats rice planthoppers as a significant component of its diet. Thus, among the prey detected via spider web sampling, T. keyserlingi is likely to mainly prey on rice planthoppers. Although the results showed that T. keyserlingi also preyed on other predators and parasitoids (intraguild predation) [60], their diversity and read abundance were significantly lower than those of pest species (Figure 6a,b). Notably, the read abundance of saprophagous and fungivorous arthropods ranked second only to that of pests. These arthropods may serve as alternative prey when the availability of spiders’ primary prey groups is low [61]. Diverse arthropod compositions exist in rice field ecosystems, including rice pests, natural enemy groups, and saprophagous and fungivorous arthropods [44]. Spider webs capture diverse prey, allowing spiders to maximize their growth rates and juvenile survival rates to promote the stability of their population in rice field ecosystems [62].
This study combined field investigations with dietary analysis to elucidate the prey capture ability of T. keyserlingi under field conditions. The findings revealed a synchrony between the occurrence of T. keyserlingi and N. lugens. Furthermore, dietary analysis indicated that the rice planthopper constituted a significant proportion of T. keyserlingi’s prey spectrum, as evidenced by high read abundance and positive detection rates. Additionally, this study highlighted the ecological significance of spider webs as valuable resources for evaluating the prey capture ability of T. keyserlingi. However, the field investigation was confined to a single region and a single rice growth cycle, which in turn constrained the broader applicability of the findings. Moreover, the pest control efficiency of T. keyserlingi under field conditions remains inadequately evaluated. In light of these limitations, future research will involve systematic field investigations across broader temporal and spatial scales to comprehensively evaluate the efficacy of T. keyserlingi in controlling rice planthopper populations. Furthermore, we propose integrating field control experiments (e.g., cage experiments) with artificial manipulation of T. keyserlingi population densities to monitor changes in rice planthopper population dynamics [63]. This approach aims to provide a more precise evaluation of its pest control efficiency and contribute scientific evidence and technical support for the biological control of rice planthoppers.

5. Conclusions

DNA metabarcoding has emerged as a powerful tool in predation ecology, enabling more accurate detection of spider feeding habits and highlighting their importance in agricultural pest management. In the present study, this technique was employed to characterize the prey composition of the web-building spider T. keyserlingi using samples obtained from both the spider’s opisthosoma and its web.
The results showed that the web of T. keyserlingi could capture diverse prey (including pests, predators, parasitoids, and saprophagous and fungivorous arthropods) in rice fields, while rice planthoppers exhibited high read abundance and positive detection rates in spider opisthosoma. Although DNA metabarcoding of spider opisthosoma indicated that T. keyserlingi also preyed on certain predators and parasitoids, the relative abundance of prey reads of these taxa was significantly lower than that of pests (mainly rice planthoppers). Additionally, our field investigation revealed that the population dynamics of T. keyserlingi and N. lugens display synchrony. Therefore, T. keyserlingi is an important predator of rice planthoppers and has potential as a biocontrol agent for rice planthoppers in integrated pest management strategies.
Spider web DNA metabarcoding is helpful for improving insights into the prey capture ability of T. keyserlingi. The prey DNA remaining in the spider web also needs to be included in the analysis when DNA metabarcoding is used to evaluate the prey capture ability of web-building spiders. Our findings highlight the potential of web sampling as a viable approach for deciphering predator–prey interactions and conducting future biodiversity assessments and pest monitoring programs.

Supplementary Materials

The following supporting information can be downloaded at: https://www.mdpi.com/article/10.3390/agriculture15121235/s1, Figure S1: Field observations of prey capture by Tetragnatha keyserlingi Simon; Figure S2: Agarose gel electrophoresis of DNA samples; Figure S3: Agarose gel electrophoresis of PCR products; Table S1: Quantity of DNA samples; Table S2: Quantity of PCR products; Table S3: Prey composition identified from DNA metabarcoding of the spider opisthosoma and the spider web.

Author Contributions

Conceptualization, T.Y. and S.Z.; methodology, T.Y.; formal analysis, J.S., X.S. and B.W.; investigation, J.S., X.S., B.W. and D.C.; data curation, T.Y.; funding acquisition, T.Y. and S.Z.; writing—original draft preparation, J.S. and X.S.; writing—review and editing, T.Y. and S.Z. All authors have read and agreed to the published version of the manuscript.

Funding

This work was supported by the National Natural Science Foundation of China (grant number: 32101265 and 32370530), the Sichuan Science and Technology Program (2023NSFSC0154), and the Fundamental Research Funds of China West Normal University (20A017).

Institutional Review Board Statement

Not applicable.

Data Availability Statement

Raw sequences are available online on NCBI databases (https://www.ncbi.nlm.nih.gov/ (accessed on 2 May 2025)), the associated BioProject accession number is PRJNA1091561.

Acknowledgments

We thank the rice owners for granting us permission to conduct our work in their rice fields.

Conflicts of Interest

The authors declare no conflicts of interest.

References

  1. Boldorini, G.X.; McCary, M.A.; Romero, G.Q.; Mills, K.L.; Sanders, N.J.; Reich, P.B.; Michalko, R.; Gonçalves-Souza, T. Predators control pests and increase yield across crop types and climates: A meta-analysis. Proc. R. Soc. B 2024, 291, 20232522. [Google Scholar] [CrossRef] [PubMed]
  2. Nyffeler, M.; Benz, G. Spiders in natural pest control: A review. J. Appl. Entomol. 1987, 103, 321–339. [Google Scholar] [CrossRef]
  3. Michalko, R.; Pekár, S.; Entling, M.H. An updated perspective on spiders as generalist predators in biological control. Oecologia 2019, 189, 21–36. [Google Scholar] [CrossRef]
  4. Wang, G.H.; Wang, X.Q.; Qiao, F.; Zhu, Z.R.; Cheng, J.A. Development and preliminary application of a triplex real-time polymerase chain reaction assay for evaluating predation on three planthoppers in a rice ecosystem. Mol. Ecol. Resour. 2013, 13, 811–819. [Google Scholar] [CrossRef]
  5. Yang, T.; Liu, J.; Yuan, L.; Zhang, Y.; Li, D.; Agnarsson, I.; Chen, J. Molecular identification of spiders preying on Empoasca vitis in a tea plantation. Sci. Rep. 2017, 7, 7784. [Google Scholar] [CrossRef] [PubMed]
  6. Yang, T.; Liu, J.; Yuan, L.; Zhang, Y.; Peng, Y.; Li, D.; Chen, J. Main predators of insect pests: Screening and evaluation through comprehensive indices. Pest Manag. Sci. 2017, 73, 2302–2309. [Google Scholar] [CrossRef] [PubMed]
  7. Kheirodin, A.; Simmons, A.M.; Legaspi, J.C.; Grabarczyk, E.E.; Toews, M.D.; Roberts, P.M.; Chong, J.-H.; Snyder, W.E.; Schmidt, J.M. Can generalist predators control Bemisia tabaci? Insects 2020, 11, 823. [Google Scholar] [CrossRef]
  8. World Spider Catalog. Available online: http://wsc.nmbe.ch (accessed on 2 May 2024).
  9. Yang, H.; Peng, Y.; Tian, J.; Wang, J.; Wei, B.; Xie, C.; Wang, Z. Rice field spiders in China: A review of the literature. J. Econ. Entomol. 2018, 111, 53–64. [Google Scholar] [CrossRef] [PubMed]
  10. Song, X.; Yang, T.; Xu, X.; Zhong, Y. A checklist of spiders in tea plantations of China. Biodivers. Data J. 2020, 8, e60143. [Google Scholar] [CrossRef]
  11. Yang, T.; Song, X.; Zhong, Y.; Wang, B.; Zhou, C. Field investigation- and dietary metabarcoding-based screening of arthropods that prey on primary tea pests. Ecol. Evol. 2022, 12, e9060. [Google Scholar] [CrossRef]
  12. Anis, J.R.; Premila, K.S. Species composition and quantitative analysis of Tetragnathid spiders, Tetragnathidae (Araneae) in rice fields. Int. J. Fauna Biol. Stud. 2016, 3, 158–160. [Google Scholar]
  13. Tian, X.X.; Pan, W.J.; Chen, L.L.; Xu, Y.Y.; Pan, H.C. The complete mitochondrial genome of stretch spider Tetragnatha maxillosa (Araneae: Tetragnathidae). Mitochondrial DNA A 2016, 27, 3469–3470. [Google Scholar] [CrossRef] [PubMed]
  14. Bandumula, N. Rice production in Asia: Key to global food security. Proc. Natl. Acad. Sci. India Sect. B Biol. Sci. 2018, 88, 1323–1328. [Google Scholar] [CrossRef]
  15. Wang, X.Q.; Wang, G.H.; Zhu, Z.R.; Tang, Q.Y.; Hu, Y.; Qiao, F.; Heong, K.L.; Cheng, J. Spider (Araneae) predations on white-backed planthopper Sogatella furcifera in subtropical rice ecosystems, China. Pest Manag. Sci. 2017, 73, 1277–1286. [Google Scholar] [CrossRef]
  16. Blackledge, T.A. Prey capture in orb weaving spiders: Are we using the best metric? J. Arachnol. 2011, 39, 205–210. [Google Scholar] [CrossRef]
  17. Nyffeler, M.; Sunderland, K.D. Composition, abundance and pest control potential of spider communities in agroecosystems: A comparison of European and US studies. Agric. Ecosyst. Environ. 2003, 95, 579–612. [Google Scholar] [CrossRef]
  18. Saksongmuang, V.; Michalko, R.; Petcharad, B.; Bumrungsri, S. Changes in community composition and prey capture of web-building spiders during rice field development. Basic Appl. Ecol. 2024, 79, 29–37. [Google Scholar] [CrossRef]
  19. Foelix, R.F. Biology of Spiders, 3rd ed.; Oxford University Press: New York, NY, USA, 2011. [Google Scholar]
  20. Saksongmuang, V.; Miyashita, T.; Maneerat, T.; Bumrungsri, S. Population dynamics and prey composition of Tetragnatha spiders (Araneae: Tetragnathidae) in semi-organic rice fields, Songkhla Province, southern Thailand. Songklanakarin J. Sci. Technol. 2020, 42, 725–733. [Google Scholar]
  21. Salomon, M. The natural diet of a polyphagous predator, Latrodectus hesperus (Araneae: Theridiidae), over one year. J. Arachnol. 2011, 39, 154–160. [Google Scholar] [CrossRef]
  22. Lafage, D.; Elbrecht, V.; Cuff, J.P.; Steinke, D.; Hambäck, P.A.; Erlandsson, A. A new primer for metabarcoding of spider gut contents. Environ. DNA 2020, 2, 234–243. [Google Scholar] [CrossRef]
  23. Sierra Ramirez, D.; Guevara, G.; Franco Pérez, L.M.; van Der Meijden, A.; González-Gómez, J.C.; Carlos Valenzuela-Rojas, J.; Quiroga, C.F.P. Deciphering the diet of a wandering spider (Phoneutria boliviensis; Araneae: Ctenidae) by DNA metabarcoding of gut contents. Ecol. Evol. 2021, 11, 5950–5965. [Google Scholar] [CrossRef] [PubMed]
  24. Yang, T.; Song, X.; Xu, X.; Zhou, C.; Shi, A. A comparative analysis of spider prey spectra analyzed through the next-generation sequencing of individual and mixed DNA samples. Ecol. Evol. 2021, 11, 15444–15454. [Google Scholar] [CrossRef] [PubMed]
  25. Valentini, A.; Pompanon, F.; Taberlet, P. DNA barcoding for ecologists. Trends Ecol. Evol. 2009, 24, 110–117. [Google Scholar] [CrossRef]
  26. Pompanon, F.; Deagle, B.E.; Symondson, W.O.; Brown, D.S.; Jarman, S.N.; Taberlet, P. Who is eating what: Diet assessment using next generation sequencing. Mol. Ecol. 2012, 21, 1931–1950. [Google Scholar] [CrossRef]
  27. Littlefair, J.E.; Clare, E.L. Barcoding the food chain: From Sanger to high-throughput sequencing. Genome 2016, 59, 946–958. [Google Scholar] [CrossRef]
  28. Sow, A.; Haran, J.; Benoit, L.; Galan, M.; Brévault, T. DNA metabarcoding as a tool for disentangling food webs in agroecosystems. Insects 2020, 11, 294. [Google Scholar] [CrossRef] [PubMed]
  29. Krehenwinkel, H.; Kennedy, S.; Pekár, S.; Gillespie, R.G. A cost-efficient and simple protocol to enrich prey DNA from extractions of predatory arthropods for large-scale gut content analysis by Illumina sequencing. Methods Ecol. Evol. 2017, 8, 126–134. [Google Scholar] [CrossRef]
  30. Toju, H.; Baba, Y.G. DNA metabarcoding of spiders, insects, and springtails for exploring potential linkage between above- and below-ground food webs. Zool. Lett. 2018, 4, 4. [Google Scholar] [CrossRef]
  31. Piñol, J.; San Andrés, V.; Clare, E.L.; Mir, G.; Symondson, W.O.C. A pragmatic approach to the analysis of diets of generalist predators: The use of next-generation sequencing with no blocking probes. Mol. Ecol. Resour. 2014, 14, 18–26. [Google Scholar] [CrossRef] [PubMed]
  32. Cuff, J.P.; Kitson, J.J.; Hemprich-Bennett, D.; Tercel, M.P.; Browett, S.S.; Evans, D.M. The predator problem and PCR primers in molecular dietary analysis: Swamped or silenced; depth or breadth? Mol. Ecol. Resour. 2023, 23, 41–51. [Google Scholar] [CrossRef]
  33. Piñol, J.; Mir, G.; Gómez-Polo, P.; Agustí, N. Universal and blocking primer mismatches limit the use of high-throughput DNA sequencing for the quantitative metabarcoding of arthropods. Mol. Ecol. Resour. 2015, 15, 819–830. [Google Scholar] [CrossRef] [PubMed]
  34. Newton, J.P.; Nevill, P.; Bateman, P.W.; Campbell, M.A.; Allentoft, M.E. Spider webs capture environmental DNA from terrestrial vertebrates. iScience 2024, 27, 108904. [Google Scholar] [CrossRef] [PubMed]
  35. Gregorič, M.; Kutnjak, D.; Bačnik, K.; Gostinčar, C.; Pecman, A.; Ravnikar, M.; Kuntner, M. Spider webs as eDNA samplers: Biodiversity assessment across the tree of life. Mol. Ecol. Resour. 2022, 22, 2534–2545. [Google Scholar] [CrossRef] [PubMed]
  36. Grabarczyk, E.E.; Querejeta, C.M.; Tillman, P.G.; Wallace, R.D.; Barnes, B.F.; Meinecke, C.D.; Villari, C.; Gandhi, K.J.K.; LaForest, J.; Elliott, M.; et al. DNA metabarcoding analysis of three material types to reveal Joro spider (Trichonephila clavata) trophic interactions and web capture. Front. Ecol. Evol. 2023, 11, 1177446. [Google Scholar] [CrossRef]
  37. Macías-Hernández, N.; Athey, K.; Tonzo, V.; Wangensteen, O.S.; Arnedo, M.; Harwood, J.D. Molecular gut content analysis of different spider body parts. PLoS ONE 2018, 13, e0196589. [Google Scholar] [CrossRef]
  38. Yu, D.W.; Ji, Y.; Emerson, B.C.; Wang, X.; Ye, C.; Yang, C.; Ding, Z. Biodiversity soup: Metabarcoding of arthropods for rapid biodiversity assessment and biomonitoring. Methods Ecol. Evol. 2012, 3, 613–623. [Google Scholar] [CrossRef]
  39. Leray, M.; Yang, J.Y.; Meyer, C.P.; Mills, S.C.; Agudelo, N.; Ranwez, V.; Boehm, J.T.; Machida, R.J. A new versatile primer set targeting a short fragment of the mitochondrial COI region for metabarcoding metazoan diversity: Application for characterizing coral reef fish gut contents. Front. Zool. 2013, 10, 34. [Google Scholar] [CrossRef]
  40. Bolyen, E.; Rideout, J.R.; Dillon, M.R.; Bokulich, N.A.; Abnet, C.C.; Al-Ghalith, G.A.; Alexander, H.; Alm, E.J.; Arumugam, M.; Asnicar, F.; et al. Reproducible, interactive, scalable and extensible microbiome data science using QIIME 2. Nat. Biotechnol. 2019, 37, 852–857. [Google Scholar] [CrossRef]
  41. Rognes, T.; Flouri, T.; Nichols, B.; Quince, C.; Mahé, F. VSEARCH: A versatile open source tool for metagenomics. PeerJ 2016, 4, e2584. [Google Scholar] [CrossRef]
  42. Edgar, R.C. Search and clustering orders of magnitude faster than BLAST. Bioinformatics 2010, 26, 2460–2461. [Google Scholar] [CrossRef]
  43. Shannon, C.E.; Weaver, W. The Mathematical Theory of Communication; University of Illinois Press: Urbana, IL, USA, 1949. [Google Scholar]
  44. Bambaradeniya, C.N.B.; Edirisinghe, J.P. Composition, structure and dynamics of arthropod communities in a rice agro-ecosystem. Cey. J. Sci. (Biol. Sci.) 2009, 37, 23–48. [Google Scholar] [CrossRef]
  45. McCracken, G.F.; Westbrook, J.K.; Brown, V.A.; Eldridge, M.; Federico, P.; Kunz, T.H. Bats track and exploit changes in insect pest populations. PLoS ONE 2012, 7, e43839. [Google Scholar] [CrossRef]
  46. Mollot, G.; Duyck, P.F.; Lefeuvre, P.; Lescourret, F.; Martin, J.F.; Piry, S.; Canard, E.; Tixier, P. Cover cropping alters the diet of arthropods in a banana plantation: A metabarcoding approach. PLoS ONE 2014, 9, e93740. [Google Scholar] [CrossRef] [PubMed]
  47. Llaneza, L.; López-Bao, J.V. Indirect effects of changes in environmental and agricultural policies on the diet of wolves. Eur. J. Wildl. Res. 2015, 61, 895–902. [Google Scholar] [CrossRef]
  48. Aizpurua, O.; Budinski, I.; Georgiakakis, P.; Gopalakrishnan, S.; Ibañez, C.; Mata, V.; Rebelo, H.; Russo, D.; Szodoray-Parádi, F.; Zhelyazkova, V.; et al. Agriculture shapes the trophic niche of a bat preying on multiple pest arthropods across Europe: Evidence from DNA metabarcoding. Mol. Ecol. 2018, 27, 815–825. [Google Scholar] [CrossRef] [PubMed]
  49. Benhadi-Marín, J.; Pereira, J.A.; Sousa, J.P.; Santos, S.A. Distribution of the spider community in the olive grove agroecosystem (Portugal): Potential bioindicators. Agr. For. Entomol. 2020, 22, 10–19. [Google Scholar] [CrossRef]
  50. Nyffeler, M.; Birkhofer, K. An estimated 400–800 million tons of prey are annually killed by the global spider community. Sci. Nat. 2017, 104, 30. [Google Scholar] [CrossRef]
  51. Nyffeler, M. Ecological impact of spider predation: A critical assessment of Bristowe’s and Turnbull’s estimates. Bull. Br. Arachnol. Soc. 2000, 11, 367–373. [Google Scholar]
  52. Venturino, E.; Isaia, M.; Bona, F.; Chatterjee, S.; Badino, G. Biological controls of intensive agroecosystems: Wanderer spiders in the Langa Astigiana. Ecol. Complex. 2008, 5, 157–164. [Google Scholar] [CrossRef]
  53. Hoefler, C.D.; Chen, A.; Jakob, E.M. The potential of a jumping spider, Phidippus clarus, as a biocontrol agent. J. Econ. Entomol. 2006, 99, 432–436. [Google Scholar] [CrossRef]
  54. Phartale, N.N.; Bhede, B.V.; Patait, D.D.; Kadam, T.A.; Gyananath, G. Pest control potential of four predatory spiders from soybean fields. J. Entomol. Res. 2019, 43, 367–370. [Google Scholar] [CrossRef]
  55. Lin, Y.; Zhou, X.Z.; Bi, S.D.; Zou, Y.D.; Ma, F.; Cheng, X.N.; Ke, L.; Yang, L.; Guo, H. The dominant species of predatory natural enemies of three kinds of planthoppers and impact of pesticides on natural enemies in paddy field. Acta Ecol. Sin. 2013, 33, 2189–2199. [Google Scholar] [CrossRef]
  56. Cuff, J.P.; Drake, L.E.; Tercel, M.P.; Stockdale, J.E.; Orozco-terWengel, P.; Bell, J.R.; Vaughan, I.P.; Müller, C.T.; Symondson, W.O. Money spider dietary choice in pre- and post-harvest cereal crops using metabarcoding. Ecol. Entomol. 2021, 46, 249–261. [Google Scholar] [CrossRef]
  57. Drake, L.E.; Cuff, J.P.; Young, R.E.; Marchbank, A.; Chadwick, E.A.; Symondson, W.O. An assessment of minimum sequence copy thresholds for identifying and reducing the prevalence of artefacts in dietary metabarcoding data. Methods Ecol. Evol. 2022, 13, 694–710. [Google Scholar] [CrossRef]
  58. Weiss, S.; Amir, A.; Hyde, E.R.; Metcalf, J.L.; Song, S.J.; Knight, R. Tracking down the sources of experimental contamination in microbiome studies. Genome Biol. 2014, 15, 564. [Google Scholar] [CrossRef] [PubMed]
  59. Krehenwinkel, H.; Kennedy, S.R.; Adams, S.A.; Stephenson, G.T.; Roy, K.; Gillespie, R.G. Multiplex PCR targeting lineage-specific SNPs: A highly efficient and simple approach to block out predator sequences in molecular gut content analysis. Methods Ecol. Evol. 2019, 10, 982–993. [Google Scholar] [CrossRef]
  60. Michalko, R.; Uhrinec, M.; Khum, W.; Sentenská, L. The benefits of intraguild predation for a top predator spider. Ecol. Entomol. 2021, 46, 283–291. [Google Scholar] [CrossRef]
  61. Guo, Y.J.; Wang, N.Y.; Jiang, J.W. Ecological significance of neutral insects as nutrient bridge for predators in irrigated rice arthropod community. Chin. J. Biol. Control. 1995, 11, 5. [Google Scholar]
  62. Toft, S.; Wise, D.H. Growth, development, and survival of a generalist predator fed single- and mixed-species diets of different quality. Oecologia 1999, 119, 191–197. [Google Scholar] [CrossRef]
  63. Li, J.; Yang, F.; Wang, Q.; Pan, H.; Yuan, H.; Lu, Y. Predation by generalist arthropod predators on Apolygus lucorum (Hemiptera: Miridae): Molecular gut-content analysis and field-cage assessment. Pest Manag. Sci. 2017, 73, 628–635. [Google Scholar] [CrossRef]
Figure 1. Relative abundance and population dynamics of predatory arthropods. The relative abundance of predatory arthropods is quantified as the proportion of the number of individuals of a specific species to the total number of predatory arthropods within a given sampling event.
Agriculture 15 01235 g001
Figure 2. Relative abundance and population dynamics of rice pests. The relative abundance of pests is quantified as the proportion of the number of individuals of a specific species to the total number of pests within a given sampling event.
Agriculture 15 01235 g002
Figure 3. Population dynamic relationships between Tetragnatha keyserlingi Simon and major rice pests. Population dynamics were constructed based on the number of individuals of each species recorded in each quadrat during each sampling event, with the upper and lower bounds of the curve indicating the standard error.
Agriculture 15 01235 g003
Figure 4. Comparison of the relative abundance of prey reads obtained from spider opisthosoma and spider webs with those of other reads. (a) Spider opisthosoma. (b) Spider web. The error bars represent the standard error (SE). “ns” indicates no significant difference. Asterisk indicates a significant difference based on post hoc multiple comparisons using the Kruskal–Wallis test with Dunn’s correction (**** p < 0.0001).
Agriculture 15 01235 g004
Figure 5. Comparison of prey species between spider opisthosoma and spider webs. (a) Venn diagram of prey species obtained from spider opisthosoma and the spider web samples. (b) Comparison of the number of prey species obtained from each spider opisthosoma and the spider web sample. SO: spider opisthosoma; SW: spider web. Asterisk indicates a significant difference according to post hoc comparisons using the Mann–Whitney U test (*** p < 0.001).
Agriculture 15 01235 g005
Figure 6. Comparison of the diversity and read abundance of pests identified from spider opisthosoma and spider webs with those of other prey taxa. (a,b) Spider opisthosoma. (c,d) Spider web. The error bars represent the SE. “ns” indicates no significant difference. Asterisk indicates a significant difference based on post hoc multiple comparisons using the Kruskal–Wallis test with Dunn’s correction (* p < 0.05; **** p < 0.0001).
Agriculture 15 01235 g006
Figure 7. Comparison of the read abundances and positive rates of prey identified at the family level from spider opisthosoma samples and spider web samples. The figure displays the six families with the highest read abundance. (a,b) Spider opisthosoma. (c,d) Spider web. (a,c) One-way ANOVA was employed to compare the read abundances across various prey families. The error bars represent the SE. “ns” indicates no significant difference. Asterisk indicates a significant difference based on post hoc multiple comparisons with Dunn’s T3 correction (* p < 0.05; *** p < 0.001; **** p < 0.0001). (b,d) Fisher’s exact test was employed to compare the differences in positive rates across various prey families (*** p < 0.001; **** p < 0.0001).
Agriculture 15 01235 g007
Disclaimer/Publisher’s Note: The statements, opinions and data contained in all publications are solely those of the individual author(s) and contributor(s) and not of MDPI and/or the editor(s). MDPI and/or the editor(s) disclaim responsibility for any injury to people or property resulting from any ideas, methods, instructions or products referred to in the content.

