Article

Effect of Caragana korshinskii Plantation Succession on Community Stability in Alpine Sandy Regions

1
Qinghai Provincial Key Laboratory of Restoration Ecology for Cold Regions, Northwest Institute of Plateau Biology, Chinese Academy of Sciences, Xining 810001, China
2
School of Chemistry and Chemical Engineering, Qinghai Normal University, Xining 810016, China
3
College of Resources and Environment, University of Chinese Academy of Sciences, Beijing 100049, China
4
Qinghai Key Laboratory of Advanced Technology and Application of Environmental Functional Materials, Xining 810016, China
5
State Key Laboratory of Plateau Ecology and Agriculture, Qinghai University, Xining 810016, China
6
Qinghai Desert Control Experimental Station, Xining 810008, China
*
Author to whom correspondence should be addressed.
Agriculture 2025, 15(11), 1143; https://doi.org/10.3390/agriculture15111143
Submission received: 7 April 2025 / Revised: 18 May 2025 / Accepted: 22 May 2025 / Published: 26 May 2025
(This article belongs to the Special Issue Research on Soil Carbon Dynamics at Different Scales on Agriculture)

Abstract

:
Climate change and intensified human activities have led to plant degradation and land desertification in desert areas, which seriously threaten ecological security. The establishment of the Caragana korshinskii plantation is considered to be one of the important means to improve the ecological environment in thealpine sandy region. This study focuses on Caragana korshinskii plantation in the alpine sandy region of the Qinghai–Tibet Plateau. Adopting a space-for-time substitution approach, six restoration chrono sequences were selected: 0 years, 5 years, 15 years, 25 years, 35 years, and 50 years. By investigating the variations in vegetation community composition and soil properties, we aim to elucidate the plant and soil system interactions under different restoration durations. The findings will clarify the stability evolution patterns of Caragana korshinskii plantation during desertification control and contribute to promoting green development strategies. The main conclusions of this study are as follows: With the passage of planting time, the plant biomass and species diversity of the Caragana korshinskii plantation community showed a trend of first increasing and then decreasing, reaching their peak in 25~35 years. Soil water content exhibited fluctuating trends, while soil organic matter showed progressive accumulation, demonstrating that Caragana korshinskii plantations effectively improved soil fertility. Community stability reaches its maximum (4.98) at 25 years. In summary, the Caragana korshinskii plantation are in an early stage of ecological secondary succession, with plant communities developing from simple to complex structures and gradually approaching, though not yet achieving a stable state.

1. Introduction

Global climate change and human activities have worsened plant degradation, soil erosion, and desertification, threatening ecological security in high-altitude sandy regions and undermining local socio-economic sustainability [1,2]. Ecological sustainability is a key path to address climate change, species extinction, and resource depletion, emphasizing development within the boundaries of the Earth and ensuring the common prosperity of humanity and nature [3]. At present, ecological sustainability is a very broad and vague concept, therefore, there is an urgent need for a more competitive definition. Desertification control is a critical project concerning the sustainable development of humanity. Artificial plant restoration is considered an important means to improve the ecological environment in high-altitude sandy areas [4]. Implementing artificial plant restoration to increase plant coverage, reduce soil erosion, optimize soil properties, promote ecosystem biodiversity and functionality, protect surrounding farmland soil from erosion, reduce mechanical damage to seeds and seedlings, and improve crop survival rates is of great significance in agricultural benefits [3]. With the progression of restoration duration, species diversity progressively increases, community structure becomes more stratified and ultimately evolves into a stable plant community [5,6]. The stability of plant communities is one of the most fundamental functions of ecosystems, and the characteristics and changing patterns of vegetation stability can be reflected through the study of community stability [7]. The stability of communities and plant diversity vary greatly during different stages of succession, and the stability of communities directly reflects the current state of succession [7]. In recent years, more and more people have focused on how to better understand the determinants of ecological stability and predict their temporal fluctuations [8]. With drought growing more frequent and severe in desert zones, ecological resilience is critically undermined [9]. Empirical evidence shows that temporal dynamics mediate how species stability influences community stability [10]. All species in the community make a significant contribution to the stability of the ecosystem, while in the more dominant community, only a few species can promote the overall stability of the community [11]. The dominant species are usually the most stable species in the community and make a great contribution to the stability of the ecological community [12]. Assessing the structural characteristics of biological communities is helpful in revealing the mechanism of ecological restoration and providing a scientific basis for the restoration of degraded ecosystems.
Research on artificial forest succession shows that the speed and direction of community succession are influenced by species selection and management strategies [13]. The introduction of different plant species may lead to different succession pathways. Research has shown that planting certain species can promote the diversity of related plant communities, but there is also a phenomenon of sustained inhibition of species richness and diversity over time [14]. This succession process not only depends on the growth pattern of the species, but is also influenced by the comprehensive effects of soil microbial communities, soil moisture conditions, and climate change [15]. In harsh environments such as mountainous and sandy regions, the stability of plantation faces greater challenges due to extreme natural conditions. This situation requires the urgent selection of pioneer species with strong stress resistance and significant ecological benefits. The harsh environmental conditions in these regions require tree species not only to survive in stressful environments but also to promote the development of ecosystems.
Caragana korshinskii (Fabaceae) is widely used for ecological restoration in alpine sandy regions due to its characteristics of cold and drought resistance, as well as strong soil nitrogen fixation ability [16]. The restoration of ecosystems by Caragana korshinskii plantations is a systematic and prolonged process, with its ecological effects and community succession characteristics significantly influenced by the duration of restoration [9]. In the alpine sandy region, the restoration process of the Caragana korshinskii plantation involves the influence of many ecological factors, including plant community diversity, soil physical and chemical properties, and soil microbial community succession [17]. Some studies showed that the Caragana korshinskii plantation improved soil carbon sink and soil nutrient availability [18]. Caragana korshinskii, a nitrogen-fixing plant, alleviates nitrogen shortage by obtaining nitrogen from the atmosphere, which leads to soil carbon accumulation [19]. At the same time, the belowground grass plant patches provide protection from soil erosion, reduce the removal of litter, and promote soil fertility [20]. The change trends of soil organic carbon and soil total nitrogen were consistent when the artificial Caragana korshinskii was restored to 10 years, 20 years, and 30 years, while soil total phosphorus was not affected by time series age, which further proved that the restoration of Caragana korshinskii plantation was a slow process and needed a longer time to accumulate soil fertility [21]. Currently, research on the temporal scale effects of Caragana korshinskii plantations in restoring ecological functions in alpine sandy regions remains relatively scarce.
Plant communities and soil exhibit complex interactions. Research indicated that Caragana korshinskii directly or indirectly alters soil nutrient content and structure through root decomposition and litter input [22]. Its nitrogen-fixing capability significantly boosts the nitrogen content in the soil, thereby providing essential nutritional support for the growth of subsequent plants [23]. With the succession of plant communities, the nutrient status of soil gradually improved, which provided favorable conditions for the growth of plants in the later stage [15]. At the same time, plant root exudates can promote the formation of soil aggregate structure and improve soil aeration and water retention capacity [24]. As recovery time increases, the diversity and species composition of plant communities undergo dynamic changes, with the plant community gradually becoming more complex and the species richness continually increasing [25]. These changes not only mirror the dynamic processes occurring within the plant community but also underscore the reciprocal feedback mechanism between plants and their soil environment [26].
In this study, the Caragana korshinskii plantation in the alpine sandy region of the Qinghai Tibet Plateau was taken as the research object, using the method of space for time substitution, and taking different restoration years as the main line, six restoration years were selected, including 0 year, 5 years, 15 years, 25 years, 35 years and 50 years. This study examines changes in shrub-herb community structure and soil properties across different restoration periods in the alpine sandy region, revealing plant community dynamics and soil nutrient evolution. Through analyzing the long-term stability of Caragana artificial, this research reveals their ecological succession dynamics on the Tibetan Plateau, providing a scientific basis for sustainable ecosystem restoration and nature-based solutions. To investigate the following aspects under different restoration periods: (1) variation characteristics of community structure in Caragana korshinskii plantation; (2) variation characteristics of soil properties in Caragana korshinskii plantation; (3) variation characteristics of community stability in Caragana korshinskii plantation.

2. Materials and Methods

2.1. Study Area

The study area is located at the Qinghai Sand Control Experimental Station within the GongHe basin in Qinghai Province, situated in Shazhuyu, Gonghe County, Hainan Tibetan Autonomous Prefecture (36°03′~36°18′ N, 100°17′~100°35′ E). It lies on the northeastern edge of the Qinghai–Tibet Plateau, at an elevation of 2870 m, and serves as a transitional zone between the Qaidam basin and the Qinghai Lake watershed (Figure 1). This region belongs to a plateau continental arid climate, with an average annual temperature of 2.6~3.5 °C, an annual precipitation of 246~289 mm, and an annual evaporation of 1800~2200 mm (about 7 times the precipitation). Due to its location in the Gonghe Basin, the degree of groundwater development and utilization is low, resulting in limited water resources in the region [8]. The soil is predominantly aeolian sandy soil, with incomplete profile development. The surface layer has an organic matter content of 0.12~0.35%, total nitrogen of 0.02~0.08%, and a pH value ranging from 8.2 to 9.1 [27]. In the mobile dune area, fine sand (0.1~0.25 mm) makes up 72~85% of the soil particle composition, while clay content is less than 1%, resulting in extremely poor water retention capacity [27]. The plant types are primarily plantations dominated by Caragana korshinskii, Hippophae rhamnoides, and Salix cheilophila, along with some grass species.

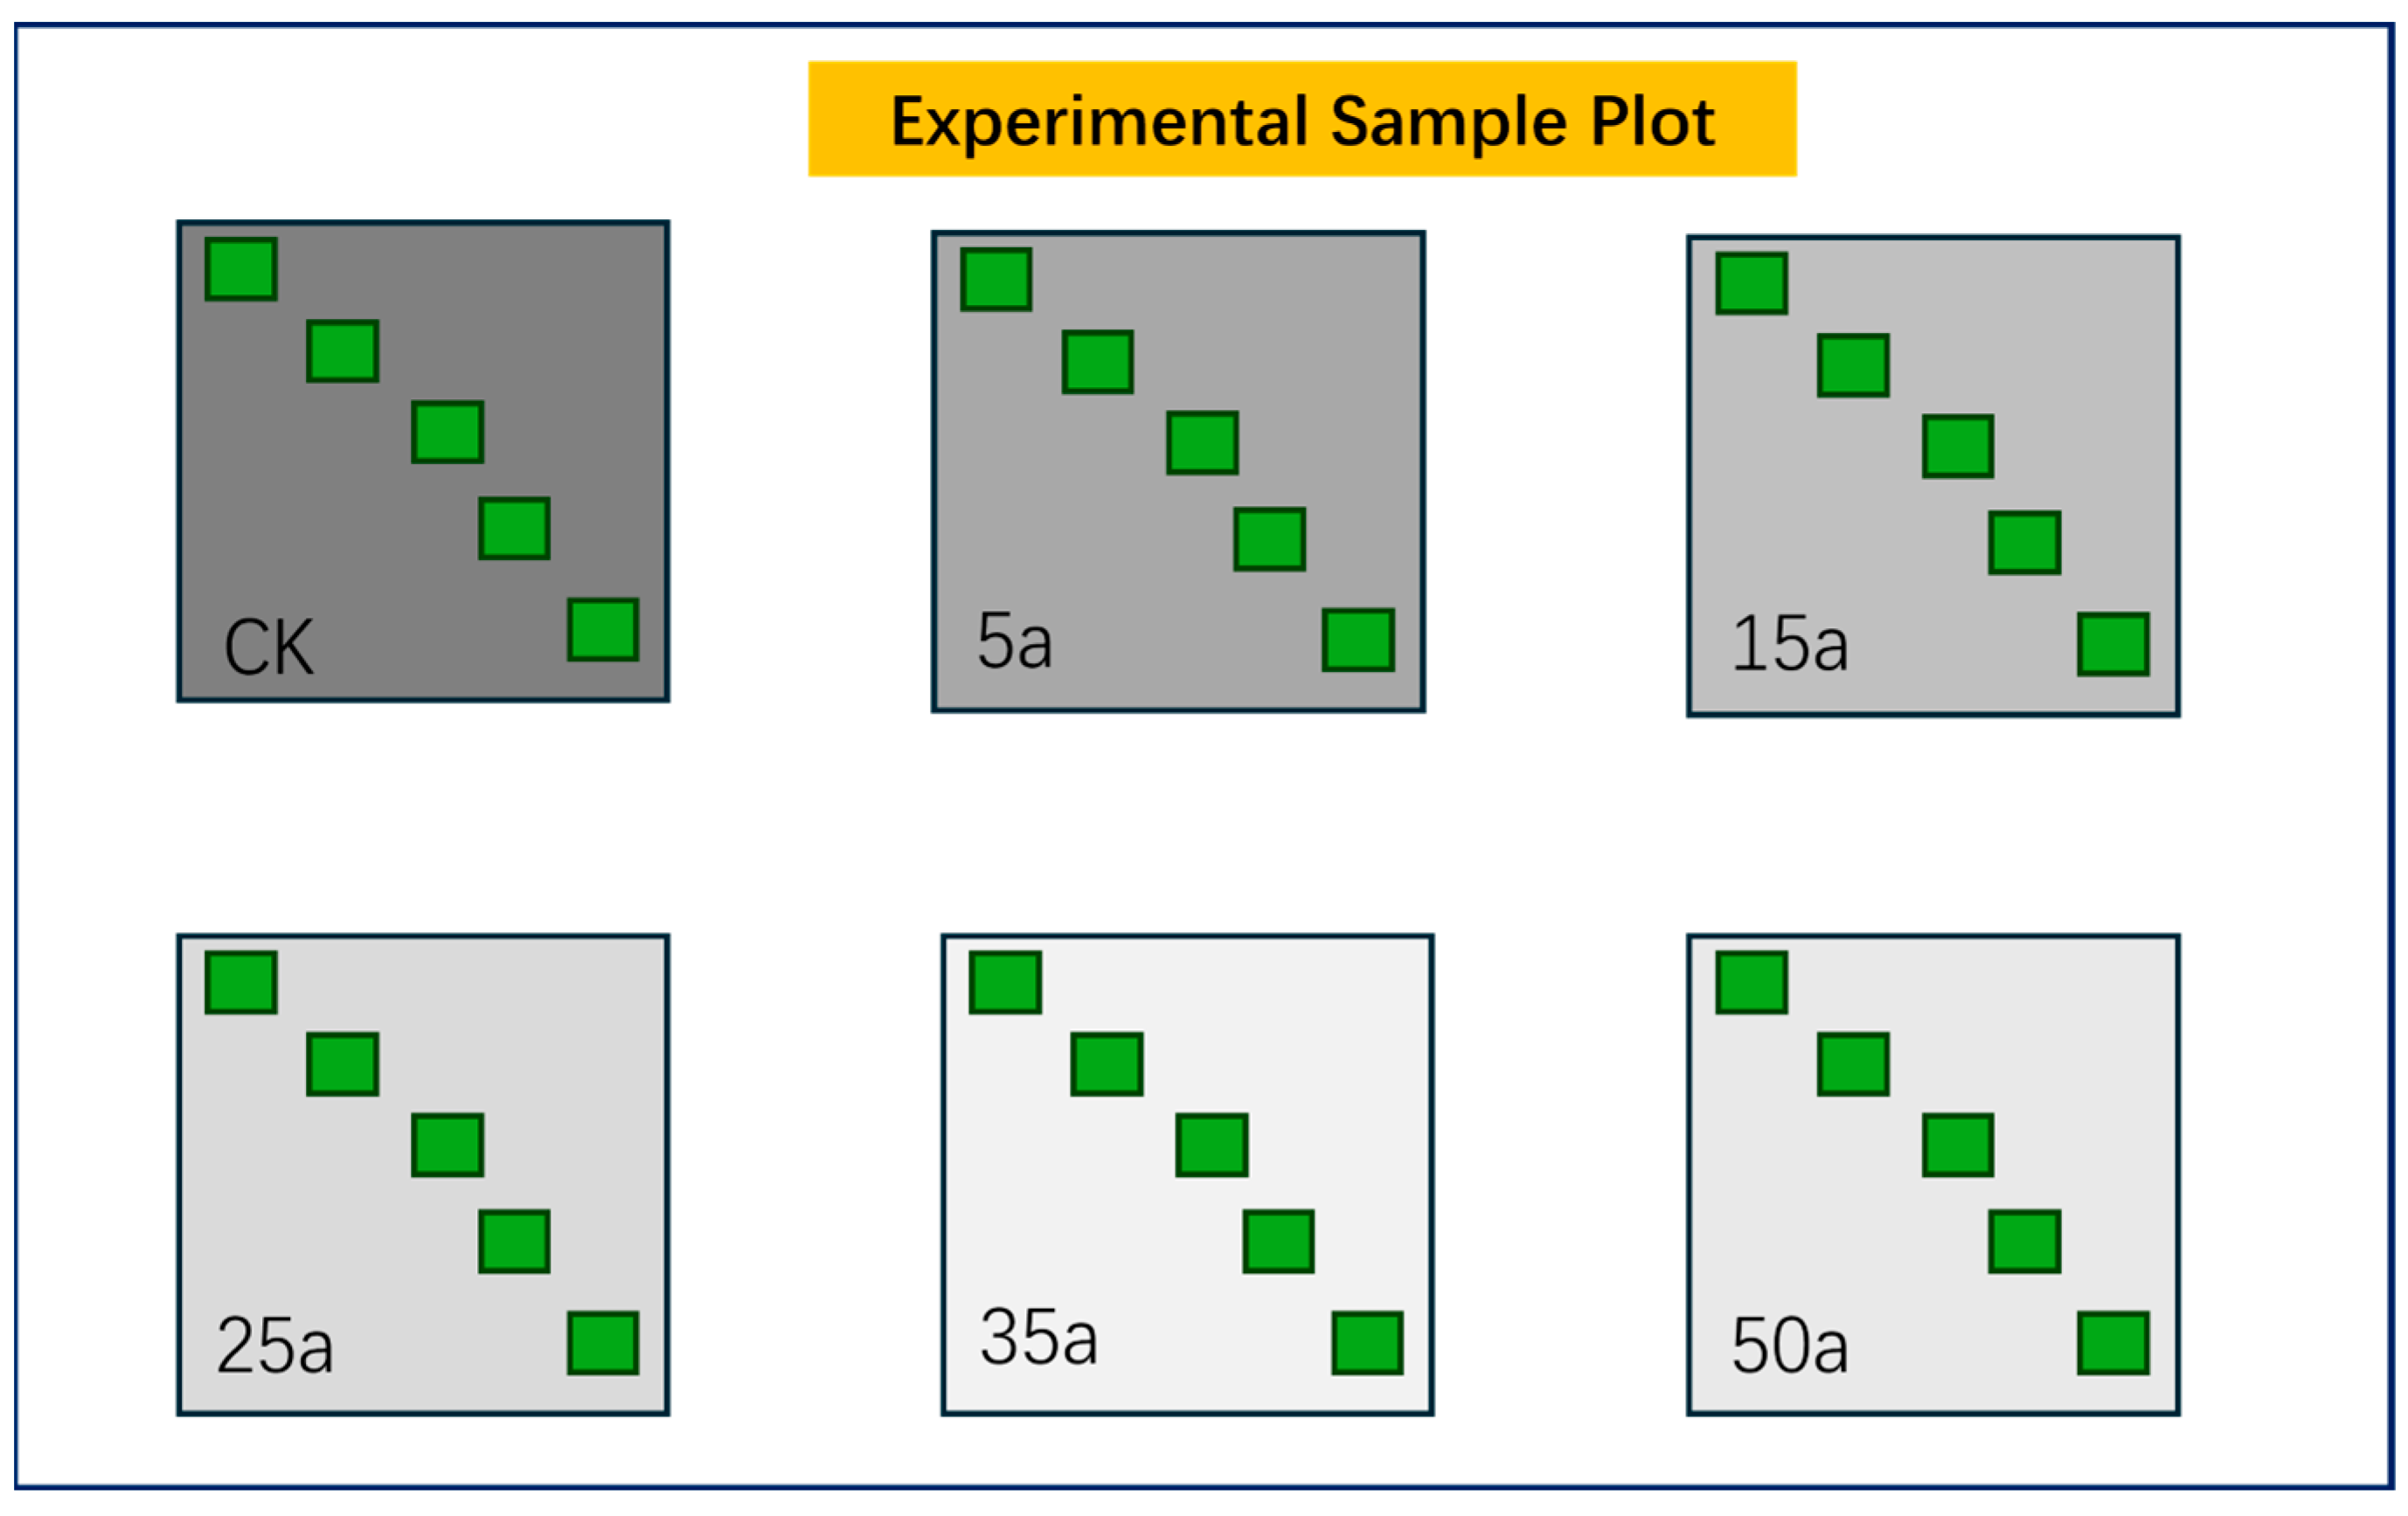
2.2. Experiment and Sampling Design

This study was conducted in long-term experimental plots established at a desertification control station in 1958. Prior to the establishment of the station, the area consisted of continuous mobile dunes with vegetation coverage below 5%. After the station was established, a standardized restoration approach was adopted to sequentially construct Caragana korshinskii plantation experimental plots, ensuring consistent environmental backgrounds among the plots. The Caragana korshinskii plantations were established via direct seeding in 1974, 1989, 1999, 2009, and 2019, forming one control group (0-year) and five restoration treatments (5, 15, 25, 35, and 50 years). Each restoration plot covered approximately 20 mu, with a minimum distance of 500 m between plots. The spacing between rows of Caragana korshinskii is 1 m × 1.5 m, and the forest stands are all pure forests without mixing. Maintain consistent slope direction during the site selection process to ensure as consistent forest conditions as possible. Each recovery period is set to 5 quadrats, and each quadrat is 5 m × 5 m, with a spacing of 20 m between quadrats to minimize edge effects, for a total of 30 plots (Figure 2).

2.3. Plant Sampling and Analysis

From July to early August 2024, plant community composition surveys were conducted in each quadrat, covering both shrub and grass communities. For grass species, a 1 m × 1 m square subplot was placed within each quadrat, and all plant species present in the subplot were recorded. At the peak of vegetative biomass (August), we recorded the species composition, frequency, cover, and height. After the plant survey, aboveground plant biomass was measured by clipping all plants in a 0.50 m × 0.50 m square at the soil surface in each plot. From each plot, two soil cores (diameter 5 cm; depth 30 cm) were collected and carefully washed to obtain fine root samples as belowground biomass. For shrub species, a 5 m × 5 m square subplot was placed within each quadrat, and all Caragana korshinskii present in the subplot were recorded. We recorded the quantity of each Caragana korshinskii, measured their height with a tape measure, and estimated it using the Caragana korshinskii estimation model for biomass estimation. To minimize disturbance to the experimental plots at the desertification control station from extensive sampling, we adopted a validated biomass estimation model. With a verification accuracy exceeding 95%, this model proved suitable for estimating Caragana korshinskii biomass in the study region. The samples were placed in archival bags and transported to the laboratory. They were initially oven-dried at 105 °C for 30 min to deactivate enzymes, then dried at 65 °C for 48 h until a constant weight was achieved. Finally, the biomass was weighed using an electronic balance with a precision of 0.001 g.
The biomass estimation model for Caragana korshinskii is as follows [28].
W B = 1.054 H 3.124
W R = 1.302 H 2.638
where WB is the aboveground biomass of Caragana korshinskii; WR is the belowground biomass of Caragana korshinskii; H is the average height of Caragana korshinskii.
Plant diversity was estimated according to the richness index (R), Shannon–Wiener index (H), Simpson index (D), and Evenness index (J), using the following formula [28]:
R = S
H = i = 1 S P i I n P i
D = 1 i = 1 S P i 2
J = H I n ( S )
where S is the total number of species; i represents various species within the sample plot; Pi is the relative importance value of species i.
The specific calculation of plant community stability is as follows [29]:
I C V = μ σ
where ICV represents the stability of plant communities; μ represents the average density of each species within the sample plot; and σ represents the standard deviation of density for each species. The larger the ICV value, the higher the community stability; that is, the density variability of each species is smaller.

2.4. Soil Sampling and Analysis

We analyzed the soil properties of the soil layer (0~60 cm) under different response years. Soil bulk density (BD) is determined using the ring knife method and determination of soil pH using the potentiometric method [30]. Soil water content (SWC) was calculated by oven-drying the soil samples at 110 °C for 10 h. Soil organic matter (SOM) was determined using the volumetric method, with potassium dichromate. Soil available phosphorus (AVP) was determined by the molybdenum-antimony colorimetric method, and soil available nitrogen (AN) was measured by the sulfate extraction method [30].

2.5. Data Processing and Analysis

All data organization and analysis were conducted in Excel and SPSS 25.0. The experimental data in this paper followed a normal distribution and passed the homogeneity of variance test. ArcGIS 10.7 was used to draw the study area map, and all other figures were completed in Origin 2023 and R4.0.4. One-way ANOVA was used to test the significance of differences in community biomass, community diversity index, and soil properties at different planting periods. The effect of Caragana korshinskii plantation succession on community stability in alpine sandy regions was analyzed with structural equation modeling using the “piecewiseSEM” package (Version: 2.3.0.1). The final model was selected based on a nonsignificant χ2 test result (p > 0.05), a low Akaike Information Criterion (AIC) value, a low root mean square error of approximation (RMSEA ≤ 0.10), a high goodness of fit index (GFI > 0.90), and a high comparative fit index (CFI > 0.90) [31].

3. Results

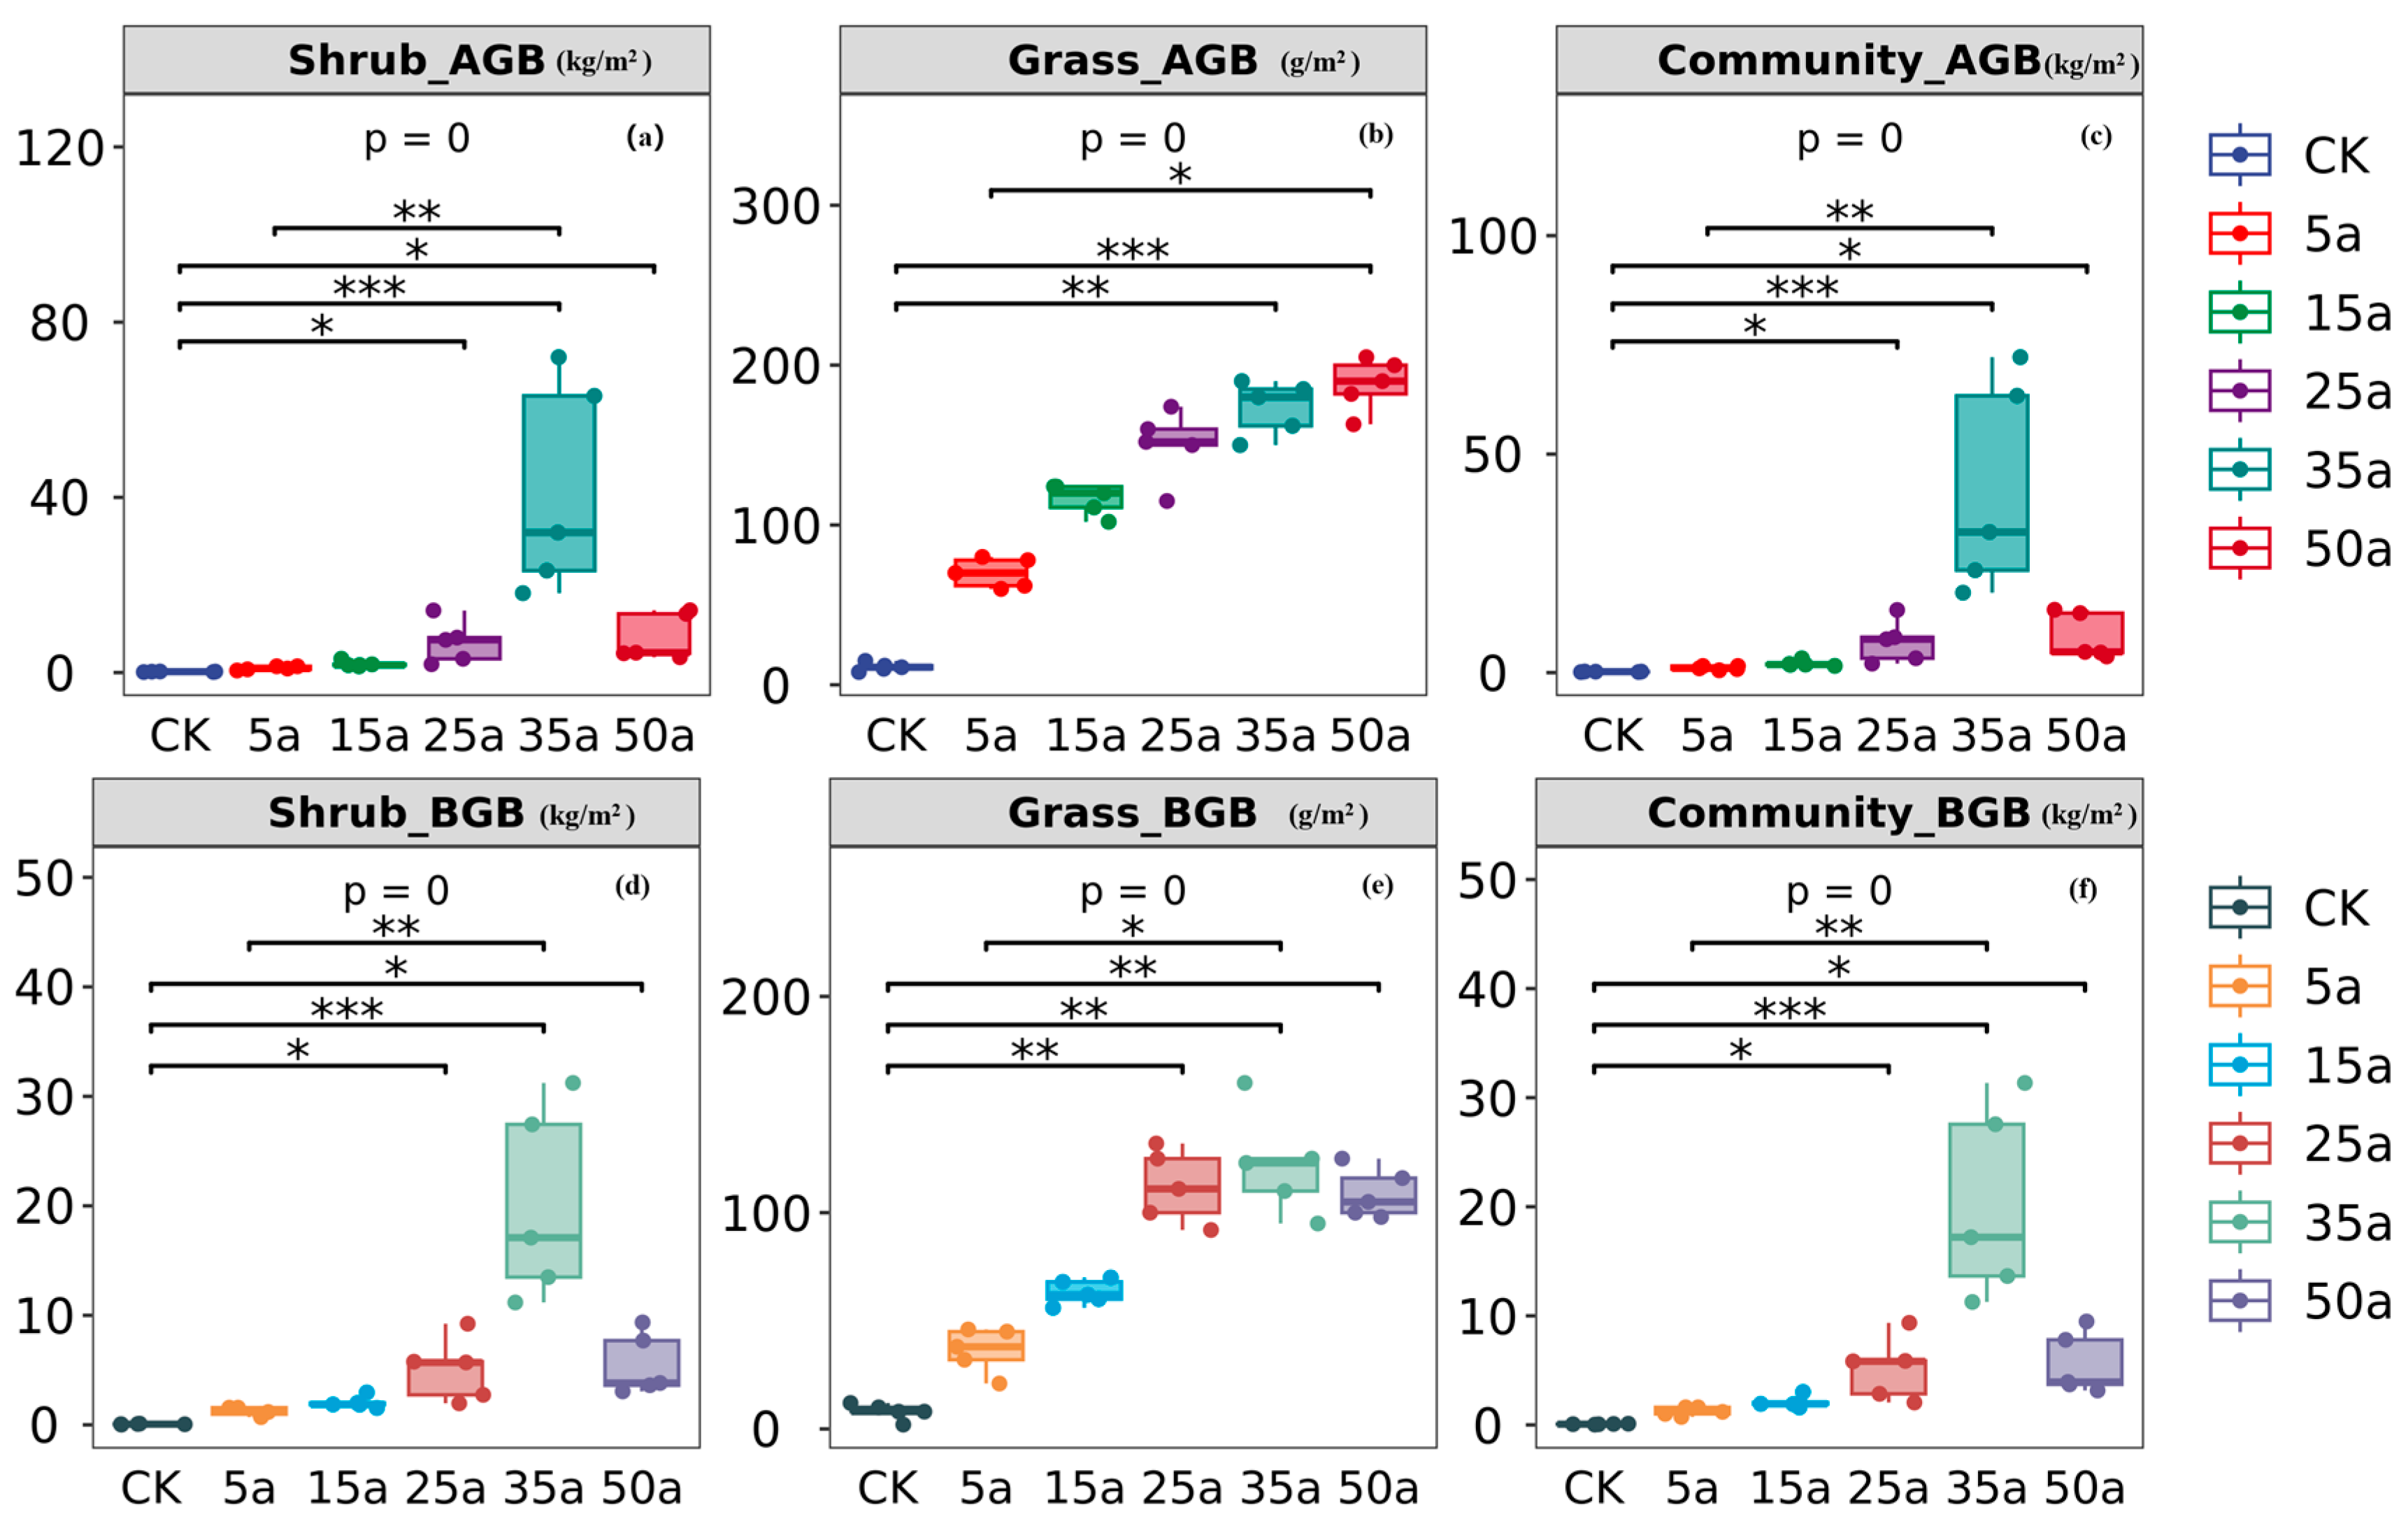
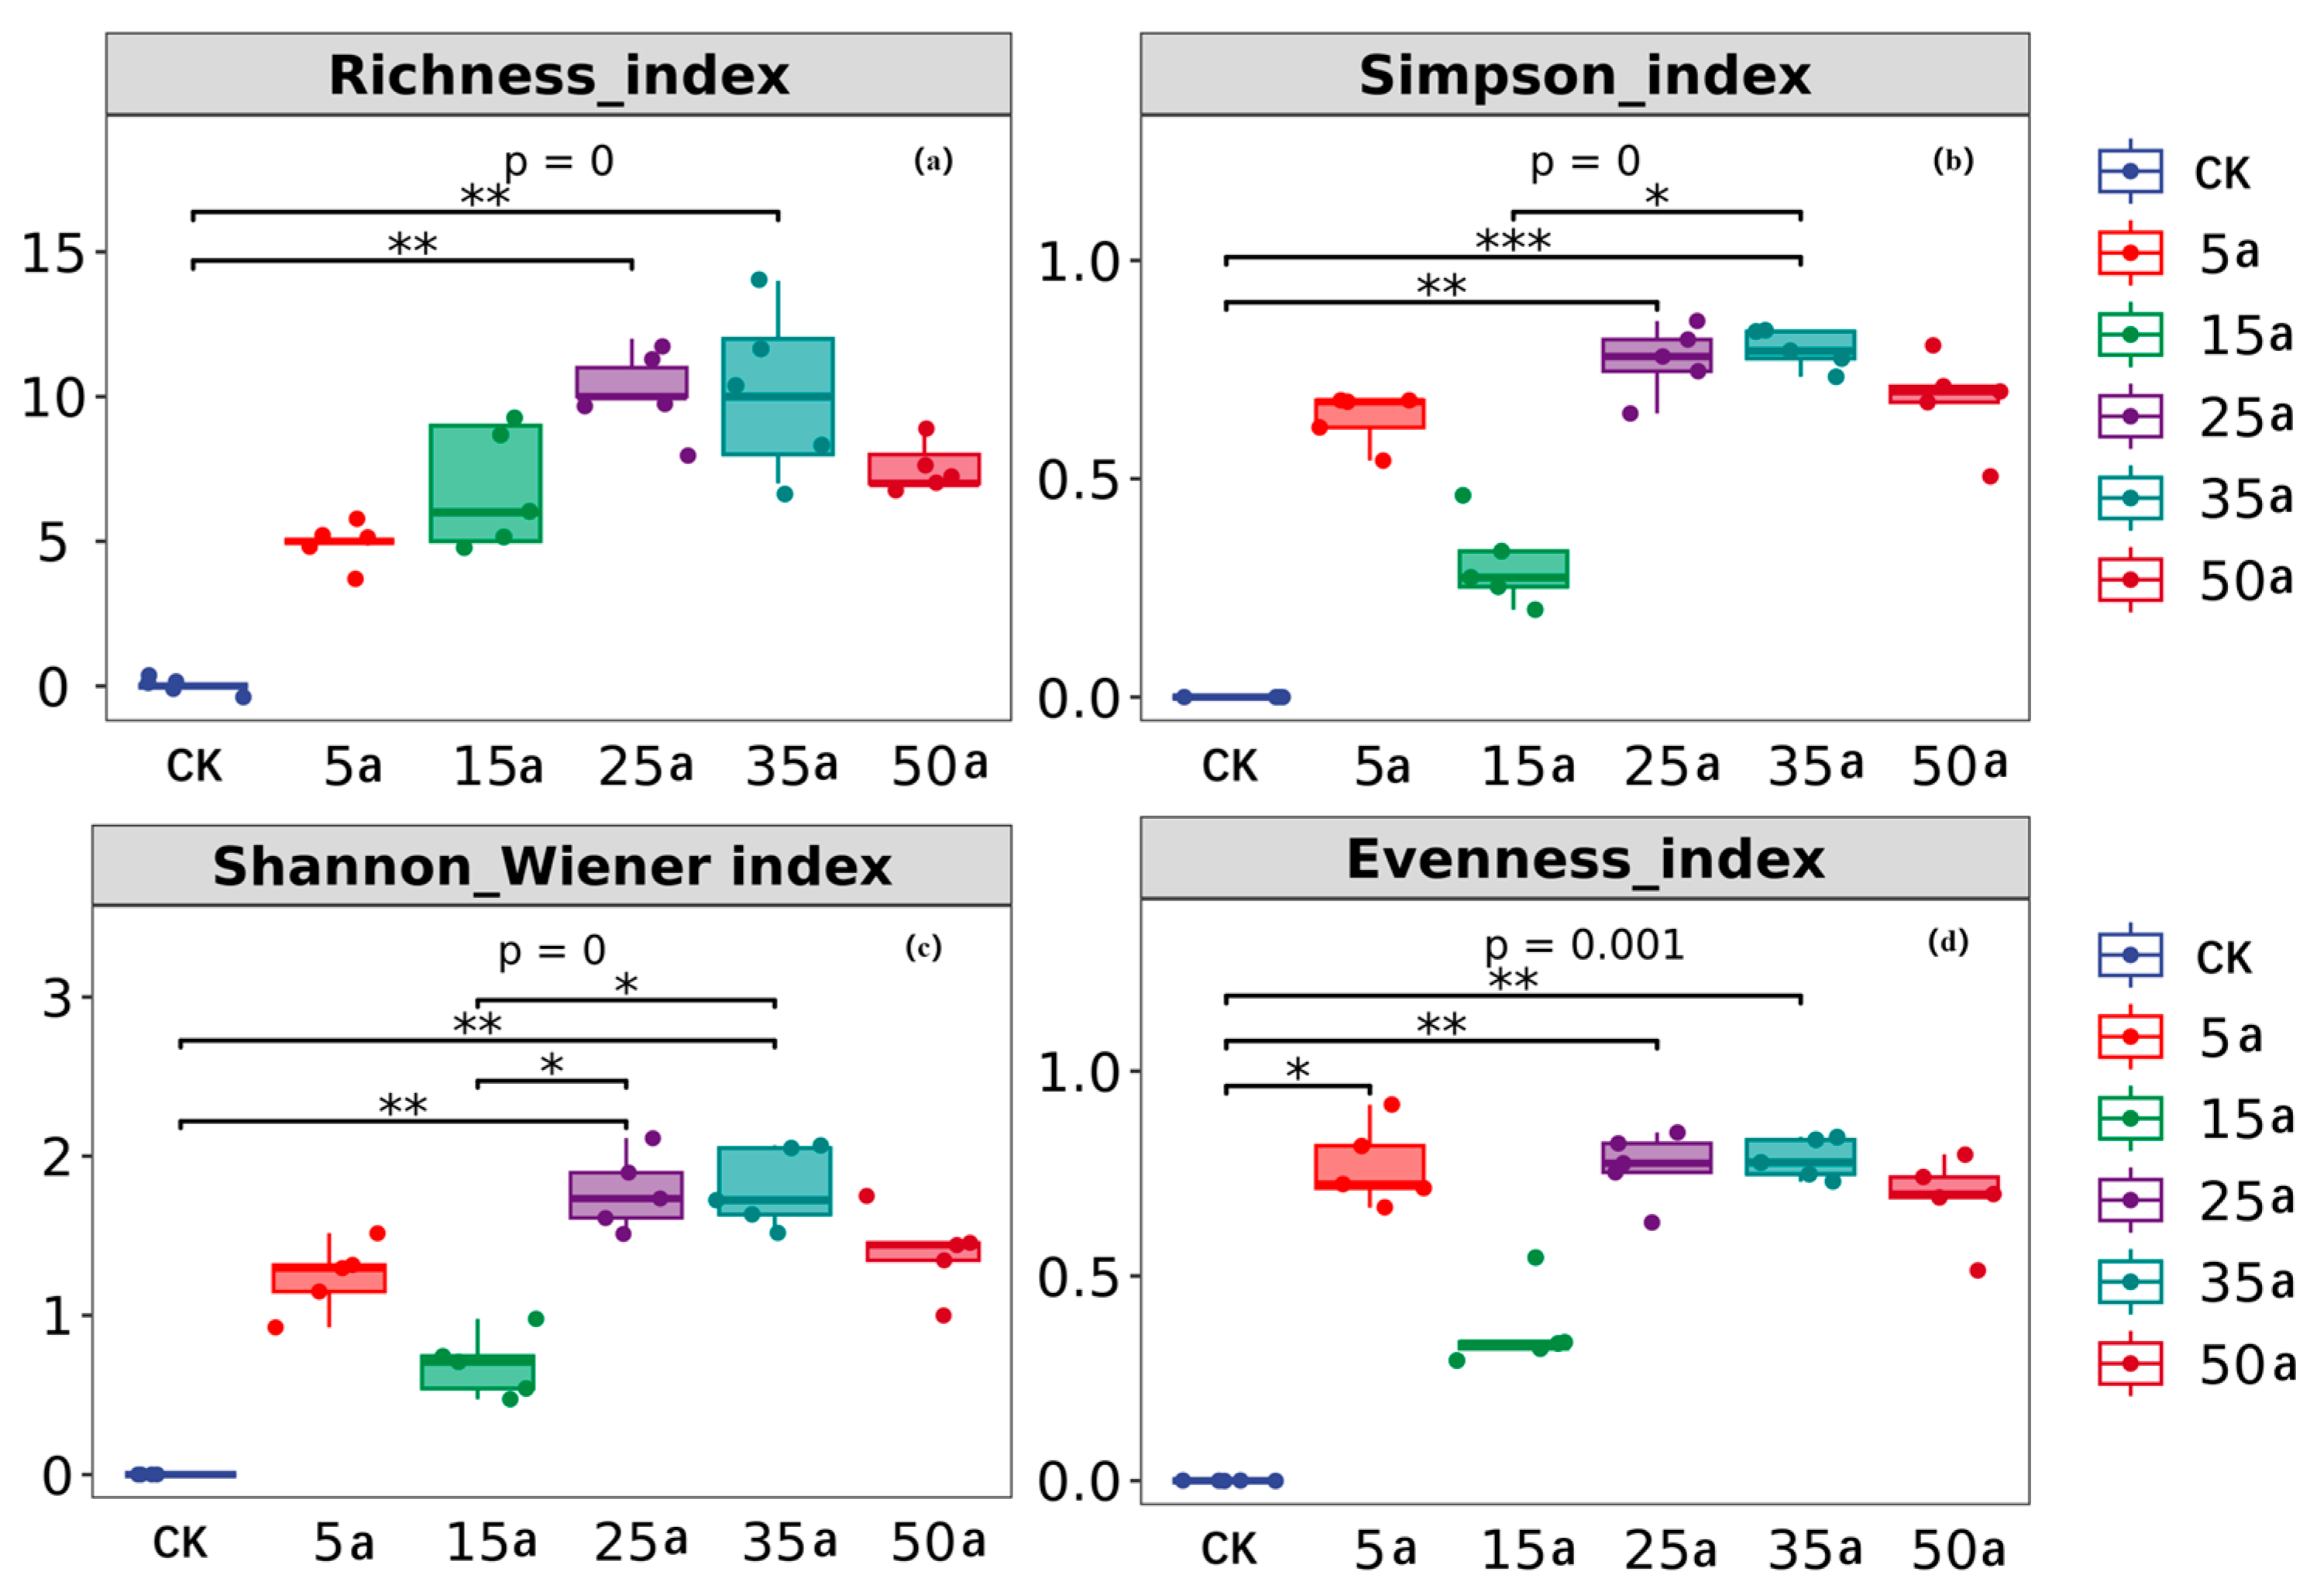
3.1. Change Characteristics in Artificial Caragana Microphylla Plant Communities

Under different restoration years, the plant community is mainly composed of shrubs and grass. There are significant differences in the above- and below-ground biomass of the shrub (Caragana korshinskii) and grass (p < 0.001). The maximum aboveground biomass of shrubs was 41.72 kg/m2 at 35 years of restoration (Figure 3a). Compared with the control, there was a significant difference (p < 0.01) in the aboveground biomass of the grass after 35 and 50 years of artificial Caragana korshinskii restoration, and the aboveground biomass of the grass continued to increase with the passage of restoration time. The maximum biomass was 188 g/m2 at 50 years of restoration (Figure 3b). In the 35th year of restoration, the total aboveground biomass of the community plant was the highest, at 41.908 kg/m2 (Figure 3c). There were significant differences (p < 0.05) in the belowground biomass of Caragana korshinskii under different restoration years, and the belowground biomass of Caragana korshinskii was also the highest at 20.08 kg/m2 in the 35th year of restoration (Figure 3d). There were also significant differences (p < 0.05) in the belowground biomass of grass. After 35 years of restoration, the belowground biomass of grass was the highest, at 122.6 g/m2 (Figure 3e). The belowground biomass of the community reached its maximum value of 20.21 kg/m2 in the 35th year of restoration (Figure 3f). In summary, in the 35 years of restoration, the above- and below-ground biomass of the Caragana korshinskii plantation was at its maximum values. There were significant differences (p < 0.001) in the species diversity index of the community plant under different restoration years (Figure 4). The Richness index reaches its maximum value at 25 years of recovery, while the Shannon–Wiener index, Simpson index, and Evenness index all reach their maximum values at 35 years of recovery.
With the increase in planting duration, there existed a correlation between the aboveground and belowground productivity of the community plant and the species diversity index (Figure 5). In the control treatment (0 year), the belowground biomass of the community showed a significant negative correlation with the Shannon–Wiener index (p < 0.05). After five years of Caragana korshinskii restoration, a significant positive correlation was observed between the Richness index and the Simpson index, as well as between the Evenness index and the aboveground biomass (p < 0.01). When the Caragana korshinskii was restored for 15 years, a significant positive correlation (p < 0.05) was observed between the Evenness index and the aboveground and belowground biomass, as well as between the Richness index and the Simpson index. After 25 years of restoration, a significant positive correlation was noted between the Simpson index and the Richness index, along with a significant correlation between the Evenness index and both the aboveground and belowground biomass of the community (p < 0.05). At the 35-year restoration mark, significant positive correlations were found between the Richness index and the Simpson index, between the Evenness index and the aboveground biomass, and between the Shannon–Wiener index and the aboveground biomass (p < 0.05). Finally, after 50 years of restoration, significant positive correlations (p < 0.05) were identified between the Richness index and the Simpson index, between the Shannon–Wiener index and the Richness index, between the aboveground biomass and the belowground biomass, and between the combined aboveground and belowground biomass and the Evenness index.

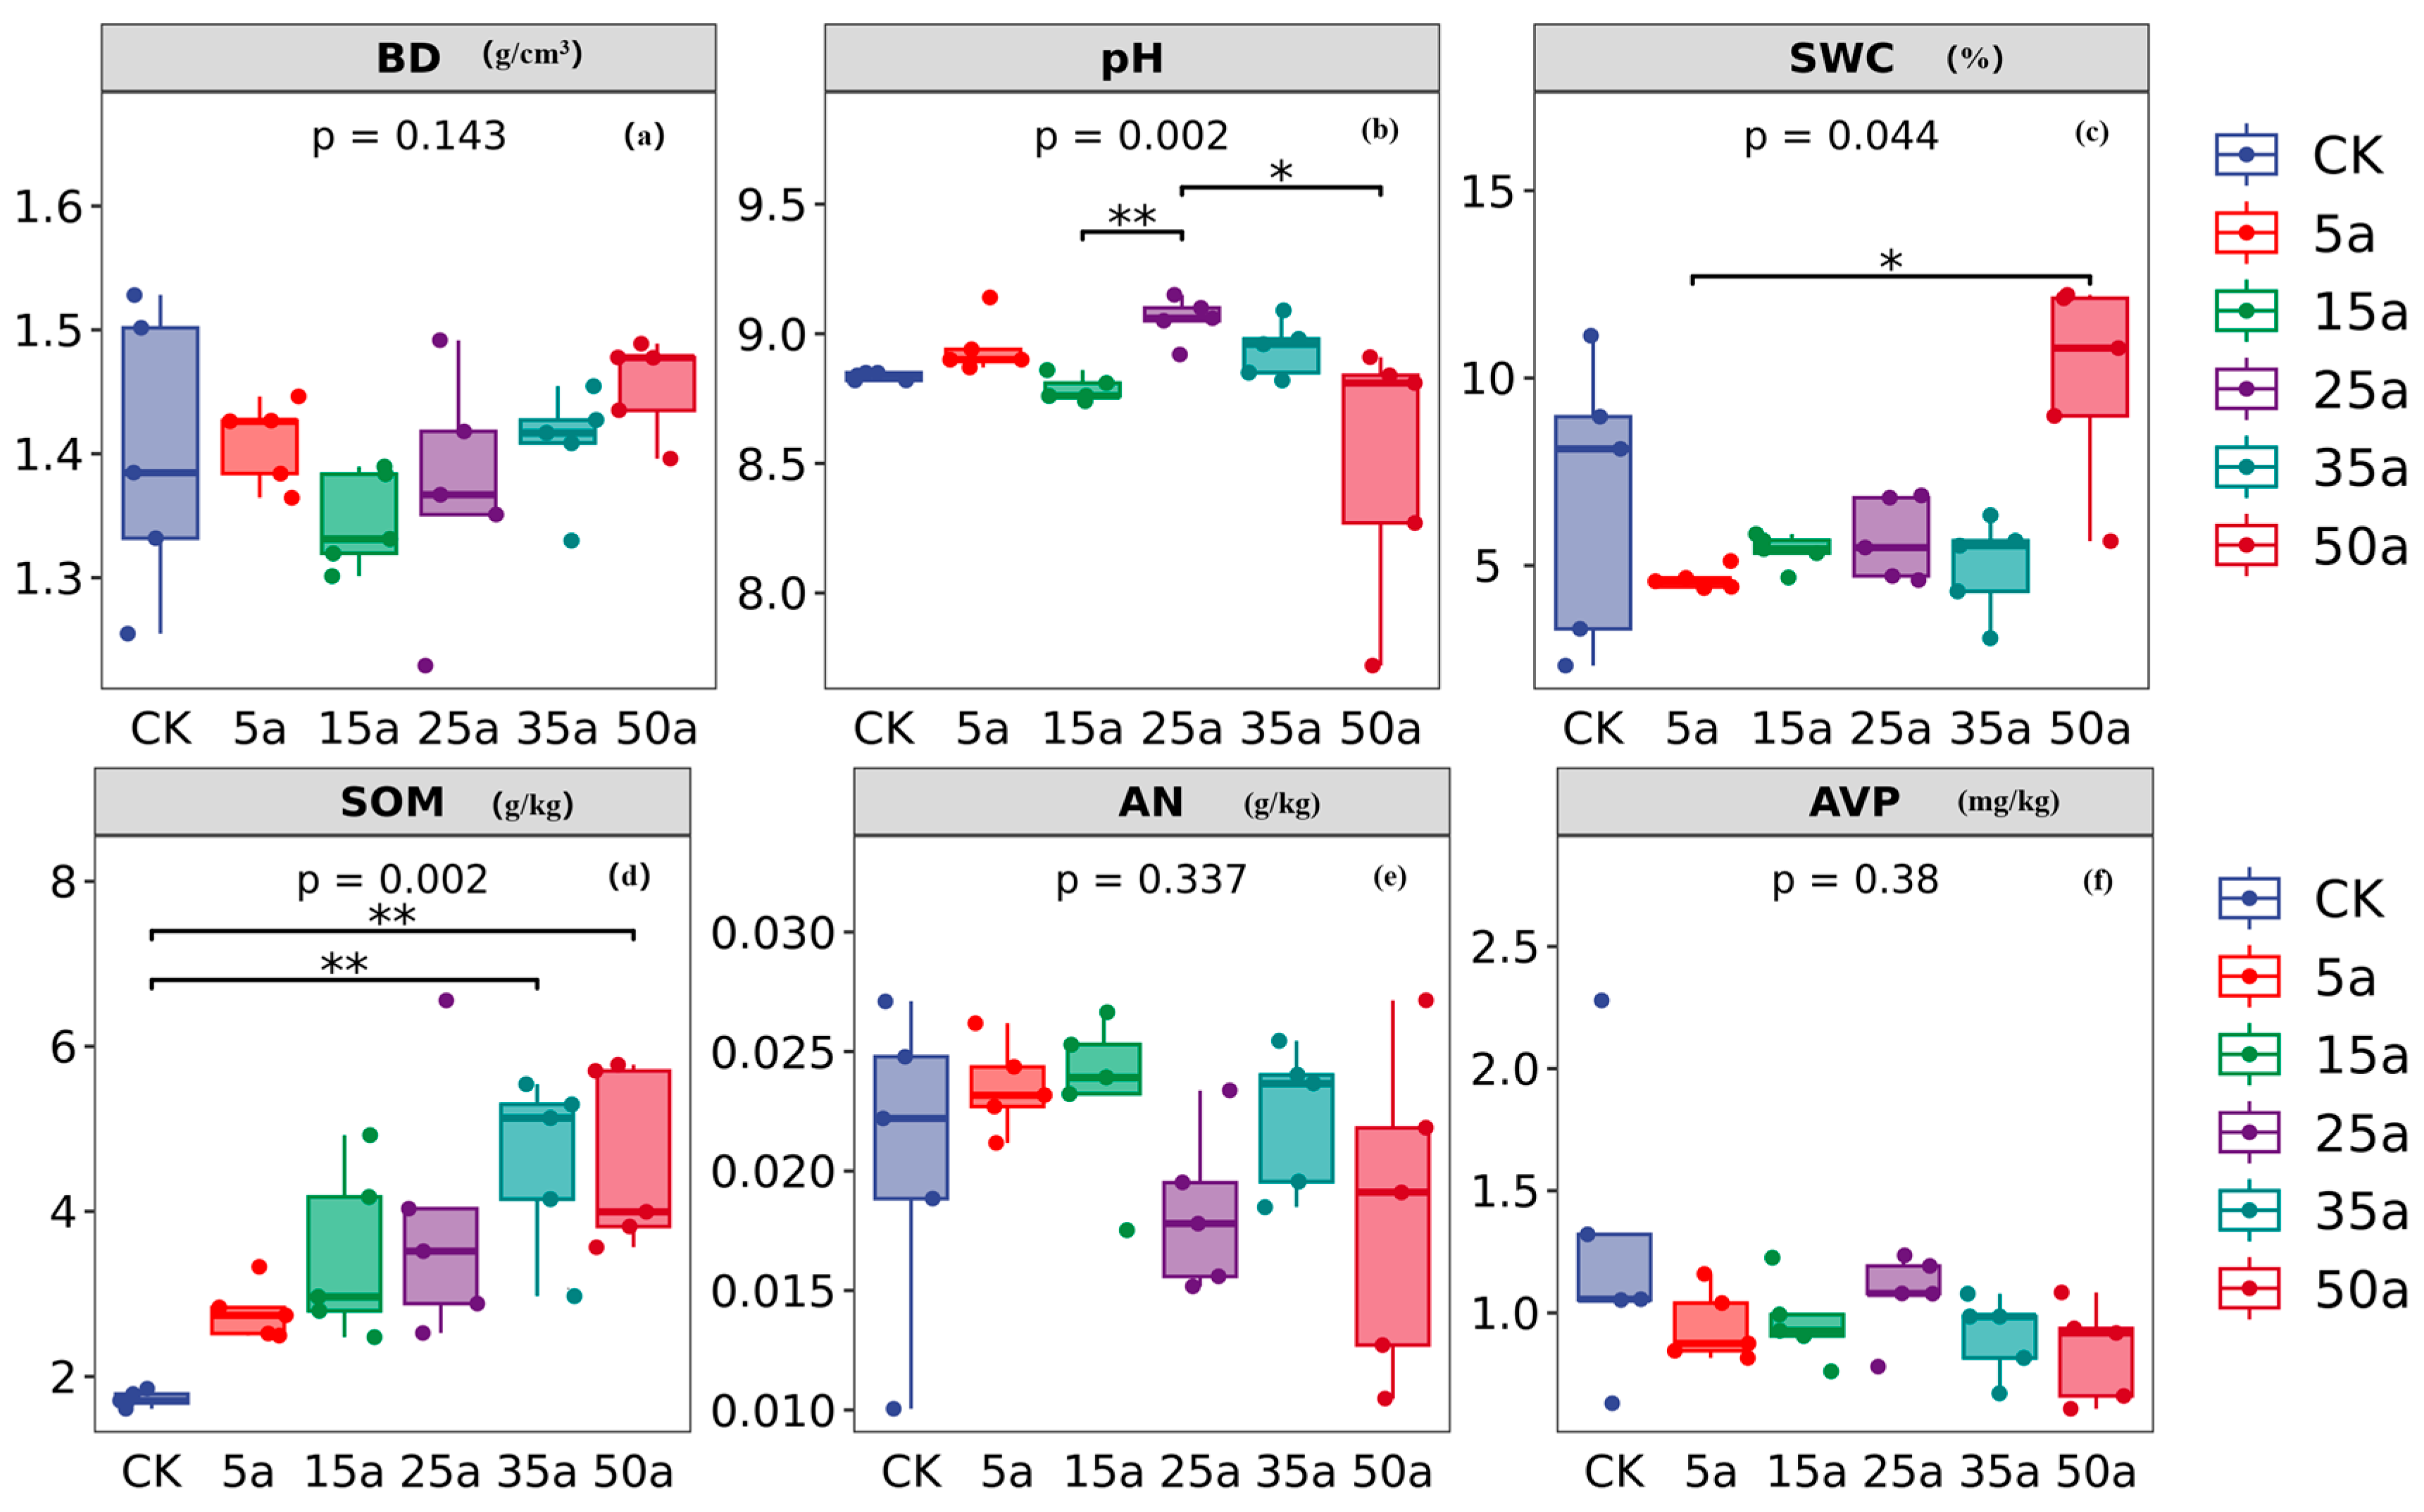
3.2. Change Characteristics of Soil Properties in Artificial Caragana Microphylla

The soil bulk density, available nitrogen, and available phosphorus content in Caragana korshinskii plantations exhibited no significant differences across various restoration periods (p > 0.05; Figure 6a,e,f). However, significant differences in soil pH were observed between the 15-year and 25-year restoration periods, as well as between the 25-year and 50-year periods (p < 0.01; Figure 6b). Additionally, the soil moisture content displayed significant differences between the 5-year and 50-year restoration periods (p < 0.05; Figure 6c). Compared to the control treatment, significant differences in soil organic matter content were identified in Caragana korshinskii plantations restored for 35 years and 50 years (p < 0.01; Figure 6d). There is a certain correlation between vegetation biomass and soil properties (Figure 7). Both plants’ aboveground and belowground biomass show positive correlations with soil pH, bulk density, soil organic matter, and available nitrogen content while exhibiting negative correlations with soil water content and available phosphorus.

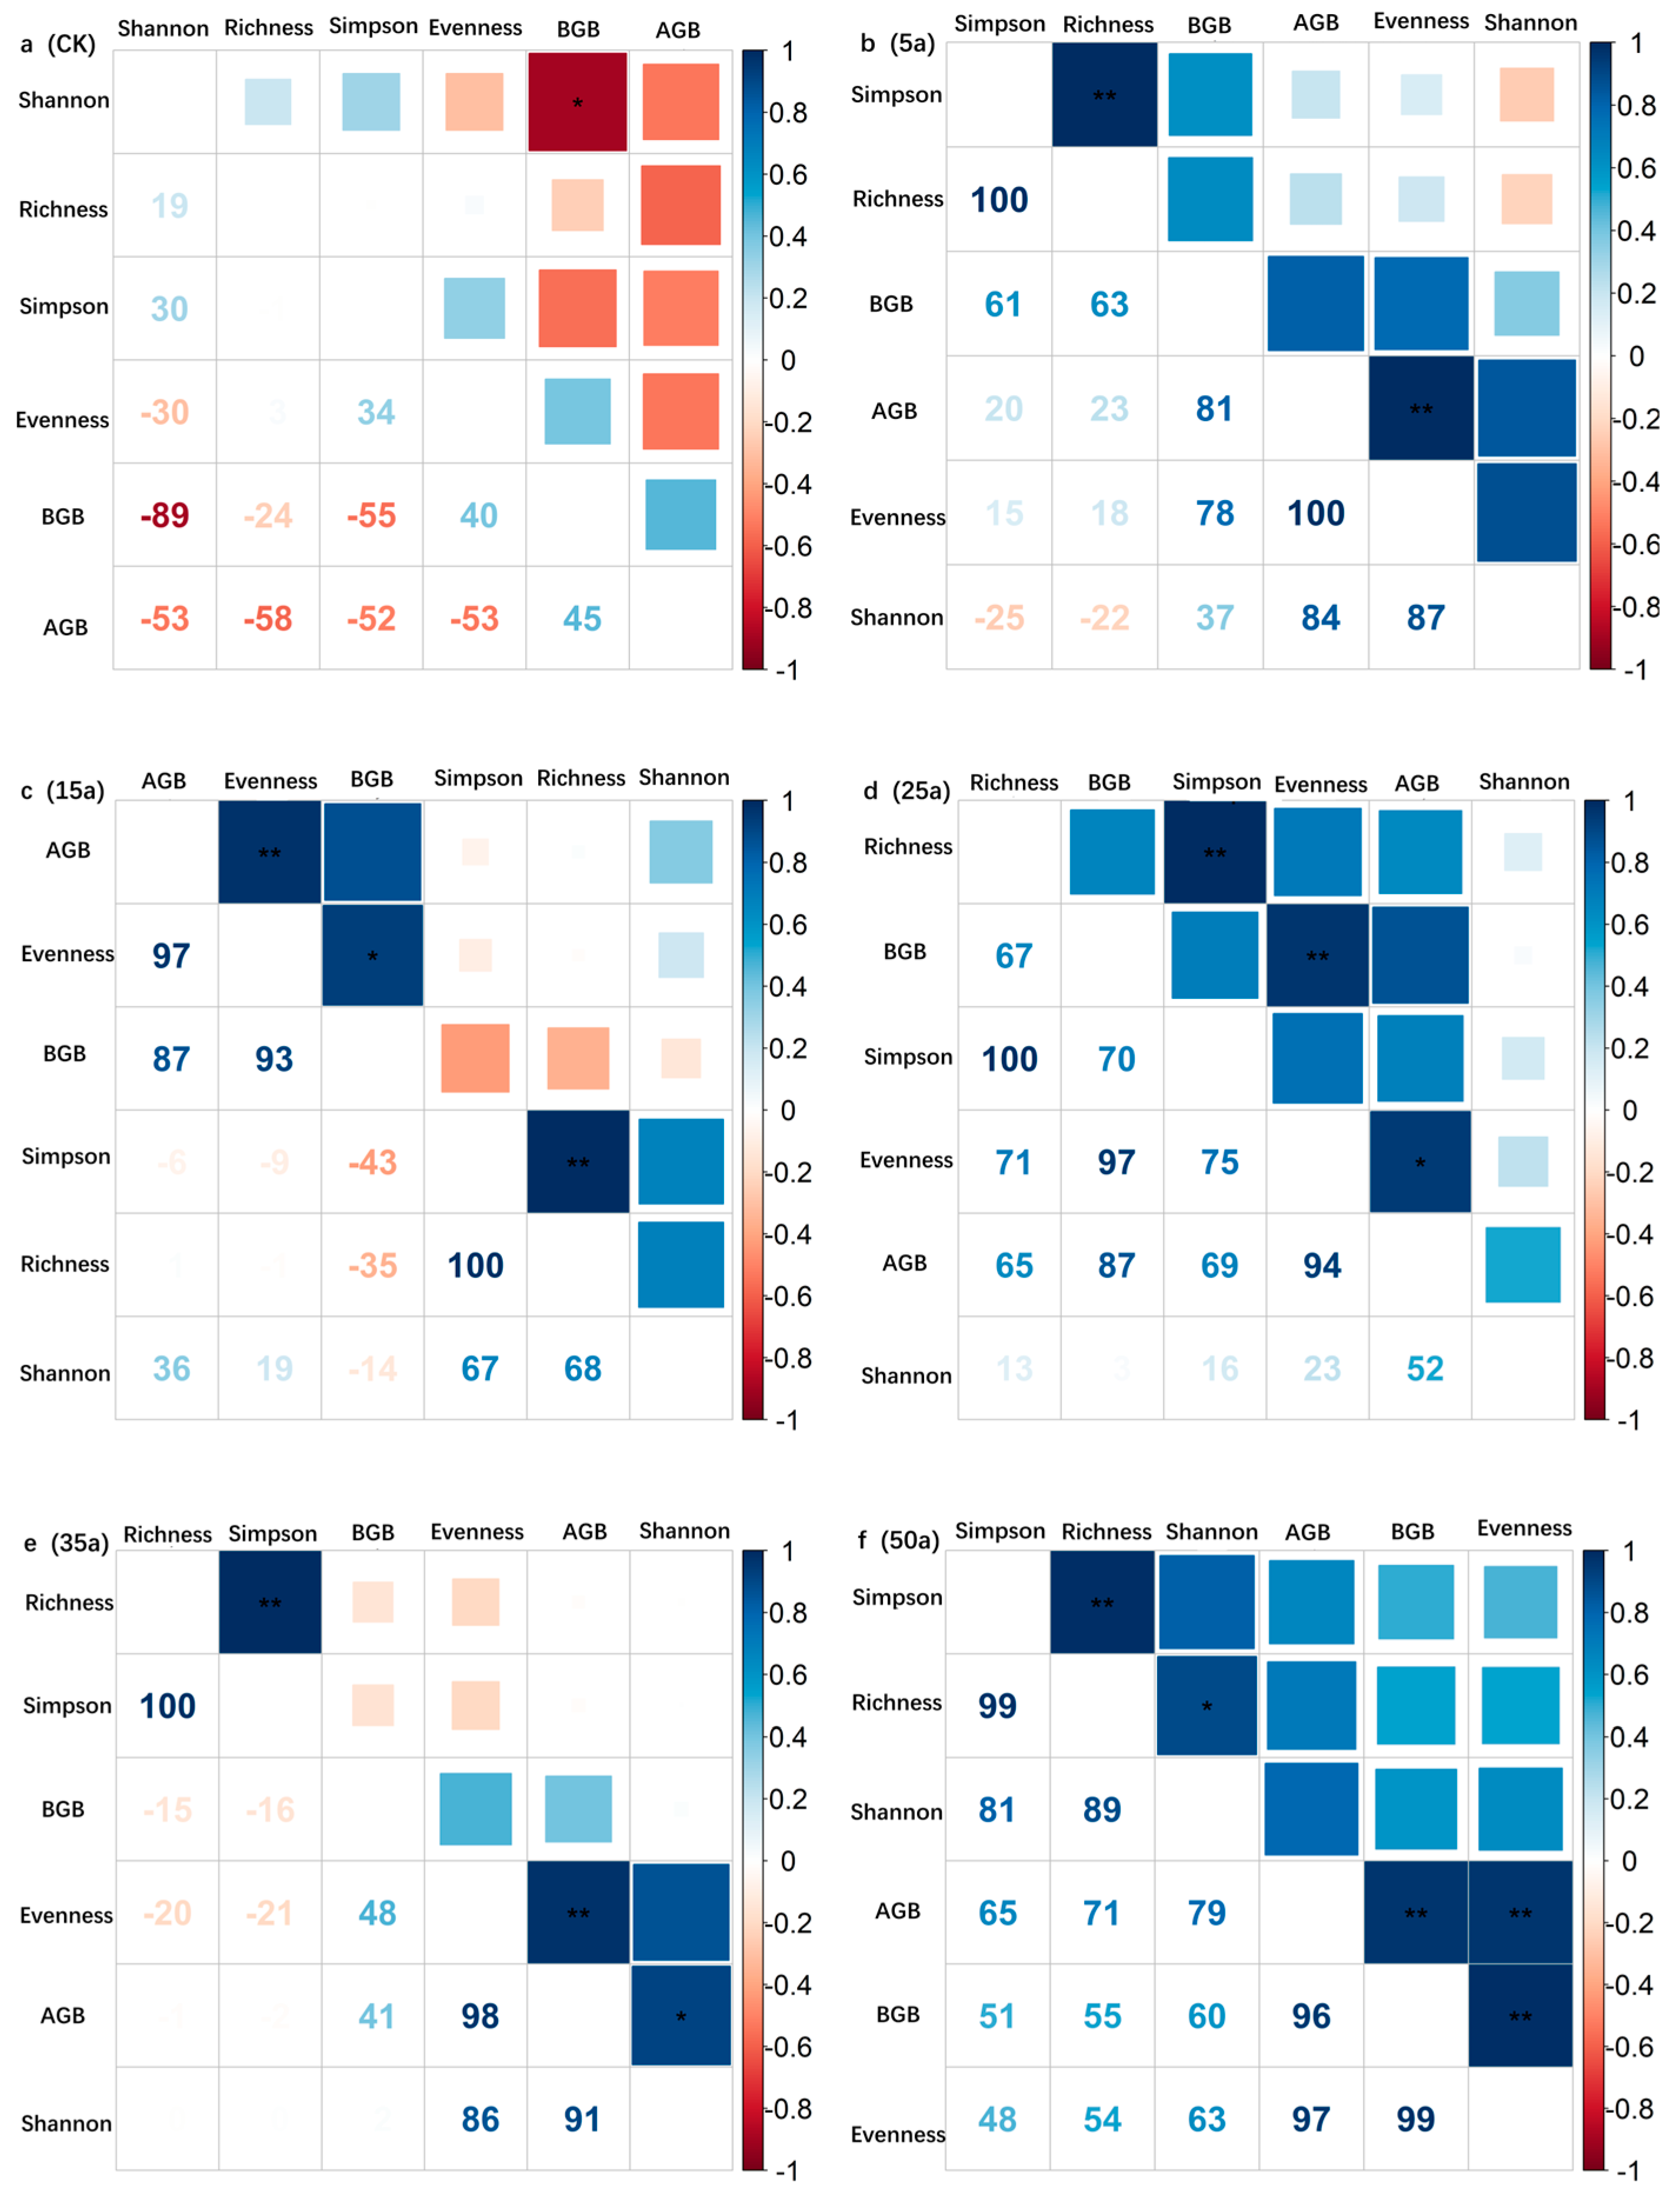
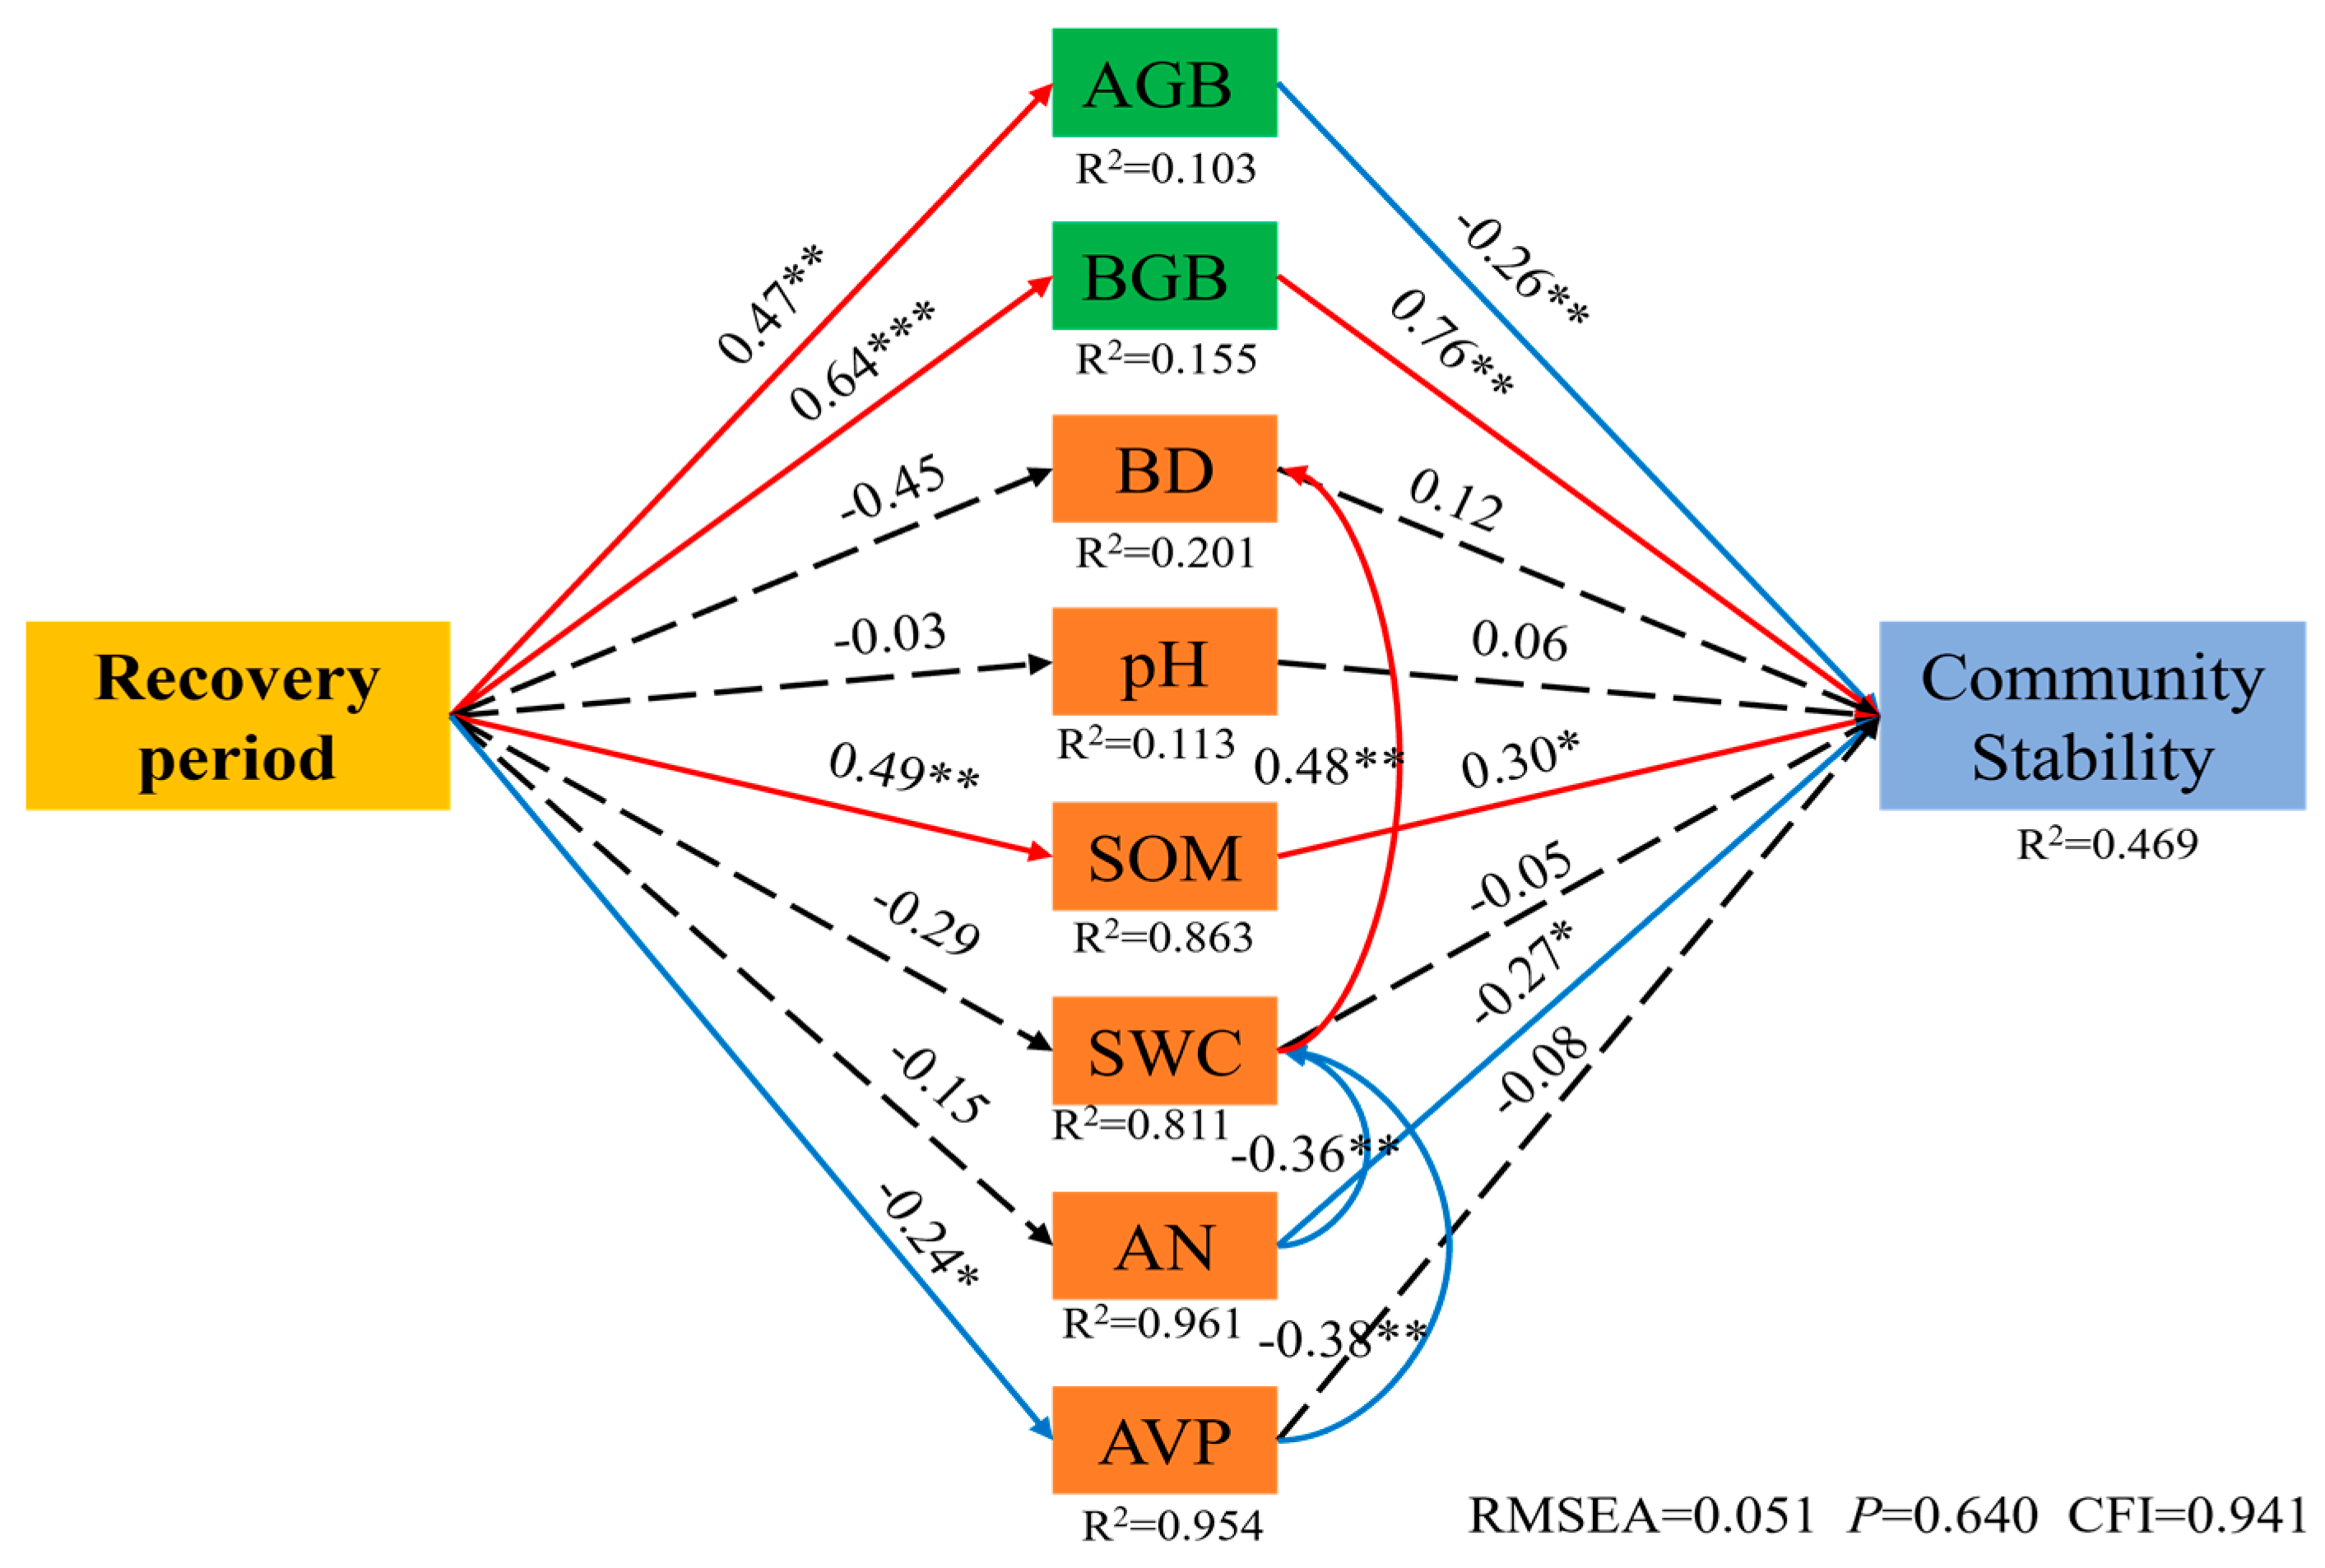
3.3. Change Characteristics of Community Stability in Artificial Caragana korshinskii

The stability of the Caragana korshinskii plantation community in high-cold sandy areas exhibits an increasing trend as the restoration period extends. Specifically, prior to restoration (0 years), community stability was at its lowest, measuring 0.42. As the restoration period progressed, the stability of the Caragana korshinskii plantation increased to 1.403 at 5 years, 1.608 at 15 years, 4.98 at 25 years, 2.74 at 35 years, and 3.78 at 50 years. Notably, community stability peaked at 25 years of restoration, followed by a sharp decline, and then increased again after 50 years (Figure 8). In summary, the overall stability of the community shows a gradual upward trend with the progression of the restoration period. The results also indicate that during the restoration process in the high-altitude sandy region, the succession of plant communities evolves from simple to complex, gradually nearing a stable dynamic process, and is currently in a state of primary succession.
The results of structural equation modeling indicate that the stability of Caragana korshinskii plantation communities across various restoration years is influenced by several factors, including aboveground biomass, belowground biomass, soil bulk density, soil pH, soil organic matter, soil moisture content, available nitrogen, and available phosphorus content, all of which exhibit significant pathway effects (Figure 9). Restoration years positively and significantly affect both aboveground and belowground biomass and soil organic matter content (p < 0.01), while they have a positive yet negative impact on soil available phosphorus content (p < 0.05). Furthermore, soil moisture content positively and significantly influences soil bulk density (p < 0.01); however, available nitrogen and available phosphorus have a positive but negative effect on soil moisture content (p < 0.01). The aboveground biomass of community plants and available nitrogen significantly negatively impact community stability (p < 0.05), whereas belowground biomass and soil organic matter content significantly positively affect community stability (p < 0.05). Furthermore, Caragana korshinskii plantation under different planting years affects community stability through vegetation biomass, soil physical properties, and available nutrients in the soil. Among them, vegetation factors, namely aboveground and underground biomass, have a greater impact on community stability; soil factors, namely soil organic matter and available nitrogen, although also have an impact, the degree of influence is relatively small. This result indicates that changes in plant community structure composition are more important in affecting community stability.

4. Discussion

4.1. Variation in Plant Community Diversity and Biomass

Artificial forest restoration is an effective approach to combating desertification, and its effectiveness is influenced by the duration of the restoration process [32]. The findings of this study indicated that as the duration of restoration continues to increase, species richness exhibits an initial increase followed by a decrease. Meanwhile, the Simpson index, Shannon–Wiener diversity index, and Evennessindex demonstrate a pattern of initial increase, followed by a decrease, then another increase, ultimately stabilizing. The results of this study showed that, with the continuous growth of restoration years, the Richness index showed a trend of first increasing and then decreasing; the Simpson index, Shannon–Wiener index, and Evenness index increased first, then decreased, and then increased, and maintained a stable state.
The results showed that as restoration duration increased, shrub productivity and total community productivity initially increased and then declined, while grassland productivity gradually increased and eventually stabilized. A significant correlation was observed between community productivity and species diversity. These findings were consistent with previous studies demonstrating that plant communities exhibited a coordinated relationship between aboveground and belowground biomass across different restoration stages, maintaining a relatively stable allocation ratio between these components [33,34]. The observed patterns may be attributed to the following factors: First, as restoration progressed, plant community diversity initially increased before stabilizing, reaching its peak species richness [35]. Second, with prolonged restoration duration, the vegetation coverage, litter accumulation, and humus formation in the Caragana korshinskii plantation gradually increased until approaching the environmental carrying capacity. This process likely reduced plants’ ability to utilize space, light, and other critical resources, consequently inhibiting photosynthetic efficiency and normal plant growth [36]. At the early stage of restoration, Caragana korshinskii, as a dominant species, changed the habitat, and some grass species began to settle down, and the species diversity index of the community increased rapidly. With the increase in restoration years, Caragana korshinskii grew rapidly, the competition relationship within the community began to strengthen, some species were excluded, and the diversity index decreased in a short time. At 25 and 35 years of restoration, species diversity gradually increased, the community structure became complex, a variety of plants coexisted, and the niche changed [37].

4.2. Variation in Soil Properties

In the alpine sandy region, the restoration of soil community structure is an important link to promote ecological restoration. In the early and middle stages of restoration (0~25 years), the soil water content of the Caragana korshinskii plantation showed a decreasing trend, followed by an increasing trend. This may be due to the improvement of the soil’s physical structure and the deep expansion of plant roots, which improved the water storage capacity [33,38]. Although transpiration is often limited by the soil water supply in the upper soil profile, Caragana korshinskii can still meet its evaporation demand due to its deep and developed root system [39]. The Caragana korshinskii plantation has more effective water use efficiency than other desertification control plant solutions, and the impact of wind is weakened by increasing aerodynamic roughness [32].
The restoration years of the Caragana korshinskii plantation generally have a positive effect on soil properties. In this study, the soil organic matter showed a trend of first increasing, then decreasing and then increasing. Compared with before restoration, due to the gradual increase in species in the community, more plant litter is decomposed by microorganisms and imported into the soil. This process is conducive to increasing the content of humus in the soil, so as to improve the soil condition [40]. The low organic matter content in the soil before planting in alpine sandy regions is mainly due to the following reasons: limited climate and soil conditions, low temperature, drought, and sandy substrates leading to low vegetation productivity, insufficient input of organic matter, and slow decomposition; The initial vegetation coverage is weak, the biomass before afforestation is scarce, the litter and root exudates are extremely rare, and the soil organic carbon source is scarce; Microbial activity and wind erosion influence, environmental stress inhibits microbial decomposition, and wind erosion exacerbates surface organic matter loss [33]. High content of humus can improve soil water retention, fertilizer retention, and aeration, and help to improve soil structure and fertility [41]. The findings align with previous studies, indicating that during the initial afforestation phase, soil organic matter decomposition may exceed accumulation. This phenomenon occurs particularly in surface soils, which demonstrate greater sensitivity to environmental fluctuations and are more strongly influenced by litter input and nutrient-rich fine particulate matter, and only a small part of decomposed litter enters the deep soil [42]. The nutrients absorbed by plants from deep soil may exceed their input [43]. In the process of artificial forest restoration, the plant biomass is also gradually accumulating. The litter accumulation layer on the ground is thicker, the root biomass in the shallow surface soil is greater, and the humus accumulation is more abundant [44]. Therefore, the nutrient content in the soil in the late stage of restoration is often higher than that in the early stage of restoration. However, the available soil phosphorus is relatively stable, indicating that the increase in soil carbon and nitrogen cycle is more critical in the process of plantation restoration, and the mobility of soil phosphorus is weak and relatively stable.

4.3. Variation in Community Stability

The dynamic changes in community species composition and community succession in the process of plant restoration in sandy land reflect the change process of community habitat in the process of ecosystem restoration [45]. The recovery speed and succession direction of degraded sandy land depend on the degree of degradation and disturbance on the one hand, and the environmental conditions on the other hand [46]. The results of this study indicated that plant biomass and abundance gradually increase with the passage of planting years. This is consistent with other research findings, that is, in the past 15 years of sand plant restoration, the annual plant abundance and biomass have shown an upward trend [47]. The main reason for this result is that the annual grass species on the soil surface of the growth environment have the characteristics of rapid propagation, short growth cycle, and so on, and the litter between shrubs and herbs in the community forms an early stage of ecological secondary succession, which provides more sufficient resources for the growth of grass species [48].
The results showed that the stability of the Caragana korshinskii plantation was the highest when it was restored to 25 years. However, when it recovered to 35 years, the community productivity was the largest. This indicated that community stability is not completely related to community productivity, and community stability generally shows an upward trend with the increase in restoration years. At present, it is in the early stage of ecological secondary succession and has not yet reached a stable state. The study showed that there are two main driving factors for community stability: (1) the species stability that makes up the community and (2) compensation dynamics, which is derived from the time compensation generated by the relationship between species [49,50]. The stability of species and populations should be mainly related to the interaction between their ecological strategies and environmental conditions [51,52]. The dynamics of ecological compensation are mainly driven by interspecific interactions (such as competition, mutual benefit, etc.) and niche differentiation [53]. Community stability is not only crucial for maintaining ecosystem function but also for effectively protecting biodiversity. Ecosystems with higher stability have stronger species-carrying capacity, which can provide more suitable living and reproduction conditions for organisms, thereby maintaining higher species richness [54]. This stability is an important foundation for achieving regional ecological security and sustainable utilization of species resources. Highly stable ecosystems are better able to support species survival and reproduction, thereby maintaining greater species richness. It is also an important basis for achieving regional ecological security and sustainable development of species resources [55]. The results of this study still have certain instability and uncertainty. This is mainly due to insufficient consideration of outdoor disturbance factors (such as climate change, grazing activities, etc.) and the impact of treatment time during the experimental process. Future research needs to strengthen long-term monitoring of aboveground and belowground communities, especially the interaction between the two, while also incorporating the influence of biological factors such as soil animals, to more comprehensively reveal the ecological mechanisms in the restoration process of plantation of Caragana korshinskii.

5. Conclusions

The study investigated the impact of plantation succession of Caragana korshinskii on community stability in alpine sandy regions. Three main findings emerged: (1) With the passage of planting time, the plant biomass and species diversity of the Caragana korshinskii plantation community showed a trend of first increasing and then decreasing, reaching their peak in 25~35 years. This reflects the increasing complexity of the community and the intensification of interspecific competition. (2) Soil moisture exhibited dynamic fluctuations while soil organic matter showed progressive accumulation, demonstrating improved soil fertility through plant development. (3) Maximum community stability occurred at 25 years of restoration, with an overall positive relationship between restoration duration and stability. Current communities remain in an early stage of ecological secondary succession, with stability primarily regulated by species compensatory dynamics and interspecific equilibrium mechanisms.

Author Contributions

Z.S. designed the study in consultation with L.M. and Z.Z. Field and laboratory work was conducted by H.L., R.Q., D.W., X.Z., H.S., S.L., X.H., and H.A., with the support of H.Z. Writing and data analysis were led by Z.S. All authors have read and agreed to the published version of the manuscript.

Funding

National Natural Science Foundation of China (U21A20186, U21A20185); Key R&D and Transformation Projects in Qinghai Province (2024-HZ-810).

Institutional Review Board Statement

Not applicable.

Data Availability Statement

The data that support the findings of this study are available from the corresponding author upon reasonable request.

Conflicts of Interest

All other authors declare that they have no conflicts of interest.

References

  1. Garcia, F.N.; Wiesmeier, M.; Goberna, M.; Martínez, M.M.; Albaladejo, J. Carbon dynamics after afforestation of semiarid shrublands: Implications of site preparation techniques. For. Ecol. Manag. 2014, 319, 107–115. [Google Scholar] [CrossRef]
  2. Lu, F.; Hu, H.; Sun, W.; Zhu, J.; Liu, G.B.; Zhou, W.M.; Zhang, Q.; Shi, P.L.; Liu, X.P.; Wu, X.; et al. Effects of National Ecological Restoration Projects on Carbon Sequestration in China from 2001 to 2010. Proc. Natl. Acad. Sci. USA 2018, 115, 4039–4044. [Google Scholar] [CrossRef] [PubMed]
  3. Saren, G.; Zhao, Y.Y.; Geng, X.Z.; Wang, Y.; Gao, G.L. Sustainability of the Human Environment System in Inner Mongolia’s Sand Region from 2000 to 2020. China Deserts 2025, 45, 71–82. [Google Scholar]
  4. Jia, G.M.; Liu, B.; Wang, G.; Zhang, B.L. The microbial biomass and activity in soil with shrub (Caragana korshinskii K.) plantation in the semi-arid loess plateau in China. Eur. J. Soil Biol. 2010, 46, 6–10. [Google Scholar] [CrossRef]
  5. Chen, F.Q.; Guo, Y.; Huang, M.Z.; Feng, W.; Ye, Q.H.; Liu, J.X.; Li, X. Community structure characteristics and management strategies of red cone artificial forests with different restoration years. J. Anhui Agric. Univ. 2022, 49, 48–55. [Google Scholar]
  6. Jiang, J.; Song, M. The role of plants and soil microorganisms in regulating nutrient cycling in ecosystems. Chin. J. Plant Ecol. 2010, 34, 979–988. [Google Scholar]
  7. Liu, F.Y.; Gao, C.J.; Li, K.; Zhang, C.H. Stability and evaluation methods of plant communities in southwest dry and hot river valleys. Chin. J. Appl. Environ. Biol. 2021, 27, 334–350. [Google Scholar]
  8. Su, J.; Zhao, Y.; Xu, F.; Bai, Y. Multiple global changes drive grassland productivity and stability: A meta-analysis. J. Ecol. 2022, 110, 2850–2869. [Google Scholar] [CrossRef]
  9. Che, C.; Xiao, S.C.; Peng, X.; Ding, A.J.; Su, J. Radial growth of Korshinsk peashrub and its response to drought in different sub-arid climate regions of northwest China. J. Environ. Manag. 2022, 326 Pt A, 116708. [Google Scholar] [CrossRef]
  10. Segrestin, J.; Gotzenberger, L.; Valencia, E.; De, B.F.; Leps, J. A unified framework for partitioning the drivers of stability of ecological communities. Glob. Ecol. Biogeogr. 2024, 33, e13828. [Google Scholar] [CrossRef]
  11. Polley, H.W.; Wilsey, B.J.; Derner, J.D. Dominant species constrain effects of species diversity on temporal variability in biomass production of tallgrass prairie. Oikos 2007, 116, 2044–2052. [Google Scholar] [CrossRef]
  12. Sasaki, T.; Lauenroth, W.K. Dominant species, rather than diversity, regulates temporal stability of plant communities. Oecologia 2011, 166, 761–768. [Google Scholar] [CrossRef]
  13. Zhou, W.J.; Lu, Z.Y.; Wu, C.S.; Wen, H.D.; Zhang, Y.P.; Liu, Y.H.; Sha, L.Q. The impact of subtropical forest reverse succession on soil carbon storage. J. Yunnan Univ. 2016, 38, 141–149. [Google Scholar]
  14. Chen, L.C.; Wang, S.L.; Chen, C.Y. Exploration of the decline mechanism of Chinese fir plantations. Chin. J. Appl. Ecol. 2004, 1953–1957. [Google Scholar]
  15. He, Y.L. Changes in plant biomass and soil nutrients of alpine shrub meadows with different degrees of degradation. Northwest Agric. J. 2014, 23, 184–190. [Google Scholar]
  16. Zeng, Q.; Lal, R.; Chen, Y.; An, S. Soil, leaf and root ecological stoichiometry of Caragana korshinskii on the loess plateau of china in relation to plantation age. PLoS ONE 2017, 12, e0168890. [Google Scholar] [CrossRef] [PubMed]
  17. Zhang, G.H.; Liu, G.B.; Wang, G. Effects of Caragana korshinskii Kom. cover on run off, sediment yield and nitrogen loss. Int. J. Sediment Res. 2010, 25, 245–257. [Google Scholar] [CrossRef]
  18. Shi, S.; Han, P.; Zhang, P.; Ding, F.; Ma, C. The impact of afforestation on soil organic carbon sequestration on the Qinghai Plateau, China. PLoS ONE 2015, 10, e0116591. [Google Scholar] [CrossRef]
  19. Houlton, B.Z.; Wang, Y.P.; Vitousek, P.M.; Field, C.B. A unifying framework for dinitrogen fixation in the terrestrial biosphere. Nature 2008, 454, 327–330. [Google Scholar] [CrossRef]
  20. Yan, Y.; Xin, X.; Xu, X.; Wang, X.; Yan, R.; Murray, P.J. Vegetation patches increase wind-blown litter accumulation in a semi-arid steppe of northern China. Environ. Res. Lett. 2016, 11, 124008. [Google Scholar] [CrossRef]
  21. Zhou, H.; Liu, Y.X. The impact of artificial sand fixation vegetation restoration on soil microbial quantity in the Gonghe Basin, Qinghai Province. Resour. Environ. Arid. Reg. 2022, 36, 178–185. [Google Scholar]
  22. Yan, R.; Feng, W.; Wang, X.J. Soil fungal community composition and diversity of different sand fixing plants in Hulunbuir Sandy Land. Chin. Soil Water Conserv. Sci. 2021, 19, 60–68. [Google Scholar]
  23. Niu, X.W.; Zhang, Q.; Yang, Z.P.; Cheng, B.; Shi, Q.L.; Liu, P.; Li, L. Study on the effects of caragana twig artificial forest on soil physical and chemical properties changes in Northwest Shanxi Province. J. Northwest Bot. 2003, 23, 628–632. [Google Scholar]
  24. Zhang, Z.K.; Zheng, X.X.; Lin, H.Z.; Lin, X.; Huang, L.J. Changes in functional traits and environmental factors of island plants at different stages of succession. Chin. J. Ecol. 2019, 39, 3749–3758. [Google Scholar]
  25. Wu, S.N.; Zhang, X.; Gao, X.X.; Xu, Y.D.; Wu, X.H.; Dan, X.K.; Liu, S.L.; Dong, Q.M.; Dong, S.K.; Wen, L. The succession dynamics of artificially restored plant communities in the degraded grassland of the “black soil beach” type in the Sanjiangyuan area. Chin. J. Ecol. 2019, 39, 2444–2453. [Google Scholar]
  26. Gan, Y.M.; Luo, Y.J.; Zhou, J.F.; Zhang, J.H. The impact of the ecological restoration project of desertification grassland in northwest Sichuan on the vegetation community of sandy land. Grassl. Sci. 2009, 26, 51–56. [Google Scholar]
  27. Li, Q.S.; Jin, W.Z.; Liu, Y.H. Comprehensive management technology for desertification land sealing and protection area in Gonghe County. Qinghai Agric. For. Sci. Technol. 2015, 1, 8–12+72. [Google Scholar]
  28. Liu, Z.; Zhou, Y.L.; Huang, Q.; Li, Z.H.; Sun, Z.; Liu, L.X.; Mi, H.Y.; Fan, Y.J. Estimation Model for the Biomass of Jinjia in the Middle of Maowusu Sandy Land. Resour. Environ. Arid. Reg. 2015, 29, 128–133. [Google Scholar]
  29. Valencia, E.; de Bello, F.; Galland, T.; Adler, P.B.; Leps, J.; E-Vojtko, A.; van Klink, R.; Carmona, C.P.; Danihelka, J.; Dengler, J.; et al. Synchrony matters more than species richness in plant community stability at a global scale. Proc. Natl. Acad. Sci. USA 2020, 117, 24345–24351. [Google Scholar] [CrossRef]
  30. Bao, S.D. (Ed.) Soil Agrochemical Analysis, 3rd ed.; Agricultural Press: Beijing, China, 2000. [Google Scholar]
  31. Gweon, H.S.; Bowes, M.J.; Moorhouse, H.L.; Oliver, A.E.; Bailey, M.J.; Acreman, M.; Read, D.S. Contrasting community assembly processes structure lotic bacteria metacommunities along the river continuum. Environ. Microbiol. 2020, 23, 484–498. [Google Scholar] [CrossRef]
  32. Chang, X.F.; Chai, Q.L.; Ma, Z.Y.; An, Q.Q.; Wu, G.L.; Chang, X.F.; Zheng, J.Y.; Wang, G. Does artificial Caragana korshinskii plantation increase soil carbon continuously in a water-limited landscape on the Loess Plateau? Land Degrad. Dev. 2019, 30, 1691–1698. [Google Scholar]
  33. Berthrong, S.T.; Jobbágy, E.G.; Jackson, R.B. A global meta-analysis of soil exchangeable cations, pH, carbon, and nitrogen with afforestation. Ecol. Appl. 2009, 19, 2228–2241. [Google Scholar] [CrossRef] [PubMed]
  34. Zhang, C.; Willis, C.G.; Klein, J.A.; Ma, Z.; Li, J.; Zhou, H.K.; Zhao, X. Recovery of plant species diversity during long-term experimental warming of a species-rich alpine meadow community on the Qinghai-Tibet plateau. Biol. Conserv. 2017, 213, 218–224. [Google Scholar] [CrossRef]
  35. Pimm, S.L. The complexity and stability of ecosystems. Nature 1984, 307, 321–326. [Google Scholar] [CrossRef]
  36. Cai, Y.; Zhang, F.; Duan, P.; Yung, J.C.; Weng, C.N.; Shi, J.; Liu, C.; Wang, J.; Bahtebay, J.; Ma, X. Vegetation cover changes in China induced by ecological restoration-protection projects and land-use changes from 2000 to 2020. Catena 2022, 217, 106530. [Google Scholar] [CrossRef]
  37. Enquist, B.J. Universal scaling in tree and vascular plant allometry: Toward a general quantitative theory linking plant form and function from cells to ecosystems. Tree Physiol. 2002, 22, 1045–1064. [Google Scholar] [CrossRef]
  38. Jia, X.; Shao, M.; Zhu, Y.; Luo, Y.B. Soil moisture decline due to afforestation across the Loess Plateau, China. J. Hydrol. 2017, 546, 113–122. [Google Scholar] [CrossRef]
  39. Jian, S.Q.; Zhao, C.; Fang, S.; Yu, K. Effects of different vegetation restoration on soil water storage and water balance in the Chinese Loess Plateau. Agric. For. Meteorol. 2015, 206, 85–96. [Google Scholar] [CrossRef]
  40. Heyburn, J.; Mckenzie, P.; Crawley, M.J.; Fornara, D.A. Effects of grassland management on plant C:N:P stoichiometry: Implications for soil element cycling and storage. Ecosphere 2017, 8, e01963. [Google Scholar] [CrossRef]
  41. Liu, Y.H.; Pei, H.K. Study on the composition and properties of soil humus in alpine meadow vegetation. Soil Bull. 2004, 35, 562–565. [Google Scholar]
  42. Yang, Z.; Zhang, Q.S.; Wang, Y.L.; Zhang, J.J.; Chen, M.C. Spatial and temporal variability of soil properties under Caragana microphylla shrubs in the northwestern Shanxi Loess Plateau, China. J. Arid Environ. 2011, 75, 538–544. [Google Scholar] [CrossRef]
  43. Miao, J.; Zhou, C.; Li, S.J.; Yan, J. Accumulation of soil organic carbon and total nitrogen in Pinus yunnanensis forests at different age stages. J. Appl. Ecol. 2014, 253, 625–631. [Google Scholar]
  44. Hu, L.; Wang, C.T.; Wang, G.X.; Ma, L.; Liu, W.; Xiang, Z.Y. Changes in soil enzyme activity and microbial community structure of alpine meadows at different degradation and succession stages in the three rivers source region. J. Grassl. Ind. 2014, 23, 8–19. [Google Scholar]
  45. Cao, C.Y.; Jiang, D.M.; Zhu, L.H.; Nan, Y.H. Causes of grassland degradation and changes in plant diversity in horqin sandy land. J. Grassl. Ind. 2006, 15, 18–26. [Google Scholar]
  46. Wang, M.M.; Liu, X.P.; He, Y.H.; Zhang, T.H.; Wei, J.; Che, L.; Sun, S.S. Changes of plant community characteristics and influencing factors during closure and restoration of Horqin Sandy Land. J. Plant Ecol. 2019, 43, 672–684. [Google Scholar] [CrossRef]
  47. Li, Y.L.; Cui, J.H.; Su, Y.Z. Comparison of leaf area and leaf dry matter content of major plants in different dune habitats. Chin. J. Ecol. 2005, 25, 304–311. [Google Scholar]
  48. Cheng, X.; Cheng, X.; Huang, M.; Shao, M.; Warrington, D.N. A comparison of fine root distribution and water consumption of mature Caragana korshinkii Kom grown in two soils in a semiarid region, China. Plant Soil 2009, 315, 149–161. [Google Scholar] [CrossRef]
  49. Gonzalez, A.; Loreau, M. The causes and consequences of compensatory dynamics in ecological communities. Annu. Rev. Ecol. Evol. Syst. 2009, 40, 393–414. [Google Scholar] [CrossRef]
  50. Hector, A.; Hautier, Y.; Saner, P.; Wacker, L.; Bagchi, R.; Joshi, J.; Scherer-Lorenzen, M.; Spehn, E.M.; Bazeley-White, E.; Weilenmann, M.; et al. General stabilizing effects of plant diversity on grassland productivity through population asynchrony and overyielding. Ecology 2010, 918, 2213–2220. [Google Scholar] [CrossRef]
  51. Conti, L.; Valencia, E.; Galland, T.; Gotzenberger, L.; Leps, J.; Evojtko, A.; Carmona, C.P.; Majekova, M.; Danihelka, J.; Dengler, J.; et al. Functional trait trade-offs define plant population stability across different biomes. Proc. R. Soc. B 2023, 290, 20230344. [Google Scholar] [CrossRef]
  52. Majekova, M.; Bello, F.D.; Dolezal, J.; Leps, J. Plant functional traits as determinants of population stability. Ecology 2014, 95, 2369–2374. [Google Scholar] [CrossRef]
  53. De Bello, F.; Lavorel, S.; Hallett, L.M.; Valencia, E.; Garnier, E.; Roscher, C.; Conti, L.; Galland, T.; Goberna, M.; Májekova, M.; et al. Functional trait effects on ecosystem stability: Assembling the jigsaw puzzle. Trends Ecol. Evol. 2021, 36, 822–836. [Google Scholar] [CrossRef] [PubMed]
  54. Loreau, M.; De Mazancourt, C. Species synchrony and its drivers: Neutral and nonneutral community dynamics in fluctuating environments. Am. Nat. 2008, 172, E48–E66. [Google Scholar] [CrossRef] [PubMed]
  55. Zhao, L.; Wang, S.; Shen, R.; Gong, Y.; Wang, C.; Hong, P.; Reuman, D.C. Biodiversity stabilizes plant communities through statistical-averaging effects rather than compensatory dynamics. Nat. Commun. 2022, 13, 7804. [Google Scholar] [CrossRef]
Figure 1. Study area location and site characteristics.
Agriculture 15 01143 g001
Figure 2. Experimental sample plot setting diagram. CK, the control; 5a, restore for 5 years; 15a, restore for 15 years; 25a, restore for 25 years; 35a, restore for 35 years; 50a, restore for 50 years.
Agriculture 15 01143 g002
Figure 3. Plant biomass under different restoration years. Aboveground biomass of the shrub (a). Aboveground biomass of the grass (b). Aboveground biomass of the community (c). Belowground biomass of the shrub (d). Belowground biomass of the grass (e). Belowground biomass of the community (f). Asterisks indicate significance levels (* p < 0.05; ** p < 0.01; *** p < 0.001).
Agriculture 15 01143 g003
Figure 4. Community diversity index under different restoration years. Community richness index (a). Simpson index (b). Shannon–Wiener index (c). Evenness index (d). Asterisks indicate significance levels (* p < 0.05; ** p < 0.01; *** p < 0.001).
Agriculture 15 01143 g004
Figure 5. The correlation between species diversity index and community productivity under different restoration years. a (CK) The correlation between species diversity index and community productivity before restoration; b (5a) The correlation between species diversity index and community productivity after 5 years of restoration; c (15a) The correlation between species diversity index and community productivity after 15 years of restoration; d (25a) The correlation between species diversity index and community productivity after 25 years of restoration; e (35a) The correlation between species diversity index and community productivity after 35 years of restoration; f (50a) The correlation between species diversity index and community productivity after 50 years of restoration. Asterisks indicate significance levels (* p < 0.05; ** p < 0.01).
Agriculture 15 01143 g005
Figure 6. Soil properties under different restoration years. (a) Soil bulk density (BD). (b) Soil pH value (pH). (c) Soil water content (SWC). (d) Soil organic matter (SOM). (e) Soil available nitrogen (AN). (f) Soil available phosphorus (AVP). Asterisks indicate significance levels (* p < 0.05; ** p < 0.01).
Agriculture 15 01143 g006
Figure 7. Redundancy analysis of plant biomass and soil characteristics of artificial Caragana korshinskii with different restoration periods.
Agriculture 15 01143 g007
Figure 8. Community stability under different restoration years.
Agriculture 15 01143 g008
Figure 9. SEM of the mechanisms that relate to indicators affecting community stability. The direction of the arrow represents the causal relationship, the number on the arrow represents the normalized path coefficient, and the line thickness is positively correlated with significance. The blue solid line represents negative correlation and significance, the red solid line represents positive correlation and significance, and the dashed line represents no significance. R2 was calculated after 999 bootstrap replications and represents the proportion of variance explained for each dependent variable in the model. * p < 0.05, ** p < 0.01, *** p < 0.001.
Agriculture 15 01143 g009
Disclaimer/Publisher’s Note: The statements, opinions and data contained in all publications are solely those of the individual author(s) and contributor(s) and not of MDPI and/or the editor(s). MDPI and/or the editor(s) disclaim responsibility for any injury to people or property resulting from any ideas, methods, instructions or products referred to in the content.

