
The Impact of Government Subsidies on Income Inequality Among Farm Households in China: Evidence from CFPS Panel Data

Abstract
1. Introduction
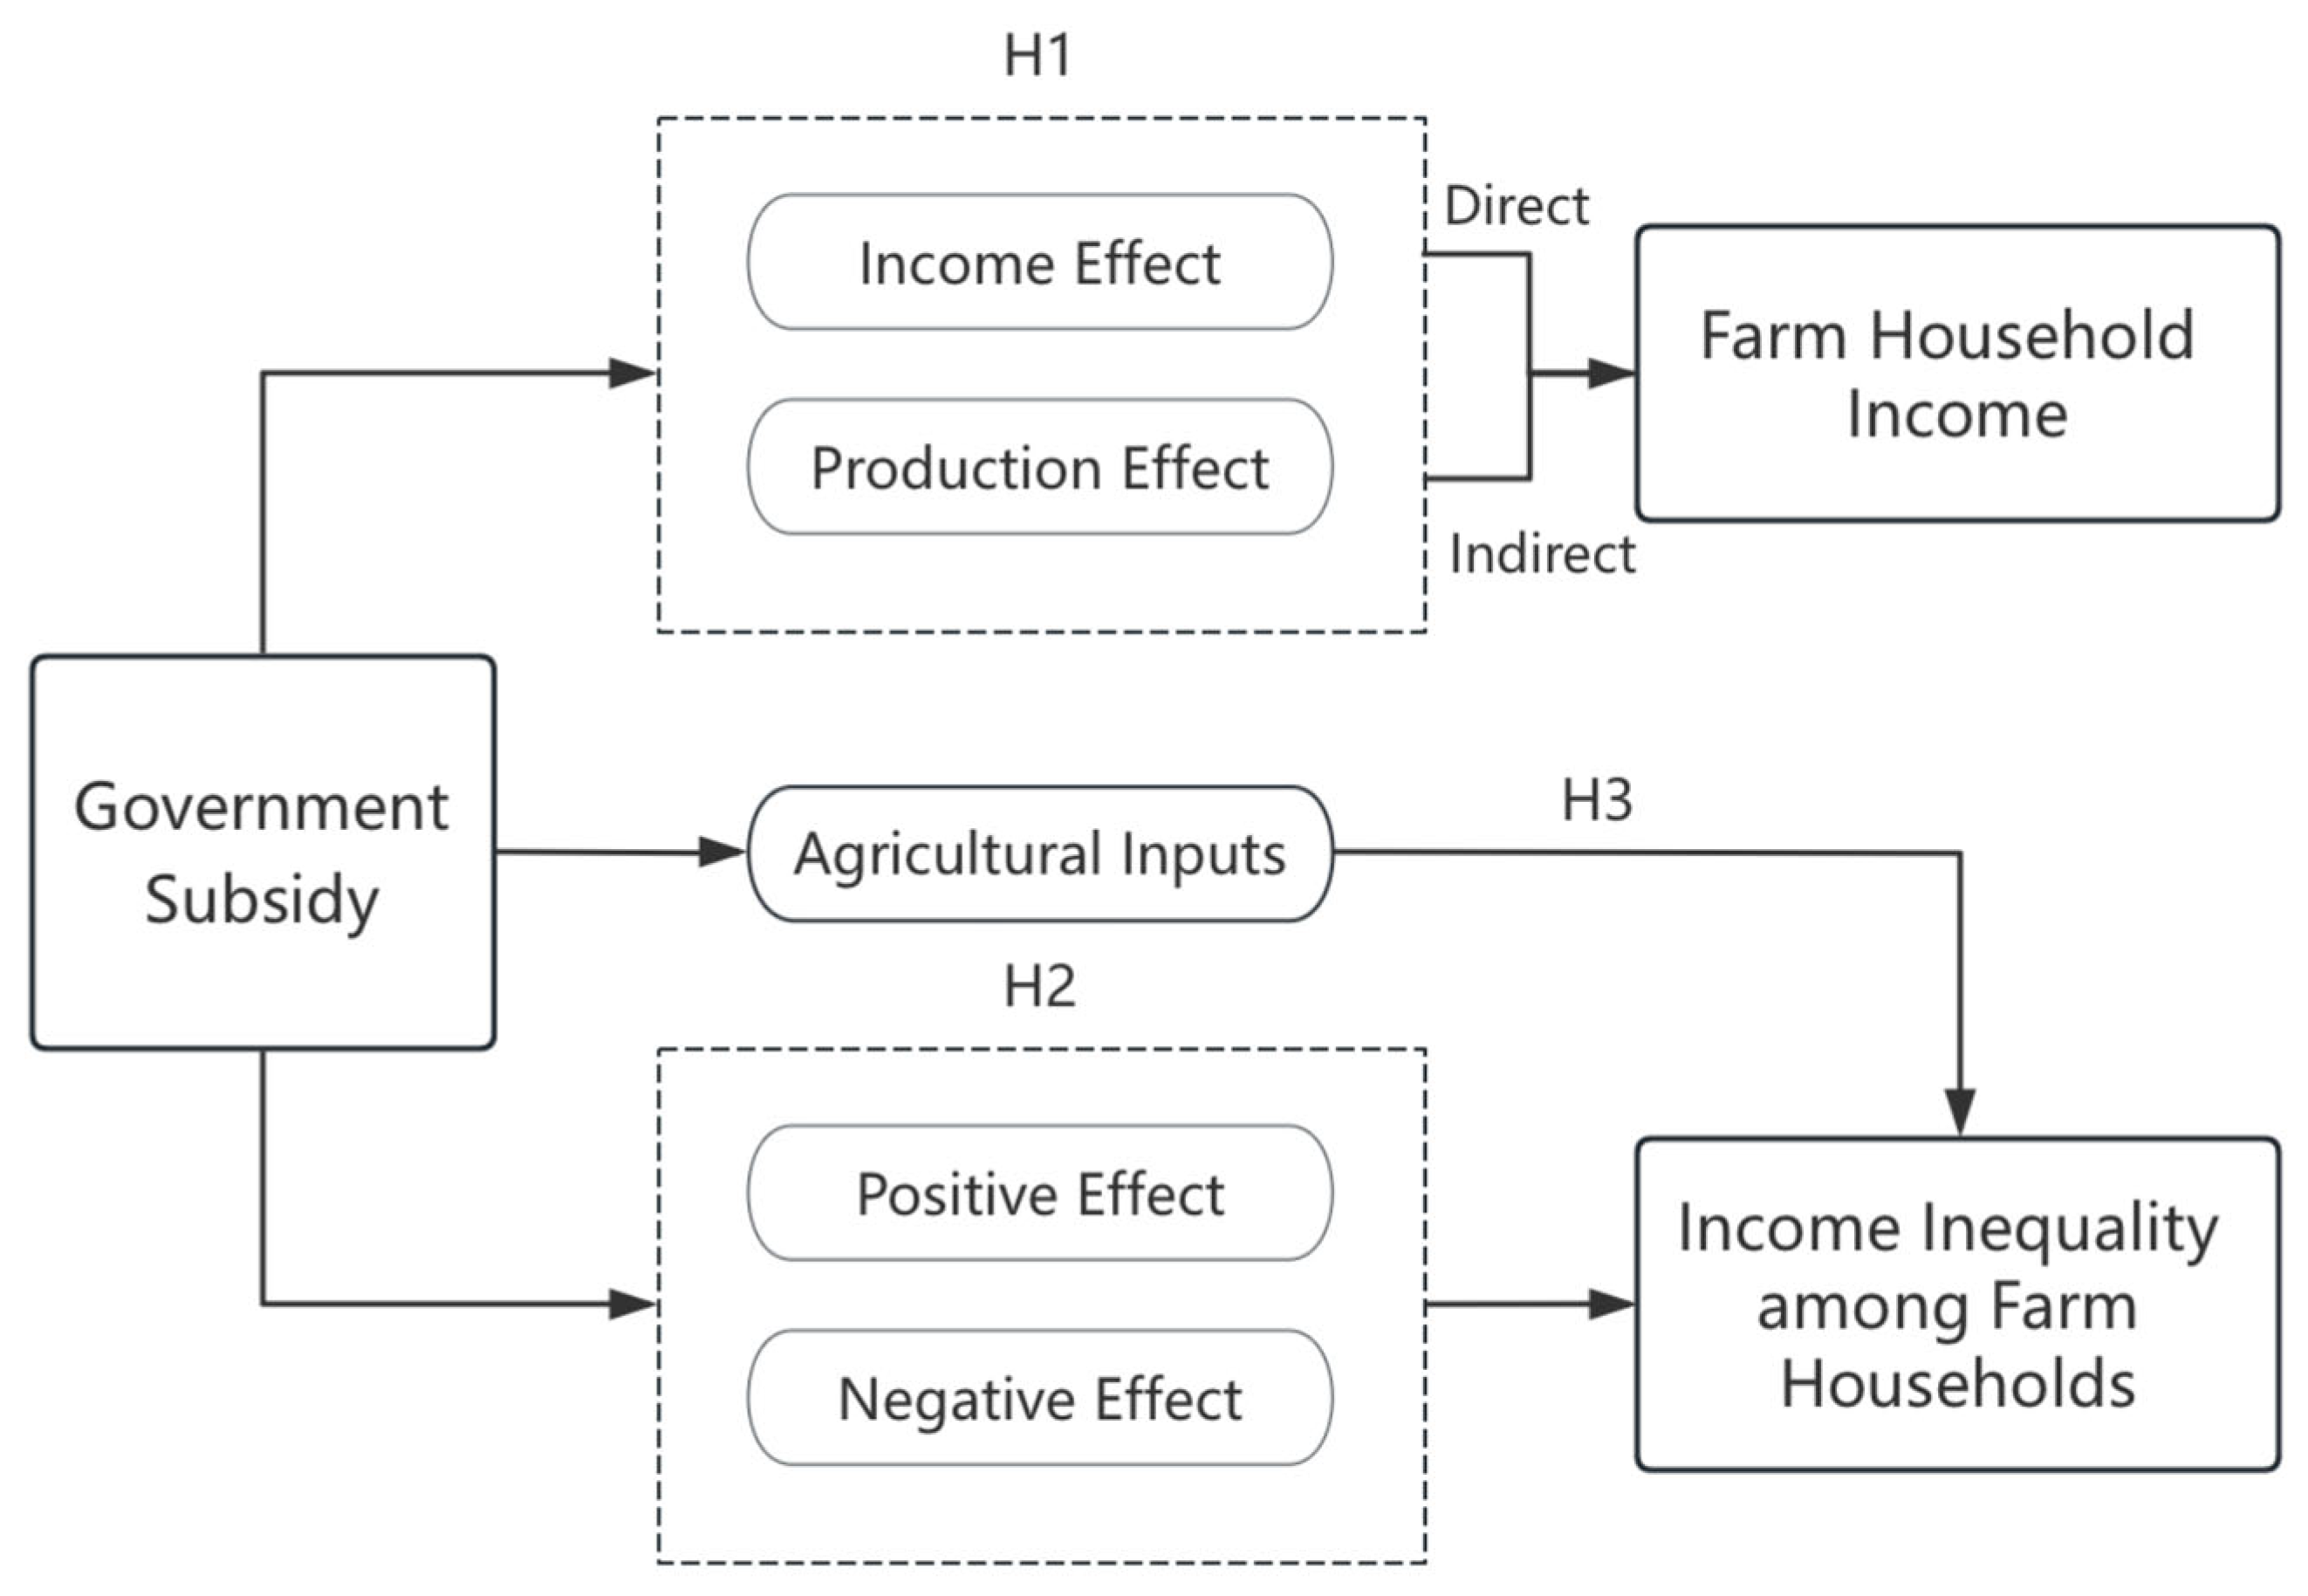
2. Theoretical Framework and Research Hypotheses
2.1. Government Subsidy and Farm Household Income
2.2. Positive and Negative Effects of Government Subsidy
2.3. Intermediation of Agricultural Inputs
3. Materials and Methods
3.1. Data Sources
3.2. Variable Descriptive Statistics
3.2.1. Independent Variable
3.2.2. Dependent Variable
3.2.3. Control Variable
3.3. Model
3.3.1. Fixed Effects Model
3.3.2. Quantile Regression Model
3.3.3. Mediation Effects Model
4. Results
4.1. Baseline Result
4.2. Quantile Regression
4.3. Mediation Effects Test
4.4. Heterogeneity Discussion
4.4.1. Government Subsidy Type Heterogeneity
4.4.2. Regional Heterogeneity
4.4.3. Age Heterogeneity
4.5. Endogeneity Analysis
4.6. Robust Tests
5. Discussion and Conclusions
5.1. Discussion
5.2. Conclusions
Author Contributions
Funding
Institutional Review Board Statement
Informed Consent Statement
Data Availability Statement
Conflicts of Interest
References
- Use the Metaphor of “Cake” to Understand Common Prosperity. Available online: http://www.moa.gov.cn/ztzl/xjpgysngzzyls/snxxt/202302/t20230207_6420045.htm (accessed on 7 April 2022).
- Decision of the Central Committee of the Communist Party of China on Further Comprehensively Deepening Reform and Promoting Chinese Modernization. Available online: https://www.gov.cn/zhengce/202407/content_6963770.htm?jump=true (accessed on 21 July 2024).
- Aleksandrova, O.; Azadi, H.; Värnik, R.; Nurmet, M.; Viira, A.-H. The Determinants of Farm Income Variability: Evidence From Estonia. Ger. J. Agric. Econ. 2024, 73, 1–26. [Google Scholar] [CrossRef]
- Wang, O.; Yang, J. The Impact of Agricultural Subsidies on Chinese Farmers’ Food Production. Chin. Rural Econ. 2014, 5, 20–28. [Google Scholar]
- Mishra, A.; El-Osta, H.; Gillespie, J.M. Effect of Agricultural Policy on Regional Income Inequality among Farm Households. J. Policy Model. 2009, 31, 325–340. [Google Scholar] [CrossRef]
- Deng, D.; Yang, J.; Sun, F. Income Mobility, Social Capital and Farmers’ Income Inequality Evidence from CFPS. Wuhan Univ. J. (Philos. Soc. Sci.) 2020, 73, 103–114. [Google Scholar] [CrossRef]
- Cheng, M.; Shi, Q.; Jin, Y. Incomes Level, Structure and Its Causes. J. Quant. Technol. Econ. 2014, 31, 3–19. [Google Scholar] [CrossRef]
- Xie, Y.; Zhou, X. Income Inequality in Today’s China. Proc. Natl. Acad. Sci. USA 2014, 111, 6928–6933. [Google Scholar] [CrossRef]
- Li, S.; Yue, X.; Shi, T.; Zuo, T. New Changes in Pattern of Income Distribution in China. Stud. Labor. Econ. 2019, 7, 9–31. [Google Scholar]
- Benjamin, D.; Brandt, L.; Giles, J. The Evolution of Income Inequality in Rural China. Econ. Dev. Cult. Change 2005, 53, 769–824. [Google Scholar] [CrossRef]
- Kanbur, R.; Zhang, X. Which Regional Inequality? The Evolution of Rural–Urban and Inland–Coastal Inequality in China from 1983 to 1995. J. Comp. Econ. 1999, 27, 686–701. [Google Scholar] [CrossRef]
- Zhang, P. Interregional Income Inequality and Non-Farm Employment among Rural Residents in China. Econ. Res. J. 1998, 8, 59–66. [Google Scholar]
- Gustafsson, B.; Shi, L. The Anatomy of Rising Earnings Inequality in Urban China. J. Comp. Econ. 2001, 29, 118–135. [Google Scholar] [CrossRef]
- Noack, F.; Larsen, A. The Contrasting Effects of Farm Size on Farm Incomes and Food Production. Environ. Res. Lett. 2019, 14, 084024. [Google Scholar] [CrossRef]
- Liu, X.; Zhou, H.; Wang, X. Does Farmland Transfer Narrow Income Gap Among Farmers? Microcosmic Evidence from CFPS. J. Agro-For. Econ. Manag. 2021, 20, 501–510. [Google Scholar]
- Li, C.; Sun, B.; Dong, Z. Farmers’ Heterogeneity, Transfer of Farmland Management Right and Rural Income Distribution. Rural Econ. 2019, 8, 26–33. [Google Scholar]
- Wan, G.; Zhou, Z.; Lu, Q. Income Inequality in Rural China: A Regression Decomposition Using Farm Household Data. Chin. Rural Econ. 2005, 5, 4–11. [Google Scholar] [CrossRef]
- Li, Z.; Xing, T.; Liu, Q. The Impact of Financial Literacy on Income Inequality of Farm Households under the Common Wealth Goal. Stat. Decis. 2022, 38, 69–73. [Google Scholar] [CrossRef]
- Yang, J.; Ding, S.; Deng, D. The Impact of Human Capital, Social Capital on Individual Income Inequality of Land-Expropriated Farmers. China Popul. Resour. Environ. 2019, 29, 148–158. [Google Scholar]
- Gao, M.; Yao, Y. Which Is the Main Reason for Income Inequality in Rural China: Physical Assets or Human Capital? Econ. Res. J. 2006, 12, 71–80. [Google Scholar]
- Mishra, A.K.; Goodwin, B.K. Farm Income Variability and the Supply of Off-farm Labor. Am. J. Agric. Econ. 1997, 79, 880–887. [Google Scholar] [CrossRef]
- Shi, X.; Fang, S.; Gao, X. Preliminary Education, Vocational Training and Migrant Workers’ Income: Based on the Perspective of Life Cycle. J. Financ. Econ. 2021, 47, 153–168. [Google Scholar] [CrossRef]
- Mao, X.; Liu, J. Economic Transition, the Changes of Household Employment, and Income Distribution in Rural China. Econ. Theory Bus. Manag. 2016, 04, 100–112. [Google Scholar]
- Wang, J.; Lv, K. The Path to Narrowing Rural Income Gap Under the Goal of Common Prosperity—A Quantitative Analysis from the Livelihood Diversification Perspective. J. Huazhong Agric. Univ. (Soc. Sci. Ed.) 2021, 5, 34–44+192–193. [Google Scholar] [CrossRef]
- Reardon, T.; Stamoulis, K.; Balisacan, A.; Cruz, M.; Berdegué, J.; Banks, B. Rural Non-farm Income in Developing Countries. State Food Agric. 1998, 1998, 283–356. [Google Scholar]
- Canagarajah, S.; Newman, C.; Bhattamishra, R. Non-farm Income, Gender, and Inequality: Evidence from Rural Ghana and Uganda. Food Policy 2001, 26, 405–420. [Google Scholar] [CrossRef]
- Zhu, Q.; Zhu, C.; Peng, C.; Bai, J. Can Information and Communication Technologies Boost Rural Households’ Income and Narrow the Rural Income Disparity in China? China Econ. Q. Int. 2022, 2, 202–214. [Google Scholar] [CrossRef]
- Zhao, W.; Peng, Y. Does the Digital Economy Affect Income Inequality?—An Empirical Test Based on Spatial Panel Models. Inq. Econ. Issues 2022, 12, 35–51. [Google Scholar]
- Bai, X.; Li, L.; Song, P. Balancing Efficiency and Fairness: The Research on the Impact of China’s Digital Economy Development on Economic Growth and Income Inequality. J. Xi’an Jiaotong Univ. (Soc. Sci.) 2023, 43, 38–50. [Google Scholar] [CrossRef]
- Zhang, Z. Relationship Between Internet Using and Farmer’ Income Inequality. Econ. Surv. 2022, 39, 45–54. [Google Scholar] [CrossRef]
- Huang, Z.; Wang, M.; Wan, G. Income Inequality of China’s Residents: An Analysis Based on the Perspective of Transfer Income. J. Manag. World 2003, 3, 70–75. [Google Scholar] [CrossRef]
- Zhong, F.; Gu, H.; Ji, Y. Farmers’ Role Differentiation and the Income Distribution Effects of Agricultural Subsidy Policies: An Empirical Study on the Income Distribution Effects of Agricultural Tax Reduction and Grain Direct Subsidy in Jiangsu Province. J. Manag. World 2008, 05, 65–70+76. [Google Scholar] [CrossRef]
- Yin, Z.; Guo, P. The Impact of Targeted Poverty Alleviation Policy on Consumption: Evidence from China Household Finance Survey. J. Manag. World 2021, 37, 64–83. [Google Scholar] [CrossRef]
- Langemeier, M.R.; Patrick, G.F. Farmers’ Marginal Propensity to Consume: An Application to Lllinois Grain Farms. Am. J. Agric. Econ. 1990, 72, 309–316. [Google Scholar] [CrossRef]
- Fisher, J.D.; Johnson, D.S.; Smeeding, T.M.; Thompson, J.P. Estimating the Marginal Propensity to Consume Using the Distributions of Income, Consumption, and Wealth. J. Macroecon. 2020, 65, 103218. [Google Scholar] [CrossRef]
- Kirwan, B.E.; Roberts, M.J. Who Really Benefits from Agricultural Subsidies? Evidence from Field-level Data. Am. J. Agric. Econ. 2016, 98, 1095–1113. [Google Scholar] [CrossRef]
- Zhang, Y.; Chen, Z. The Impact of Rural Benefit Policies on Income Flows of Rural Residents in Impoverished Areas—An Analysis Based on a Tracking Survey of Farmers’ Households in Three Administrative Villages in Guizhou. Chin. Rural Econ. 2015, 7, 70–81. [Google Scholar]
- Yang, D.; Wang, X.; Tang, Y. Agricultural Subsidies, Rural Income Increase and Income Inequality. J. Huazhong Agric. Univ. (Soc. Sci. Ed.) 2020, 05, 60–70+171. [Google Scholar] [CrossRef]
- Ravallion, M.; Wodon, Q. Does Child Labour Displace Schooling? Evidence on Behavioural Responses to An Enrollment Subsidy. Econ. J. 2000, 110, 158–175. [Google Scholar] [CrossRef]
- Rozelle, S. Rural Industrialization and Increasing Inequality: Emerging Patterns in China’s Reforming Economy. J. Comp. Econ. 1994, 19, 362–391. [Google Scholar] [CrossRef]
- Hölsch, K.; Kraus, M. European Schemes of Social Assistance: An Empirical Analysis of Set-ups and Distributive Impacts. Int. J. Soc. Welf. 2006, 15, 50–62. [Google Scholar] [CrossRef]
- Su, C.; Xie, E. Fiscal Mobility, Public Transfers and Its Efficiency on Alleviating Poverty: Analysis Based on Micro-data of Rural China. J. Financ. Res. 2015, 4, 34–49. [Google Scholar]
- Reardon, T.; Taylor, J.E.; Stamoulis, K.; Lanjouw, P.; Balisacan, A. Effects of Non-Farm Employment on Rural Income Inequality in Developing Countries: An Investment Perspective. J. Agric. Econ. 2000, 51, 266–288. [Google Scholar] [CrossRef]
- Xu, C.; Li, L. Does Urban and Rural Subsistence Security System Reduce Future Poverty? Empirical Analysis Based on Vulnerability of Poverty. Financ. Trade Econ. 2017, 38, 5–19+146. [Google Scholar]
- Ravallion, M.; Chen, S. Benefit Incidence with Incentive Effects, Measurement Errors and Latent Heterogeneity: A Case Study for China. J. Public Econ. 2015, 128, 124–132. [Google Scholar] [CrossRef]
- Clark, J.; Lee, D.R. Government Transfers and Inequality: An Anatomy of Political Failure. Public Financ. Manag. 2008, 8, 265–301. [Google Scholar] [CrossRef]
- Wang, Z.; Deng, D. Propensity Score Matching, Aid Dependence and Aiming Mechanism: Based on the Experience Analysis to the Implementation ofd Social Assistance System. J. Public Manag. 2012, 9, 83–88+126. [Google Scholar]
- Cui, J.; Li, W.; Xie, Y. Does Decision-making of Grassroots Fiscal Expenditure Favor the Poor? Evidence from Tracking Investigation of the Chinese Countryside Families. Financ. Trade Econ. 2018, 39, 21–35. [Google Scholar] [CrossRef]
- Cheng, X.; Wang, J. Elite Capture, the “Follow-up Checks” Policy, and the Targeted Poverty Alleviation Program: Evidence from Rural Western China. J. Integr. Agric. 2021, 20, 880–890. [Google Scholar] [CrossRef]
- Park, A.; Wang, S.; Wu, G. Regional Poverty Targeting in China. J. Public Econ. 2002, 86, 123–153. [Google Scholar] [CrossRef]
- Zhu, Q.; Lu, C. An Empirical Investigation into the Financial Support for Agriculture and Farmers’ Income. Jinan J. (Philos. Soc. Sci.) 2020, 42, 67–83. [Google Scholar]
- Shu, L. The Phenomenon of “Elite Capture” in the Field of Agricultural Resources under the Public Policy Perspective. Rural Econ. 2019, 6, 107–113. [Google Scholar]
- Liu, M.; Feng, X.; Wang, S.; Qiu, H. China’s Poverty Alleviation over the Last 40 Years: Successes and Challenges. Aust. J. Agric. Resour. Econ. 2020, 64, 209–228. [Google Scholar] [CrossRef]
- Liu, Y.; Guo, Y.; Zhou, Y. Poverty Alleviation in Rural China: Policy Changes, Future Challenges and Policy Implications. China Agric. Econ. Rev. 2018, 10, 241–259. [Google Scholar] [CrossRef]
- Vercammen, J. Farm Bankruptcy Risk as A Link Between Direct Payments and Agricultural Investment. Eur. Rev. Agric. Econ. 2007, 34, 479–500. [Google Scholar] [CrossRef]
- Goodwin, B.K.; Mishra, A.K. Another Look at Decoupling: Additional Evidence on the Production Effects of Direct Payments. Am. J. Agric. Econ. 2005, 87, 1200–1210. [Google Scholar] [CrossRef]
- Biagini, L.; Antonioli, F.; Severini, S. The Role of The Common Agricultural Policy in Enhancing Farm Income: A Dynamic Panel Analysis Accounting for Farm Size in Italy. J. Agric. Econ. 2020, 71, 652–675. [Google Scholar] [CrossRef]
- Tang, L.; Sun, S. Fiscal Incentives, Financial Support for Agriculture, and Urban-rural Inequality. Int. Rev. Financ. Anal. 2022, 80, 102057. [Google Scholar] [CrossRef]
- Hemming, D.J.; Chirwa, E.W.; Dorward, A.; Ruffhead, H.J.; Hill, R.; Osborn, J.; Langer, L.; Harman, L.; Asaoka, H.; Coffey, C. Agricultural Input Subsidies for Improving Productivity, Farm Income, Consumer Welfare and Wider Growth in Low-and Lower-middle-income Countries: A Systematic Review. Campbell Syst. Rev. 2018, 14, 1–153. [Google Scholar] [CrossRef]
- Li, J. Evaluating the Effects of Agricultural Subsidy Policies: Incentive and Wealth Effects. Chin. Rural Econ. 2016, 12, 17–32. [Google Scholar]
- Zhong, C.; Chen, S.; Xu, C. Structural Change, Factor Relative Prices and Farm Household Behavior—Theoretical Models and Micro-Empirical Evidence on Agricultural Subsidies. J. Financ. Res. 2013, 5, 167–180. [Google Scholar]
- Xie, E.; Song, Y. Tax, Transfer Payment and Top Income Inequality. J. Hohai Univ. (Philos. Soc. Sci.) 2022, 24, 47–65+135. [Google Scholar]
- Wang, X.; Shao, S.; Li, L. Agricultural Inputs, Urbanization, and Urban-Rural Income Disparity: Evidence from China. China Econ. Rev. 2019, 55, 67–84. [Google Scholar] [CrossRef]
- Heerink, N.; Kuiper, M.; Shi, X. China’s New Rural Income Support Policy: Impacts on Grain Production and Rural Income Inequality. China World Econ. 2006, 14, 58–69. [Google Scholar] [CrossRef]
- Yang, Y.; Lin, W. Agricultural Machinery Purchase Subsidy, Agricultural Mechanization Service, and Farmers’ Income. J. Agrotech. Econ. 2021, 9, 16–35. [Google Scholar] [CrossRef]
- Yang, J.; Deng, Y. Research on the Impact of China’s Rural Pension Insurance to Household Income Inequality. J. Quant. Technol. Econ. 2020, 37, 83–100. [Google Scholar] [CrossRef]
- Lee, J. Changes in the Source of China’s Regional Inequality. China Econ. Rev. 2000, 11, 232–245. [Google Scholar] [CrossRef]
- Koenker, R.; Bassett, G., Jr. Regression Quantiles. Econom. J. Econom. Soc. 1978, 46, 33–50. [Google Scholar] [CrossRef]
- Lv, X.; Hu, X. Agricultural Subsidies, Non-Farm Employment and Food Production—Based on Research Data from Heilongjiang, Jilin, Henan and Shandong Provinces. Issues Agric. Econ. 2017, 38, 85–91. [Google Scholar] [CrossRef]
- Wan, H.; Wang, Y. New Changes for Income Inequality in Rural China. Issues Agric. Econ. 2022, 1, 27–39. [Google Scholar] [CrossRef]
- Shen, X.; Li, H.; Li, H. Will Entrepreneurship Exacerbate Income Inequality in Rural Areas? J. Agrotech. Econ. 2020, 10, 33–47. [Google Scholar] [CrossRef]
- Niu, W.; Shen, S.; Luo, L.; Zhang, b.; Jin, Y. Does Farmer’s Concurrent Business Expand Income Gap in Rural Areas? A Case Study in Upper-middle Yellow River Basin. J. Arid Land Resour. Environ. 2022, 36, 80–87. [Google Scholar] [CrossRef]
- Rios-Avila, F. Recentered Influence Functions (RIFs) in Stata: RIF Regression and RIF Decomposition. Stata J. 2020, 20, 51–94. [Google Scholar] [CrossRef]
- Zhou, Z.; Zhang, C.; Peng, C.; Kong, X. Agricultural Mechanization and Farmers’ Incomes: Evidence from Agricultural Machinery Purchase Subsidy Policies. Chin. Rural Econ. 2016, 2, 68–82. [Google Scholar]
- Guo, J.; Yu, Z. Poverty Prevention Effect of Government Subsidies for Peasants: Based on Inspection of Agricultural Income and Wage Income. J. South-Cent. Minzu Univ. (Humanit. Soc. Sci.) 2021, 41, 48–56. [Google Scholar] [CrossRef]
- Dong, L.; Li, Y.; Sun, Z. Study on the Impact of Farmers’ Non-agricultural Income and Agricultural Technological Progress on Food Supply Security. Sci. Manag. Res. 2025, 43, 99–109. [Google Scholar]
- Zhao, X.; Xing, C. Construction of Cooperative Development Mechanism of Farmers’ Cooperatives and Precision Poverty Alleviation: Theoretical Logic and Practical Path. Issues Agric. Econ. 2016, 37, 23–29+110. [Google Scholar]

| Variables | Definition of Variables | Full Sample | 2014 | 2016 | 2018 | ||||
|---|---|---|---|---|---|---|---|---|---|
| Mean | SD | Mean | SD | Mean | SD | Mean | SD | ||
| lnx0 | Government subsidy amount | 4.288 | 3.225 | 4.710 | 2.723 | 4.358 | 3.211 | 3.986 | 3.460 |
| lny1 | Farm household net income | 10.643 | 0.986 | 10.280 | 1.205 | 10.610 | 0.891 | 10.880 | 0.859 |
| incD1 | Income inequality | 0.488 | 0.233 | 0.462 | 0.271 | 0.522 | 0.209 | 0.472 | 0.226 |
| age | Household head’s age | 35.950 | 13.460 | 34.550 | 13.070 | 35.430 | 13.500 | 37.220 | 13.510 |
| edu | Educational level is distributed in increasing order from 1–8 No schooling, Elementary school, Middle school, High school, Secondary school, Vocational education, University, Masters and above | 2.655 | 1.615 | 2.275 | 1.069 | 2.249 | 1.143 | 3.246 | 2.014 |
| hea | Health level is distributed in increasing order from 1–5 | 3.273 | 1.187 | 3.374 | 1.189 | 3.254 | 1.178 | 3.234 | 1.192 |
| size | Household size | 4.963 | 1.981 | 5.038 | 1.820 | 5.111 | 1.927 | 4.784 | 2.099 |
| zd | Land expropriation have = 1, otherwise = 0 | 0.069 | 0.254 | 0.068 | 0.252 | 0.064 | 0.244 | 0.075 | 0.264 |
| zr | Land transfer in have = 1, otherwise = 0 | 0.174 | 0.379 | 0.191 | 0.393 | 0.200 | 0.400 | 0.141 | 0.348 |
| zc | Land transfer out have = 1, otherwise = 0 | 0.142 | 0.349 | 0.070 | 0.255 | 0.088 | 0.284 | 0.233 | 0.423 |
| dg1 | Number of migrant laborers | 1.028 | 1.070 | 1.063 | 1.104 | 1.089 | 1.083 | 0.951 | 1.033 |
| net | Internet importance in increasing order of distribution from 1–5 | 2.856 | 1.594 | 2.337 | 1.510 | 2.755 | 1.579 | 3.220 | 1.561 |
| area | Region Western = 1, Northeastern = 2, Central = 3, Eastern = 4 | 2.410 | 1.230 | 2.521 | 1.205 | 2.339 | 1.227 | 2.414 | 1.241 |
| Variable | (1) | (2) |
|---|---|---|
| Net Household Income | Income Inequality Among Farm Households | |
| lnx0 | 0.019 *** | −0.004 *** |
| (5.84) | (−5.42) | |
| age | 0.001 | 0.000 |
| (0.05) | (0.07) | |
| edu | 0.017 ** | −0.007 *** |
| (2.04) | (−3.39) | |
| hea | −0.004 | −0.001 |
| (−0.41) | (−0.25) | |
| size | 0.085 *** | −0.023 *** |
| (9.93) | (−11.06) | |
| zd | 0.258 *** | −0.073 *** |
| (6.94) | (−8.06) | |
| zr | 0.038 | −0.010 |
| (1.43) | (−1.58) | |
| zc | 0.009 | −0.006 |
| (0.34) | (−1.01) | |
| dg1 | 0.179 *** | −0.043 *** |
| (18.43) | (−19.17) | |
| net | 0.006 | −0.002 |
| (0.79) | (−1.11) | |
| area | 0.149 *** | −0.031 *** |
| (3.28) | (−2.81) | |
| _cons | 9.067 *** | 0.754 *** |
| (18.35) | (6.40) | |
| Year dummy variable | Controlled | |
| N | 13,583 | 13,583 |
| r2 | 0.215 | 0.117 |
| F | 128.3 | 79.98 |
| Variable | FE | QR_10 | QR_25 | QR_50 | QR_75 | QR_90 |
|---|---|---|---|---|---|---|
| lnx0 | 0.019 *** | 0.014 *** | 0.005 | 0.002 | −0.002 | −0.005 |
| (0.003) | (0.005) | (0.003) | (0.002) | (0.002) | (0.003) | |
| age | 0.001 | −0.002 | 0.000 | 0.003 *** | 0.004 *** | 0.005 *** |
| (0.016) | (0.002) | (0.001) | (0.001) | (0.001) | (0.001) | |
| edu | 0.017 * | 0.115 *** | 0.103 *** | 0.087 *** | 0.086 *** | 0.100 *** |
| (0.009) | (0.013) | (0.009) | (0.006) | (0.006) | (0.009) | |
| hea | −0.004 | 0.029 ** | 0.024 ** | 0.028 *** | 0.018 *** | 0.007 |
| (0.009) | (0.014) | (0.009) | (0.007) | (0.007) | (0.009) | |
| size | 0.085 *** | 0.059 *** | 0.074 *** | 0.073 *** | 0.084 *** | 0.094 *** |
| (0.008) | (0.008) | (0.006) | (0.004) | (0.004) | (0.006) | |
| zd | 0.258 *** | 0.050 | 0.178 *** | 0.264 *** | 0.334 *** | 0.458 *** |
| (0.034) | (0.060) | (0.042) | (0.029) | (0.029) | (0.041) | |
| zr | 0.038 | 0.087 ** | 0.088 *** | 0.097 *** | 0.064 *** | 0.051 * |
| (0.027) | (0.041) | (0.028) | (0.019) | (0.020) | (0.028) | |
| zc | 0.009 | 0.099 ** | 0.112 *** | 0.119 *** | 0.147 *** | 0.166 *** |
| (0.027) | (0.046) | (0.032) | (0.022) | (0.022) | (0.031) | |
| dg1 | 0.179 *** | 0.329 *** | 0.251 *** | 0.155 *** | 0.078 *** | 0.025 ** |
| (0.009) | (0.015) | (0.010) | (0.007) | (0.007) | (0.010) | |
| net | 0.006 | 0.084 *** | 0.063 *** | 0.073 *** | 0.058 *** | 0.044 *** |
| (0.008) | (0.012) | (0.009) | (0.006) | (0.006) | (0.008) | |
| area | 0.149 *** | 0.095 *** | 0.085 *** | 0.080 *** | 0.079 *** | 0.063 *** |
| (0.048) | (0.013) | (0.009) | (0.006) | (0.006) | (0.009) | |
| Year dummy variable | Controlled | |||||
| _cons | 9.067 *** | 7.436 *** | 8.441 *** | 9.113 *** | 9.687 *** | 10.150 *** |
| (0.555) | (0.116) | (0.080) | (0.055) | (0.056) | (0.078) | |
| Variable | Q10–Q50 | Q10–Q75 | Q10–Q90 | Q20–Q75 | Q25–Q90 |
|---|---|---|---|---|---|
| lnx0 | −0.011 *** | −0.015 *** | −0.019 *** | −0.006 ** | −0.010 ** |
| (0.004) | (0.004) | (0.005) | (0.003) | (0.004) | |
| age | 0.005 *** | 0.006 *** | 0.007 *** | 0.004 *** | 0.005 *** |
| (0.001) | (0.001) | (0.002) | (0.001) | (0.001) | |
| edu | −0.028 ** | −0.029 ** | −0.015 | −0.017 * | −0.003 |
| (0.012) | (0.013) | (0.015) | (0.009) | (0.011) | |
| hea | −0.002 | −0.012 | −0.022 | −0.007 | −0.017 |
| (0.012) | (0.011) | (0.015) | (0.010) | (0.011) | |
| size | 0.014 ** | 0.025 *** | 0.036 *** | 0.010 ** | 0.020 *** |
| (0.007) | (0.008) | (0.009) | (0.005) | (0.007) | |
| zd | 0.214 *** | 0.284 *** | 0.409 *** | 0.155 *** | 0.280 *** |
| (0.060) | (0.068) | (0.080) | (0.044) | (0.076) | |
| zr | 0.009 | −0.024 | −0.036 | −0.024 | −0.036 |
| (0.037) | (0.040) | (0.043) | (0.025) | (0.035) | |
| zc | 0.020 | 0.047 | 0.067 | 0.034 | 0.054 * |
| (0.035) | (0.039) | (0.047) | (0.025) | (0.032) | |
| dg1 | −0.174 *** | −0.251 *** | −0.304 *** | −0.174 *** | −0.226 *** |
| (0.013) | (0.012) | (0.013) | (0.010) | (0.012) | |
| net | −0.011 | −0.027 ** | −0.040 *** | −0.005 | −0.018 |
| (0.011) | (0.013) | (0.015) | (0.008) | (0.011) | |
| area | −0.015 | −0.016 | −0.031 ** | −0.006 | −0.022 * |
| (0.012) | (0.015) | (0.014) | (0.009) | (0.012) | |
| Year dummy variable | Controlled | ||||
| _cons | 1.676 *** | 2.250 *** | 2.714 *** | 1.246 *** | 1.709 *** |
| (0.099) | (0.107) | (0.132) | (0.096) | (0.118) | |
| Variable | (1) | (2) | (3) |
|---|---|---|---|
| incD1 | lntr | incD1 | |
| lntr | −0.004 *** | ||
| (0.00) | |||
| lnx0 | −0.004 *** | 0.146 *** | −0.0001 *** |
| (−5.42) | (0.006) | (0.00) | |
| Control variables | Controlled | Controlled | Controlled |
| Adj R2 | 0.117 | 0.268 | 0.207 |
| F-value | 79.98 | 451.86 | 295.86 |
| Sobel | 0.000 *** | ||
| Goodman-1 | 0.000 *** | ||
| Goodman-2 | 0.000 *** | ||
| Variable | (1) | (2) |
|---|---|---|
| Agricultural Development Subsidy | Safeguard Policy Subsidy | |
| lnx0 | −0.024 *** | −0.014 |
| (0.006) | (0.014) | |
| age | −0.001 ** | −0.003 ** |
| (0.001) | (0.002) | |
| edu | −0.039 *** | −0.094 *** |
| (0.007) | (0.020) | |
| hea | −0.013 *** | −0.008 |
| (0.005) | (0.013) | |
| size | −0.011 *** | −0.046 *** |
| (0.003) | (0.009) | |
| zd | −0.095 *** | −0.218 *** |
| (0.021) | (0.061) | |
| zr | −0.014 | 0.054 |
| (0.014) | (0.049) | |
| zc | −0.026 | −0.068 |
| (0.021) | (0.058) | |
| dg1 | −0.072 *** | −0.077 *** |
| (0.005) | (0.017) | |
| area | −0.032 *** | 0.003 |
| (0.005) | (0.013) | |
| net | −0.016 *** | −0.019 |
| (0.004) | (0.013) | |
| _cons | 1.038 *** | 1.324 *** |
| (0.052) | (0.148) | |
| r2 | 0.206 | 0.358 |
| r2_a | 0.201 | 0.324 |
| Variable | (1) | (2) | (3) | (4) |
|---|---|---|---|---|
| West | Northeast | Central | East | |
| lnx0 | −0.0052 *** | −0.0048 *** | −0.003 ** | −0.002 |
| (0.001) | (0.002) | (0.001) | (0.001) | |
| age | −0.001 | 0.031 * | −0.004 | 0.005 |
| (0.005) | (0.016) | (0.009) | (0.011) | |
| edu | −0.005 | −0.004 | −0.007 | −0.015 *** |
| (0.003) | (0.006) | (0.004) | (0.004) | |
| hea | −0.009 ** | 0.011 * | 0.010 ** | −0.003 |
| (0.004) | (0.006) | (0.004) | (0.004) | |
| size | −0.027 *** | −0.020 *** | −0.025 *** | −0.021 *** |
| (0.004) | (0.007) | (0.004) | (0.003) | |
| zd | −0.089 *** | −0.168 *** | −0.072 *** | −0.028 * |
| (0.013) | (0.032) | (0.015) | (0.014) | |
| zr | −0.002 | −0.024 | −0.013 | −0.009 |
| (0.011) | (0.017) | (0.012) | (0.012) | |
| zc | −0.007 | −0.051 ** | −0.007 | 0.007 |
| (0.012) | (0.021) | (0.011) | (0.011) | |
| dg1 | −0.044 *** | −0.034 *** | −0.050 *** | −0.033 *** |
| (0.004) | (0.007) | (0.004) | (0.004) | |
| net | −0.003 | 0.003 | −0.000 | −0.002 |
| (0.003) | (0.005) | (0.003) | (0.003) | |
| _cons | 0.837 *** | −0.517 | 0.763 *** | 0.454 |
| (0.159) | (0.560) | (0.284) | (0.363) | |
| Year dummy variable | Controlled | |||
| N | 5046 | 1426 | 3544 | 3567 |
| r2 | 0.120 | 0.144 | 0.170 | 0.097 |
| Variable | (1) | (2) |
|---|---|---|
| Youth Group | Middle-Aged and Old-Aged Group | |
| x0 | −0.005 *** | −0.003 *** |
| (0.001) | (0.001) | |
| edu | 0.001 | −0.002 |
| (0.003) | (0.003) | |
| hea | 0.001 | −0.003 |
| (0.003) | (0.003) | |
| size | −0.021 *** | −0.028 *** |
| (0.002) | (0.003) | |
| zd | −0.077 *** | −0.067 *** |
| (0.011) | (0.012) | |
| zr | −0.002 | −0.016 * |
| (0.009) | (0.009) | |
| zc | −0.011 | 0.005 |
| (0.008) | (0.010) | |
| dg1 | −0.039 *** | −0.049 *** |
| (0.003) | (0.003) | |
| area | −0.024 ** | −0.037 |
| (0.012) | (0.026) | |
| net | −0.005 * | 0.002 |
| (0.002) | (0.003) | |
| _cons | 0.708 *** | 0.800 *** |
| (0.039) | (0.067) | |
| Year dummy variable | Controlled | |
| N | 7337 | 6246 |
| r2 | 0.136 | 0.114 |
| Benchmark Regression | Instrumental Variables (2SLS) | ||
|---|---|---|---|
| First Stage | Second Stage | ||
| Government subsidy | −0.004 *** | −0.134 *** | |
| Average provincial government subsidy | 0.0001 *** | ||
| Durbin–Watson (score) test p-value | 0.000 | ||
| Wu–Hausman test p-value | 0.000 | ||
| Shea’s partial R-squared | 0.000 | ||
| Variable | (1) | (2) | (3) |
|---|---|---|---|
| Q90–Q10 Quantile | Gini Coefficient | Variance | |
| lnx0 | −0.027 *** | −0.001 *** | −0.026 *** |
| (0.008) | (0.000) | (0.007) | |
| age | 0.020 *** | 0.000 *** | 0.009 *** |
| (0.003) | (0.000) | (0.002) | |
| edu | −0.047 ** | −0.000 | 0.008 |
| (0.021) | (0.000) | (0.013) | |
| hea | −0.059 ** | −0.001 ** | −0.012 |
| (0.025) | (0.000) | (0.018) | |
| size | −0.011 | 0.000 | 0.018 |
| (0.015) | (0.000) | (0.013) | |
| zd | 0.158 | 0.003 * | 0.142 ** |
| (0.099) | (0.002) | (0.069) | |
| zr | −0.137 ** | −0.003 ** | −0.060 |
| (0.069) | (0.001) | (0.057) | |
| zc | −0.052 | −0.000 | −0.005 |
| (0.068) | (0.001) | (0.040) | |
| dg1 | −0.491 *** | −0.009 *** | −0.310 *** |
| (0.024) | (0.000) | (0.020) | |
| net | −0.034 | −0.001 *** | −0.028 * |
| (0.021) | (0.000) | (0.016) | |
| area | −0.088 *** | −0.002 *** | −0.046 ** |
| (0.023) | (0.000) | (0.020) | |
| r2 | 0.062 | 0.073 | 0.044 |
| r2_a | 0.061 | 0.073 | 0.043 |
| Variable | (1) | (2) |
|---|---|---|
| Net Household Income | Income Inequality Among Farm Households | |
| lnx0 | 0.014 *** | −0.004 *** |
| (5.83) | (−5.42) | |
| age | 0.008 | 0.000 |
| (0.67) | (0.07) | |
| edu | 0.022 *** | −0.007 *** |
| (3.11) | (−3.39) | |
| hea | 0.004 | −0.001 |
| (0.56) | (−0.25) | |
| size | 0.073 *** | −0.023 *** |
| (10.28) | (−11.06) | |
| zd | 0.240 *** | −0.073 *** |
| (7.93) | (−8.06) | |
| zr | 0.029 | −0.010 |
| (1.31) | (−1.58) | |
| zc | 0.010 | −0.006 |
| (0.50) | (−1.01) | |
| dg1 | 0.148 *** | −0.043 *** |
| (19.73) | (−19.17) | |
| net | 0.008 | −0.002 |
| (1.37) | (−1.11) | |
| area | 0.111 *** | −0.031 *** |
| (2.97) | (−2.81) | |
| _cons | 9.119 *** | −0.004 *** |
| (22.64) | (−5.42) | |
| Year dummy variable | Controlled | |
| N | 13,583 | 13,583 |
| r2 | 0.228 | 0.117 |
| F | 159.1 | 79.98 |
Disclaimer/Publisher’s Note: The statements, opinions and data contained in all publications are solely those of the individual author(s) and contributor(s) and not of MDPI and/or the editor(s). MDPI and/or the editor(s) disclaim responsibility for any injury to people or property resulting from any ideas, methods, instructions or products referred to in the content. |
© 2025 by the authors. Licensee MDPI, Basel, Switzerland. This article is an open access article distributed under the terms and conditions of the Creative Commons Attribution (CC BY) license (https://creativecommons.org/licenses/by/4.0/).
Share and Cite
Wang, L.; Deng, L.; Zheng, S. The Impact of Government Subsidies on Income Inequality Among Farm Households in China: Evidence from CFPS Panel Data. Agriculture 2025, 15, 1142. https://doi.org/10.3390/agriculture15111142
Wang L, Deng L, Zheng S. The Impact of Government Subsidies on Income Inequality Among Farm Households in China: Evidence from CFPS Panel Data. Agriculture. 2025; 15(11):1142. https://doi.org/10.3390/agriculture15111142
Chicago/Turabian StyleWang, Leyi, Li Deng, and Shi Zheng. 2025. "The Impact of Government Subsidies on Income Inequality Among Farm Households in China: Evidence from CFPS Panel Data" Agriculture 15, no. 11: 1142. https://doi.org/10.3390/agriculture15111142
APA StyleWang, L., Deng, L., & Zheng, S. (2025). The Impact of Government Subsidies on Income Inequality Among Farm Households in China: Evidence from CFPS Panel Data. Agriculture, 15(11), 1142. https://doi.org/10.3390/agriculture15111142