Article

Data Elements and Agricultural Green Total Factor Productivity: Evidence from a Quasi-Natural Experiment Based on Public Data Openness in China

School of Economics and Management, Yantai University, Yantai 264005, China
*
Author to whom correspondence should be addressed.
Agriculture 2025, 15(11), 1130; https://doi.org/10.3390/agriculture15111130
Submission received: 16 April 2025 / Revised: 20 May 2025 / Accepted: 21 May 2025 / Published: 23 May 2025
(This article belongs to the Section Agricultural Economics, Policies and Rural Management)

Abstract

:
The digital economy’s development has been significantly influenced by data, which have emerged as a new propelling force for the promotion of high-quality and environmentally friendly agricultural development. This paper employs panel data from 30 provinces in China, spanning from 2000 to 2022. We construct a multi-period difference-in-differences model to investigate the impact of data elements on agricultural green total factor productivity (AGTFP) by utilizing the launch of public data open platforms as a quasi-natural experiment. AGTFP is substantially improved by public data openness, as indicated by the findings. Cross-sectoral labor transfer and green technological innovation are critical pathways through which public data openness enhances AGTFP, according to the mechanism analysis. Furthermore, heterogeneity analysis indicates that the beneficial impact of public data openness on AGTFP is more pronounced in regions with high levels of environmental regulation and non-major grain-producing regions. The results of this study have significant policy implications for the evaluation of the economic impacts of data elements and the promotion of sustainable and environmentally friendly agricultural development.

1. Introduction

Since the reform and opening-up, China has garnered global attention for its accelerated agricultural and rural development. In contrast, the “extensive development” of agriculture has resulted in the emergence of more prominent issues, including environmental pollution and the scarcity of agricultural resources, despite its contribution to accelerated economic growth [1]. China’s No. 1 central document for 2024 underscored the necessity of “adhering to the principles of agricultural development through industry, quality, and green practices, and promoting high-quality agricultural development”. In recent years, the digital economy has arisen as a novel economic paradigm driven by digital technologies and characterized by data as a key production factor as a result of the deep implementation of the digital economy development strategy [2]. In this context, the Chinese government, in the “White Paper on Digital Economy Development in China (2024)”, emphasized that data elements are empowering modern agriculture, thereby improving its precision, efficiency, and sustainability. However, the current application of agricultural data continues to encounter a multitude of obstacles, including the incompleteness of data acquisition and the inadequacy of data analysis capabilities. The emergence of public data open platforms has created novel opportunities for the sharing and implementation of agricultural data [3]. In this context, the construction of a modern economic system and the high-quality development of the national economy are contingent upon the attainment of high-quality agricultural development, which is led by the growth of green total factor productivity. Accordingly, this study aims to systematically examine the impact of public data openness on agricultural green total factor productivity (AGTFP), focusing on two core research questions: (1) Does public data openness affect AGTFP? (2) Through which mechanisms does public data openness influence AGTFP? By addressing these questions in depth, this study fills a gap in the existing literature and reveals the essential role of public data openness in advancing green agricultural development.
In recent years, scholars have primarily concentrated their research on AGTFP in two primary areas: the measurement methods and the development of an indicator system for AGTFP. DEA and other non-parametric methods are preferred when accounting for undesirable outputs, and Stochastic Frontier Analysis (SFA) and Data Envelopment Analysis (DEA) are the primary measurement methods employed by academicians [4,5]. The agricultural production process has been transformed into a dynamic model that includes “inputs + desirable outputs + undesirable outputs” in the design of the indicator system for AGTFP, as per the extant literature. This method employs the carbon emission coefficients of agricultural input factors to evaluate AGTFP from a “low-carbon” perspective [6]. The second area of research concentrates on the factors that affect AGTFP. Digital rural development and marketization are considered to be critical factors in the enhancement of AGTFP [7,8], while factor market distortions and agricultural industrial agglomeration are perceived as obstacles [9].
The consequences of public data openness have been extensively investigated by the academic community. There is a wealth of existing research that examines the economic implications of public data openness from both macro and micro perspectives. From a macro perspective, the promotion of regional coordinated development and the reduction in disparities in development levels within urban areas are significantly influenced by public data openness [10]. Furthermore, public data transparency can not only directly stimulate economic growth by providing essential data elements for production, innovation, and other socio-economic activities, but it can also indirectly contribute to economic growth by improving the effectiveness of government governance [11]. Firms are essential entities in the utilization of data elements at the micro level, as they are the fundamental units of economic activity. As noted by certain scholars, public data can be considered a critical resource in the innovation processes of firms, thereby reducing innovation costs in terms of labor, capital, and other resources [12]. In addition, the availability of public data reduces the uncertainty associated with corporate investment, enabling businesses to identify new market opportunities, make more informed location decisions, and generate both commercial and social values [13]. The aforementioned studies suggest that the impact of public data openness on economic development is substantial, particularly in terms of resource allocation efficiency and innovation. The mechanisms by which public data openness influences agricultural development are yet to be completely investigated, as it is a distinctive production sector. This presents a significant research opportunity for this investigation. While prior research has demonstrated the positive effects of public data openness on economic development—especially in improving resource allocation and fostering innovation—its role in the agricultural sector remains underexamined. Considering the unique features of agricultural production, spatial distribution, and policy environment, agriculture’s response to data openness may differ significantly from other sectors. Therefore, it is essential to investigate how public data openness affects AGTFP, particularly in facilitating green transformation and sustainable rural development.
The primary focus of the literature that is directly relevant to this paper is the influence of the digital economy on AGTFP. Several investigations suggest that the digital transformation of agriculture, rural digitalization, and digital finance significantly improve AGTFP [14,15,16]. The “digital divide” and novel forms of digital inequality may result from the development of the digital economy, as noted by other scholars. The existence of a digital divide can have a differentiated impact on the growth of regional agricultural total factor productivity. This, in turn, may lead to productivity disparities between regions, which will further distort factor allocation and impede the enhancement of agricultural total factor productivity [17]. The function of data elements in fostering agricultural and rural development has been the subject of preliminary research by a few scholars. For example, Xie et al. [18] argue that the primary objective of agricultural digital transformation innovation is to fundamentally transform agricultural production operations by enhancing the efficiency of resource allocation through data restructuring, beginning with an analysis of how data elements reshape the efficiency of agricultural production factor allocation. This transition is characterized by a transition from data-supported innovation to data-driven innovation, thereby fostering the development of a high-quality agricultural economy. However, these studies have yet to deeply examine the specific role of data elements in enhancing agricultural green total factor productivity, particularly the effects and mechanisms of public data openness on AGTFP. Although existing research has partially addressed the potential of data-driven innovation in agricultural development, it lacks a systematic analysis of how public data openness can improve AGTFP through mechanisms such as promoting cross-sectoral labor transfer and green technology innovation. This research gap underscores a limitation in the current literature and identifies a critical direction for further inquiry into how public data openness can contribute to the improvement in AGTFP.
This paper employs public data open platforms as a quasi-natural experiment to investigate the influence of data elements on AGTFP. The following are the potential marginal contributions of this paper: initially, prior research has predominantly concentrated on the effects of public data openness on enterprise innovation and regional coordinated development, with limited investigation of its impact on the agricultural sector. This paper concentrates on the role of public data openness in fostering environmental protection and agricultural development, examining its impact on AGTFP and thereby contributing to the current corpus of research. Secondly, the primary concentration of contemporary academic research on public data openness is qualitative analysis, with an emphasis on institutional design or status assessment. In order to further establish the significance of public data transparency across various regions, environmental regulation levels, and agricultural production characteristics, this paper implements a multi-period difference-in-differences model. Third, this paper explores the mechanisms of public data openness on AGTFP, with a specific emphasis on factors such as cross-sectoral labor transfer and green technological innovation. This analysis provides valuable policy insights for advancing green agricultural development and fostering the deep integration of data elements with modern agriculture.
The remainder of this paper has the following structure. The next section reviews the literature to establish a theoretical framework for further investigation. Then, Section 3 describes the data and methodology. After that, Section 4 presents the empirical results of the estimations, investigates the channels of its effect, and conducts additional tests for heterogeneous effects. Finally, Section 5 concludes the research and offers some policy recommendations.

2. Theoretical Analysis and Research Hypotheses

2.1. The Effects of Public Data Openness on AGTFP

Grounded in the agricultural technology diffusion theory, this paper explores how public data openness directly affects AGTFP. This theory emphasizes that technological progress alone does not guarantee productivity gains; rather, it is the diffusion and adoption of innovations—facilitated by effective information flows and institutional mechanisms—that drive systemic change. The following two aspects are the primary indicators of the direct impact of public data openness on AGTFP: initially, the excessive consumption of tangible resources and energy in traditional agricultural production is mitigated by public data. Traditional economic development frequently encounters challenges in overcoming its substantial dependence on energy and the environment [19]. The extensive development model, which is defined by its high input, high consumption, and high pollution, is no longer sustainable. Farmers can optimize crop planning by identifying the best uses and potential of their land through the opening of data [20]. This approach also reduces the use of inputs such as fertilizers and pesticides, thereby reducing production costs and enhancing AGTFP. Subsequently, the availability of public data provides an incentive for local governments. This motivates them to allocate resources toward the development of agricultural digital infrastructure. The establishment of network infrastructure is a prerequisite for the exchange of agricultural data over the internet [21]. The rate of agricultural digital development is substantially determined by the quality of digital infrastructure. In agricultural production, digital infrastructures, including drone imaging systems, satellite remote sensing, and IoT sensor systems, are implemented to facilitate precise irrigation and fertilization [22]. By establishing green agricultural ecological cycles, these technologies can significantly reduce superfluous inputs in agricultural production, thereby enhancing AGTFP and reducing agricultural carbon emissions. This paper suggests the subsequent hypothesis in accordance with the preceding analysis.
H1. 
Public data openness enhances AGTFP.

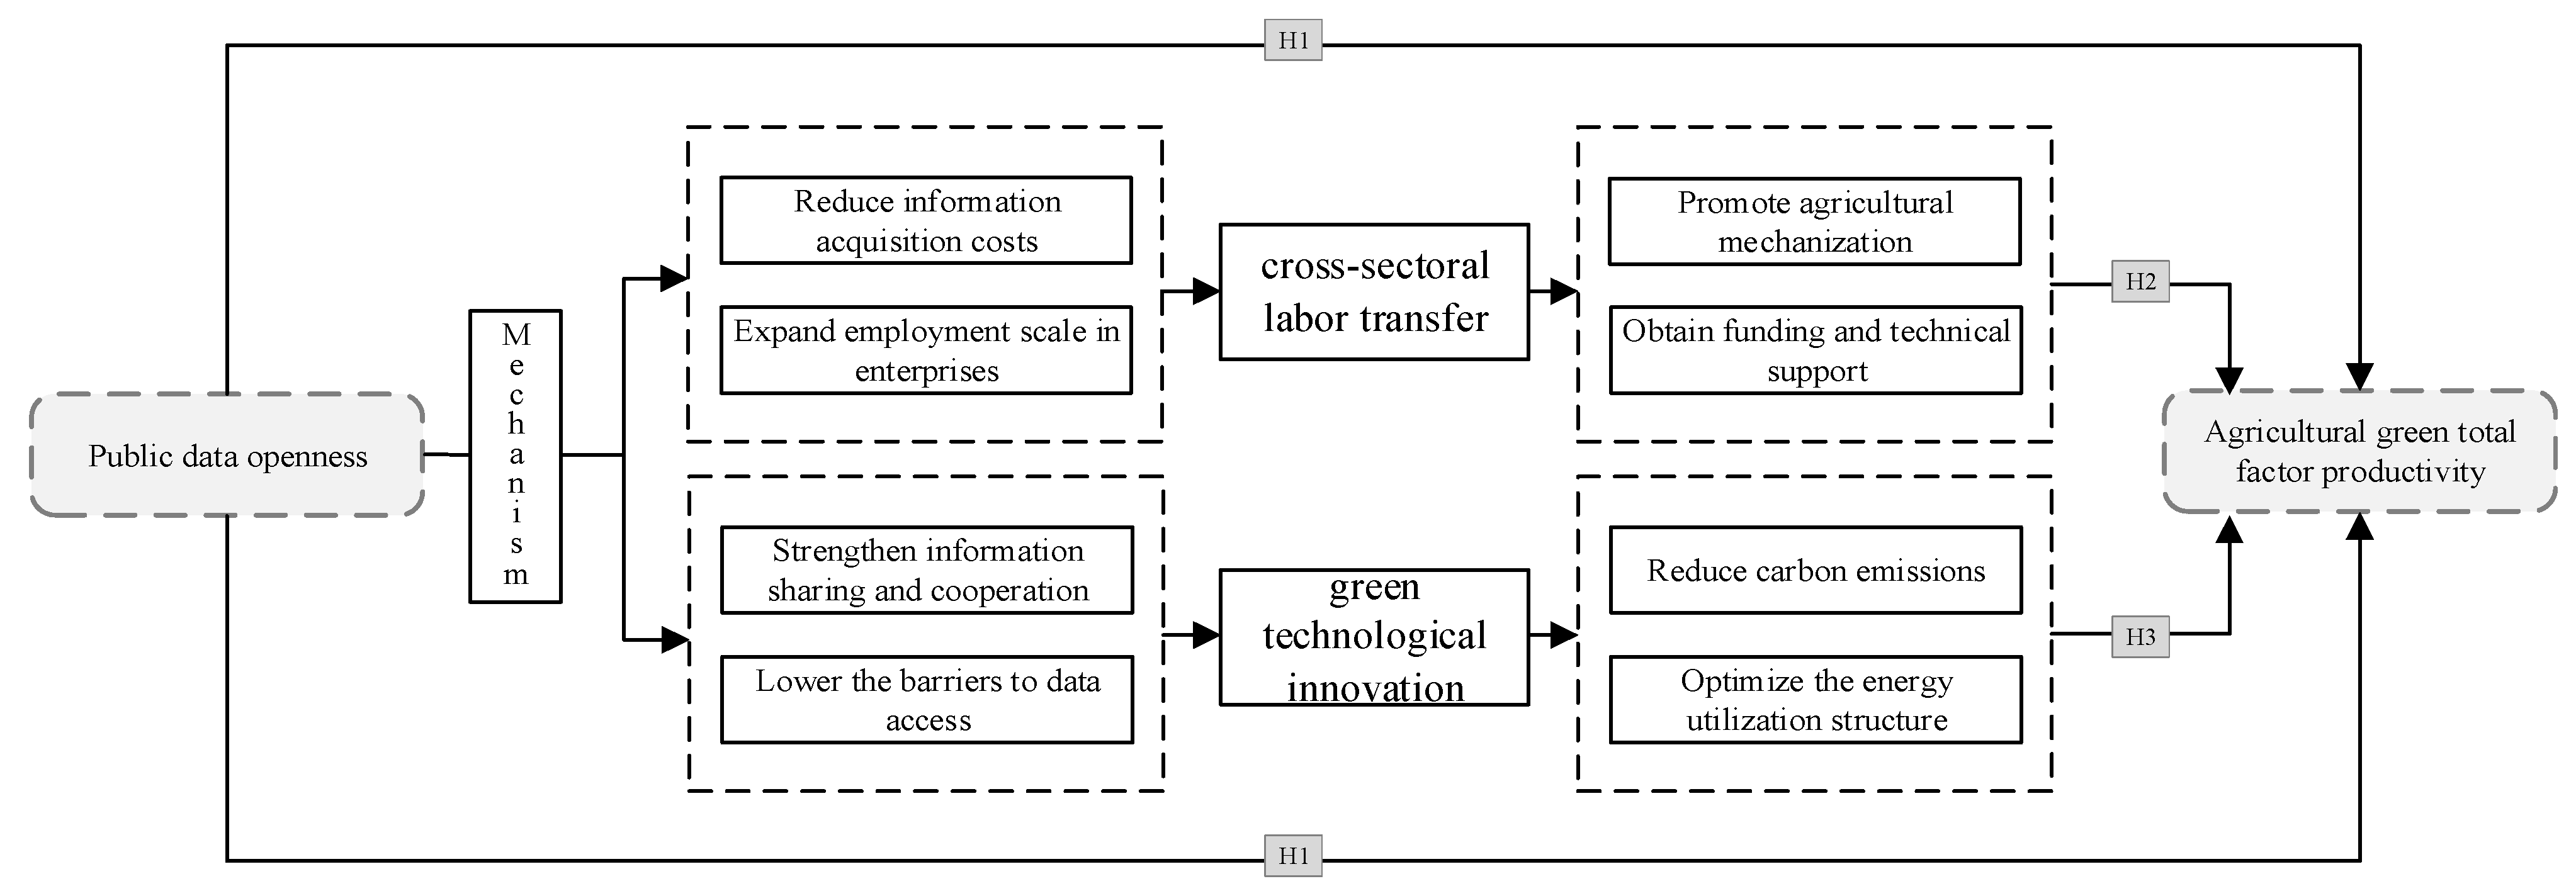
2.2. The Mechanism of Public Data Openness on AGTFP

2.2.1. Data Openness, Cross-Sectoral Labor Transfer, and AGTFP

Cross-sectoral labor transfer refers to the process of reallocating labor from one economic sector to another. In many developing countries, this is commonly observed in the migration of rural labor from the traditional agricultural sector to non-agricultural sectors [23]. Public data openness plays a critical role in reshaping the allocation of rural labor resources. On the one hand, it mitigates information asymmetry in rural labor markets. In traditional agricultural labor markets, farmers often lack access to comprehensive data on external employment opportunities, wage differentials, and required skills, which limits their mobility [24]. By providing information on job vacancies, wage levels, and skill requirements, public data platforms enhance labor market transparency, enabling farmers to make more informed decisions and facilitating labor migration from low-productivity agriculture to higher-productivity sectors. On the other hand, public data openness improves human capital allocation by offering access to information on education, vocational training, and industry-specific skill demands. This enables rural workers to upgrade their skills in accordance with the requirements of emerging sectors, thereby improving labor productivity. In this way, public data not only facilitate the effective matching of the labor market but also promote the continuous development and innovation of various industries. Additionally, the transparency of government data has the potential to increase employment growth within enterprises and enhance both functional and skill-based employment structures, thereby creating additional job opportunities [25].
AGTFP is directly influenced by cross-sectoral labor transfer on this basis. Initially, the industrial sector experiences an increase in the capital return rate, while the agricultural sector experiences capital deepening. This is due to labor transfer. Farmers typically employ a reduced number of laborers to engage in larger-scale agricultural production as agricultural capital deepens [26]. The remaining labor force is composed of more experienced and competent farmers. The improvement in labor productivity and the promotion of long-term development in AGTFP are a result of the reduction in labor forces in agricultural production, which is facilitated by mechanization and automation. Secondly, cross-sectoral labor transfer has the potential to provide agricultural production with additional financial and technical support. On the one hand, the AGTFP can be enhanced by the investment of increased income from transferred labor in rural households in more refined and efficient agricultural practices [27]. Alternatively, the adoption and implementation of modern agricultural technologies and management practices can be facilitated by the transfer of laborers to other sectors. This process enables the removal of small-scale producers from agricultural production, thereby promoting the scaling-up of agricultural operations and the circulation of land. Thus, productivity and resource efficiency are improved, and green agricultural development is promoted. This paper suggests the subsequent hypothesis in accordance with the preceding analysis.
H2. 
Public data openness positively affects AGTFP by promoting cross-sectoral labor transfer.

2.2.2. Public Data Openness, Green Technological Innovation, and AGTFP

Green technological innovation is the act of combining green production factors and manufacturing conditions to achieve the ultimate objectives of sustainable development, energy efficiency improvement, pollution prevention and control, and resource conservation [28]. Public data openness plays a key enabling role in this process by reducing information asymmetries and facilitating knowledge exchange across disciplinary and institutional boundaries. By offering open access to environmental, industrial, and technological datasets, it promotes interdisciplinary collaboration among researchers and policymakers, thus accelerating the development and dissemination of ecological technologies [29]. Furthermore, enhanced data accessibility lowers barriers to innovation, especially for small and medium-sized enterprises and entrepreneurial actors who often face difficulties accessing proprietary information. Specifically, the openness of public data enables enterprises to access real-time information on market demand, technological advancements, and policy support, thereby accelerating the implementation and commercialization of innovations and further enhancing the industrial application potential of green technologies. These factors work in concert to drive the development of a green technology innovation system, promoting the comprehensive advancement and widespread application of green technologies.
Agricultural technological innovation not only promotes the development and adoption of energy-efficient technologies, such as fuel-efficient diesel engines and fuel additives, but also considerably improves the performance of existing agricultural machinery. These cutting-edge technologies enhance energy efficiency, decrease dependence on fossil fuels, and, as a result, decrease carbon emissions in agricultural production [30]. Simultaneously, technological innovation expedites the development and utilization of renewable energy in rural areas, such as photovoltaic power and biomass energy, thereby optimizing the agricultural energy structure. In particular, the utilization of biomass resources, including crop residues and livestock manure, not only mitigates environmental pollution but also provides agriculture with renewable energy support [31]. In addition to enhancing energy efficiency, these technological advancements also contribute to the enhancement of AGTFP. This paper suggests the subsequent hypothesis in accordance with the preceding analysis.
H3. 
Public data openness positively influences AGTFP by promoting green technological innovation.
Drawing from the analysis above, the hypothetical framework of this study is shown in Figure 1.

3. Data, Variables, and Methods

3.1. Data Sources

There are two primary sources of data for this investigation. Initially, the data for the calculation of AGTFP and control variables have been sourced from the “China Statistical Yearbook”, “Provincial Statistical Yearbooks”, “China Rural Statistical Yearbook”, and “China Urban Statistical Yearbook” for the years 2000 to 2022. The sample excludes the Xizang Autonomous Region, Hong Kong SAR, Macao SAR, and Taiwan Province of China due to limitations in data availability. Interpolation algorithms were employed to supplement any missing data. Secondly, the data on the public data open platforms of various provinces in China are derived from the “China Local Government Data Openness Report” released by the Digital and Mobile Governance Lab of Fudan University and cross-verified using the Baidu News search engine.

3.2. Variables

3.2.1. The Dependent Variable: AGTFP

This paper employs the super-efficiency SBM model to calculate AGTFP [32], with its dynamic characteristics measured using the Global Malmquist–Luenberger (GML) index. The selection of indicators in this study follows the approach of Li and Shi [33] and is specified as follows: input indicators primarily include agricultural labor, land, agricultural machinery, fertilizers, and agricultural water use. Output indicators consist of both desirable and undesirable outputs. The desirable output is measured by the total value of agricultural output, while the undesirable outputs account for pollution indicators, including agricultural non-point source pollution and agricultural carbon emissions. Based on the method of Zhang and He [34], agricultural undesired outputs mainly manifest as agricultural carbon emissions caused by six major factors: fertilizers, pesticides, agricultural films, diesel, tillage, and irrigation. This paper adopts the non-point source pollution calculation method proposed by Lai et al. [35]—the unit survey assessment method—and uses nitrogen fertilizer emissions and phosphorus fertilizer emissions as pollution sources to calculate agricultural non-point source pollution emissions. The specific formula is as follows:
E = i = 1 E U i × ρ i × C i E U i , S = i = 1 P E i × C i E U i , S
where E represents the agricultural non-point source pollution emissions, referring to the total amount of pollutants generated by pollution unit i that enter water bodies and pollute water resources; E U i is the statistical quantity of pollution unit i; ρ i is the generation coefficient of pollution unit i; C i is the loss coefficient of the pollution unit i, both of which are determined based on the natural conditions of the pollution unit E U i and the natural conditions where the pollution unit is located. S represents the specific conditions at the pollution unit’s location, which can be used to determine the coefficient values; P E i is the agricultural non-point source pollution generation. Specific input–output indicators are detailed in Table 1.
The specific steps are as follows: Let n be the number of decision-making units (DMUs), where each DMU has m types of inputs; r 1 are the types of expected outputs, and r 2 are the types of unexpected outputs. In this study, n = 30; m = 5; r 1 = 1, and r 2 = 2. The slack variables for inputs, expected outputs, and unexpected outputs are denoted as r i x , r k y , and r l z , respectively. λ j represents the weight vector, and ρ is the agricultural green development efficiency value. The formula is as follows:
ρ = min 1 + 1 m i = 1 m r i x x i 0 1 1 r 1 + r 2 k = 1 r 1 r k y y k 0 + l = 1 r 2 r l z z l 0
s . t . x i 0 j = 1 , 0 n λ j x j r i x , i ; y k 0 j = 1 , 0 n λ j y j + r k y , k ; z l 0 j = 1 , 0 n λ j z j r l z , l ; 1 1 r 1 + r 2 k = 1 r 1 r k y y k 0 + l = 1 r 2 r l z z l 0 > 0 ; r i x 0 ; r k y 0 ; r l z 0 , λ j 0 , i , j , k , l ;
Given the long-term and dynamic nature of agricultural production, this investigation implements the global DEA model with unexpected results to compute the GML index in accordance with Oh [36]. The expression for this index is as follows:
G M L C G = E C G x t + 1 , y t + 1 E C G x t , y t = E C t + 1 x t + 1 , y t + 1 E C t x t , y t × E C G x t + 1 , y t + 1 E C t + 1 x t + 1 , y t + 1 E C G x t , y t E C t x t , y t = E C C × B P C C
where G M L C G represents the change in AGTFP. E C C represents the change in technical efficiency, which measures the output performance of a decision-making unit under a specified degree of input. B P C C is a measure of the change in technological progress, which indicates the output performance of a decision-making unit in response to technological advancement. These decomposition indices have a positive impact on AGTFP when their values exceed 1. Conversely, values that are less than 1 have a restraining effect, while values that are equal to 1 indicate that there has been no significant change.
This paper employs the natural breakpoint method to categorize AGTFP levels into three categories, high, medium, and low, in order to investigate the dynamic variations in AGTFP. The software used is ArcGIS 10.8. Figure 2a, b, c, and d, respectively, presents the Agricultural Green Total Factor Productivity (AGTFP) for each province in the years 2000, 2006, 2012, and 2022, offering a comprehensive view of the temporal evolution and regional variations in AGTFP across these key years. In general, the AGTFP has demonstrated a gradual increase from 2000 to 2022; however, regional disparities persist. Jiangsu, Zhejiang, Fujian, Guangdong, and Hainan are among the eastern regions that have consistently maintained high productivity levels. This is primarily due to the strong policy support, sophisticated technology, and developed economies of these regions. These regions have maintained their position at the forefront of green agricultural development due to their emphasis on agricultural technology and efficient resource utilization, as well as their increased marketization and openness to public data. The volatility of the AGTFP in central regions has been more pronounced. However, the western provinces, including Gansu and Qinghai, have encountered periods of low productivity. This underscores the necessity of accelerating the development of infrastructure and technological innovation in order to reduce the disparity between the western and eastern regions. To promote balanced AGTFP growth across the country, especially to reduce the gap between the eastern and western regions, it is necessary to intensify efforts in infrastructure construction, technological innovation, and green agricultural policy support in the western regions. This will facilitate the rapid development of green agriculture in these areas and help narrow the regional disparities.
During the sample period, technological progress was greater than 1, as indicated in Figure 3, while technical efficiency was barely below 1. This suggests that technological advancements exceeded technical efficacy. Some potential explanations for this phenomenon include the following. Many highly qualified young rural laborers have left agriculture and migrated to urban areas in search of employment due to the extended production cycles, poor conditions, and low profits associated with agricultural production. This migration impedes the efficacy of current green agricultural technologies and impedes advancements in technical efficiency by decreasing the efficiency of resource allocation in agriculture. However, policies that promote the construction of high-quality farmland and the development of large-scale cereal farms, in addition to the expansion of agricultural mechanization, have effectively facilitated technological advancements in green agriculture.

3.2.2. The Independent Variable: Public Data Openness (DATA)

This paper’s research is provided with an ideal quasi-natural experimental scenario by the promotion of public data open platforms by local administrations. Table 2 shows the initial launch dates of public data open platforms across 24 provinces by the end of 2022. For provinces/autonomous regions/municipalities directly under the central government that established public data open platforms in the year of establishment and thereafter, the value of DATA is set to 1; otherwise, it is set to 0. This study selects provincial-level public data open platforms as the research subject for two main reasons: first, most provincial-level public data platforms provide data that cover the data of the subordinate prefecture-level cities; second, public data openness requires a substantial amount of financial resources for data collection, organization, as well as platform maintenance and upgrades. Compared to municipal governments, provincial governments generally have stronger financial support capabilities. Therefore, provincial-level public data open platforms are significantly superior to prefecture-level cities in terms of data capacity, data quality, and update frequency and, thus, have a higher economic value.

3.2.3. Control Variables

In order to mitigate the influence of variables other than the public data open platforms on AGTFP, this investigation implements control variables. The following control variables are chosen in accordance with the existing research [31,37]: (1) Level of transportation infrastructure (TRAN); (2) Urbanization level (URB); (3) Agricultural mechanization level (AML); (4) Human capital level (HUM); (5) Crop disaster rate (AD); (6) Fiscal support (FIN). Table 3 contains descriptions of the relevant factors.

3.3. Model

3.3.1. Baseline Model

The multi-period difference-in-differences (DID) model is a widely used econometric method for policy evaluation and causal inference. It aims to identify the causal effects of a policy or intervention by comparing the differences in outcomes between treatment and control groups before and after the intervention. Compared to the traditional DID model, the multi-period DID model extends the time dimension, allowing for the examination of dynamic effects across multiple time points. This study adopts the multi-period DID model for the following reasons. First, it effectively captures the dynamic impacts of open government data across different time periods, making it suitable for analyzing the long-term effects of policy interventions. Second, by comparing the differences between the treatment and control groups before and after the intervention, this model helps control for time-varying factors and unobserved heterogeneity, thereby reducing potential biases and enhancing the validity of causal inference. Using this approach, this study is able to more clearly identify the causal impact of open government data on AGTFP and further analyze how this effect evolves over time. This study adopts a difference-in-differences (DID) model to account for both individual differences among the subjects and time differences before and after the launch of public data open platforms in order to investigate the policy’s overall impact. The treatment group comprises provinces that have implemented public data open platforms, while the control group comprises the remaining provinces. The regression model is configured in the following manner:
A G T F P it = β 0 + β 1 D A T A i t + β 2 C O N T R O L S i t + δ i + δ t + ε i t
In Equation (5), i stands for province, and t stands for the year. The dependent variable A G T F P i t represents the agricultural green total factor productivity of province i in year t. The independent variable   D A T A i t   is a dummy variable for the launch of public data open platforms; it takes the value of 1 if province i has launched the platform in year t, and 0 otherwise. C O N T R O L S i t indicates additional control variables that account for factors that influence the AGTFP, in addition to the introduction of public data open platforms. δ i   stands for the province fixed effects, and δ t represents the year-fixed effects, which are employed to mitigate omitted variable bias by absorbing confounding factors that remain constant over time or across provinces. ε i t is the random error term.

3.3.2. Mediation Effects Model

In order to determine the mechanism by which the introduction of public data open platforms influences the AGTFP, this paper implements a three-step mediation effect test. The subsequent test stages are as follows, as determined by Equation (3):
N ij = a 0 + a 1 D A T A i t + a i C O N T R O L S i t + δ i + δ t + ε i t
A G T F P i t = b 0 + b 1 D A T A i t + b 2 N i j + b i C O N T R O L S i t + δ i + δ t + ε i t
In this context, N i j represents the mediator variables, which specifically include cross-sector labor transfer (CSLT) and green technology innovation (GTI). The parameters a and b are to be estimated, while the definitions of the other variables are to be maintained in accordance with those in Equation (5). The impact of public data openness on green technology innovation and cross-sector labor transfer is investigated using Equation (6). Thus, the mediator variables are incorporated into the baseline regression model in Equation (7) to investigate the mediation effects of cross-sector labor transfer and green technology innovation.

4. Results

This chapter mainly presents the empirical analysis process of this study, which is divided into three parts: baseline regression results, robustness checks, and mechanism analysis. First, the baseline regression results verify the impact of public data openness on Agricultural Green Total Factor Productivity (AGTFP) (Section 4.1). Next, robustness checks are conducted to ensure the reliability and stability of the results (Section 4.2). Finally, the specific path of the impact of public data openness on AGTFP (Section 4.3) and the heterogeneity analysis are explored through mechanism analysis.

4.1. Baseline Regression

The regression results of the impact of public data openness on AGTFP are presented in Table 4. An iterative regression strategy is implemented in this investigation. In Column 1, the regression results are presented with only the explanatory variables and fixed effects. The coefficient for DATA is 0.0189, which is substantially positive at the 10% statistical level. This study controls for variables that are closely related to AGTFP in order to mitigate endogeneity. The regression results, as shown in column (2), indicate that the coefficient for DATA is 0.0298, which is significantly positive at the 1% statistical level. The baseline regression results indicate that public data openness significantly improves AGTFP, with a 1% increase in data openness associated with a 2.9% increase in AGTFP. This finding suggests that enhanced access to public data enables agricultural producers to make more informed decisions regarding resource allocation and farming practices. By facilitating the adoption of more efficient and sustainable agricultural technologies, public data openness contributes to increased productivity and reduced environmental impact. Therefore, public data openness plays a crucial role in promoting both the economic and environmental sustainability of agricultural development. These offer preliminary support for Hypothesis H1.

4.2. Robustness Checks

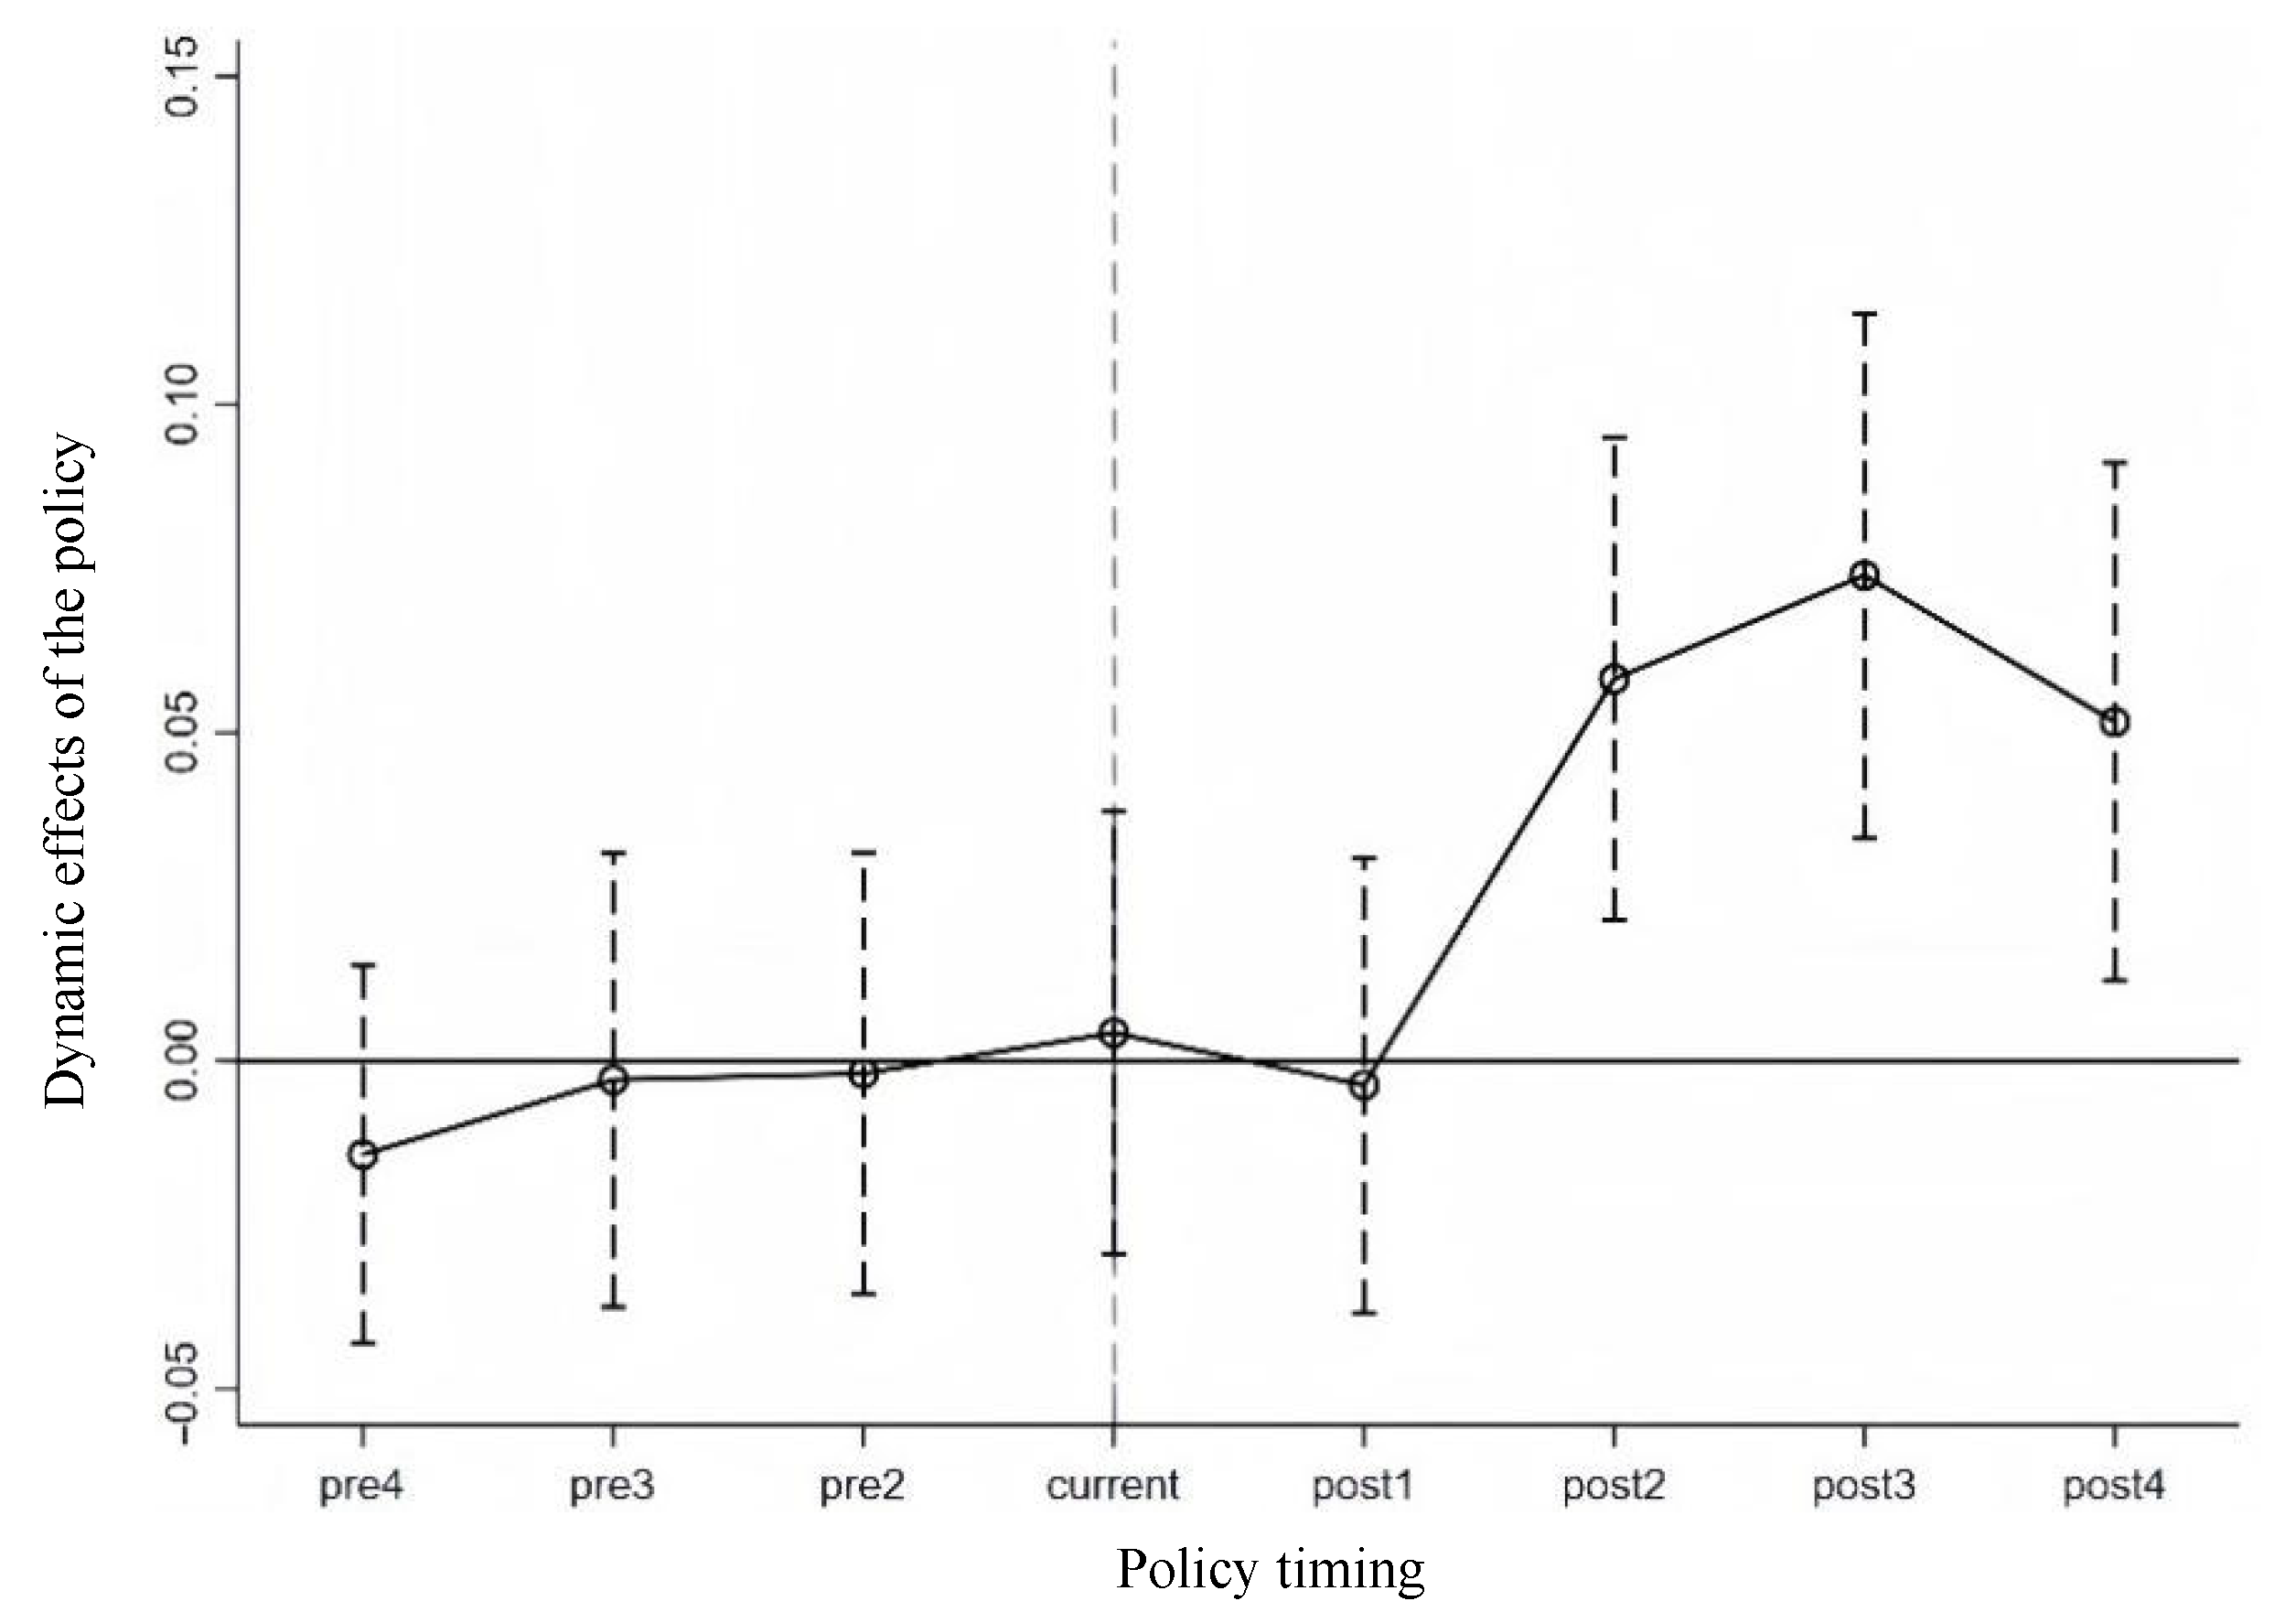
4.2.1. Parallel Trends Test
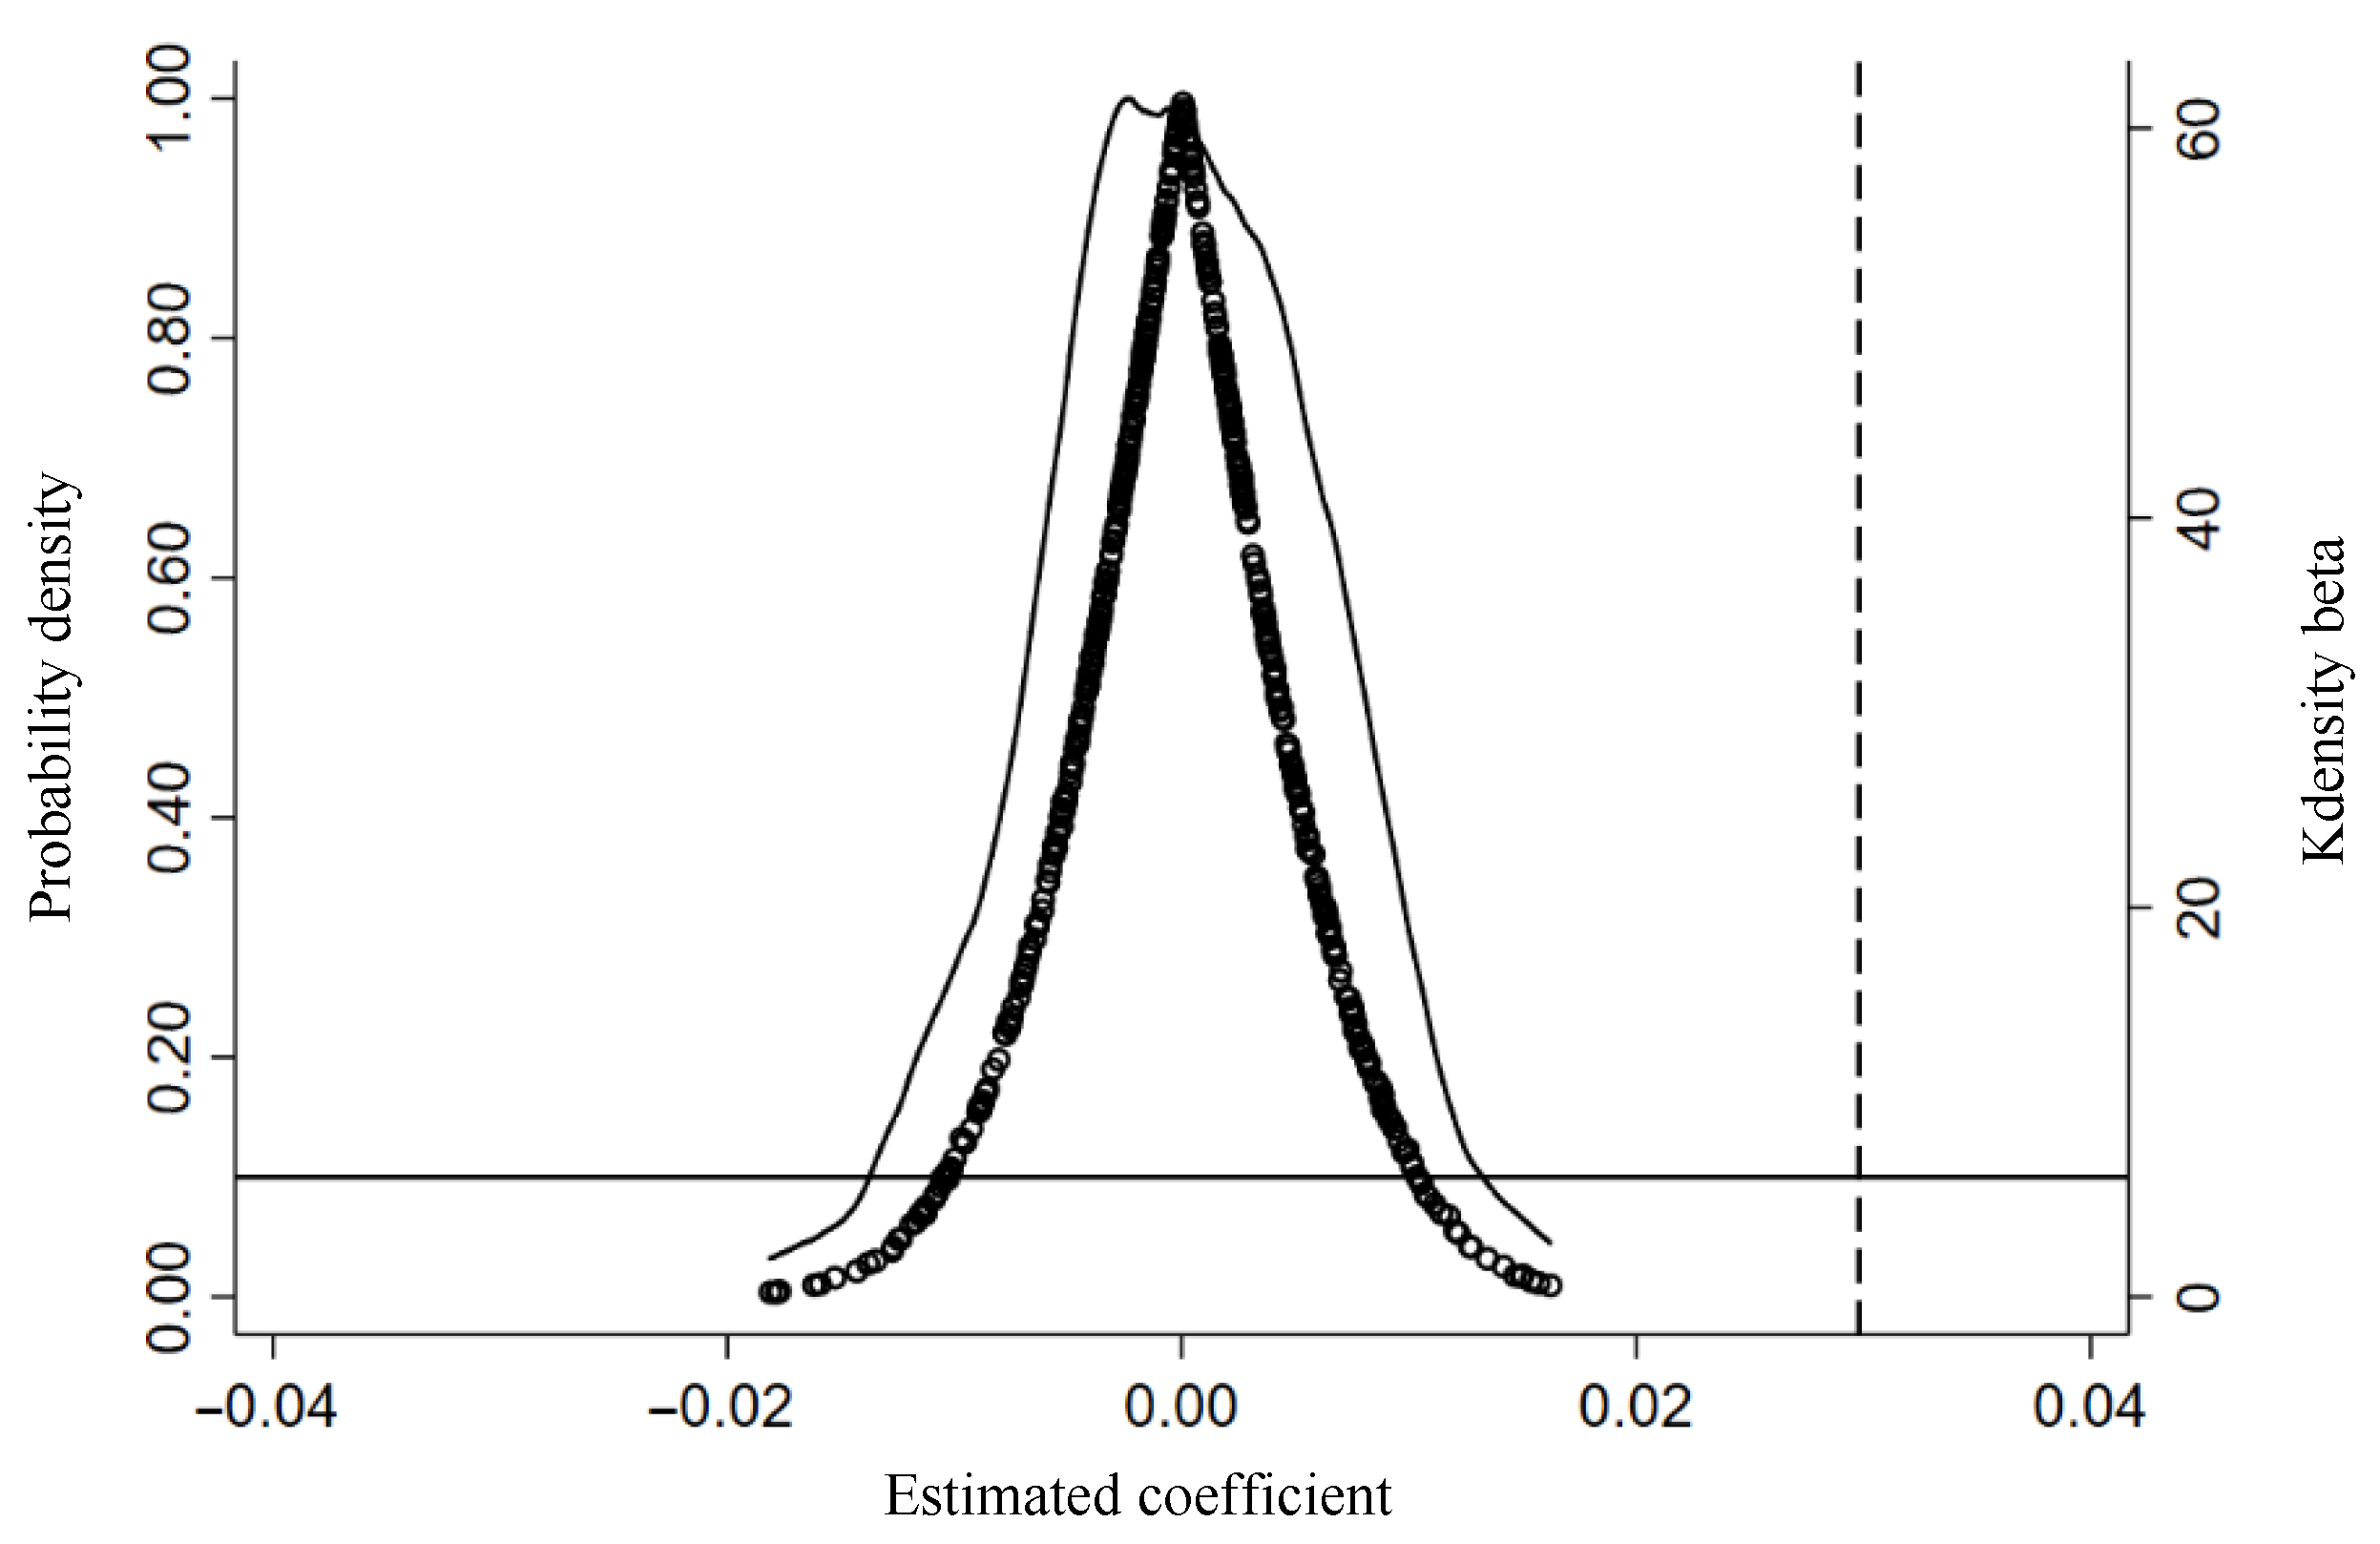
The parallel trends assumption, which is the prerequisite for the use of the difference-in-differences (DID) method, is defined as the treatment group and the control group showing the same time trend prior to the implementation of the policy [38]. The parallel trends test model is specified as follows:
A G T F P it = β 0 + t = 4 4 + β t D k × T R E A T i + β 2 C O N T R O L S i t + δ i + δ t + ε i t
The regression coefficient β t is for D K × T R E A T i . This paper merges the four years and earlier prior to the implementation of government public data openness into a “pre4” category and the four years and beyond after the implementation into a “post4” category, taking into account the issue of the sample time period and the establishment of the government data openness platform.
The results of the parallel trends test are illustrated in Figure 4. The estimated coefficients for the pre-treatment periods are close to zero and statistically insignificant, indicating no systematic differences in AGTFP trends between the treatment and control groups before policy implementation. Post-treatment, the coefficients show a clear upward trend and become statistically significant, confirming the positive impact of public data openness on AGTFP. Therefore, the parallel trend assumption is satisfied, validating the use of the DID methodology in this study.

4.2.2. Placebo Test

To ensure that the net effect on AGTFP is entirely attributable to the impact of public data open platform launches and not influenced by random factors, this study also implements a placebo test for verification.
In order to establish a “fictional” treatment group, 24 provinces were randomly selected from a total of 30 provinces. In order to construct “pseudo” time dummy variables, sample times were randomly selected as the policy impact points. Cai et al. [39] conducted a total of 500 random samples and estimates for the provinces that were identified through random selection. The kernel density distribution of the estimated coefficients and p-values from the placebo test is shown in Figure 5. The kernel density of the estimated coefficients from the sampling regressions approximates a normal distribution with a mean of 0. Additionally, the p-values for the majority of the estimated coefficients exceed the 10% statistical significance level (p > 0.1), and all estimated coefficients are below the baseline regression coefficient of 0.0298, which is represented by the dashed line on the right. These findings suggest that the baseline estimation results are not influenced by other unobservable factors. This confirms that the conclusions of this study have successfully passed the placebo test.

4.2.3. Replacing the Dependent Variable

An output-oriented super-efficiency CCR model was employed to quantify the AGTFP for 30 provinces in accordance with the methodology of Hadi-Vencheh and Foroughi [40]. The specific regression results are displayed in column (1) of Table 5. The direction of the baseline regression coefficient is consistent with the coefficient of DATA, which is 0.1061 and is significant at the 1% level. The robustness of the baseline regression results is suggested by this test result.

4.2.4. Adjusting the Sample Time Period

This study modifies the sample time period to determine whether the conclusions are influenced by the time window, thereby increasing the reliability of the impact of public data openness on enhancing AGTFP. To prevent the impact of earlier years on the results, the sample time period was adjusted to 2008–2018, as public data open platforms began to launch in 2012. Subsequently, regression analysis was implemented, as indicated in Table 5. The regression coefficient of public data openness on AGTFP is 0.0145, which is a significant positive value at the 5% level, as indicated in column (2) of Table 5. This implies that the relationship between the two is comparatively stable and positive and that the time window does not affect it.

4.2.5. Propensity Score Matching (PSM) Approach

To address potential sample selection bias, this paper adopts the double-difference propensity score matching (PSM-DID) method for robustness testing. The control variables used in the baseline model are included as covariates in the Logit regression used to estimate the probability of group assignment (treatment vs. control). Kernel matching is then employed, and regression analysis is conducted again based on the matched samples. As shown in Column (3) of Table 5, the estimated coefficient for public data openness is 0.0283, statistically significant at the 1% level, further confirming the robustness of this study’s conclusions.

4.2.6. Winsorization

Considering that outliers in agricultural AGTFP may influence the accuracy of the baseline regression results, this study applies a 1% winsorization to the dependent variable, AGTFP, before performing the baseline regression. As shown in Column (4) of Table 5, the regression coefficient for public data openness remains significantly positive at the 1% level, further validating the robustness of the research findings.

4.3. Further Analyses

4.3.1. Mediating Mechanism Analysis

This study utilizes the research of Luo et al. [41] to investigate whether CSLT and GTI are the primary factors that influence AGTFP through public data openness. The CSLT is quantified by the ratio of employment in the secondary and tertiary industries to total employment in the primary, secondary, and tertiary industries, which reflects the employment structure and its changes. The number of green patent grants is employed as a metric for the innovation capacity of green technology, as per the research conducted by Kesidou and Wu [42], and a logarithmic transformation is applied to it.
Table 6, column (1) shows that the coefficient of DATA is 0.0381, which is significantly positive at the 1% level. This suggests that public data openness has effectively facilitated the transfer of labor to the secondary and tertiary industries. In column (2), the coefficients of DATA and CSLT are positively significant at the 10% and 1% levels, respectively. This indicates that public data openness has promoted the transfer of agricultural labor, which has contributed to an increase in AGTFP. In column (3), the coefficient of DATA is significantly positive at the 1% level, suggesting that public data openness has significantly enhanced the level of innovation in green technology. In column (4), the coefficients of DATA and GTI are both positively significant at the 5% level, indicating that public data openness improves AGTFP by fostering GTI. As a result, Hypotheses H2 and H3 are supported.

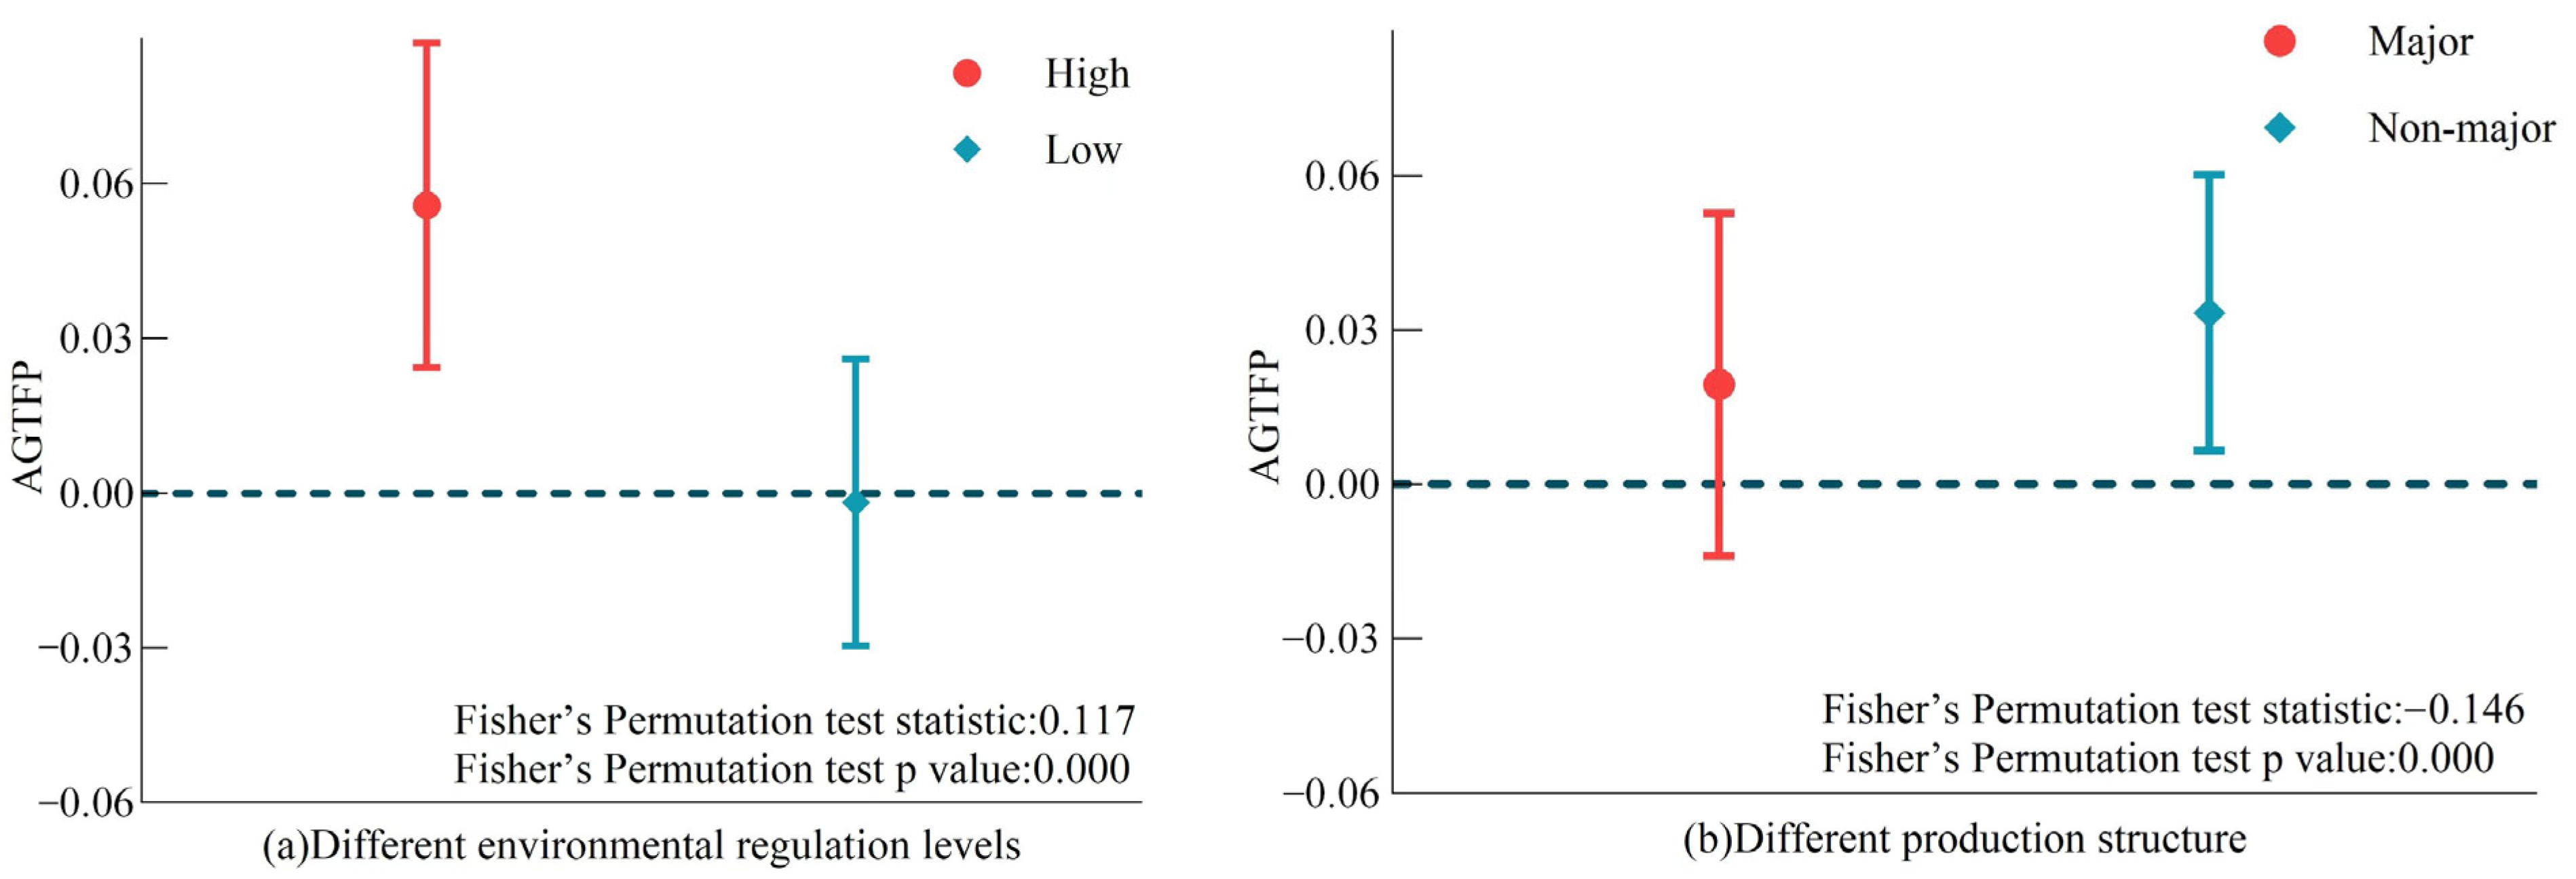
4.3.2. Heterogeneity Analysis

The empirical p-values obtained from the Fisher’s Permutation test in this paper were used to determine whether there are significant differences between the two regression coefficients. The fundamental principle entails the random reassignment of samples among various groups and the calculation of the test statistic for each permutation of the observed data. The presence of substantial differences between the groups is suggested by the fact that the observed differences occur infrequently under random conditions.
(1)
Heterogeneity in Environmental Regulation
The extent of environmental regulation has an impact on the AGTFP, as indicated by existing research. Therefore, the extent to which public data openness influences the productivity of the AGTFP is contingent upon the level of environmental regulation. The degree of environmental regulation is assessed by the investment in industrial pollution control per 1000 yuan of industrial added value, as per the research conducted by He and Luo [43]. The regions are divided into two categories: high and low environmental regulation intensity, based on the median of environmental regulation intensity imposed as a threshold. The Fisher permutation inter-group difference test statistic is 0.117, with a corresponding p-value of 0.000. The subsample regression results (as indicated in Figure 6a) indicate that the impact of public data openness on AGTFP is more pronounced in regions with higher levels of environmental regulation, whereas it is negligible in regions with lower levels of regulation. A plausible explanation is that in regions with stricter environmental standards, agricultural producers face greater external pressure to comply with environmental norms, thereby increasing the demand for technological and process innovations. In such contexts, public data openness plays a critical enabling role by offering not only regulatory compliance information but also comprehensive market and environmental data. This improved accessibility significantly reduces the cost and uncertainty associated with information acquisition, effectively lowering the barriers to green technology adoption. Consequently, agricultural producers in these regions are more likely to integrate open data resources into their operations, enhancing productivity and environmental performance. In contrast, in regions with weak enforcement of environmental regulations, the absence of strong regulatory incentives diminishes producers’ motivation to adopt data-driven and environmentally sustainable practices, thereby weakening the effect of public data openness on AGTFP.
(2)
Heterogeneity in Production Structure
The sample is divided into main grain-producing regions and non-major grain-producing regions, as indicated in the 2017 document released by the State Council. Heilongjiang, Henan, Shandong, Sichuan, Jiangsu, Hebei, Jilin, Anhui, Hunan, Hubei, Inner Mongolia, Jiangxi, and Liaoning are the primary grain-producing regions. The Fisher permutation inter-group difference test statistic is −0.146, with a corresponding p-value of 0.000. This suggests that the impact of public data openness on AGTFP is substantially influenced by the differences in production structure. Furthermore, the subsample regression results (as indicated in Figure 6b) indicate that the impact of public data openness on AGTFP is more pronounced in major non-grain-producing regions, whereas it is negligible in major grain-producing regions. One possible explanation is that agricultural operators in non-major grain-producing regions are more responsive to market fluctuations and can adjust crop types and planting areas more flexibly. Public data openness allows these producers to access real-time information on market demand, climate trends, and crop growth conditions, enabling more informed production decisions. This timely access to data supports better resource allocation, improves production efficiency, and reduces risk, thereby contributing more effectively to AGTFP enhancement in non-major grain-producing regions.

5. Conclusions and Implications

5.1. Conclusions

The impact of public data openness on AGTFP is analyzed in this paper using a multi-period difference-in-differences (DID) model and a mediation effect model. This paper considers the launch of public data open platforms by local governments as a policy shock and employs a sample of 30 provinces from 2000 to 2022. The results indicate that AGTFP is considerably improved by public data openness, which confirms the critical role of data elements in fostering green agricultural development. This paper has reached a conclusion that is consistent with the findings of existing research, namely that data elements contribute to the digital transformation of agriculture, thereby promoting agricultural economic development [44]. Traditionally, research has primarily concentrated on the influence of factors such as international trade [45], urbanization [46], and environmental policies on agricultural production [47]. However, this paper takes public data openness as a core variable, revealing its potential to improve AGTFP.
We established in this study that public data openness has a substantial positive effect on AGTFP by means of two primary mechanisms: the facilitation of CSLT and the promotion of GTI. Initially, the openness of public data has significantly enhanced farmers’ ability to access market and technical information, enabling them to more easily grasp critical information such as market demand, price fluctuations, and cultivation techniques, thereby optimizing production decisions. As information asymmetry decreases, farmers can more easily identify high-productivity opportunities, which drives the transfer of labor from low-productivity traditional agriculture to modern agriculture or other industries. This not only improves labor productivity but also promotes the deepening of agricultural capital and the scaling-up of agricultural development [48]. Secondly, the GTI has been significantly accelerated by data openness. Cross-sector collaboration is facilitated in an open data environment, which, in turn, accelerates the development of green technologies by enabling researchers, enterprises, and farmers to more extensively share and utilize data resources. Farmers can effectively reduce resource waste and environmental contamination by adopting more advanced water-saving and fertilizer-saving techniques through precise data analysis [49]. These green technologies considerably increase the productivity of the agricultural green total factor by reducing carbon emissions in the agricultural production process and improving resource utilization efficiency [50].
The heterogeneous effects of public data openness on AGTFP across various levels of environmental regulation intensity and agricultural production structures are revealed in this study. However, this investigation is distinct from prior research in a number of respects. This study highlights that the positive impact of public data openness on AGTFP is more pronounced in non-major grain-producing regions, in contrast to previous research that has emphasized the more pronounced policy effects in major grain-producing regions [51]. The primary explanation for this difference is that non-major grain-producing regions are able to respond more rapidly to market changes and policy stimuli due to their smaller operational scale and more flexible production structure. Thus, they are able to more effectively utilize public data resources to improve production efficiency. Furthermore, this investigation demonstrates that the extent of environmental regulation substantially influences the accessibility of public data. Public data openness has a more significant impact on the growth of AGTFP in regions with a higher degree of environmental regulation. Still, this finding is in contrast to others that have suggested that environmental regulation may impede agricultural innovation [52]. This discrepancy may be primarily due to the fact that in regions with a high level of environmental regulation, farmers and enterprises prioritize environmental requirements and actively implement green technologies and methods. Therefore, they achieve increased production efficiency and environmental benefits with the assistance of public data.
Although this study primarily focuses on China, relevant international experiences from Europe offer valuable examples of the role of public data openness in promoting agricultural sustainability. In countries such as the Netherlands and Germany, open data platforms have played a pivotal role in advancing precision agriculture by providing access to critical datasets on climate, soil, and crops. This access has led to improved resource efficiency, optimized production processes, and reduced environmental impact [53]. These cases underscore the potential of public data to enhance agricultural productivity and sustainability, offering valuable lessons for China as it advances its green agricultural policies. China’s experience with public data openness also holds important implications for other developing countries. It demonstrates how open data can enhance decision-making in agricultural production, thereby improving efficiency and sustainability. For countries facing challenges such as limited infrastructure and resources, China’s model highlights how data transparency can improve resource management and foster innovation. Moreover, China’s approach provides a potential framework for other developing countries, emphasizing the government’s key role in developing data infrastructure, enhancing capacity, and formulating supportive policies to achieve sustainable agricultural development.
Yet, this investigation is not without its constraints. Initially, the data are predominantly concentrated at the provincial level, which may result in the neglect of more granular local differences and their influence on AGTFP. In order to gain a more comprehensive comprehension of the impact of public data openness on agricultural green total factor productivity, future research could broaden the data scope to include additional county-level and township-level data. Secondly, the analysis did not completely account for other potential influencing factors despite the fact that this study examines the mediating effects of CSLT and GTI. In order to enhance and deepen our comprehension of the impact of public data openness on AGTFP, additional mediating mechanisms, including government support, the extent of marketization, and farmers’ adaptability, could be investigated in future research. Finally, while the DID methodology provides robust results, potential issues of endogeneity and unobserved heterogeneity remain. Future research could refine the analysis using more advanced econometric techniques to address these concerns.

5.2. Implications

The subsequent policy insights are suggested in accordance with the aforementioned research: firstly, promote the construction of rural digital infrastructure. The government should prioritize the development of public data open platforms and increase investment in digital infrastructure in rural areas, focusing on improving internet connectivity, data storage, and processing capabilities. Specifically, the following measures can be implemented: on the one hand, build high-speed broadband networks and gradually extend 5G network coverage to rural and remote areas, ensuring that farmers can access the internet in a stable and fast manner. On the other hand, the government should strengthen the construction of data centers to improve data processing capabilities, supporting the storage, processing, and sharing of agricultural-related data. At the same time, relevant departments and stakeholders should explore the establishment of a joint talent development mechanism between urban and rural areas, focusing on cultivating rural digital talent and enhancing human capital in rural regions, thus laying a solid talent foundation for the construction of digital villages.
Secondly, public data openness policies tailored to local conditions should be developed. Regional differences should be considered when formulating data openness strategies. Improving data openness policies to facilitate the sharing of agricultural data and green farming technologies. In areas with higher levels of digitalization and stricter environmental regulations, the government should promote comprehensive data sharing and utilization to support green agricultural development. In regions with weaker infrastructure, efforts should focus on strengthening the digital foundation to ensure the effective operation of data platforms and facilitate the flow and sharing of information across regions. For regions with different agricultural production structures, particularly non-major grain-producing areas, the government should support agricultural operators in flexibly adjusting their production strategies to enhance market responsiveness.
Thirdly, green technology subsidies and labor training should be increased. Local governments should implement fiscal support policies for green technological innovation based on regional conditions, with an emphasis on promoting technologies that enhance resource efficiency and reduce environmental impact. Furthermore, the government should strengthen labor training, develop practical and feasible farmer training programs, and help farmers acquire the skills needed for modern agricultural practices and other productive sectors. This would promote the transfer of agricultural labor to more efficient and productive fields, thereby improving AGTFP and enhancing sustainable development capacity.

Author Contributions

Conceptualization, M.W.; methodology, J.R. and M.W.; software, M.W.; validation, X.L.; formal analysis, X.L. and X.D.; investigation, J.R.; resources, J.R. and X.D.; data curation, M.W. and X.D.; writing—original draft, M.W.; writing—review and editing, X.L.; visualization, J.R., X.D. and M.W.; project administration, X.L.; funding acquisition, J.R. and X.L. All authors have read and agreed to the published version of the manuscript.

Funding

The authors are grateful for the financial support provided by the Research Results of the Shandong Province Social Science Planning Project (Project Approval No. 23CSDJ62).

Institutional Review Board Statement

The present study did not require approval or ethical review by any Educational Institution, as the study does not involve any personal data and the respondents were well aware that they can opt out anytime during the data collection phase.

Data Availability Statement

The data will be provided upon request to the corresponding author.

Conflicts of Interest

The authors declare no conflicts of interest.

References

  1. Su, Y.; He, S.; Wang, K.; Shahtahmassebi, A.R.; Zhang, L.; Zhang, J.; Zhang, M.; Gan, M. Quantifying the sustainability of three types of agricultural production in China: An emergy analysis with the integration of environmental pollution. J. Clean. Prod. 2020, 252, 119650. [Google Scholar] [CrossRef]
  2. Xue, Y.; Tang, C.; Wu, H.; Liu, J.; Hao, Y. The emerging driving force of energy consumption in China: Does digital economy development matter? Energy Policy 2022, 165, 112997. [Google Scholar] [CrossRef]
  3. Li, D.; Gui, M.; Ma, R.; Feng, Y. Public data accessibility and corporate maturity mismatch: Evidence from China. Pac.-Basin Financ. J. 2024, 86, 102455. [Google Scholar] [CrossRef]
  4. Falavigna, G.; Manello, A.; Pavone, S. Environmental efficiency, productivity and public funds: The case of the Italian agricultural industry. Agric. Syst. 2013, 121, 73–80. [Google Scholar] [CrossRef]
  5. Murillo, Z.L.R. Economic efficiency and frontier techniques. J. Econ. Surv. 2004, 18, 33–77. [Google Scholar] [CrossRef]
  6. Guo, H.; Liu, X. Time-space evolution of China’s agricultural green total factor productivity. Chin. J. Manag. Sci. 2020, 28, 66–75. [Google Scholar] [CrossRef]
  7. Wang, H.; Tang, Y. Spatiotemporal Distribution and Influencing Factors of Coupling Coordination between Digital Village and Green and High-Quality Agricultural Development—Evidence from China. Sustainability 2023, 15, 8079. [Google Scholar] [CrossRef]
  8. Lu, X.; Jiang, X.; Gong, M. How land transfer marketization influence on green total factor productivity from the approach of industrial structure? Evidence from China. Land Use Policy 2020, 95, 104610. [Google Scholar] [CrossRef]
  9. Ge, J.; Zhou, S. Whether factor market distortions stimulate agricultural surface pollution—The case of fertilizers. Agric. Econ. 2021, 33, 92–98+112. (In Chinese) [Google Scholar] [CrossRef]
  10. Fang, J.; Liu, Y.; Gao, H. Can public data openness promote coordinated regional development?—A quasi-natural experiment from the launch of a government data platform. J. Manag. World 2023, 39, 124–142. (In Chinese) [Google Scholar] [CrossRef]
  11. Young, A.; Verhulst, S. The Global Impact of Open Data; O’Reilly Media, Incorporated: Sebastopol, CA, USA, 2016. [Google Scholar]
  12. Laursen, K.; Salter, A. Open for innovation: The role of openness in explaining innovation performance among UK manufacturing firms. Strateg. Manag. J. 2006, 27, 131–150. [Google Scholar] [CrossRef]
  13. Nagaraj, A. The private impact of public data: Landsat satellite maps increased gold discoveries and encouraged entry. Manag. Sci. 2022, 68, 564–582. [Google Scholar] [CrossRef]
  14. Gao, Q.; Cheng, C.; Sun, G.; Li, J. The impact of digital inclusive finance on agricultural green total factor productivity: Evidence from China. Front. Ecol. Environ. 2022, 10, 905644. [Google Scholar] [CrossRef]
  15. Jiang, Q.; Li, J.; Si, H.; Su, Y. The impact of the digital economy on agricultural green development: Evidence from China. Agriculture 2022, 12, 1107. [Google Scholar] [CrossRef]
  16. Shen, Z.; Wang, S.; Boussemart, J.-P.; Hao, Y. Digital transition and green growth in Chinese agriculture. Technol. Forecast. Soc. Change 2022, 181, 121742. [Google Scholar] [CrossRef]
  17. Peng, Z.; Dan, T. Digital dividend or digital divide? Digital economy and urban-rural income inequality in China. Telecommun. Policy 2023, 47, 102616. [Google Scholar] [CrossRef]
  18. Xie, K.; Yi, F.; Gu, F. Big data-driven agricultural digital transformation and innovation. Issues Agric. Econ. 2022, 5, 37–48. (In Chinese) [Google Scholar] [CrossRef]
  19. dos Santos Gaspar, J.; Marques, A.C.; Fuinhas, J.A. The traditional energy-growth nexus: A comparison between sustainable development and economic growth approaches. Ecol. Indic. 2017, 75, 286–296. [Google Scholar] [CrossRef]
  20. Lin, Y.; Habib, A. Quality control and crop characterization framework for multi-temporal UAV LiDAR data over mechanized agricultural fields. Remote Sens. Environ. 2021, 256, 112299. [Google Scholar] [CrossRef]
  21. Hong, J.; Shi, F.; Zheng, Y. Does network infrastructure construction reduce energy intensity? Based on the “Broadband China” strategy. Technol. Forecast. Soc. Change 2023, 190, 122437. [Google Scholar] [CrossRef]
  22. Lei, S.; Yang, X.; Qin, J. Does agricultural factor misallocation hinder agricultural green production efficiency? Evidence from China. Sci. Total Environ. 2023, 891, 164466. [Google Scholar] [CrossRef] [PubMed]
  23. Liu, S.; Zhang, X. Digital infrastructure and food production: Empirical evidence based on deep learning. Quant. Econ. Tech. Econ. Res. 2024, 41, 155–176. (In Chinese) [Google Scholar] [CrossRef]
  24. Zhao, S. Institutional Regulation of Revenue Distribution from Government Open Data in the Context of Common Prosperity. E-Government 2023, 4, 80–92. (In Chinese) [Google Scholar] [CrossRef]
  25. Wang, S.; Tang, J.; Liu, D. The impact of government data openness on labor employment: A dual perspective based on employment scale and employment structure. East China Econ. Manag. 2024, 38, 116–128. (In Chinese) [Google Scholar] [CrossRef]
  26. Liu, X.; Lu, F. The puzzle of rising capital returns in China. China Econ. Q. 2014, 13, 817–836. (In Chinese) [Google Scholar] [CrossRef]
  27. Yao, S.; Guo, Y.; Huo, X. An empirical analysis of the effects of China’s land conversion program on farmers’ income growth and labor transfer. Environ. Manag. 2010, 45, 502–512. [Google Scholar] [CrossRef]
  28. Rahman, M. The virtuous circle between green product innovation and performance: The role of financial constraint and corporate brand. J. Bus. Res. 2023, 154, 113296. [Google Scholar] [CrossRef]
  29. Song, M.; Fisher, R.; Kwoh, Y. Technological challenges of green innovation and sustainable resource management with large scale data. Technol. Forecast. Soc. Change 2019, 144, 361–368. [Google Scholar] [CrossRef]
  30. Zhong, R.; He, Q.; Qi, Y. Digital economy, agricultural technological progress, and agricultural carbon intensity: Evidence from China. Int. J. Environ. Res. Public Health 2022, 19, 6488. [Google Scholar] [CrossRef]
  31. Sayer, J.; Cassman, K.G. Agricultural innovation to protect the environment. Proc. Natl. Acad. Sci. USA 2013, 110, 8345–8348. [Google Scholar] [CrossRef]
  32. Tone, K. A slacks-based measure of super-efficiency in data envelopment analysis. Eur. J. Oper. Res. 2002, 143, 32–41. [Google Scholar] [CrossRef]
  33. Li, L.; Shi, P. A study on the impact of carbon finance effects on regional carbon emission based on the LMDI model. Stat. Decis. 2018, 34, 164–167. (In Chinese) [Google Scholar] [CrossRef]
  34. Zhang, J.; He, K. Research on Low-Carbon Agricultural Development under the “Dual Carbon” Goals: Current Status, Misunderstandings, and Prospects. Agric. Econ. Issues 2022, 2022, 35–46. (In Chinese) [Google Scholar] [CrossRef]
  35. Lai, S.; Du, P.; Chen, J. Non-Point Source Pollution Survey and Assessment Method Based on Unit Analysis. J. Tsinghua Univ. Nat. Sci. Ed. 2004, 2004, 1184–1187. (In Chinese) [Google Scholar] [CrossRef]
  36. Oh, D.-H. A global Malmquist-Luenberger productivity index. J. Product. Anal. 2010, 34, 183–197. [Google Scholar] [CrossRef]
  37. Wang, F.; Du, L.; Tian, M. Does agricultural credit input promote agricultural green total factor productivity? Evidence from spatial panel data of 30 provinces in China. Int. J. Environ. Res. Public Health 2022, 20, 529. [Google Scholar] [CrossRef]
  38. Beck, T.; Levine, R.; Levkov, A. Big bad banks? The winners and losers from bank deregulation in the United States. J. Financ. 2010, 65, 1637–1667. [Google Scholar] [CrossRef]
  39. Cai, X.; Lu, Y.; Wu, M.; Yu, L. Does environmental regulation drive away inbound foreign direct investment? Evidence from a quasi-natural experiment in China. J. Dev. Econ. 2016, 123, 73–85. [Google Scholar] [CrossRef]
  40. Hadi-Vencheh, A.; Foroughi, A.A. A generalized DEA model for inputs/outputs estimation. Math. Comput. Model. 2006, 43, 447–457. [Google Scholar] [CrossRef]
  41. Luo, C.; Teng, Y.; Li, L. Industry structure, gender discrimination, and the gender wage gap. J. Manag. World 2019, 35, 58–68 (In Chinese). [Google Scholar] [CrossRef]
  42. Kesidou, E.; Wu, L. Stringency of environmental regulation and eco-innovation: Evidence from the eleventh Five-Year Plan and green patents. Econ. Lett. 2020, 190, 109090. [Google Scholar] [CrossRef]
  43. He, Y.; Luo, Q. Environmental regulation, technological innovation, and industrial total factor productivity: A re-examination of the “strong Porter hypothesis”. Soft Sci. 2018, 32, 20–25. (In Chinese) [Google Scholar] [CrossRef]
  44. Zhao, H.; Pan, G. A study on the coupling and coordination between digital finance and high-quality agricultural development in the Yellow River Basin. Stat. Decis. 2024, 40, 152–157. (In Chinese) [Google Scholar] [CrossRef]
  45. Deng, H.; Zheng, W.; Shen, Z.; Štreimikienė, D. Does fiscal expenditure promote green agricultural productivity gains: An investigation on corn production. Appl. Energy 2023, 334, 120666. [Google Scholar] [CrossRef]
  46. Zhou, J.; Xu, N.; Zhang, W.; Ning, X. Can agricultural low-carbon development benefit from urbanization?—Empirical evidence from China’s new-type urbanization pilot policy. J. Clean. Prod. 2024, 435, 140388. [Google Scholar] [CrossRef]
  47. Sun, Y. Environmental regulation, agricultural green technology innovation, and agricultural green total factor productivity. Front. Environ. Sci. 2022, 10, 955954. [Google Scholar] [CrossRef]
  48. Ye, T.; Zhang, Y.; Wang, X. Does digital economy service industry improve regional green innovation efficiency?—A dual perspective based on industrial collaborative agglomeration and public environmental concern. Econ. Manag. Res. 2025, 46, 45–60. (In Chinese) [Google Scholar] [CrossRef]
  49. Guo, Z.; Chen, X.; Zhang, Y. Impact of environmental regulation perception on farmers’ agricultural green production technology adoption: A new perspective of social capital. Technol. Soc. 2022, 71, 102085. [Google Scholar] [CrossRef]
  50. Liu, D.; Zhu, X.; Wang, Y. China’s agricultural green total factor productivity based on carbon emission: An analysis of evolution trend and influencing factors. J. Clean. Prod. 2021, 278, 123692. [Google Scholar] [CrossRef]
  51. Zhu, J.; Zhu, Z.; Zhang, B. Can the construction of agricultural industrial parks enhance food production resilience?—A quasi-natural experiment based on national modern agricultural demonstration areas. World Agric. 2025, 03, 119–131. (In Chinese) [Google Scholar] [CrossRef]
  52. Ma, G.; Tan, Y. A study on the impact of environmental regulation on agricultural green total factor productivity—An analysis based on the panel threshold model. Agric. Technol. Econ. 2021, 05, 77–92. (In Chinese) [Google Scholar] [CrossRef]
  53. Guo, Y.; Yan, J.; Zhuang, P. How does data sharing affect the sustainable development of agribusiness? Evidence from public data openness. Int. Rev. Econ. Financ. 2025, 97, 103785. [Google Scholar] [CrossRef]
Figure 1. A hypothetical framework of this study.
Agriculture 15 01130 g001
Figure 2. Dynamic evolution of AGTFP in 30 provinces from 2000 to 2022. Note: The data do not include Xizang Autonomous Region, Hong Kong SAR, Macao SAR, and Taiwan Province of China.
Agriculture 15 01130 g002
Figure 3. GML index and its decomposition from 2000 to 2022.
Agriculture 15 01130 g003
Figure 4. Parallel trends test.
Agriculture 15 01130 g004
Figure 5. Placebo test.
Agriculture 15 01130 g005
Figure 6. The heterogeneity effects of public data openness. Notes: The figure indicates the 95% significance level. The Fisher combination test was used to compute the p-value of the coefficient difference test between groups, which was sampled 500 times.
Agriculture 15 01130 g006
Table 1. AGTFP indicator system.
Indicator Specific IndicatorsIndicator MeasurementUnitMeanS.D.
InputsLabor inputNumber of agricultural workers10,000 people905.17681.10
Land inputCrop sown areathousand hectares5364.653639.25
Capital inputTotal power of agricultural machinery10,000 kilowatts2909.932725.78
Agricultural fertilizer use (pure)10 kilo-tons174.77136.64
Resource inputCrop irrigated areathousand hectares2027.311540.65
OutputsExpected outputTotal agricultural output value100 million yuan1403.791284.72
Unexpected outputAgricultural carbon emissions10 kilo-tons310.97223.35
Nitrogen and phosphorus emissions10 kilo-tons69.5961.32
Table 2. Overview of public data open platforms going online.
YearProvince/Municipality
2012Beijing, Shanghai
2015Zhejiang Province
2016Guangdong Province, Guizhou Province
2018Jiangxi Province, Shandong Province, Henan Province, Shaanxi Province, Ningxia Hui Autonomous Region
2019Tianjin, Jiangsu Province, Fujian Province, Hainan Province, Sichuan Province, Xinjiang Uyghur Autonomous Region, Qinghai Province
2020Hubei Province, Hunan Province, Chongqing, Guangxi Zhuang Autonomous Region
2021Gansu Province, Anhui Province, Hebei Province
Table 3. Variable definitions and descriptive statistics.
Variable TypeVariableVariable DefinitionObsMeanS.D.
Dependent VariableAGTFPSuper Efficiency SBM model calculation6900.5320.158
Independent VariableDATAWhether each province has implemented: yes = 1; no = 06900.1670.373
Control VariableTRANNumber of road kilometers, density69011.3990.919
URBUrban population/total population6900.5160.151
AMLAgricultural machinery horsepower per unit area6900.5600.259
HUMHigher education student population/total population6900.0170.007
ADdisaster-affected crop area/crop sowing area6900.2250.16
FINGeneral fiscal government expenditure/GDP6900.2090.096
Note: S.D. is the standard deviation.
Table 4. Results of baseline regression.
Variables(1)(2)
DATA0.0189 *0.0298 ***
(1.8871)(2.8853)
TRAN 0.0370 **
(2.2906)
URB −0.0247
(−0.7319)
AML −0.0529 **
(−1.9985)
HUM 3.0113 ***
(2.7007)
AD −0.0580 ***
(−2.6723)
FIN 0.0930
(1.2313)
Province fixed effectsYesYes
Year fixed effectsYesYes
Constant0.3880 ***
(35.5148)
0.0206
(0.1233)
Pseudo R20.8270.833
N690690
Note: *** p < 0.01, ** p < 0.05, * p < 0.1.
Table 5. Robustness checks.
Variables(1)(2)(3)(4)
DATA0.1061 ***0.0145 **0.0283 ***0.0278 ***
(7.1167)(1.9869)(2.7161)(2.7930)
TRAN0.01110.0936 ***0.0452 ***0.0366 **
(0.4758)(2.8422)(2.8413)(2.3479)
URB0.1128 **0.0568−0.0119−0.0263
(2.3170)(1.0943)(−0.3481)(−0.8087)
AML0.0280−0.0529 ***−0.0560 **−0.0626 **
(0.7326)(−2.8924)(−2.0457)(−2.4539)
HUM2.49504.1570 ***1.9669 *2.9857 ***
(1.5519)(3.1278)(1.7177)(2.7815)
AD−0.0573 *−0.0294 **−0.0606 ***−0.0561 ***
(−1.8327)(−2.0096)(−2.7166)(−2.6875)
FIN−0.05850.07400.08200.0929
(−0.5371)(0.9660)(1.0586)(1.2768)
Province fixed effectsYesYesYesYes
Year fixed effectsYesYesYesYes
Constant0.0605
(0.2516)
−0.6928 *
(−1.8785)
−0.0625
(−0.3771)
0.0298
(0.1858)
Pseudo R20.8610.8340.8330.841
N690330690690
Note: *** p < 0.01, ** p < 0.05, * p < 0.1.
Table 6. Mechanisms of the impact of public data openness on AGTFP.
VariablesCSLTAGTFPGTIAGTFP
(1)(2)(3)(4)
DATA0.0381 ***0.0175 *0.2258 ***0.0259 **
(5.9734)(1.6801)(4.5825)(2.4726)
CSLT 0.3237 ***
(5.1106)
GTI 0.0173 **
(2.0805)
TRAN0.0440 ***0.02280.2496 ***0.0327 **
(4.4174)(1.4153)(3.2400)(2.0117)
URB0.0790 ***−0.05030.9232 ***−0.0407
(3.8000)(−1.5023)(5.7432)(−1.1791)
AML0.0429 ***−0.0668 **0.2304 *−0.0569 **
(2.6300)(−2.5590)(1.8258)(−2.1493)
HUM5.6476 ***1.183113.4644 **2.7778 **
(8.2179)(1.0284)(2.5354)(2.4852)
AD0.0162−0.0632 ***0.1545−0.0606 ***
(1.2096)(−2.9676)(1.4958)(−2.7983)
FIN−0.03110.1031−0.02170.0934
(−0.6671)(1.3908)(−0.0602)(1.2395)
Province fixed effectsYesYesYesYes
Year fixed effectsYesYesYesYes
Constant−0.04380.03470.53900.0112
(−0.4258)(0.2123)(0.6786)(0.0674)
Pseudo R20.8350.8400.9700.834
N690690690690
Note: *** p < 0.01, ** p < 0.05, * p < 0.1.
Disclaimer/Publisher’s Note: The statements, opinions and data contained in all publications are solely those of the individual author(s) and contributor(s) and not of MDPI and/or the editor(s). MDPI and/or the editor(s) disclaim responsibility for any injury to people or property resulting from any ideas, methods, instructions or products referred to in the content.

