
Variation and QTL Analysis of Dynamic Tillering in Rice Under Nitrogen and Straw Return Treatments

 ,
,
Abstract
1. Introduction
2. Materials and Methods
2.1. Test Materials and Field Trials
2.2. Investigation of Dynamic Tiller Number in Rice Under Three Treatments and Data Analysis
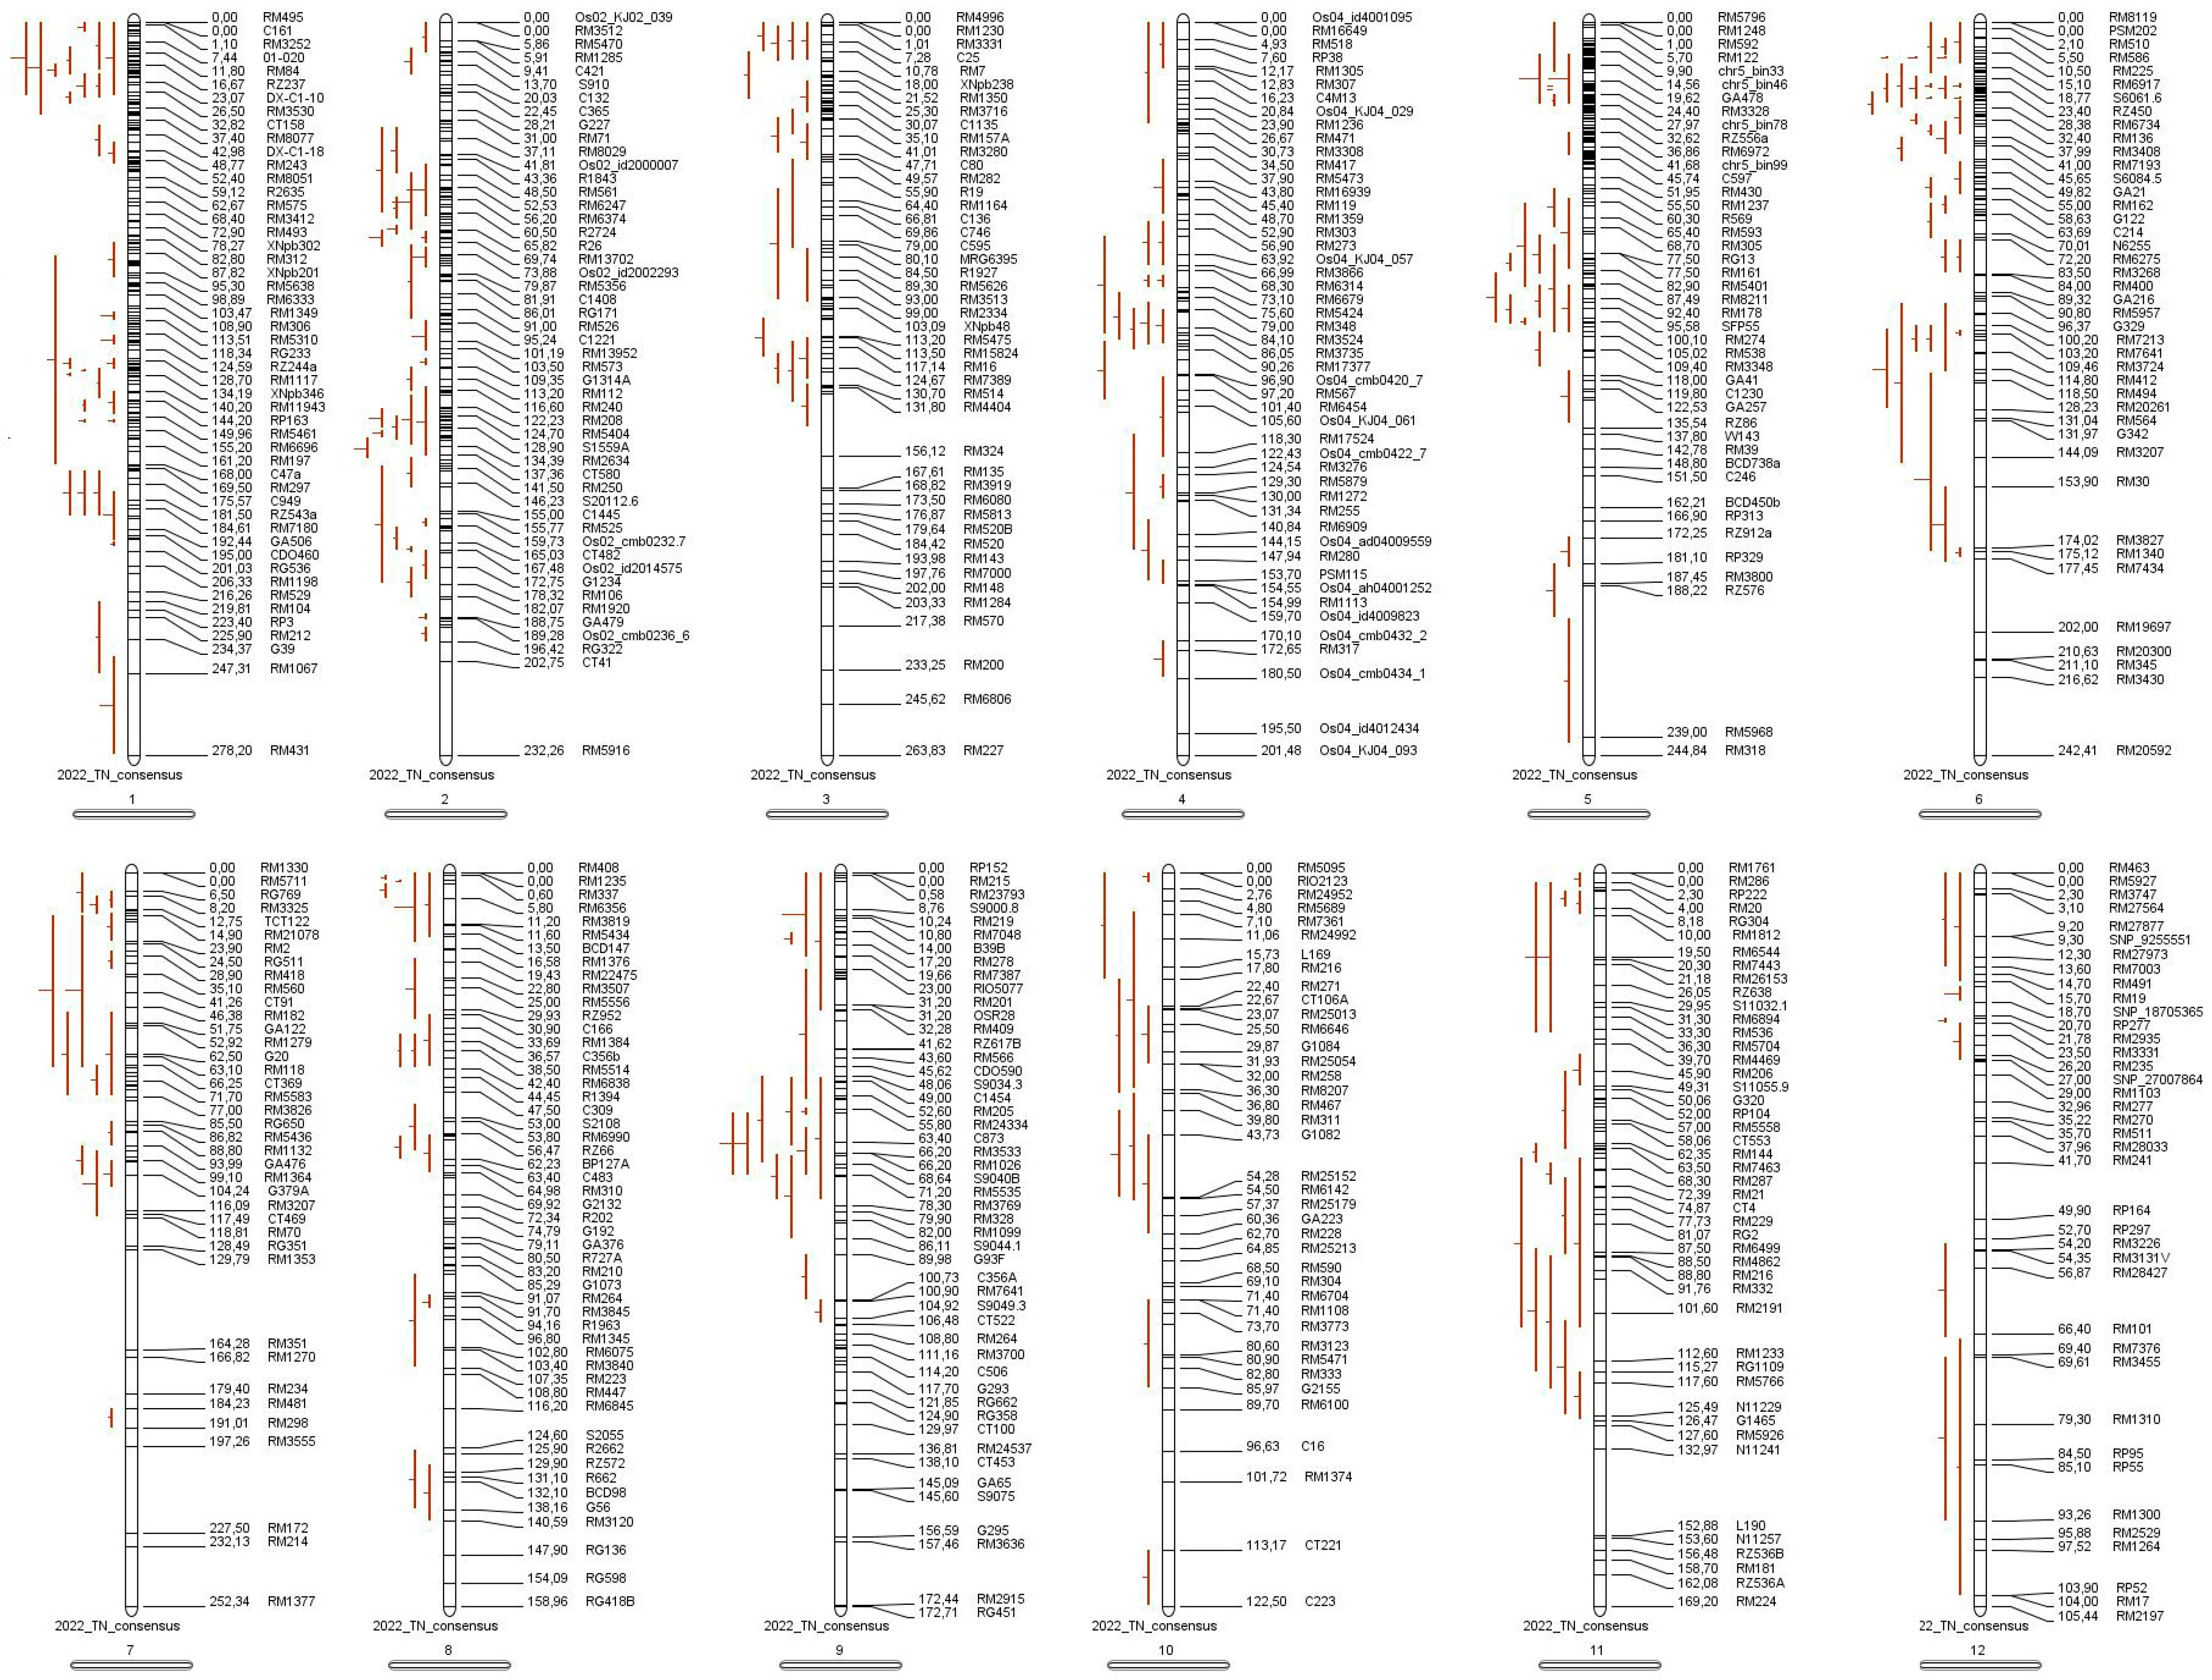
2.3. Genetic Mapping
2.4. Single- and Multi-Environment QTL Analyses for Dynamic Tillering in Rice
2.5. Tiller Number-Related QTL Collection and Meta-QTL Analysis
2.6. Candidate Gene Analysis
3. Results
3.1. Phenotypic Variation of Dynamic Tillering in Rice Under Three Treatments
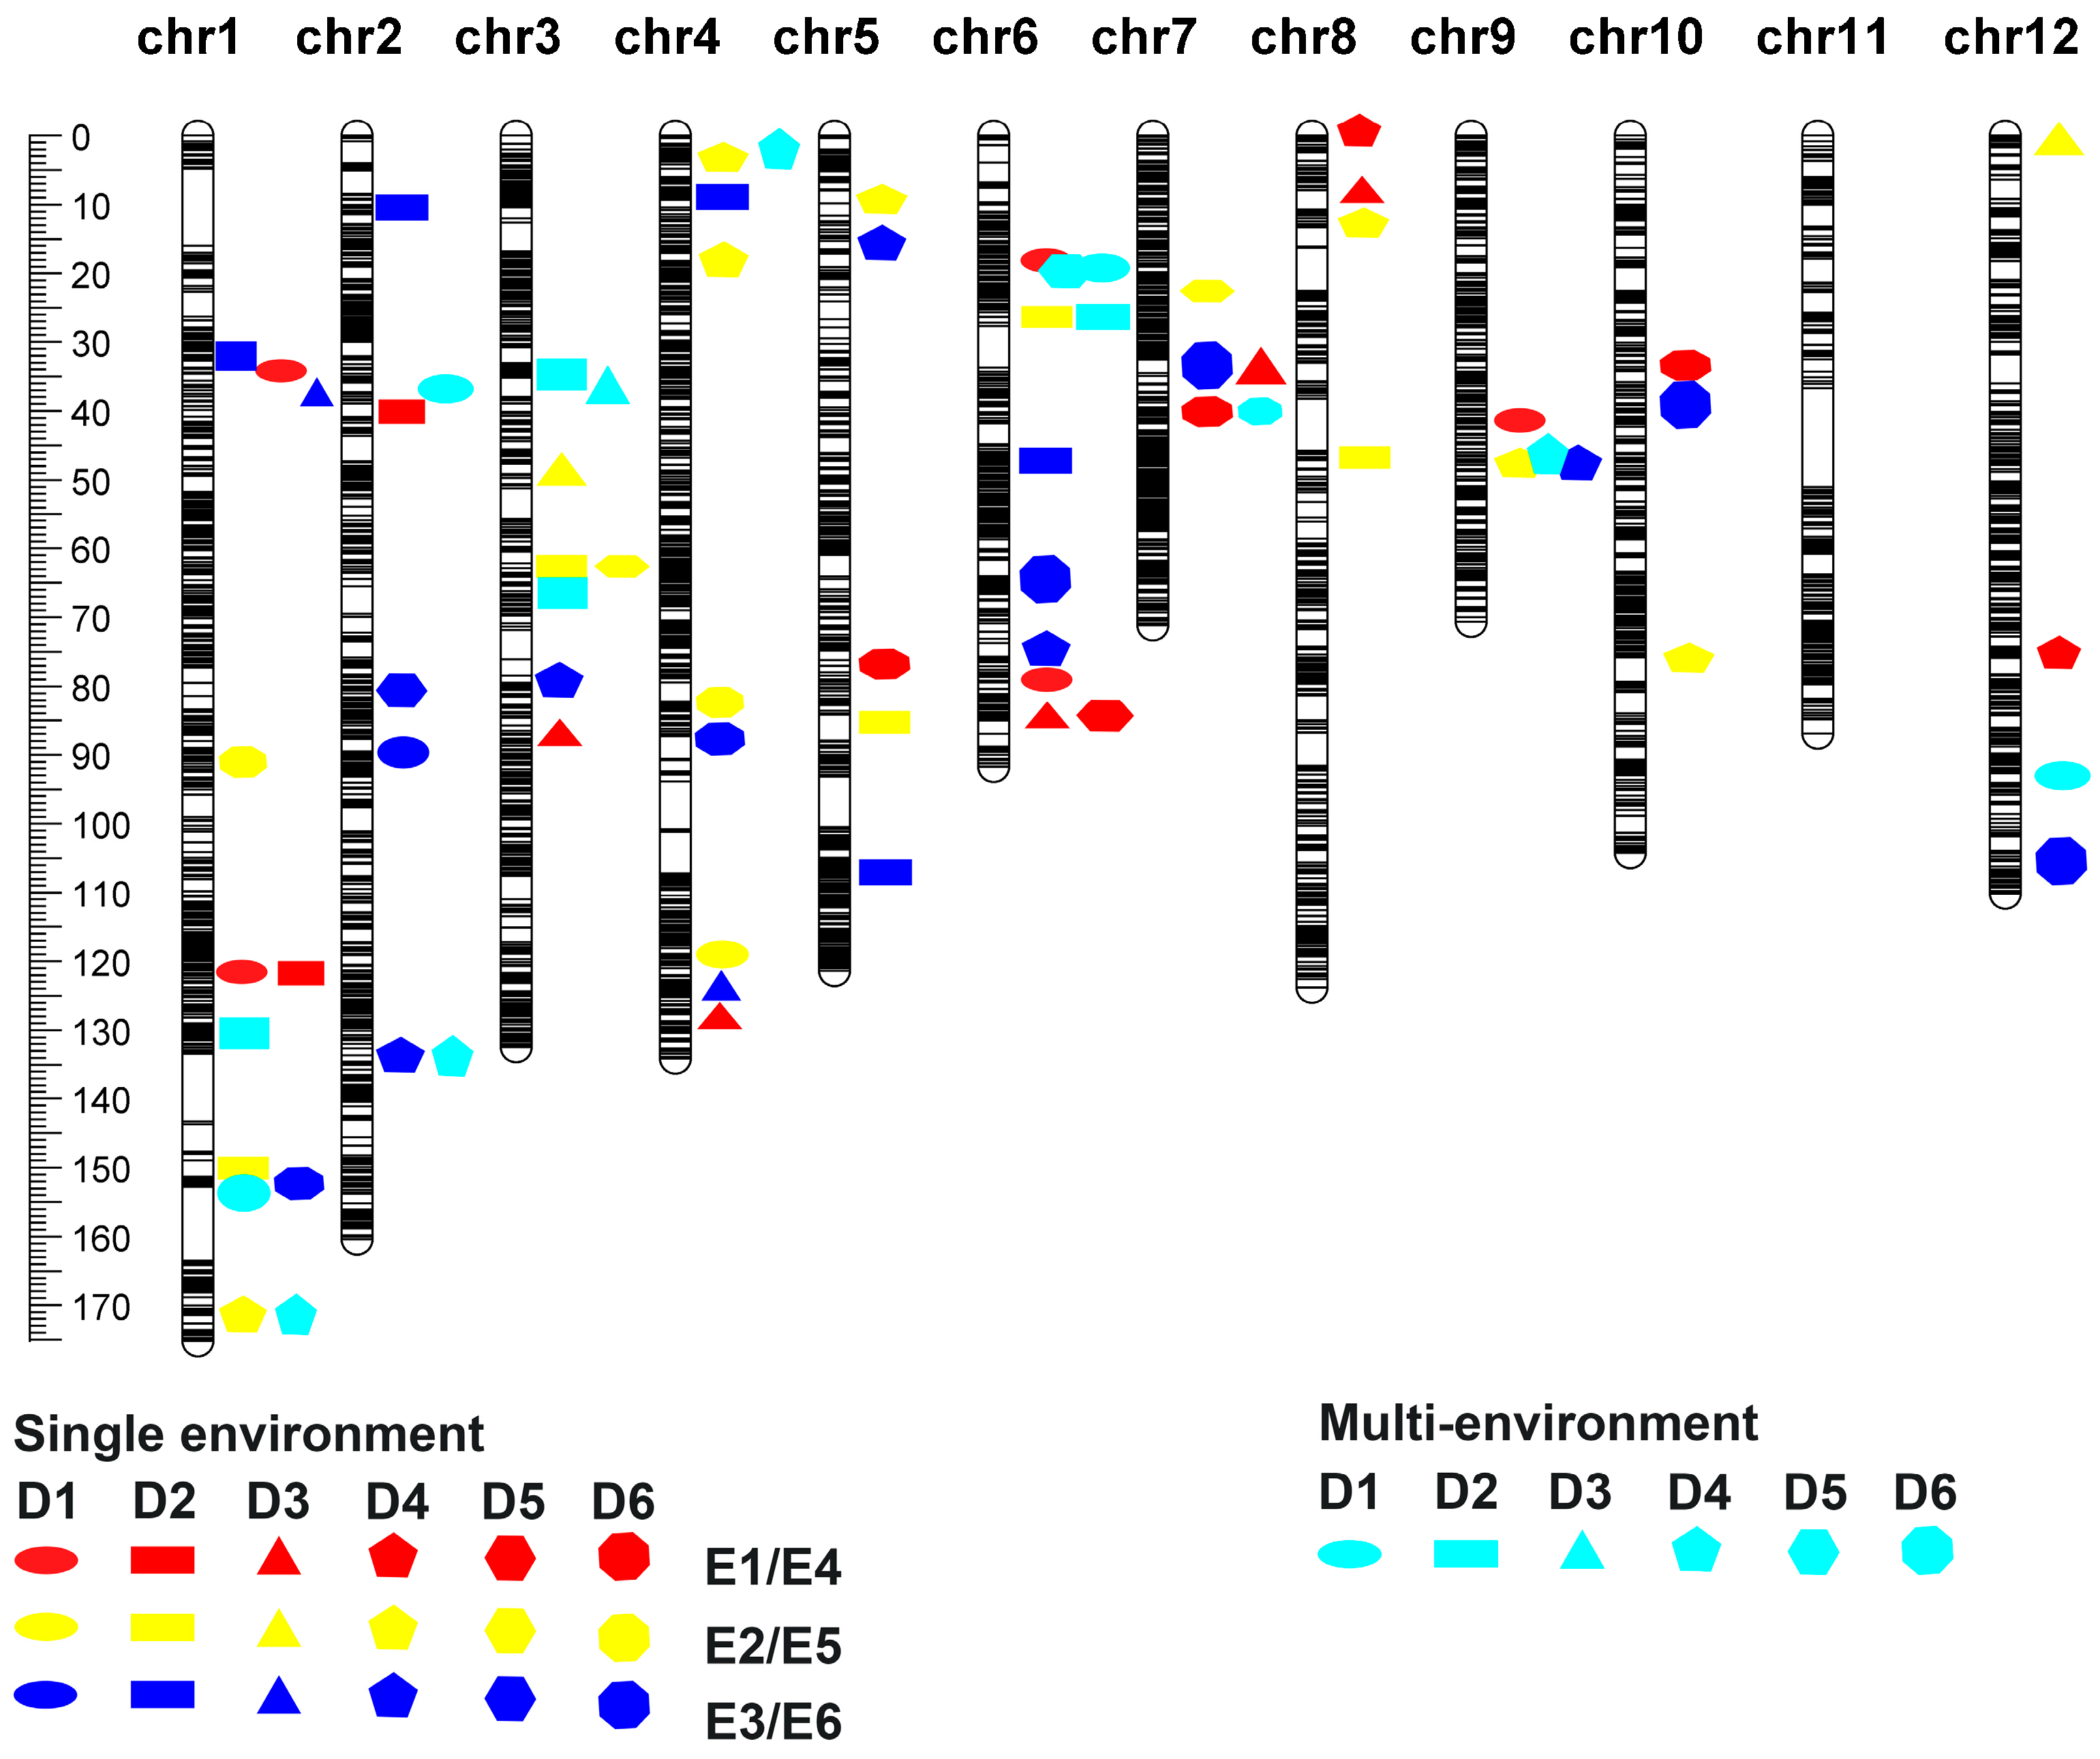
3.2. QTL Correlation Analysis of Tiller Number Across Six Periods in Recombinant Inbred Lines of Rice
3.2.1. Single-Environment QTL Analysis of Tiller Number Traits in RIL Populations in Six Periods
3.2.2. Multi-Environmental QTL Analysis of Tiller Number Traits in RIL Populations Across Six Periods
3.3. Meta-QTL Analysis of Tillering Traits in Rice
3.3.1. Collection of Information Related to QTLs for Tiller Number in Rice
3.3.2. Meta-QTL Analysis of Tiller Number Traits in Rice
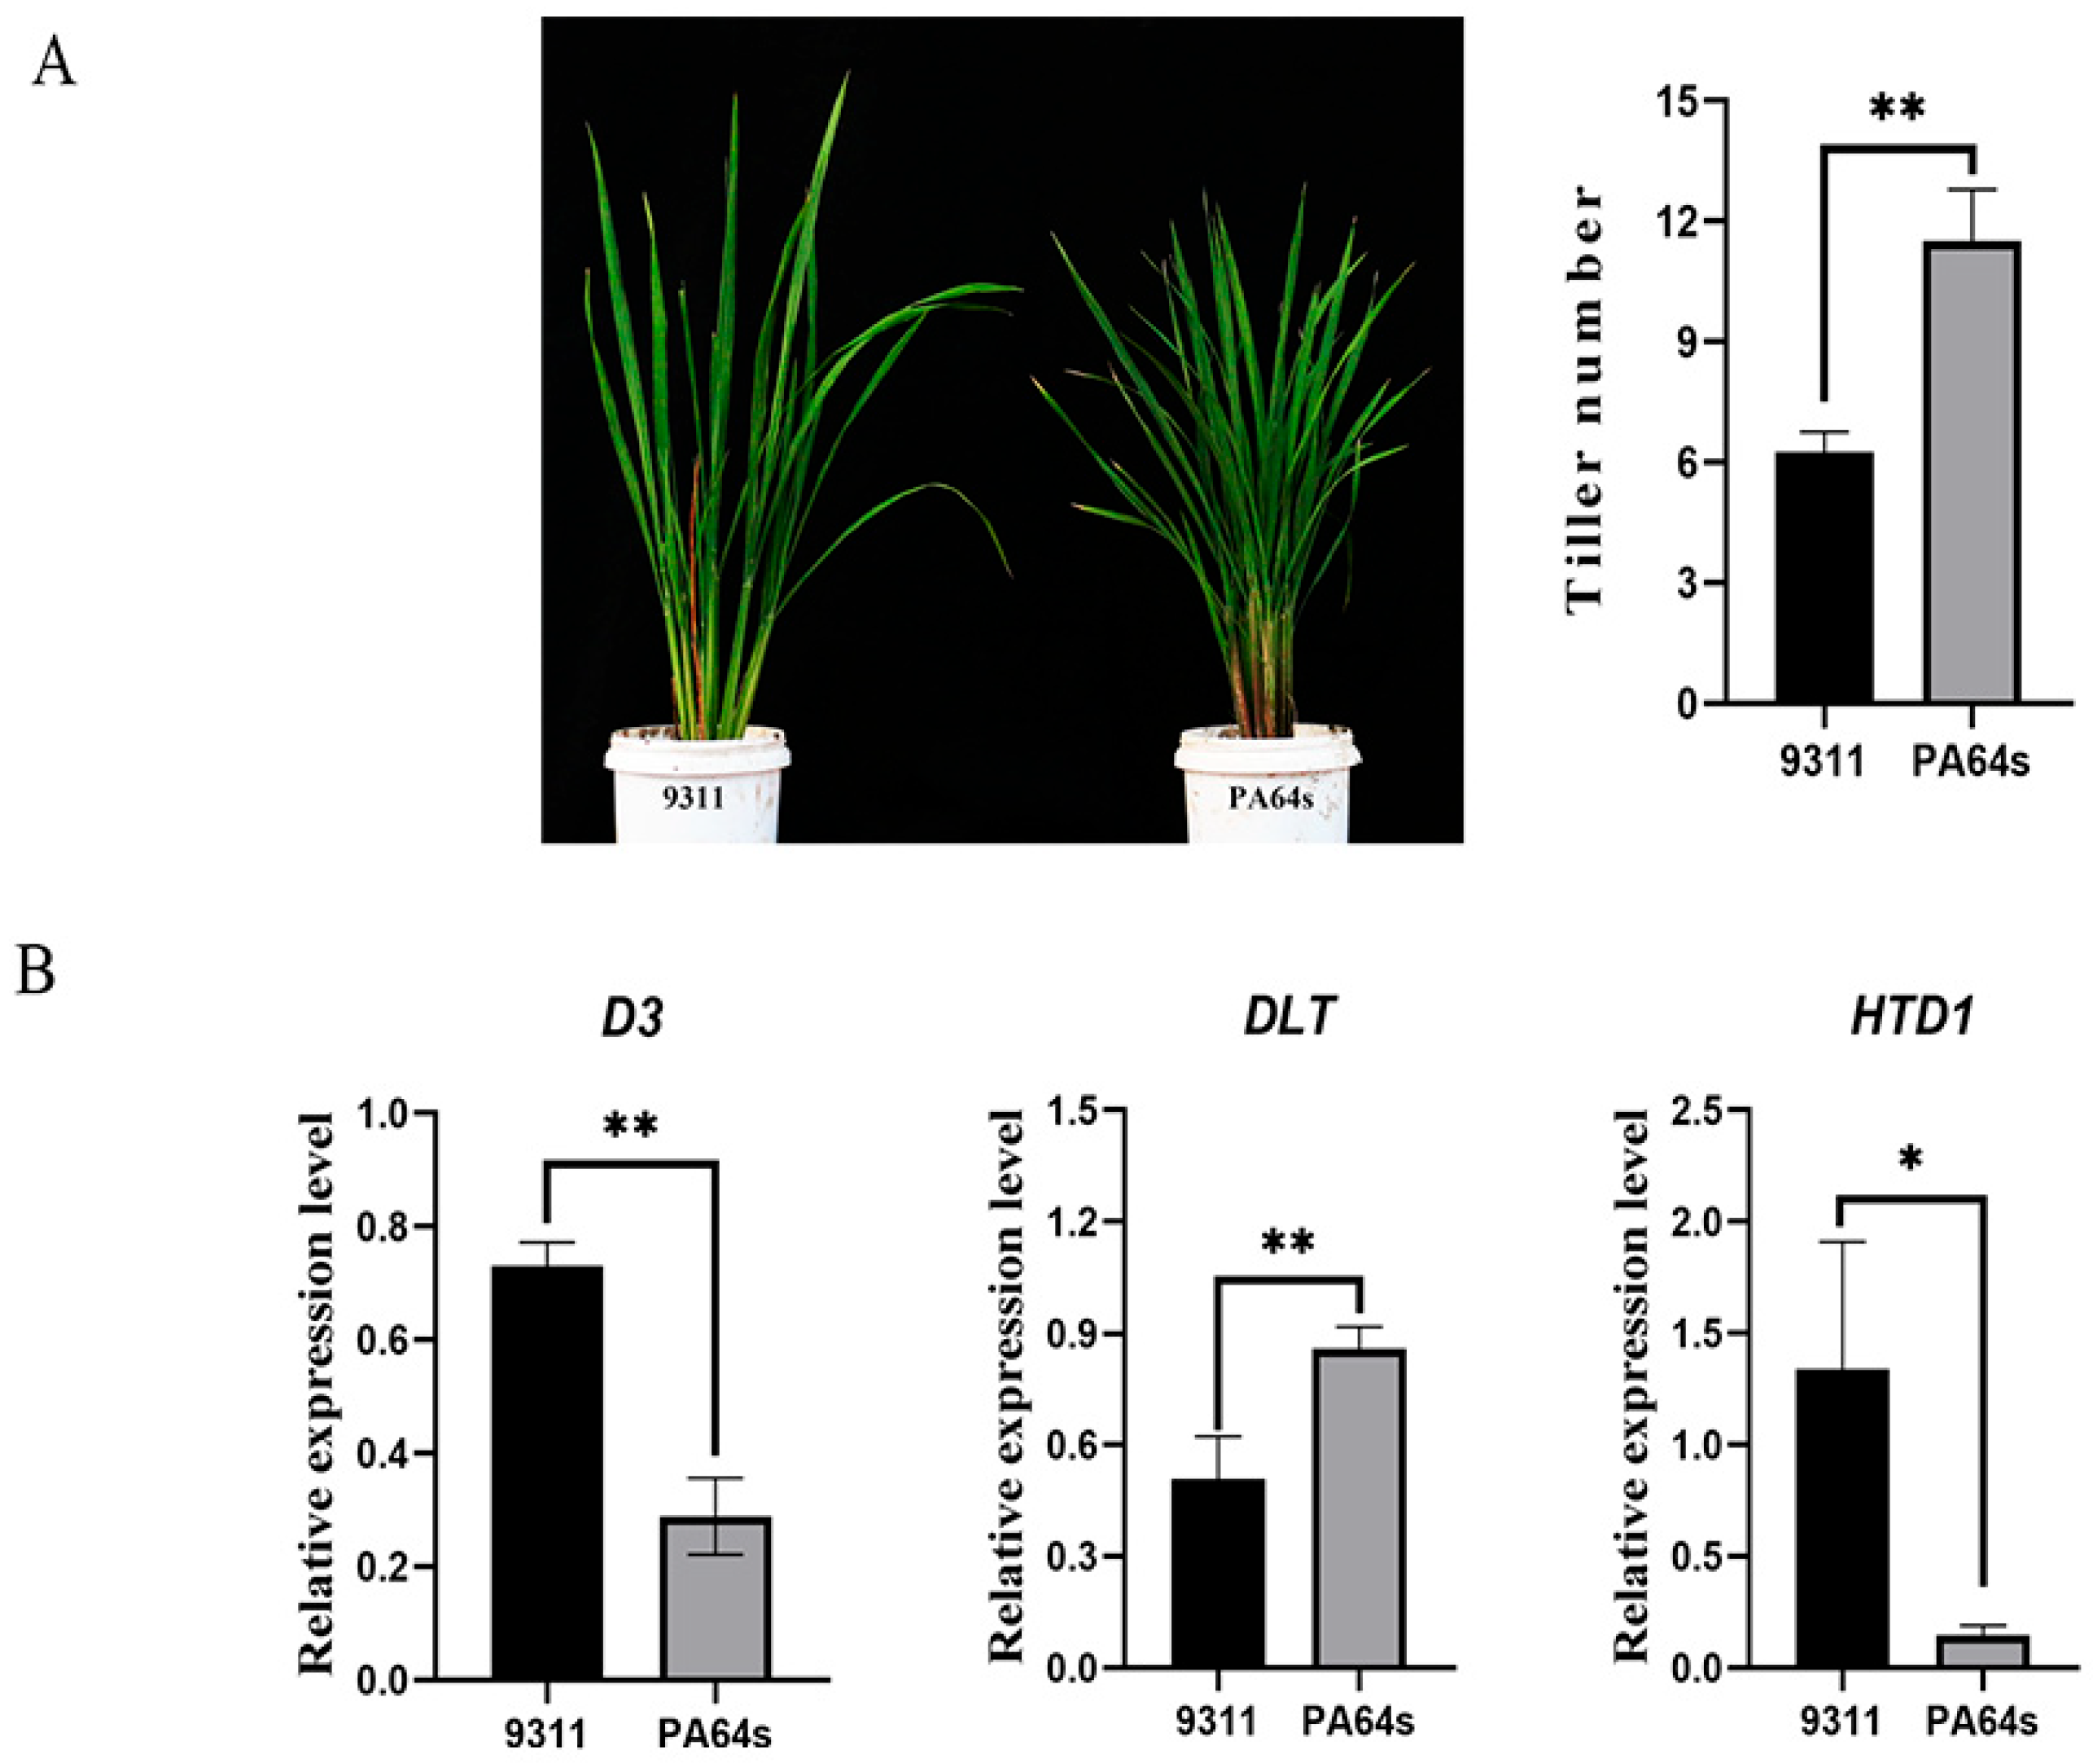
3.4. Analysis of Candidate Genes Related to Tillering in Rice
3.4.1. MQTL Candidate Gene Analysis
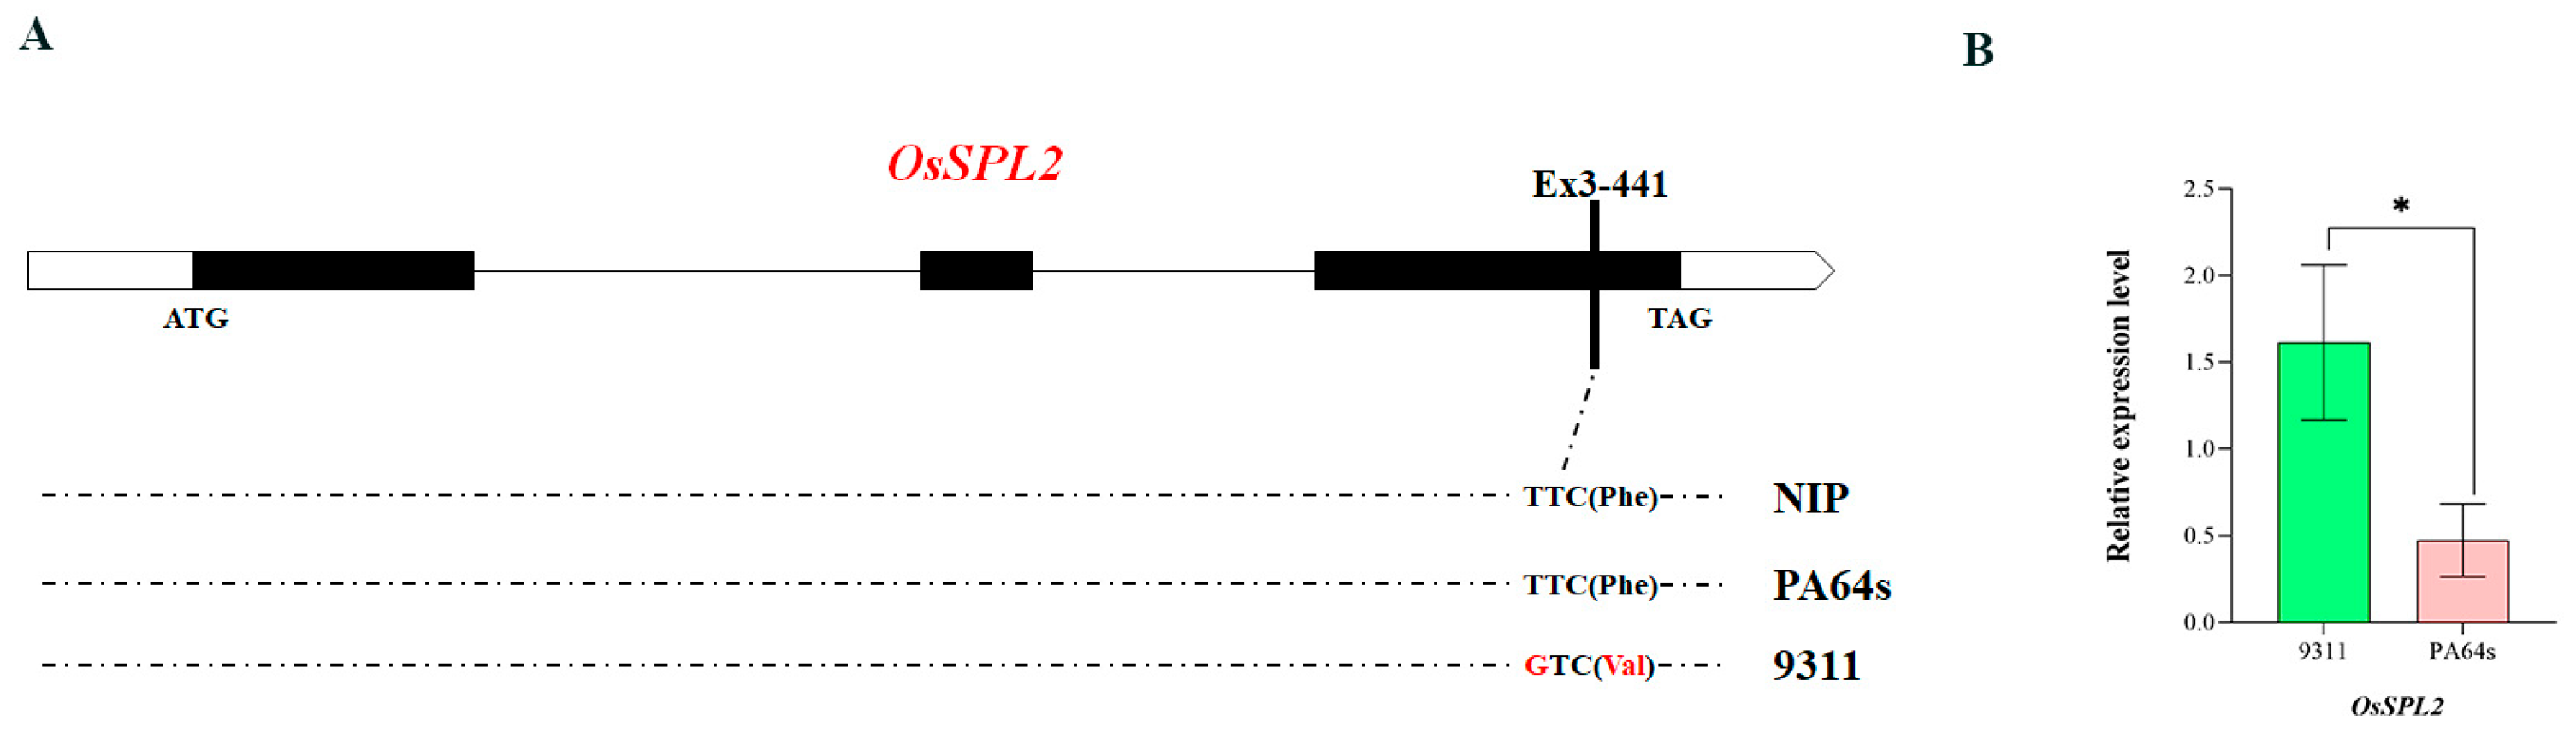
3.4.2. Analysis of MQTL1.6-Related Candidate Genes
4. Discussion
4.1. Comparison of the QTLs Identified in This Study with Reported QTLs
4.2. Adaptive QTLs Associated with Dynamic Tillering in Rice RIL Populations Under Three Treatments
4.3. Dynamic Tillering in Rice RIL Populations Under Three Treatments Associated with Pleiotropic QTLs and Primary QTLs
4.4. Meta-QTLs and Candidate Genes Associated with Tiller Traits in Rice
4.5. Breeding Implications
4.6. Limitations of Year-to-Year Reproducibility and Statistical Stringency
5. Conclusions
Supplementary Materials
Author Contributions
Funding
Institutional Review Board Statement
Data Availability Statement
Conflicts of Interest
References
- Li, X.; Qian, Q.; Fu, Z.; Wang, Y.; Xiong, G.; Zeng, D.; Wang, X.; Liu, X.; Teng, S.; Hiroshi, F.; et al. Control of tillering in rice. Nature 2003, 422, 618–621. [Google Scholar] [CrossRef] [PubMed]
- Shao, G.; Lu, Z.; Xiong, J.; Wang, B.; Jing, Y.; Meng, X.; Liu, G.; Ma, H.; Liang, Y.; Chen, F.; et al. Tiller Bud Formation Regulators MOC1 and MOC3 Cooperatively Promote Tiller Bud Outgrowth by Activating FON1 Expression in Rice. Mol. Plant 2019, 12, 1090–1102. [Google Scholar] [CrossRef]
- Song, X.; Lu, Z.; Yu, H.; Shao, G.; Xiong, J.; Meng, X.; Jing, Y.; Liu, G.; Xiong, G.; Duan, J.; et al. IPA1 functions as a downstream transcription factor repressed by D53 in strigolactone signaling in rice. Cell Res. 2017, 27, 1128–1141. [Google Scholar] [CrossRef]
- Takeda, T.; Suwa, Y.; Suzuki, M.; Kitano, H.; Ueguchi-Tanaka, M.; Ashikari, M.; Matsuoka, M.; Ueguchi, C. The OsTB1 gene negatively regulates lateral branching in rice. Plant J. Cell Mol. Biol. 2003, 33, 513–520. [Google Scholar] [CrossRef]
- Ishikawa, S.; Maekawa, M.; Arite, T.; Onishi, K.; Takamure, I.; Kyozuka, J. Suppression of tiller bud activity in tillering dwarf mutants of rice. Plant Cell Physiol. 2005, 46, 79–86. [Google Scholar] [CrossRef]
- Zhang, M.; Hu, D.; Zhang, D. Advances in molecular mechanism of rice tillering. Biot. Resour. 2022, 44, 26–35. [Google Scholar] [CrossRef]
- Zhou, W.; Yan, F.; Chen, Y.; Ren, W. Optimized nitrogen application increases rice yield by improving the quality of tillers. Plant Prod. Sci. 2022, 25, 311–319. [Google Scholar] [CrossRef]
- Xu, J.; Zha, M.; Li, Y.; Ding, Y.; Chen, L.; Ding, C.; Wang, S. The interaction between nitrogen availability and auxin, cytokinin, and strigolactone in the control of shoot branching in rice (Oryza sativa L.). Plant Cell Rep. 2015, 34, 1647–1662. [Google Scholar] [CrossRef]
- Zhong, X.; Peng, S.; Sheehy, J.E.; Visperas, R.M.; Liu, H. Relationship between tillering and leaf area index: Quantifying critical leaf area index for tillering in rice. J. Agric. Sci. 2002, 138, 269–279. [Google Scholar] [CrossRef]
- McAllister, C.H.; Beatty, P.H.; Good, A.G. Engineering nitrogen use efficient crop plants: The current status. Plant Biotechnol. J. 2012, 10, 1011–1025. [Google Scholar] [CrossRef]
- Sang, S.; Cao, M.; Wang, Y.; Wang, J.; Sun, X.; Zhang, W.; Ji, S. Research progress of nitrogen efficiency related genes in rice. Sci. Agric. Sin. 2022, 55, 1479–1491. [Google Scholar]
- Kong, D. Effect on Nitrogen and Carbon Content and Microbial Community Structure of Wheatsoybean Rotation Soil under Straw Return and Fertilizer Application Treatments. Ph.D. Thesis, North West Agriculture and Forestry University, Xianyang, China, 2020. [Google Scholar]
- Wang, X.; Zhao, S.; Zheng, X.; Wang, Z.; He, G. Effects of Straw Returning and Nitrogen Application Rate on Grain Yield and Nitrogen Utilization of Winter Wheat. Sci. Agric. Sin. 2021, 54, 5043–5053. [Google Scholar]
- Yin, H.; Zhao, W.; Li, T.; Cheng, X.; Liu, Q. Balancing straw returning and chemical fertilizers in China: Role of straw nutrient resources. Renew. Sustain. Energy Rev. 2018, 81, 2695–2702. [Google Scholar] [CrossRef]
- Lei, L.; Zheng, H.L.; Wang, J.G.; Liu, H.L.; Sun, J.; Zhao, H.W.; Yang, L.M.; Zou, D.T. Genetic dissection of rice (Oryza sativa L.) tiller, plant height, and grain yield based on QTL mapping and metaanalysis. Euphytica 2018, 214, 109. [Google Scholar] [CrossRef]
- Jiang, H.; Jiang, L.; Guo, L.; Gao, Z.; Zeng, D.; Zhu, L.; Liang, G.; Qian, Q. Conditional and unconditional mapping of quantitative trait loci underlying plant height and tiller number in rice (Oryza sativa L.) grown at two nitrogen levels. Prog. Nat. Sci.-Mater. Int. 2008, 18, 1539–1547. [Google Scholar] [CrossRef]
- Liu, G.; Zhu, H.; Liu, S.; Zeng, R.; Zhang, Z.; Li, W.; Ding, X.; Zhao, F.; Zhang, G. Unconditional and conditional QTL mapping for the developmental behavior of tiller number in rice (Oryza sativa L.). Genetica 2010, 138, 885–893. [Google Scholar] [CrossRef]
- Liu, G.; Zhu, H.; Zhang, G.; Li, L.; Ye, G. Dynamic analysis of QTLs on tiller number in rice (Oryza sativa L.) with single segment substitution lines. Theor. Appl. Genet. 2012, 125, 143–153. [Google Scholar] [CrossRef]
- Xing, Z.; Tan, F.; Hua, P.; Sun, L.; Xu, G.; Zhang, Q. Characterization of the main effects, epistatic effects and their environmental interactions of QTLs on the genetic basis of yield traits in rice. Theor. Appl. Genet. 2002, 105, 248–257. [Google Scholar] [CrossRef]
- Gong, J.; Zheng, X.; Du, B.; Qian, Q.; Chen, S.; Zhu, L.; He, P. Comparative study of QTLs for agronomic traits of rice (Oriza sativa L.) between salt stress and nonstress environment. Sci. China Ser. C Life Sci. 2001, 44, 73–82. [Google Scholar] [CrossRef]
- Gao, Z.; Wang, Y.; Chen, G.; Zhang, A.; Yang, S.; Shang, L.; Wang, D.; Ruan, B.; Liu, C.; Jiang, H.; et al. The indica nitrate reductase gene OsNR2 allele enhances rice yield potential and nitrogen use efficiency. Nat. Commun. 2019, 10, 5207. [Google Scholar] [CrossRef]
- Hu, B.; Wang, W.; Ou, S.; Tang, J.; Li, H.; Che, R.; Zhang, Z.; Chai, X.; Wang, H.; Wang, Y.; et al. Variation in NRT1.1B contributes to nitrate-use divergence between rice subspecies. Nat. Genet. 2015, 47, 834–838. [Google Scholar] [CrossRef] [PubMed]
- Liu, Y.; Wang, H.; Jiang, Z.; Wang, W.; Xu, R.; Wang, Q.; Zhang, Z.; Li, A.; Liang, Y.; Ou, S.; et al. Genomic basis of geographical adaptation to soil nitrogen in rice. Nature 2021, 590, 600–605. [Google Scholar] [CrossRef] [PubMed]
- Guo, N.; Hu, J.; Yan, M.; Qu, H.; Luo, L.; Tegeder, M.; Xu, G. Oryza sativa Lysine-Histidine-type Transporter 1 functions in root uptake and root-to-shoot allocation of amino acids in rice. Plant J. Cell Mol. Biol. 2020, 103, 395–411. [Google Scholar] [CrossRef]
- Tao, Y.; Zhu, J.; Wang, J.; Fan, F.; Xu, Y.; Li, W.; Wang, F.; Chen, Z.; Jiang, Y.; Zhu, J.; et al. Development of functional markers and genotype screening for nitrogen use efficiency genes in rice. Acta Agron. Sin. 2022, 48, 3045–3056. [Google Scholar]
- Li, L.; Peng, Y.; Tang, S.; Yu, D.; Tian, M.; Guo, F.; Chen, Y.; Yang, G.; Wang, X.; Hu, Y. Mapping QTL for leaf pigment content at dynamic development stage and analyzing Meta-QTL in rice. Euphytica 2021, 217, 90. [Google Scholar] [CrossRef]
- Wang, X.; Li, W.; OUyang, L.; Xu, J.; Chen, X.; Bian, J.; Hu, L.; Peng, X.; He, X.; Fu, J.; et al. QTL mapping for plant architecture in rice based on chromosome segment substitution lines. Acta Agron. Sin. 2022, 48, 1141–1151. [Google Scholar] [CrossRef]
- Luo, L.; Lei, L.; Liu, J.; Zhang, R.; Jin, G.; Cui, D.; Li, M.; Ma, X.; Zhao, Z.; Han, L. Mapping QTLs for yield-related traits using chromosome segment substitution lines of Dongxiang common wild rice (Oryza rufipogon Griff.) and Nipponbare (Oryza sativa L.). Acta Agron. Sin. 2021, 47, 1391–1401. [Google Scholar]
- Rajurkar, A.B.; Muthukumar, C.; Ayyenar, B.; Thomas, H.B.; Babu, R.C. Mapping consistent additive and epistatic QTLs for plant production traits under drought in target populations of environment using locally adapted landrace in rice (Oryza sativa L.). Plant Prod. Sci. 2021, 24, 388–403. [Google Scholar] [CrossRef]
- Kwon, Y.-H.; Kabange, N.-R.; Lee, J.-Y.; Lee, S.-M.; Cha, J.-K.; Shin, D.-J.; Cho, J.-H.; Kang, J.-W.; Ko, J.-M.; Lee, J.-H. Novel QTL Associated with Shoot Branching Identified in Doubled Haploid Rice (Oryza sativa L.) under Low Nitrogen Cultivation. Genes 2021, 12, 745. [Google Scholar] [CrossRef]
- Suman, K.; Neeraja, C.N.; Madhubabu, P.; Rathod, S.; Bej, S.; Jadhav, K.P.; Kumar, J.A.; Chaitanya, U.; Pawar, S.C.; Rani, S.H.; et al. Identification of Promising RILs for High Grain Zinc Through Genotype x Environment Analysis and Stable Grain Zinc QTL Using SSRs and SNPs in Rice (Oryza sativa L.). Front. Plant Sci. 2021, 12, 587482. [Google Scholar] [CrossRef]
- Beerelli, K.; Balakrishnan, D.; Addanki, K.R.; Surapaneni, M.; Rao Yadavalli, V.; Neelamraju, S. Mapping of QTLs for Yield Traits Using F2:3:4 Populations Derived From Two Alien Introgression Lines Reveals qTGW8.1 as a Consistent QTL for Grain Weight From Oryza nivara. Front. Plant Sci. 2022, 13, 790221. [Google Scholar] [CrossRef] [PubMed]
- Zhang, Y.; Anis, G.B.; Wang, R.; Wu, W.; Yu, N.; Shen, X.; Zhan, X.; Cheng, S.; Cao, L. Genetic dissection of QTL against phosphate deficiency in the hybrid rice ‘Xieyou9308’. Plant Growth Regul. 2018, 84, 123–133. [Google Scholar] [CrossRef]
- Xu, Y.; Zhang, H.; Hu, J.; Wang, X.; Huang, M.; Wang, H. Further QTL mapping for yield component traits using introgression lines in rice (Oryza sativa L.) under drought field environments. Euphytica 2018, 214, 33. [Google Scholar] [CrossRef]
- Li, Z.; Hua, Z.; Dong, L.; Zhu, W.; He, G.; Qu, L.; Qi, N.; Xu, Z.; Wang, F. Quantitative Trait Locus Mapping for Yield-Associated Agronomic Traits in a BC2F6 Population of Japonica Hybrid Rice Liaoyou 5218. J. Plant Growth Regul. 2020, 39, 60–71. [Google Scholar] [CrossRef]
- Zhou, X.; Lin, J.; Yao, W.; Zhai, Y.; Li, B.; Ding, X.; Liu, X.; Xiao, Y.; Liu, J. Localisation of QTL for tiller number traits using recombinant inbred line populations in rice. Mol. Plant Breed. 2019, 17, 7770–7777. [Google Scholar] [CrossRef]
- Emami, M.P.; Mohebalipour, N.; Ebadi, A.A.; Nourafcan, H.; Ajali, J. Qtl Mapping of Some Morphological Traits of Rice in a Rils Population Derived from Hashemi and Modified Nemat Varieties Hybrid. Genetika 2020, 52, 1087–1106. [Google Scholar] [CrossRef]
- Liang, Y.; Zhang, Q.; Wang, S.; Deng, Q.; Li, P.; Li, Y.; Yan, S. Construction of SSR genetic linkage maps of sequenced rice varieties and their gene locus analysis for agronomic traits. Chin. J. China Biotechnol. 2007, 27, 28–34. [Google Scholar] [CrossRef]
- Ye, S.; Zhang, Q.; Li, J.; Zhao, B.; Li, P. QTL localisation for six agronomic traits in rice using PA64S/Nippobare F2 population. China J. Rice Sci. 2007, 21, 39–43. [Google Scholar] [CrossRef]
- Venu, R.C.; Ma, J.; Jia, Y.; Liu, G.; Jia, M.H.; Nobuta, K.; Sreerekha, M.V.; Moldenhauer, K.; McClung, A.M.; Meyers, B.C.; et al. Identification of Candidate Genes Associated with Positive and Negative Heterosis in Rice. PLoS ONE 2014, 9, e95178. [Google Scholar] [CrossRef]
- Xu, Y.; This, D.; Pausch, R.C.; Vonhof, W.M.; Coburn, J.R.; Comstock, J.P.; McCouch, S.R. Leaf-level water use efficiency determined by carbon isotope discrimination in rice seedlings: Genetic variation associated with population structure and QTL mapping. Theor. Appl. Genet. 2009, 118, 1065–1081. [Google Scholar] [CrossRef]
- Liang, Y.; Zhan, X.; Gao, Z.; Lin, Z.; Yang, Z.; Zhang, Y.; Shen, X.; Cao, L.; Cheng, S. Mapping of QTLs associated with important agronomic traits using three populations derived from a super hybrid rice Xieyou9308. Euphytica 2012, 184, 1–13. [Google Scholar] [CrossRef]
- Zhou, S.; Zhu, M.; Wang, F.; Huang, J.; Wang, G. Mapping of Qtls for Yield and Its Components in a Rice Recombinant Inbred Line Population. Pak. J. Bot. 2013, 45, 183–189. [Google Scholar]
- Sun, P.; Cai, H.; Wei, X. QTL analysis of maximum tiller number and effective tiller number in rice. Henan Agric. Sci. 2014, 43, 12–15. [Google Scholar] [CrossRef]
- Lim, J.-H.; Yang, H.-J.; Jung, K.-H.; Yoo, S.-C.; Paek, N.-C. Quantitative Trait Locus Mapping and Candidate Gene Analysis for Plant Architecture Traits Using Whole Genome Re-Sequencing in Rice. Mol. Cells 2014, 37, 149–160. [Google Scholar] [CrossRef]
- Sun, J.; Wang, J.; Liu, H.; Xie, D.; Zheng, H.; Zhao, H.; Zou, D.; Luan, F. Dynamic QTL Analysis of Rice Seedling Height and Tiller Number Under Salt Stress. J. Nucl. Agric. Sci. 2015, 29, 235–243. [Google Scholar]
- Xu, F.; Huang, Y.; Bao, J. Identification of QTLs for agronomic traits in indica rice using an RIL population. Genes Genom. 2015, 37, 809–817. [Google Scholar] [CrossRef]
- Surapaneni, M.; Balakrishnan, D.; Mesapogu, S.; Addanki, K.R.; Yadavalli, V.R.; Venkata, T.V.G.N.; Neelamraju, S. Identification of Major Effect QTLs for Agronomic Traits and CSSLs in Rice from Swarna/Oryza nivara Derived Backcross Inbred Lines. Front. Plant Sci. 2017, 8, 1027. [Google Scholar] [CrossRef]
- Jiang, H.; Jiang, L.; Sun, H.; Zeng, L.; Xue, D.; Liang, G. Developmental QTL analysis of stem tiller extinction in two rice DH populations. J. Yangzhou Univ. Agric. Life Sci. Ed. 2008, 29, 53–60. [Google Scholar] [CrossRef]
- Jiang, H. Analysis and Mutant Gene Mapping of Tillering and Leaf-related Trait in Rice (Oryza sativa L.). Ph.D. Thesis, Yangzhou University, Yangzhou, China, 2008. [Google Scholar]
- Kennard, C.; Phillips, L.; Porter, A. Genetic dissection of seed shattering, agronomic, and color traits in American wildrice (Zizania palustris var. interior L.) with a comparative map. Theor. Appl. Genet. 2002, 105, 1075–1086. [Google Scholar] [CrossRef]
- Kobayashi, S.; Fukuta, Y.; Sato, T.; Osaki, M.; Khush, G.S. Molecular marker dissection of rice (Oryza sativa L.) plant architecture under temperate and tropical climates. Theor. Appl. Genet. 2003, 107, 1350–1356. [Google Scholar] [CrossRef]
- Ren, X.; Weng, Q.; Zhu, L.; He, G. Mapping Quantitative Trait Loci for Tillering Ability in Rice. Wuhan Univ. J. Nat. Sci. Ed. 2003, 49, 533–537. [Google Scholar]
- Miyamoto, N.; Goto, Y.; Matsui, M.; Ukai, Y.; Morita, M.; Nemoto, K. Quantitative trait loci for phyllochron and tillering in rice. Theor. Appl. Genet. 2004, 109, 700–706. [Google Scholar] [CrossRef] [PubMed]
- Liang, Y.; Zhang, Q.; Ye, S.; Liu, M.; Yin, D.; Li, P. QTL mapping and analysis for tiller and its relafed traits in rice. Chin. Agric. Sci. Bull. 2005, 21, 47–52. [Google Scholar]
- Wang, Y.; Li, J. Branching in rice. Curr. Opin. Plant Biol. 2011, 14, 94–99. [Google Scholar] [CrossRef]
- Zheng, X.; Yang, X.; Chen, Z.; Xie, W.; Yue, X.; Zhu, H.; Chen, S.; Sun, X. Arabidopsis SMAX1 overaccumulation suppresses rosette shoot branching and promotes leaf and petiole elongation. Biochem. Biophys. Res. Commun. 2021, 553, 44–50. [Google Scholar] [CrossRef]
- Oikawa, T.; Kyozuka, J. Two-Step Regulation of LAX PANICLE1 Protein Accumulation in Axillary Meristem Formation in Rice. Plant Cell 2009, 21, 1095–1108. [Google Scholar] [CrossRef]
- Zhang, Z.; Sun, X.; Ma, X.; Xu, B.; Zhao, Y.; Ma, Z.; Li, G.; Khan, N.U.; Pan, Y.; Liang, Y.; et al. GNP6, a novel allele of MOC1, regulates panicle and tiller development in rice. Crop J. 2021, 9, 57–67. [Google Scholar] [CrossRef]
- Lu, Z.; Yu, H.; Xiong, G.; Wang, J.; Jiao, Y.; Liu, G.; Jing, Y.; Meng, X.; Hu, X.; Qian, Q.; et al. Genome-Wide Binding Analysis of the Transcription Activator Ideal Plant Architecture1 Reveals a Complex Network Regulating Rice Plant Architecture. Plant Cell 2013, 25, 3743–3759. [Google Scholar] [CrossRef]
- Zheng, J.; Hong, K.; Zeng, L.; Wang, L.; Kang, S.; Qu, M.; Dai, J.; Zou, L.; Zhu, L.; Tang, Z.; et al. Karrikin Signaling Acts Parallel to and Additively with Strigolactone Signaling to Regulate Rice Mesocotyl Elongation in Darkness. Plant Cell 2020, 32, 2780–2805. [Google Scholar] [CrossRef]
- Kulkarni, K.P.; Vishwakarma, C.; Sahoo, S.P.; Lima, J.M.; Nath, M.; Dokku, P.; Gacche, R.N.; Mohapatra, T.; Robin, S.; Sarla, N.; et al. A substitution mutation in OsCCD7 cosegregates with dwarf and increased tillering phenotype in rice. J. Genet. 2014, 93, 389–401. [Google Scholar] [CrossRef]
- Zou, J.; Zhang, S.; Zhang, W.; Li, G.; Chen, Z.; Zhai, W.; Zhao, X.; Pan, X.; Xie, Q.; Zhu, L. The rice HIGH-TILLERING DWARF1 encoding an ortholog of Arabidopsis MAX3 is required for negative regulation of the outgrowth of axillary buds. Plant J. Cell Mol. Biol. 2006, 48, 687–698. [Google Scholar] [CrossRef]
- Miura, K.; Ikeda, M.; Matsubara, A.; Song, X.-J.; Ito, M.; Asano, K.; Matsuoka, M.; Kitano, H.; Ashikari, M. OsSPL14 promotes panicle branching and higher grain productivity in rice. Nat. Genet. 2010, 42, 545–549. [Google Scholar] [CrossRef]
- Dai, Z.; Wang, J.; Yang, X.; Lu, H.; Miao, X.; Shi, Z. Modulation of plant architecture by the miR156f-OsSPL7-OsGH3.8 pathway in rice. J. Exp. Bot. 2018, 69, 5117–5130. [Google Scholar] [CrossRef]
- Leran, S.; Varala, K.; Boyer, J.-C.; Chiurazzi, M.; Crawford, N.; Daniel-Vedele, F.; David, L.; Dickstein, R.; Fernandez, E.; Forde, B.; et al. A unified nomenclature of NITRATE TRANSPORTER 1/PEPTIDE TRANSPORTER family members in plants. Trends Plant Sci. 2014, 19, 5–9. [Google Scholar] [CrossRef]
- Huang, W.; Nie, H.; Feng, F.; Wang, J.; Lu, K.; Fang, Z. Altered expression of OsNPF7.1 and OsNPF7.4 differentially regulates tillering and grain yield in rice. Plant Sci. 2019, 283, 23–31. [Google Scholar] [CrossRef] [PubMed]
- McSteen, P. Hormonal Regulation of Branching in Grasses. Plant Physiol. 2009, 149, 46–55. [Google Scholar] [CrossRef]
- Wu, J.; Guo, X.; Lu, J.; Wang, X.; Xu, Z.; Zhang, X. Effects of continuous straw mulching on soil physical and chemical properties and crop yields in paddy-upland rotation sys-tem. Plant Nutr. Fertil. Sci. 2012, 18, 587–594. [Google Scholar]
- Liu, Z.; Tao, L.; Liu, T.; Zhang, X.; Wang, W.; Song, J.; Yu, C.; Peng, X. Nitrogen application after low-temperature exposure alleviates tiller decrease in rice. Environ. Exp. Bot. 2019, 158, 205–214. [Google Scholar] [CrossRef]
- Kiba, T.; Takei, K.; Kojima, M.; Sakakibara, H. Side-Chain Modification of Cytokinins Controls Shoot Growth in Arabidopsis. Dev. Cell 2013, 27, 452–461. [Google Scholar] [CrossRef]
- Schaller, G.E.; Street, I.H.; Kieber, J.J. Cytokinin and the cell cycle. Curr. Opin. Plant Biol. 2014, 21, 7–15. [Google Scholar] [CrossRef]


| Stage | Year | Environment | Parent | RIL Population | ANOVA | |||||
|---|---|---|---|---|---|---|---|---|---|---|
| PA64s | 9311 | Mean | Range | CV (%) | RILs | Treatment | G × E | |||
| D1 | 2021 | E1 | 4.5 | 5 | 4.2 ± 0.7 | 2.3~6.8 | 16.3 | ** | NS | ** |
| E2 | 5.0 * | 3.3 | 4.3 ± 0.4 | 3.0~7.0 | 9.5 | |||||
| E3 | 3.8 | 4 | 4.2 ± 0.6 | 3.0~6.8 | 14.1 | |||||
| 2022 | E4 | 13.0 * | 8 | 7.9 ± 0.6 | 4.3~11.7 | 7.3 | ||||
| E5 | 9.3 | 9.3 | 9.3 ± 1.0 | 4.0~14.3 | 10.2 | |||||
| E6 | 9.3 * | 5.7 | 7.3 ± 0.5 | 3.7~12.3 | 7.5 | |||||
| D2 | 2021 | E1 | 10.3 * | 8.3 | 7.3 ± 1.0 | 4.5~13.5 | 13.8 | ** | ** | ** |
| E2 | 9.3 * | 6.3 | 6.9 ± 1.1 | 4.0~11.8 | 15.7 | |||||
| E3 | 6.5 * | 5 | 4.9 ± 1 | 2.8~8.3 | 20.9 | |||||
| 2022 | E4 | 14.7 * | 10 | 13.8 ± 1.1 | 7.0~22.3 | 7.9 | ||||
| E5 | 14.0 * | 11.3 | 13.9 ± 1.2 | 7.3~23.3 | 8.5 | |||||
| E6 | 11.3 * | 9 | 9.6 ± 0.7 | 5.0~14.7 | 7.5 | |||||
| D3 | 2021 | E1 | 16.0 * | 12.8 | 12.6 ± 1.1 | 8.3~21.0 | 8.9 | ** | ** | ** |
| E2 | 14.3 * | 9.3 | 11.5 ± 1.7 | 6.3~21.3 | 14.3 | |||||
| E3 | 14.3 * | 8 | 9.8 ± 1.3 | 5.3~15.5 | 13.6 | |||||
| 2022 | E4 | 17.7 * | 13 | 14.9 ± 1.6 | 9.3~25.0 | 10.8 | ||||
| E5 | 18.0 * | 12 | 14.2 ± 1.0 | 8.0~25.7 | 7 | |||||
| E6 | 13.5 * | 11 | 13.1 ± 0.8 | 7.7~23.0 | 5.9 | |||||
| D4 | 2021 | E1 | 19.3 * | 12.8 | 12.7 ± 1.7 | 7.8~24.5 | 13.2 | ** | ** | ** |
| E2 | 24.3 * | 13.5 | 13.7 ± 2.2 | 7.5~21.3 | 16 | |||||
| E3 | 14.0 * | 8.5 | 11.9 ± 2.1 | 6.8~17.8 | 17.7 | |||||
| 2022 | E4 | 18.0 * | 15.3 | 15.5 ± 1.2 | 9.7~23.3 | 7.7 | ||||
| E5 | 18.5 * | 13.7 | 15.0 ± 1.3 | 9.3~23.3 | 8.8 | |||||
| E6 | 15.7 * | 12.7 | 14.0 ± 1.0 | 8.3~22.7 | 7.2 | |||||
| D5 | 2021 | E1 | 18.3 * | 11.3 | 13.0 ± 1.9 | 7.3~24.3 | 14.6 | ** | ** | ** |
| E2 | 26.7 * | 13.7 | 12.2 ± 2.4 | 6.3~22.5 | 19.6 | |||||
| E3 | 23.0 * | 12.5 | 12.8 ± 2.0 | 7.8~19.0 | 15.5 | |||||
| 2022 | E4 | 21.3 * | 15.7 | 14.4 ± 1.3 | 9.3~24.0 | 8.9 | ||||
| E5 | 19.3 * | 14 | 15.7 ± 1.2 | 9.0~22.3 | 7.6 | |||||
| E6 | 18.7 * | 13.5 | 14.3 ± 1.1 | 7.3~23.0 | 7.6 | |||||
| D6 | 2021 | E1 | 17.5 * | 11.5 | 11.4 ± 1.8 | 7.0~17.8 | 16.3 | ** | NS | ** |
| E2 | 22.5 * | 13.5 | 11.3 ± 2.4 | 6.5~15.3 | 21.2 | |||||
| E3 | 17.3 * | 11 | 11.7 ± 1.9 | 7.3~22.0 | 16 | |||||
| 2022 | E4 | 19.7 * | 14.7 | 16.6 ± 0.8 | 9.0~25.3 | 5.1 | ||||
| E5 | 19.8 * | 13.7 | 16.4 ± 1.4 | 9.0~26.0 | 8.3 | |||||
| E6 | 19.3 * | 13.7 | 15.8 ± 1.4 | 9.0~23.3 | 8.9 | |||||
| Stage | QTL | |||||||
|---|---|---|---|---|---|---|---|---|
| Name | Locus | Environment | Linkage Group | Position of Highest Peak (cM) | −log10(P) | Effect a | PVE | |
| D1 | qD1tn1-1 b | mks1-66 | E4 | 1 | 36.57 | 3.12 | −0.40 | 7.39 |
| qD1tn1-2 | mks1-305 | E4 | 1 | 123.05 | 3.23 | −0.40 | 7.38 | |
| qD1tn1-3 | mks1-355 | E6 | 1 | 152.44 | 4.81 | 1.02 | 41.61 | |
| qD1tn2 | mks2-228 | E6 | 2 | 90.69 | 4.09 | −0.52 | 10.70 | |
| qD1tn4 | mks4-278 | E6 | 4 | 90.75 | 4.70 | −0.57 | 12.82 | |
| qD1TN6-2 | mks6-69 | E1 | 6 | 24.44 | 4.03 | 0.28 | 11.09 | |
| qD1TN6-1 | mks6-222 | E1 | 6 | 82.85 | 3.63 | 0.25 | 8.86 | |
| qD1tn9 | mks9-131 | E4 | 9 | 42.55 | 4.52 | 0.50 | 11.85 | |
| D2 | qD2TN1-4 | mks1-61 | E3 | 1 | 34.43 | 3.65 | 0.33 | 9.19 |
| qD2tn1 | mks1-305 | E4 | 1 | 123.05 | 3.19 | −1.00 | 9.05 | |
| qD2TN1-2 | mks1-352 | E2 | 1 | 151.87 | 5.18 | 1.21 | 47.95 | |
| qD2tn2 | mks2-17 | E6 | 2 | 10.29 | 4.84 | −0.67 | 11.36 | |
| qD2TN2-1 | mks2-107 | E1 | 2 | 40.9 | 3.11 | 0.49 | 8.33 | |
| qD2tn3 | mks3-165 | E5 | 3 | 65.05 | 5.70 | 1.19 | 13.93 | |
| qD2tn4-1 | mks4-30 | E6 | 4 | 8.49 | 3.08 | −0.53 | 7.22 | |
| qD2tn4-2 | mks4-340 | E5 | 4 | 122.16 | 3.69 | 0.94 | 8.56 | |
| qD2tn5-1 | mks5-196 | E5 | 5 | 89.99 | 3.25 | 0.83 | 6.72 | |
| qD2tn5-2 | mks5-286 | E6 | 5 | 118.71 | 5.05 | 0.68 | 11.65 | |
| qD2tn6-1 | mks6-81 | E5 | 6 | 34.84 | 3.16 | −0.89 | 7.79 | |
| qD2tn6-2 | mks6-135 | E6 | 6 | 51.64 | 3.08 | −0.53 | 7.09 | |
| qD2TN8 | mks8-91 | E2 | 8 | 48.49 | 3.75 | −0.54 | 9.52 | |
| D3 | qD3tn1 | mks1-71 | E6 | 1 | 38.69 | 4.02 | 1.07 | 9.95 |
| qD3TN3-1 | mks3-139 | E2 | 3 | 50.82 | 3.68 | 0.88 | 9.24 | |
| qD3TN3-2 | mks3-213 | E1 | 3 | 89.43 | 3.26 | −0.65 | 6.49 | |
| qD3tn4-1 | mks4-355 | E6 | 4 | 125.8 | 3.68 | 1.07 | 9.98 | |
| qD3tn4-2 | mks4-374 | E4 | 4 | 132.58 | 3.20 | 0.79 | 8.02 | |
| qD3TN6 | mks6-235 | E1 | 6 | 89.03 | 3.22 | 0.67 | 6.87 | |
| qD3TN7 | mks7-139 | E1 | 7 | 39.72 | 3.50 | −0.69 | 7.17 | |
| qD3TN8-1 | mks8-27 | E1 | 8 | 10.65 | 4.83 | −0.83 | 10.61 | |
| qD3TN12-1 | mks12-8 | E2 | 12 | 1.53 | 5.02 | −1.19 | 16.80 | |
| D4 | qD4tn1 | mks1-382 | E5 | 1 | 171.08 | 3.22 | 0.71 | 7.43 |
| qD4TN2-1 | mks2-344 | E3 | 2 | 135.73 | 3.53 | 0.61 | 7.83 | |
| qD4TN3 | mks3-192 | E3 | 3 | 81.08 | 4.66 | −0.71 | 10.37 | |
| qD4TN4 | mks4-18 | E2 | 4 | 4.81 | 4.49 | −0.95 | 11.13 | |
| qD4tn4 | mks4-62 | E5 | 4 | 19.71 | 4.73 | −0.93 | 12.44 | |
| qD4TN5-1 | mks5-29 | E2 | 5 | 11.63 | 3.89 | 0.91 | 10.30 | |
| qD4TN5-2 | mks5-37 | E3 | 5 | 14.92 | 3.05 | 0.56 | 6.60 | |
| qD4TN6 | mks6-212 | E3 | 6 | 79.37 | 4.65 | 0.74 | 11.33 | |
| qD4TN8-1 | mks8-1 | E1 | 8 | 0 | 3.76 | −0.83 | 9.68 | |
| qD4TN8-2 | mks8-36 | E2 | 8 | 12.95 | 4.30 | −0.96 | 11.26 | |
| qD4tn9 | mks9-144 | E5 | 9 | 47.38 | 5.64 | 1.00 | 14.59 | |
| qD4tn9 | mks9-144 | E6 | 9 | 47.38 | 3.77 | 0.86 | 11.27 | |
| qD4TN10 | mks10-197 | E2 | 10 | 75.21 | 3.23 | 0.73 | 6.63 | |
| qD4TN12 | mks12-197 | E1 | 12 | 75.31 | 3.79 | 0.95 | 12.78 | |
| D5 | qD5TN2-1 | mks2-199 | E3 | 2 | 82.35 | 5.39 | 0.85 | 13.74 |
| qD5tn3 | mks3-165 | E5 | 3 | 65.05 | 6.01 | 1.19 | 18.71 | |
| qD5TN6 | mks6-235 | E1 | 6 | 89.03 | 3.31 | 1.03 | 9.20 | |
| qD5tn7 | mks7-105 | E5 | 7 | 27.85 | 4.66 | 1.00 | 13.15 | |
| D6 | qD6TN1 | mks1-216 | E2 | 1 | 90.37 | 3.44 | 0.54 | 9.27 |
| qD6TN4 | mks4-265 | E2 | 4 | 83.48 | 5.22 | 0.69 | 15.51 | |
| qD6tn5 | mks5-179 | E4 | 5 | 80.67 | 3.97 | −0.94 | 10.69 | |
| qD6TN6-2 | mks6-195 | E3 | 6 | 70.51 | 3.98 | 0.86 | 10.61 | |
| qD6TN7 | mks7-139 | E3 | 7 | 39.72 | 4.08 | −0.83 | 9.89 | |
| qD6tn7 | mks7-146 | E4 | 7 | 41.25 | 3.44 | −0.82 | 8.14 | |
| qD6tn10-1 | mks10-64 | E4 | 10 | 30.1 | 3.12 | −0.79 | 7.49 | |
| qD6tn10-2 | mks10-68 | E6 | 10 | 31.25 | 3.59 | −0.76 | 9.83 | |
| qD6tn12 | mks12-294 | E6 | 12 | 110.04 | 3.29 | −0.72 | 8.71 | |
| Stage | Name | Locus | Linkage Group | Position of Highest (cM) | −log10 (P) | Q × E | Treatment | Effect a | pb | R2 |
|---|---|---|---|---|---|---|---|---|---|---|
| D1 | qmD1TN1 | mks1-356 | 1 | 152.63 | 2.66 | no | E1 | 0.33 | 0.00 | 15.70 |
| E2 | 0.33 | 0.00 | 18.00 | |||||||
| E3 | 0.33 | 0.00 | 14.30 | |||||||
| E4 | 0.33 | 0.00 | 5.10 | |||||||
| E5 | 0.33 | 0.00 | 1.90 | |||||||
| E6 | 0.33 | 0.00 | 4.40 | |||||||
| qmD1TN2 | mks2-106 | 2 | 38.85 | 3.67 | yes | E1 | 0.15 | 0.24 | 3.20 | |
| E2 | 0.02 | 0.90 | 0.00 | |||||||
| E3 | 0.04 | 0.77 | 0.20 | |||||||
| E4 | −0.03 | 0.81 | 0.00 | |||||||
| E5 | 0.61 | 0.00 | 6.30 | |||||||
| E6 | −0.11 | 0.40 | 0.40 | |||||||
| qmD1TN6 | mks6-71 | 6 | 24.82 | 6.60 | yes | E1 | 0.21 | 0.10 | 6.30 | |
| E2 | −0.22 | 0.09 | 7.70 | |||||||
| E3 | −0.05 | 0.72 | 0.30 | |||||||
| E4 | 0.23 | 0.07 | 2.40 | |||||||
| E5 | −0.70 | 0.00 | 8.40 | |||||||
| E6 | −0.05 | 0.71 | 0.10 | |||||||
| qmD1TN12 | mks12-267 | 12 | 100.89 | 3.50 | yes | E1 | −0.12 | 0.38 | 2.00 | |
| E2 | 0.00 | 1.00 | 0.00 | |||||||
| E3 | 0.09 | 0.48 | 1.10 | |||||||
| E4 | −0.03 | 0.83 | 0.00 | |||||||
| E5 | 0.56 | 0.00 | 5.40 | |||||||
| E6 | −0.26 | 0.04 | 2.80 | |||||||
| D2 | qmD2TN1 | mks1-334 | 1 | 131.32 | 5.81 | yes | E1 | −0.01 | 0.95 | 0.00 |
| E2 | −0.03 | 0.90 | 0.00 | |||||||
| E3 | −0.04 | 0.84 | 0.10 | |||||||
| E4 | −1.05 | 0.00 | 9.90 | |||||||
| E5 | 0.48 | 0.02 | 2.30 | |||||||
| E6 | −0.15 | 0.46 | 0.60 | |||||||
| qmD2TN3-1 | mks3-105 | 3 | 34.84 | 4.66 | yes | E1 | 0.18 | 0.44 | 1.10 | |
| E2 | 0.31 | 0.17 | 3.10 | |||||||
| E3 | 0.16 | 0.49 | 2.00 | |||||||
| E4 | −1.01 | 0.00 | 9.20 | |||||||
| E5 | 0.44 | 0.05 | 1.90 | |||||||
| E6 | 0.08 | 0.74 | 0.10 | |||||||
| qmD2TN3-2 | mks3-164 | 3 | 64.86 | 2.95 | yes | E1 | −0.09 | 0.68 | 0.30 | |
| E2 | 0.39 | 0.08 | 4.90 | |||||||
| E3 | −0.07 | 0.75 | 0.40 | |||||||
| E4 | 0.55 | 0.01 | 2.70 | |||||||
| E5 | 0.83 | 0.00 | 6.80 | |||||||
| E6 | 0.18 | 0.41 | 0.90 | |||||||
| qmD2TN6 | mks6-81 | 6 | 34.84 | 4.31 | yes | E1 | −0.12 | 0.60 | 0.50 | |
| E2 | −0.31 | 0.17 | 3.00 | |||||||
| E3 | −0.09 | 0.69 | 0.60 | |||||||
| E4 | 0.13 | 0.56 | 0.10 | |||||||
| E5 | −1.13 | 0.00 | 12.40 | |||||||
| E6 | −0.33 | 0.14 | 2.70 | |||||||
| D3 | qmD3TN3 | mks3-108 | 3 | 37.97 | 2.62 | yes | E1 | −0.30 | 0.26 | 1.30 |
| E2 | 0.79 | 0.00 | 7.50 | |||||||
| E3 | 0.14 | 0.60 | 0.70 | |||||||
| E4 | 0.23 | 0.38 | 0.70 | |||||||
| E5 | 0.76 | 0.00 | 5.70 | |||||||
| E6 | 0.36 | 0.17 | 1.20 | |||||||
| D4 | qmD4TN1 | mks1-382 | 1 | 171.08 | 3.36 | yes | E1 | 0.08 | 0.72 | 0.10 |
| E2 | −0.35 | 0.15 | 1.50 | |||||||
| E3 | 0.04 | 0.87 | 0.00 | |||||||
| E4 | 0.47 | 0.05 | 2.30 | |||||||
| E5 | 0.86 | 0.00 | 10.70 | |||||||
| E6 | −0.18 | 0.46 | 0.50 | |||||||
| qmD4TN2 | mks2-344 | 2 | 135.73 | 2.91 | yes | E1 | 0.43 | 0.07 | 2.60 | |
| E2 | 0.78 | 0.00 | 7.50 | |||||||
| E3 | 0.61 | 0.01 | 7.90 | |||||||
| E4 | −0.07 | 0.77 | 0.10 | |||||||
| E5 | 0.22 | 0.35 | 0.70 | |||||||
| E6 | −0.17 | 0.47 | 0.40 | |||||||
| qmD4TN4 | mks4-14 | 4 | 3.27 | 3.29 | yes | E1 | −0.05 | 0.85 | 0.00 | |
| E2 | −0.78 | 0.00 | 7.60 | |||||||
| E3 | −0.02 | 0.93 | 0.00 | |||||||
| E4 | −0.81 | 0.00 | 7.00 | |||||||
| E5 | −0.70 | 0.01 | 7.10 | |||||||
| E6 | −0.09 | 0.73 | 0.10 | |||||||
| qmD4TN9 | mks9-143 | 9 | 47.19 | 3.28 | yes | E1 | −0.32 | 0.18 | 1.40 | |
| E2 | −0.01 | 0.96 | 0.00 | |||||||
| E3 | 0.20 | 0.40 | 0.80 | |||||||
| E4 | 0.48 | 0.04 | 2.40 | |||||||
| E5 | 0.77 | 0.00 | 8.60 | |||||||
| E6 | 0.59 | 0.01 | 5.20 | |||||||
| D5 | qmD5TN6 | mks6-71 | 6 | 24.82 | 2.93 | yes | E1 | 0.65 | 0.01 | 3.70 |
| E2 | −0.10 | 0.70 | 0.10 | |||||||
| E3 | −0.24 | 0.34 | 1.10 | |||||||
| E4 | −0.23 | 0.37 | 1.00 | |||||||
| E5 | −0.78 | 0.00 | 7.90 | |||||||
| E6 | 0.17 | 0.52 | 0.20 | |||||||
| D6 | qmD6TN7 | mks7-145 | 7 | 41.06 | 4.31 | yes | E1 | −0.36 | 0.09 | 2.50 |
| E2 | 0.05 | 0.83 | 0.10 | |||||||
| E3 | −0.79 | 0.00 | 8.90 | |||||||
| E4 | −0.84 | 0.00 | 8.40 | |||||||
| E5 | −0.07 | 0.75 | 0.10 | |||||||
| E6 | −0.07 | 0.75 | 0.10 |
| Map Name | Traits | Parental | Population Type | Population Size | Number of QTL | Reference |
|---|---|---|---|---|---|---|
| 2021-Wang | TN | Changhui 121/Koshihikari | BC | 208 | 8 | (Wang et al., 2021) [27] |
| 2021-Luo | TN | Oryza rufipogon Griff./Oryza sativa L. | BC | 104 | 2 | (Luo et al., 2021) [28] |
| 2021-B. Rajurkar | TN | IR62266/Norungan | RIL | 132 | 35 | (B. RajurKar et al., 2021) [29] |
| 2021-Kwon | TN | 9311/Milyang352 | DH | 117 | 3 | (Kwon et al., 2021) [30] |
| 2021-Suman | TN | PR116/Ranbir Basmati | RIL | 44 | 1 | (Suman et al., 2021) [31] |
| 2022-Kavitha Beerelli | TN | IET27223/IET26772 | RIL | 174 | 4 | (Kavitha Beerelli et al., 2022) [32] |
| 2017-Zhang | TN | XieqingzaoB/Zhonghui9308 | RIL | 195 | 3 | (Zhang et al., 2017) [33] |
| 2018-Lei | TN | Dongnong422/Kongyu131 | RIL | 190 | 7 | (Lei et al., 2018) [15] |
| 2018-Xu | TN | Shennong265/Haogelao | BC | 178 | 3 | (Xu et al., 2018) [34] |
| 2019-Li | TN | Liaoyou5218/5216A | BC | 167 | 2 | (Li et al., 2019) [35] |
| 2019-Zhou | TN | Mowanggu/CO39 | BC | 280 | 4 | (Zhou et al., 2019) [36] |
| 2020-Mona | TN | Hashemi/Nemat | RIL | 140 | 3 | (Emami et al., 2020) [37] |
| 2007-Liang | TN | Nipponbare/Guagluai4hao | RIL | 90 | 6 | (Liang et al., 2007) [38] |
| 2007-Ye | TN | PA64s/Nipponbare | RIL | 180 | 2 | (Ye et al., 2007) [39] |
| 2013-Vennu | TN | Nipponbare/9311 | RIL | 254 | 9 | (Vennu et al., 2013) [40] |
| 2009-Xu | TN | Nipponbare/Kasalath | BC | 98 | 4 | (Xu et al., 2009) [41] |
| 2012-Liang | TN | XieqingzaoB/Zhonghui9308 | RIL | 226 | 4 | (Liang et al., 2012) [42] |
| 2013-Zhou | TN | Guanghui 116/LaGrue | RIL | 307 | 4 | (Zhou et al., 2013) [43] |
| 2014-Sun | TN | Ch5-10/Ch6-11 | RIL | 113 | 9 | (Sun et al., 2014) [44] |
| 2014-Lim | TN | Milyang23/SNUSG1 | RIL | 178 | 5 | (Lim et al., 2014) [45] |
| 2015-Sun | TN | Dongnong425/Changbai10 | RIL | 180 | 7 | (Sun et al., 2015) [46] |
| 2015-Xu | TN | JY293/M201 | RIL | 234 | 2 | (Xu et al., 2015) [47] |
| 2017-Malathi | TN | MTU7029/IRGC81848 | BC | 94 | 2 | (Surapaneni et al., 2017) [48] |
| 2008-Jiang (1) | TN | Zhaiyeqing8hao/Jingxi17 | DH | 127 | 30 | (Jiang (1) et al., 2008) [49] |
| 2008-Jiang (2) | TN | Taizhong1/Chunjiang06 | DH | 120 | 45 | (Jiang (2) et al., 2008) [50] |
| 2002-W. C. Kennard | TN | Johnson/Dora Lake | RIL | 172 | 3 | (W. C. Kennard et al., 2002) [51] |
| 2003-Kobayashi | TN | Milyang 23/Akihikari | RIL | 191 | 2 | (Kobayashi et al., 2003) [52] |
| 2003-Ren | TN | MH63/B5 | RIL | 187 | 4 | (Ren et al., 2003) [53] |
| 2004-N. Miyamoto | TN | IR36/Genjah Wangkal | RIL | 100 | 4 | (N. Miyamoto et al., 2004) [54] |
| 2005-Liang | TN | Nipponbare/Guangluai4 | RIL | 100 | 5 | (Liang et al., 2005) [55] |
| Chr a | No. of Markers b | No. of QTLs b | Length (cM) | Average (cM) |
|---|---|---|---|---|
| 1 | 299 | 36 | 278.2 | 0.93 |
| 2 | 266 | 30 | 256.4 | 0.96 |
| 3 | 164 | 17 | 285.1 | 1.74 |
| 4 | 130 | 20 | 201.5 | 1.55 |
| 5 | 266 | 25 | 244.8 | 0.92 |
| 6 | 201 | 37 | 258.2 | 1.28 |
| 7 | 76 | 15 | 252.3 | 3.32 |
| 8 | 99 | 16 | 159.0 | 1.61 |
| 9 | 124 | 15 | 172.7 | 1.39 |
| 10 | 57 | 10 | 122.5 | 2.15 |
| 11 | 111 | 16 | 169.2 | 1.52 |
| 12 | 72 | 8 | 123.2 | 1.71 |
| Total | 1865 | 245 | 2523.2 | |
| a chromosome | ||||
| b number |
| MQTL | QTL Model | Position (cM) | PVE (%) | No. of Initial QTLs | MQTL CI (95%) | Interval | Physical Length of MQTLs (Mb) | Partial Initial QTL | Candidate Genes |
|---|---|---|---|---|---|---|---|---|---|
| MQTL1.1 | 7 | 2.78 | 7 | 2 | 3.94 | RM3148–RM5423 | 1.42 | SPL33; MHZ4 | |
| MQTL1.2 | 23.29 | 23 | 8 | 2.94 | R1944–RM8111 | 1.73 | OsNPR1; OsSCAR1; DPF; OsBZR2 | ||
| MQTL1.3 | 48.21 | 6 | 2 | 7.06 | RM259–RM576 | 0.69 | OsGRX3 | ||
| MQTL1.4 | 114.22 | 13 | 4 | 2.44 | GA330–RG345 | 3.79 | OsRH2; OsATG7; Osa-miR319a; OsFBK1 | ||
| MQTL1.5 | 132.81 | 16 | 6 | 1.00 | RM1117–RM3324 | 2.43 | mks1-334 | THIS1; OsIAA6; D10 | |
| MQTL1.6 | 151.31 | 15 | 5 | 1.02 | RM3520–RM414 | 0.50 | qD1tn1-3, qD2tn1-2, mks1-356 | OsSPL2 | |
| MQTL1.7 | 197.75 | 21 | 7 | 0.29 | RM5362–RM1067 | 1.84 | OsRLCK57 | ||
| MQTL2.1 | 6 | 9.21 | 7 | 2 | 6.59 | R2510–CT16 | 1.57 | qD2tn2 | OsSPL3; OsmiR168a; OsTEF1 |
| MQTL2.2 | 66.43 | 33 | 10 | 2.04 | RM71–G243A | 2.99 | EP3 | ||
| MQTL2.3 | 108.02 | 10 | 3 | 2.45 | R26–RM318 | 3.30 | OsmiR156i; OsPRR1; OsPLIM2a | ||
| MQTL2.4 | 130.83 | 23 | 7 | 2.91 | R3393–CT388 | 3.15 | qD4TN2-1, mks2-344 | OsPIN1; OsMADS57; OsNPF7.2; OsDOF11 | |
| MQTL2.5 | 164.77 | 17 | 5 | 2.19 | CT482–CT87 | 1.88 | OsNR2; DES4 | ||
| MQTL2.6 | 189.23 | 10 | 3 | 0.37 | CT41–RM535 | 0.41 | OsIAA10; OsDHHC06 | ||
| MQTL3.1 | 4 | 8.03 | 29 | 5 | 5.97 | C25–RM489 | 0.37 | ||
| MQTL3.2 | 36.38 | 24 | 4 | 5.86 | RM232–RM3280 | 1.15 | mks3-105, mks3-108 | ||
| MQTL3.3 | 84.02 | 17 | 3 | 15.54 | MRG6395–RM5626 | 2.61 | qD4TN3 | ||
| MQTL3.4 | 124.4 | 29 | 5 | 2.87 | RM426–RM504 | 0.54 | OsTB1; OsSLR1 | ||
| MQTL4.1 | 4 | 7.73 | 11 | 2 | 11.67 | RM518–RM252 | 3.62 | qD2tn4-1, mks4-14 | OsETR2; OsPT4 |
| MQTL4.2 | 69.98 | 31 | 6 | 2.50 | RM3308–RM6679 | 0.73 | OsAFB2; LAX2 | ||
| MQTL4.3 | 85.88 | 32 | 6 | 5.30 | RM6997–RM1165 | 2.55 | qD6TN4 | OsNAC2 | |
| MQTL4.4 | 145.47 | 26 | 5 | 1.17 | RM255–RM5968 | 3.31 | OsNPF7.3; RFL; OsGS2; MOC3 | ||
| MQTL5.1 | 6 | 21.57 | 12 | 2 | 0.08 | RM13–RM437 | 1.87 | OsTIR1 | |
| MQTL5.2 | 22.96 | 14 | 4 | 0.11 | RM437–RM7118 | 2.21 | |||
| MQTL5.3 | 40.82 | 4 | 1 | 7.93 | RM289–RM249 | 2.97 | |||
| MQTL5.4 | 77.11 | 23 | 5 | 4.98 | RM164–RM3295 | 3.07 | OsBC1L4 | ||
| MQTL5.5 | 99.32 | 25 | 6 | 3.17 | RM3476–G81 | 0.48 | OsZIP9; OsZIP5; PILS6b | ||
| MQTL5.6 | 114.77 | 9 | 2 | 10.10 | RM3348–GA257 | 3.52 | qD2tn5-2 | OsmtSSB1; OsPUP7 | |
| MQTL6.1 | 8 | 11.99 | 17 | 6 | 0.61 | RM510–RM6587 | 0.54 | D3; Hd3a | |
| MQTL6.2 | 21.45 | 14 | 6 | 1.37 | CT201–CT115 | 0.82 | AID1; OsNPY2 | ||
| MQTL6.3 | 25.3 | 11 | 3 | 0.84 | RM314–RM253 | 0.58 | qD1TN6-2, mks6-71 | OsKASI | |
| MQTL6.4 | 35.12 | 14 | 5 | 2.39 | RM2615–R2147 | 0.56 | qD2tn6-1, mks6-81 | OsTCP19 | |
| MQTL6.5 | 58.33 | 11 | 4 | 4.10 | RM5745–RM1161 | 1.26 | Osa-miR1871; OsMFAP1 | ||
| MQTL6.6 | 77.8 | 6 | 2 | 7.97 | RM541–RM5957 | 5.01 | qD4TN6 | OsUBR7; OsAAP3; OsSPX1; OsBZR3; MOC1 | |
| MQTL6.7 | 103.9 | 19 | 7 | 1.99 | RM7641–RM340 | 1.34 | OsPIN2; OsARF18 | ||
| MQTL6.8 | 175.44 | 8 | 3 | 0.75 | G342–RM494 | 0.27 | FON1 | ||
| MQTL7.1 | 4 | 11.69 | 29 | 4 | 8.87 | RM3325–RM21103 | 2.34 | OsTCP21; POW1 | |
| MQTL7.2 | 30.81 | 16 | 3 | 10.13 | RG477–CT91 | 6.00 | qD5tn7 | ||
| MQTL7.3 | 69.48 | 22 | 3 | 12.12 | G20–RM5583 | 1.83 | CHR729 | ||
| MQTL7.4 | 97.39 | 27 | 4 | 6.29 | RM1132–RM429 | 2.82 | mks7-145 | OsBZR1; OsLBD39; OsGH3.8; OsNPF7.1 | |
| MQTL8.1 | 6 | 1.22 | 9 | 1 | 1.20 | S2104–RM1381 | 0.27 | qD4TN8-1 | OsPMEI28 |
| MQTL8.2 | 2.24 | 22 | 4 | 0.68 | RM6925–RM6356 | 0.91 | |||
| MQTL8.3 | 37 | 25 | 4 | 4.38 | RM5428–C309 | 5.45 | OsCCA1; OsLIS-L1; DTH8; OsGPT1 | ||
| MQTL8.4 | 59.2 | 19 | 3 | 4.05 | RM6990–RM5767 | 4.46 | PAY1 | ||
| MQTL8.5 | 93.24 | 12 | 2 | 3.06 | G1073–CT56 | 1.81 | SAD1; OsmiR156f; Osmtd1 | ||
| MQTL8.6 | 133.15 | 13 | 2 | 5.15 | RZ66–RG136 | 1.52 | OsSPL14; OsPIN5b | ||
| MQTL9.1 | 4 | 15.61 | 21 | 3 | 2.95 | RM219–RM7387 | 2.25 | OsWRKY74 | |
| MQTL9.2 | 56.44 | 29 | 4 | 1.88 | RM566–RM434 | 0.96 | OsTCP17; OsmiR156g | ||
| MQTL9.3 | 67.76 | 37 | 6 | 6.00 | RM3533–RM5519 | 1.34 | LGD1; OsZHD1; Oshox4; OsmiR156k; OsSPL17 | ||
| MQTL9.4 | 101.77 | 13 | 2 | 1.67 | RM328–RM205 | 3.00 | OsSPL18; OsFTL4; OsSHI1; OsNLP4; OsNRPD1b; OsAHP2; OsDRP1E | ||
| MQTL11.1 | 3 | 4.71 | 31 | 5 | 2.33 | RM286–RM26153 | 3.25 | D53; OsGalLDH; OsTOM2; NAL2 | |
| MQTL11.2 | 63.56 | 43 | 7 | 3.08 | RM6272–CT4 | 3.11 | OsTOM3; miR535 | ||
| MQTL11.3 | 116.17 | 26 | 4 | 5.25 | RM1233–RM5766 | 1.81 | DHD1 |
Disclaimer/Publisher’s Note: The statements, opinions and data contained in all publications are solely those of the individual author(s) and contributor(s) and not of MDPI and/or the editor(s). MDPI and/or the editor(s) disclaim responsibility for any injury to people or property resulting from any ideas, methods, instructions or products referred to in the content. |
© 2025 by the authors. Licensee MDPI, Basel, Switzerland. This article is an open access article distributed under the terms and conditions of the Creative Commons Attribution (CC BY) license (https://creativecommons.org/licenses/by/4.0/).
Share and Cite
Shui, Y.; Guo, F.; Peng, Y.; Yin, W.; Qi, P.; Hu, Y.; Yan, S. Variation and QTL Analysis of Dynamic Tillering in Rice Under Nitrogen and Straw Return Treatments. Agriculture 2025, 15, 1115. https://doi.org/10.3390/agriculture15111115
Shui Y, Guo F, Peng Y, Yin W, Qi P, Hu Y, Yan S. Variation and QTL Analysis of Dynamic Tillering in Rice Under Nitrogen and Straw Return Treatments. Agriculture. 2025; 15(11):1115. https://doi.org/10.3390/agriculture15111115
Chicago/Turabian StyleShui, Yang, Faping Guo, Youlin Peng, Wei Yin, Pan Qi, Yungao Hu, and Shengmin Yan. 2025. "Variation and QTL Analysis of Dynamic Tillering in Rice Under Nitrogen and Straw Return Treatments" Agriculture 15, no. 11: 1115. https://doi.org/10.3390/agriculture15111115
APA StyleShui, Y., Guo, F., Peng, Y., Yin, W., Qi, P., Hu, Y., & Yan, S. (2025). Variation and QTL Analysis of Dynamic Tillering in Rice Under Nitrogen and Straw Return Treatments. Agriculture, 15(11), 1115. https://doi.org/10.3390/agriculture15111115