Article

The Effects of an Automatic Flushing Valve on the Hydraulic Performance of a Subsurface Drip Irrigation System for Alfalfa

1
College of Water Resources, North China University of Water Resources and Electric Power, Zhengzhou 450046, China
2
China Institute of Water Resources and Hydropower Research, Beijing 100048, China
3
Inner Mongolia Agricultural University, Hohhot 010018, China
4
Institute of Environment and Sustainable Development in Agriculture, Chinese Academy of Agricultural Sciences, Beijing 100081, China
*
Authors to whom correspondence should be addressed.
Agriculture 2025, 15(10), 1107; https://doi.org/10.3390/agriculture15101107
Submission received: 19 April 2025 / Revised: 16 May 2025 / Accepted: 17 May 2025 / Published: 21 May 2025

Abstract

:
The automatic flushing valve (AFV) enables automatic flushing of drip irrigation systems, improving their anti-clogging performance. This study focuses on a subsurface drip irrigation system (SDI) for alfalfa, selecting T20 and T70 AFVs (with designed flushing durations of 20 and 70 s, respectively) installed at the end of the dripline and a buried dripline without an AFV as a control. The aim of this study was to explore the variations in AFV hydraulic performance over two years of operation and the impact on the irrigation uniformity of SDI systems. The results revealed that the flushing duration (FD) and flushing water volume (FQ) of both T20 and T70 fluctuated over time, with an average coefficient of variation (CV) of 13.2%. The FD and FQ of the two types of AFVs are affected by the daily average temperature (T), and when T increases from 20.1 °C to 25.7 °C, the FD and FQ increased by an average of 22.6%. After 2 years of operation, the average relative flow rate (Dra) and irrigation uniformity (Cu) of the T20 and T70 SDI emitters were 93.7% and 96.8%. Both the Dra and Cu were significantly influenced by FD (p < 0.05). Compared with CK and T20, T70 significantly increased the Dra and Cu by 6.3% and 4.6%, respectively. The order of degree of clogging at different positions in the dripline was rear > middle > front for the CK and T20 treatments, whereas for T70, it was middle > front > rear. With the installation of the T70 AFV, the time required for the SDI system to reach moderate clogging (Dra = 50~80%) was extended from 3~7 years to 8~20 years, resulting in a 180% increase in operation time. The T70 AFV is recommended for use in the alfalfa SDI of this study.

1. Introduction

Alfalfa, one of the most important leguminous forage crops, is highly adaptable, produces a high yield of forage, and is rich in proteins, minerals, vitamins, and other nutrients. It is an excellent feed resource for herbivorous animals such as dairy cattle [1,2,3]. In 2021, China imported 1.78 million tons of alfalfa, accounting for 29.6% of the country’s total alfalfa usage, thus the country is heavily reliant on alfalfa imports [4]. To promote the development of animal husbandry, the Chinese government has strongly encouraged alfalfa cultivation in recent years [5]. By 2023, the area planted with alfalfa in China exceeded 550,000 hectares, with a yield exceeding 5 million tons. By 2030, China plans to increase the planting area of high-quality forage, mainly alfalfa, to 9 million hectares, with an estimated yield exceeding 130 million tons [6]. During its entire growing season, alfalfa can consume up to 2250 mm of water [7]. The expansion of alfalfa cultivation in the context of water scarcity has posed new challenges in the adoption of efficient water-saving irrigation technologies.
Subsurface drip irrigation (SDI) technology involves burying drip irrigation tubing below the tillage layer, allowing for water and fertilizers to be directly applied to crop roots without affecting surface machinery operations. It is currently one of the most water-efficient irrigation technologies [8,9]. When installed and maintained properly, the SDI can operate for 10 to 20 years without the need for annual reinstallation of the driplines [10], making it suitable for perennial crops such as alfalfa. Numerous studies have shown that SDI can significantly increase the yield and quality of alfalfa while improving water use efficiency. In northern Mexico, compared with flood and sprinkler irrigation, alfalfa irrigated with SDI increased yield by 23% to 64% [11]. In Kansas and southern California in the USA, SDI increased the alfalfa yield by 16% to 25% and saved 32% to 51% more water than flood irrigation did [12,13]. In regions of Xinjiang, China, such as Shihezi and Hutubi, SDI increased the alfalfa yield by 16.2% to 21.6% and improved water use efficiency by 20% to 148.1% compared with flood and microsprinkler irrigation [14,15].
However, since SDI emitters are buried and need to operate continuously for several years, the risk of clogging is much greater than that of surface drip systems in China, which are replaced annually. In addition to the clogging caused by the impurities in irrigation water, negative pressure suction and root intrusion can also lead to emitter clogging [16,17]. Minor clogging can affect the uniformity of irrigation and fertilization, whereas severe clogging can lead to the failure of the SDI system. The area of SDI application in Xinjiang, China, sharply decreased from 120,000 acres in 2005 to 1000 acres in 2014 due to issues such as emitter clogging [18]. In Inner Mongolia, China, alfalfa SDI resulted in slight emitter clogging after two years of operation, with the average relative flow rate (Dra) of the emitters decreasing by 10.3% [19]. In Kansas, United States, after six years of operation, the irrigation uniformity of the SDI decreased to 65%, failing to meet the irrigation demand [20]. For the alfalfa SDI system in Egypt’s National Center for Agricultural Research, the emitter clogging rate reached 20.8% after one year of operation, severely affecting the supply of water and fertilizer to alfalfa [11]. Therefore, emitter clogging is one of the greatest obstacles to the promotion and application of SDI in alfalfa cultivation.
Drip irrigation flushing can use hydraulic shear forces to remove sediments attached to the capillary walls and flush the dislodged clogging material out of the pipes, reducing the chances of sediment entering the emitters [21]. Under conditions of sandy water [22], reclaimed water [23], and slurry [24], drip flushing technology can extend the emitter’s lifespan by 24% to 28%, 155% to 186%, and 12% to 21%, respectively. The automatic flushing valve (AFV) developed by the China Institute of Water Resources and Hydropower Research is installed at the end of the dripline. It can automatically flush the dripline when the drip irrigation system is activated and shut off automatically after the designed flushing duration (FD), allowing for the system to resume normal operation without external power input and achieving periodic automatic flushing of the drip irrigation system [22].
In recent years, scholars have conducted extensive research on the structural optimization of AFVs and their ability to resist sand clogging. Research has focused on parameters such as the tooth length, tooth width, and upper chamber volume of the annular labyrinth flow channel of the AFV [25], the volume of the storage chamber [21], the offset distance of the water column, the width of the drainage holes, and the hardness of the elastic diaphragm [26]. Using 3D printing technology, CFD numerical simulations, and hydraulic performance tests, scholars have revealed the response patterns of the hydraulic performance of the flushing valve to structural and elastic diaphragm mechanical parameters and have designed five types of AFVs with FDs ranging from 17.9 to 94.3 s. Due to significant changes in hydraulic performance before and after flushing of the drip irrigation system, Li et al. [27] and Gao et al. [28] built hydraulic calculation models on the basis of hydraulic performance test data and studied the optimal AFV layout and pump parameters for different scenarios (such as water source silt content, control scale, and crop type). To study the impact mechanism of an AFV on emitter anti-clogging ability under sandy water conditions, Zhao [29] and Li [30] configured sandy water with a concentration of 1 g/L according to the sediment grain size characteristics of the Hetao Irrigation District in Inner Mongolia and the Zun Village Irrigation District in Shanxi Province, China. After 400 h of system operation, compared with that of a drip irrigation system without AFVs (CK), the Dra of emitters with AFVs with FD between 30 and 80 s increased by 400% to 1657%, and the irrigation uniformity (Cu) increased by 125% to 135%. When the FD was 15 s, the short flushing time did not allow for the clogging material to be removed from the dripline in time, and the Dra of the emitters decreased by 12.4% to 14.5% compared with that of the CK treatment.
The structural design, layout, and anticlogging mechanism of AFVs under unconventional water conditions have mostly been studied in laboratory settings. However, in practical engineering, factors such as outdoor radiation, temperature, humidity, and water source temperature can vary, leading to the formation of complex physical, chemical, and biological clogging substances within the pipe walls, AFV internals, and emitter flow channels. The variation in AFV hydraulic performance over time and its impact on SDI irrigation uniformity remain underexplored, and the practical application of AFVs in SDI systems needs further research. Therefore, this study focused on the alfalfa SDI system by measuring the hydraulic performance of AFVs and buried emitters over two years of operation to identify the key factors affecting AFV operational stability. This study explored the spatial and temporal distribution characteristics of the emitter flow rate and the impact of AFVs on alfalfa SDI water and fertilizer application uniformity, aiming to establish quantitative response patterns for the anti-clogging ability of AFVs and the time required for moderate clogging to occur in SDI systems. These findings provide a basis for the development and promotion of AFVs, enhancing the operational efficiency of alfalfa SDI systems and advancing water-saving irrigation technology for alfalfa.

2. Materials and Methods

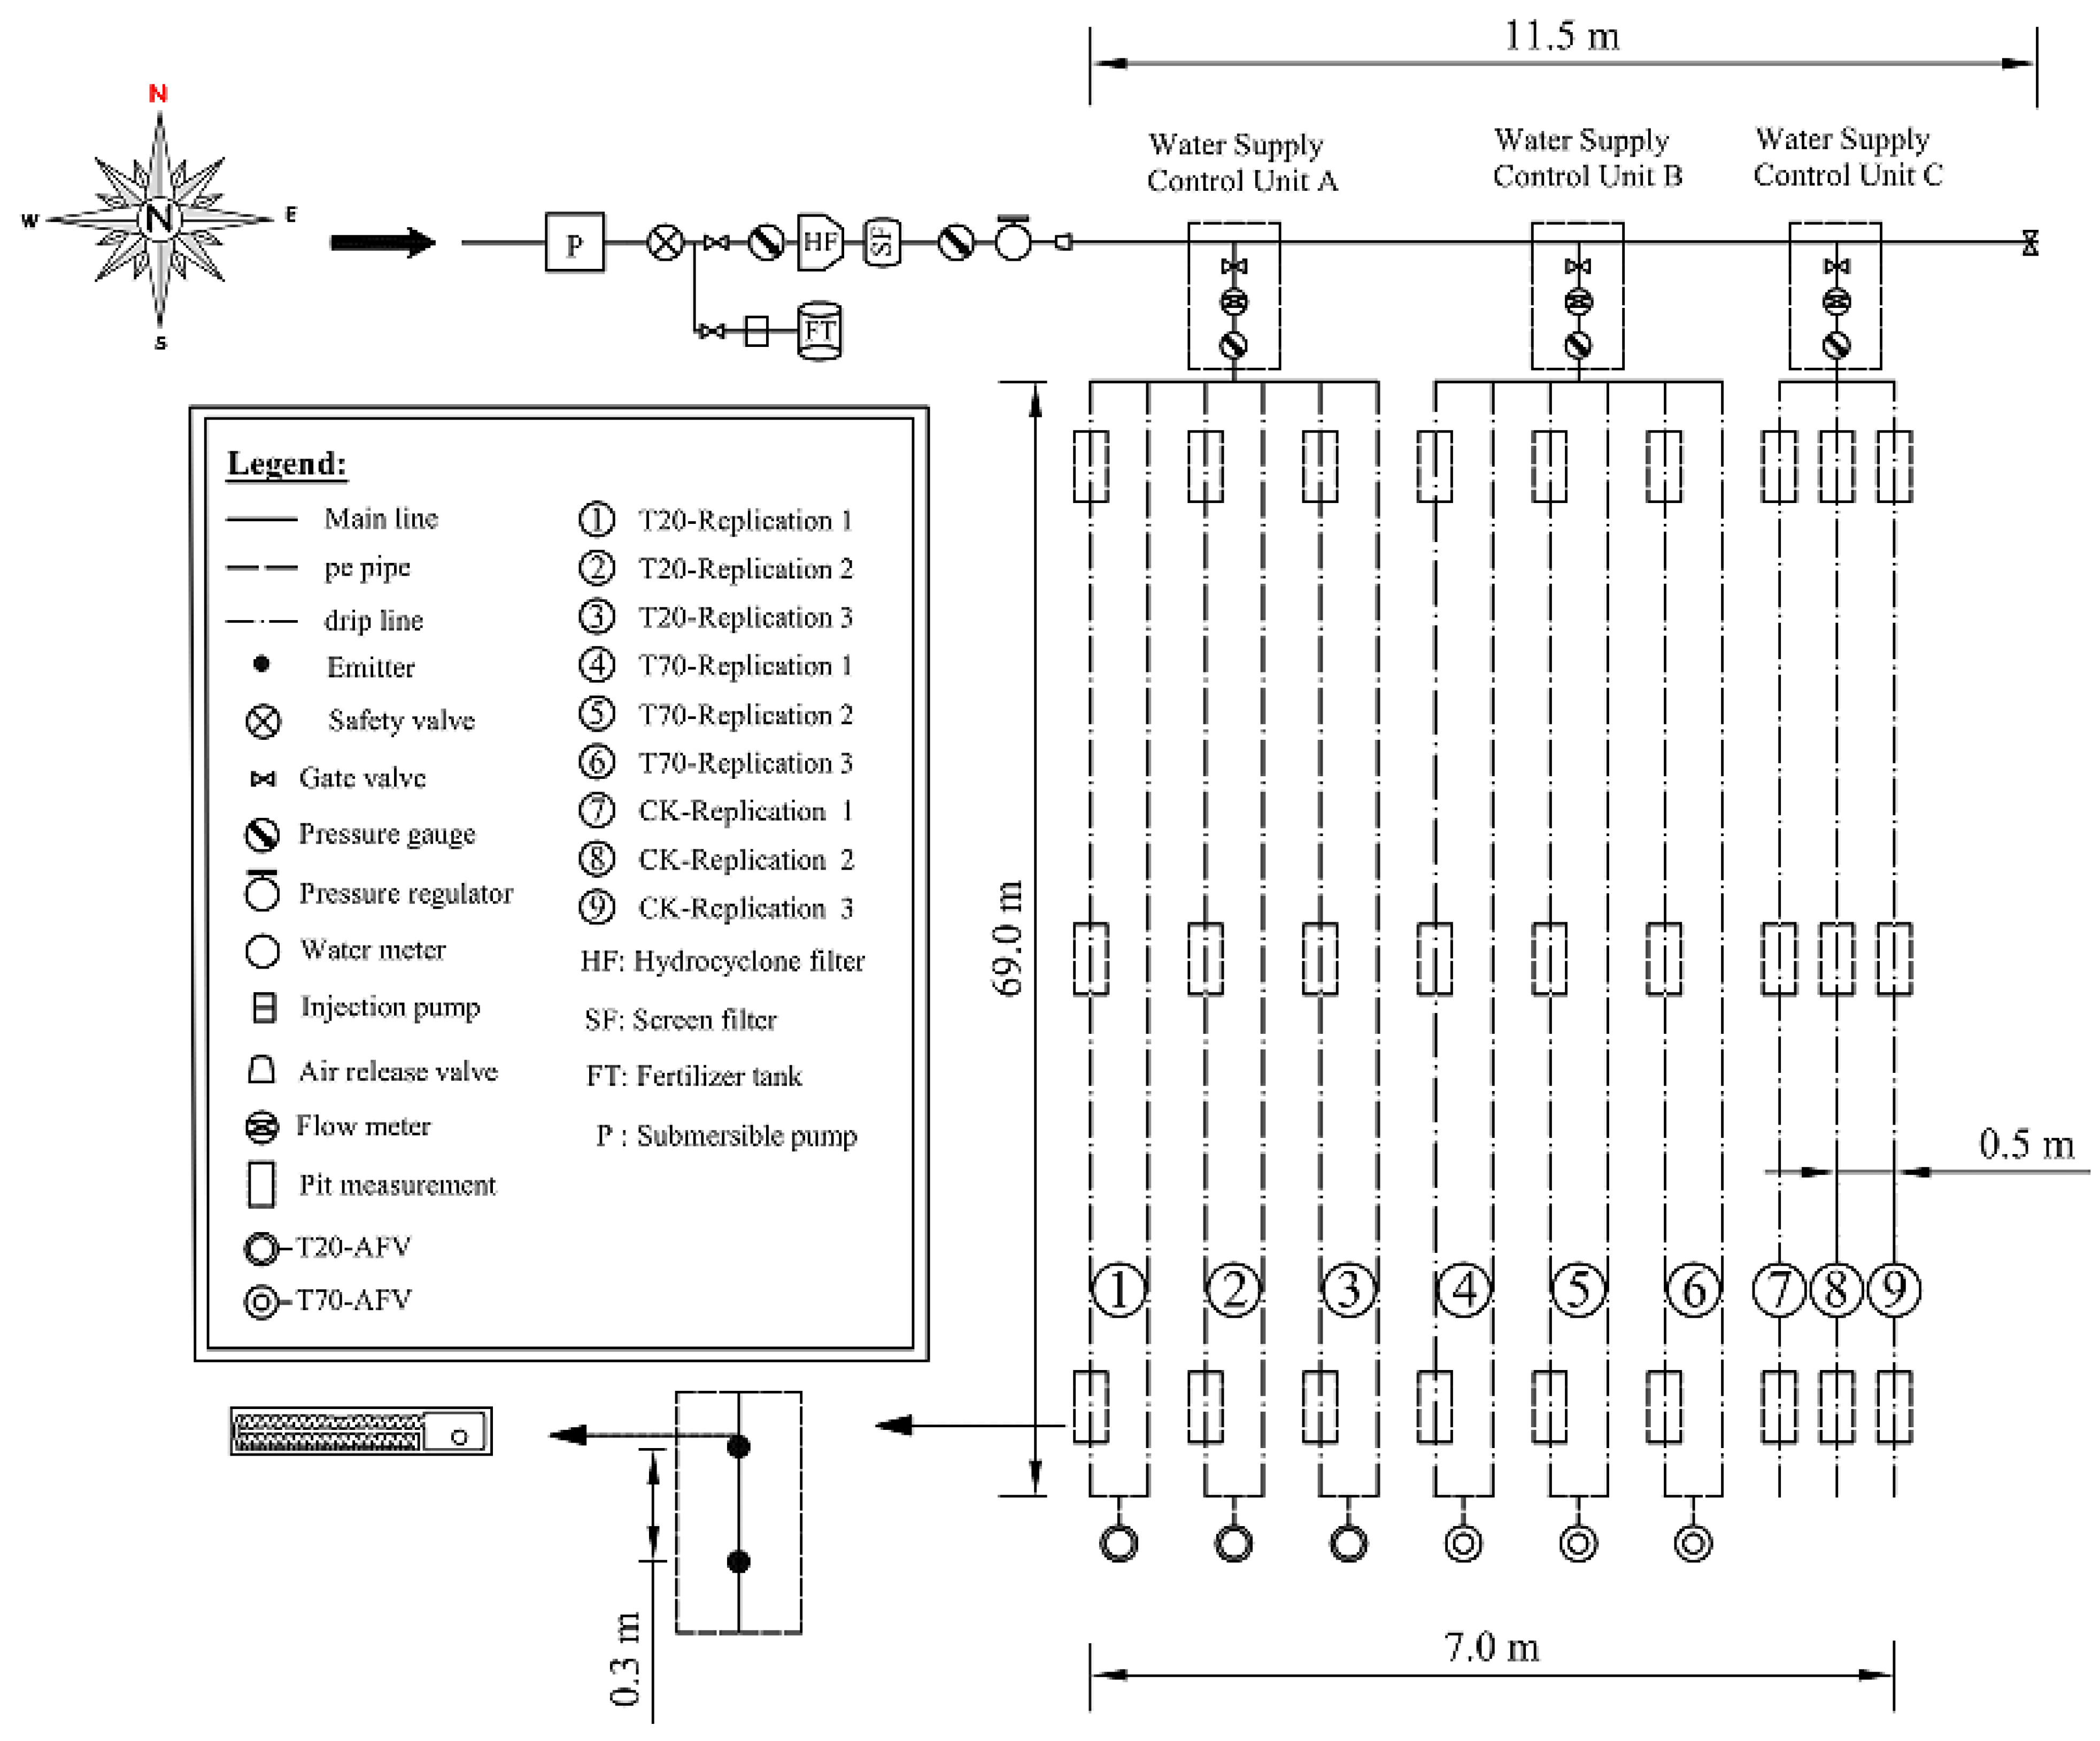
2.1. Overview of the Experimental Area

The experiment was conducted from June 2023 to September 2024 at the National Modern Agricultural Science and Technology Park in Baotou, Inner Mongolia, China (116°15′ E, 39°39′ N, altitude 1000 m). The region has a continental semiarid monsoon climate, with an average annual precipitation of 350 mm. The water source for the experiment was groundwater, from a depth of 101 m. The water quality parameters of the groundwater are shown in Table 1. The soil texture of the experimental plot is uniform, mainly sandy soil, with a soil bulk density of 1.49 g/cm3 and a field water holding capacity of 24.3%.

2.2. Experimental Design and Field Management

The AFV was installed at the end of the dripline. It operates without external power and starts flushing the network every time the drip irrigation system is activated. Water flows through the annular labyrinth flow channel into the upper chamber of the AFV, and the elastic diaphragm gradually moves downward under the water pressure from the upper chamber and the outlet. When the FD reaches the designed value, the elastic diaphragm seals the outlet, and the AFV automatically closes, completing the flushing operation. The system resumes normal operation, and drip irrigation begins [21]. The specific structure and operation principle of the AFV are shown in Figure 1.
Considering the time for clogging substances to travel from the inlet to the outlet of the dripline during single flushing, this experiment consisted of three treatments: SDI with T20 and T70 AFVs (self-developed by the China Institute of Water Resources and Hydropower Research) and SDI without an AFV as the control (CK). The Zb values for T20 and T70 were 9.0 mm and 10.5 mm, respectively, and the elastic diaphragm hardness (E) values were 60 and 40 HA, respectively. When the AFV inlet pressure (H0) is 0.12 MPa, the designed FD for T20 and T70 were 20 s and 70 s, and the designed flushing volumes (FQ) were 13.5 L and 3.6 L, respectively.
The SDI system in the experimental area was established in May 2023. The dripline used was the Aries TWD series from Netafim (Tel Aviv HaShalom, Tel Aviv, Israel), with an internal diameter of 15.2 mm, wall thickness of 0.38 mm, and emitter spacing of 30 cm. At a pressure of 0.1 MPa, the flow rate per emitter (q0) was 1.35 L/h. The dripline was installed at a depth of 25 cm (taking into account both alfalfa emergence and the depth of pre-sowing soil preparation), with a spacing of 50 cm and a length of 69 m. The experimental area covered 483 m2 and was divided into nine subplots. In subplots 1~3, two driplines were laid in each subplot, and the ends of these two driplines were connected by a 16 mm PE pipe, with a T20 AFV installed at the end. In subplots 4~6, two driplines were also laid in each subplot, and the ends of these two driplines were connected by a 16 mm PE pipe, with a T70 AFV installed at the end. In subplots 7~9, only one dripline was laid in each subplot, with no AFV installed, serving as the CK treatment (Figure 2).
Each of the T20, T70, and CK treatments was connected to a 32-mm PVC pipe at the beginning of the driplines, each monitored by one water supply control unit, labelled A, B, and C for each treatment, respectively. Each control unit consisted of a gate valve, an ultrasonic flow meter (measuring accuracy of 0.001 m3/h), and a pressure sensor (measuring accuracy of 0.1 kPa). The flow rate (Q) and inlet pressure (H) for each treatment were transmitted to the cloud platform, with measurements taken every 2 s. Each water supply control unit was connected to the groundwater source through a centrifugal filter, mesh filter, air release valve, and fertigation pump, with the pressure of the pump controlled by a frequency converter. Within 20 m of the experimental site, a weather station (TH-QC8, Ambient temperature: −40 to 60 °C, ±0.3 °C; Rainfall: ≤4 mm/min, ±0.2 mm; China) monitored meteorological data, including rainfall and daily average temperature, throughout the experiment period.
The alfalfa planted in the experiment is the locally recommended variety “Zhongmu No. 3”, which was sown on 24 June 2023. Irrigation was applied when the soil volumetric water content in the alfalfa root zone reached 70–75% of the field capacity, and irrigation continued until the field capacity was reached. Soil moisture was monitored by means of a TRIME-PICO-IPH-2TDR profile soil moisture meter (TRIME-PICO-IPH-2TDR, ±3%, Germany). The total irrigation amounts for 2023 and 2024 were 512.5 mm (233 mm in 2023 and 279.3 mm in 2024), with applications of 200 kg/ha of nitrogen, 300 kg/ha of available phosphorus (P2O5), and 200 kg/ha of available potassium (K2O) (Table 2).

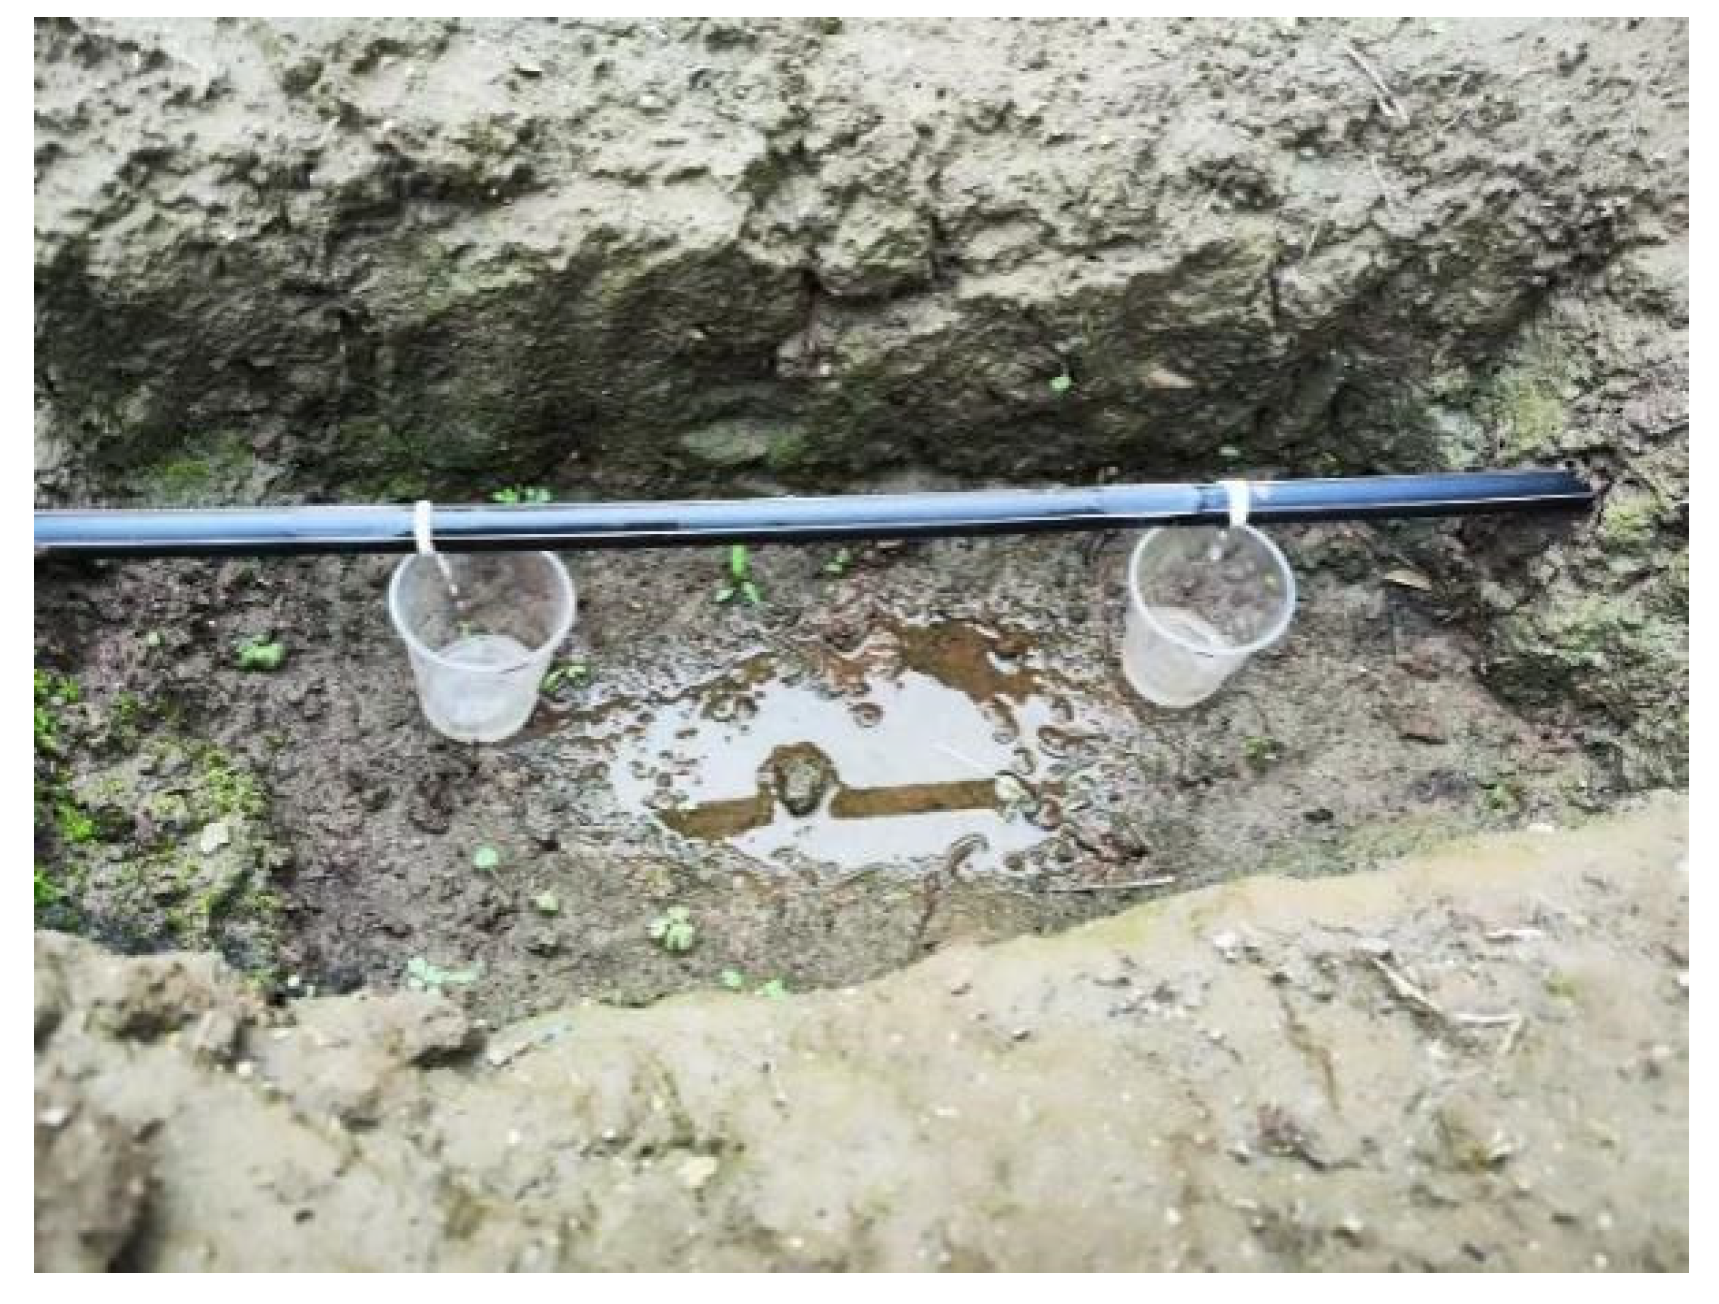
2.3. Testing Methods and Procedures

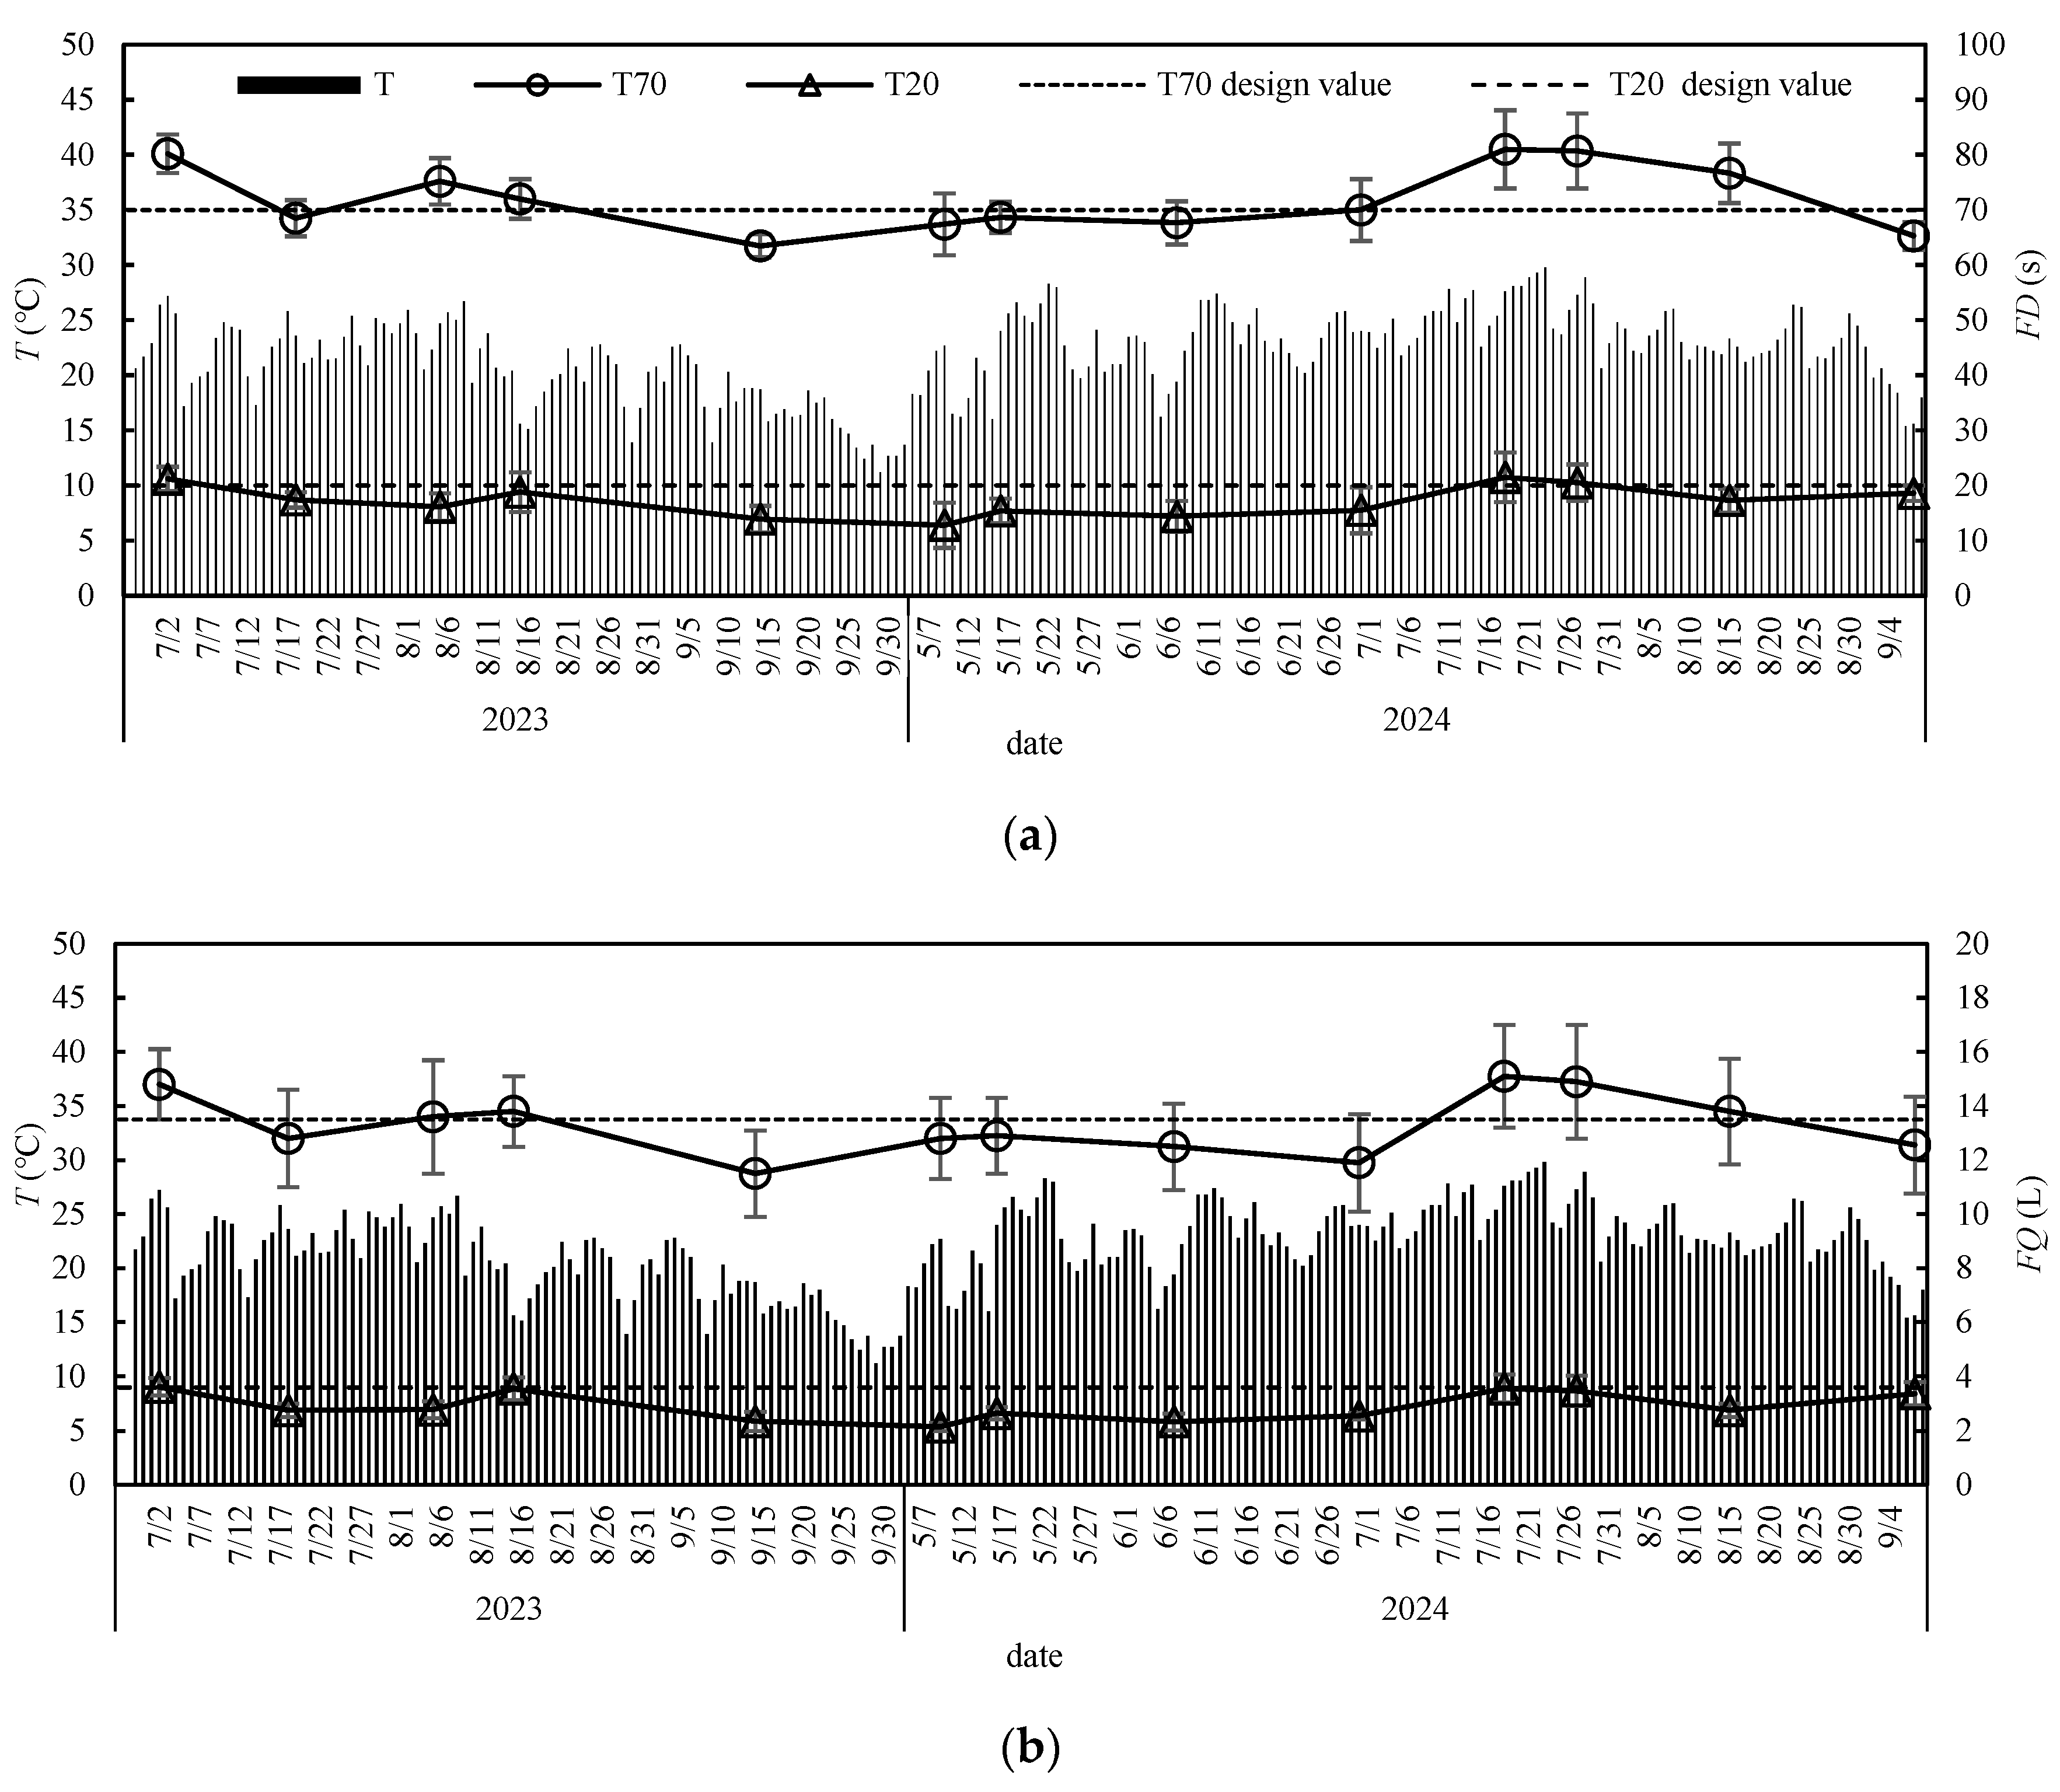
2.3.1. Hydraulic Performance of the Automatic Flushing Valve (AFV)

To meet the required H0 for the AFV, the water pump supply pressure was adjusted through frequency modulation during each irrigation flushing operation, ensuring that the H of the water supply control unit was 0.125 MPa. When the AFV began discharging water (Figure 3), a stopwatch (0.1 s) was used to start timing. The timing was stopped when no water flowed out of the AFV. This period was considered the FD (in s), and the water volume discharged by the AFV during the FD was the FQ (in L). The flushing velocity (FV, in m/s) was calculated via Equation (1). The hydraulic performance of the AFV was measured during the irrigation process on 2 July 2023; 18 July 2023; 5 August 2023; 15 August 2023; and 14 September 2023.
F Q F D × S
In the equation, FQ represents the flushing water quantity, FD represents the flushing duration, and S represents the cross-sectional area of the PE pipe with a diameter of De16 mm, which is 201 mm2.
The variation in FD and FQ over the two-year test period was characterized by the coefficient of variation (CV), which was calculated via Equations (2) to (4). A smaller CV indicates greater stability in the AFV’s performance.
C V = σ x μ x × 100
In this equation, σx and μx represent the standard deviation and mean of FD and FQ during the experimental process, respectively.
σ x = i = 1 n ( x i μ x ) 2 n
μ x = i = 1 n x i n
In these equations, xi represents the test result of the i-th FD and FQ, and μx is the average value of n tests; n = 13.

2.3.2. Emitter Hydraulic Performance

One dripline controlled by each AFV in subplots 1–6 was selected, and three driplines in subplots 7–9 were selected. Measurement pits (40 × 15 × 30 cm) were dug at the front, middle, and rear of the driplines at distances of 5, 35, and 65 m from the inlet. Each pit contained two emitters, for a total of 27 measurement pits and 54 emitters. After flushing, the water supply pressure was adjusted to 0.1 MPa and stabilized for 5 min before a water collection container was placed directly below the emitter in the pit (Figure 4). After 3 min, the water volume was measured using a graduated cylinder (with an accuracy of 1.0 mL), and the emitter flow rate (qi) was calculated. The Dra and Cu for the emitters in each subplot were calculated via Equations (5) and (6).
D r a = i = 1 n q i n q 0 × 100
In the equation, qi represents the flow rate of the i-th emitter at H = 0.1 MPa (L/h); q0 = 1.35 L/h; and n represents the number of emitters tested in each subplot, n = 18. When Dra > 95%, the emitter is considered normal; 80~95% indicates slight clogging; 50~80% indicates moderate clogging; 20~50% indicates severe clogging; and <20% indicates complete clogging.
C u = ( 1 i = 1 n q i q ¯ x i i = 1 n q i ) × 100
where q ¯ represents the average flow rate (L/h) of the emitters in each treatment at H = 0.1 MPa. When the Cu is lower than 80%, the requirement for irrigation uniformity is no longer met.

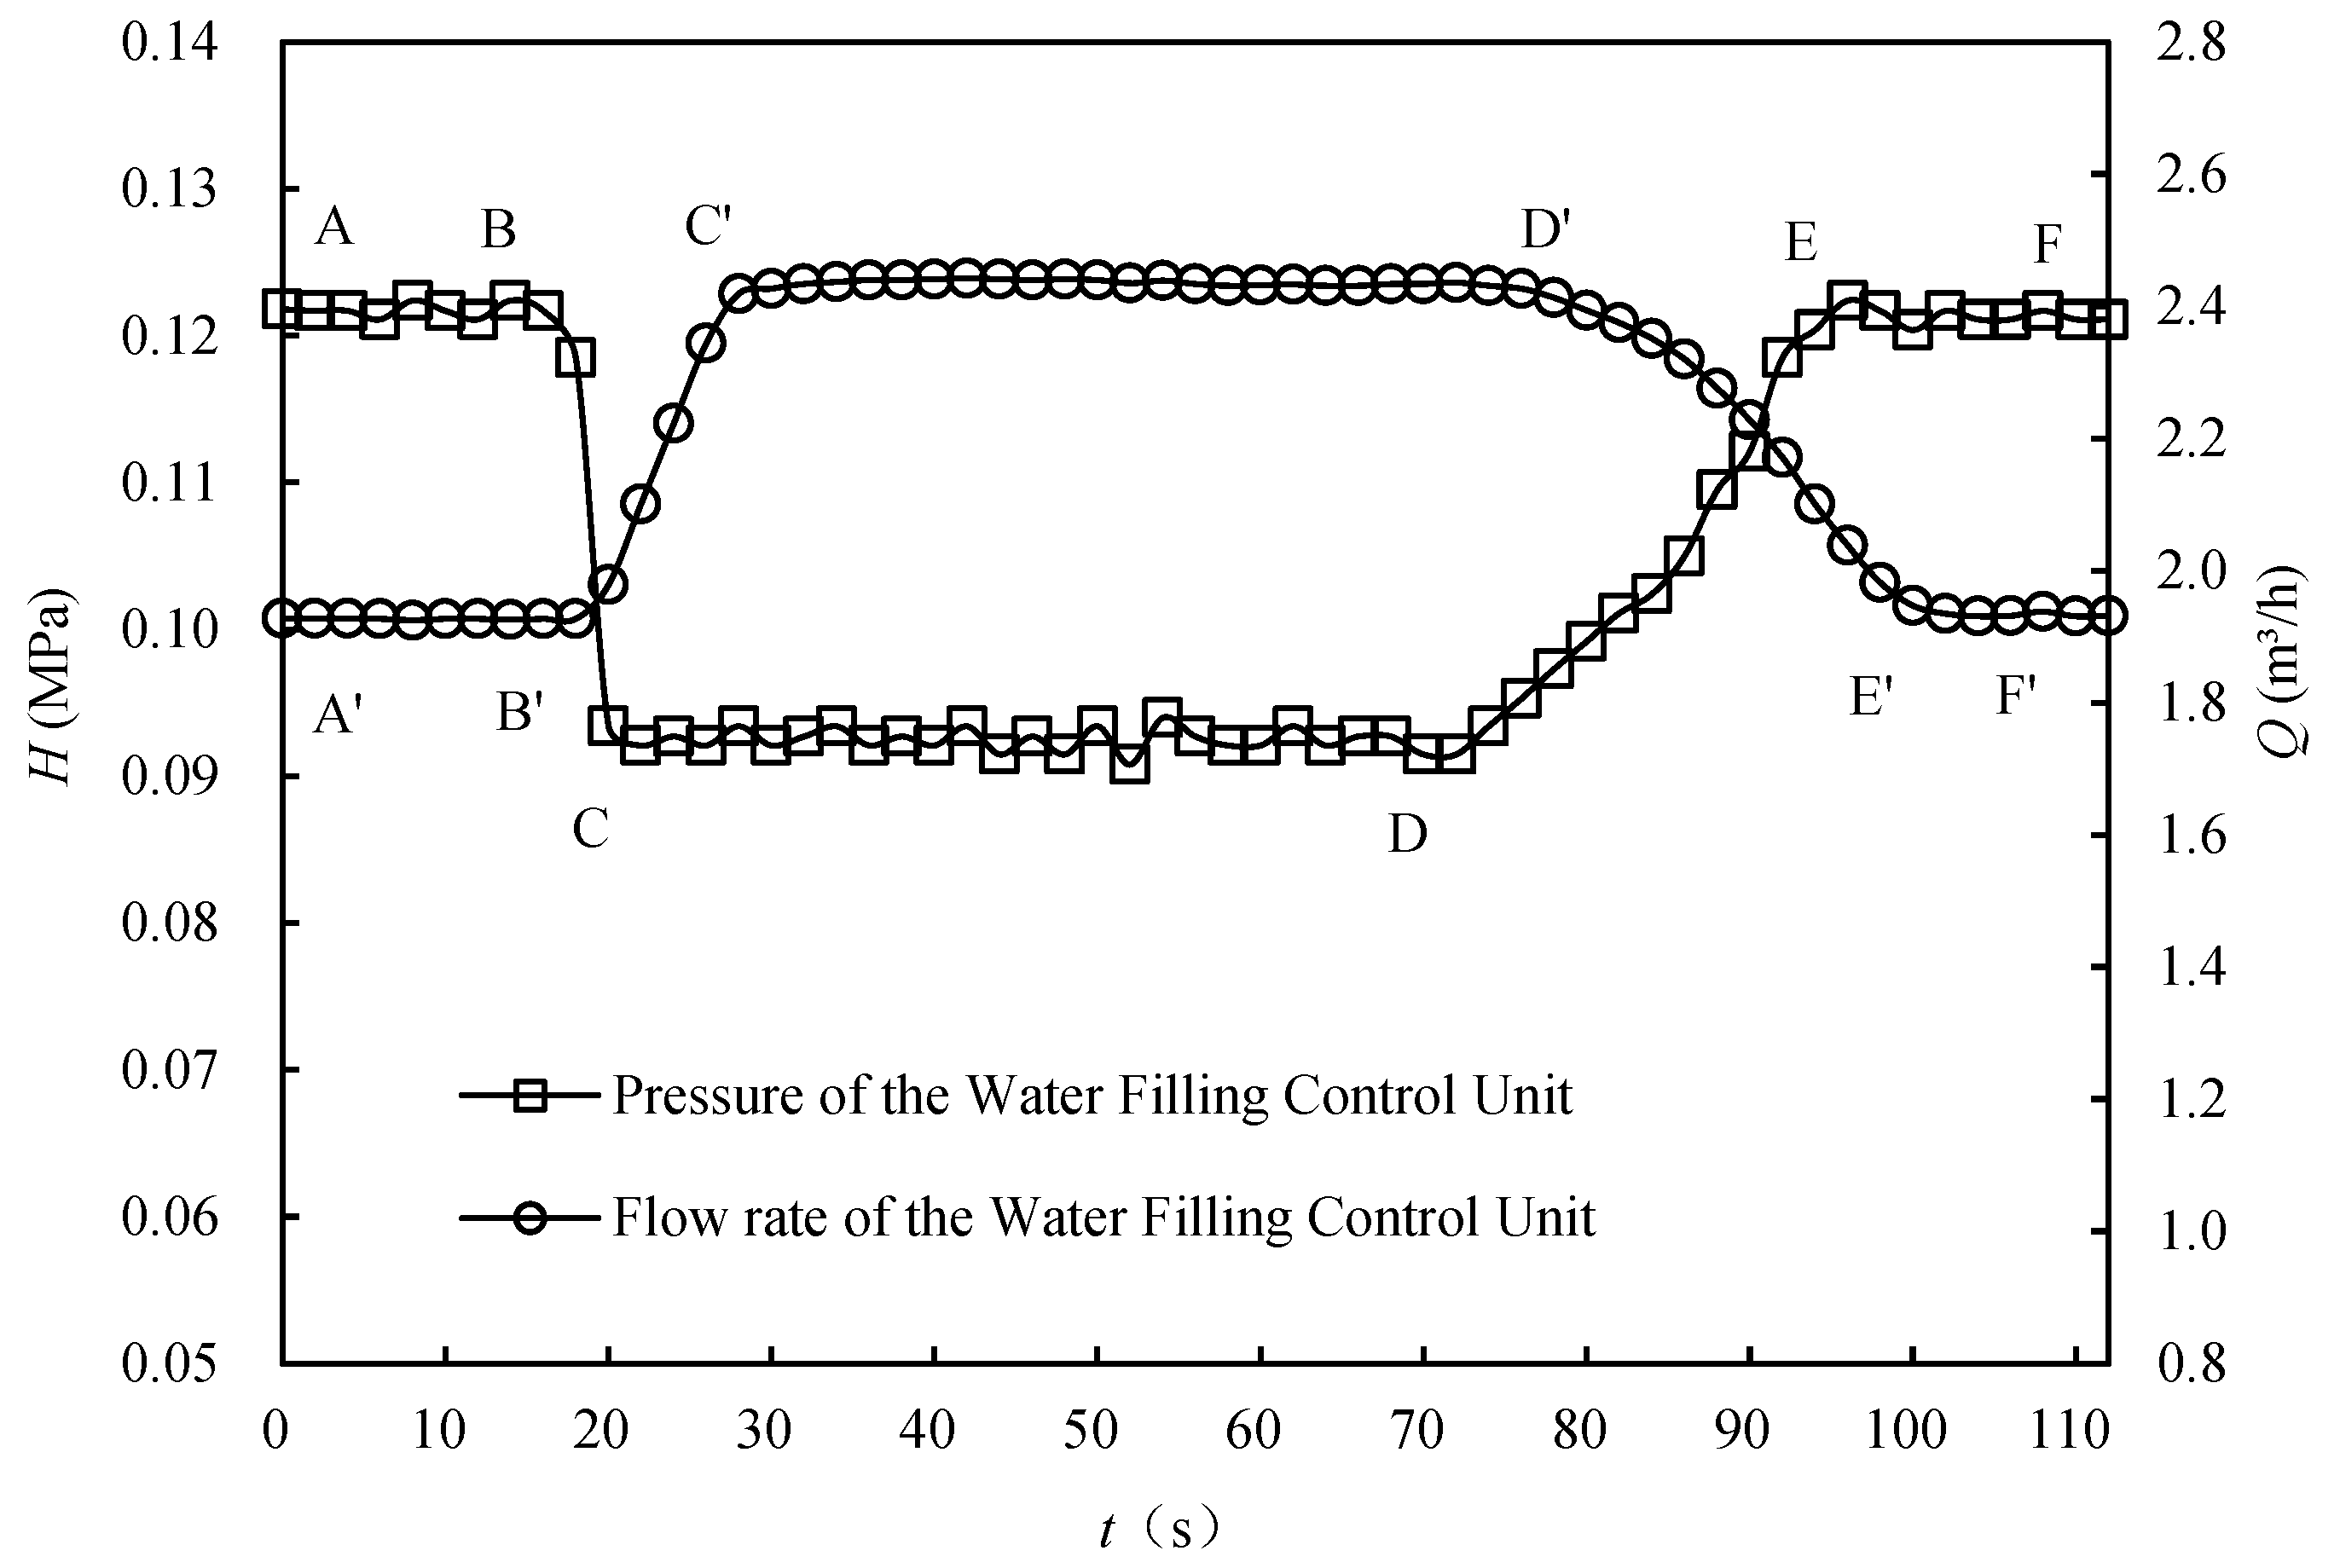
2.3.3. Hydraulic Performance of the Water Supply Control Unit

The H and flow rate (Q) versus time (t) curves recorded by irrigation control unit B (shown in Figure 2) on 18 July 2023 are presented in Figure 5. The time points at which changes in H and Q occur are nearly synchronized. When the AFV begins flushing, H decreases (segment BC), whereas Q increases (segment B′C′). During the stable flushing phase, the variations in H and Q are minimal (segments CD and C′D′). As the FD reaches the design value, the AFV gradually closes, with H increasing (segment DE) and Q decreasing (segment D′E′). Once the AFV is fully closed, both H and Q return to their preflushing levels. On the basis of the H~t and Q~t curves, the calculated values of the AFV FD′, FQ′, and flushing flow rate (FV′) can be derived (Equations (7)–(9)). By fitting these calculated values to the measured hydraulic performance values of the AFV and ensuring satisfactory fitting accuracy, the actual hydraulic performance of the AFV during each flushing operation can be obtained automatically through sensor-monitored data.
F D = 0.5   ( t E t B + t E t B )
F Q = 0.125 [ ( t D t C + t E t B ) ( Q B Q C + Q E Q D ) + ( t D t C + t E t B ) ( Q C Q B + Q D Q E ) ]
F V = F Q F D × 201
In the equation, tD′, tC′, tE′, tB′, tD, tC, tE, tB, and QD′, QC′, QE′, QB′, QD, QC, QE, and QB correspond to the time and flow values at points D′, C′, E′, B′, D, C, E, and B in Figure 5, respectively.

2.4. Data Analysis

One-way analysis of variance (ANOVA) was used to analyze the response of the AFV’s hydraulic performance (FV, FQ, FD) and emitter hydraulic performance (Dra, Cu) to the experimental treatments. The significance of differences between the average values of the measured parameters was determined using the minimum significant difference test, with p < 0.05. All the statistical analyses were conducted using the Statsmodels library in Python 3.8.

3. Results

3.1. Fitting of Measured and Calculated Hydraulic Performance of the AFV

The five measured hydraulic performance values of the AFV exhibited a significant linear relationship with the calculated values obtained from the H~t and Q~t curves. The linear regressions for FD~FD′ and FQ~FQ′ had R2 values of 0.994 and 0.977, respectively (p < 0.01) (Figure 6). The hydraulic performance of the AFV during the two-year experiment can be obtained from the ultrasonic flow meter and pressure sensor monitoring results for the water supply control unit.

3.2. Hydraulic Performance of the AFVs

During the two-year experiment, the hydraulic performance of T20 and T70 followed a decreasing–increasing–decreasing trend throughout each year, which closely matched the variation in the average daily temperature (T) over time (Figure 7). From early May to early July and in September, when T was lower, with an average of 20.1 °C, both FD and FQ were lower: FD and FQ for T20 ranged from 12.8 to 18.6 s and 2.2 to 3.4 L, respectively, whereas for T70, they ranged from 63.5 to 68.5 s and 11.9 to 12.8 L, respectively. In mid-July to early August, when T was high, averaging 25.7 °C, both AFVs had the highest FD and FQ: FD and FQ for T20 ranged from 18.8 to 21.5 s and 3.5 to 3.6 L, respectively, whereas for T70, they ranged from 75.2 to 82.1 s and 13.6 to 15.1 L, respectively.
Over the two-year test period, the average FD, FQ, and FV for T20 were 17.1 s, 2.8 L, and 0.82 m/s, with CVs for FD and FQ of 15.31% and 20.34%, respectively. For T70, the average FD, FQ, and FV were 72.6 s, 13.4 L, and 0.92 m/s, with CVs for FD and FQ of 8.11% and 8.87%, respectively. The hydraulic performance of T20 fluctuated more than that of T70. Compared with the design values, the hydraulic performance of T20 and T70 decreased by an average of 4.6% and 4.2%, respectively, after two years of operation. Additionally, the drainage volumes of T20 and T70 accounted for 0.5% and 1.4%, respectively, of the total water usage in their respective controlled SDI systems.
To further analyze the relationship between the AFV’s hydraulic performance and T, 13 flushing operations performed with T20 and T70 over the two-year test period were analyzed. FD and FQ both followed a quadratic relationship with T, with R2 values between 0.752 and 0.905 (p < 0.01). For T20, when T was at its lowest (15.6 °C), the average values of FD and FQ were 18.8 s and 3.5 L, respectively. When T ranged from 20.9 °C to 21.3 °C, FD and FQ reached their minimum values of 15.2 s and 2.3 L, respectively. When T increased to 27.6 °C, FD and FQ reached their maximum values of 21.5 s and 3.6 L, respectively. For T70, when T was 15.6 °C, the average values of FD and FQ were 68.7 s and 13.2 L, respectively. When T ranged from 19.3 °C to 19.6 °C, FD and FQ reached their minimum values of 66.3 s and 11.1 L, respectively. When T increased to 27.6 °C, the AFV FD and FQ reached their maximum values of 81.0 s and 15.6 L, respectively.
As T increased from 15.6 °C to the minimum T corresponding to FD or FQ, for each 1.0 °C increase in T, the average FD and FQ of both AFVs decreased by 0.89 s and 0.19 L, respectively. When T continued to increase to 27.6 °C, each 1.0 °C increase in T caused the average FD and FQ of both AFVs to increase by 1.42 s and 0.31 L, respectively (Figure 8).

3.3. Hydraulic Performance of the Subsurface Drip Irrigation System

Over the two years of operation, the Dra of the emitters in the different treatments tended to decrease, with the degree of clogging being highest in the CK treatment, followed by those in the T20 and T70 treatments. For both the T20 and CK treatments, the degree of clogging at different positions in the dripline was greatest at the rear, followed by the middle and front, whereas for T70, the degree of clogging was greatest in the middle, followed by the front and rear (Figure 9).
At the front of the dripline, the Dra for all three treatments was above or close to 95%. Compared with T20 and CK, T70 presented average increases of 5.1% and 1.1%, respectively (Figure 9a). In the middle and rear sections of the dripline, the Dra of T70 was always above 95%, whereas T20 and CK had Dra values above 95% in 2023 but below 95% in 2024. Compared with T20 and CK, T70 presented average increases of 4.3% and 11.3%, respectively. Compared with the CK treatment, the T20 treatment resulted in an average increase of 6.7% (Figure 9b,c).
For the entire dripline, the Dra for T70 remained above 95%, whereas for T20 and CK, the Dra in 2024 was less than 95% (Figure 9d).
After two years of operation, the overall Cu of the alfalfa SDI system was 96.8%, with a Dra of 93.7%, indicating good irrigation uniformity. The Cu for all the treatments was greater than 95%, with T70 having the highest Cu at 98.1%, significantly increasing by 2.3% and 2.9% compared with those of T20 and CK, respectively (p < 0.05). All the treatments had Dra values above 85%, with T70 resulting in the highest Dra at 98.1% and CK resulting in the lowest Dra at 89.8%. The Dra for CK was significantly lower than that for T70 and T20, by 8.5% and 2.6%, respectively. The differences in the flushing duration between treatments significantly affected the Cu and Dra (p < 0.05) (Table 3).
The Dra of the emitters across the entire dripline showed a good negative correlation with the number of irrigation events (N) (R2 = 0.736~0.937) (Figure 10). Under the water source conditions described in this study, and assuming eight irrigation events per year, for the CK treatment, the Dra reaches the light clogging stage (80% ≤ Dra < 95%) after 9 to 28 irrigation events (1 to 3 years), it reaches the moderate clogging stage (50% ≤ Dra < 80%) after 28 to 66 irrigation events (3 to 7 years), and reaches the severe clogging stage (20% ≤ Dra < 50%) after 66 to 104 irrigation events (7 to 12 years). After installing T20, the moderate clogging period for the SDI system was extended to 4 to 9 years, increasing the operational time by 33%. After T70 was installed, the general clogging period was extended to 8 to 20 years, increasing the operation time by 180% (Table 4).

4. Discussion

4.1. Variation in the AFV’s Hydraulic Performance

Under laboratory conditions, when the water temperature was 23 ± 2 °C [31,32], the hydraulic performance of the AFV was related to the structural dimensions of the annular labyrinth flow channel, water column, drainage holes, upper chamber and storage chamber volumes, and elasticity of the diaphragm (E) [21,25,26]. Under practical engineering conditions, the hydraulic performance of the AFV fluctuated over time but showed a relatively small variation compared with the average, with a mean CV of 13.2%. Both AFV types have good stability and reliability in practical applications. The E of the elastic diaphragm in T20 was 50% greater than that in T70, making T20 more unstable during deformation, which resulted in 66.4% greater fluctuations in hydraulic performance than did T70.
Previous studies have shown that the E of rubber materials is negatively correlated with temperature [33]. In this study, as the average daily temperature increased from July to August, the E of the elastic diaphragm made of rubber in the AFV decreased. Under the same inlet pressure, the deformation of the diaphragm increased as E decreased, resulting in better fitting between the diaphragm and the lower boundary of the AFV storage chamber. As the flow through the annular labyrinth channel into the storage chamber remained constant, the time required for the diaphragm to move downward and seal the outlet increased as the Cb value increased. Therefore, when T increased from 20.9 °C to 27.6 °C, the FD and FQ of the two AFVs increased by an average of 31.8% and 48.5%, respectively.

4.2. Variations in the Hydraulic Performance of the Subsurface Drip Irrigation System

Through a comprehensive analysis of system investment, operational years, and crop yield, Lamm et al. [34] suggested that SDI systems need to operate for more than 15 years to be economically competitive with large-scale sprinkler systems. Regular acid/chlorine treatments and pipe network flushing are essential maintenance measures to extend the operational lifespan of SDI systems [18]. When groundwater without acid treatment or capillary flushing was used, five SDI systems in Kansas, USA, presented Cu values below 80% after 6~20 years of operation [20]. For surface water, the Cu for sugarcane SDI in Guangxi, China, decreased to 75.6% after 5 years without maintenance [35]. In contrast, SDI systems at the Northwest Research and Extension Center in Kansas, USA, with 2~3 acid/chlorine treatments and dripline flushes per year, experienced minimal flow changes (±5%) after nearly 30 years of operation [36]. On the North China Plain, SDI systems for maize, with two capillary flushes annually, maintained Cu and Dra values of 91.2% and 88.3%, respectively, after 5 years of operation [37].
Owing to favorable water source conditions, the CK treatment, which had no flushing, and the T20 treatment, which had a shorter FD, maintained Cu and Dra values of 95.6% and 91.0%, respectively, after two years, which met the requirements for irrigation uniformity. However, when long-term operation was considered, the SDI systems with T70 AFVs after two years presented Cu and Dra values of 98.8% and 98.5%, respectively, which were significantly greater than those of the CK and T20 systems by 6.3% and 8.9%, with the time required for moderate clogging (Dra = 50~80%) ranging from 3~7 years to 8~20 years.

4.3. Temporal and Spatial Distributions of Emitter Clogging in Subsurface Drip Irrigation Systems

Under conditions of sandy water, slightly saline water, or reclaimed water, when no flushing is performed, the degree of physical, chemical, or biological clogging at the emitter increases closer to the end of the dripline [22,38,39]. Similarly, for the CK and T20 treatments, the degree of clogging was greatest at the rear of the dripline, followed by the middle and front sections. For T70, clogging was greatest in the middle section, followed by the front and rear sections. The reason for this is that the flow velocity and turbulence decrease along the dripline, and the water flow becomes laminar closer to the end of the dripline, causing suspended particles in the irrigation water to accumulate around the emitter inlet and increasing the risk of clogging [11,40].
For the T20 treatment, although flushing was performed, the average flushing velocity was 0.85 m/s. However, owing to the short FD (averaging 17.2 s), the distance of clogging material movement during a single flush was 14.6 m (assuming that the movement speed of the clogging material was the same as that of the FV), which was 21.2% of the dripline length. This resulted in a cycle of “short-distance suspended material movement (flushing process)—deposition and slow material movement (dripping process).” Compared with the CK treatment, the clogging material entering the T20 dripline could be flushed out through the AFV after five flushing operations. Thus, the decrease in Dra in the middle and rear sections of the T20 dripline was, on average, 40.6% lower than that in the CK. However, the spatial distribution of emitter blockages was consistent with that of the CK.
For the T70 treatment, the average FD over two years was 72.1 s, and the movement distance of the clogging material during a single flushing operation was 66.3 m, which accounted for 99.1% of the dripline length. Therefore, the risk of the clogging material entering the emitter was much lower than that in the CK and T20 treatments. After two years of operation, both Cu and Dra were greater than 98%. Because the concentration of clogging material at the end of the dripline was minimal, the degree of clogging sequence for T70 was middle > front > rear, with the middle and front sections showing the same degree of clogging as that in the CK, which was caused primarily by the distribution characteristics of the clogging material during the drip process.

4.4. Engineering Significance

As a perennial crop, alfalfa requires a large amount of water and is highly sensitive to water and fertilizer application [14,41]. A reduction in irrigation and fertilization by 18.8% and 21.1%, respectively, can significantly reduce yields by 17.0% to 19.6% [42]. Therefore, the decrease in Dra caused by emitter clogging and the resulting insufficient or uneven water and fertilizer application severely affects the yield and quality of alfalfa. The number of years required for moderate clogging to occur is a crucial factor in the promotion of SDI in alfalfa cultivation. Studies by Lamm and Rogers [36] and Li et al. [37] have shown that the uniformity of water and fertilizer application in SDI systems and their operational years are influenced by water quality, design, installation, and maintenance practices.
In this study, the irrigation water source was of high quality, with centrifugal and mesh filters installed at the pump outlet to reduce the risk of impurities entering the SDI system. An air release valve at the start of the SDI system helped mitigate the negative pressure suction of mud during pump shutdowns. The dripline was buried 25 cm deep, effectively bypassing the alfalfa root zone enrichment area (0~20 cm) [43], thereby reducing the potential for root intrusion. Extensive studies have shown that maintaining high soil moisture levels in the root zone can help reduce the risk of root intrusion into emitters [37,44]. The irrigation lower and upper limits applied in this study were 70~75% and 100% of field capacity, respectively. Throughout the two-year experiment, the volumetric soil moisture content in the alfalfa root zone remained consistently above 85%, which effectively minimized root intrusion. Based on the temporal trend of Dra under the T70 treatment, it is inferred that the SDI system will experience moderate clogging after 20 years of operation. Of the two AFVs, T70 demonstrates greater stability, with a single flushing operation effectively transporting clogging materials from the inlet to the end of the dripline. Over the two-year period, the total drainage volume from flushing accounted for a small proportion of the total water used in its controlled SDI system, benefiting alfalfa without wasting water resources. Therefore, T70 is more suitable for installation in the alfalfa SDI system of this study. Assuming an FV of 0.85 m/s, AFV models should be selected with the FD approximately 1.18 times the length of the dripline for SDI systems of different scales. In terms of layout, better performance is achieved when a single AFV controls two driplines.

5. Conclusions

Under field conditions, this study measured the hydraulic performance of two types of AFVs and the flow rates of 54 buried emitters over two years to explore the mechanisms by which AFVs affect the Cu of alfalfa SDI and the temporal and spatial distribution characteristics of emitter clogging. The main conclusions are as follows:
The hydraulic performance of T20 and T70 AFVs fluctuated over two years of outdoor operation, with an average CV of 13.2%. The FD and FQ of both AFV types showed a quadratic relationship with the daily average temperature (R2 = 0.752~0.905). As the temperature increased from 20.1 °C to 25.7 °C, both FD and FQ increased by an average of 22.7%. After two years of operation, the Dra and Cu of the alfalfa SDI system reached 93.7% and 96.8%, respectively, indicating high irrigation uniformity. Compared to the CK and T20 treatments, the T70 treatment significantly improved Dra and Cu by 6.3% and 4.6%, respectively. FD had a statistically significant effect on both Dra and Cu (p < 0.05). Regarding the degree of emitter clogging at different positions along the dripline, the order was rear > middle > front for CK and T20, whereas for T70, it was middle > front > rear. With the installation of the T70 AFV, the time required for the SDI to reach moderate clogging was extended from 3~7 years to 8~20 years, resulting in a 180% increase in operational lifespan. In the design of SDI systems, it is advisable to select AFV models with an FD that is 1.18 times the length of the dripline, and better performance is achieved when a single AFV controls two driplines.
In future investigations, the performance and applicability of AFVs will be evaluated using unconventional water sources, including sediment-laden water, reclaimed water, and mildly saline water.

Author Contributions

Conceptualization, Y.M. and Z.L.; methodology, Z.L. and Y.M.; software, Z.L.; validation, Y.M., F.W. and Z.L.; formal analysis, Z.L., F.W., Y.M., H.G. and J.W.; investigation, Z.L.; resources, F.W.; data curation, Z.L.; writing—original draft preparation, Z.L.; writing—review and editing, Y.M. and F.W.; visualization, Z.L. and H.G.; supervision, F.W. and Y.M.; project administration, Y.M. and R.W.; funding acquisition, Y.M. and F.W. All authors have read and agreed to the published version of the manuscript.

Funding

We are grateful to the research grants from the National Key Research and Development Program of China (2022YFD1900402), the Research and Development Support Program of China Institute of Water Resources and Hydropower Research (ID0145B042021), and the Inner Mongolia Autonomous Region Key Research and Transformation of Achievements Program (2022YFHH0030).

Institutional Review Board Statement

Data Availability Statement

The data presented in this study are available upon request from the corresponding author.

Conflicts of Interest

The authors declare no conflicts of interest.

Abbreviations

The following abbreviations are used in this manuscript:
SDISubsurface drip irrigation
AFVAutomatic flushing valve
FDFlushing duration
FQFlushing water volume
FVFlushing velocity
CVCoefficient of variation
TThe daily average temperature
EElasticity
DraThe average relative flow rate
CuIrrigation uniformity
TNTotal nitrogen
TPTotal phosphorus
TSSTotal suspended solids
TDSTotal dissolved solids
THTotal concentration of calcium and magnesium ions

References

  1. Kou, D.; Su, D.; Wu, D.; Li, Y. Effects of regulated deficit irrigation on water consumption, hay yield and quality of alfalfa under subsurface drip irrigation. Trans. Chin. Soc. Agric. Eng. 2014, 30, 116–123. [Google Scholar] [CrossRef]
  2. Olszewska, M. Micronutrient Content of Aboveground Biomass as Influenced by Different Proportions of Medicago media Pers. in Two-Component Alfalfa–Grass Mixtures. Agriculture 2024, 14, 2205. [Google Scholar] [CrossRef]
  3. Nery, D.; Palottini, F.; Farina, W.M. The South American Black Bumblebee (Bombus pauloensis) as a Potential Pollinator of Alfalfa (Medicago sativa). Agriculture 2024, 14, 2192. [Google Scholar] [CrossRef]
  4. General Administration of Customs of China. China Customs Statistical Yearbook 2022; China Customs Press: Beijing, China, 2022.
  5. Lu, Q.; Qi, G.; Yin, M.; Kang, Y.; Ma, Y.; Jia, Q.; Wang, J.; Jiang, Y.; Wang, C.; Gao, Y.; et al. Alfalfa Cultivation Patterns in the Yellow River Irrigation Area on Soil Water and Nitrogen Use Efficiency. Agronomy 2024, 14, 874. [Google Scholar] [CrossRef]
  6. National Development and Reform Commission, Ministry of Agriculture and Rural Affairs, National Forestry and Grassland Administration. Opinions on Promoting the High-Quality Development of the Forage Industry. 2024. Available online: https://www.ndrc.gov.cn/xxgk/zcfb/tz/202411/t20241113_1394430.html (accessed on 20 January 2025).
  7. Zheng, H.; Wang, B.; Cao, X.; Wu, J.; Yan, H.; Tian, D. Optimization of Subsurface Drip Irrigation Schedule of Alfalfa in Northwest China. Water 2023, 15, 2242. [Google Scholar] [CrossRef]
  8. Mo, Y.; Li, G.; Wang, D.; Lamm, F.R.; Wang, J.; Zhang, Y.; Gong, S. Planting and preemergence irrigation procedures to enhance germination of subsurface drip irrigated corn. Agric. Water Manag. 2020, 242, 106412. [Google Scholar] [CrossRef]
  9. Gao, N.; Mo, Y.; Wang, J.; Yang, L.; Gong, S. Effects of Flow Path Geometrical Parameters on the Hydraulic Performance of Variable Flow Emitters at the Conventional Water Supply Stage. Agriculture 2022, 12, 1531. [Google Scholar] [CrossRef]
  10. Lamm, F.R. Advantages and Disadvantages of Subsurface Drip Irrigation. In Proceedings of the International Meeting on Advances in Drip/Micro Irrigation, Puerto de La Cruz, Spain, 2–5 December 2002; pp. 1–13. [Google Scholar]
  11. Tayel, M.Y.; Pibars, S.K.; Mansour, H.A.G. Effect of drip irrigation method, nitrogen source, and flushing schedule on emitter clogging. Agric. Sci. 2013, 4, 131–137. [Google Scholar] [CrossRef]
  12. Alam, M.; Trooien, T.P.; Rogers, D.H.; Dumler, T.J. An efficient irrigation technology for alfalfa growers. J. Ext. 2002, 40, 15. [Google Scholar]
  13. Hutmacher, R.B.; Phene, C.J.; Mead, R.M.; Shouse, P.; Clark, D.; Vail, S.S.; Fargerlund, J. Subsurface Drip and Furrow Irrigation Comparison with Alfalfa in the Imperial Valley. In Proceedings of the 2001 California Alfalfa & Forage Symposium, Modesto, CA, USA, 12–13 December 2001; pp. 11–13. [Google Scholar]
  14. Yang, K.; Zhao, J.; Wang, X.; Ma, C.; Zhang, Q. Effects of Different Irrigation Methods and Phosphorus Application on Alfalfa Yield, Quality and Water and Phosphorus Use Efficiency. Trans. Chin. Soc. Agric. Eng. 2023, 39, 130–138. [Google Scholar] [CrossRef]
  15. Guo, X.; Li, W. Effects of Different Irrigation Methods on Alfalfa Yield and Weed Occurrence. Xinjiang Agric. Sci. 2014, 51, 2079–2084. [Google Scholar]
  16. Nakayama, F.S.; Bucks, D.A. Water quality in drip/trickle irrigation: A review. Irrig. Sci. 1991, 12, 187–192. [Google Scholar] [CrossRef]
  17. Pei, Y.; Li, Y.; Liu, Y.; Zhou, B.; Shi, Z.; Jiang, Y. Eight emitters clogging characteristics and its suitability under on-site reclaimed water drip irrigation. Irrig. Sci. 2014, 32, 141–157. [Google Scholar] [CrossRef]
  18. Li, Y.; Zhou, B.; Yang, P. Research advances in drip irrigation emitter clogging mechanism and controlling methods. J. Hydraul. Eng. 2018, 49, 103–114. [Google Scholar] [CrossRef]
  19. Jia, J.; Zhang, S.; Zheng, H. Study on the Clogging Rate of Drip Irrigation under the Condition of Buried Drip Irrigation. China Rural. Water Hydropower 2019, 2, 98–101. [Google Scholar]
  20. Enciso-Medina, J.; Multer, W.L.; Lamm, F.R. Management, maintenance, and water quality effects on the long-term performance of subsurface drip irrigation systems. Appl. Eng. Agric. 2011, 27, 969–978. [Google Scholar] [CrossRef]
  21. Mo, Y.; Zhao, X.; Wang, J.; Zhang, Y.; Gong, S.; Xia, H.; Wang, Y. Design and Structural Optimization of the Automatic Flushing Valve with Exhaust Function. Trans. Chin. Soc. Agric. Eng. 2022, 38, 72–79. [Google Scholar] [CrossRef]
  22. Ma, C.; Jiang, C.; Li, Y.; Shi, N.; Liu, S.; Hu, X.; Liu, Z.; Sun, Z.; Muhammad, T. Effect of lateral flushing on emitter clogging in drip irrigation using high-sediment water. Agric. Water Manag. 2024, 293, 108702. [Google Scholar] [CrossRef]
  23. Song, P.; Li, Y.; Li, J.; Pei, Y. Chlorination with lateral flushing controlling drip irrigation emitter clogging using reclaimed water. Trans. Chin. Soc. Agric. Eng. 2017, 33, 80–86. [Google Scholar] [CrossRef]
  24. Wang, H.; Wang, C.; Wang, J.; Qiu, X.; Wang, S.; Li, G. Flushing control strategies to improve the stability of a biogas slurry drip irrigation system: Behavioral characteristics and mechanisms. J. Environ. Manag. 2023, 326, 116792. [Google Scholar] [CrossRef]
  25. Zhao, X.; Mo, Y.; Xia, H.; Gong, Y.; Wang, J.; Zhang, Y.; Gong, S.; Li, Q. Hydraulic performance of automatic flushing valve at the end of dripline. J. Irrig. Drain. 2021, 40, 105–112. [Google Scholar] [CrossRef]
  26. Gao, H.; Mo, Y.; Wu, F.; Wang, J.; Gong, S. Impact of Elastic Diaphragm Hardness and Structural Parameters on the Hydraulic Performance of Automatic Flushing Valve. Water 2023, 15, 287. [Google Scholar] [CrossRef]
  27. Li, W.; Mo, Y.; Wang, Z. Influence of Pipeline Layout Form on the Hydraulic Performance of the Automatic Flushing Valve at the End of the Capillary Tube. J. Irrig. Drain. 2022, 41, 110–117. [Google Scholar] [CrossRef]
  28. Gao, H.; Mo, Y.; Wang, J.; Wu, F.; Gao, N.; Gong, S. Model for predicting the hydraulic elements of drip irrigation system with automatic flushing valves under high sediment water. Biosyst. Eng. 2023, 228, 18–30. [Google Scholar] [CrossRef]
  29. Zhao, X. Research on Hydraulic Performance Test of Flushing Valve at End of Capillary and Its Application in Sandy Drip Irrigation System. Master’s Thesis, Hebei Agricultural University, Baoding, China, 2016. [Google Scholar]
  30. Li, W. Research on Hydrological Frequency of Rivers in Arid Areas Based on Normal Transformation. Master’s Thesis, Shihezi University, Shihezi, China, 2022. [Google Scholar]
  31. GB/T 50485-2020; Technical Code for Microirrigation Engineering. Standards Press of China: Beijing, China, 2020.
  32. GB/T 17187-2009; Agricultural Irrigation Equipment—Emitters and Emitting Pipe-Specification and Test Methods. Standards Press of China: Beijing, China, 2009.
  33. Mark, J.E.; Erman, B. Science and Technology of Rubber, 3rd ed.; Elsevier Academic Press: Amsterdam, The Netherlands, 2011. [Google Scholar]
  34. Lamm, F.R.; Trooien, T.P. Subsurface Drip Irrigation for Corn Production: A Review of 10 Years of Research in Kansas. Irrig. Sci. 2003, 22, 195–200. [Google Scholar] [CrossRef]
  35. Muhammad, T.; Zhou, B.; Puig-Bargu, J.; Ding, C.; Li, S.; Manan, I.; Li, Y. Assessment of emitter clogging with multiple fouling and root intrusion in sub-surface drip irrigation during 5-year sugarcane growth. Agric. Water Manag. 2022, 274, 107981. [Google Scholar] [CrossRef]
  36. Lamm, F.R.; Rogers, D.H. Longevity and performance of a subsurface drip irrigation system. Trans. ASABE 2017, 60, 931–939. [Google Scholar] [CrossRef]
  37. Li, Z.; Mo, Y.; Gao, H.; Gong, S.; Zhang, Y.; Li, G.; Wu, F. The hydraulic performance and clogging characteristics of a subsurface drip irrigation system operating for five years in the North China plain. Agric. Water Manag. 2025, 307, 109217. [Google Scholar] [CrossRef]
  38. Zhang, L.; Yang, P.; Ren, S.; Li, Y.; Liu, Y. Chemical clogging of emitters and evaluation of their suitability for saline water drip irrigation. Irrig. Drain. 2016, 65, 439–450. [Google Scholar] [CrossRef]
  39. Li, Y.; Song, P.; Pei, Y.; Feng, J. Effects of lateral flushing on emitter clogging and biofilm components in drip irrigation systems with reclaimed water. Irrig. Sci. 2015, 33, 235–245. [Google Scholar] [CrossRef]
  40. Jiang, S.; Fang, X.; Ye, C. Anti-clogging Performance of Drip Emitters under Silt Content Water Irrigation. J. Irrig. Drain. 2010, 29, 7–10. [Google Scholar] [CrossRef]
  41. Cao, X.; Feng, Y.; Li, H.; Zheng, H.; Wang, J.; Tong, C. Effects of subsurface drip irrigation on water consumption and yields of alfalfa under different water and fertilizer conditions. J. Sens. 2021, 1, 6617437. [Google Scholar] [CrossRef]
  42. Tong, B.; Zhang, N.; Bao, Z. Effects of Different Water and Fertilizer Treatments on Growth and Yield of Alfalfa under Subsurface Drip Irrigation. J. Irrig. Drain. 2018, 37, 35–40. [Google Scholar]
  43. Wang, Q.; Fan, W.; Tan, X. Root Distribution and Growing of Apricot-Alfalfa Sod-Culture Pattern. Sci. Silvae Sin. 2008, 44, 141–144. [Google Scholar]
  44. Suarez, R.E. Subsurface Drip Irrigation of Bermudagrass Turf in Arizona: Benefits and Limitations. Ph.D. Thesis, University of Arizona, Tucson, AZ, USA, 2002. [Google Scholar]
Figure 1. Schematic diagram of the structure and operation of an AFV: (a) Front sectional view of the automatic flush valve during flushing; (b) front sectional view of the automatic flush valve after it is closed; (c) top view of the valve body. 1—Valve body; 2—Elastic diaphragm; 3—Valve cover; 4—Inlet; 5—Outlet; 6—Upper chamber; 7—Storage chamber; 8—Annular labyrinth flow channel. Za—Height of the upper chamber; Zb—Height of the storage chamber; Ca—Volume of the upper chamber (yellow-filled area); Cb—Volume of the storage chamber (orange-filled area), i.e., the additional volume created by the deformation of the elastic diaphragm under the water pressure in the upper chamber; Red hollow arrow—Direction of water flow inside the valve body; Blue hollow dashed arrow—Direction of drainage water flow; Blue arrow—Direction of the elastic diaphragm’s response to the water pressure in the upper chamber; Red arrow—Direction of the elastic diaphragm’s response to the water pressure at the outlet.
Agriculture 15 01107 g001
Figure 2. Layout diagram of the pipe network of the subsurface drip irrigation system and the flow rate test points of the emitters.
Agriculture 15 01107 g002
Figure 3. Hydraulic performance testing of the automatic flushing valve.
Agriculture 15 01107 g003
Figure 4. Emitter flow rate testing for subsurface drip irrigation.
Agriculture 15 01107 g004
Figure 5. Curves of the pressure (H) and flow rate (Q) monitored by irrigation control unit B with time (t) on 18 July 2023.
Agriculture 15 01107 g005
Figure 6. Fitting of the relationships between the measured value (FD) and the calculated value (FD′) of the flushing duration of the automatic flush valve (a), as well as between the measured value (FQ) and calculated value (FQ′) of the flushing water volume (b).
Agriculture 15 01107 g006
Figure 7. Variation patterns of the flushing duration (FD) (a) and flushing water volume (FQ) (b) of the automatic flushing valve and the daily average temperature (T) at the test site over time.
Agriculture 15 01107 g007
Figure 8. Variation patterns of the flushing duration (FD) (a) and flushing water volume (FQ) (b) of the automatic flush valve with the daily average temperature (T) of the experimental site.
Agriculture 15 01107 g008
Figure 9. Variation patterns of the average relative flow rate (Dra) of the emitters at the front (a), middle (b), and tail (c) sections and of the whole drip irrigation tape (d).
Agriculture 15 01107 g009
Figure 10. Variation patterns of the average relative flow rate (Dra) of the measured emitters along the entire drip irrigation tape with the number of irrigation events (N).
Agriculture 15 01107 g010
Table 1. Water quality of the water source in the experimental area.
TN
(mg L−1)
TP
(mg L−1)
TSS
(mg L−1)
TDS
(mg L−1)
TH
(mg L−1)
CO32−
(mg L−1)
HCO3
(mg L−1)
Cl
(mg L−1)
SO42−
(mg L−1)
pH
1.05 ± 0.030.08 ± 0.0142.8 ± 2.6640 ± 31375 ± 1911.9 ± 0.5216.0 ± 14.017.2 ± 1.133.2 ± 2.17.5
Note: TN, total nitrogen; TP, total phosphorus; TSS, total suspended solids; TDS, total dissolved solids; TH, total concentration of calcium and magnesium ions. The water quality remained stable throughout the two-year experimental period.
Table 2. Irrigation and fertilization of alfalfa under subsurface drip irrigation in 2023 and 2024.
20232024
DateIrrigation Volume
(mm)
Fertilizer Amount
(kg/ha)
DateIrrigation Volume
(mm)
Fertilizer Amount
(kg/ha)
NP2O5KNP2O5K
6/2445.5 5/941.5
7/222.6 5/1620.5335033
7/1831.13350336/741.2
8/520.1 6/1821.4
8/1535.2 6/3021.6335033
8/2930.23350337/1830.6
9/1422.8 7/2720.1
9/2825.53350338/1540.1335033
9/742.3
total233.0100150100total279.3100150100
Table 3. Significance analysis of irrigation uniformity (Cu) and average relative flow rate (Dra) of the buried emitters after two years of operation.
TreatmentFD (s)Cu (%)Dra (%)
T202095.9 (0.6) b92.2 (1.7) b
T707098.5 (0.7) a98.1 (0.8) a
CK095.3 (1.5) b89.8 (2.4) c
the whole system96.893.7
F6.443.2
significance***
Note: The numbers in parentheses represent the standard error of each group of data. The absence of the same letter among the three experimental treatments in each column indicates a significant difference at the level of p < 0.05; * indicates significance at the level of p < 0.05; ** indicates significance at the level of p < 0.01.
Table 4. The number of irrigation events and operation years corresponding to the clogging grades of the emitters controlled by different flush valves.
Clogging LevelDra (%)CKT20T70
Irrigation EventsOperation YearsIrrigation EventsOperation YearsIrrigation EventsOperation
Years
slight clogging80~959~281~311~341~423~753~8
moderate clogging50~8028~663~734~794~975~1808~20
severe clogging20~5066~1047~1279~1259~14180~28420~32
Disclaimer/Publisher’s Note: The statements, opinions and data contained in all publications are solely those of the individual author(s) and contributor(s) and not of MDPI and/or the editor(s). MDPI and/or the editor(s) disclaim responsibility for any injury to people or property resulting from any ideas, methods, instructions or products referred to in the content.

