Article

The Implementation Path for a Policy Balancing Cultivated Land Occupation and Reclamation Based on Land-Type Classification—A Case Study in Heilongjiang Province

1
School of Business, Yangzhou University, Yangzhou 225125, China
2
College of Public Administration, Nanjing Agricultural University, Nanjing 210095, China
3
School of Land Science and Technology, China University of Geosciences (Beijing), Beijing 100083, China
4
Key Laboratory of Land Consolidation, Ministry of Natural Resources, Beijing 100035, China
5
Institute of Political Science and Law, Zhengzhou University of Light Industry, Zhengzhou 450001, China
6
School of Environment Science and Engineering, Tiangong University, Tianjing 300387, China
7
China State Farms Economic Development Center, Beijing 100122, China
*
Author to whom correspondence should be addressed.
Agriculture 2025, 15(10), 1105; https://doi.org/10.3390/agriculture15101105
Submission received: 6 April 2025 / Revised: 13 May 2025 / Accepted: 13 May 2025 / Published: 20 May 2025
(This article belongs to the Section Agricultural Economics, Policies and Rural Management)

Abstract

:
Food security is a fundamental issue that has long been of great concern, and cultivated land resources are the core elements of food security. In recent years, the problem of “non-agriculturalization” and “non-grain” conversion of cultivated land has become prominent. The need for further strict control of cultivated land use has gained significant attention from the government and academia. Recently, it has been proposed in China that all forms of cultivated land occupation should be integrated into the management policy for balancing cultivated land occupation and reclamation. In this study, the concept of provincial-level land-type classification, along with agricultural land potential productivity evaluation, is adopted to determine the optimal scheme for balancing cultivated land occupation and reclamation. Thus, an analysis of the optimization scheme for implementing the cultivated land occupation and reclamation balance policy in Heilongjiang, along with a macro-level layout of this balance scheme, is carried out at the provincial level. The results show that the land-type classification system constructed from five dimensions—climatic conditions, geomorphic conditions, geological conditions, edaphic conditions, and hydrologic conditions—as well as the agricultural land potential productivity evaluation system constructed based on land types, can effectively identify the potential cultivated land utilization space in Heilongjiang Province. Based on the zoning of land suitable for farming, the cultivated land in unsuitable farming areas in Heilongjiang should be transferred out (403.01 km2) and, according to the principle of the balancing cultivated land occupation and reclamation policy, the non-cultivated land in highly and moderately suitable farming areas should be transferred in (249.80 km2 and 163.39 km2, respectively) to achieve balance. The results can provide reference for the implementation of the cultivated land occupation and reclamation policy at the provincial level, as well as for promoting the implementation of the strategy of “storing grain in the land”.

1. Introduction

Under the impact of multiple pressures such as the international situation, climate, geopolitics, trade, resources, and demand, food security has become a serious issue and a hot topic. Cultivated land, as a special natural resource, is crucial to food security [1,2]. With the development of the social economy and the expansion of the urban scale, a large amount of agricultural land has been occupied for construction [3,4,5,6]. Especially in developing countries, the frequent transfer of agricultural land to construction land results in a decreasing trend for cultivated land area [7,8]; therefore, the cultivated land reserve resources become insufficient. In the absence of breakthroughs in agricultural technology, it is necessary to have a sufficient amount of cultivated land to stabilize the comprehensive grain production capacity. The pressure on food supply imposed by population growth is expected to persist into the middle of this century [9,10]. Coordinating the contradictory relationship between cultivated land resources and human activity is a major issue that needs to be solved urgently to ensure national food security and achieve high-quality development.
According to the statistics on cultivated land area across the world and each country, the area of cultivated land in the northern hemisphere is larger than that in the southern hemisphere, while the area in the eastern hemisphere is larger than that in the western hemisphere [11]. Due to the growth of the world population, climate change, and the acceleration of urbanization, the global area of cultivated land has been declining since 2005 [12,13]. The top 10 countries in terms of cultivated land are as follows: China, the United States, India, Russia, Brazil, Argentina, Australia, Canada, Kazakhstan, and Ukraine. Among them, China is the only country experiencing a decrease in cultivated land. To strictly protect cultivated land resources, policy to balance cultivated land occupation and reclamation was proposed in China in 1998 in order to strictly control the conversion of agricultural land to construction land. For more than 20 years, this policy has played an important role and has largely curbed the blind occupation of cultivated land for development. However, it only targets the rigid constraints between agricultural land and construction land, and does not strictly control the transfer of cultivated land to woodland, grassland, and other agricultural land [14,15,16]. At present, the area of cultivated land has decreased sharply, with a severe trend toward “non-agriculturalization” and “non-grain” uses [17,18,19]. Since 2020, the General Office of the State Council in China has issued several documents to restrict the “non-agriculturalization” and “non-grain” uses of cultivated land. In November 2021, the Ministry of Natural Resources, the Ministry of Agriculture and Rural Affairs, and the National Forestry and Grassland Administration in China jointly issued a notice titled “Issues related to strict control over the use of cultivated land”. This notice proposed the cultivated land “access–exit balance” policy, emphasizing strict control over the transfer of general-quality cultivated land to other types of agricultural or agricultural facility land. In September 2024, the Central Committee of the Communist Party and the General Office of the State Council of the People’s Republic of China issued the Opinions “Strengthening the Protection of Cultivated Land, Improving the Quality of Cultivated Land and Improving the Balancing of Occupation and Reclamation”, proposing that all types of cultivated land use, such as non-agricultural construction, afforestation and planting, and fruit and tea planting, should be integrated into the management system for balancing cultivated land occupation and reclamation. Under the new policy background, the implementation path of balancing cultivated land occupation and reclamation is still being explored. Therefore, implementing effective balancing management of cultivated land occupation and reclamation has become an urgent practical problem in China’s cultivated land management.
Generally, the management of cultivated land is based on land-use status classification; however, under the concept of sustainable development, it is necessary to optimize the use of cultivated land according to the natural environmental factors that form the land [20,21]. Land-type classification, an effective tool to coordinate the relationship between humans and land and optimize the allocation of land resources, is the process of dividing the basic natural attributes of land such as hydrothermal conditions, geomorphological types, and soil types in a specific area [22,23]. Relevant studies on land-type classification have been carried out in succession since the 1930s; however, due to differences in research aim, object, scale, and application purpose, scholars in various countries have adopted different land attributes, grades, and names for their land-type classification system schemes. From the perspective of research history, the main systems include the comprehensive classification systems of Britain and Australia as well as the landscape classification systems of Germany and the former Soviet Union. Other countries such as Canada, Europe, and the United States have also adopted the idea of a comprehensive system, which has obvious ecological characteristics [24,25,26,27,28,29,30]. In the early 1980s, a land-type classification system (1:1 million) was developed in China based on natural zoning, but no standardized study has been carried out on other small spatial scales [31]. Regarding the factors for classification and index selection, scholars consider that the classification factors should comprehensively reflect the characteristics of the land. At the global and national spatial scales, macroclimate factors play a leading role, affecting the spatial distribution of geographical elements [32,33]. At the watershed- and province-level spatial scales, under the influence of microclimate factors, the differentiation of topography and geomorphology leads to variations in hydrothermal conditions, soil conditions, and vegetation distribution [34]. At the county-, village-, and town-level spatial scales, flora and soil properties are strongly affected by slope aspect and human activities [35]. In recent years, the classification of the Earth Critical Zone has provided a new boundary idea for land-type classification [36,37]. The evaluation results of agricultural land potential productivity have notable practical significance for optimizing the spatial layout of cultivated land. Research on land potential productivity has mainly evolved through three major stages: an initial focus on land natural potential productivity, followed by a focus on light–temperature potential productivity and, finally, light–temperature–water–soil potential productivity. In the evaluation process, climatic conditions, topography, soil, water, and so on, are important factors affecting crop production; therefore, these factors are basically considered in the calculation model. The main methods can be summarized into the following five categories [38,39,40,41,42,43,44]: (1) based on the historical crop yield data, the trend extrapolation method models are used to identify variation in yield to predict crop yield; (2) the land potential productivity is calculated via correction for the effects of temperature, moisture, and soil on biomass, utilizing a mechanism model (agro-ecological zone model, Wageningen model) or an empirical model (Miami model, Thornthwaite Memorial model); (3) the crop growth simulation method is used to simulate the process of crop growth to predict crop yield; (4) potential productivity is calculated based on an evaluation of soil fertility using methods such as the Storie Index method and M-SQR method; and (5) a remote sensing model is developed to evaluate the grain yield.
Based on the concept of natural sustainable development, it is necessary to study the implementation path of balancing cultivated land occupation and reclamation policy based on the land types, as well as to propose targeted measures for optimal allocation of cultivated land from the perspective of land potential productivity assessment, in order to better promote the implementation of the strategy of “grain storage in land and technology” and ensure food security. In this study, Heilongjiang Province, a major grain-producing province in China, was taken as a case study to provide valuable reference for the implementation of balancing cultivated land occupation and reclamation policy and the optimal utilization of resources in other areas. The purposes of the study were to (1) put forward a land-type classification system at the provincial level and an evaluation method system of agricultural land potential productivity based on land types; (2) establish an implementation path of balancing cultivated land occupation and reclamation policy based on land types; and (3) recommend countermeasures and suggestions for the optimal allocation of cultivated land resources in Heilongjiang Province.

2. Theoretical Framework

2.1. Land-Type Classification at the Provincial Level

The land system is a complex system composed of natural elements, such as climate, topography, geology, soil, and hydrology, and human activities [45], in which the natural elements of the land form its basis. The Earth Critical Zone refers to a zone extending from the bottom of groundwater to the soil–rock interface and the top of the vegetation canopy; applied internationally, it provides a system boundary for the analysis of the natural land system. It includes the spatial heterogeneity area formed by the intersection of the atmosphere, lithosphere, soil circle, hydrosphere, and biosphere [46,47]. The climate circle is an important component of the land that largely determines the types of crops suitable for planting and the land’s potential productivity; factors such as solar radiation, heat, precipitation, and wind are very important to the formation of the surface climate and play a role in macro-control [48]. The climate is also an important external force that shapes topography and landform; generally, the larger the difference in land in small- and medium-sized areas, the more obvious the constraints of topography and geomorphology are, which redistributes the hydrothermal conditions and has a certain regulatory effect on the region [49]. The formation of topography and geomorphology is related to geological factors, and its relative stability is largely determined by the stability of rocks. As the carrier of parent material differentiation, rocks form different kinds of soil through the process of soil formation, providing a direct place for plant growth [50]. Hydrological factors, as an active part of the Earth Critical Zone, play an important role in the flow of material and energy [51], and the biosphere is the most active sphere that includes animals, plants, microorganisms, and human beings, who have significant migration patterns and can carry out disturbing activities that exert influences on other spheres. Therefore, only the first four spheres are considered as the most basic research objects in this study.
Different spatial levels of land systems have different structural characteristics. Usually, the state divides the region to facilitate administrative management. The provincial level, as the convergence level between the national and county levels, is a macro-control area for implementing national strategies, goals, and tasks and rationally allocating land use; therefore, it plays an important role in coordinating land use and planning, resource protection, and management [52]. Land types are affected by the comprehensive development and evolution of natural geographical elements, and the reasonable selection of division factors and indices forms the basis for scientific land-type classification [53,54]. In this study, the widely used “top-down” method was adopted, and the principles of a comprehensive and systematic approach examining regional differentiation and dominance, stability, and practicability were followed; moreover, the interaction between land development and composition structure and its constituent factors, as well as the formation and evolution process of the land, was comprehensively considered in the process of classification. Based on the main controlling factors, relative stability factors, and dynamic factors examined in this study, as well as the consistency of and difference in land attributes at the provincial level, land units with similar attributes were merged. Thus, a three-level classification—comprising the first land class, second land class, and third land class—was constructed from five dimensions: climatic conditions, geomorphic conditions, geological conditions, edaphic conditions, and hydrologic conditions (Figure 1). According to the climatic conditions as the main controlling factors and the differences in topography and geomorphology, the first land class, consisting of the highest-level units in the system, was classified, reflecting the zonal and non-zonal differentiation laws in the province. Based on the first land class, relative stability factors such as geological conditions and edaphic conditions were added, further reflecting the regional natural and geographical characteristics. The third land class, consisting of the lowest-level units in the system, was classified by adding hydrologic conditions to the second land class; hydrologic conditions are generally relatively dynamic, and it is necessary to consider these conditions to better understand the flow of material and energy in the system.

2.2. Agricultural Land Potential Productivity Evaluation Based on Land Types

The potential productivity evaluation of agricultural land is an effective way to identify the potential space for increasing cultivated land utilization. However, existing studies have generally been based on the current status of cultivated land, with a lack of recognition and assessment of the elastic space of cultivated land, making it difficult to reveal the real regional land potential productivity. Therefore, this study was carried out based on the natural background of land and identified the elastic space of cultivated land to reveal its potential productivity. This provided the basic support for the optimization of the status quo of cultivated land utilization, forming the idea of agricultural land potential productivity evaluation based on land types in this study.
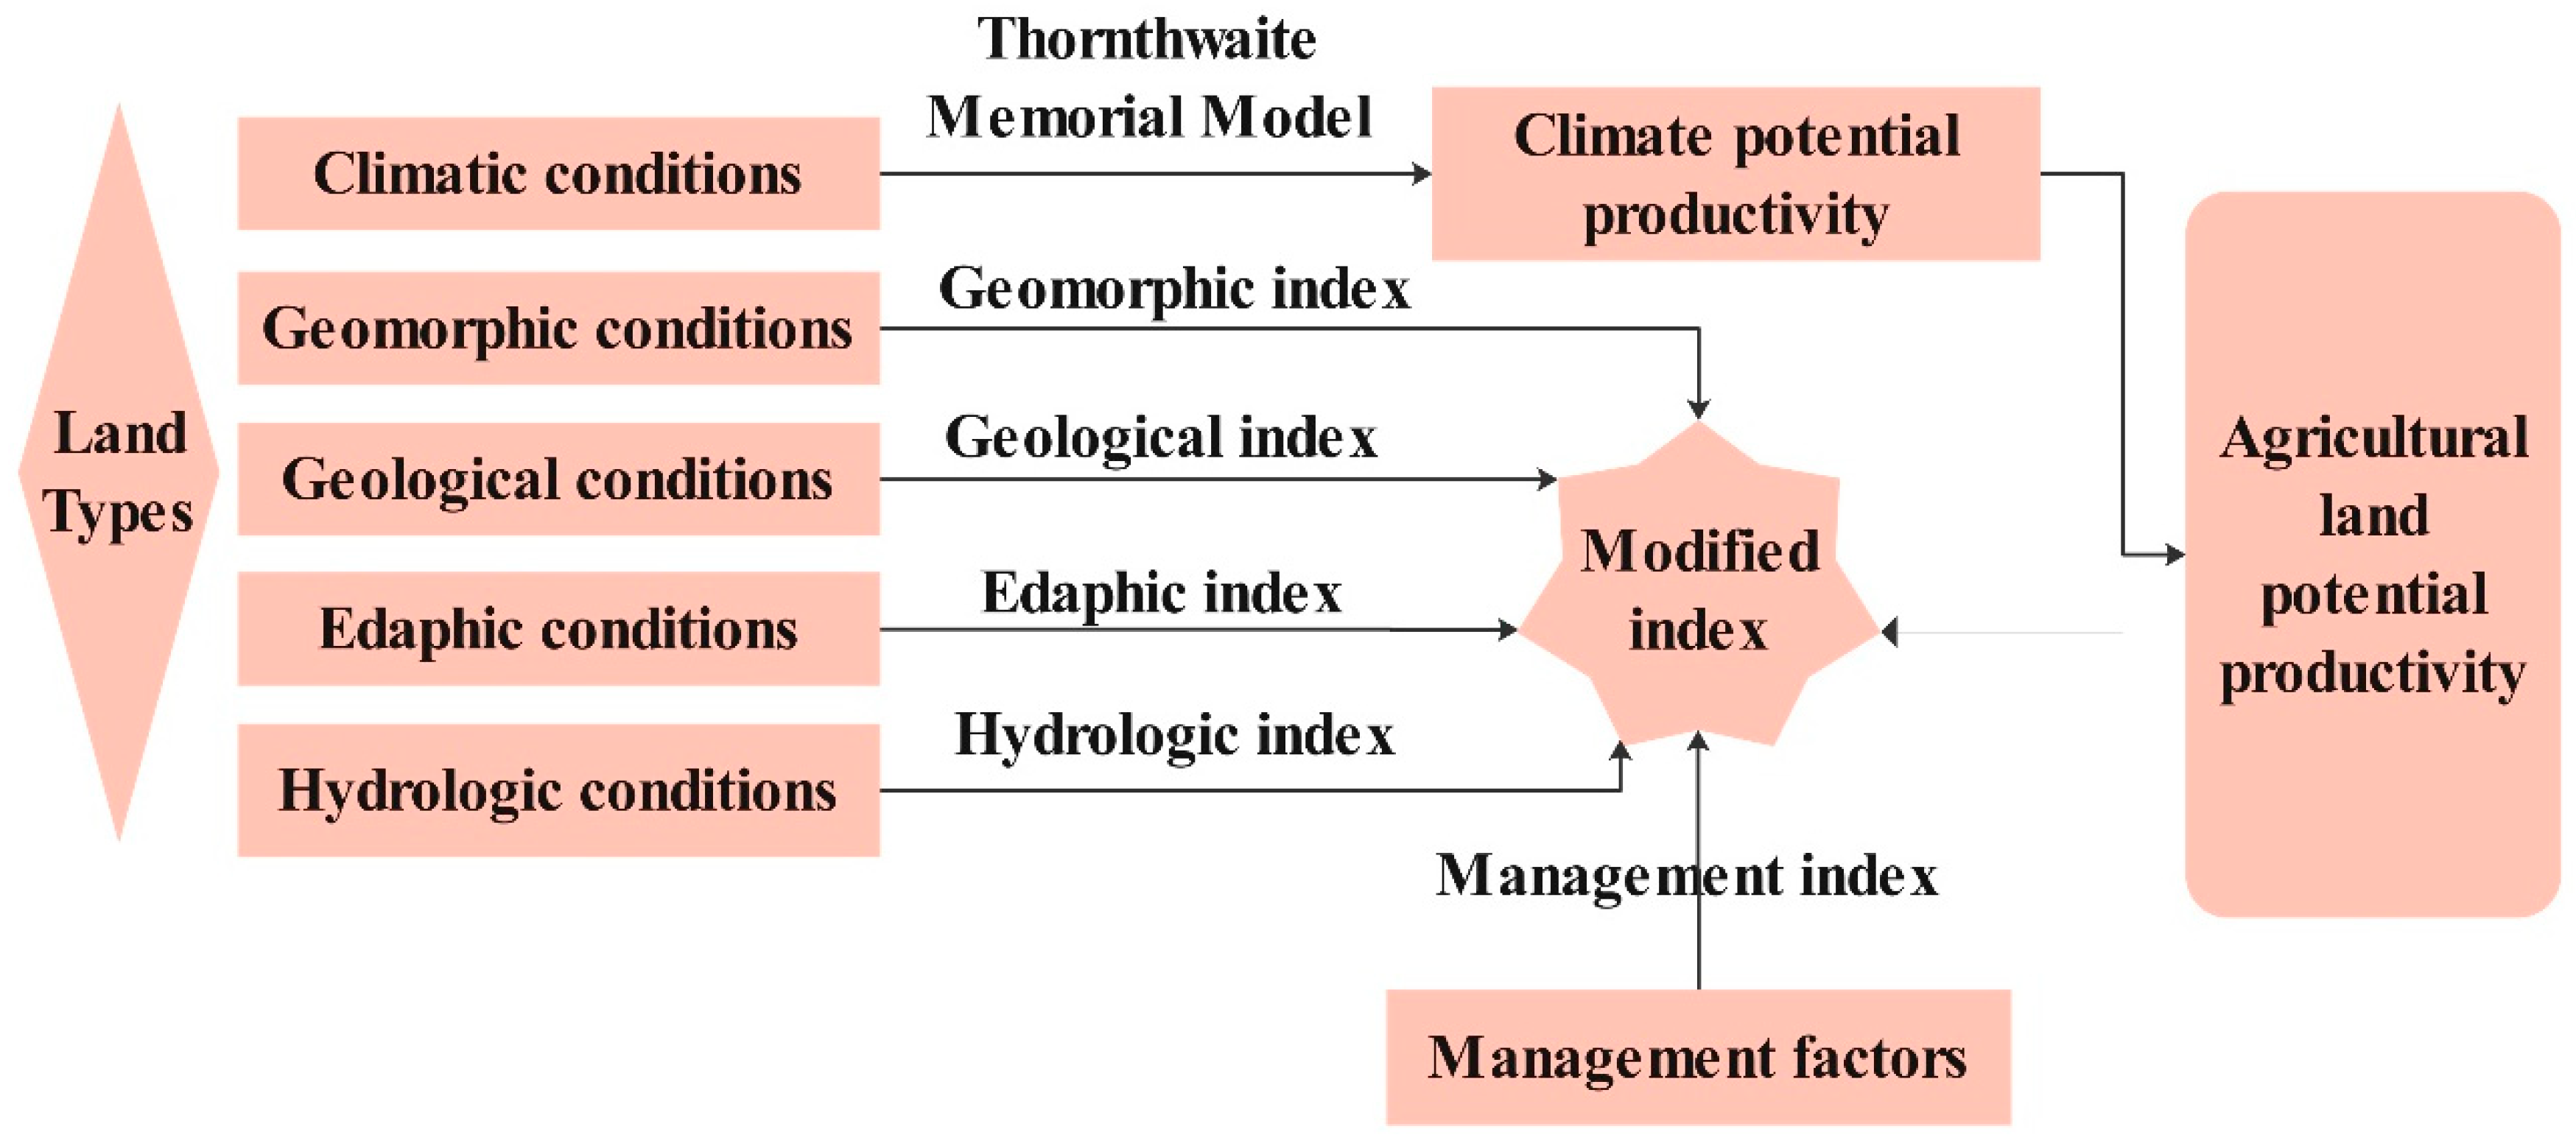
At the provincial level, there are many land-type units, and the size of these units is different; it is difficult to directly apply the land units as evaluation units and connect them with the data source. Therefore, based on the proposed land-type classification, this study did not consider the current situation of land use, but directly used the classification indicators corresponding to various land types as the basic parameters to measure the agricultural land potential productivity (Figure 2). The specific conceptual framework is as follows: taking the classification factors and indexes of land types as the control indexes of agricultural land potential productivity measurement, and considering the management factors under natural conditions, the classification standard of indices is determined based on the climate potential productivity measurement; then, the climate potential productivity is corrected; finally, the potential productivity of agricultural land is determined. According to the evaluation results of agricultural land potential productivity, combined with the land-type classification, the potential productivity level is divided.

2.3. Theoretical Thoughts on the Implementation of a Policy for Balancing Cultivated Land Occupation and Reclamation

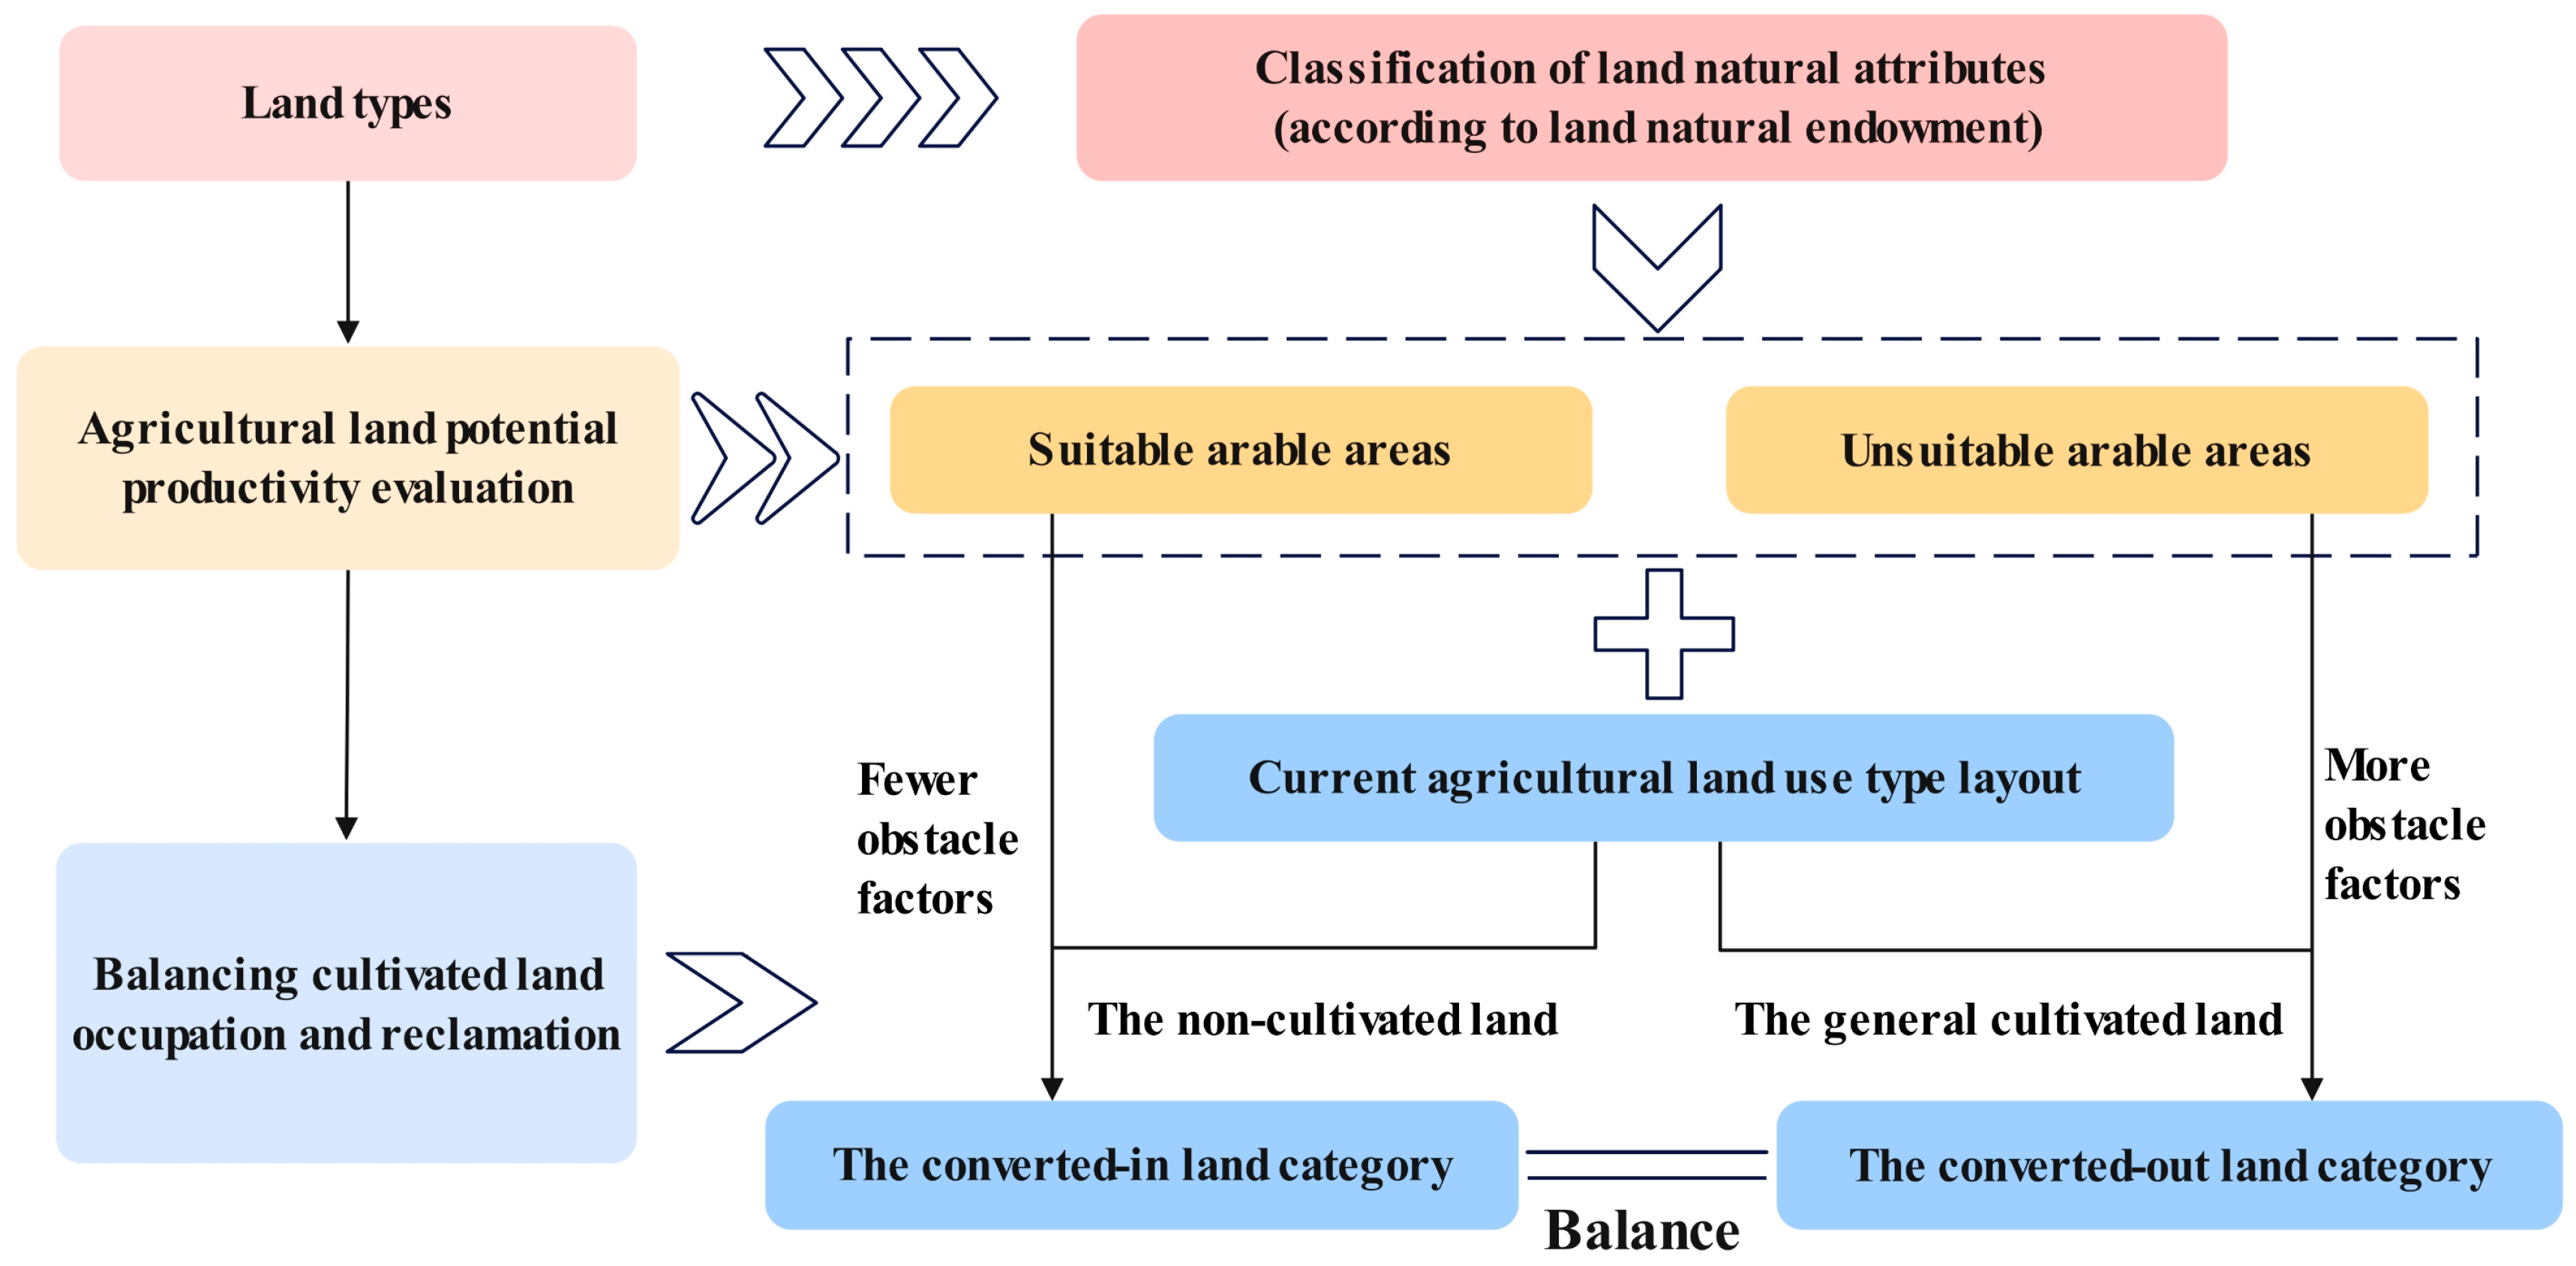
The objective of balancing cultivated land occupation and reclamation in the new policy lies in the management of the use conversion between cultivated land and other types of land, including agricultural land, construction land, and unused land. Currently, there is a preference for cultivated land with poor and unstable farmland infrastructure and unsuitable natural conditions to be transferred out for more suitable land uses. For the main grain-producing areas, cultivated land with good and stable natural conditions, supplementary cultivated land, paddy fields, and so on, are not allowed to be transferred out. Following the principle of balancing cultivated land occupation and reclamation, if an area of cultivated land is occupied, it must be filled with another cultivated land type with the same quantity, quality, and stability to ensure that the quantity and quality of crop yield are not reduced; moreover, the planting attribute must be unchanged, and efforts should be made to avoid the phenomenon of farmland with “non-agriculturalization” and “non-grain” uses. Therefore, in the process of balanced management of cultivated land import and export, based on the above calculation results of agricultural land potential productivity evaluation, this study determined the converted and transferred arable land plots. The non-cultivated land within the area that has fewer obstacle factors and is suitable for cultivation is classified in the converted-in land category, while the general cultivated land with low suitability and more obstacle factors for converting into permanent basic farmland is classified in the converted-out land category (Figure 3).

3. Materials and Methods

3.1. Study Area

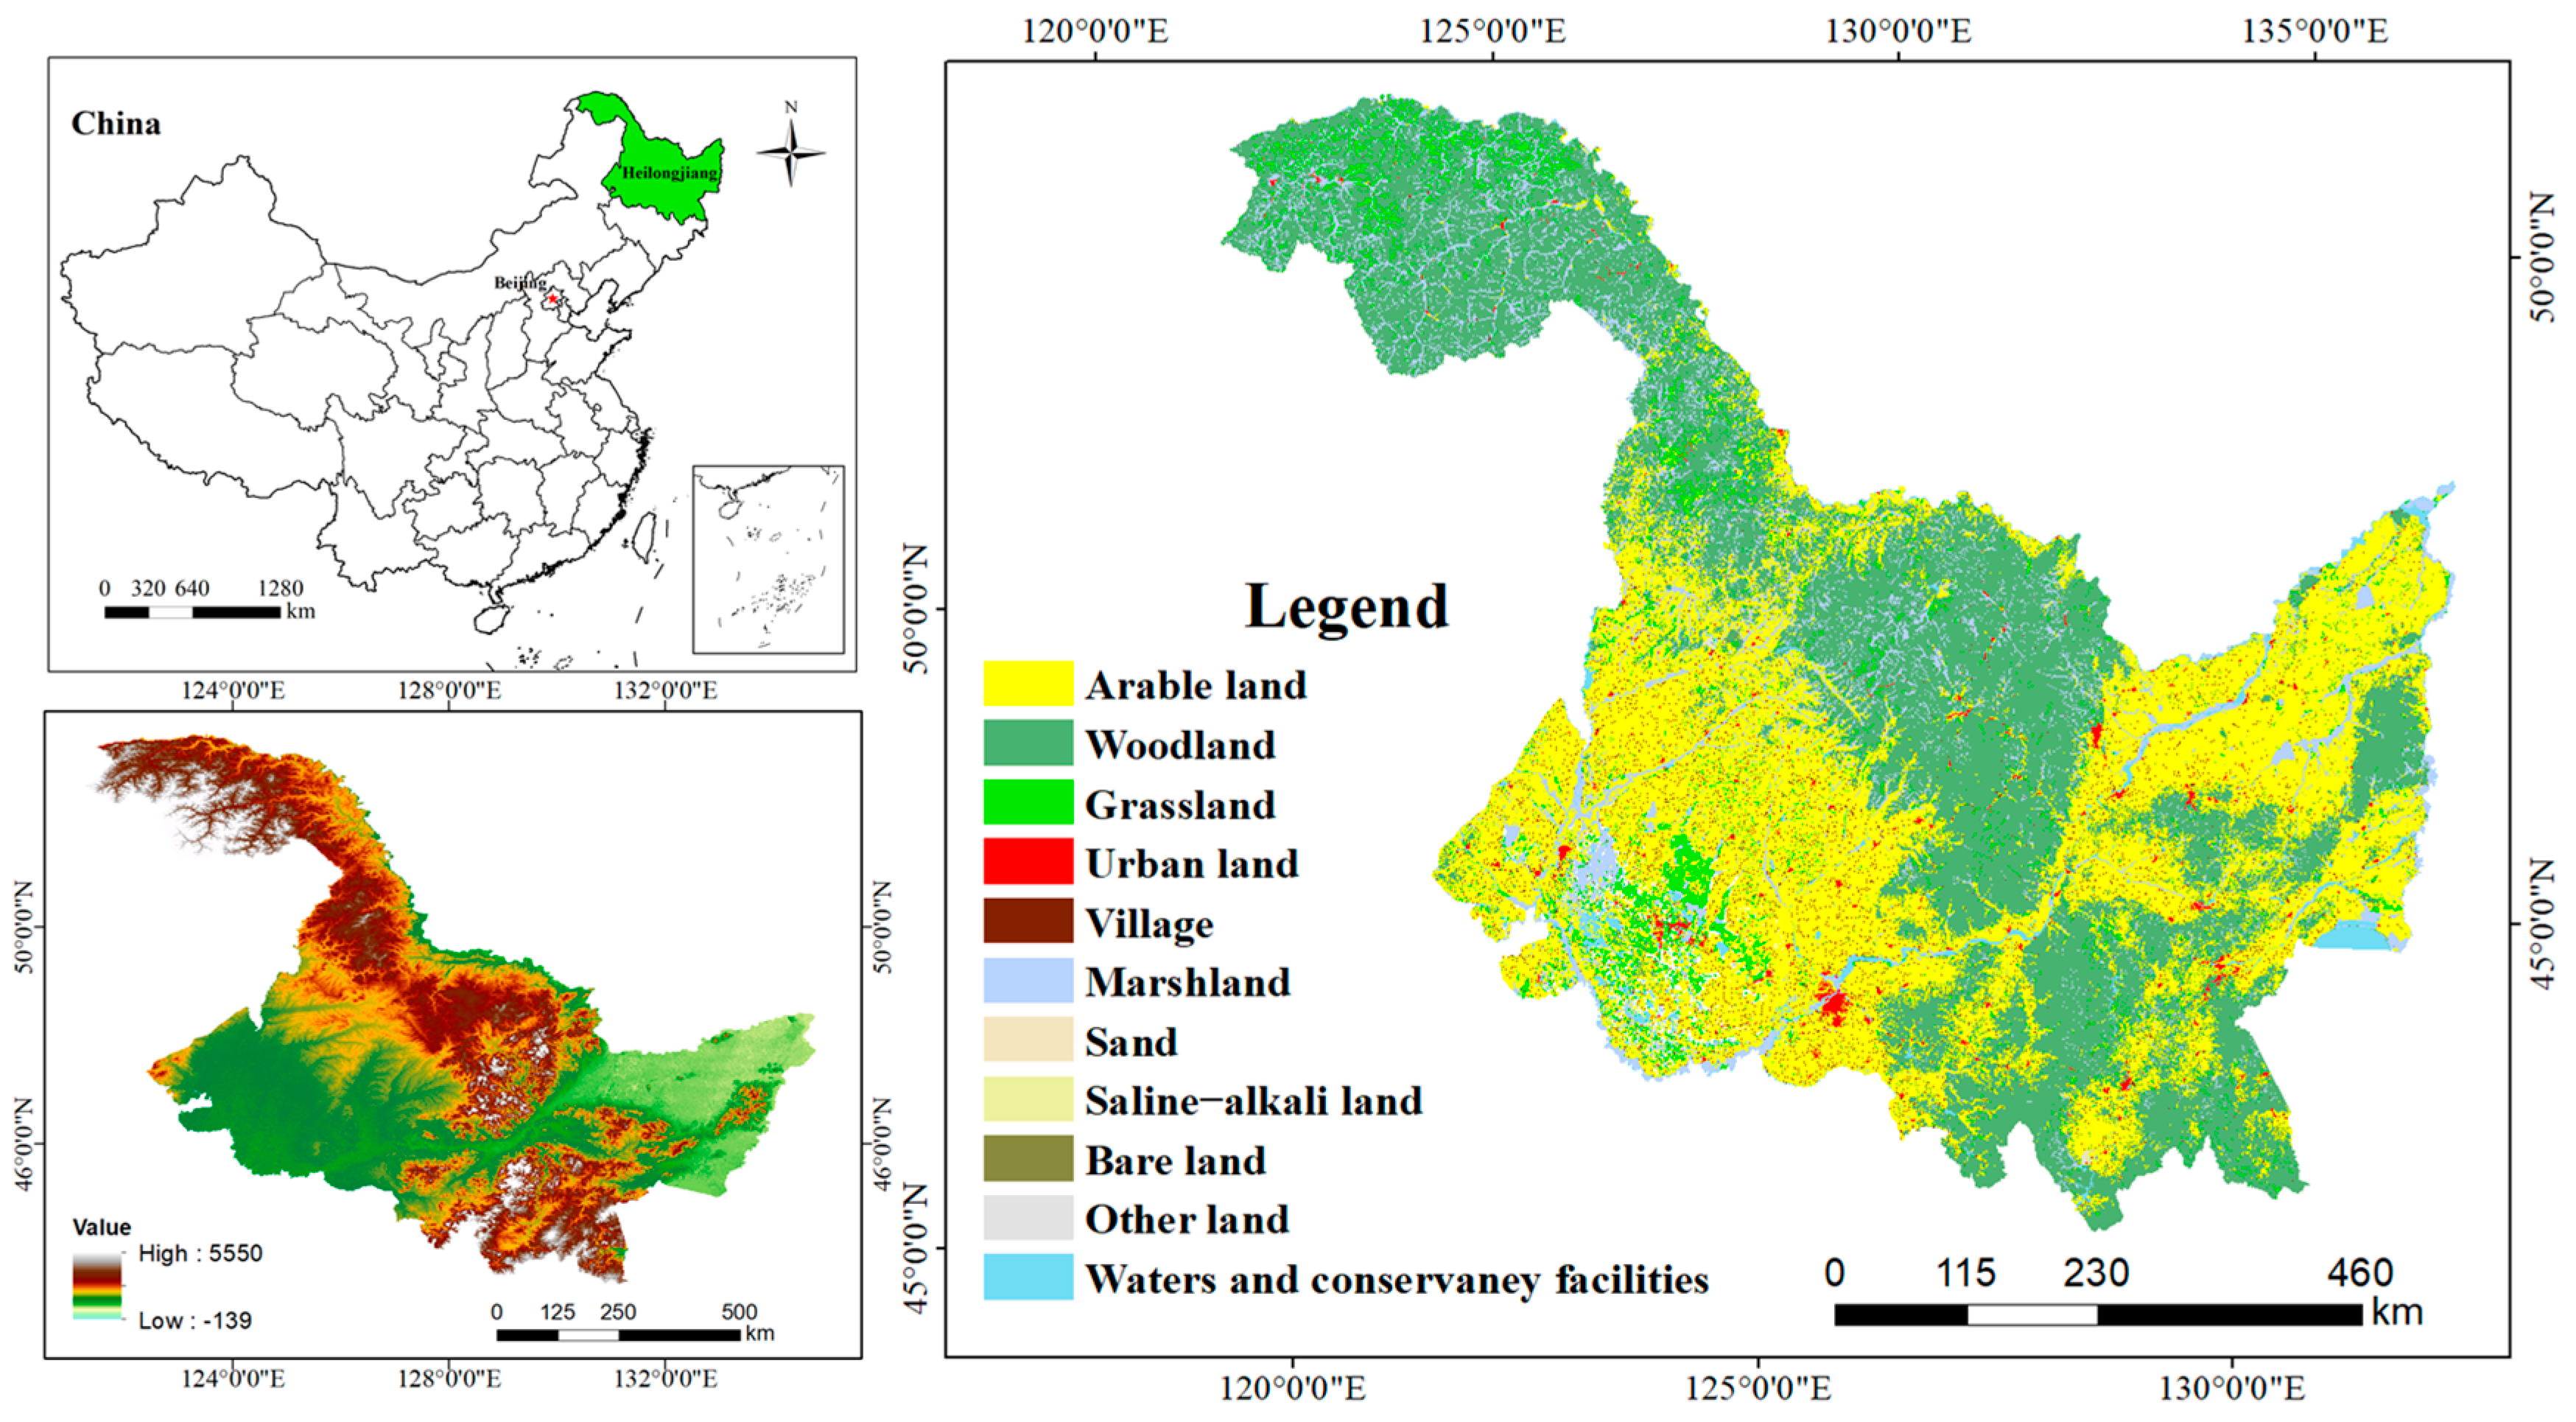
Heilongjiang Province, with a total area of about 470,740 km2, is located in China’s highest latitude and longitude of the eastern region (43°26′~53°33′ N, 121°11′~135°05′ E), (Figure 4). The northern part is characterized by a cold temperate monsoon climate, while the southern part has a temperate monsoon climate. The summer is short, hot, and humid, while the winter is cold and dry. The lowest temperature can be as low as approximately −40 °C. The average annual temperature is about −5~5 °C, and the average annual precipitation is about 400~700 mm. The terrain is high in the northwest, north, and southeast, mostly mountainous, while it is low in the northeast and southwest, mostly flat, with the junction areas mostly being plateaus. There are few types of soil in the cold temperate zone, while the soil types in the temperate zone are more complex. The rivers are distributed vertically and horizontally, and there are four major rivers: The Heilongjiang, Songhua, Wusuli, and Razdolnaya Rivers. Due to its superior geographical conditions, Heilongjiang Province is an important agricultural province in China, and its grain output has ranked first in China for thirteen consecutive years.
The reason for choosing Heilongjiang Province as the research area is that it is located in the Northeast China black soil area—one of only four black soil areas in the world. Due to its fertile soil, it is suitable for farming and Heilongjiang plays an important role in ensuring grain security. Studies have shown that the amount of non-agricultural land in Heilongjiang has increased in the last 40 years, and the cultivated land has shown a certain phenomenon of non-grain use [55]. To stabilize and protect the black soil area, from the perspective of land natural endowment, in this study, the agricultural production potential of the whole land in Heilongjiang Province was calculated based on land-type division, the optimal allocation of cultivated land was established based on the idea of unified occupation and reclamation management of cultivated land, and the implementation of strict national cultivated land-use control was further promoted.

3.2. Methods

3.2.1. Land-Type Classification

(1) The graph overlay method
According to the land-type classification system scheme at the provincial level, the graph overlay method was used to complete the division using the ArcGIS software. The specific steps are as follows: ① the climate zone index layer, corresponding to the dominant factor—climate condition—and the geomorphic subclass index layer, corresponding to the dominant factor—geomorphic condition—are superimposed and intersected to obtain the first land-class units; ② based on the first land-class units, the rock type index layer, corresponding to the dominant factor—geological condition—and the soil genus index layer, corresponding to the dominant factor—edaphic condition—are superimposed and intersected to obtain the second land-class units; ③ based on the second land-class units, the groundwater depth index layer, corresponding to the dominant factor—hydrologic condition—is superimposed to obtain the third land-class units.
(2) Land-type naming
Based on relevant land-type classification practices and to fully express the characteristics of natural resource elements in the land-type name, this study adopts a naming method according to dominant factors and indices; that is, land types are named in the order of “[climatic condition + geomorphic condition]—[geological condition + edaphic condition]—[hydrologic condition]”. The three-level classification basis of the provincial-scale classification system can be expressed intuitively through the naming process, which is convenient for application in land evaluation, territorial spatial planning, land valuation, and so on. The specific naming rules are as follows: ① in the climate zone index, the first letter “C” is used to encode the climate, the first two Arabic numerals are used to encode the climate zone, and the last Arabic numeral represents the dry and wet zone. In the geomorphic subclass index, the first letter “T” is used to encode the geomorphology; the first, second, and fifth Arabic numerals are used to encode the land relief, altitude, and secondary genetic types, respectively; and the third and fourth Arabic numerals represent genetic types. ② In the rock type index, the first letter “G” is used to encode the geomorphology; others are codes for the representative rock types, which follows the rock type code in the SOTER classification. In the soil genus index, the first letter “S” is used to refer to soil, the first two Arabic numerals are used to encode the Chinese province, and the last three Arabic numerals represent the soil genus. ③ In the groundwater depth index, the first letter “H” is used to encode the hydrology, and the two Arabic numerals represent shallow groundwater, middle and deep groundwater, or deep groundwater.

3.2.2. Evaluation Method System of Agricultural Land Potential Productivity

(1) Climate potential productivity
Climate factors play a key role in grain production. Precipitation is the basic water source, and heat is one of the environmental factors necessary for crop growth. Climate potential productivity refers to a production capacity that is only affected by temperature and precipitation conditions, considering other natural environmental factors to be in an ideal state. It is measured using the dimensionless index parameters and mathematical models, mainly based on multi-year average climate data [56]. The Miami model and the Thornthwaite Memorial model are widely used; in particular, the Thornthwaite Memorial model—a relatively mature method—uses the actual annual evapotranspiration to predict biological production, which is a further improvement on the basis of the Miami model [57]. The calculation formulas are as follows:
W a = 3000 × ( 1 e 0.0009695 × E a 20 )
E a = 1.05 R a / ( 1 + 1.05 R a W m a x ) 2 1 / 2
W m a x = 300 + 25 t + 0.05 t 3
where W a is the crop dry matter yield calculated using the actual evapotranspiration (g/(m2·a)), E a is the annual average actual evapotranspiration (mm), R a is the annual average precipitation (mm), W m a x is the annual average maximum evapotranspiration (mm), and t is the annual average temperature (°C).
When R a > 0.316 W m a x , Formula (2) is valid; while if R a ≤ 0.316 W m a x , then E a = R a .
(2) Agricultural potential productivity
Agricultural potential productivity is not only affected by climate factors but also by topography, soil, hydrology, and other conditions. The correction factors and indices are provided in Table 1. From the perspective of the factors influencing the land composition structure, topography is one of the main natural environmental limiting factors affecting the potential productivity of land, which directly affects the inherent quality of the land [58]. Based on the land-type classification and considering the indicators that have a direct impact on land potential productivity, surface morphology, slope, and altitude are selected. Rock types are considered in the classification of land types as they are closely related to soil parent materials [59]; the potential productivity correction index also considers this index. Edaphic condition, as the core factor affecting the potential productivity of land, reflects the status of land as the main background condition for the production of food crops. It mainly considers the physical and chemical indicators that affect soil water, fertilizer, gas, heat, and other factors, including soil texture, soil thickness, soil organic carbon, gravel content, bulk density, soil pH, soil available water content, cation exchange capacity, and base saturation, among others; factors that limit soil fertility are also considered, such as the soil erosion degree [60,61]. In terms of hydrological conditions, the precipitation conditions are considered in the calculation of climatic potential productivity; then, the groundwater depth is used as the correction index. The quality and salinity of groundwater also have notable impacts on the quality of cultivated land and crop production; however, due to the difficulty in obtaining the data for such indicators at the provincial level, they were not considered in this study. Management factors focus on considering irrigation and drainage conditions under the influence of natural conditions.
The agricultural potential productivity is obtained through stepwise correction of the climate potential productivity and a multi-factor comprehensive evaluation method. The formulas are as follows:
F n = i n f i w i
P = j n F n W j
where F n is the correction index for each factor, f i is the function score of index i, w i is the weight of index i, and i indexes the function scores for each factor (i = 1, 2, …, n); P is the agricultural land potential productivity, W j is the weight of each factor, and j indexes the weights for each factor. The weight of each index is determined using the analytic hierarchy process (AHP) method. Its basic principle is to decompose the overall evaluation goal into different constituent factors, conduct aggregation at different levels according to the mutual membership relationship among each factor, and finally conduct consistency tests to obtain the heaviest weight value. The process of weight definition is completed by the software YAANP.
The function score of each index mainly refers to the grading standard parameters set by the current standards and norms related to the quality of cultivated land in China (Table 1), such as the technical regulation of the third nationwide land survey (TD/T 1055-2019) [62], regulation for gradation on agriculture land quality (GB/T 28407-2012) [63], rules for soil quality survey and assessment (NY/T 1634-2008) [64], standards for classification and gradation of soil erosion (SL 190-2007) [65], and cultivated land quality grade (GB/T 33469-2016) [66], among others.
The division method of potential productivity grade zoning is based on the principle that the same type of land unit has similar internal attributes and utilization potential. Therefore, according to the land-type classification and the calculation value of agricultural potential productivity, firstly, the natural discontinuity point method was used to divide the potential productivity calculation values from high to low into three levels; then, combining the principle of land unit integrity, the three levels were adjusted to determine the interval value of the potential productivity partition. Finally, the agricultural land potential productivity was divided into three zones: high potential productivity zone, medium potential productivity zone, and low potential productivity zone.

3.2.3. The Implementation Paths of Balancing Cultivated Land Occupation and Reclamation Policy

In the process of calculating the agricultural land potential productivity, the correction indices and their selected grading standards are defined according to the relevant norms and standards of cultivated land evaluation in China. If the correction index is less than 60, it means that the corresponding area is not suitable for farming; therefore, a series of measures need to be taken to overcome the environmental limitations. In this study, an area with a correction index of more than 60 is regarded as a suitable farming area. According to the potential productivity calculation results based on land types, and the correction indices as the measurement standard, four areas have been divided (Table 2): (1) the land within the high potential productivity zone with correction indices exceeding 85 is included in Area I (highly suitable farming areas); (2) the land within the high potential productivity zone with correction indices exceeding 60 but less than 85 and the land within the medium potential productivity zone with correction indices exceeding 85 are included in Area II (moderately suitable farming areas); (3) the land within the medium potential productivity zone with correction indices more than 60 but less than 85 and the land within the low potential productivity zone with correction indices more than 85 are included in Area III (low suitable farming areas); and (4) the land within the low potential productivity zone with correction indices more than 60 but less than 85 and other areas with environmental factors that are not suitable for farming are included in Area IV (unsuitable farming areas).
After the suitable farming areas are delineated, the land-use status is superimposed to identify the land-use status corresponding to different suitable farming areas; then, the adjustment path for balancing cultivated land occupation and reclamation is specified: (1) land currently utilized as cultivated land in Area IV (unsuitable farming areas) should be transferred out; (2) if there is non-cultivated land in Area I, it can be preferentially transferred in and, if there is non-cultivated land in Area II, it can be transferred in. In these two cases, it is necessary to consider the requirements of the policy for balancing cultivated land occupation and reclamation: the quantity of cultivated land should be balanced, and the quality of cultivated land should be better than that of occupied land (or at least remains relatively stable). Furthermore, the principle of “make up first and occupy later” and the convenience of farming should be considered; (3) to ensure the balance between quantity and quality of cultivated land occupation and reclamation, if the quantity of the land transferred in from Area I and Area II is not balanced with the quantity of cultivated land transferred out from Area IV, the non-cultivated land in Area III can be transferred in. In this case, the adjustment requirements are the same as those in (2).

3.3. Data Source and Process

The data used in this study mainly comprise three categories: land-type classification data, agricultural land potential productivity evaluation index basic data, and land-use status data (Table 3).

4. Results

4.1. The Results of Land-Type Classification in Heilongjiang Province

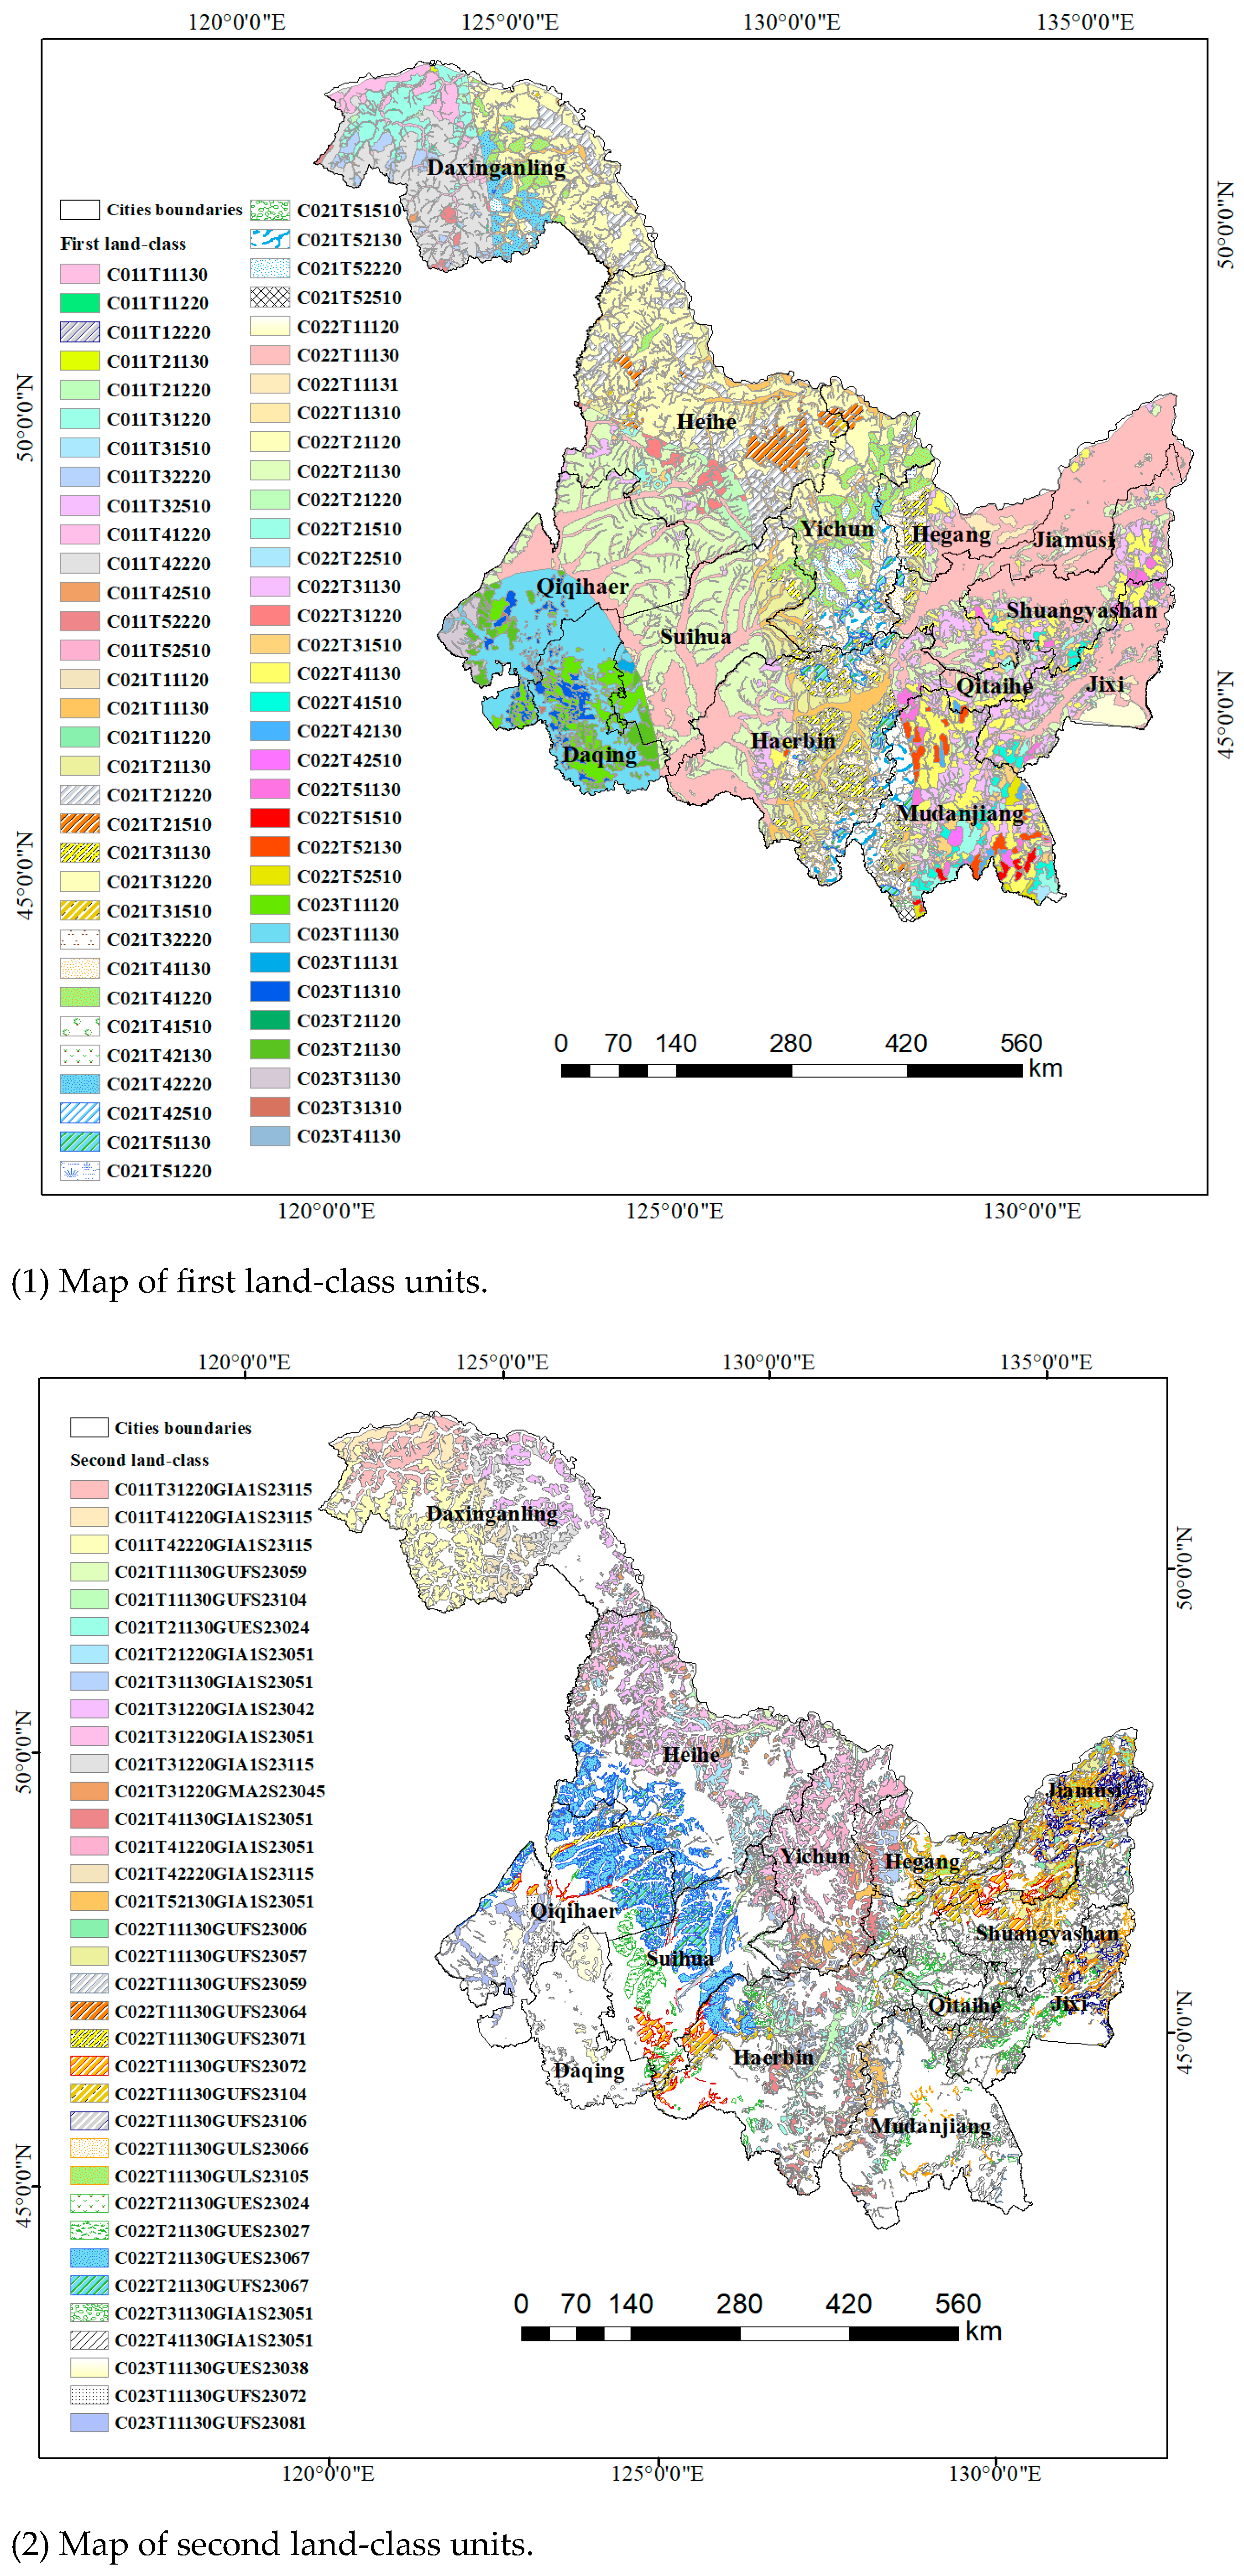
According to the spatial level effect and the availability of relevant data, the land types in Heilongjiang were assessed based on the constructed land-type classification system. The final land-type classification result was formed through step-by-step superposition of the index layers. Finally, Heilongjiang Province was divided into 65 first land-class units, 4407 s land-class units, and 6476 third land-class units (Figure 5).
The western part of Heilongjiang Province is the Songnen Plain, formed by the alluvial deposits of the Songhua and Nenjiang Rivers, while the northeastern part is the Sanjiang Plain, formed by the alluvial deposits of the Heilongjiang, Songhua, and Wusuli Rivers. The land types cover relatively larger areas in the plains, with a more regular shape. Among the first land-class land-type units, the uplift/erosion flow low-altitude plains (C022T11130) in the mid-temperate semi-humid area account for the largest proportion (of 18.627%), with the highest degree of differentiation and the most complex type combination relationship. The area of the uplift/erosion flow low-altitude plateau (C022T21130) in the mid-temperate semi-humid area accounts for 13.180% of the total, which presents the highest frequency and the largest diversity index.
The second land-class land-type units in the plain of Heilongjiang mainly include the alluvial (river deposits) clay meadow soil–medium temperate semi-humid zone uplift/erosion flow low-altitude plain (CO22T11130GUFS23104) and an alluvial sandy gravel bottom calcareous meadow soil–medium temperate semi-humid zone uplift/erosion flow low-altitude plain (CO222T11130GUFS23072), accounting for 2.090% and 1.228% of the area of Heilongjiang, respectively. The former presents a high frequency, as well as a high degree of differentiation and dominance. The land-type units in the hilly and mountainous areas are relatively more fragmented, rich, and complex, mainly including granite sandy dark brown soil–mid-temperate humid zone uplift/erosion periglacial low-altitude hills (CO21T31220GIA1S23051) and granite brown coniferous forest soil–cold temperate humid zone uplift/erosion periglacial small undulating mountains (C011T42220GIA1S23115), accounting for more than 2.000% of the area of Heilongjiang Province. The former has the highest degree of differentiation and the largest diversity index.
Among the third land-class land-type units, the largest area is the middle and deep groundwater–granite sandy dark brown soil–middle temperate humid zone uplift/erosion periglacial low-altitude hills (C021T31220GIA1S23051H02), with the highest degree of differentiation, the largest diversity index, and a complex type combination, accounting for 2.559% of the area of Heilongjiang, followed by the middle and deep groundwater–granite gravel sandy dark brown soil–middle temperate humid zone uplift/erosion periglacial low-altitude hills (C021T31220GIA1S23042H02) and the middle and deep groundwater–aeolian sand bottom black soil–middle temperate semi-humid area uplift/erosion water low-altitude plateau (C022T21130GUES23067H02), accounting for 2.280% and 2.101% of the area of Heilongjiang Province, respectively.

4.2. The Evaluation Results of Agricultural Potential Productivity

4.2.1. Climate Potential Productivity

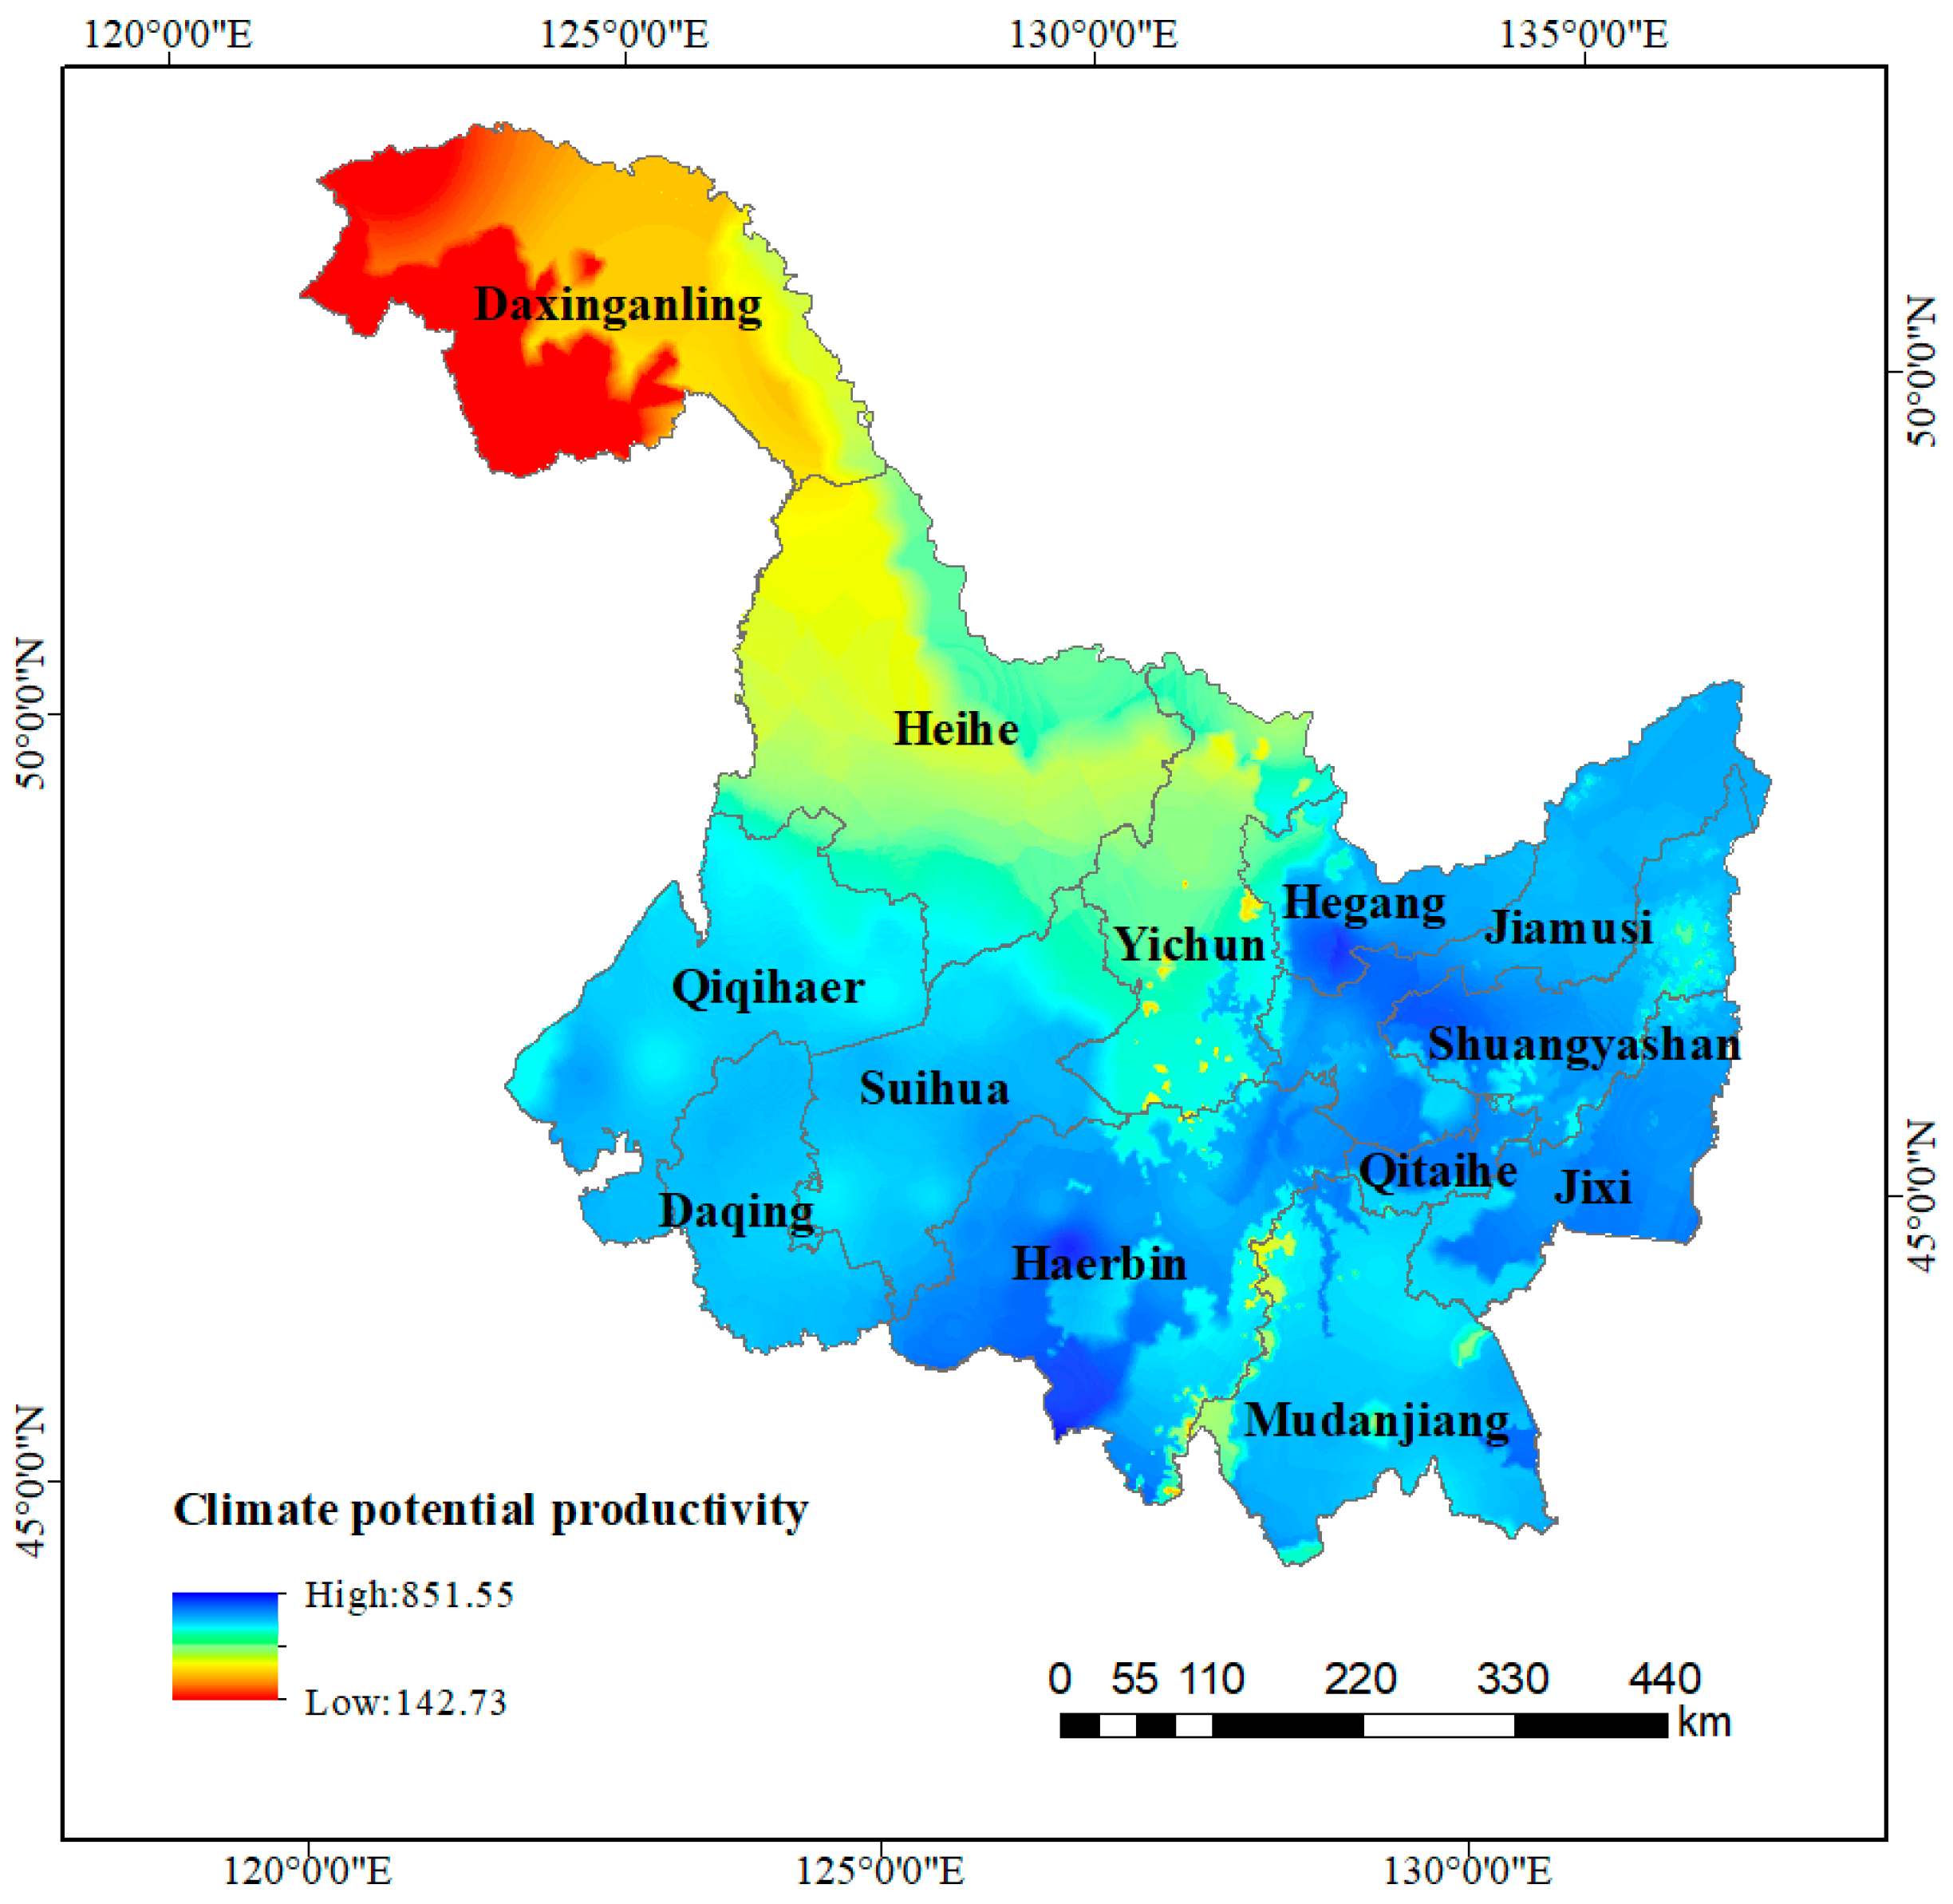
The climate potential productivity of Heilongjiang ranges from 142.73 to 851.55g/(m2·a), with the climate potential productivity in the northern and central regions being low, while that in the western and eastern regions is high (Figure 6). According to the maximum and minimum difference average discontinuity method, the climate potential productivity of Heilongjiang was divided into four grades: 142.73~319.93 g/(m2·a), 319.94~497.13 g/(m2·a), 497.14~674.34 g/(m2·a), and 674.35~851.55 g/(m2·a). The climate potential productivity of Heilongjiang is dominated by higher values in the range of 674.35~851.55 g/(m2·a), with the area in this range accounting for 62.14% of Heilongjiang, mainly located in the west, east, and south of Heilongjiang. This area includes Qiqihar City, Daqing City, most of Suihua City, Harbin City, Jiamusi City, Hegang City, Shuangyashan City, Jixi City, and Qitaihe City, among others. This is followed by areas with climate potential productivity in the range of 497.14~674.34 g/(m2·a), which are mainly located in the central and northern parts of Heilongjiang, including Heihe City, Yichun City, and parts of the Greater Khingan Mountains.

4.2.2. Agricultural Potential Productivity

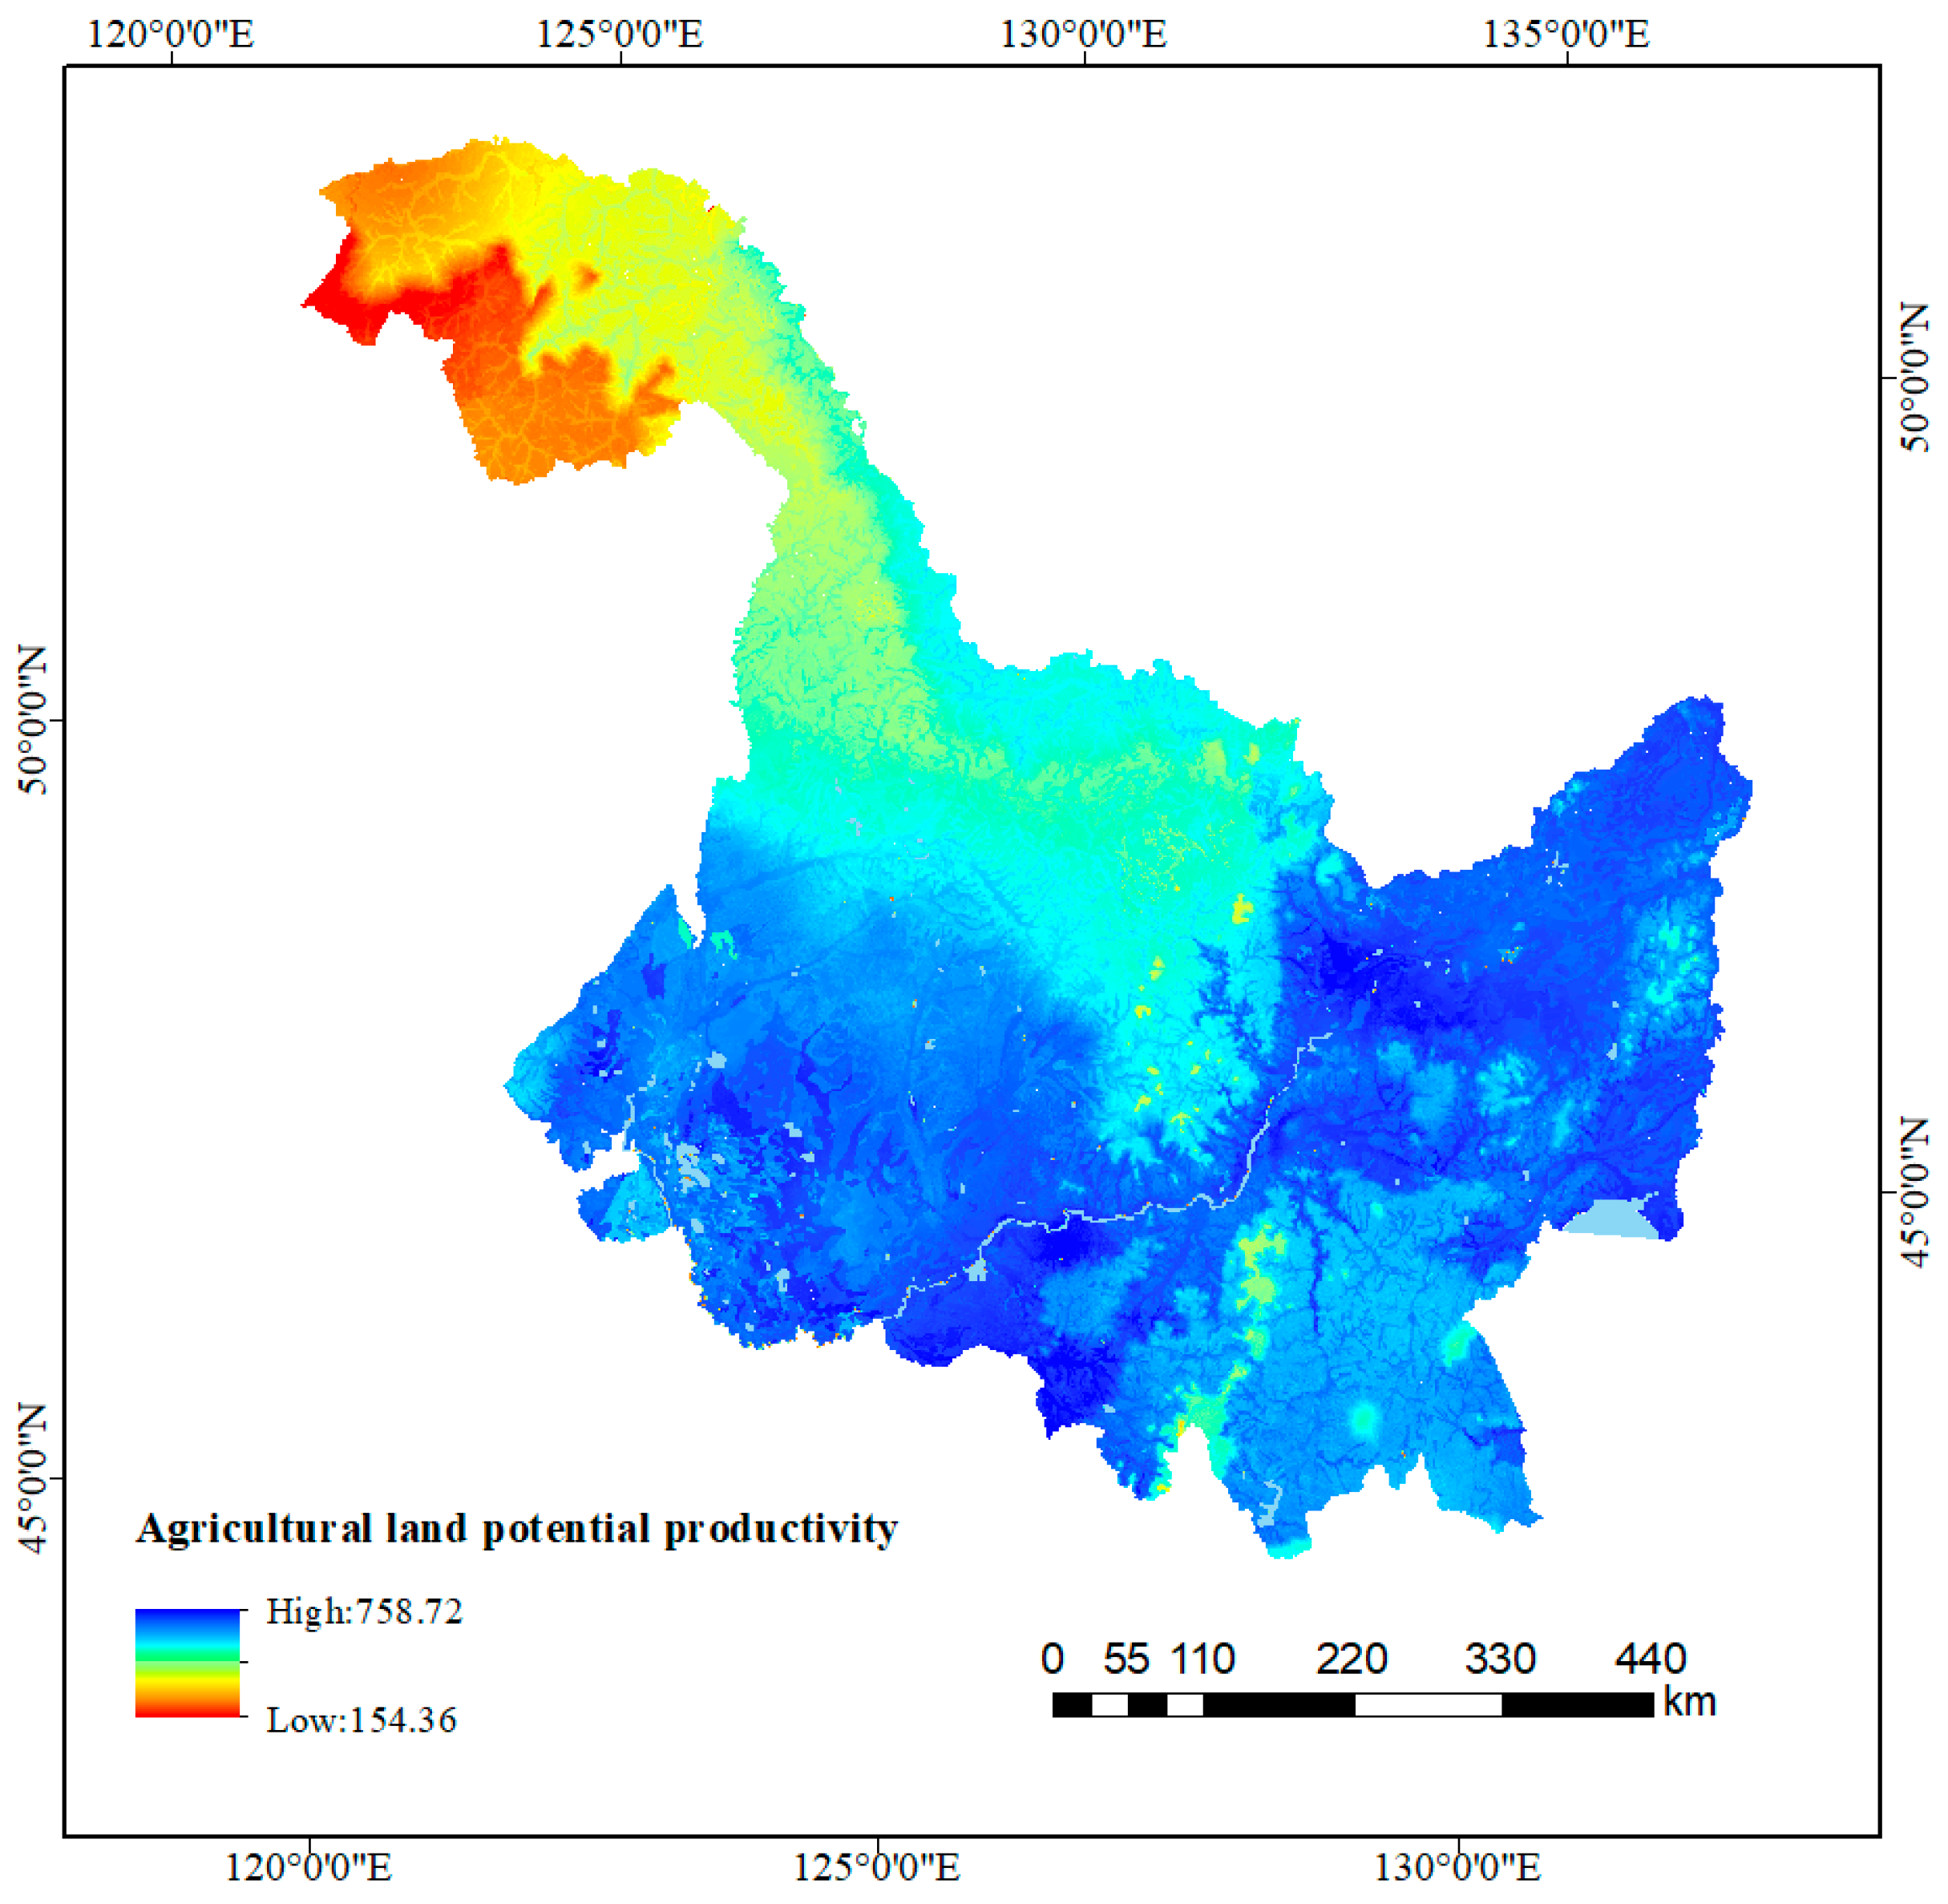
The values of agricultural potential productivity and climate potential productivity present certain similarities in terms of spatial distribution (Figure 7): the agricultural potential productivity in the northern and central regions of Heilongjiang Province is low, while that in the western and eastern regions is high. However, it can be seen that due to the different spatial distributions of terrain, soil, water, and other factors, the agricultural potential productivity shows certain spatial differences, which is manifested as a regular and strip-like distribution according to certain topography or soil types, related to the zonal and non-zonal differentiation rules presented by these factors. Based on the maximum and minimum difference average discontinuity method, the agricultural potential productivity of Heilongjiang was also divided into four grades: 154.36~305.45 g/(m2·a), 305.46~456.54 g/(m2·a), 456.55~607.63 g/(m2·a), and 607.64~758.72 g/(m2·a). The agricultural potential productivity in Heilongjiang is mainly in the range of 607.64~758.72 g/(m2·a), accounting for 53.72% of the total area, with this area including in Qiqihar City, Daqing City, Suihua City, Harbin City, Mudanjiang City, Qitaihe City, Jixi City, Shuangyashan City, Jiamusi City, Hegang City, and other parts of the western and eastern Heilongjiang. This is followed by the range of 456.55~607.63 g/(m2·a), the area of which is mainly located in Heihe City, Yichun City, Suihua City, Mudanjiang City, and other parts of the central part of Heilongjiang.

4.2.3. Agricultural Potential Productivity Grade Zoning

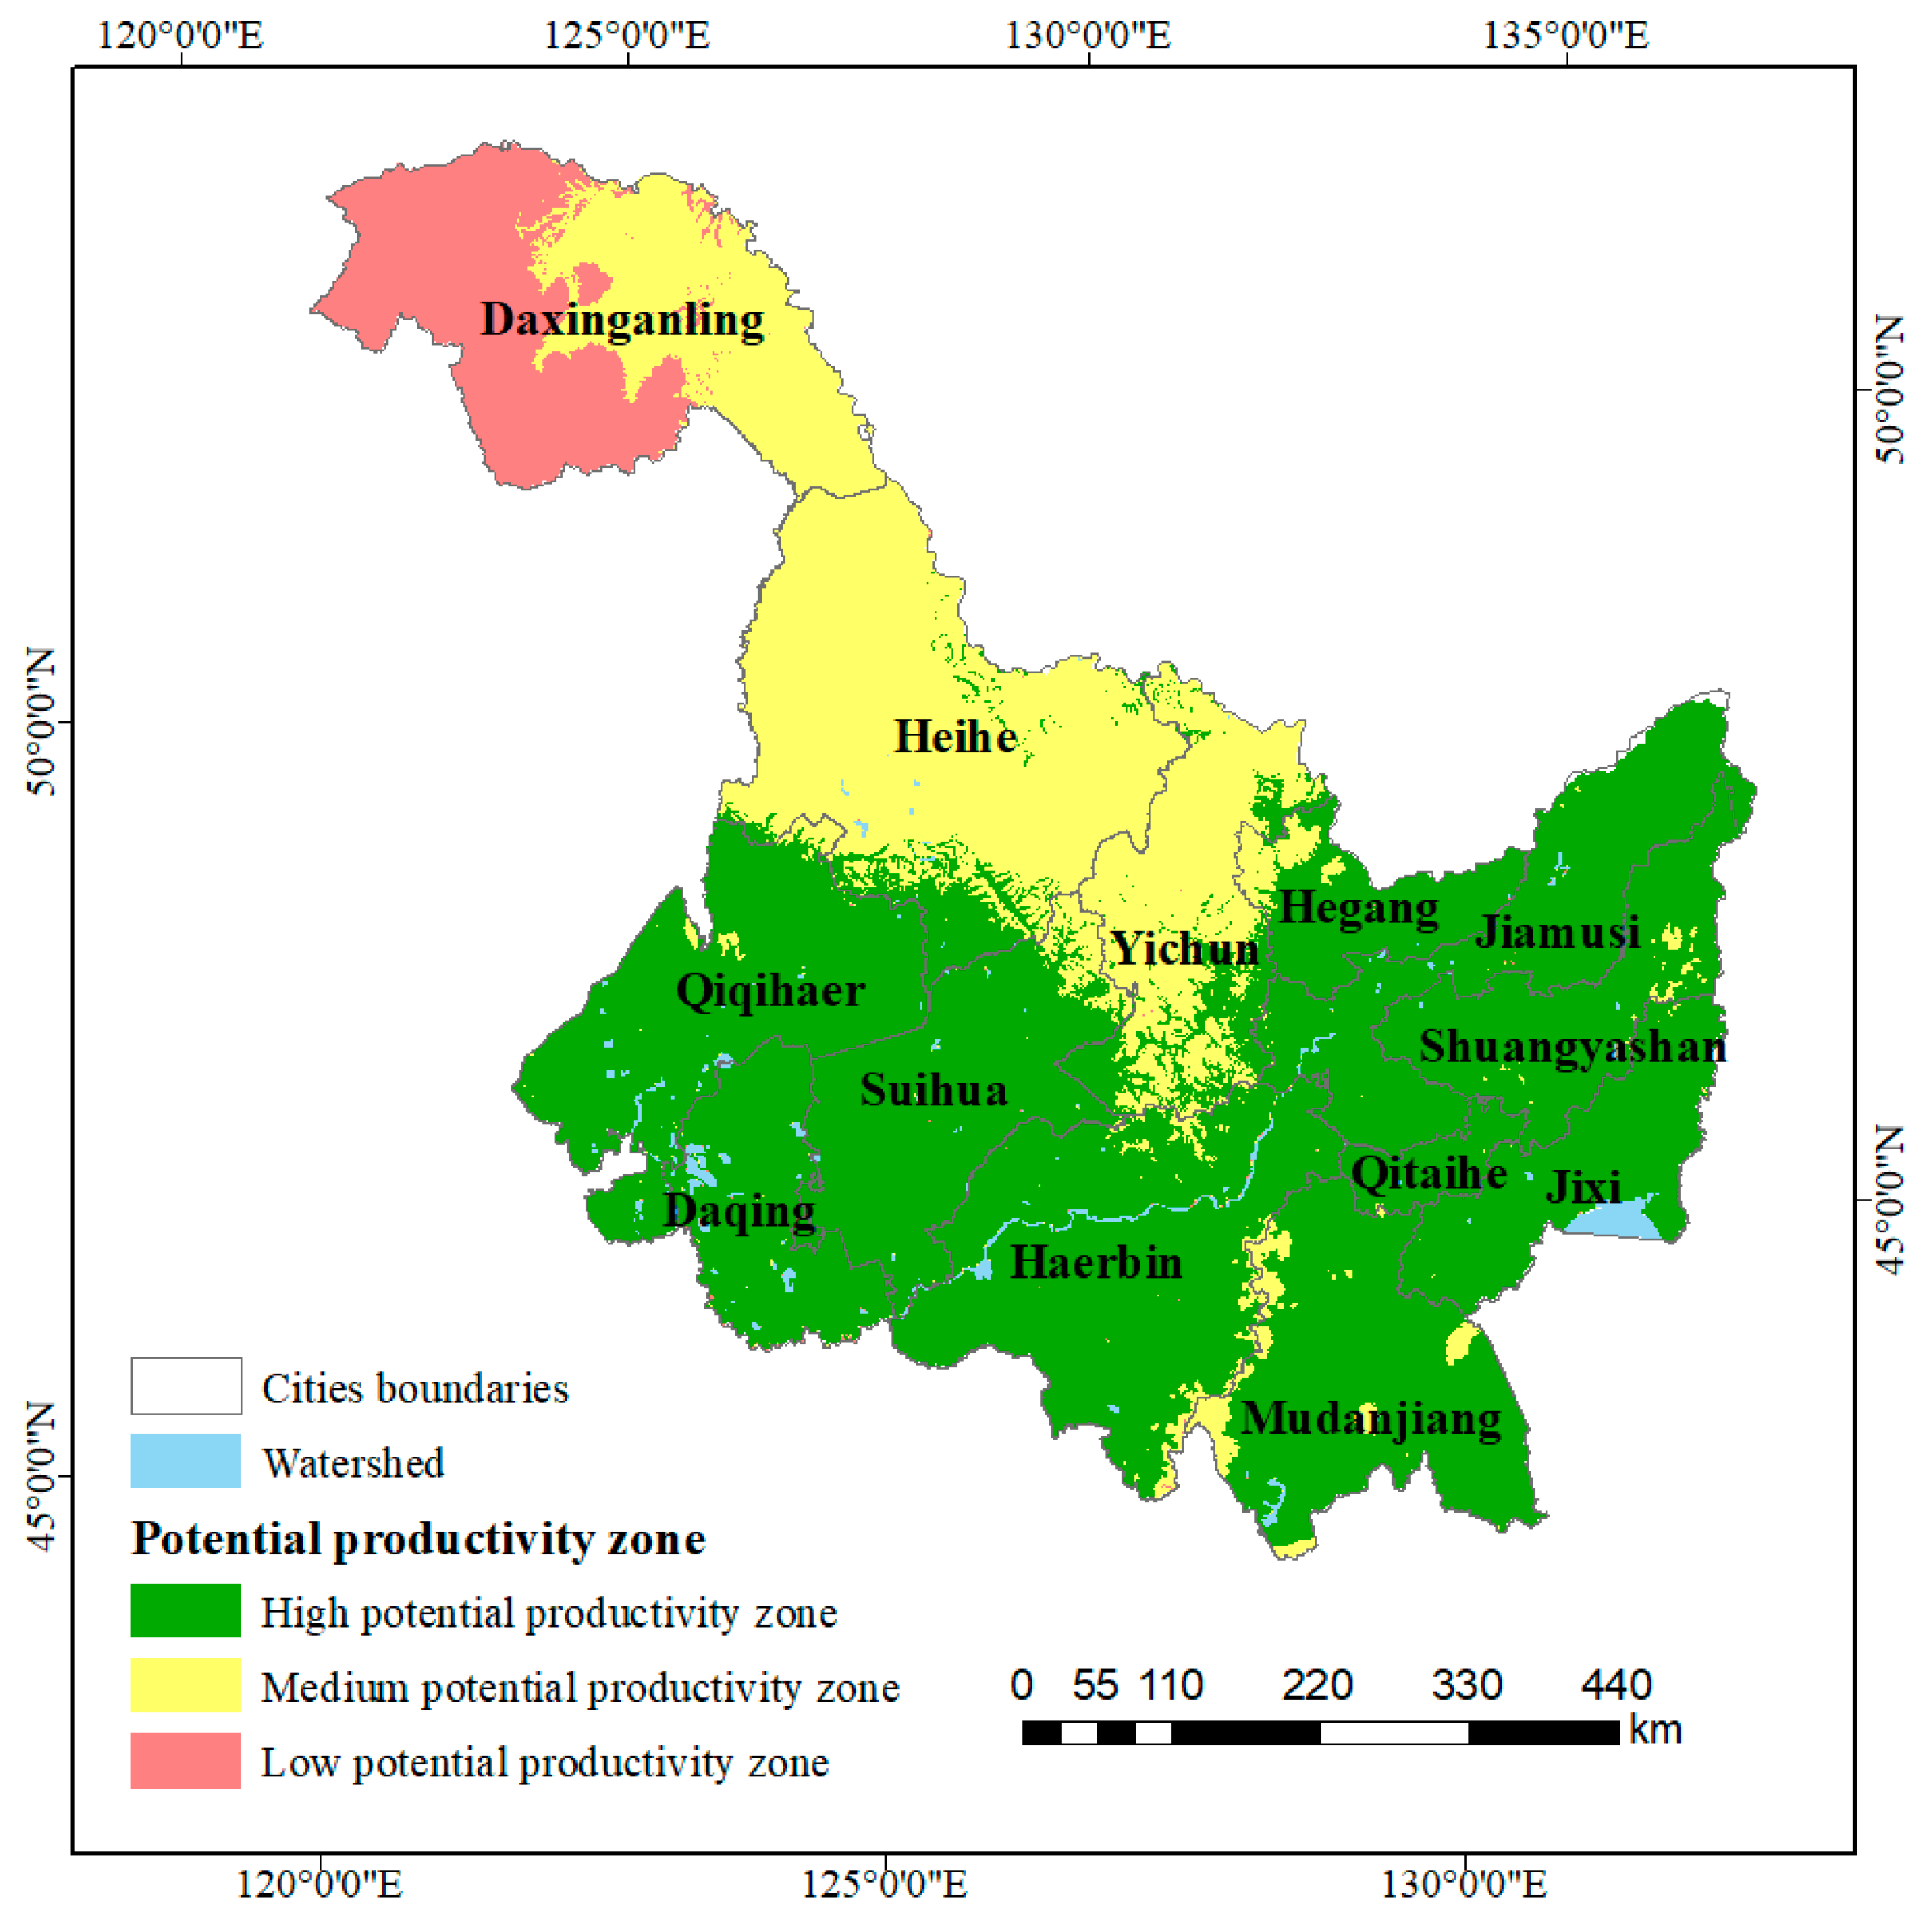
The land in Heilongjiang Province typically belongs to the high potential productivity zone, the area of which accounts for 63.53% of the total area of Heilongjiang; this is followed by the medium potential productivity zone, accounting for 28.09% of the total area of Heilongjiang, while the land area belonging to the low potential productivity zone is the lowest, accounting for only 8.38% of the total area (Figure 8). The land in the high potential productivity zone is distributed in a concentrated manner in the western and eastern regions of Heilongjiang, including Qiqihar City, Daqing City, Suihua City, Harbin City, Mudanjiang City, Qitaihe City, Jixi City, Shuangyashan City, Jiamusi City, and Hegang City, where the climate in the west is mainly in the semi-arid area of the middle temperate zone, the climate in the middle is in the semi-humid area and humid area of the middle temperate zone, and the climate in the east is in the semi-humid area of the middle temperate zone. The climate conditions of this zone are good, the terrain mostly comprises low-altitude areas, and the rock types are mainly eolian deposits, alluvial deposits, lacustrine deposits, and granites. The soil types are mainly sandy meadow chernozem, sandy meadow black soil, sandy black soil, jute sandy dark brown soil, clay meadow soil, and sandy meadow swamp soil. The groundwater in the west and east is mostly shallow, while the middle part has mostly medium depth and deep groundwater. Therefore, the land in the high potential productivity zone is suitable for farming; here, the value of agricultural potential productivity is high (above 570 g/(m2·a)). The land belonging to the medium potential productivity zone is distributed in a concentrated manner in the northwest of Heilongjiang, including Yichun City, Heihe City, and some areas of the Greater Khingan Mountains, where the climate is primarily humid in the middle temperate zone, with others falling under the semi-humid area of the middle temperate zone. The terrain is predominantly low-lying. The rock types are mainly alluvial deposits, granites, and gneisses, while the soil types are mainly sandy bottom clay meadow soil, sandy bottom meadow swamp soil, pith meadow soil, peat swamp soil, and hemp sandy dark brown soil. The groundwater level is mainly deep. There are certain restrictions in these areas for farming, and the value of agricultural land potential productivity is between 410 and 570 g/(m2·a). The land belonging to the low potential productivity zone is mainly distributed in a concentrated manner in the Greater Khingan Mountains, characterized by a cold temperate humid climate and the terrain is basically in the middle altitude area. The rock types are mainly granite, alluvial, and lacustrine deposits, while the soil types are mainly peat swamp soil and brown coniferous forest soil. The groundwater is mainly medium depth and deep groundwater. Generally, the hydrothermal and soil conditions of these areas are not suitable for farming, such that the value of agricultural potential productivity is low: mainly below 410 g/(m2·a).

4.3. Optimal Scheme for Balancing Cultivated Land Occupation and Reclamation

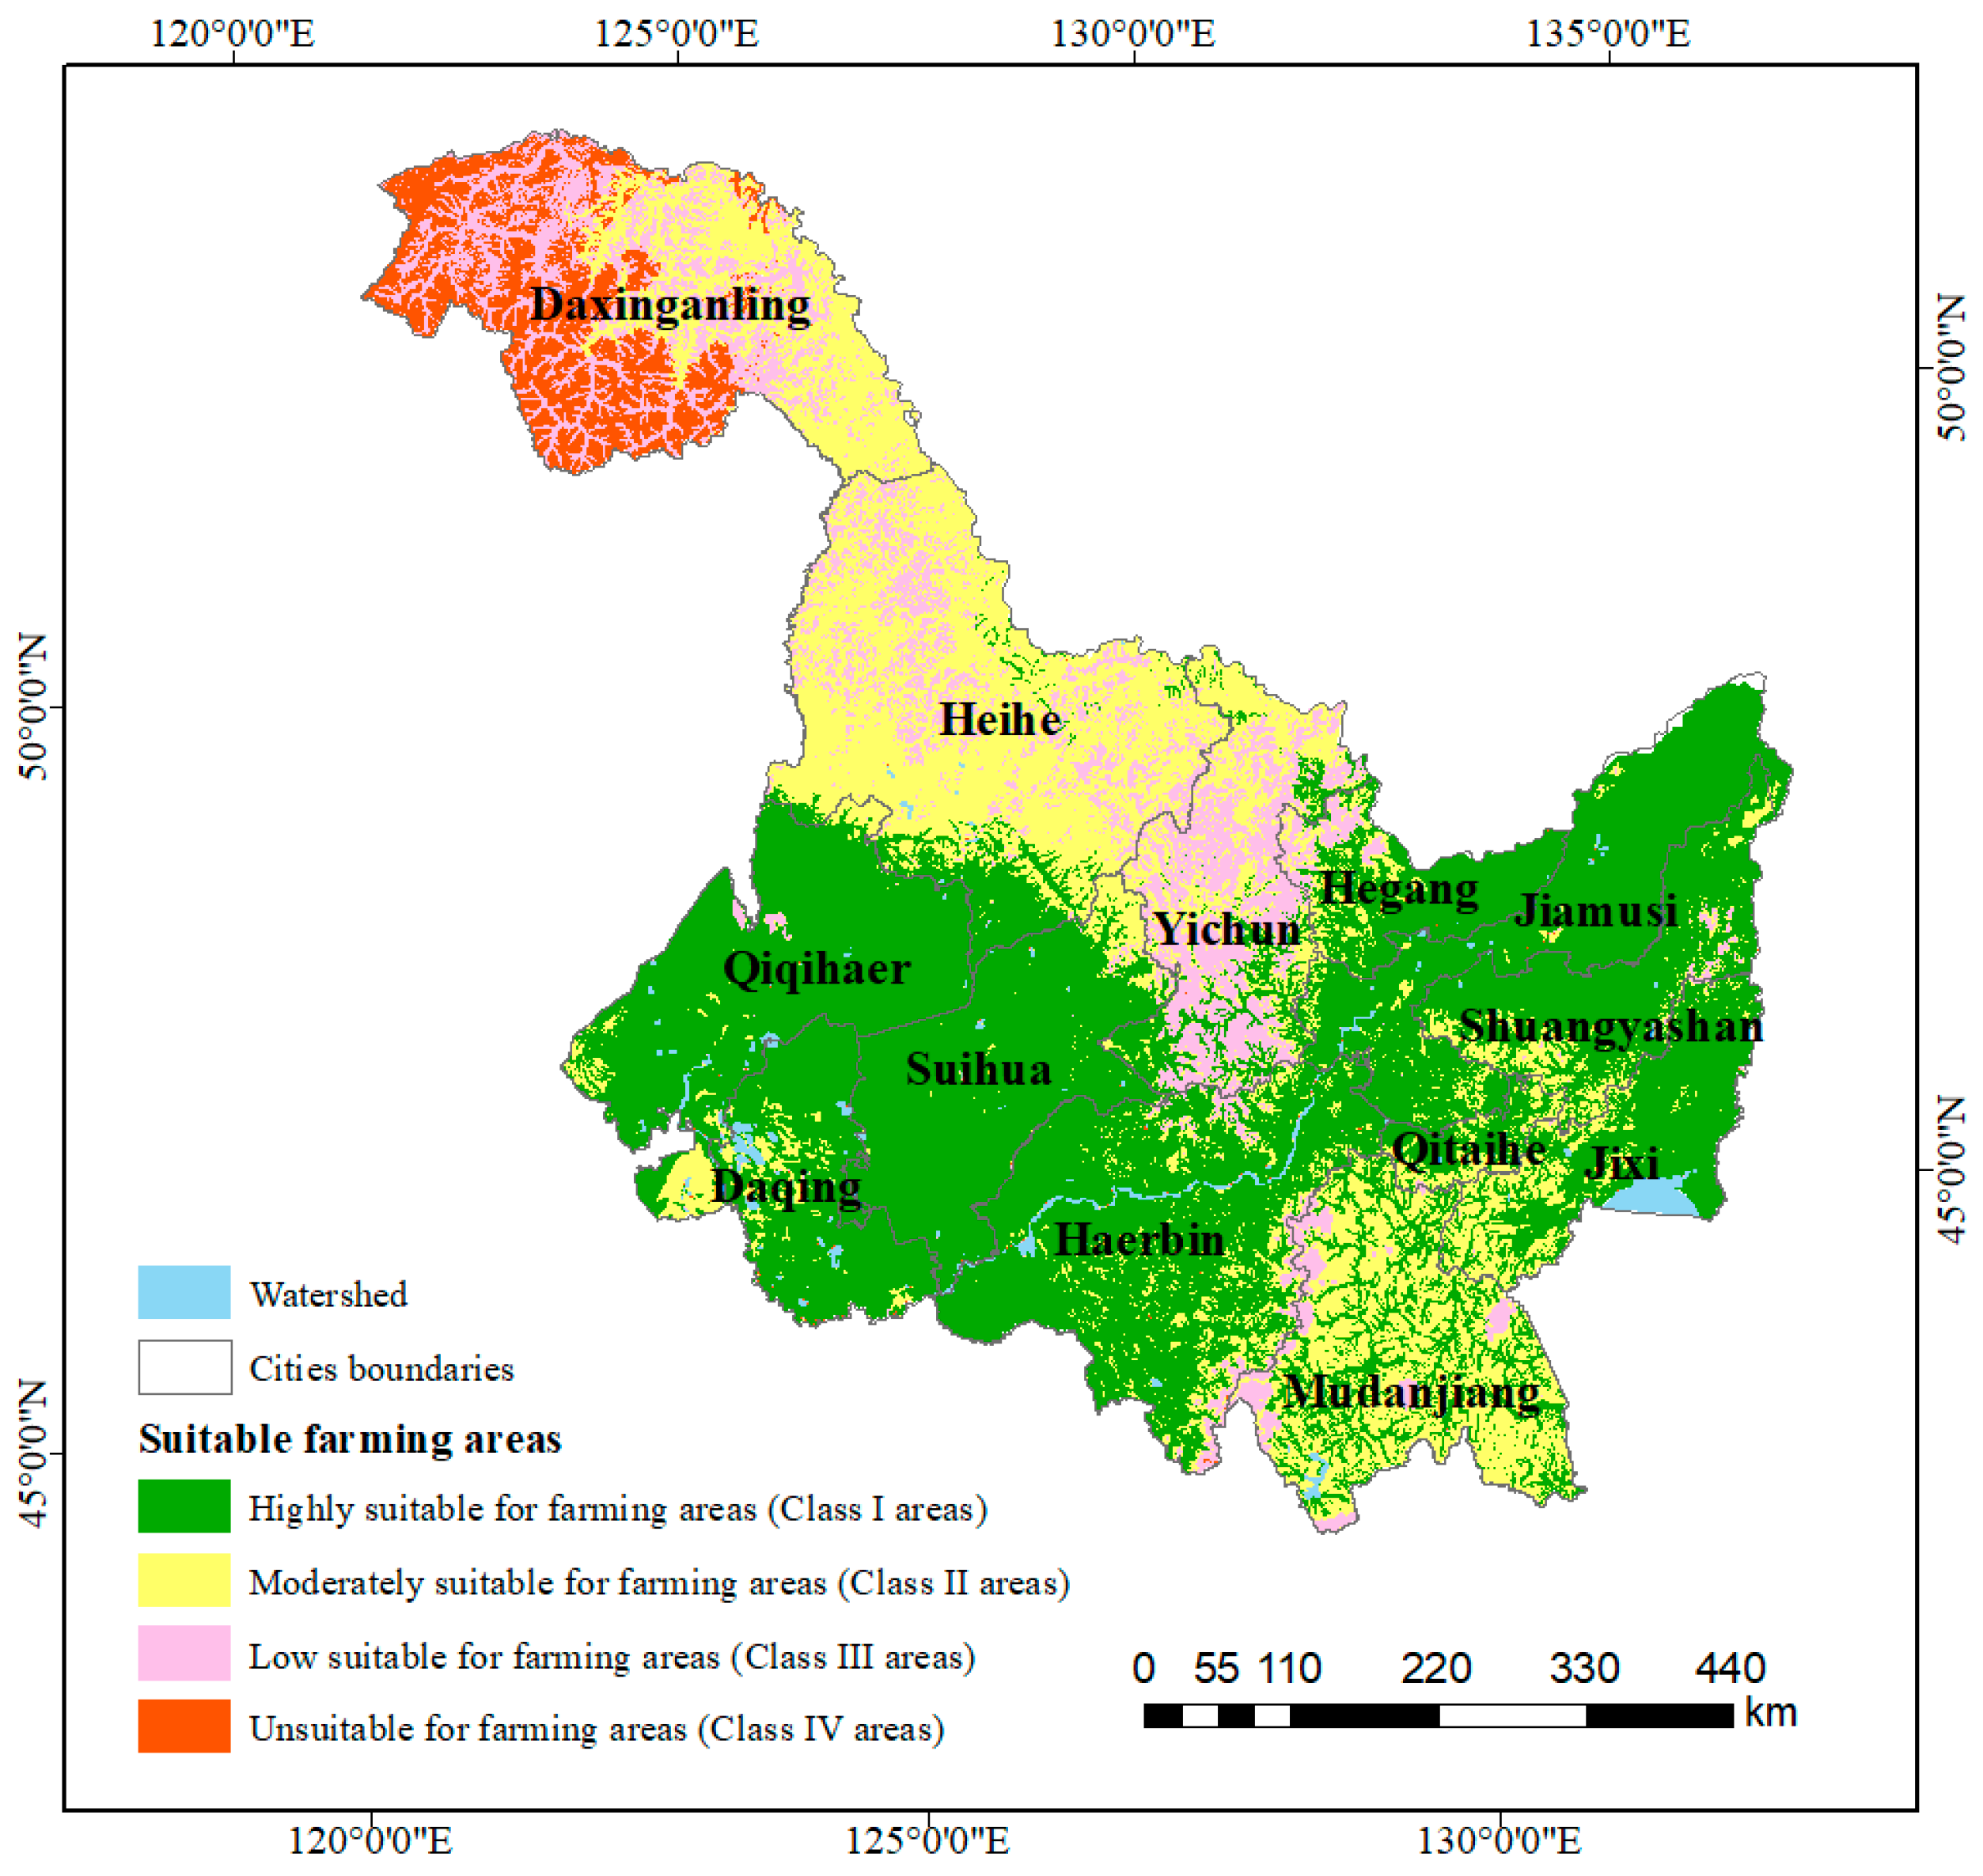
The highly suitable farming areas (Area I; Figure 9) are mainly distributed in the western and eastern regions, accounting for 52.44% of the total area of Heilongjiang. The area has high potential productivity and excellent farming conditions, with 67.24% located in the mid-temperate semi-humid area, 81.36% of the land located in plains and terraces, 95.28% of the land having a slope of less than 6°, and 89.04% of the land having an elevation of less than 300 m. The main types of rocks are alluvial, fluvial, and aeolian deposits; the main types of soil are clay meadow soil, hemp sandy dark brown soil, and sandy black soil; and the soil fertility is generally good. A total of 53.95% of the land’s groundwater depth is shallow, while 42.18% is medium to deep groundwater. More than 70% of the land has irrigation conditions, and more than 95% of the land has drainage conditions. Overall, the land in this area is very suitable for farming, with few obstacles, and can be prioritized as flexible spatial guarantee land for the “grain storage in land” policy.
The moderately suitable farming areas (Area II) are mainly distributed in the northern, central, and southern parts of Heilongjiang, accounting for 28.62% of the total area. This area is mainly a high potential productivity zone with certain limitations and a medium potential productivity zone with good farming conditions. A total of 58.77% of the moderately suitable farming area is located in the humid temperate zone, 34.37% of the land is characterized as hilly, 26.52% of the land is terraced, 45.22% of the land has a slope of less than 2°, 38.08% of the land has a slope of 2–6°, and 82.85% of the land has an elevation of less than 500 m. The main types of rocks are granite, alluvial deposits, and river deposits; the soil types are mainly hemp sandy dark brown soil, and sandy gravel bottom clay meadow soil; and the soil has high fertility. A total of 84.26% of the land has a medium to deep groundwater depth. More than 95% of the land has drainage conditions, but only 14.05% has irrigation conditions. Although there are certain limiting factors regarding the farming conditions, the land in this area can still serve as flexible spatial guarantee land for the strategic demand of “storing grain in the land”.
The low suitable farming areas (Area III) are mainly distributed in the central and some southern regions, as well as being scattered in the northern regions, accounting for 13.46% of the total area of Heilongjiang. The area is mainly in the medium potential productivity zone with certain limitations and low potential productivity zone with good farming conditions. A total of 73.96% of the climate is located in the humid zone of the middle temperate zone, 20.16% is located in the humid zone of the cold temperate zone, 41.53% of the land is characterized as hilly, 26.80% of the land covers small undulating mountains, 51.34% of the land has a slope of 2–6°, 24.52% of the land has a slope of 6–15°, and 50.50% of the land has an elevation higher than 500 m, indicating a high risk of soil erosion. The main types of rocks are granite, andesite, trachyte, and phonolite, and the soil types mainly include sandy dark brown soil, brown coniferous forest soil, and peat swamp soil. The overall salt saturation of the Greater Khingan Mountains region is relatively high, resulting in average soil fertility; 82.42% of the land’s groundwater depth is medium to deep; and 6.97% of the land generally meets irrigation conditions, while 92.36% of the land does not have irrigation conditions. There are many factors limiting farming in this area; if the arable land in the areas that are highly and moderately suitable for farming are insufficient to meet the demand for food production, the land in this area can be used as flexible spatial guarantee land for the strategic demand of the “storing grain in the land” policy.
The unsuitable farming areas (Area IV) are mainly distributed in the western region of the Greater Khingan Mountains, accounting for 5.48% of the total area of Heilongjiang. Unsuitable farming areas are mainly scattered across high, medium, and low potential productivity zones, with certain limitations that make them unsuitable for farming. A total of 74.47% of the area is located in the humid cold temperate zone, with general hydrothermal conditions compared to the first three areas. This area presents significant limitations in terms of terrain and geomorphology, with 63.72% of the land located in mountainous areas and 22.05% in hilly areas, 51.24% having slopes of 2–6°, 30.72% having slopes of 6–15°, 36.99% having elevations of 800–1500 m, and 44.19% having elevations of 500–800 m, making it relatively easy for soil erosion to occur. The main types of rocks are granite, alluvial deposits, and glacial deposits; the soil type is mainly brown coniferous forest soil; and the natural vegetation mainly comprises coniferous forests. The soil in this area has a high gravel content, low pH value, slightly acidic nature, and small soil bulk density. A total of 77.22% of the soil has slight freeze–thaw erosion, and the soil fertility is relatively poor. A total of 69.44% of the area has medium to deep groundwater; 90.79% has no irrigation conditions, and 87.20% has poor drainage conditions. Therefore, there are many natural limiting factors in this area of Heilongjiang, making it relatively unsuitable for farming.
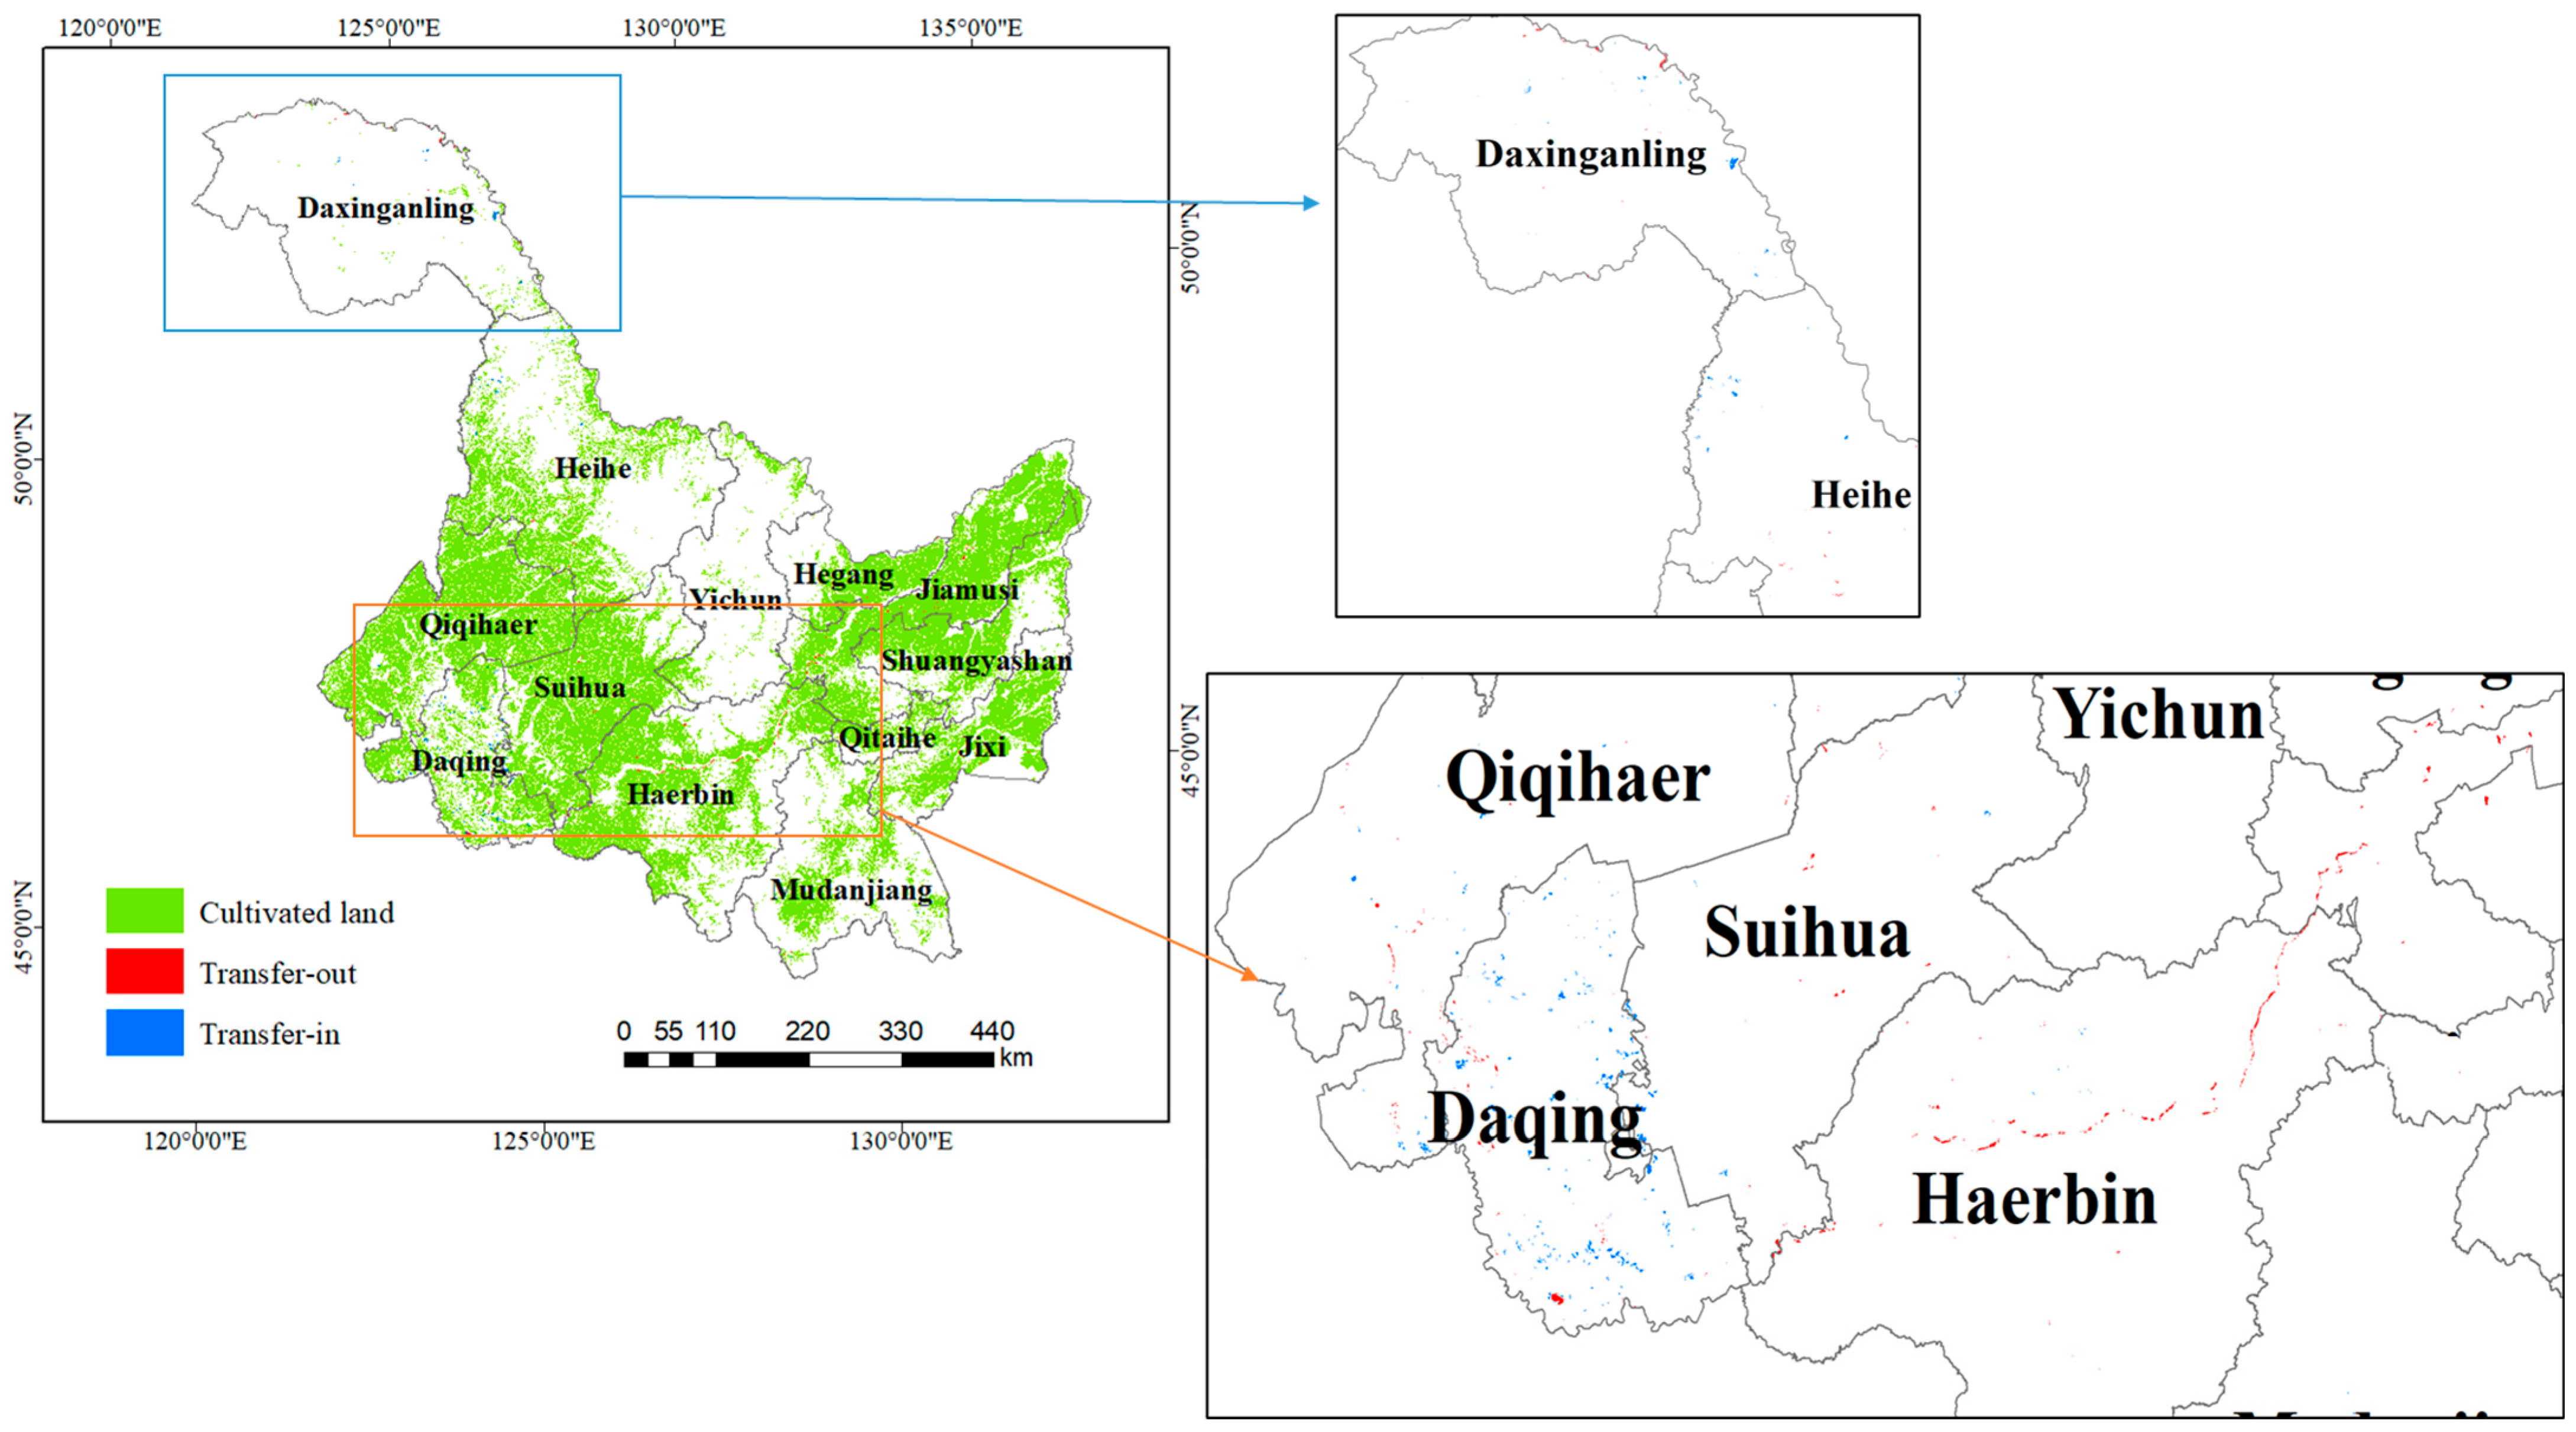
Among the current land-use types in Heilongjiang Province, 82.19% of the cultivated land belongs to the Class I areas, 16.13% belongs to the Class II areas, 1.45% belongs to the Class III areas, and 0.23% belongs to the Class IV areas. It can be seen that the cultivated land is basically located in areas with high potential productivity and less restrictive conditions. The area of cultivated land belonging to the Class IV areas is 403.01 km2; although the land in this area used as cultivated land has a certain production capacity and can help to maintain the stability of the quantity of cultivated land, there are significant limitations in cultivation, such as soil erosion, and some land is within the scope of water bodies. From the perspective of changes in the transfer of cultivated land in Heilongjiang, nearly half of these cultivated lands have undergone transfer changes since 2000. Therefore, the state of this cultivated land is unstable. It is recommended to transfer the entire area of 403.01 km2 out. To ensure the balance of cultivated land (transfer in and out), and to ensure that the quality of cultivated land is not reduced, it is necessary to gradually transfer cultivated land in according to the suitability classification level. According to the land-use types in the remote sensing monitoring database, other forest land and low-coverage grassland are considered as the transferred-in land types, with areas of 18.95 km2 and 230.85 km2 in the Class I areas, respectively. These two land-use types in the Class II areas are considered to be transferred in, with areas of 123.74 km2 and 39.65 km2. Overall, these two types are transferred in with a total transferred area of 413.19 km2 (Figure 10). The cultivated land after this adjustment is entirely located in suitable cultivation areas, imposing fewer restrictions for farming.

5. Discussion

5.1. Analysis of Agricultural Potential Productivity of Different Land Types

The third land-class land-type units, as the lowest level classification units, were used to determine the agricultural potential productivity values for different land types. Due to the large number of land-type units, the third land-class land-type units with an area ratio of over 1.00% in the study area were analyzed (Table 4). From the perspective of land-type units, the potential productivity of Heilongjiang Province in the middle temperate semi-humid area (C022) is generally higher than that for other types of units. The middle and deep groundwater–granite sandy dark brown soil–middle temperate humid zone uplift/erosion flow low-altitude small undulating mountains (C022T31130GIA1S23051H02) have high soil organic matter and relatively high potential productivity value, due to the associated rock types and soil types, compared with other types of units. The middle and deep groundwater–granite brown coniferous forest soil–cold temperate humid zone uplift/erosion periglacial small undulating mountain (C011T42220GIA1S23115H02) is in the cold temperate humid area, where the soil is low in available nutrients, such that the potential productivity value is low. Overall, the calculation results of the potential productivity value basically conform to the basic characteristics of the corresponding attributes of land type units.

5.2. Policy Implications for Balancing Cultivated Land Occupation and Reclamation

The construction of a land-type classification system is a complex process, integrating multi-source territorial spatial information data and various existing classification results. However, in the process of land-type classification, due to many difficulties in data collection, different levels of old and new data, and problems such as differences in the application time of the data, it is suggested to establish relevant standards for land-type classification, as well as integrating land resources and multi-departmental resources to improve the classification results. Additionally, it is important to fully leverage the unit attributes of land types, develop systems for the application of land-type classification results, and enhance the practical value of the classification results in the application of the balancing cultivated land occupation and reclamation policy. According to the optimal allocation of cultivated land use in this study, Area I, Area II, and Area III can all be used as flexible spaces to guarantee efficient land use. Therefore, to control the balanced occupation and reclamation of cultivated land, cultivated land indicators can be allocated according to local conditions in the potential productivity zone, following the principle of “make up first and occupy later”, allowing for reasonable implementation of the cultivated land-use control system. It is suggested to establish a balanced management mechanism for cultivated land occupation and reclamation, in order to further promote the implementation of the cultivated land-use control system.
It is suggested to establish a dynamic supervision system for the management of cultivated land occupation and reclamation balancing, conduct long-term annual monitoring, update and assess the use of cultivated land, and controlling the irrational use of cultivated land resources in a timely manner to avoid the phenomenon of misallocation of cultivated land resources, which can effectively improve the level of cultivated land use and help make corresponding science-based decisions. In the supervision system, it is necessary not only to monitor the status quo of cultivated land utilization but also to monitor and track the natural attributes of the land—such as climate, soil properties, and hydrological conditions—and record man-made field management measures simultaneously. The establishment of a supervision system can allow full use to be made of space technology, sensors, the Internet, and other advanced technologies for data collection, analysis and management, and transmission, as well as sharing the data with the relevant cultivated land management departments. In addition, professional technical and management personnel should be trained to regularly manage and maintain the supervision system, providing technical support for the protection and utilization of cultivated land.

5.3. Innovation, Limitations, and Prospects for Future Studies

This study identified the following innovations: (1) from the perspective of the components of the land system, starting from the ideas of the main controlling factors, relative stability factors, and dynamic factors, this study added geological and hydrological factors and established a provincial-level land-type classification system for the protection and utilization of cultivated land; (2) to break through the bottleneck of land types, which have traditionally been difficult to popularize and apply, the land types connected to suitable arable zoning management and a potential control system for balancing cultivated land occupation and reclamation were evaluated from the perspective of agricultural potential productivity; (3) in this empirical study on Heilongjiang Province, a major grain-producing province, the results of land types directly reflected the natural background, and applying the land-type classification results in management practice could guide and optimize the current mismatch of cultivated land and improve the level of cultivated land management. The ideas and methods covered in this study can be expanded to other provinces in China, providing useful insights for implementing cultivated land occupation and reclamation balancing policy in such provinces. However, due to the different natural environmental factors in different provinces, there may be differences in the selection of factors and the determination of weights for the calculation of potential productivity.
However, there are some shortcomings in this study. In the classification of land types, the various classification indicators and their adopted layers may cause our results of land-type classification to present a certain degree of subjectivity due to their different classification bases. In terms of research ideas, this study does not directly take the current situation of cultivated land use as the research object; therefore, the impact of human factors on land use is not considered. In fact, in the process of cultivated land use in Heilongjiang, due to its geographical location, natural factors have a great impact on the potential productivity of the land. At present, we are pursuing the mode of sustainable development, and the paradigm of this study is in line with this concept. In addition, the implementation of the balancing cultivated land occupation and reclamation policy is based on taking the county unit as the basic unit; meanwhile, this study focuses on macro-control at the provincial level. At present, there are many problems that are difficult to solve regarding the implementation of the policy at the county level. The most important thing is the determination of the transferred-in plots [69]. Therefore, the scope of this study can be expanded, and carrying out cultivated land occupation and reclamation balancing at the provincial level will be an important direction for the implementation of future work. In this framework, this study does not consider the balancing of ecosystem services, natural recharge, or the economic and esthetic/environmental value of forest lands. In a follow-up study, we intend to pay attention to the timing arrangement of the cultivated land occupation and reclamation balance at the cross-county level in the province, consider artificial amelioration actions, and combine ecosystem services and landscapes to further promote the efficient and sustainable cultivation of farmland.

6. Conclusions

This study focused on the main research theme of “provincial-level land-type classification–agricultural land potential productivity calculation–optimal paths of balancing cultivated land occupation and reclamation”. Based on a traditional land-type classification approach, starting from the constituent elements and their relationships with the land system, and following the ideas of main controlling factors, relative stability factors, and dynamic factors, from five dimensions—climate conditions, geomorphic condition, geological condition, soil condition, and hydrological condition—a three-level system for land-type classification at the provincial level was established (comprising first, second, and third land-classes). Based on the land types, the agricultural potential productivity was calculated, and three potential zones were formed. Combined with the degree of suitability for farming regarding the potential productivity indicators, Heilongjiang was divided into Area I (highly suitable for farming), Area II (moderately suitable for farming), Area III (low suitability for farming), and Area IV (unsuitable for farming areas). Area I comprises priority areas for ensuring the flexible spatial use of cultivated land, while Area II and Area III comprise areas considered as flexible spaces for the strategic implementation of cultivated land. According to the rules of balancing cultivated land occupation and reclamation, the cultivated land in Area IV should be transferred out. The potential productivity of cultivated land within the province was shown to improve after the proposed adjustments. Differentiated management measures have been proposed for the planning of cultivated land occupation and reclamation balancing, providing a reference for implementation of the cultivated land occupation and reclamation balance policy at the provincial level, which is of great significance for maintaining the quantity of cultivated land and ensuring food security.

Author Contributions

Conceptualization, Y.L., K.W. and W.Z.; methodology, Y.L., X.L. (Xiaoliang Li) and X.L. (Xiao Li); formal analysis, Y.L. and X.L. (Xiaoliang Li); funding acquisition, Y.L. and K.W.; software, Y.L., X.L. (Xiaoliang Li) and X.L. (Xiao Li); original draft, Y.L.; review and editing, Y.L., X.L. (Xiaoliang Li), X.L. (Xiao Li) and R.Z. All authors have read and agreed to the published version of the manuscript.

Funding

This study was funded by the General Project of Philosophy and Social Science Research in Colleges and Universities in Jiangsu Province (2023SJYB2055) and the National Natural Science Foundation of China (42171261 and 42401307).

Institutional Review Board Statement

Not applicable.

Data Availability Statement

The data that support the findings of this study are available from the corresponding author upon reasonable request.

Acknowledgments

This study was supported by the “Geographic Data Sharing Infrastructure, Geographic Data Sharing Infrastructure, Resource and Environment Science and Data Center” (http://www.resdc.cn) and “Geospatial Data Cloud site, Computer Network Information Center, Chinese Academy of Sciences” (http://www.gscloud.cn), who provided data support.

Conflicts of Interest

The authors declare on conflicts of interest.

References

  1. Han, H.B.; Zhang, X.Y. Exploring environmental efficiency and total factor productivity of cultivated land use in China. Sci. Total Environ. 2020, 726, 138434. [Google Scholar] [CrossRef] [PubMed]
  2. Liu, J.J.; Zhong, X.P. The practice, problems and improvement strategies of China’s food security emergency guarantee mechanism: A case study of Henan rainstorm disaster response. Issues Agric. Econ. 2024, 7, 34–47. [Google Scholar]
  3. Fei, R.; Lin, Z.; Chunga, J. How land transfer affects agricultural land use efficiency: Evidence from China’s agricultural sector. Land Use Policy 2021, 103, 105300. [Google Scholar] [CrossRef]
  4. Long, H.L.; Kong, X.B.; Hu, S.G.; Li, Y.R. Land use transitions under rapid urbanization: A perspective from developing China. Land 2021, 10, 935. [Google Scholar] [CrossRef]
  5. Wang, M.M.; Jiang, Z.Z.; Li, T.B.; Yang, Y.C.; Jia, Z. Analysis on absolute conflict and relative conflict of land use in Xining metropolitan area under different scenarios in 2030 by PLUS and PFCI. Cities 2023, 137, 104314. [Google Scholar]
  6. Yan, H.T.; Chen, H.; Wang, F.; Qiu, L.J.; Li, R. Early warning and management measures for the non-agriculturalization of cultivated land in Shaanxi Province of China based on a patch-generated land use simulation Model. Agriculture 2025, 15, 672. [Google Scholar] [CrossRef]
  7. Li, Y.H.; Li, Y.R.; Westlund, H.; Liu, Y.S. Urban-rural transformation in relation to cultivated land conversion in China: Implications for optimizing land use and balanced regional development. Land Use Policy 2015, 47, 218–224. [Google Scholar] [CrossRef]
  8. Kong, X.B. Transition objectives, contents and ways of cultivated land protection in China under the background of rehabilitation system. J. Soc. Sci. Hunan Normal Univ. 2021, 50, 1–12. [Google Scholar]
  9. Hossain, A.; Krupnik, T.J.; Timsina, J.; Mahboob, M.G.; Chaki, A.K.; Farooq, M.; Bhatt, R.; Fahad, S.; Hasanuzzaman, M. Agricultural land degradation: Processes and problems undermining future food security. In Environment, Climate, Plant and Vegetation Growth; Fahad, S., Hasanuzzaman, M., Alam, M., Ullah, H., Saeed, M., Khan, I.A., Adnan, M., Eds.; Springer: Cham, Switzerland, 2020. [Google Scholar]
  10. Luo, X.L.; Yang, R.; Xu, Q. Spatial mismatch evolution of global population and food and its influencing factors. J. Nat. Resour. 2021, 36, 1381–1397. [Google Scholar] [CrossRef]
  11. Hu, Q.; Wu, W.B.; Xiang, M.T.; Chen, D.; Long, Y.Q.; Song, Q.; Liu, Y.Z.; Lu, M.; Yu, Q.Y. Spatio-temporal changes in global cultivated land over 2000–2010. Sci. Agric. Sin. 2018, 51, 1091–1105. [Google Scholar]
  12. Chen, G.Z.; Li, X.; Liu, X.P.; Chen, Y.M.; Liang, Y.; Leng, J.Y.; Xu, X.C.; Liao, W.L.; Qiu, Y.A.; Wu, Q.L.; et al. Global projections of future urban land expansion under shared socioeconomic pathways. Nat. Commun. 2020, 11, 537. [Google Scholar] [CrossRef] [PubMed]
  13. Li, H.H.; Song, W. Spatial transformation of changes in global cultivated land. Sci. Total Environ. 2023, 859, 160194. [Google Scholar] [CrossRef]
  14. Liu, Y.; Fang, F.; Li, Y. Key issues of land use in China and implications for policy making. Land Use Policy 2014, 40, 6–12. [Google Scholar] [CrossRef]
  15. Huang, W.J. An analysis on the implementation path of cultivated land “access-exit balance” policy. Res. Guide 2022, 6, 20. [Google Scholar]
  16. Liang, K.Y.; Jin, X.B.; Wang, S.L.; Ying, S.C.; Qi, Z.; Zhou, Y.K. Control of balancing cultivated land conversion by integrating “homogeneous equivalence” and “loss-supplement balance”: Methodology and empirical study. China Land Sci. 2023, 37, 77–88. [Google Scholar]
  17. Su, Y.; Qian, K.; Lin, L.; Wang, K.; Guan, T.; Gan, M.Y. Identifying the driving forces of non-grain production expansion in rural China and its implications for policies on cultivated land protection. Land Use Policy 2020, 92, 104435. [Google Scholar] [CrossRef]
  18. Song, M.; Peng, J.Y.; Yi, L.P.; Fu, J.H. Quantity and quality balance of farmland in Hubei Province in the context of compensation for comprehensive occupation and its impact on grain production capacity. China Popular. Resour. Environ. 2024, 34, l173–186. [Google Scholar]
  19. Wang, Y.; Zeng, X.; Liu, Z.Y.; Dong, S.Z.; Jiang, Y.T. Determinants of the spatiotemporal differentiation of cultivated land non-grain conversion in Liaoning Province: The role of multiple stakeholder decisions. Res. Sci. 2023, 45, 980–993. [Google Scholar] [CrossRef]
  20. Foley, J.A.; Ramankutty, N.; Brauman, K.A.; Cassidy, E.S.; Gerber, J.S.; Johnston, M.; Mueller, N.D.; O’Connell, C.; Ray, D.K.; West, P.C.; et al. Solutions for a cultivated planet. Nat. Int. Weekly J. Sci. 2011, 478, 337–342. [Google Scholar] [CrossRef]
  21. Li, F.P.; Liu, W.; Lu, Z.B.; Mao, L.C.; Xiao, Y.H. A multi-criteria evaluation system for arable land resource assessment. Environ. Monit. Assess. 2020, 192, 79. [Google Scholar] [CrossRef]
  22. Wang, W.M. Historical review and prospect of land science discipline construction in China. China Land Sci. 2001, 15, 22–27. [Google Scholar]
  23. Shen, Y.C. Studies on land types: Academic significance function and prospect. Geogr. Res. 2010, 29, 575–583. [Google Scholar]
  24. Bourne, R. Regional survey and its relation to stocktaking of the agricultural and forest resources of the British Empire. Geogr. J. 1932, 79, 341. [Google Scholar]
  25. Christian, C.S.; Stewart, G.A. Methodology of integrated surveys: Aerial surveys and integrated surveys. In Proceedings of the Touluase Conference, UNESCO, Paris, France, 30 October 1968. [Google Scholar]
  26. Zonneveld, I.S. Land Evaluation and Land (Scape) Science. ITC Textbook of Photo-Interpretation; ITC: Enschede, The Netherlands, 1979. [Google Scholar]
  27. Cleland, D.T.; Avers, P.E.; McNab, W.H.; Jensen, M.E. National hierarchical framework of ecological units. In Ecosystem Management Applications for Sustainable Forest and Wildlife Resources; Boyce, M.S., Haney, A., Eds.; Yale University Press: New Haven, CT, USA, 1997; pp. 181–200. [Google Scholar]
  28. NRCS. Land Resource Regions and Major Land Resource Areas of the United States, the Caribbean, and the Pacific Basin; NRCS Agricultural Handbook 296; USDA: Washington, DC, USA, 2006. [Google Scholar]
  29. Salley, S.W.; Curtis, M.H.; Brown, J.R. Completing the land resource hierarchy. Rangelands 2016, 38, 313–317. [Google Scholar] [CrossRef]
  30. Canada Statistics. National Ecological Framework for Canada; Research Branch Agriculture and Agri-Food Canada: Ottawa, ON, Canada, 2017; ISBN 978-0-660-24501-0. [Google Scholar]
  31. Zhao, S.Q.; Shen, Y.C. The land classification system (draft) of 1/1 million and 1/200,000 land type maps of key provinces (autonomous regions) in China. Nat. Resour. 1980, 3, 13–24. [Google Scholar]
  32. Bailey, R.G. Ecoregions Map of North America: Explanatory Note: US Department of Agriculture; USDA Forest Service: Washington, DC, USA, 1998. [Google Scholar]
  33. Capotorti, G.; Guida, D.; Siervo, V.; Smiraglia, D.; Blasi, C. Ecological classification of land and conservation of biodiversity at the national level: The case of Italy. Biol. Conserv. 2012, 147, 174–183. [Google Scholar] [CrossRef]
  34. Bestelmeyer, B.T.; Tugel, A.J.; Peacock, G.L., Jr.; Robinett, D.G.; Shaver, P.L.; Brown, J.R.; Herrick, J.E.; Sanchez, H.; Havstad, K.M. State-and-transition models for heterogeneous landscapes: A strategy for development and application. Rangeland Ecol. Manag. 2009, 62, 1–15. [Google Scholar] [CrossRef]
  35. Grondin, P.; Gauthier, S.; Borcard, D.; Bergeron, Y.; Noël, J. A new approach to ecological land classification for the Canadian boreal forest that integrates disturbances. Landsc. Ecol. 2014, 29, 1–16. [Google Scholar] [CrossRef]
  36. Lü, Y.H.; Hu, J.; Fu, B.J.; Harris, P.; Wu, L.H.; Tong, X.L.; Bai, Y.F.; Comber, A.J. A framework for the regional critical zone classification: The case of the Chinese Loess Plateau. Nati. Sci. Rev. 2019, 6, 14–18. [Google Scholar] [CrossRef]
  37. Zhang, G.H.; Song, X.D.; Wu, K.N. A classification scheme for Earth’s critical zones and its application in China. Sci. China Earth Sci. 2021, 51, 1681–1692. [Google Scholar] [CrossRef]
  38. Batchelor, W.D.; Basso, B.; Paz, J.O. Examples of strategies to analyze spatial and temporal yield variability using crop models. Eur. J. Agron. 2002, 18, 141–158. [Google Scholar] [CrossRef]
  39. Van Ittersum, M.K.; Leffelaar, P.A.; van Keulen, H.; Kropff, M.J.; Bastiaans, L.; Goudriaan, J. On approaches and applications of the Wageningen crop models. Eur. J. Agron. 2003, 18, 201–234. [Google Scholar] [CrossRef]
  40. Xie, J.Q.; Cai, Y.M.; Zheng, Z.Y.; Lin, P. AEZ-based assessment for food productivity potential of cultivated land in China. China Land Sci. 2004, 18, 31–37. [Google Scholar]
  41. Gao, W.B.; Jiang, D.; Yang, X.H. Cultivated land potential production model and application driven by RS information. Prog. Geog. 2009, 28, 119–124. [Google Scholar]
  42. Li, X.L.; Wu, K.N.; Chu, X.X.; Yang, Q.J.; Zhang, X.D.; Hao, S.H. Research progress and prospects for cultivated land productivity evaluation. China Land Sci. 2019, 33, 91–100. [Google Scholar]
  43. Liu, L.M.; Zhou, D.; Chang, X.; Lin, Z.L. A new grading system for evaluating China’s cultivated land quality. Land Degrad. Dev. 2020, 31, 1482–1501. [Google Scholar] [CrossRef]
  44. Yang, S.L.; Bai, Y.; Alatlo, J.M.; Wang, H.M.; Tong, J.P.; Liu, G.; Zhang, F.; Chen, J.Y. Spatial–temporal pattern of cultivated land productivity based on net primary productivity and analysis of influencing factors in the Songhua River basin. Land Degrad. Dev. 2022, 33, 1917–1932. [Google Scholar] [CrossRef]
  45. Turner, B.L.; Meyer, W.B. Land use and land cover in global environmental change: Considerations for study. Int. Soc. Sci. J. 1991, 43, 669. [Google Scholar]
  46. Yang, S.H.; Zhang, G.L. What is the Critical Zone? Sci. News 2021, 73, 33–36+4. [Google Scholar]
  47. Naylor, L.A.; Dungait, J.A.J.; Zheng, Y.; Buckerfield, S.; Green, S.M.; Oliver, D.M.; Liu, H.Y.; Peng, J.; Tu, C.L.; Zhang, G.L.; et al. Achieving sustainable earth futures in the Anthropocene by including local communities in critical zone science. Earth’s Future 2023, 11, e2022EF003448. [Google Scholar] [CrossRef]
  48. Qiu, B.J. Mr. Kezhen Zhu and China’ s climatic zone. J. Southwest Techers Univ. 1986, 3, 79–84. [Google Scholar]
  49. Li, Z.; Zhang, M.L.; Zhang, Y.C.; Lin, C.W.; Zheng, J.L.; Wang, S.T.; Zhou, Y.P. Landscape pattern characteristics of mountain land types–taking the Fuping County, Hebei Province as an example. For. Ecol. Sci. 2021, 36, 254–261. [Google Scholar]
  50. Guan, L.Z. General Soil Science; China Agriculture Press: Beijing, China, 2016. [Google Scholar]
  51. Bredehoeft, J.D.; Papadopulos, S.S.; Cooper, H.H., Jr. Scientific Basis of Water Resources Management; National Academy Press: Washington, DC, USA, 1982. [Google Scholar]
  52. Liu, Y.N.; Wu, K.N.; Li, X.L.; Li, X. Land-type classification at provincial level based on GIS and Fuzzy SOFM Model: A case study of Henan Province. China Land Sci. 2021, 35, 112–122. [Google Scholar]
  53. Ni, S.X. Introduction to Land Types and Land Evaluation, 3rd ed.; Higher Education Press: Beijing, China, 2009. [Google Scholar]
  54. Zhu, H.Z.; Wang, J.L.; Zhong, H.P.; Zhou, L.L.; Yang, H.; Liu, Q. Concept of building multi-level classification system framework for land type based on grid. J. Geo-Inf. Sci. 2015, 17, 783–788. [Google Scholar]
  55. Li, D.; Wang, S.; Zhou, J.; Qiao, W.H.; Song, Y.J. Spatial pattern evolution characteristics of cultivated land conversion in Heilongjiang province. J. Nat. Sci. Hunan Normal Univ. 2022, 45, 81–89. [Google Scholar]
  56. Zaks, D.P.M.; Ramankutty, N.; Barford, C.C.; Foley, J.A. From Miami to Madison: Investigating the relationship between climate and terrestrial net primary production: Climatic controls of NPP. Glo. Biogeochem. Cycles 2007, 21, GB3004. [Google Scholar]
  57. Xu, Y.Q.; Zhou, B.T.; Yu, L.; Xu, Y. Climatic potential productivity and population carrying capacity in China from 1961 to 2010. J. Meteorol. Environ. 2019, 35, 84–91. [Google Scholar]
  58. Kong, X.B. Practice of Regional Cultivated Land Quantity Control and Quality Improvement; Science Press: Beijing, China, 2014. [Google Scholar]
  59. Wu, Q.T. Environmental Soil Science; China Agricultural Press: Beijing, China, 2015. [Google Scholar]
  60. Makovníková, J.; Širáň, M.; Houšková, B.; Pálka, B.; Jones, A. Comparison of different models for predicting soil bulk density. Case study–Slovakian agricultural soils. Int. Agrophys. 2017, 31, 491–498. [Google Scholar] [CrossRef]
  61. Stiglitz, R.Y.; Mikhailova, E.A.; Sharp, J.L.; Post, C.J.; Schlautman, M.A.; Gerard, P.D.; Cope, M.P. Predicting soil organic carbon and total nitrogen at the farm scale using quantitative color sensor measurements. Agronomy 2018, 8, 212. [Google Scholar] [CrossRef]
  62. TD/T 1055—2019; Technical Regulation of the Third Nationwide Land Survey. Standards Press of China: Beijing, China, 2019.
  63. GB/T 28407—2012; Regulation for Gradation on Agriculture Land Quality. Standards Press of China: Beijing, China, 2012.
  64. NY/T 1634—2008; Rules for Soil Quality Survey and Assessment. Standards Press of China: Beijing, China, 2008.
  65. SL 190—2007; Standards for Classification and Gradation of Soil Erosion. Standards Press of China: Beijing, China, 2007.
  66. GB/T33469—2016; Cultivated Land Quality Grade. Standards Press of China: Beijing, China, 2016.
  67. Zheng, J.Y.; Bian, J.J.; Ge, Q.S.; Hao, Z.X.; Yi, Y.H.; Liao, Y.M. The climate regionalization in China for 1981–2010. Chinese Sci. Bull. 2013, 58, 3088–3099. [Google Scholar]
  68. Zhou, C.H.; Cheng, W.M.; Qian, J.K.; Li, B.Y.; Zhang, B.P. Research on the classification system of digital land geomorphology of 1:1000000 in China. J. Geo-Inf. Sci. 2009, 11, 707–724. [Google Scholar]
  69. Fu, J. The key and difficult points and suggestions for the work of cultivated land “access-exit balance”. Rural Sci. Technol. 2022, 3, 31–34. [Google Scholar]
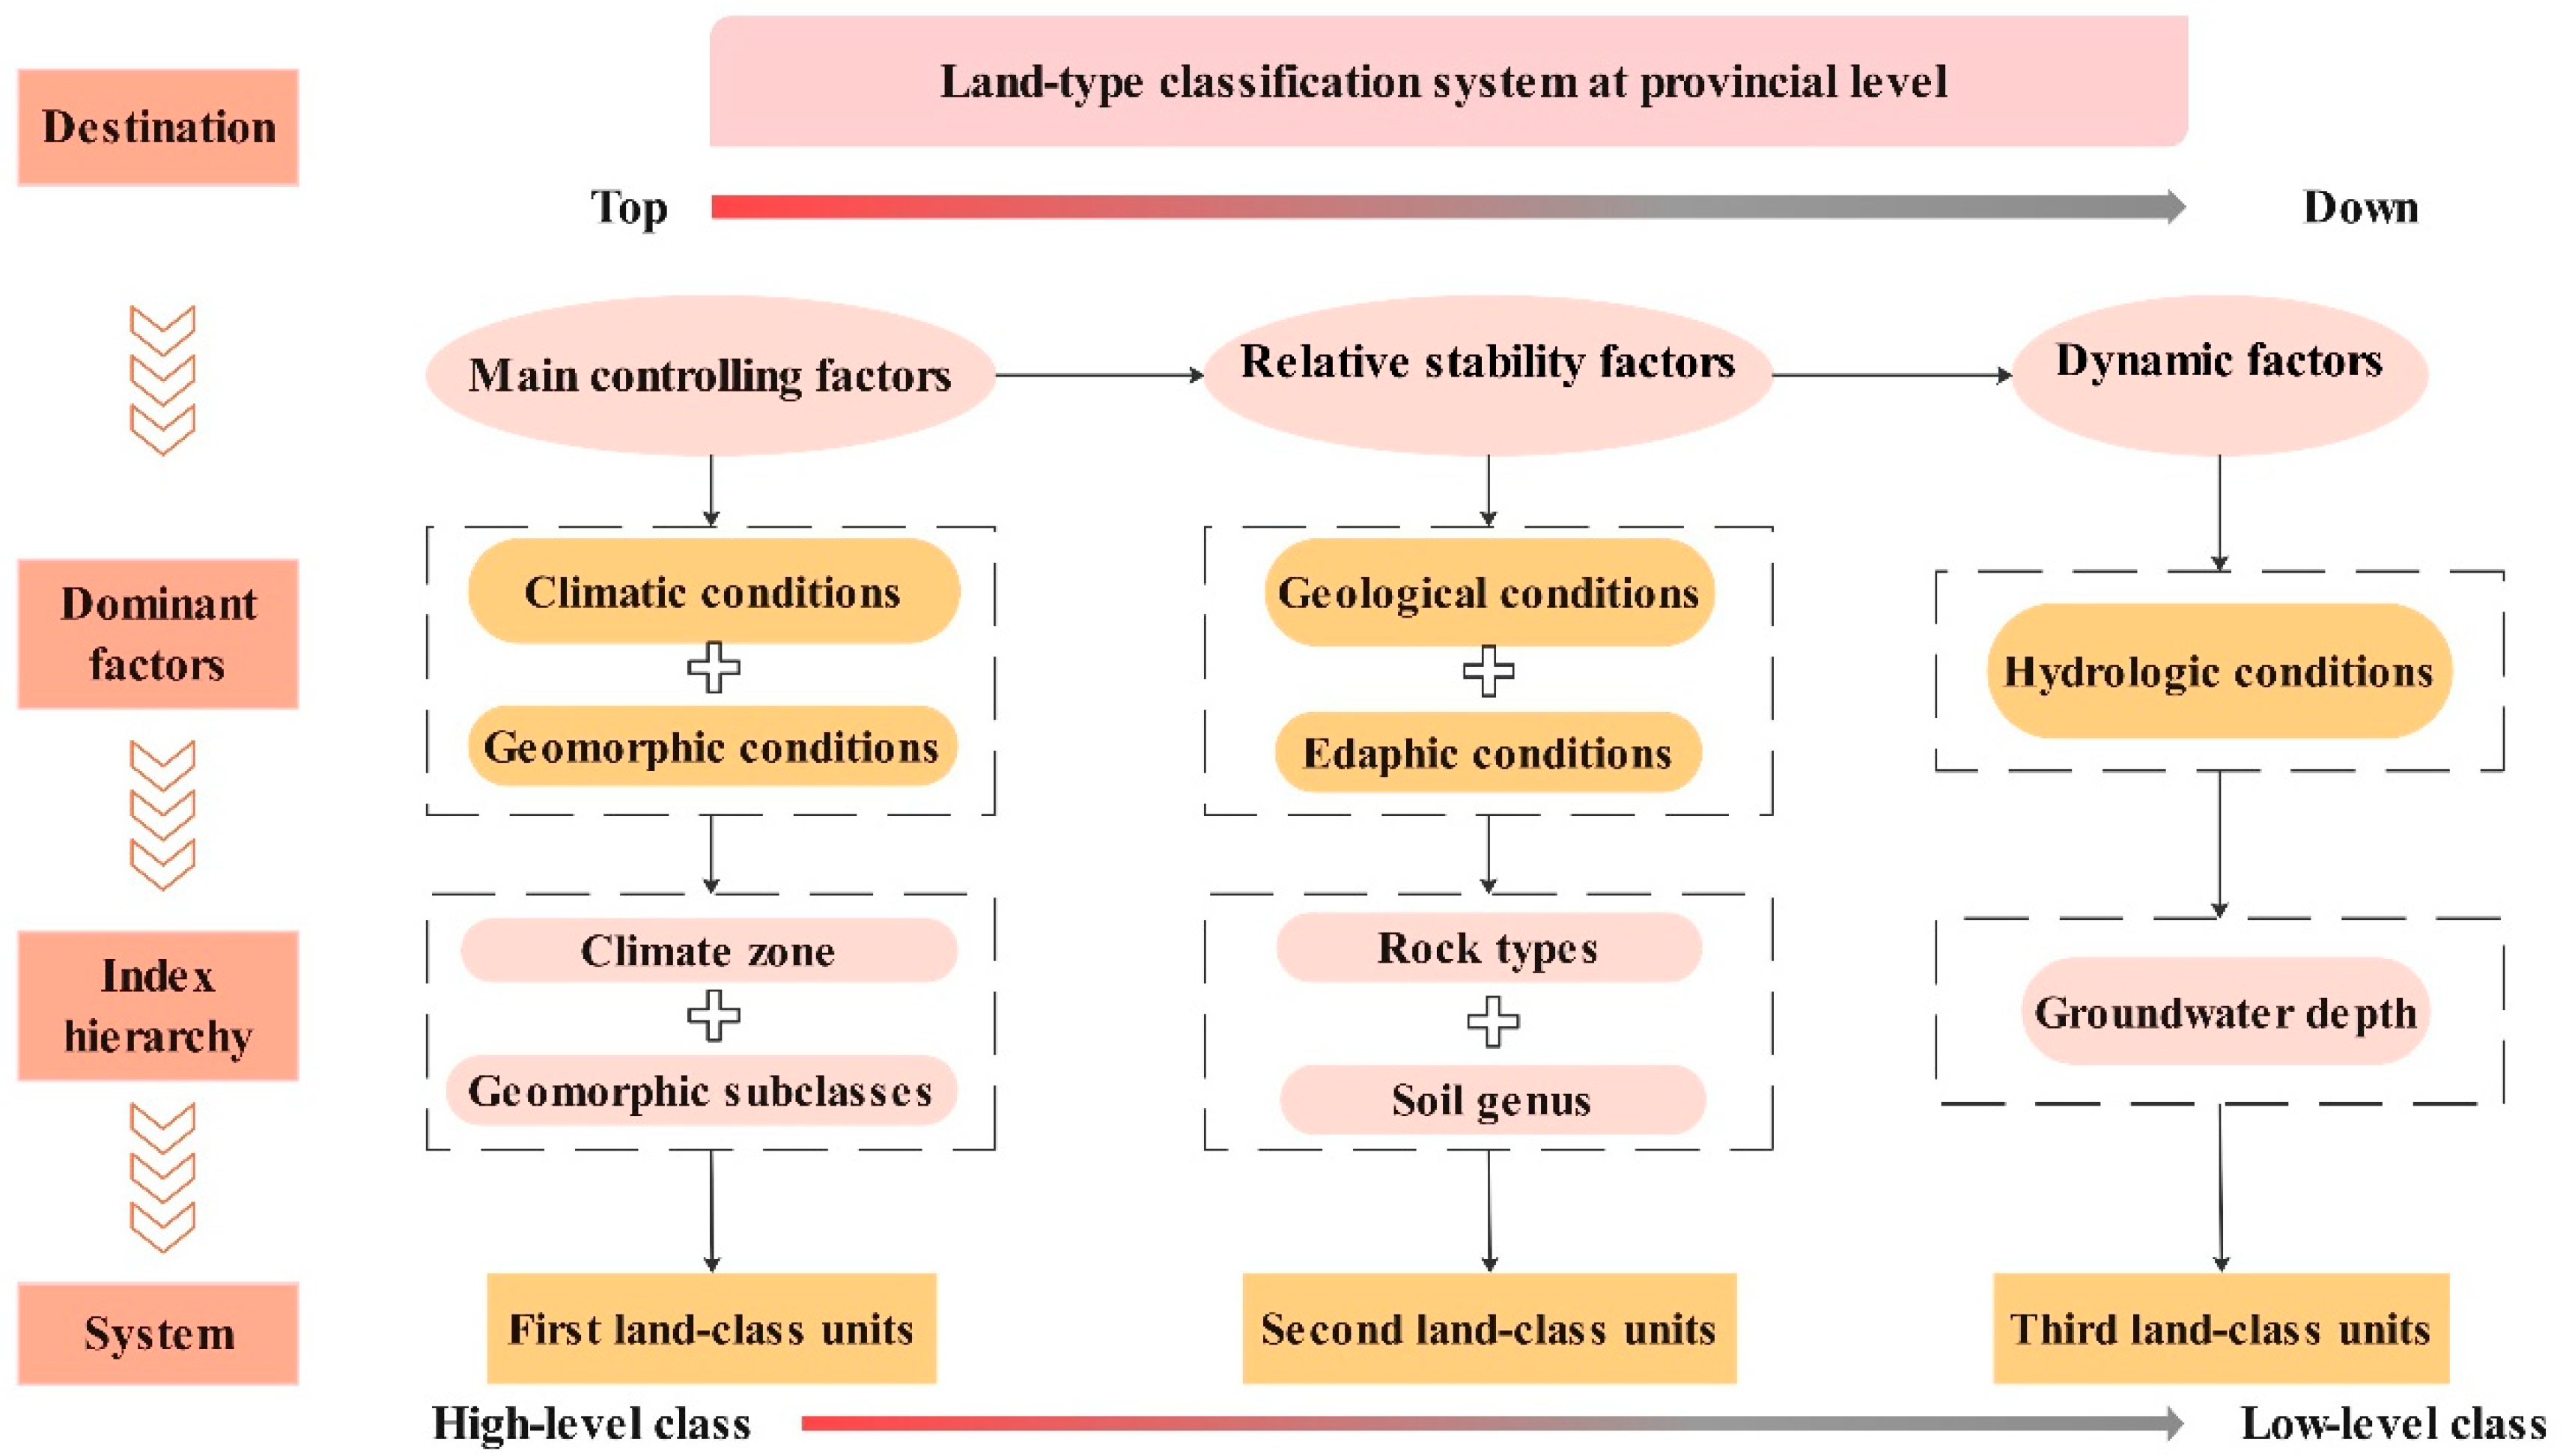
Figure 1. Land-type classification system scheme at the provincial level.
Agriculture 15 01105 g001
Figure 2. Evaluation system of agricultural land potential productivity based on land types.
Agriculture 15 01105 g002
Figure 3. The conceptual implementation system for balancing cultivated land occupation and reclamation.
Agriculture 15 01105 g003
Figure 4. Location of Heilongjiang Province.
Agriculture 15 01105 g004
Figure 5. Maps showing land-type classifications in Heilongjiang Province.
Agriculture 15 01105 g005aAgriculture 15 01105 g005b
Figure 6. Map showing the climate potential productivity distribution in Heilongjiang Province.
Agriculture 15 01105 g006
Figure 7. Map showing the agricultural potential productivity distribution in Heilongjiang Province.
Agriculture 15 01105 g007
Figure 8. Map showing the agricultural potential productivity grade zoning distribution in Heilongjiang Province.
Agriculture 15 01105 g008
Figure 9. Map showing the suitable farming area distribution in Heilongjiang Province.
Agriculture 15 01105 g009
Figure 10. Map of the optimal scheme for balancing cultivated land occupation and reclamation distribution in Heilongjiang Province. (As the transfer-in and transfer-out plots are not very clearly displayed on the map, the other major areas have been enlarged.)
Agriculture 15 01105 g010
Table 1. Correction factors and indices, with corresponding classification standards and weights.
FactorsIndicesGrading StandardWeight
1009080706025
TopographySurface morphologyPlainPlatformHillSmall rolling hillsThe rolling hillsGreat Rolling Hills0.0251
Slope/°<22~66~15 15~25≥250.0875
Altitude/m<100100~300300~500500~800800~1500≥15000.0378
Geological conditionRock typesLoose sediments: alluvial deposits, lacustrine deposits and marine deposits, etc.Rocks rich in syenite: granite, syenite, rhyolite, feldspar sandstone, gneiss, etc. Rocks rich in dark minerals: gabbro, basalt, diorite, andesite, etc.Rocks containing CaCO3: limestone, marble, marl, dolomitic limestone, calcareous sandstone, shale, etc.High SiO2 content of rocks: quartzite, quartz sandstone, shale, etc.0.0185
Edaphic conditionSoil textureLoamClay Sand Gravelly soil0.1052
Soil thickness/cm≥150100~15060~100 30~60<300.0540
Soil organic carbon/%≥2.02.0~1.21.2~0.60.6~0.20.1~0.2<0.10.1203
Gravel content/%≤22~55~88~1111~15>150.0316
Bulk density/g·cm−31~1.251.25~1.351.35~1.45 1.45~1.55≥1.55 or <10.0855
Soil pH6.5~7.55.0~6.5 or 7.5~8.5 4.0~5.0 or 8.5~9.5 ≥9.0 or <4.00.0722
Edaphic conditionSoil available water content/%1501251007550150.1085
Cation exchange capacity/cmol·kg−1>2015~2010~156~103~6≤30.0258
Base saturation/%55~70 40~55 or 70~80 10~40 or 80~90≥90 or ≤100.0195
Soil erosion degreeMicroMildModerate SevereExtremely severe0.0723
Hydrologic conditionGroundwater depth/m>20 5~20 0~5 0.0422
Management factorsIrrigationconditionFullBasicGeneral Little 0.0478
Drainage conditionFine GoodNormalWorseSevere0.0462
Table 2. The zoning scheme of land suitable for farming.
Zoning SchemeHigh Potential Productivity ZoneMedium Potential Productivity ZoneLow Potential Productivity Zone
Correction index≥85IIIIII
[75,85)IIIIIIV
[60,75)IIIIIIV
<60IV
Table 3. Data description and source of this study.
Data TypeData DescriptionData Source
Land-type classification dataClimate zoneChina’s climate zone map from 1981 to 2010 [67]
Geomorphic subclassesChina’s digital land geomorphology (1:1 million) [68]
Rock typesWorld Soils and Terrain Digital Database (SOTER)National Earth System Science Data Center
(http://www.geodata.cn/, accessed on 15 December 2023)
Soil genusSoil type data of Henan Province (1:2,000,000)
Groundwater depthWater Related Knowledge Service System (http://mwr.ckcest.cn/, accessed on 28 March 2024)
Agricultural land potential productivity evaluation index basic dataAnnual average temperature, annual average precipitationChina Meteorological Data Service Centre
(http://data.cma.cn, accessed on 10 May 2024)
Slope and altitudeGeospatial Data Cloud (https://www.gscloud.cn/, accessed on 10 May 2024) (DEM: 30 m)
Soil texture, soil thickness, soil organic carbon, soil available water content, base saturationHarmonized World Soil Database
(HWSD v1.2) (1 km)
Gravel content, bulk density, cation exchange capacity, soil pHSoilGrids data (https://soilgrids.org/, accessed on 15 May 2024)
Soil erosion degreeChinese Academy of Sciences
Resource and Environment Science and Data Center
(https://www.resdc.cn, accessed on 20 May 2024)
Irrigation and drainage conditionsThe buffer zone is established based on the waterhead and calculated by referring to the compilation of statistical yearbooks
Land-use status dataLand use remote sensing monitoring data (30 m)Chinese Academy of Sciences
Resource and Environment Science and Data Center
Table 4. Agricultural land potential productivity of different land types (the third land-class land-type units).
IDNameArea Proportion (%)Potential Productivity Value (g/(m2·a)
C021T31220GIA1S23051H02The middle and deep groundwater–granite sandy dark brown soil–middle temperate humid zone uplift/erosion periglacial low-altitude hills2.56366.35~660.46
C021T31220GIA1S23042H02The middle and deep groundwater–granite gravel sandy dark brown soil–middle temperate humid zone uplift/erosion periglacial low-altitude hills2.28291.20~576.46
C022T21130GUES23067H02The middle and deep groundwater–aeolian sand bottom black soil–uplift/erosion of low-altitude platform in semi-humid area of middle temperate zone2.10289.24~695.94
C022T11130GUFS23104H01The shallow groundwater–alluvial (fluvial) clay meadow soil–uplift/erosion low-altitude plain in semi-humid area of mid-temperate zone1.69311.41~740.29
C011T42220GIA1S23115H02The middle and deep groundwater–granite brown coniferous forest soil–cold temperate humid zone uplift/erosion periglacial small undulating mountain1.53154.37~459.61
C022T31130GIA1S23051H02The middle and deep groundwater–granite sandy dark brown soil–uplifting/erosion of running water in semi-humid areas of mid-temperate low-altitude hills1.52506.17~725.31
C022T41130GIA1S23051H02The middle and deep groundwater–granite sandy dark brown soil–mid-temperate semi-humid area uplift/erosion flow low altitude small undulating mountains1.45321.69~717.80
C022T21130GUFS23067H02The middle and deep groundwater–alluvial (fluvial) sand bottom black soil–uplift/erosion of low-altitude platform in semi-humid area of middle temperate zone1.39251.13~708.04
C021T41130GIA1S23051H02The middle and deep groundwater–granite sandy dark brown soil–middle temperate humid zone uplift/erosion flow low altitude small undulating mountains1.24414.57~705.67
C022T11130GUFS23072H01The shallow groundwater–alluvial (fluvial) sandy gravel bottom calcareous meadow soil–uplift/erosion low-altitude plain in semi-humid area of mid-temperate zone1.21294.65~720.74
C021T41220GIA1S23051H02The middle and deep groundwater–granite sandy dark brown soil–middle temperate humid zone uplift/erosion periglacial low altitude small undulating mountains1.18403.77~661.64
C011T42220GIA1S23115H03The deep groundwater–granite brown coniferous forest soil–cold temperate humid zone uplift/erosion periglacial small undulating mountain1.01211.24~463.88
Disclaimer/Publisher’s Note: The statements, opinions and data contained in all publications are solely those of the individual author(s) and contributor(s) and not of MDPI and/or the editor(s). MDPI and/or the editor(s) disclaim responsibility for any injury to people or property resulting from any ideas, methods, instructions or products referred to in the content.