

Response Prediction and Experimental Validation of Vibration Noise in the Conveyor Trough of a Combine Harvester


 ,
,
Abstract
1. Introduction
2. Materials and Methods
2.1. Structure of the Conveying Channel and Chain Engagement
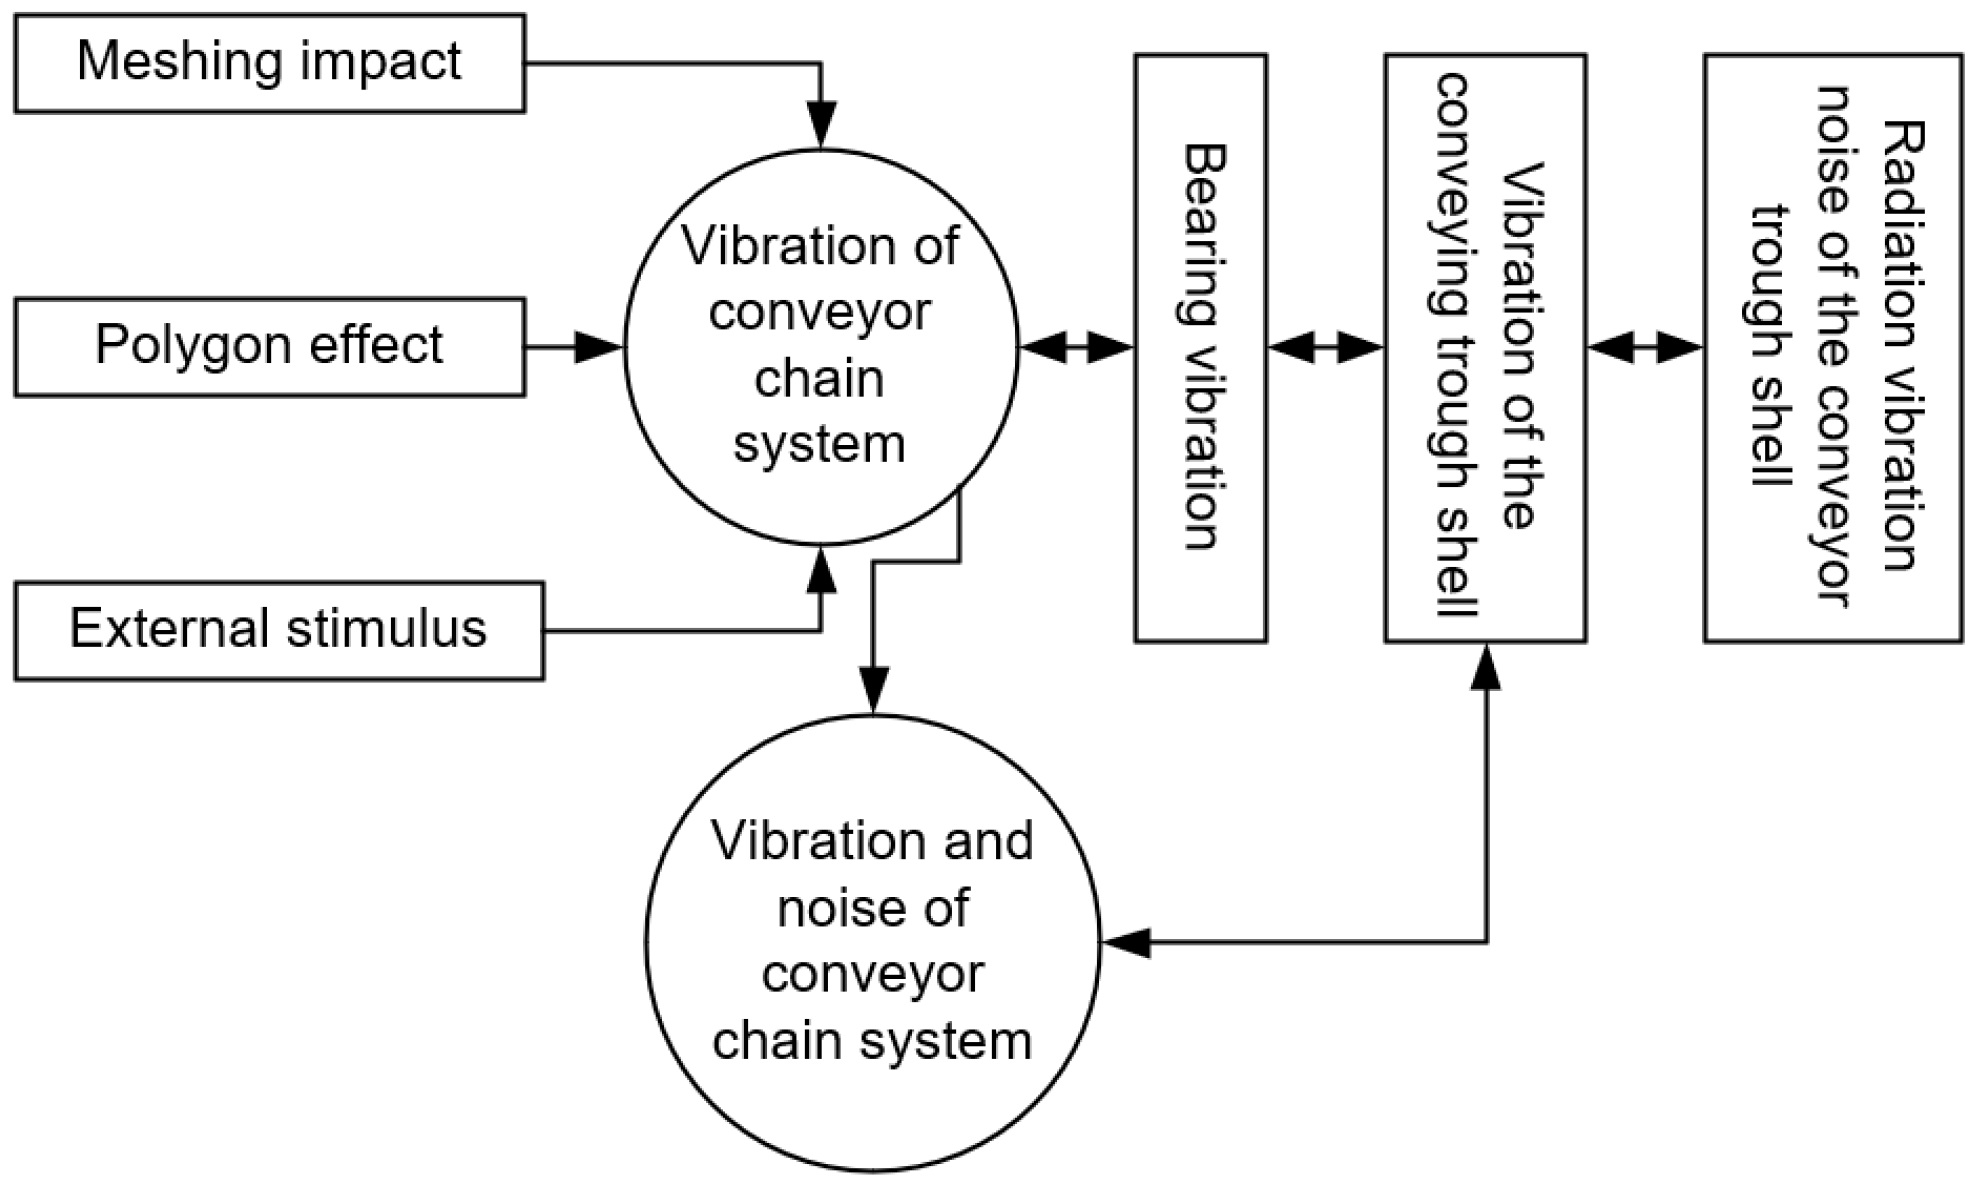
2.2. Analysis Method
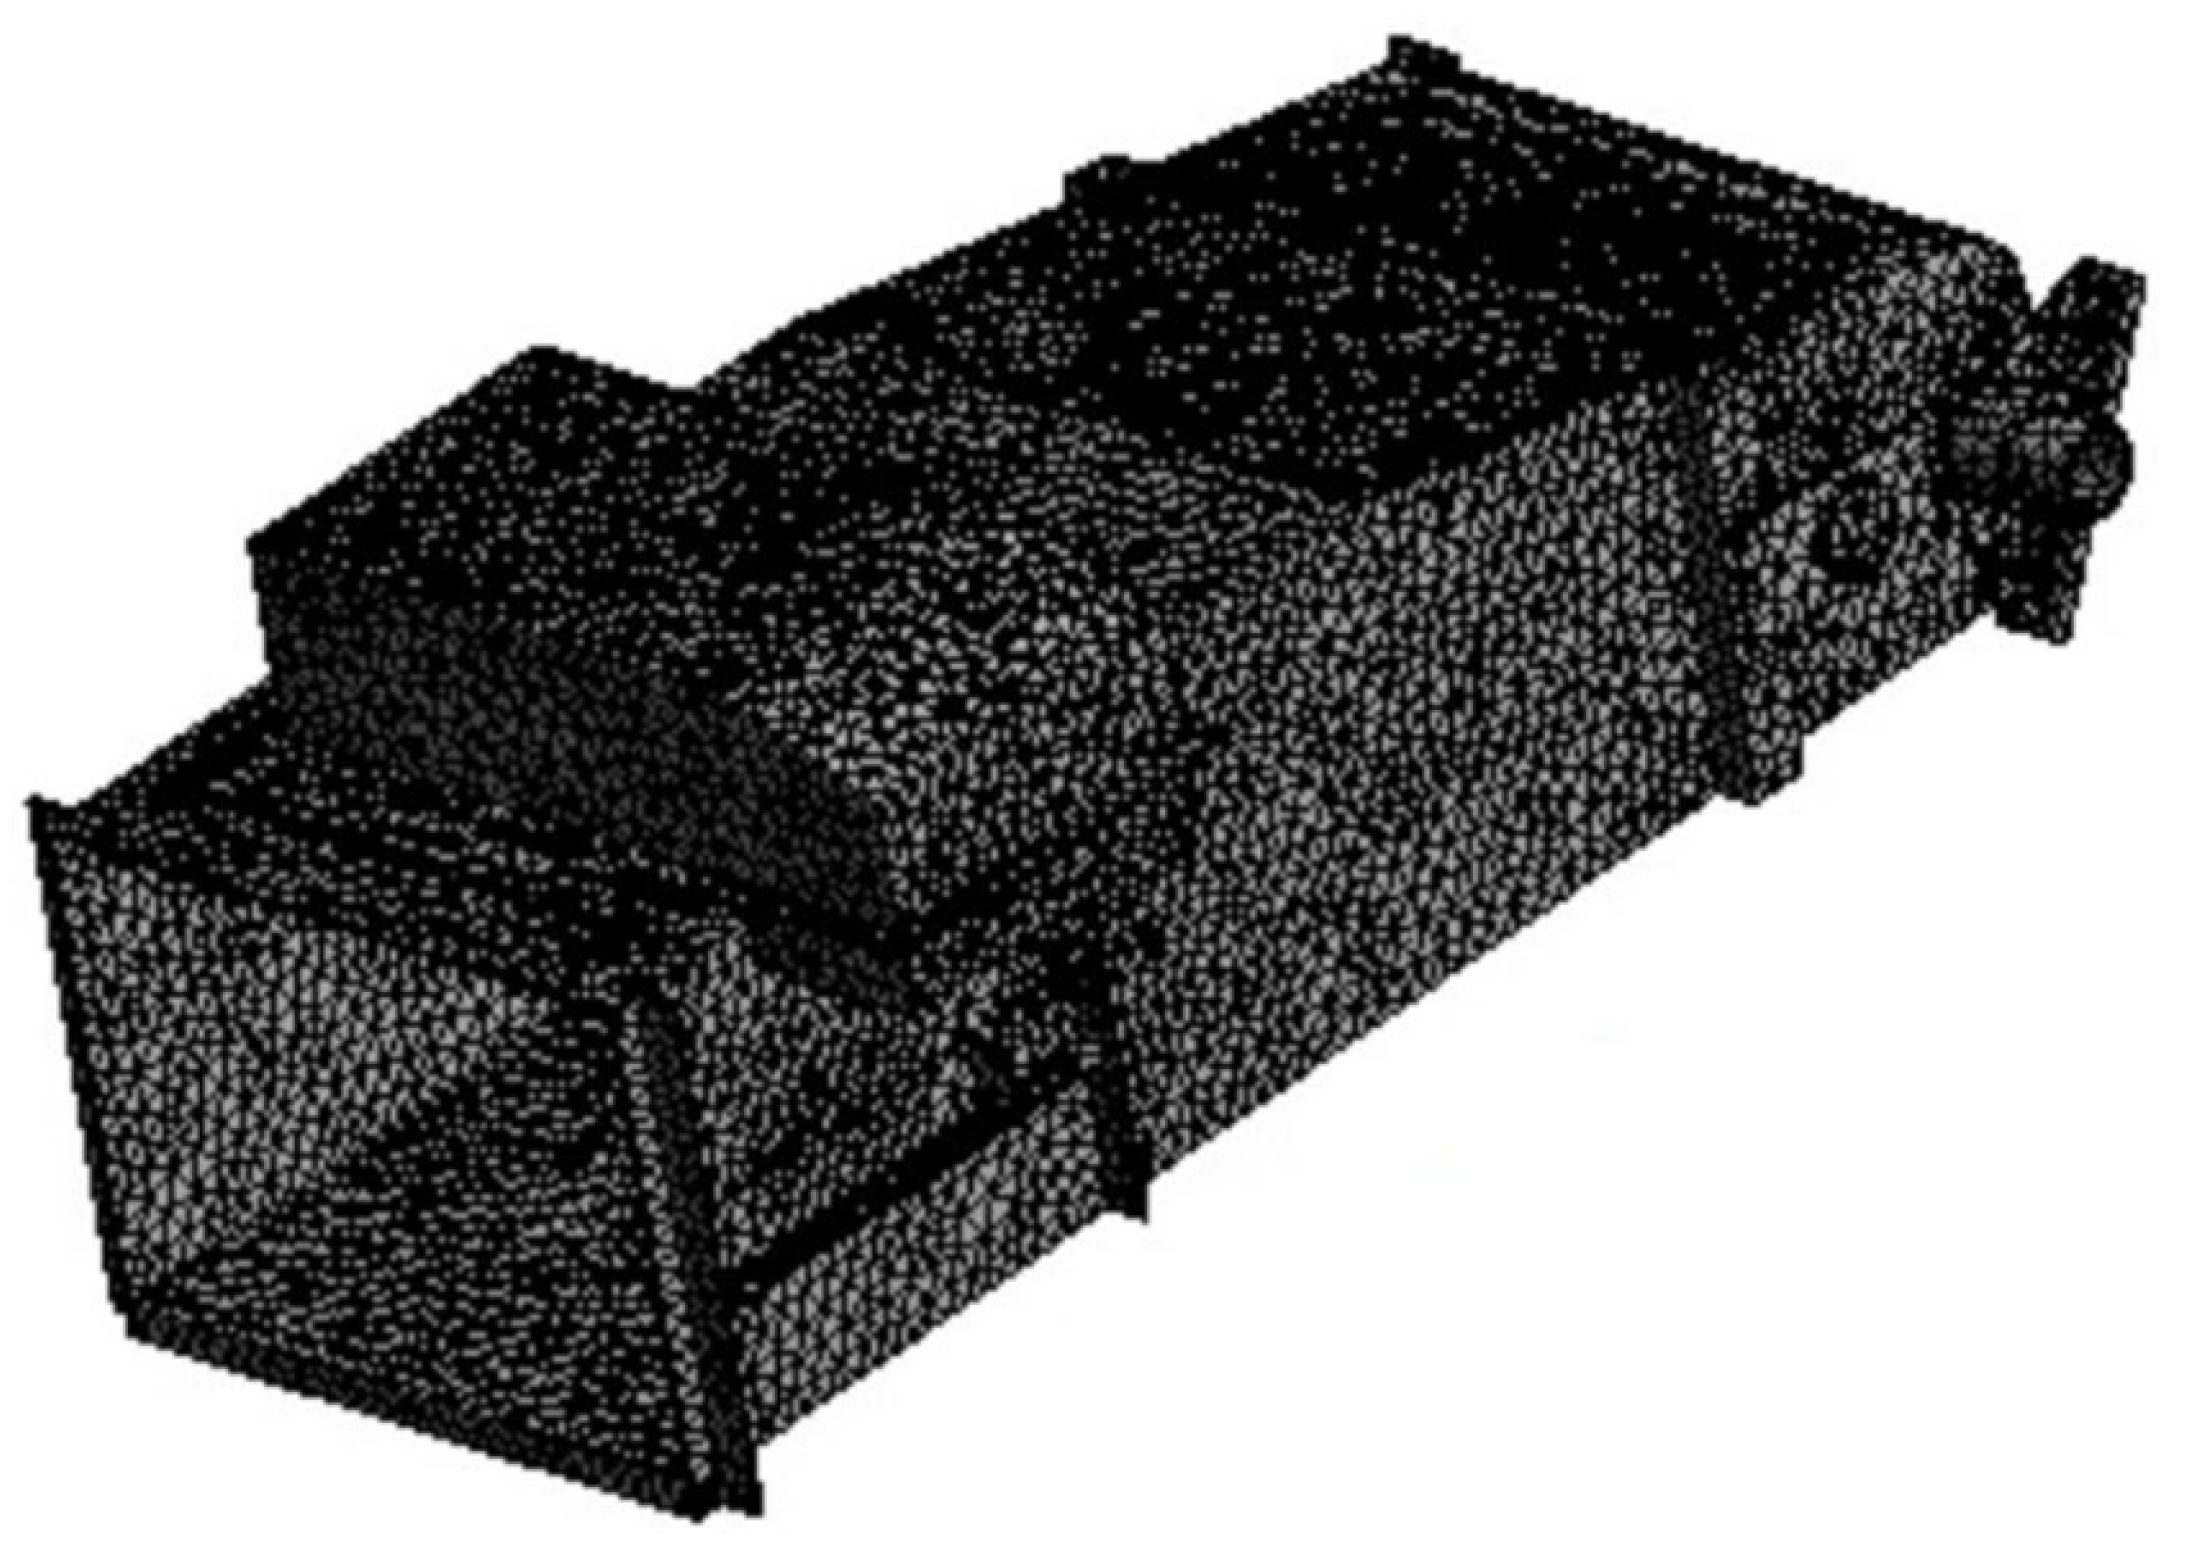
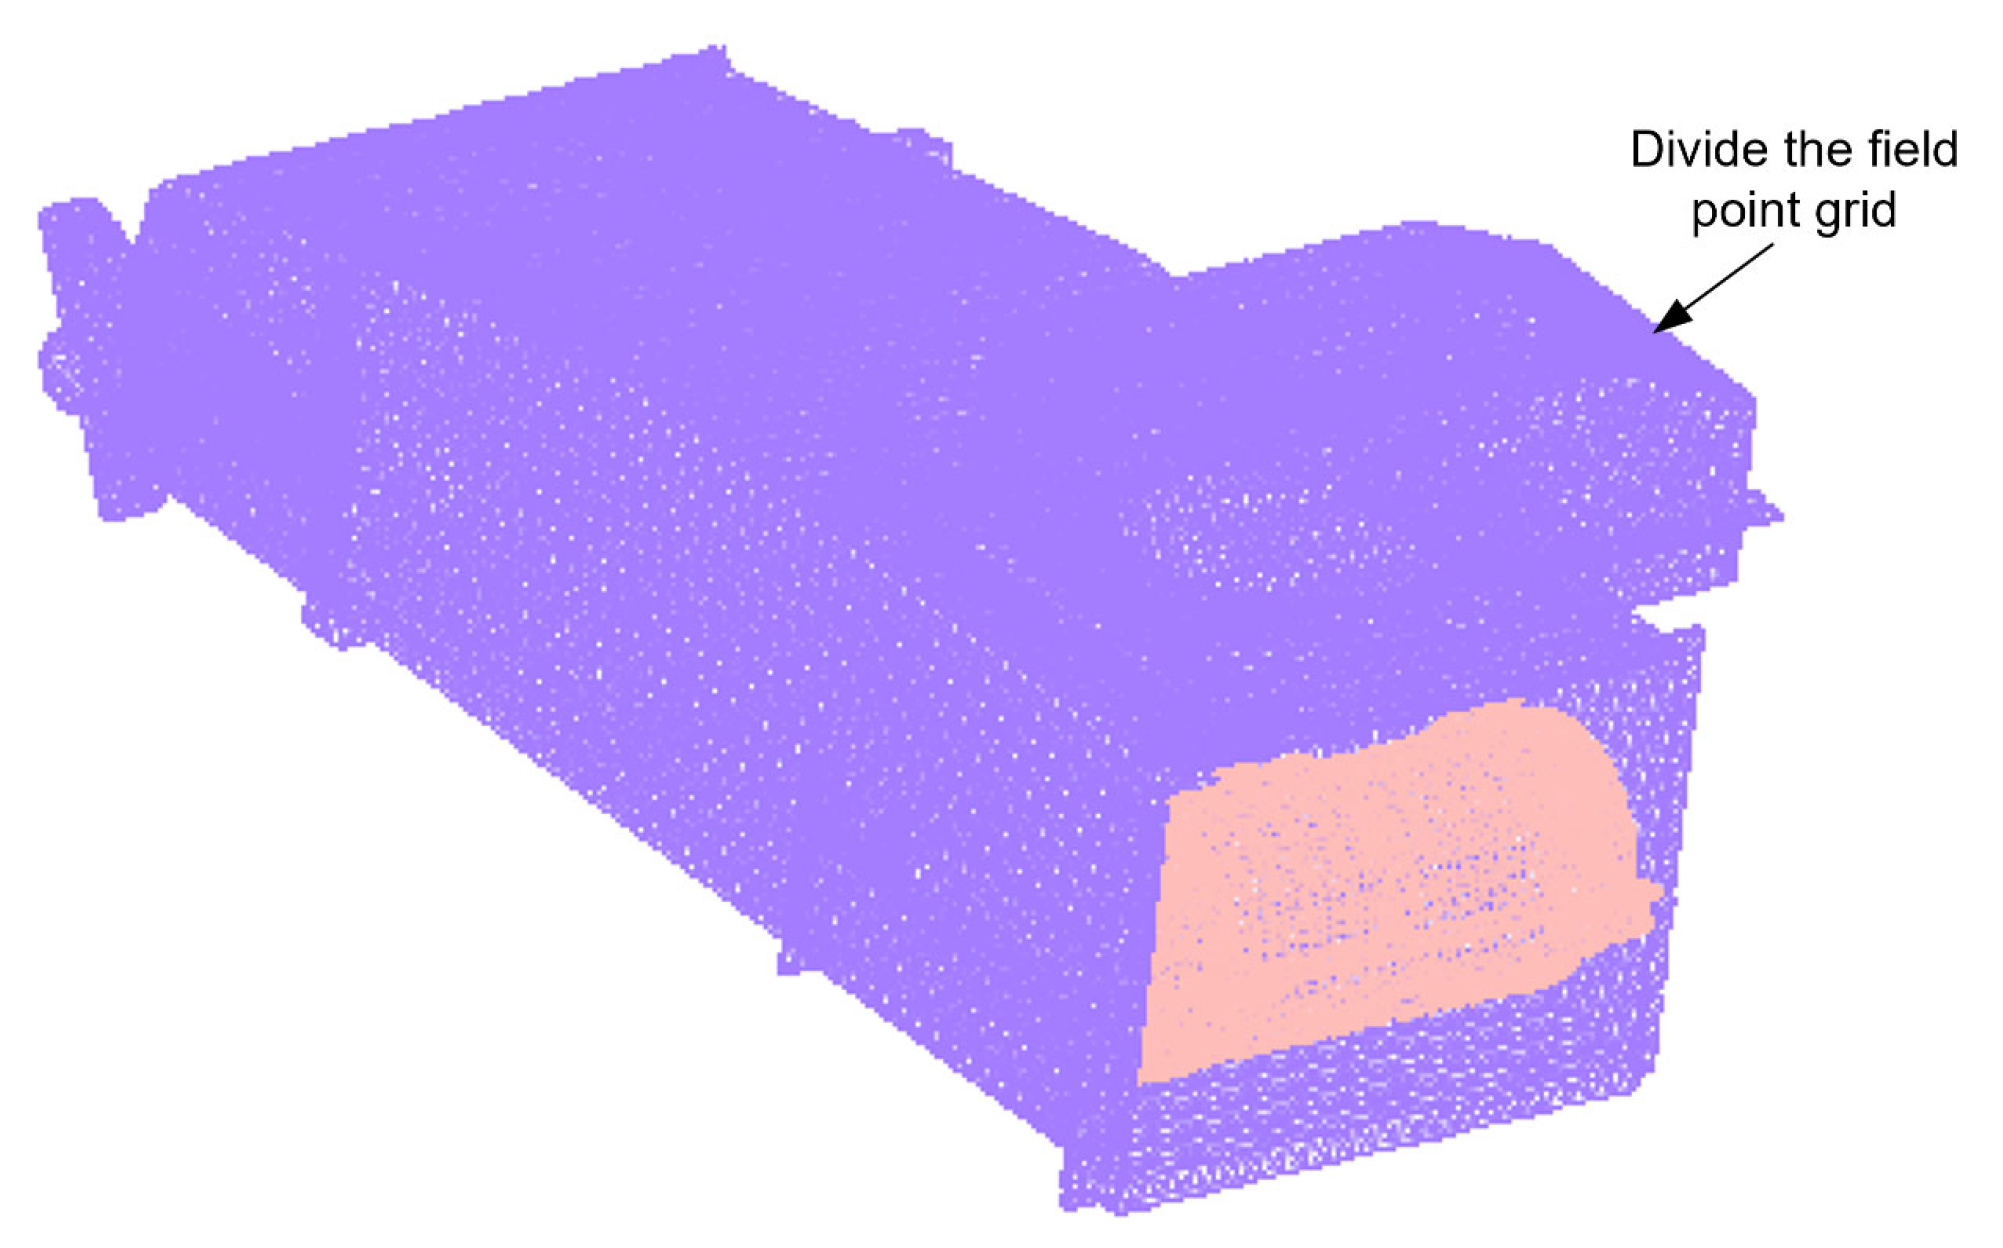
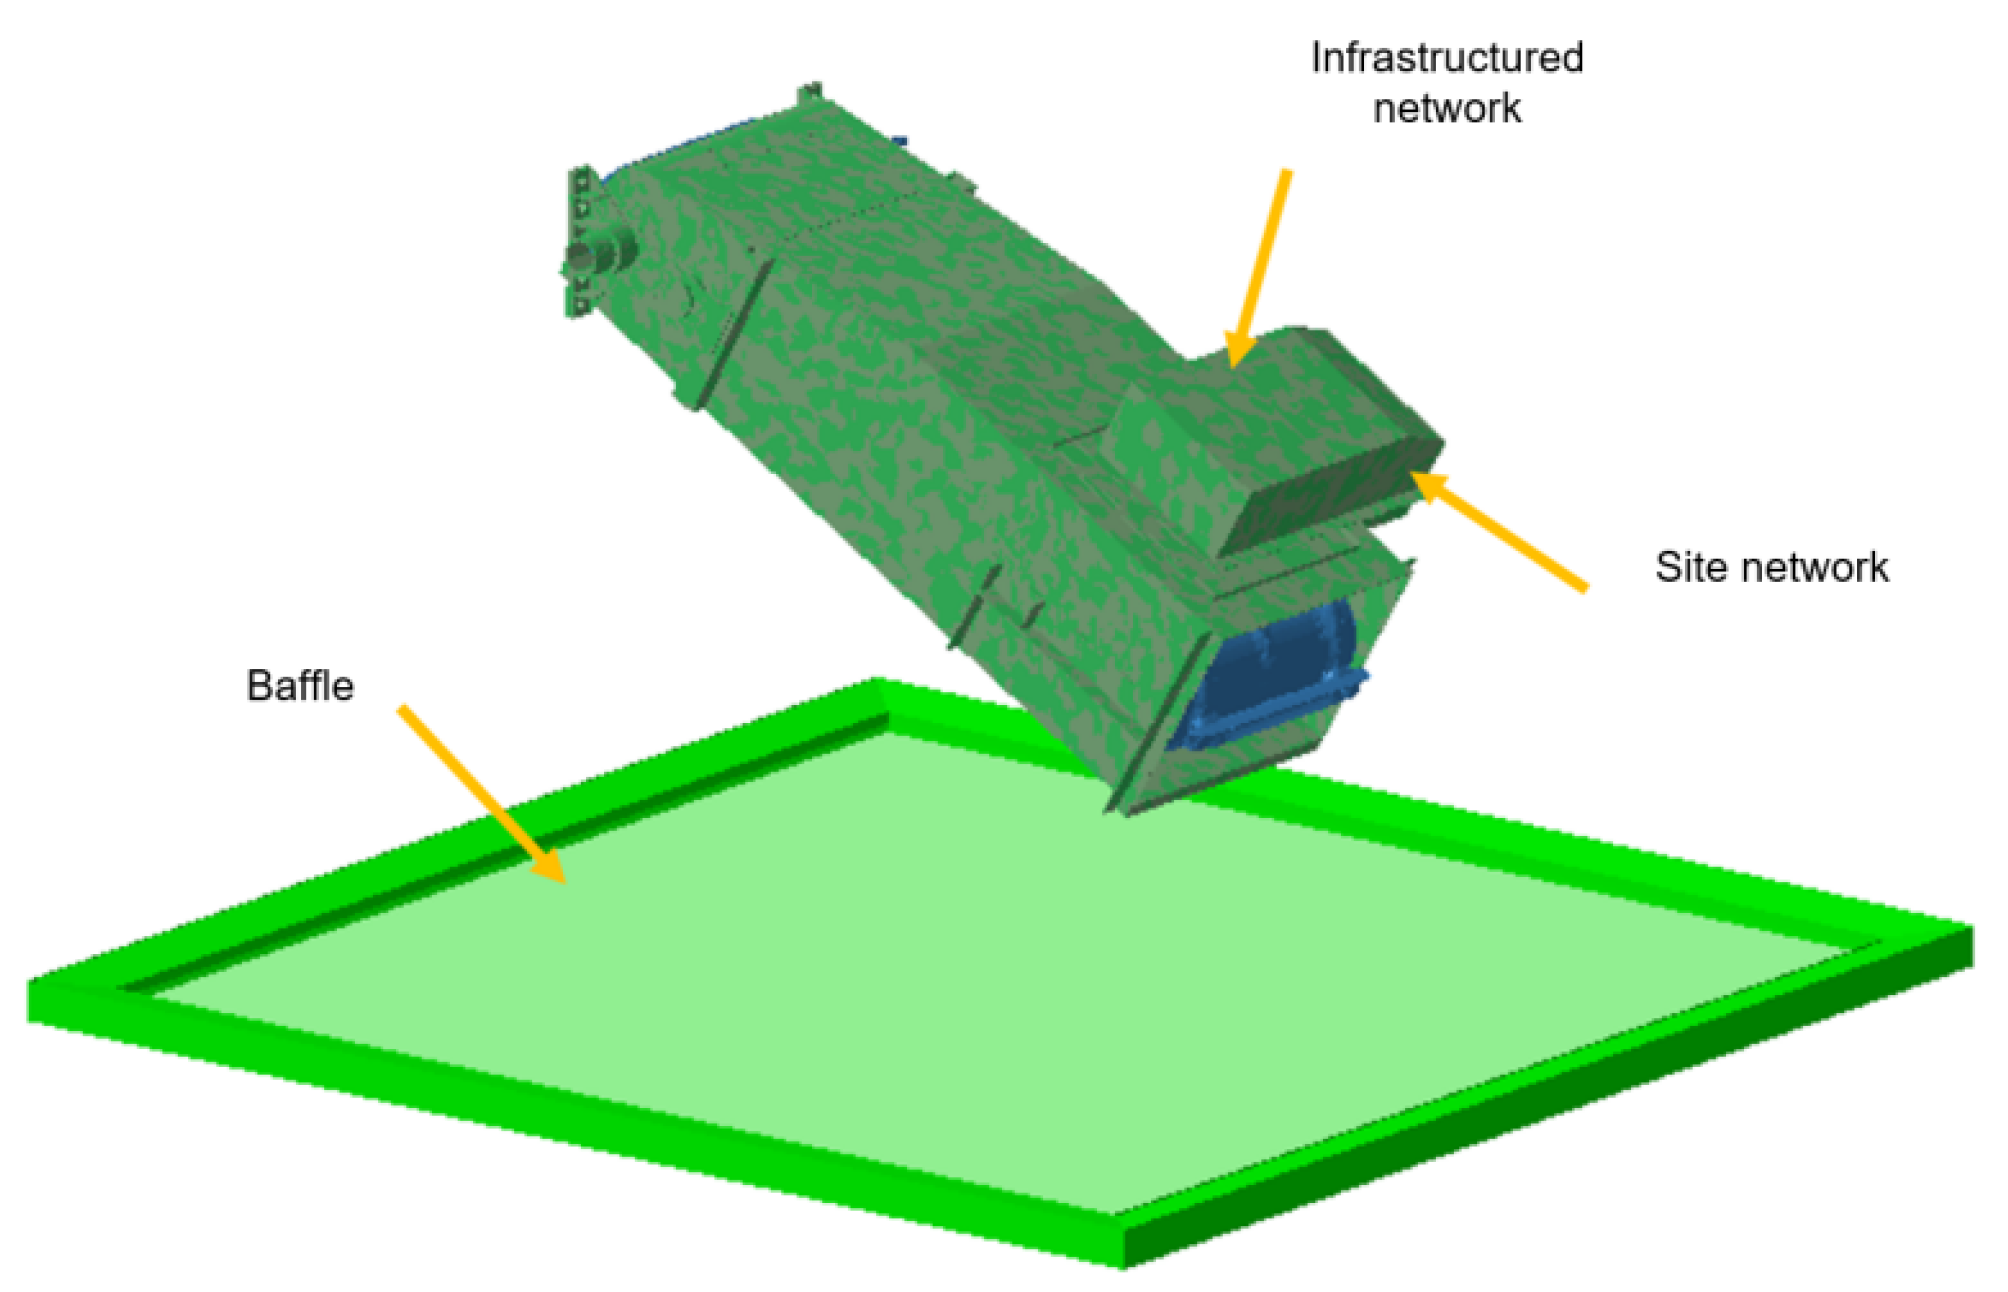
2.3. Numerical Simulation of Vibration of Conveyor Trough Shell
2.4. Modal Analysis and Vibration Response Analysis of Conveyor Shell
2.4.1. Modal Analysis
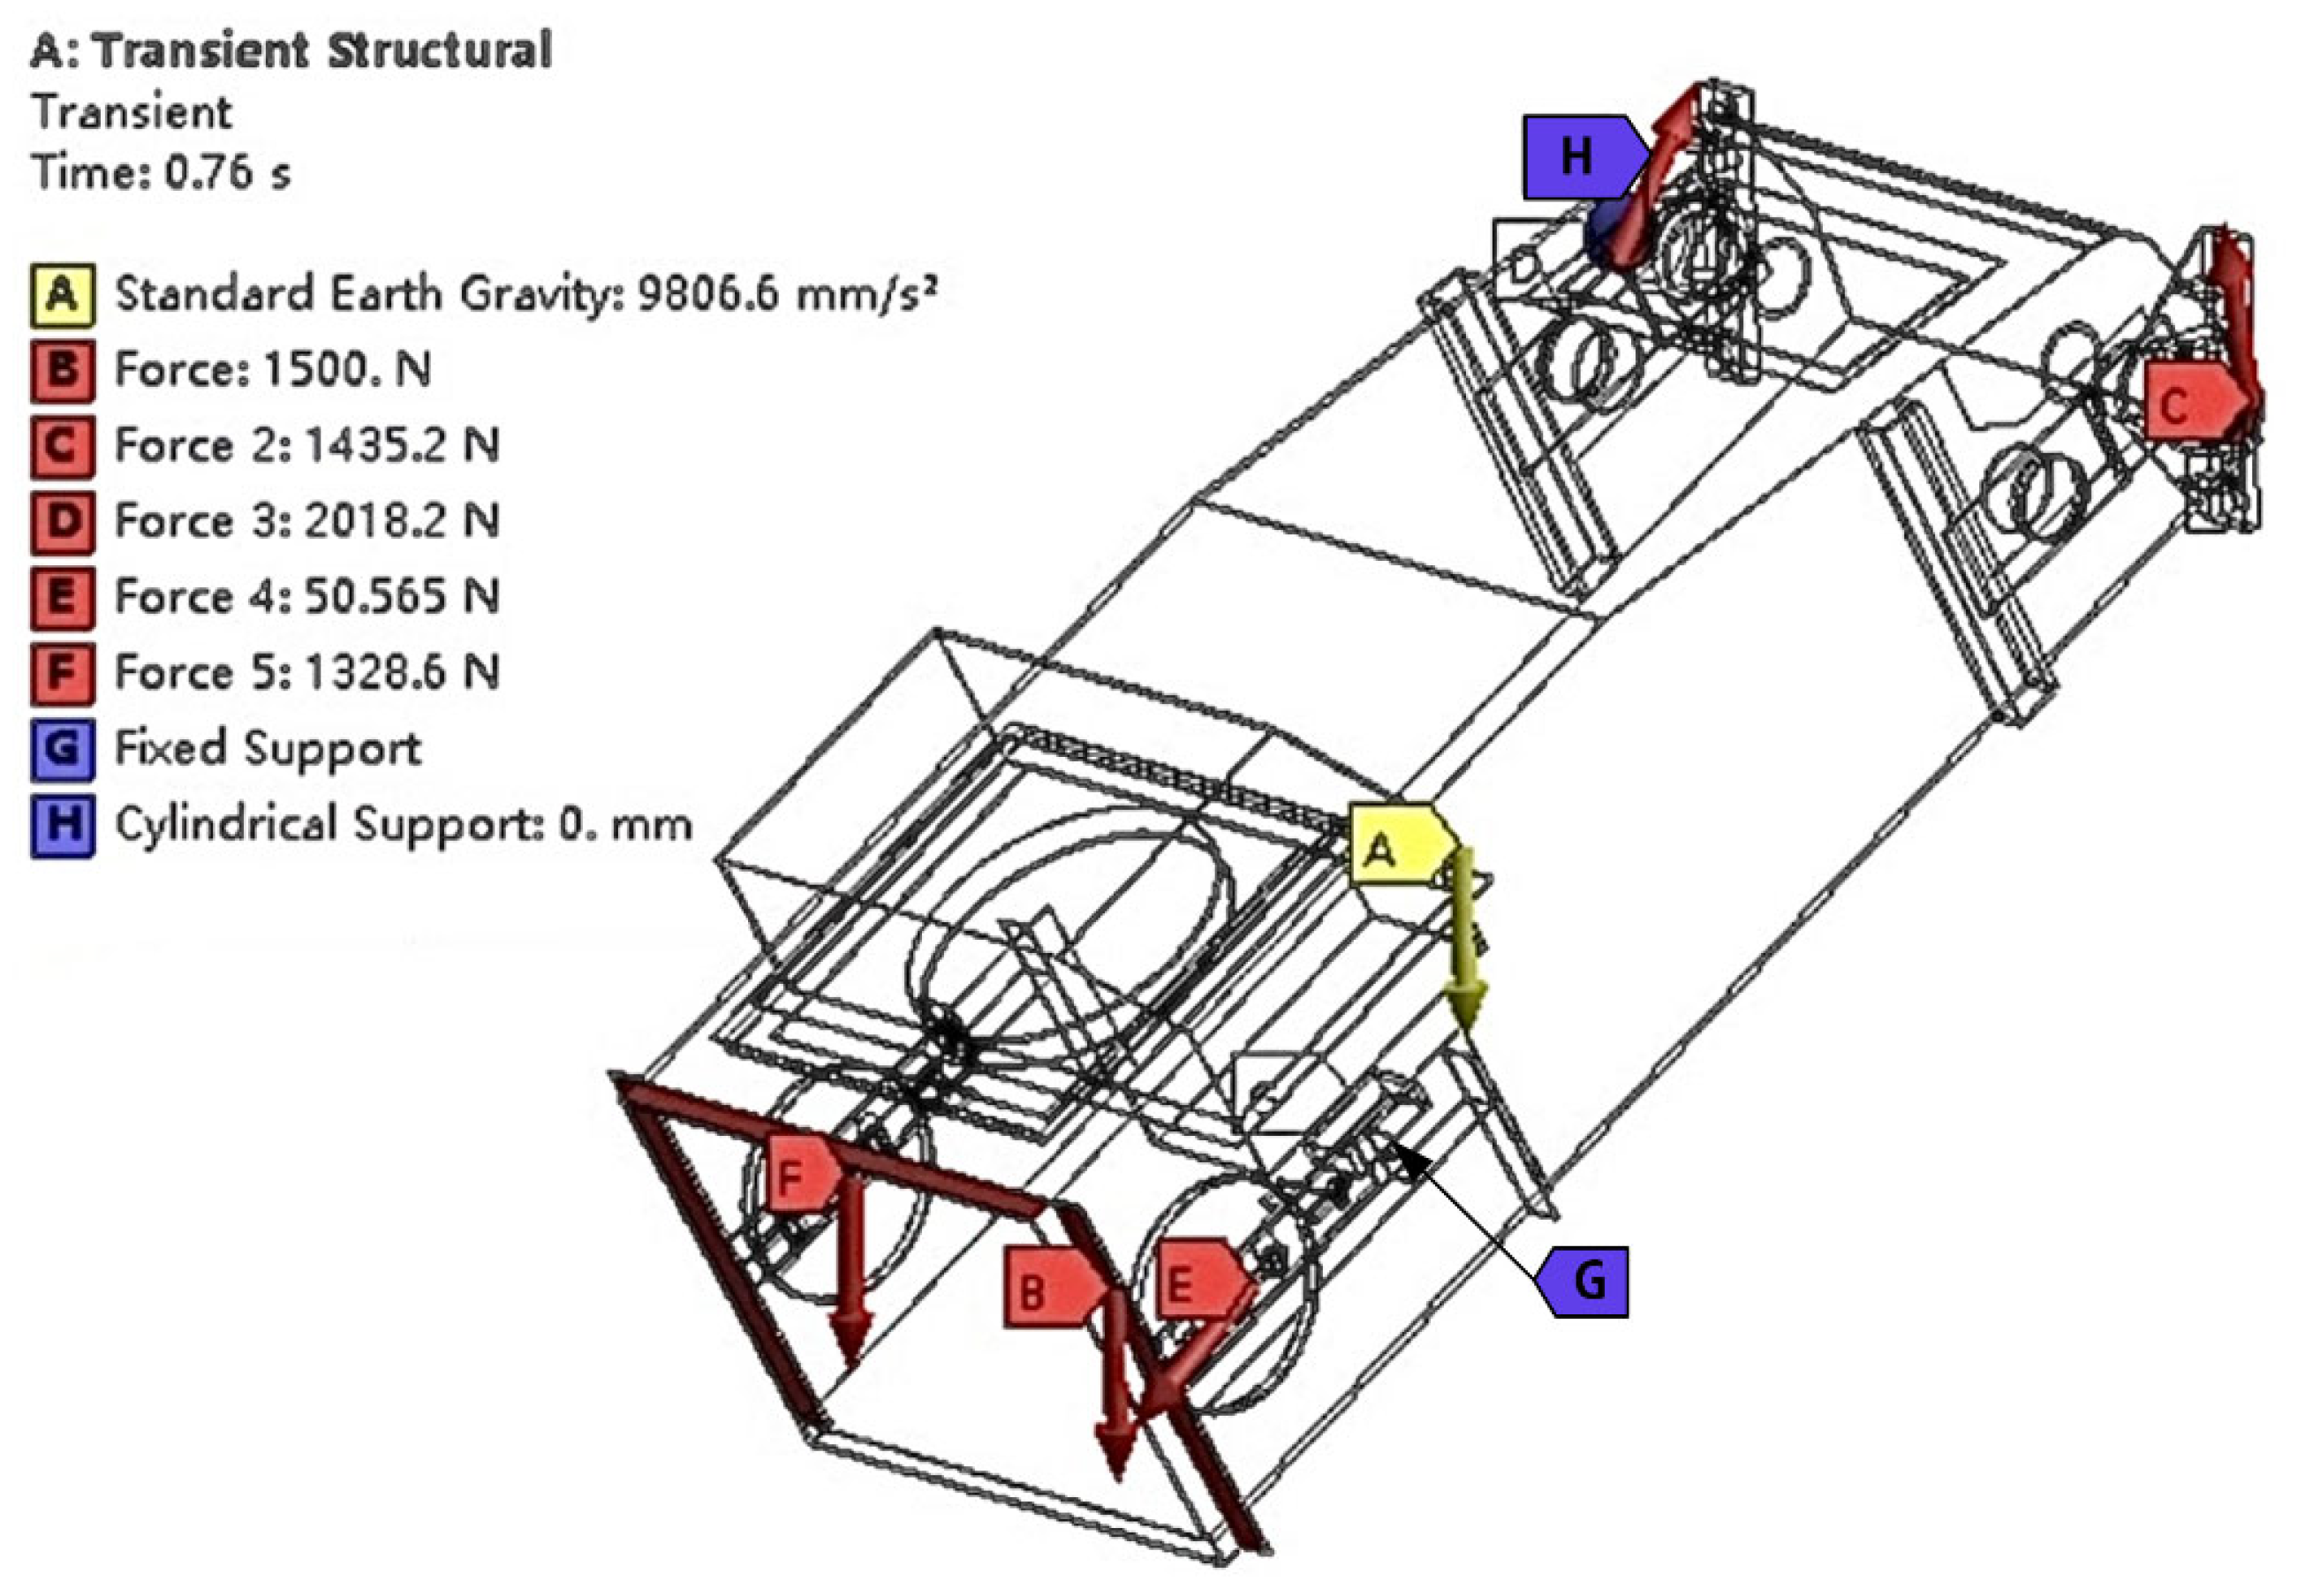
2.4.2. Vibration Response Analysis
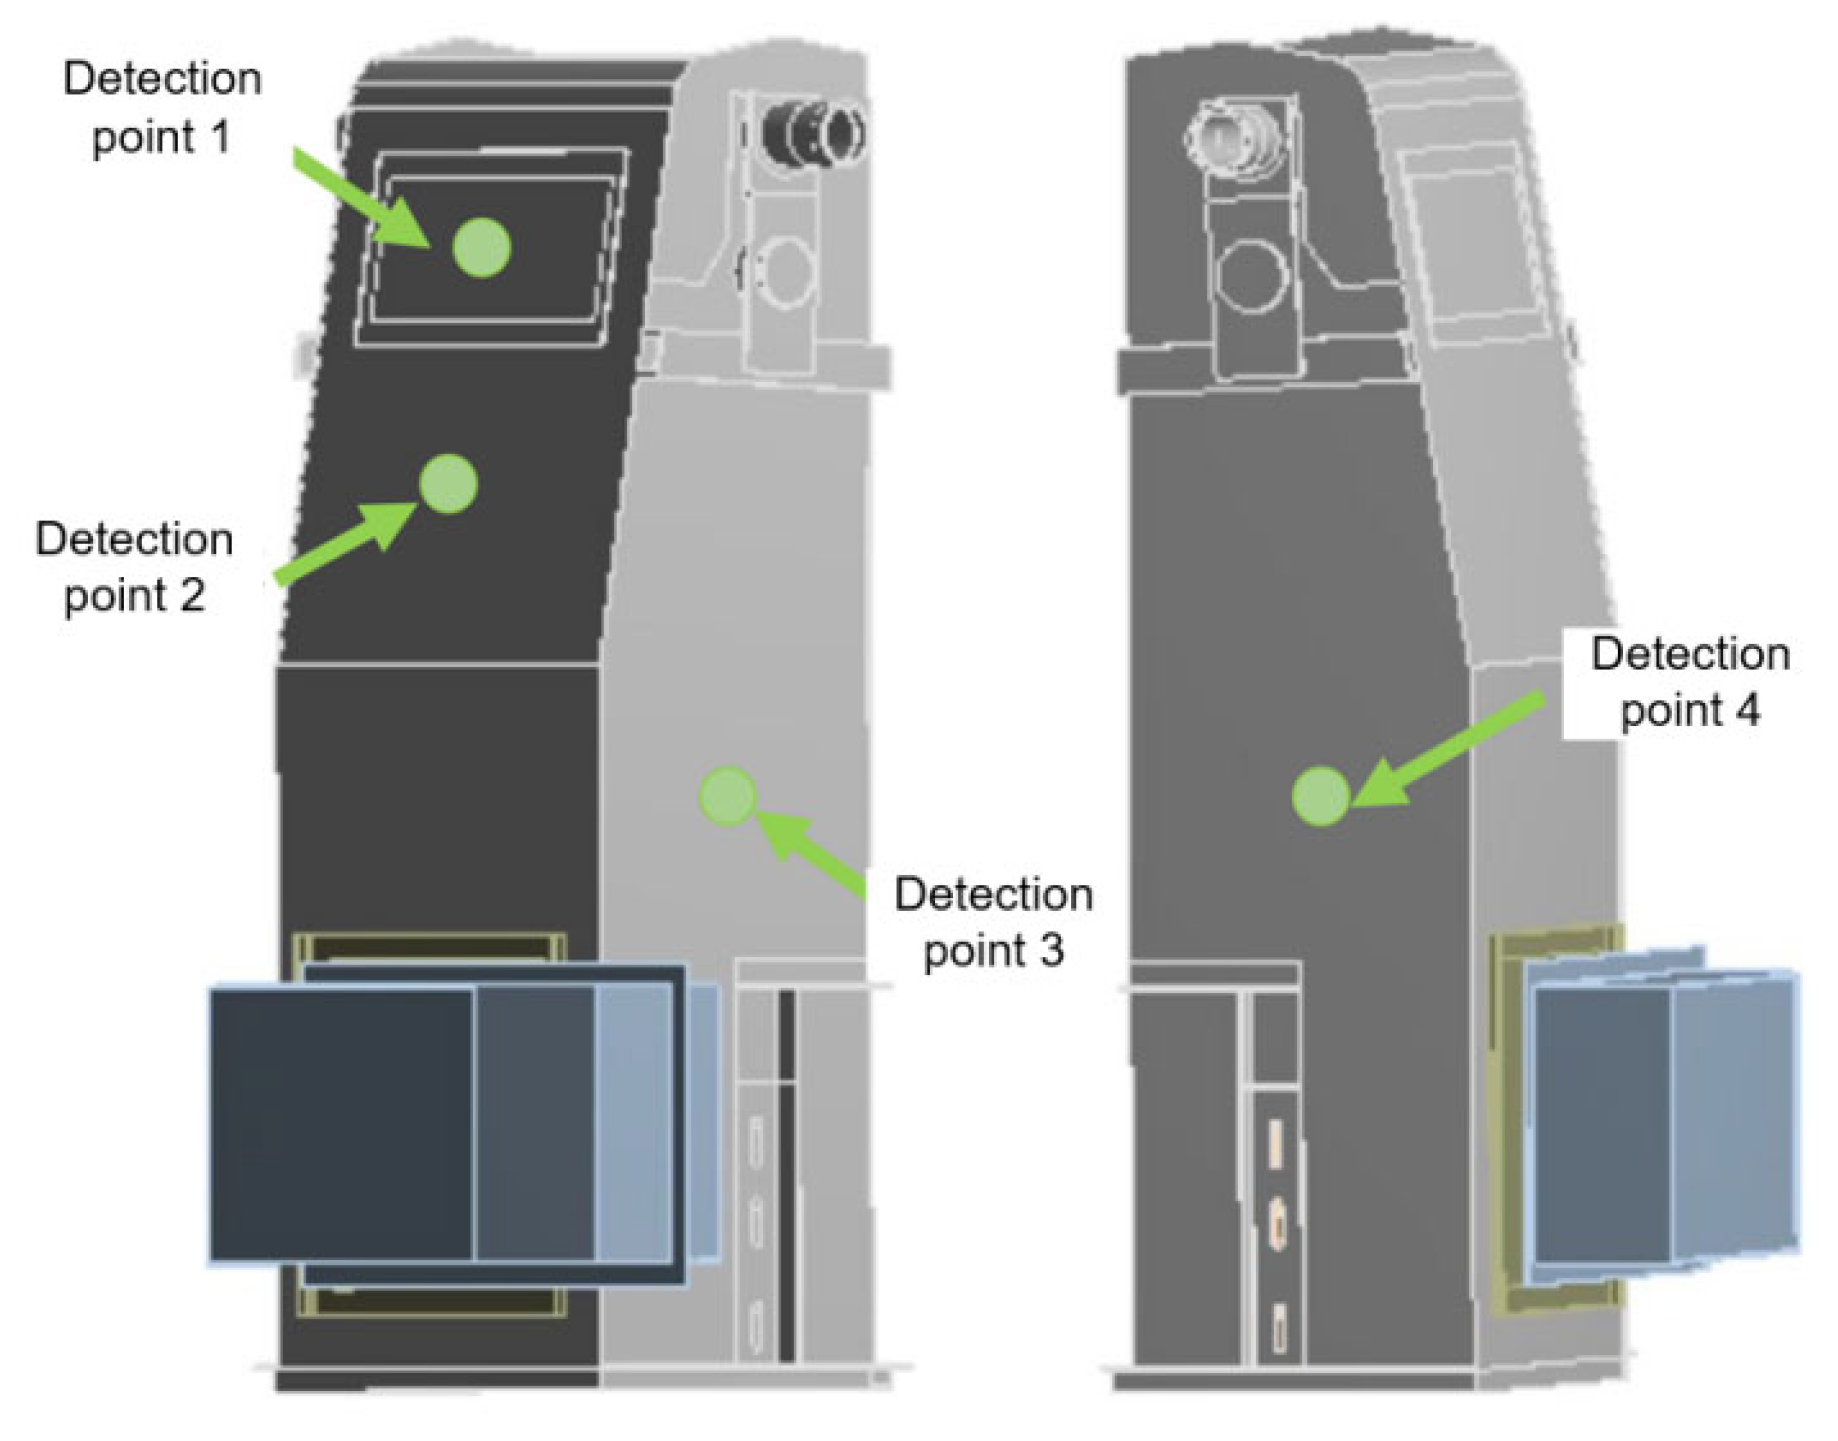
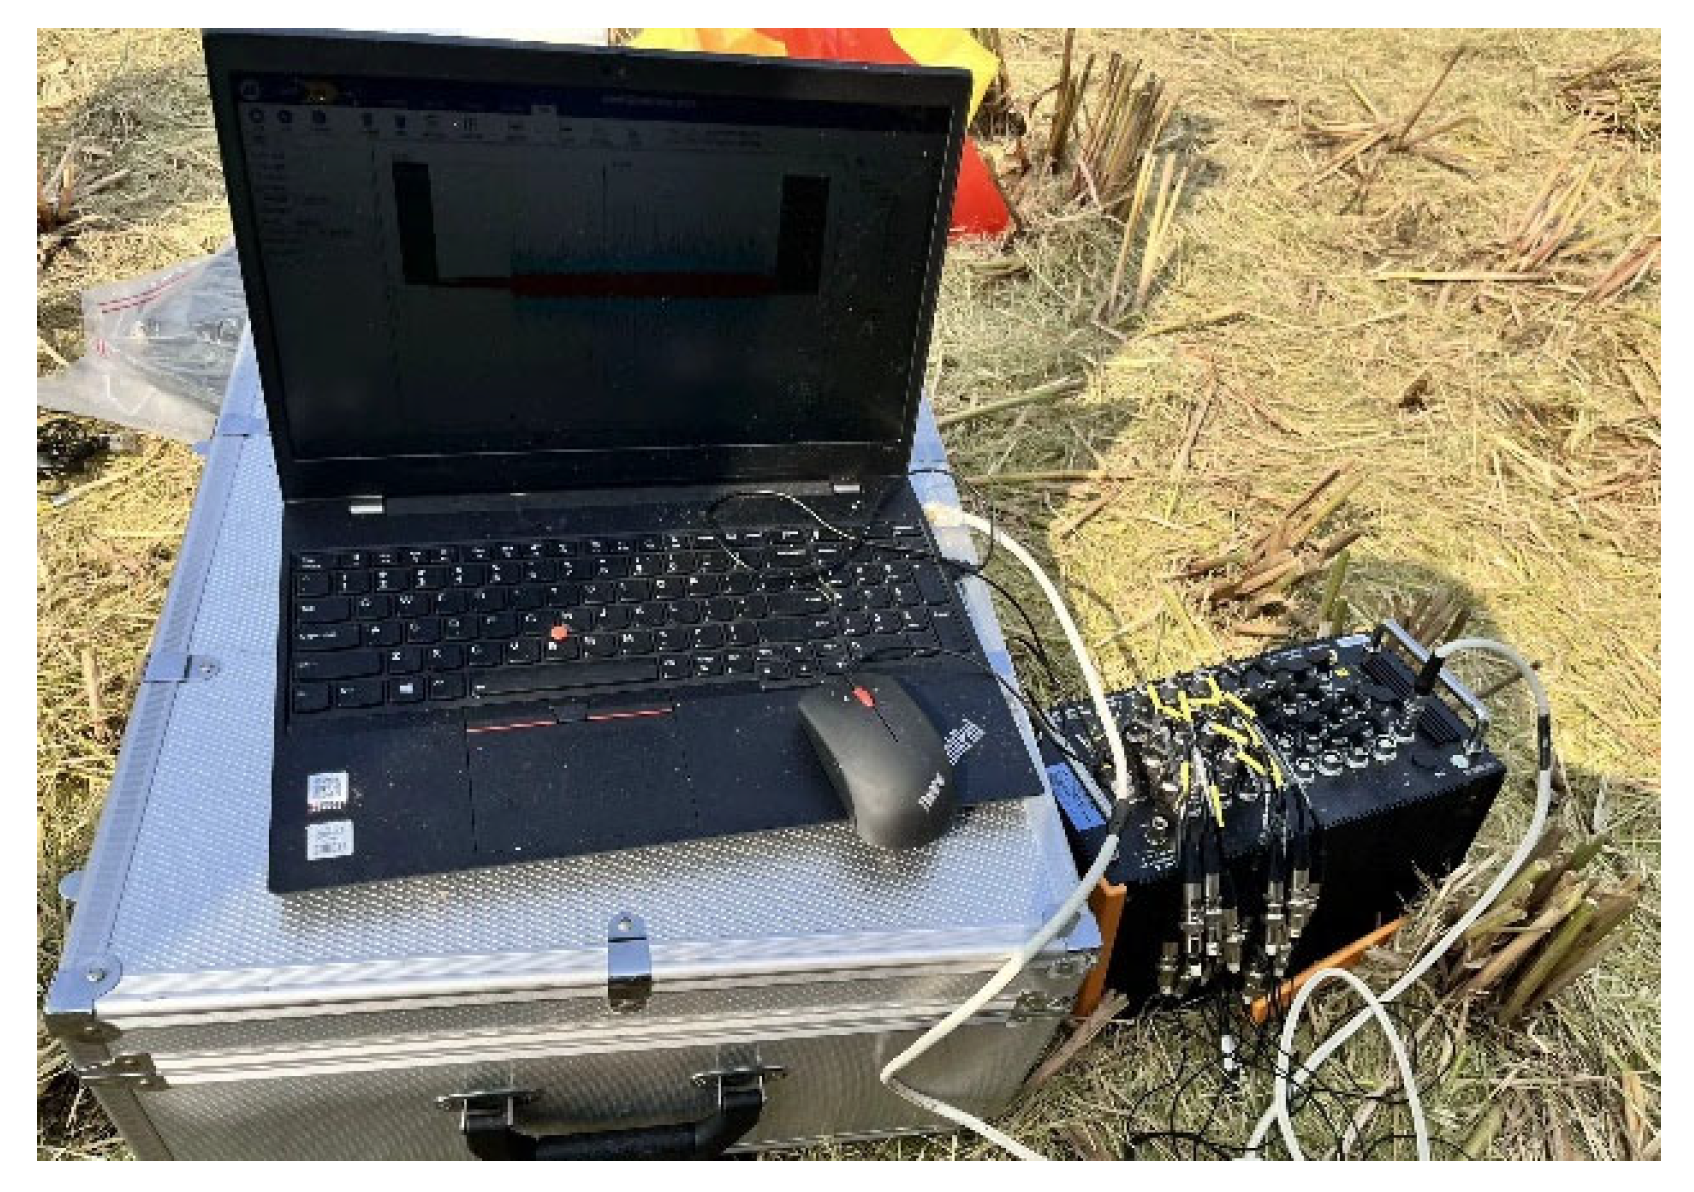
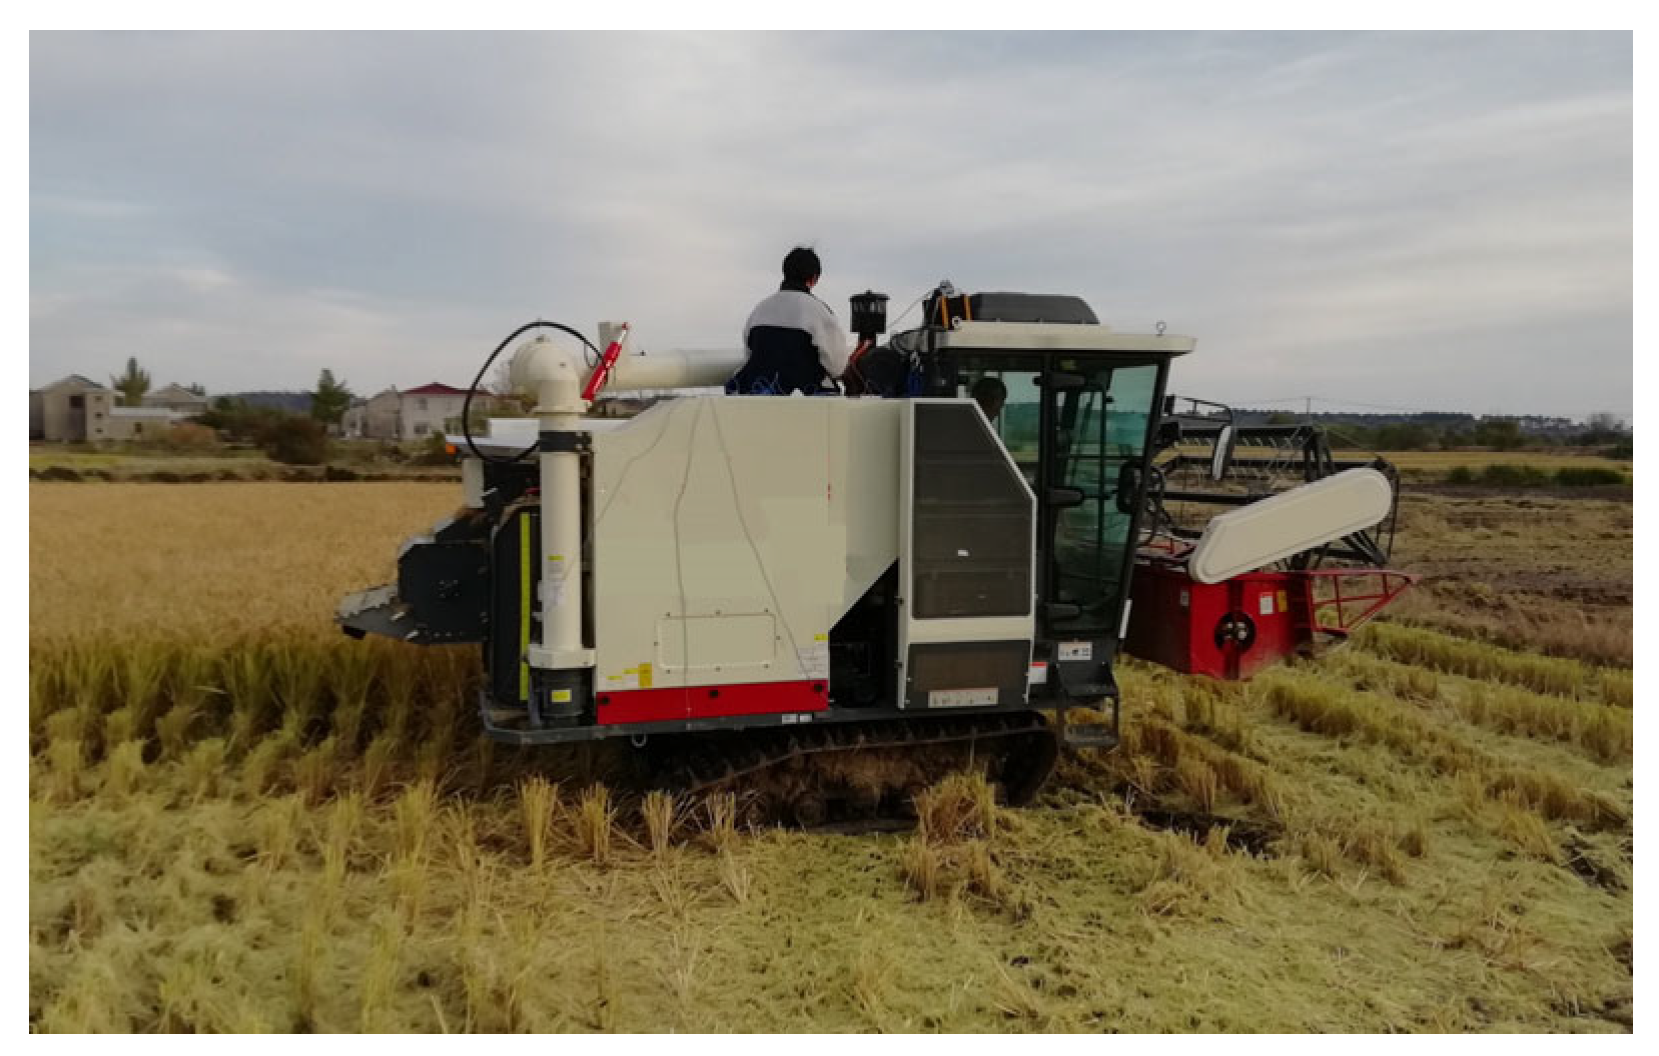
2.5. Equipment and Conditions for Vibration Testing of Conveyor Troughs
3. Results
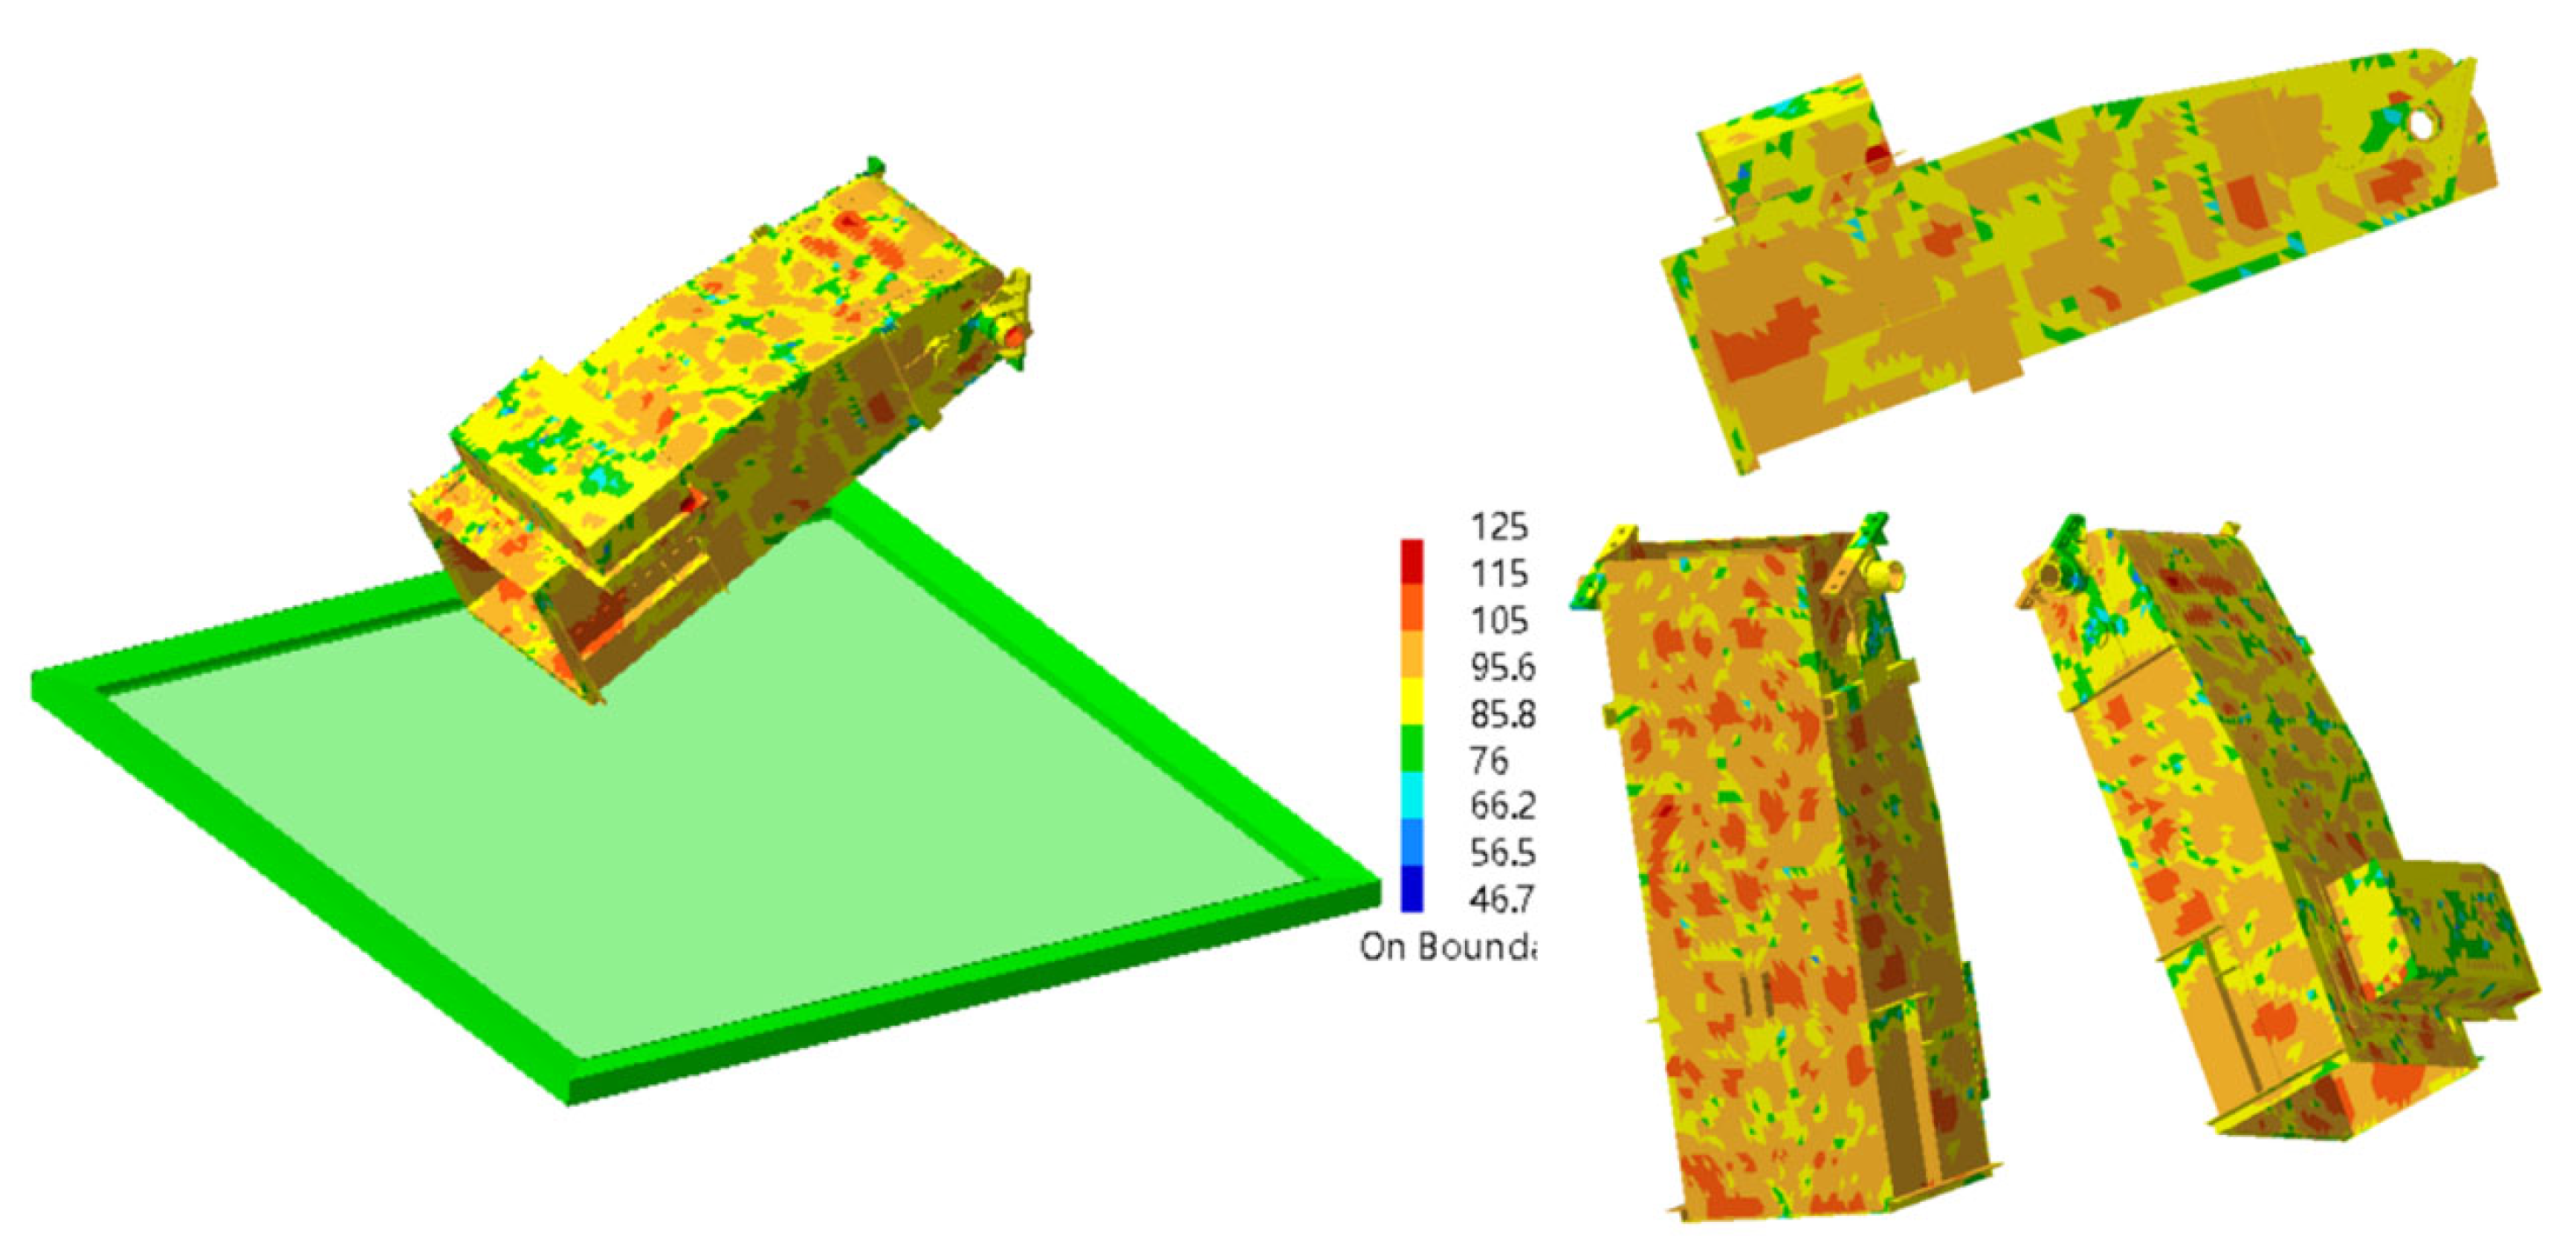
3.1. Numerical Prediction of Vibration Radiation Noise of Conveyor Trough Shell
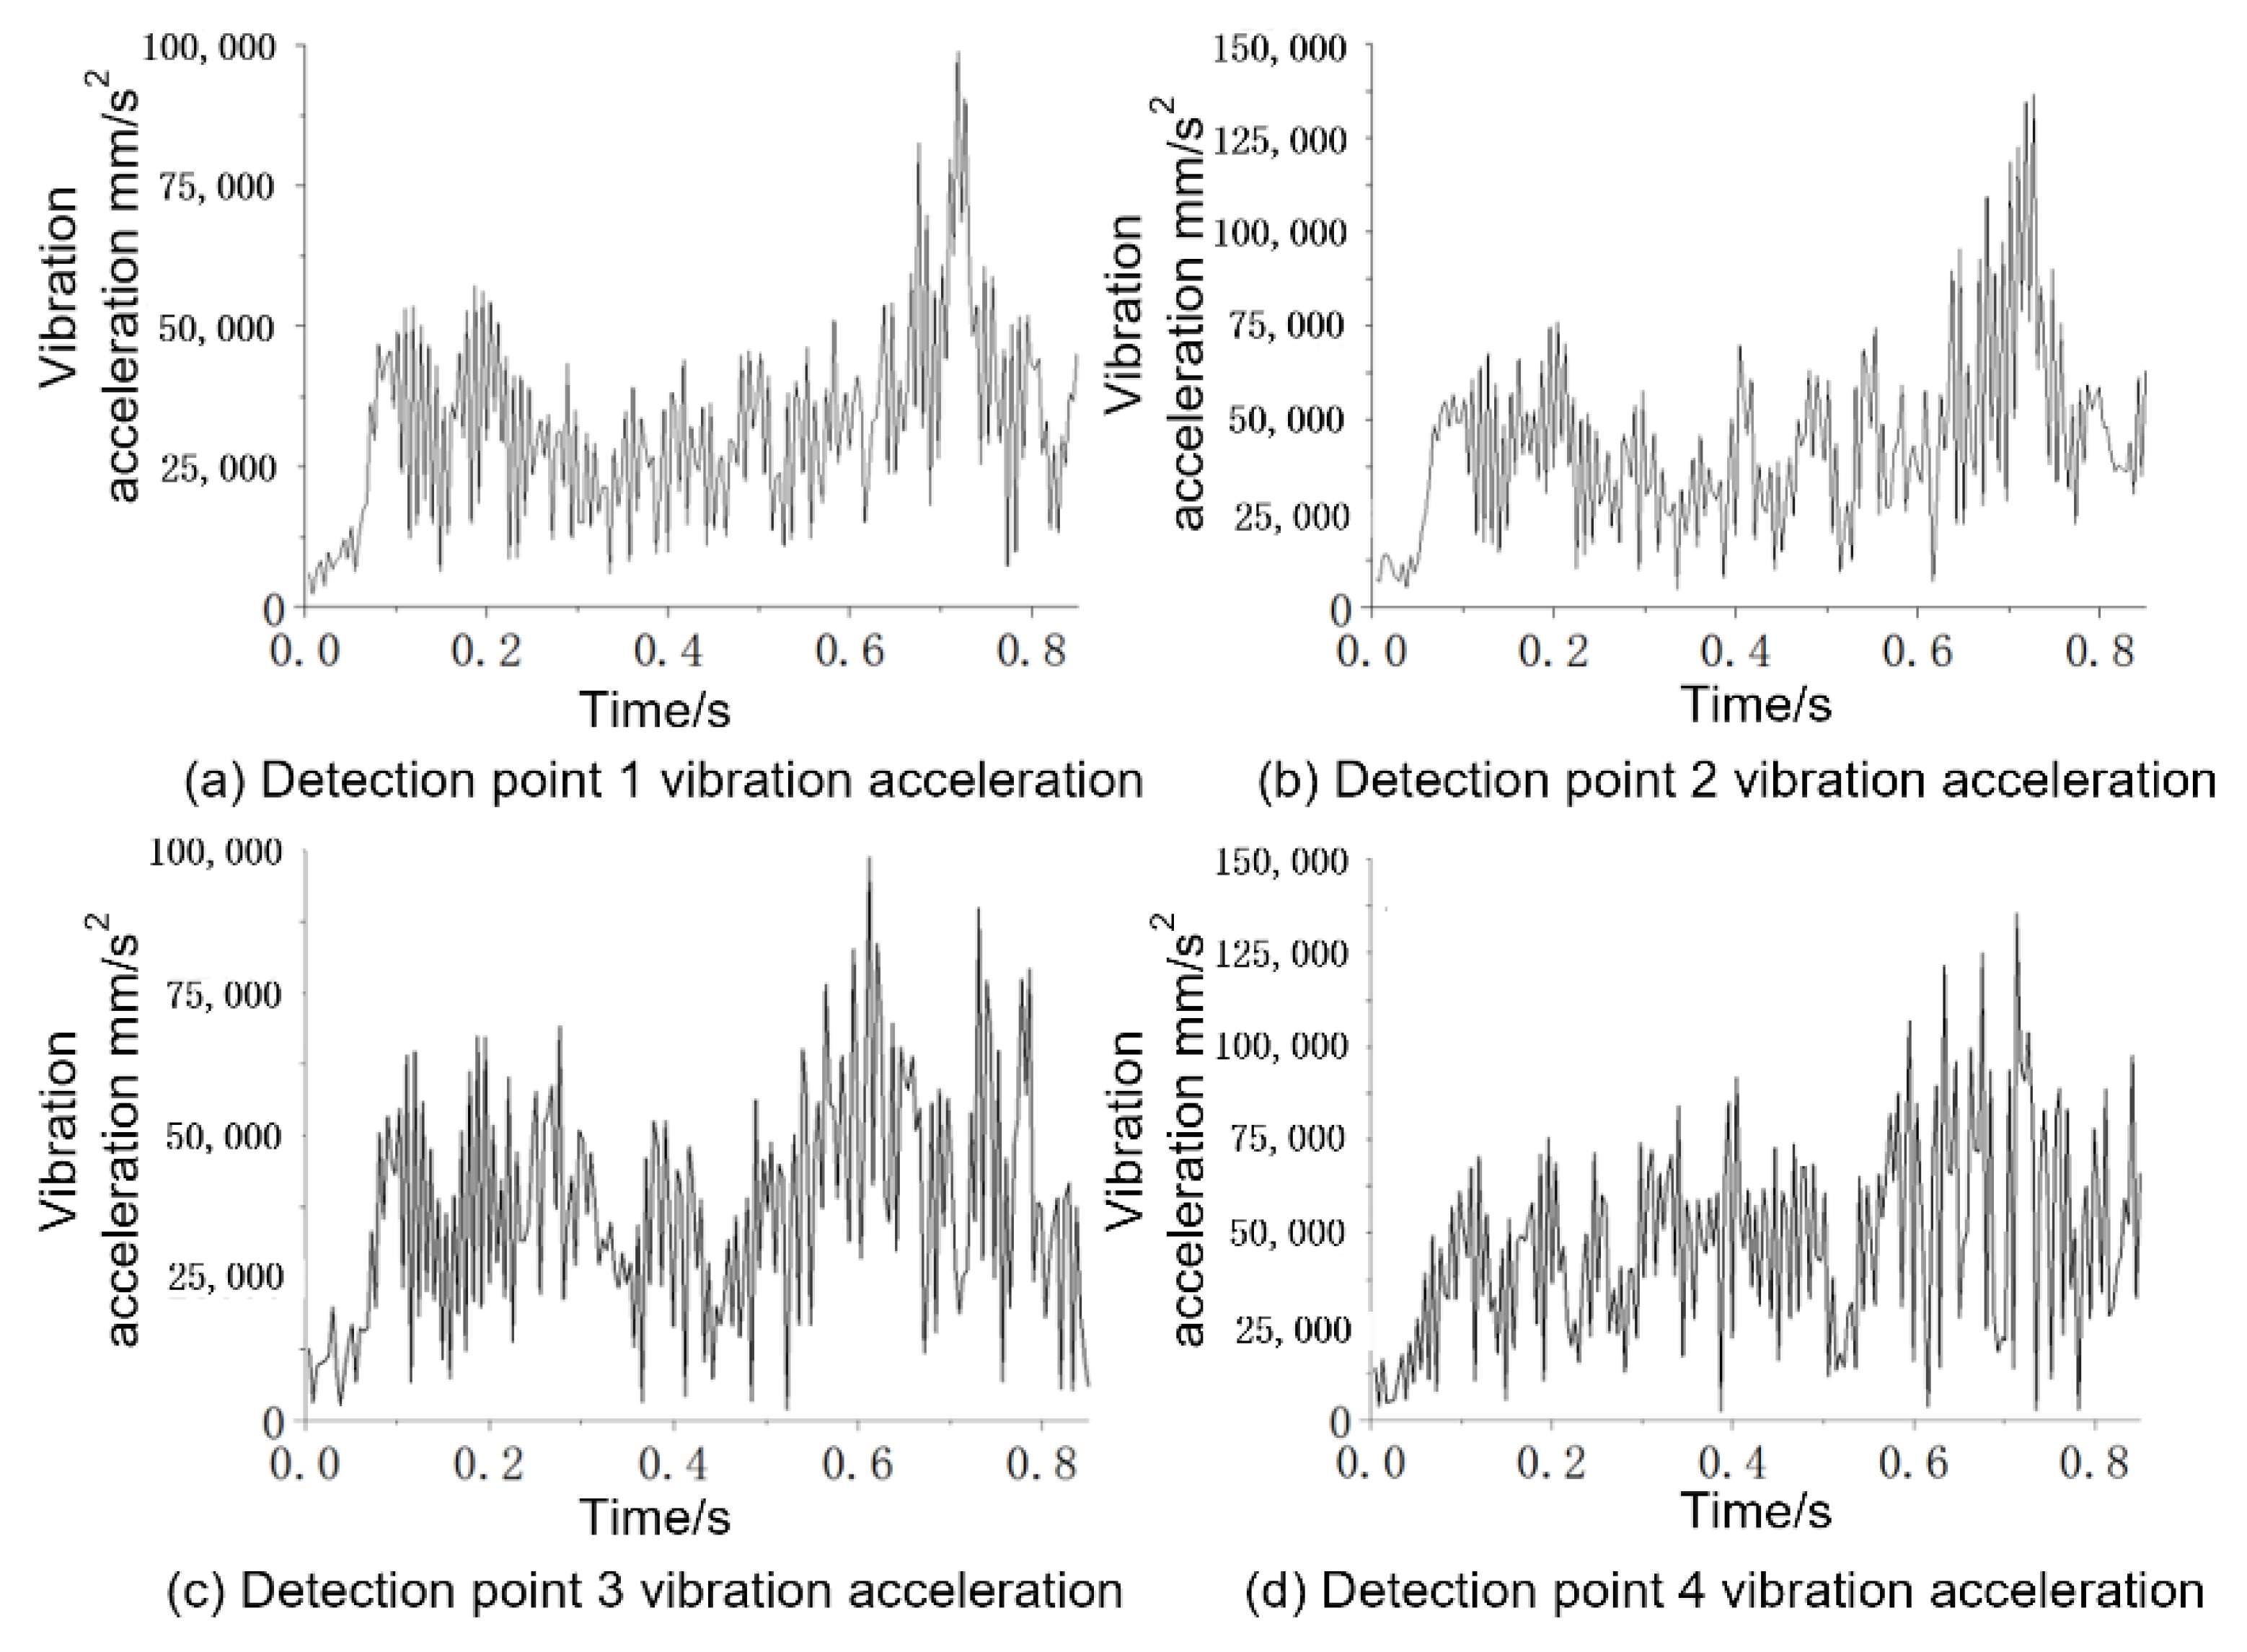
3.2. Verification of Conveyor Groove Vibration Test
4. Discussion
4.1. Transmission Analysis of Conveyor Trough Shell
4.2. The Difference Between Actual Situation and Simulation
5. Conclusions
- (1)
- The simulation results of the vibration radiation noise of the conveyor housing are consistent with the experimental results; the sound pressure levels at the fundamental frequency of 112 Hz are basically consistent; the established noise numerical prediction model is basically accurate, and the prediction method is feasible.
- (2)
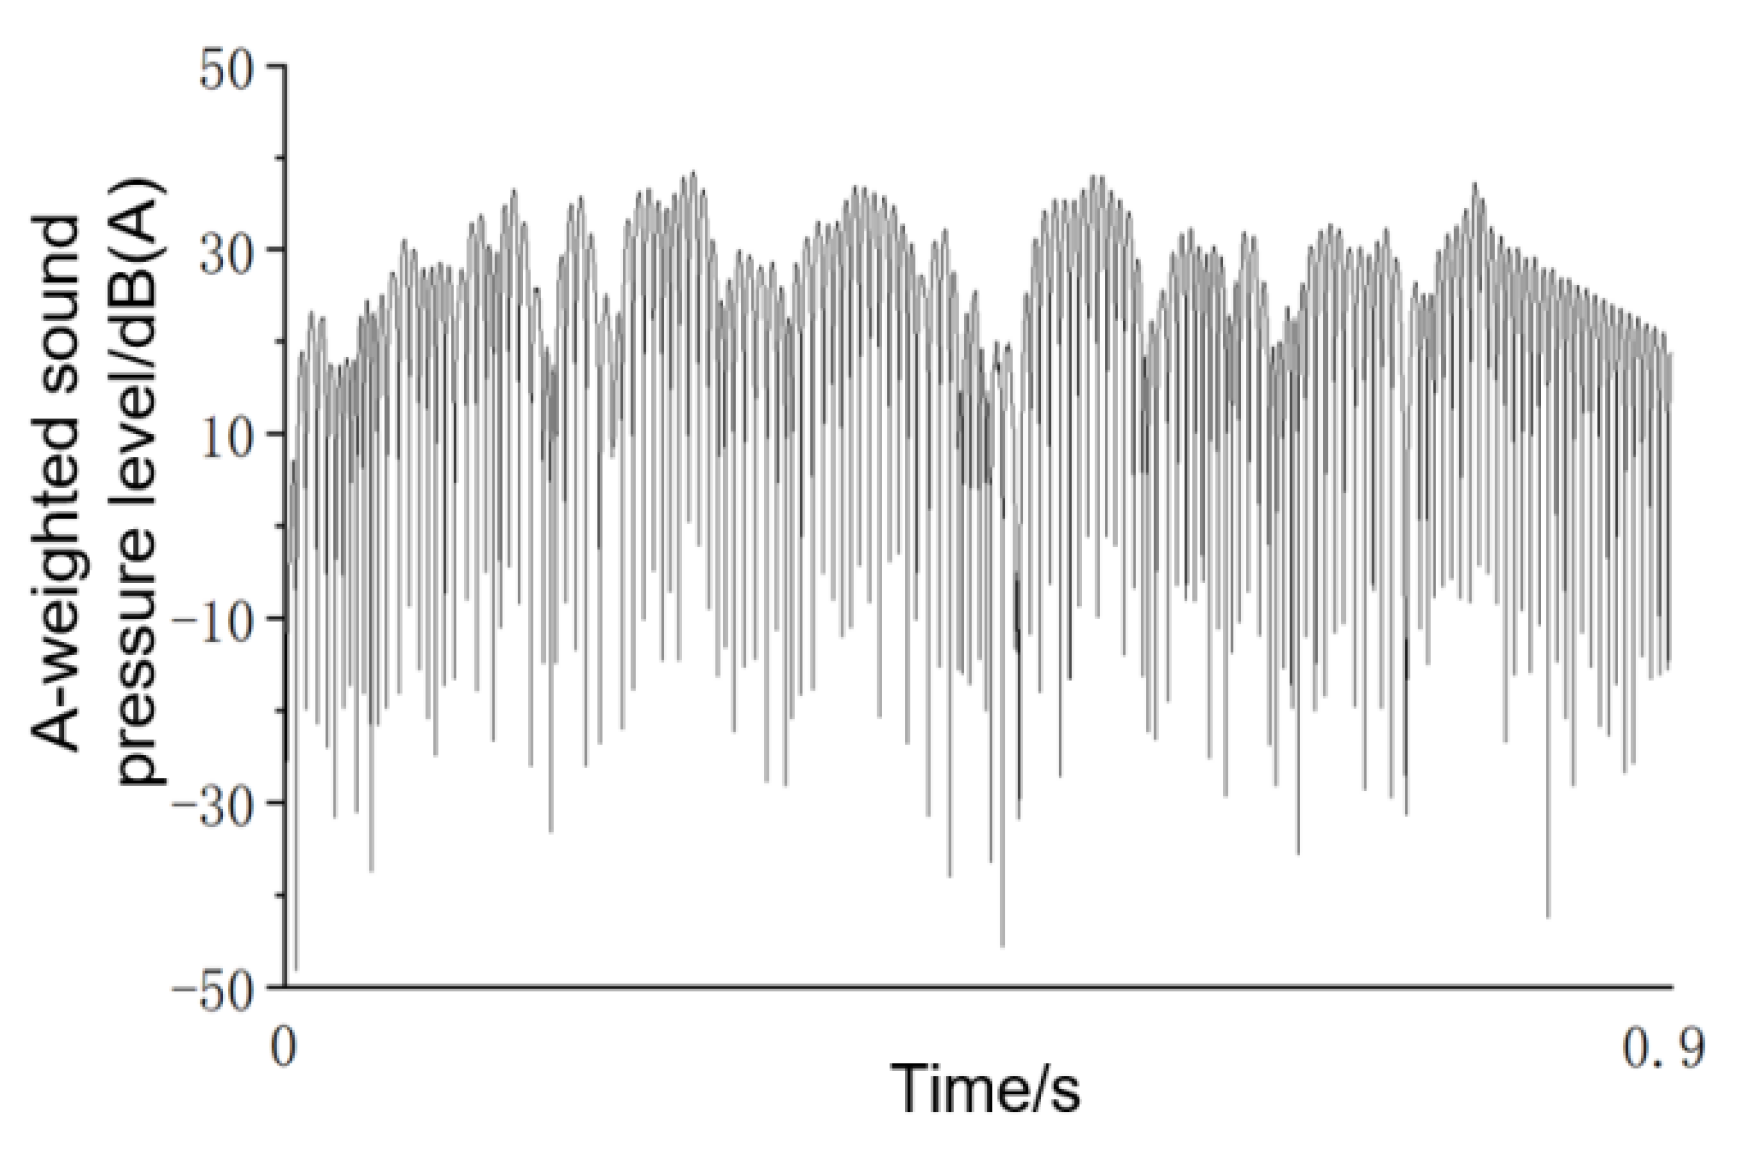
- The noise generated by the engine and the conveyor chain system structure on the sound pressure level of the conveyor housing was compared and analyzed. When the combine harvester is operating with the conveyor and header running, the average A-weighted sound pressure level decreases significantly, indicating that the noise generated during harvesting is more intense than in other operating conditions.
- (3)
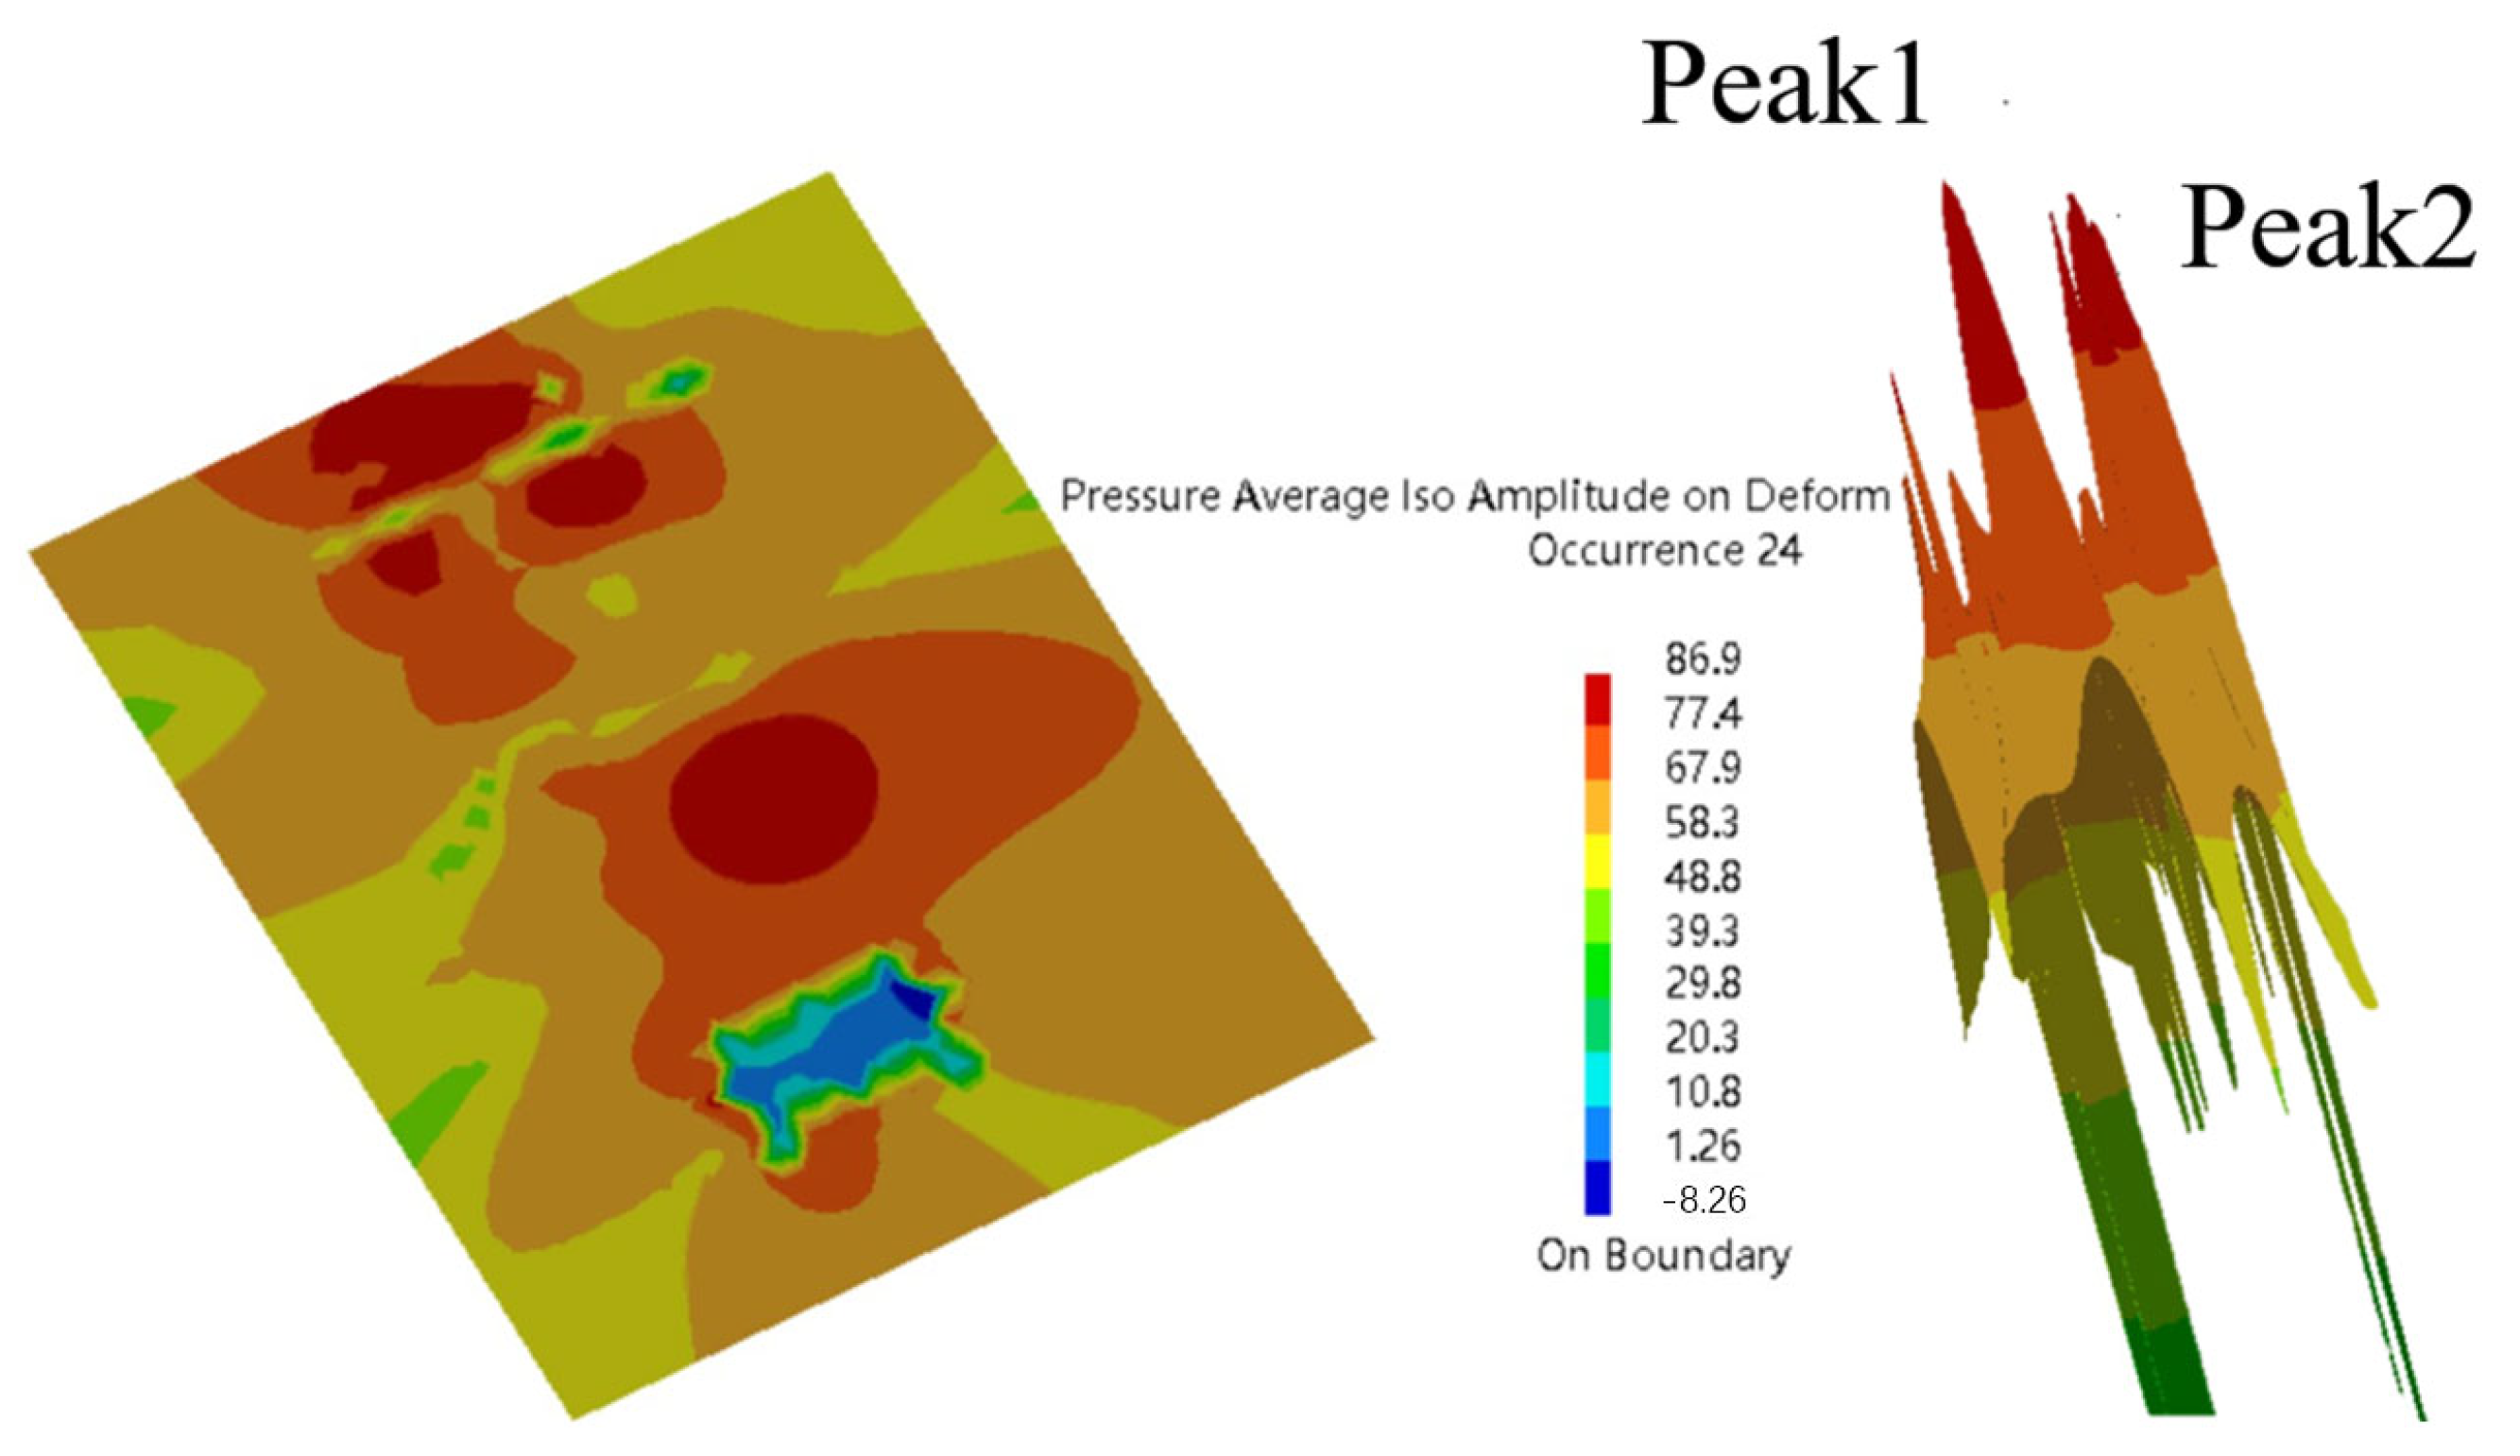
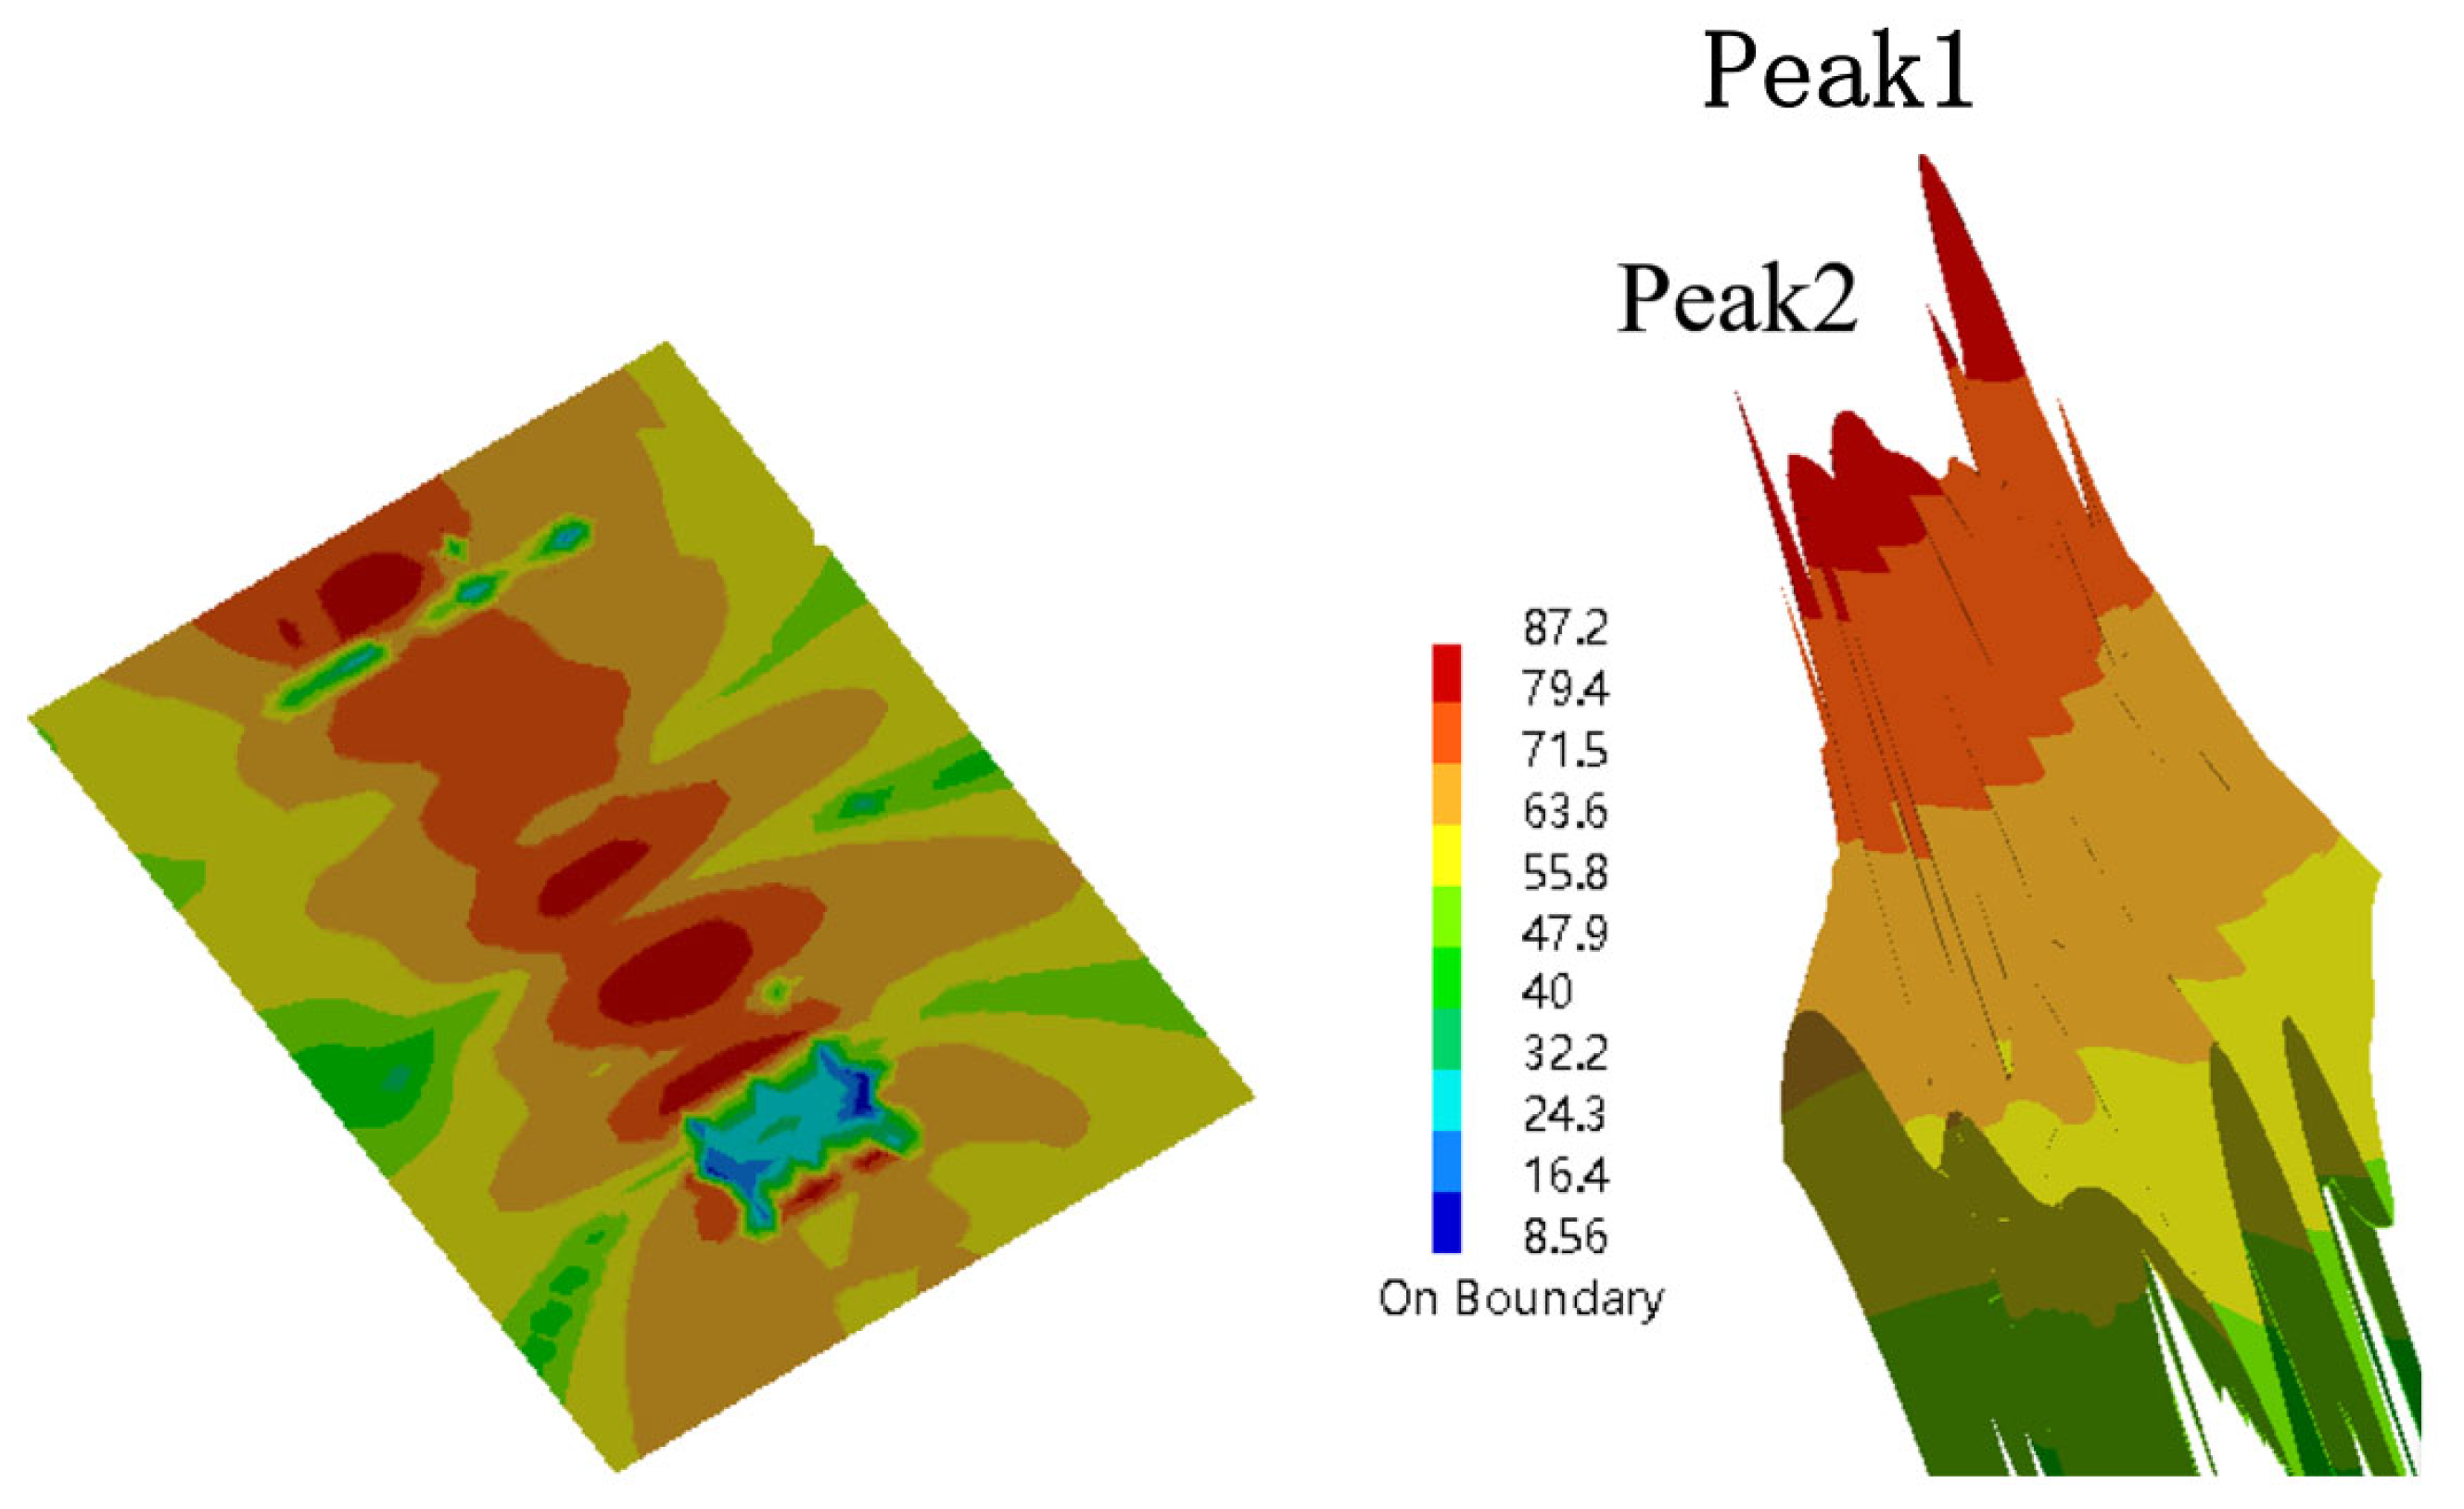
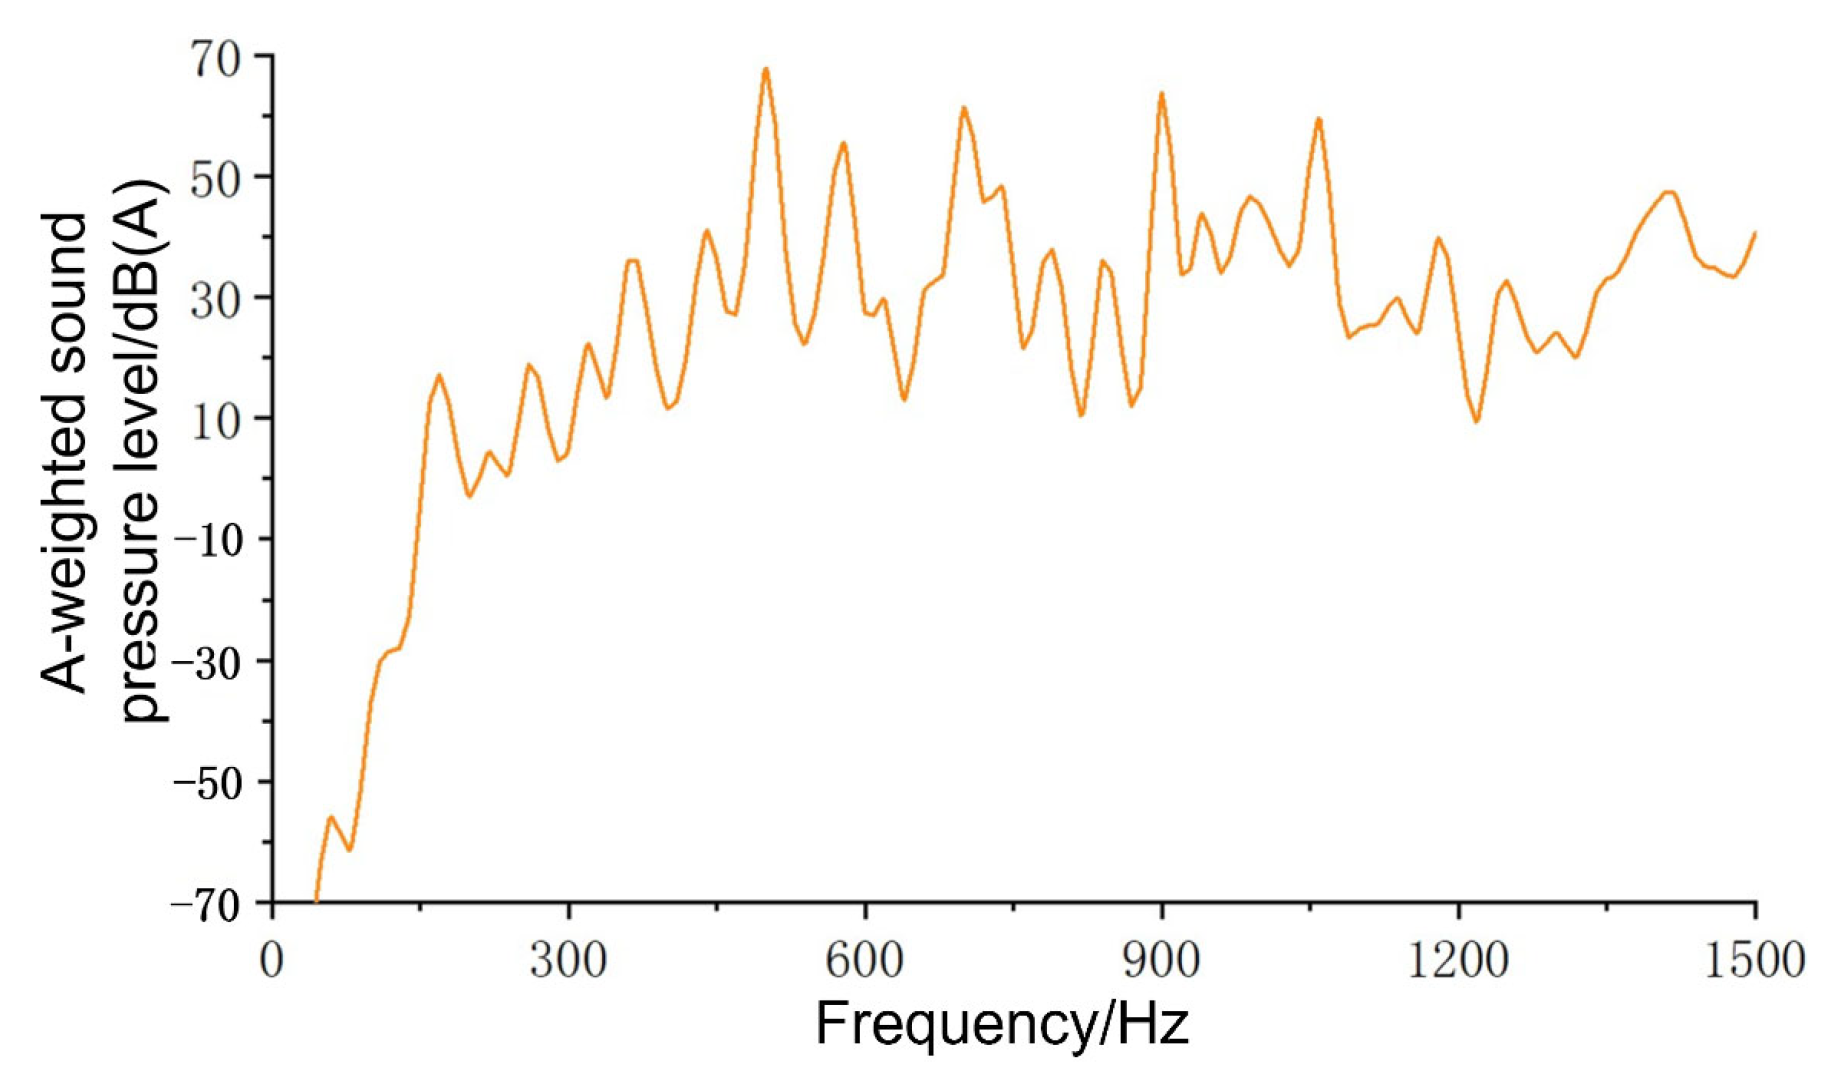
- However, the transmission noise of the conveyor housing at 500 Hz and 700 Hz was compared and analyzed, with sound power levels of 98.4 dB and 109.52 dB, respectively. The research results show that when the sound pressure levels produced by two sound sources differ significantly, the sound source with the lower sound pressure level has almost no effect on the superimposed result. Compared with the sound pressure at the same detection point, the influence of the transmitted noise at this point is greater than that of the structural noise, and the transmitted noise transmits more energy.
Author Contributions
Funding
Institutional Review Board Statement
Data Availability Statement
Conflicts of Interest
References
- Jiang, W.; Zhou, J.; Xu, H.; Liu, S.; Wang, C.; Dong, J. Research of the Influence of Road Excitation on Human Body Comfort under the Harvester Working Condition. Appl. Eng. Agric. 2019, 35, 495–502. [Google Scholar] [CrossRef]
- Chen, S.; Zhou, Y.; Tang, Z.; Lu, S. Modal vibration response of rice combine harvester frame under multi-source excitation. Biosyst. Eng. 2020, 194, 177–195. [Google Scholar] [CrossRef]
- Solecki, L. Preliminary recognition of whole body vibration risk in private farmers’ working environment. Ann. Agric. Environ. Med. 2007, 14, 299–304. [Google Scholar]
- Zhao, X.; Du, Y.; Yang, L.; Mao, E.; Guo, D.; Zhu, Z. Effects of Road Type and IVIS Task Type on Driver Behavior and Driving Performance in Agricultural Tractors. Int. J. Hum.-Comput. Interact. 2024, 40, 3159–3172. [Google Scholar] [CrossRef]
- Solecki, L. Assessment of Annual Exposure of Private Farmers to Whole Body Mechanical Vibration on Selected Family Farms of Plant Production Profile. Ann. Agric. Environ. Med. 2010, 17, 243–250. [Google Scholar]
- Tanas, W.; Szczepaniak, J.; Kromulski, J.; Szymanek, M.; Tanas, J.; Sprawka, M. Modal analysis and acoustic noise characterization of a grain crusher. Ann. Agric. Environ. Med. 2018, 25, 433–436. [Google Scholar] [CrossRef]
- Nakazawa, T.; Hattori, H.; Tarutani, I.; Yasuhara, S.; Inoue, T. Influence of pin profile curve on continuously variable transmission (CVT) chain noise and vibration. Mech. Mach. Theory 2020, 154, 104027. [Google Scholar] [CrossRef]
- Carletti, E.; Miccoli, G.; Pedrielli, F.; Parise, G. Vibroacoustic Measurements and Simulations Applied to External Gear Pumps. Integr. Simpl. Approach. Arch. Acoust. 2016, 41, 285–296. [Google Scholar] [CrossRef]
- Zhou, W.; Zuo, Y.; Zheng, M. Analysis and Optimization of the Vibration and Noise of a Double Planetary Gear Power Coupling Mechanism. Shock Vib. 2018, 2018, 9048695. [Google Scholar] [CrossRef]
- Lee, H.M.; Haris, A.; Lim, K.M.; Xie, J.; Lee, H.P. Solving Noise Pollution Issue Using Plenum Window with Perforated Thin Box. Crystals 2020, 10, 614. [Google Scholar] [CrossRef]
- He, Y.; Xiao, C.; Zhang, W.; Wang, K. Study of noise and structural characteristics of twin-screw air compressor based on multi-physical field coupling. Sci. Rep. 2023, 13, 20879. [Google Scholar] [CrossRef]
- Chen, L.; Sun, Z.; Li, P.; Ma, H.; Pan, G. DEM simulation of the transport of mine concrete by a screw feeder. J. Braz. Soc. Mech. Sci. Eng. 2022, 44, 280. [Google Scholar] [CrossRef]
- Chen, X.; Liu, F.; Li, D.; Wang, J.; Wu, P. Noise Reduction Method of Power Capacitor Shells Based on Multi-objective Topography Optimization. Noise Vib. Control 2020, 40, 192–198. [Google Scholar]
- Deng, W.; Dong, C.; Qian, Z.; Wang, Q. Equivalent orthotropic material parameters identification of electrical machines for modal analysis utilizing a PSO-assisted theoretical approach. Mech. Syst. Signal Process. 2025, 222, 111765. [Google Scholar] [CrossRef]
- Jiang, Q.; Wang, X.; Yu, M.; Tang, M.; Zhang, H.; Wu, J. Theoretical study of vibro-acoustics of fluid-pile-soil coupled system and experimental research of noise reduction of small-scale pile driving. Ocean Eng. 2022, 252, 110997. [Google Scholar] [CrossRef]
- Kuan, J.; Canic, S. Well-Posedness of Solutions to Stochastic Fluid-Structure Interaction. J. Math. Fluid Mech. 2024, 26, 4. [Google Scholar] [CrossRef]
- Pei, J.C.; Fann, G.I.; Harrison, R.J.; Nazarewicz, W.; Shi, Y.; Thornton, S. Adaptive multi-resolution 3D Hartree-Fock-Bogoliubov solver for nuclear structure. Phys. Rev. C 2014, 90, 024317. [Google Scholar] [CrossRef]
- Qi, M.; Li, B.; Yan, S.; Yan, Q.; He, Q. Simulation Analysis of Cylindrical Shell Cavity Noise with Melamine Foam Lining. Shock Vib. 2021, 2021, 6646596. [Google Scholar] [CrossRef]
- Tang, Y.; Zhao, Z.; Qin, Y.; Pang, F.; Du, Y.; Gao, C.; Li, H. Experimental and numerical investigation on vibro-acoustic performance of a submerged stiffened cylindrical shell under multiple excitations. Thin-Walled Struct. 2024, 197, 111569. [Google Scholar] [CrossRef]
- Tawri, K. A 2D stochastic nonlinearly coupled fluid-structure interaction problem in compliant arteries with unrestricted structural displacement. J. Differ. Equ. 2025, 431, 113243. [Google Scholar] [CrossRef]
- Wang, S.; Lu, B. Detecting the weak damped oscillation signal in the agricultural machinery working environment by vibrational resonance in the duffing system. J. Mech. Sci. Technol. 2022, 36, 5925–5937. [Google Scholar] [CrossRef]
- Celik, H.K.; Topakci, M.; Canakci, M.; Rennie, A.E.W.; Akinci, I. Modal analysis of agricultural machineries using finite element method: A case study for a V-belt pulley of a fodder crushing machine. J. Food Agric. Environ. 2010, 8, 439–446. [Google Scholar]
- Cutini, M.; Bisaglia, C. Cab Damping Device Evaluation on Tractor Vibration Transmission and Operator Comfort Using A Four-Poster Test Rig. In Proceedings of the 39th International Symposium on Agricultural Engineering, Opatija, Croatia, 22–25 February 2011; pp. 83–93. [Google Scholar]
- Marchant, B.P. Time-frequency analysis for biosystems engineering. Biosyst. Eng. 2003, 85, 261–281. [Google Scholar] [CrossRef]
- Matthews, J. Ergonomics and farm machinery. J. Soc. Occup. Med. 1983, 33, 126–136. [Google Scholar] [CrossRef]
- Naskrent, B.; Grzywinski, W.; Lukowski, A.; Polowy, K. Influence of Cutting Attachment on Noise Level Emitted by Brush Cutter during Tending of Young Forests. Croat. J. For. Eng. 2020, 41, 129–135. [Google Scholar] [CrossRef]
- Poje, A.; Grigolato, S.; Potocnik, I. Operator Exposure to Noise and Whole-Body Vibration in a Fully Mechanised CTL Forest Harvesting System in Karst Terrain. Croat. J. For. Eng. 2019, 40, 139–150. [Google Scholar]
- Chen, J.; Zhang, Z.Q.; Li, Y.M.; Guan, Z.H.; Tang, X.M. Research on Following Suction and Discharging Motion Control Method of Vacuum-Vibration Precision Seeding Manipulator. Appl. Eng. Agric. 2022, 38, 873–883. [Google Scholar] [CrossRef]
- Chen, L.W.; Zhang, Z.Y.; Li, H.B.; Zhang, X.P. Maintenance Skill Training Gives Agricultural Socialized Service Providers More Advantages. Agriculture 2023, 13, 135. [Google Scholar] [CrossRef]
- Singh, A.; Samuel, S.; Singh, H.; Singh, J.; Prakash, C.; Dhabi, Y.K. Whole Body Vibration Exposure among the Tractor Operator during Soil Tillage Operation: An Evaluation using ISO 2631-5 Standard. Shock Vib. 2022, 2022, 6412120. [Google Scholar] [CrossRef]
- Twardoch, K.; Sierocinski, D. An Analytical Approach to Gear Mesh Dynamics for the Sustainable Design of Agricultural Machinery Drive Systems. Sustainability 2025, 17, 1837. [Google Scholar] [CrossRef]
- Chen, W.Q.; Shen, C.; Jiang, Q.H.; Ma, H.L. Conveyor belt catalytic infrared radiation as a novel apparatus for dried tofu baking: Focus on evaluation of physicochemical qualities. Innov. Food Sci. Emerg. Technol. 2024, 95, 103703. [Google Scholar] [CrossRef]
- Ding, C.B.; Wang, L.M.; Chen, X.Y.; Yang, H.T.; Huang, L.X.; Song, X.M. A Blockchain-Based Wide-Area Agricultural Machinery Resource Scheduling System. Appl. Eng. Agric. 2023, 39, 1–12. [Google Scholar] [CrossRef]
- El-Mesery, H.S.; Ashiagbor, K.; Hu, Z.C.; Rostom, M. Mathematical modeling of thin-layer drying kinetics and moisture diffusivity study of apple slices using infrared conveyor-belt dryer. J. Food Sci. 2024, 89, 1658–1671. [Google Scholar] [CrossRef]
- Faheem, M.; Liu, J.Z.; Chang, G.Z.; Ahmad, I.; Peng, Y. Hanging force analysis for realizing low vibration of grape clusters during speedy robotic post-harvest handling. Int. J. Agric. Biol. Eng. 2021, 14, 62–71. [Google Scholar] [CrossRef]
- Lian, Y.; Chen, J.; Guan, Z.H.; Song, J. Development of a monitoring system for grain loss of paddy rice based on a decision tree algorithm. Int. J. Agric. Biol. Eng. 2021, 14, 224–229. [Google Scholar] [CrossRef]
- Huang, J.; Tan, L.; Tian, K.; Zhang, B.; Ji, A.; Liu, H.; Shen, C. Formation mechanism for the laying angle of hemp harvester based on ANSYS-ADAMS. Int. J. Agric. Biol. Eng. 2023, 16, 109–115. [Google Scholar] [CrossRef]
- Li, H.; Chen, L.; Zhang, Z. A Study on the Utilization Rate and Influencing Factors of Small Agricultural Machinery: Evidence from 10 Hilly and Mountainous Provinces in China. Agriculture 2023, 13, 51. [Google Scholar] [CrossRef]
- Liang, Z.W.; Qin, Y.Q.; Su, Z. Establishment of a Feeding Rate Prediction Model for Combine Harvesters. Agriculture 2024, 14, 589. [Google Scholar] [CrossRef]
- Liao, C.Q.; Chen, J.; Geng, F.Z.; Tang, X.M. Airflow basin structure numerical optimisation analysis and suction nozzle characteristics experimental study of vacuum-vibration tray precision seeder. J. Agric. Eng. 2022, 53, 1294. [Google Scholar] [CrossRef]
- Liu, Z.; Wang, E.G.; Mao, H.P.; Zuo, Z.Y.; Peng, H.T.; Zhao, M.X.; Yu, Y.S.; Li, Z.K. Design and Testing of an Electric Side-Mounted Cabbage Harvester. Agriculture 2024, 14, 1741. [Google Scholar] [CrossRef]
- Ma, Z.; Wu, Z.P.; Li, Y.F.; Song, Z.Q.; Yu, J.; Li, Y.M.; Xu, L.Z. Study of the grain particle-conveying performance of a bionic non-smooth-structure screw conveyor. Biosyst. Eng. 2024, 238, 94–104. [Google Scholar] [CrossRef]
- Ma, Z.; Zhu, Y.L.; Li, J.L.; Song, Z.Q.; Yu, J.; Li, Y.M.; Xu, L.Z. Study on the performance of detection air duct and evaluation index of agricultural cleaning centrifugal fans. Biosyst. Eng. 2024, 239, 81–97. [Google Scholar] [CrossRef]
- Song, X.Q.; Yu, X.J.; Zhou, C.S.; Xu, B.G.; Chen, L.; Yagoub, A.A.; Emeka, O.C.; Wahia, H. Conveyor belt catalytic infrared as a novel apparatus for blanching processing applied to sweet potatoes in the industrial scale. LWT-Food Sci. Technol. 2021, 149, 111827. [Google Scholar] [CrossRef]
- Wang, B.; Du, X.X.; Wang, Y.N.; Mao, H.P. Multi-machine collaboration realization conditions and precise and efficient production mode of intelligent agricultural machinery. Int. J. Agric. Biol. Eng. 2024, 17, 27–36. [Google Scholar] [CrossRef]
- Wang, X.Z.; Hong, T.Y.; Fang, W.Q.; Chen, X.Y. Optimized Design for Vibration Reduction in a Residual Film Recovery Machine Frame Based on Modal Analysis. Agriculture 2024, 14, 543. [Google Scholar] [CrossRef]
- Yu, Z.W.; Li, Y.M.; Du, X.X.; Liu, Y.B. Threshing cylinder unbalance detection using a signal extraction method based on parameter-adaptive variational mode decomposition. Biosyst. Eng. 2024, 244, 26–41. [Google Scholar] [CrossRef]
- Yu, Z.W.; Li, Y.M.; Xu, L.Z.; Du, X.X.; Ji, K.Z. Unbalanced variation after assembly and double-speed influence coefficient method in the threshing drum. Int. J. Agric. Biol. Eng. 2023, 16, 1–10. [Google Scholar] [CrossRef]
- Wei, J.; Yang, Y.; Yuan, Y.; Tang, W. Review of the Analysis on Vibration and Noise in the Whole Life Cycle of Ships. Ship Eng. 2023, 45, 1–20+26. [Google Scholar]
- Zhou, Z.; Lin, Y.; Chen, W.; Chi, Q. Flow Noise Simulation and Noise Reduction Technology for Underwater Cylindrical Shell Structures. Noise Vib. Control 2022, 42, 90–95+122. [Google Scholar]
- Cao, Y.L.; Tang, Z.; Lu, D.P.; Lin, S.B. Performance Test of Artificial Defoliating Broccoli Conveyor Line and Analysis of Defoliating Broccoli Inflorescences. Agronomy 2024, 14, 1925. [Google Scholar] [CrossRef]
- Chen, J.; Ning, X.; Li, Y.; Yang, G.; Wu, P.; Chen, S. A Fuzzy Control Strategy for the Forward Speed of A Combine Harvester Based on Kdd. Appl. Eng. Agric. 2017, 33, 15–22. [Google Scholar] [CrossRef]
- Dong, X.; Li, M.; Niu, Z.; Hu, J. Design and Experimental Analysis of Full-automatic Virus-free Seedcane Seed-metering Device. In Proceedings of the International Conference on Computer Systems, Electronics and Control (ICCSEC), Dalian, China, 25–27 December 2017; pp. 614–618. [Google Scholar]
- Han, L.; Mao, H.; Kumi, F.; Hu, J. Development of A Multi-Task Robotic Transplanting Workcell for Greenhouse Seedlings. Appl. Eng. Agric. 2018, 34, 335–342. [Google Scholar] [CrossRef]
- Jiang, S.; Zhu, T.C.; Jia, D.F.; Yao, J.; Jiang, Y.Y. Effect of egg freshness on their automatic orientation. J. Sci. Food Agric. 2018, 98, 2642–2650. [Google Scholar] [CrossRef]
- Liu, S.F.; Tang, Z.; Zhang, B.; Liang, Y.Q.; Gu, X.Y. Ergonomic Design of Cab Structure for Wheeled Combine Harvester. Eng. Agric. 2022, 42, e20220023. [Google Scholar] [CrossRef]


| Order | Frequency/Hz | Order | Frequency/Hz | Order | Frequency/Hz |
|---|---|---|---|---|---|
| 1 | 45.177 | 18 | 180.06 | 35 | 293.76 |
| 2 | 51.964 | 19 | 189.5 | 36 | 298.13 |
| 3 | 62.351 | 20 | 190.04 | 37 | 311.7 |
| 4 | 66.732 | 21 | 201.46 | 38 | 317.75 |
| 5 | 68.365 | 22 | 208.37 | 39 | 322.63 |
| 6 | 78.48 | 23 | 209.26 | 40 | 334.9 |
| 7 | 92.104 | 24 | 221.66 | 41 | 347.79 |
| 8 | 100.55 | 25 | 224.49 | 42 | 349.43 |
| 9 | 109.46 | 26 | 227.8 | 43 | 357. |
| 10 | 115.87 | 27 | 237.26 | 44 | 358.29 |
| 11 | 123.18 | 28 | 238.13 | 45 | 365.26 |
| 12 | 127.92 | 29 | 242.79 | 46 | 367.35 |
| 13 | 136.99 | 30 | 251.6 | 47 | 375.2 |
| 14 | 144.86 | 31 | 265.21 | 48 | 377.87 |
| 15 | 155.1 | 32 | 270.59 | 49 | 382.73 |
| 16 | 159.68 | 33 | 278.94 | 50 | 387.93 |
| 17 | 174.49 | 34 | 286.93 |
| Components | Chain Wheel | Chain Harrow | Roller | Pin Shaft | Sleeve | Passive Drum |
|---|---|---|---|---|---|---|
| Material | 45 Cr | Q235-B | 20 CrMo | 20 CrMo | 20 CrMnMo | Structural steel |
| Density kg/m3 | 7820 | 7840 | 7840 | 7840 | 7870 | 7850 |
| Poisson’s ratio | 0.290 | 0.278 | 0.278 | 0.278 | 0.254 | 0.3 |
| 2.06 × 10¹¹ | 2.10 × 10¹¹ | 2.10 × 10¹¹ | 2.10 × 10¹¹ | 2.07 × 10¹¹ | 2.0 × 10¹¹ |
| Instrument name | 356A16-type accelerometer | |||
| Performance indicators | Range/g | Frequency response/kHz | Sensitivity/(mV·g−1) | Lateral sensitivity/% |
| Technical parameters | ±50 | 0.3~6 | 100 | <5 |
| Instrument name | DH5902N dynamic signal acquisition instrument | |||
| Performance indicators | Number of channels | Maximum sampling frequency/kHz | Distortion degree | Signal input method |
| Technical parameters | 32 | 100 | <0.5 | IEPE |
| Experimental Conditions | 1 | 2 | 3 | 4 | 5 |
|---|---|---|---|---|---|
| Testing environment | Rice fields | Rice fields | Rice fields | Rice fields | Rice fields |
| Harvesting operation status | Only engine operation | Engine and threshing cleaning work | The whole machine starts, remains stationary, and has no load | The whole machine starts only for walking | Complete machine startup, walking, and harvesting |
| Speed km/h | 0 | 0 | 0 | 8 | 8 |
| Condition | 1, 2, 3 | 4, 5 | |||||
|---|---|---|---|---|---|---|---|
| Detection point | 1 | 2 | 3 | 4 | 1 | 2 | 3 |
| Installation position | On the conveyor trough panel | Left side of conveyor trough panel | Conveyor trough panel on the right | Conveyor trough drive shaft bearing seat | On the conveyor trough panel | Left side of conveyor trough panel | Conveyor trough panel on the right |
| Detection point | 5 | 6 | 7 | 8 | 4 | 5 | 6 |
| Installation position | Vibration screen drive shaft bearing seat | Fan drive shaft bearing seat | Threshing drive shaft bearing seat | header | Conveyor trough drive shaft bearing seat | Threshing drive shaft bearing seat | Header |
| (a) Small Throttle of the Engine | (b) Big Throttle of the Engine | (c) Threshing and Cleaning Start | (d) Whole Machine Startup | ||||
|---|---|---|---|---|---|---|---|
| Frequency | Sound Passure /Pa | Frequency | Sound Passure /Pa | Frequency | Sound Passure /Pa | Frequency | Sound Passure /Pa |
| 58.594 | 0.597 | 83.008 | 0.782 | 117.188 | 1.158 | 95.215 | 1.127 |
| 117.188 | 0.440 | 473.633 | 0.439 | 95.215 | 0.926 | 112.305 | 0.570 |
| 29.297 | 0.431 | 385.742 | 0.376 | 190.43 | 0.564 | 102.539 | 0.707 |
| 146.484 | 0.162 | 114.746 | 0.286 | 85.449 | 0.561 | 119.629 | 0.679 |
| 131.836 | 0.111 | 122.07 | 0.267 | 168.457 | 0.560 | 168.457 | 0.648 |
| Parameter | Value/Result | Notes |
|---|---|---|
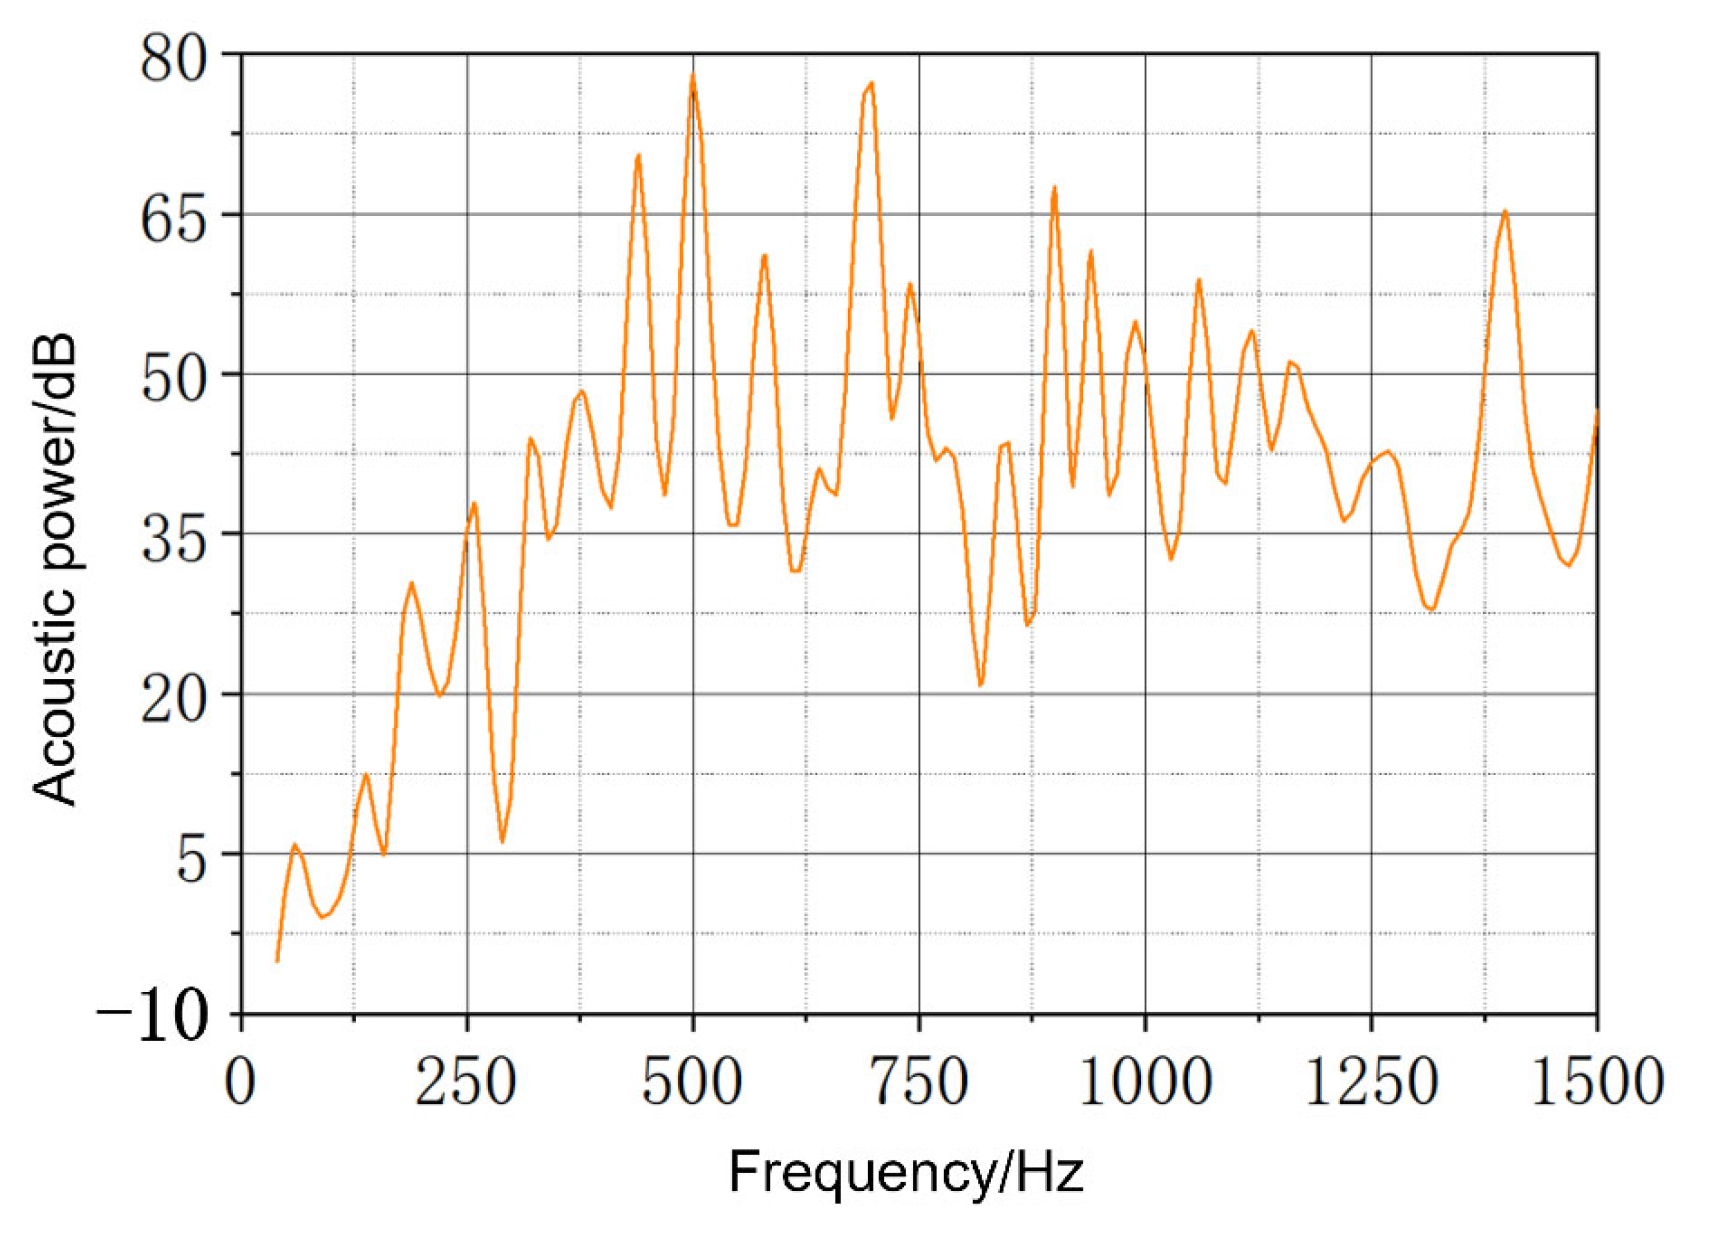
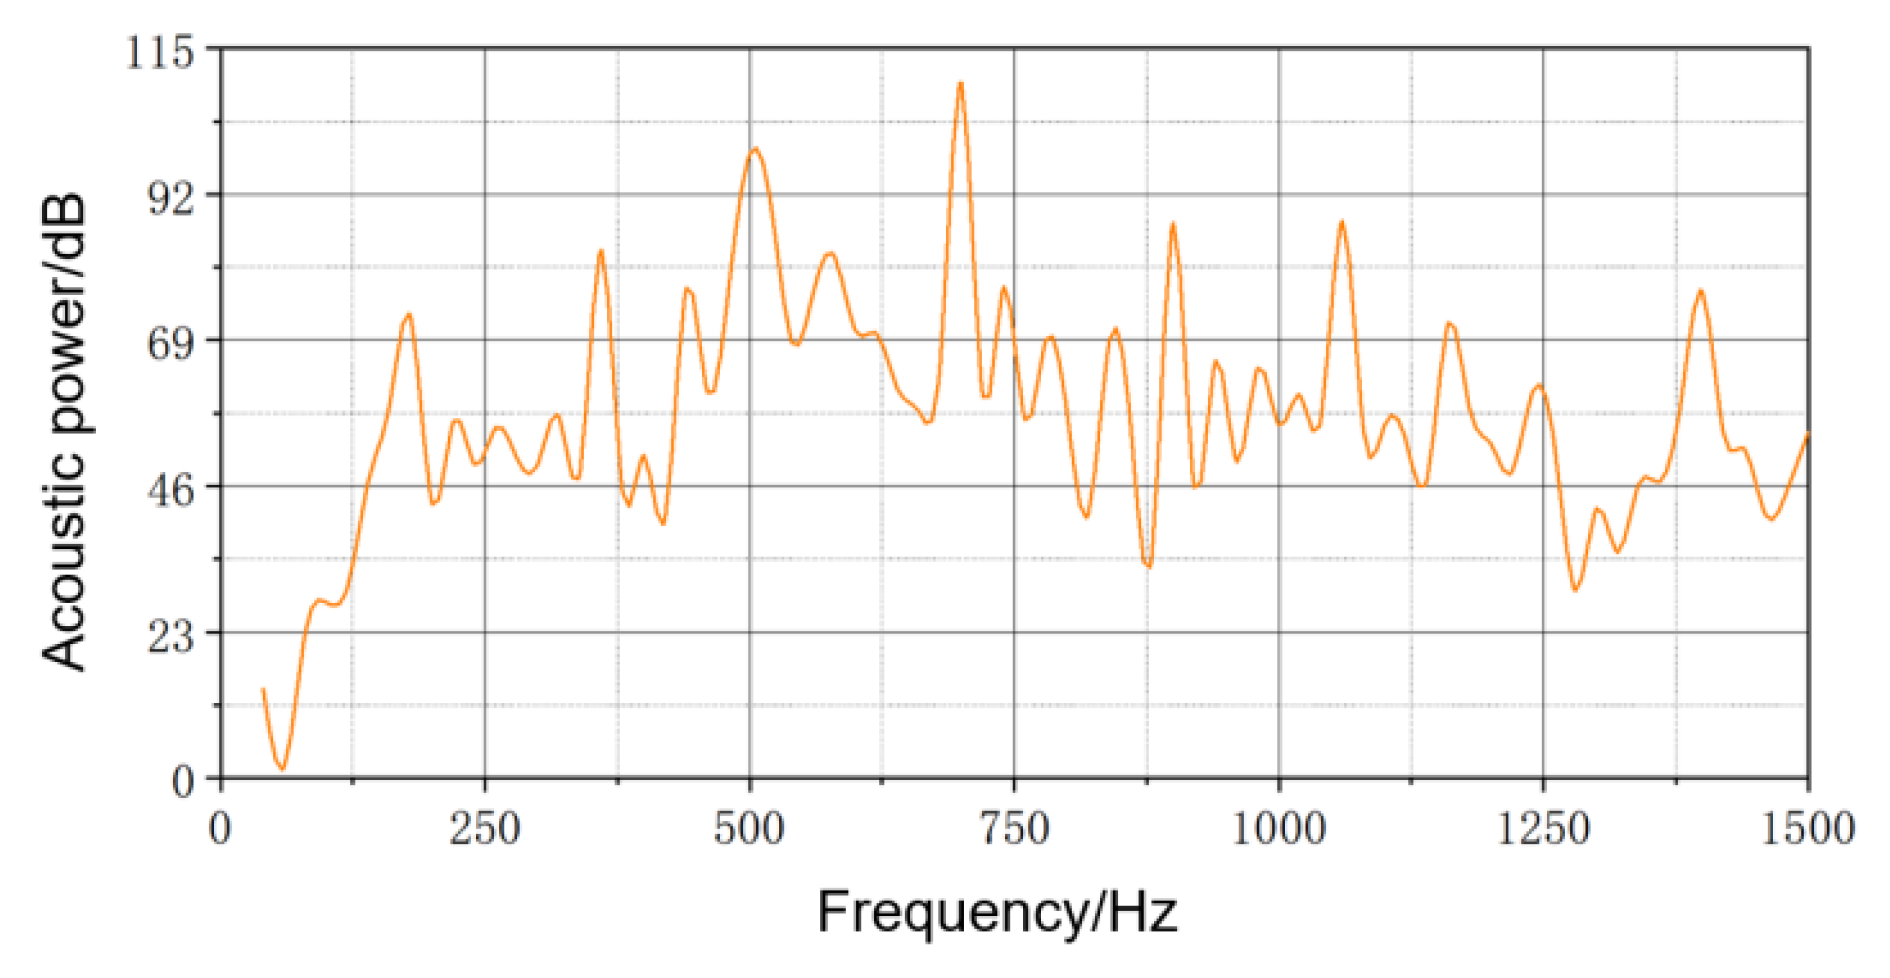
| Frequency range (Hz) | 40–1500 Hz | For noise calculation of conveyor chain system |
| Maximum sound pressure level (dB) | 87.2 dB | At the active sprocket |
| Peak sound pressure location | Middle of conveyor chain system | Location of highest noise at 500 Hz |
| Sound pressure distribution | Highest at feed and discharge ends | High SPL at both ends of the conveyor trough |
| Transmission noise impact | Greater than structural noise | Transmission noise contributes more energy |
Disclaimer/Publisher’s Note: The statements, opinions and data contained in all publications are solely those of the individual author(s) and contributor(s) and not of MDPI and/or the editor(s). MDPI and/or the editor(s) disclaim responsibility for any injury to people or property resulting from any ideas, methods, instructions or products referred to in the content. |
© 2025 by the authors. Licensee MDPI, Basel, Switzerland. This article is an open access article distributed under the terms and conditions of the Creative Commons Attribution (CC BY) license (https://creativecommons.org/licenses/by/4.0/).
Share and Cite
Jing, J.; Yan, G.; Tang, Z.; Chen, S.; Liang, R.; Chen, Y.; He, X. Response Prediction and Experimental Validation of Vibration Noise in the Conveyor Trough of a Combine Harvester. Agriculture 2025, 15, 1099. https://doi.org/10.3390/agriculture15101099
Jing J, Yan G, Tang Z, Chen S, Liang R, Chen Y, He X. Response Prediction and Experimental Validation of Vibration Noise in the Conveyor Trough of a Combine Harvester. Agriculture. 2025; 15(10):1099. https://doi.org/10.3390/agriculture15101099
Chicago/Turabian StyleJing, Jianpeng, Guangen Yan, Zhong Tang, Shuren Chen, Runzhi Liang, Yuxuan Chen, and Xiaoying He. 2025. "Response Prediction and Experimental Validation of Vibration Noise in the Conveyor Trough of a Combine Harvester" Agriculture 15, no. 10: 1099. https://doi.org/10.3390/agriculture15101099
APA StyleJing, J., Yan, G., Tang, Z., Chen, S., Liang, R., Chen, Y., & He, X. (2025). Response Prediction and Experimental Validation of Vibration Noise in the Conveyor Trough of a Combine Harvester. Agriculture, 15(10), 1099. https://doi.org/10.3390/agriculture15101099